Product Name Confidentiality Level INTERNAL Product Version Total 38 Pages Performance and Capacity Technical Clarification For internal use only Prepared By RNPS Date 2009-9-29 Reviewed By Date Reviewed By Date Approved By Date Huawei Technologies Co., Ltd.

Welcome message from author
This document is posted to help you gain knowledge. Please leave a comment to let me know what you think about it! Share it to your friends and learn new things together.
Transcript

Product Name Confidentiality Level
INTERNAL
Product VersionTotal 31 Pages
Performance and Capacity Technical ClarificationFor internal use only
Prepared By RNPS Date 2009-9-29
Reviewed By
Date
Reviewed By
Date
Approved By
Date
Huawei Technologies Co., Ltd.
All Rights Reserved.

Performance and Capacity Technical Clarification Confidentiality level:
Change HistoryDate Issue Change Description Author
2009-9-29 V0.1 Completed the draft. He Xiaomei
2009-10-12 V0.1 Added the application scenario of each capacity expansion solution and corresponding congestion rate and traffic volume per channel.
He Xiaomei
2009-12-25 Revised based on review comments. He Xiaomei
2023-4-28 Huawei Proprietary and ConfidentialCopyright © Huawei Technologies Co., Ltd.
Page 2 of 31

Performance and Capacity Technical Clarification Confidentiality level:
Contents
Performance and Capacity Technical Clarification...............................................71 Overview.......................................................................................7
1.1 Background........................................................................................................................................................7
2 Methods for Identifying Network Congestion Problems....................72.1 Busy-Hour Radio Resource Usage....................................................................................................................72.2 TCH Congestion................................................................................................................................................8
2.2.1 Definition of Congestion Rate on TCH....................................................................................................82.2.2 Methods for Analyzing TCH Congestion.................................................................................................92.2.3 Methods for Identifying PS Congestion.................................................................................................12
2.3 SDCCH Congestion.........................................................................................................................................132.3.1 Definition of Congestion Rate on SDCCH.............................................................................................132.3.2 Methods for Analyzing SDCCH Congestion Problems.........................................................................13
3 Capacity Expansion Solutions.......................................................153.1 TCH Capacity Expansion Solution 1: Adjusting the Proportions of TCHFs and TCHHs..............................15
3.1.1 Application Scenarios.............................................................................................................................153.1.2 Enabling the HR Threshold Adjustment Function to Absorb Traffic Volume........................................153.1.3 Traffic Volume to Be Absorbed After the HR Function Is Enabled.......................................................163.1.4 Impact of the HR Function on Network Performance............................................................................16
3.2 TCH Capacity Expansion Solution 2: Adjusting AMR Parameters................................................................173.2.1 Application Scenarios.............................................................................................................................173.2.2 Capacity Calculation and TRX Configuration in a Loose Frequency Reuse Pattern.............................173.2.3 Capacity Calculation and TRX Configuration in a Tight Frequency Reuse Pattern..............................183.2.4 Impact of the AMR Function on Network Performance........................................................................20
3.3 TCH Expansion Solution 3: Adding TRXs......................................................................................................213.3.1 Application Scenarios.............................................................................................................................213.3.2 Number of TRXs to Be Added for Traffic Absorption...........................................................................213.3.3 Impact of Adding TRXs on Network Performance................................................................................21
3.4 SDCCH Capacity Expansion Solution: SDCCH Dynamic Allocation............................................................223.4.1 Application Scenarios.............................................................................................................................223.4.2 Estimation of Dynamic SDCCHs...........................................................................................................223.4.3 Impact of the SDCCH Dynamic Allocation Function on Network Performance...................................23
2023-4-28 Huawei Proprietary and ConfidentialCopyright © Huawei Technologies Co., Ltd.
Page 3 of 31
Performance and Capacity Technical Clarification Confidentiality level:
3.5 PDCH Capacity Expansion Solution: Allocating Dynamic PDCHs...............................................................233.5.1 Application Scenarios.............................................................................................................................233.5.2 Checking Whether Capacity Expansion Is Required for PS Services....................................................233.5.3 Maximum Rate of PDCHs......................................................................................................................253.5.4 Impact of Adjusting the Maximum Rate of PDCHs on Network Performance.....................................25
4 Analysis on the Relationship Between Um-Interface Traffic Volume per Channel and Congestion Rate....................................................26
4.1 Shi Jiazhuang...................................................................................................................................................264.1.1 S1 to S4 Site Configuration Mode..........................................................................................................274.1.2 S5 to S8 Site Configuration Mode..........................................................................................................274.1.3 S9 and Higher Site Configuration Mode................................................................................................28
5 Adjusting Capacity Related Channel Management Parameters.......285.1 Adjusting TCHF and TCHH Management Parameters....................................................................................285.2 Description of AMR Related Parameters (GBSC V900R008C12 Performance Parameter Baseline)............30
6 References..................................................................................30
2023-4-28 Huawei Proprietary and ConfidentialCopyright © Huawei Technologies Co., Ltd.
Page 4 of 31

Performance and Capacity Technical Clarification Confidentiality level:
Reference DocumentsNo.
Document Author Department Date
1 GSM BSS Capacity Expansion and Performance Technical Clarification
Yan Yafeng, Wang Yiou, Yan Xingmei, and Wu Zhen
GSM Performance Department
2007-4-17
2 RNPS GSM SDCCH Capacity Planning Solutions
He Qun, Wang Yiting, and Liu Rui
RNPS 2008-10-08
3 GSM BSS AMR Performance Technical Clarification
Yan Yafeng and Liu Xiuyu
GSM Performance Department
2009-5-30
4 Guide to Capacity Expansion for PS and CS services
Zhuang Yanli and Zhang Lin
RNPS 2008-12-22
5 GSM BSS HR Performance Technical Clarification
Liu Xiuyu and Wang Fei
GSM Performance Department
2007-6-12
2023-4-28 Huawei Proprietary and ConfidentialCopyright © Huawei Technologies Co., Ltd.
Page 5 of 31

Performance and Capacity Technical Clarification Confidentiality level:
Keywords: performance, capacity
Abstract: Based on traffic statistics, this document describes how to determine the congestion rate and how the capacity is affected by adjusting the proportion of full-rate (FR)/half-rate (HR) channels, enabling the AMR function, and adding TRXs, dynamic SDCCHs, and dynamic PDCHs. This document also provides a qualitative analysis on the impact of parameter adjustment on network performance.
Acronyms and Abbreviations
Acronyms and Abbreviations
Full Name
FR Full-rate
HR Half-rate
2023-4-28 Huawei Proprietary and ConfidentialCopyright © Huawei Technologies Co., Ltd.
Page 6 of 31

Performance and Capacity Technical Clarification Confidentiality level:
Performance and Capacity Technical Clarification
1 Overview1.1 Background
At present, the GSM network in most countries is mature, the performance problems of equipment decrease, and the network quality, costs, and services have attracted more attention. Therefore, operators are committed to evaluate and optimize network resources and improve the network service capability and quality to enhance their core competencies. Some operators list the network resource usage as a KPI to evaluate the network operation and maintenance (O&M) quality.
With the commercial operation of GSM BSS and a significant increase in MSs, equipment congestion occurs in some offices, constituting an urgent need for network expansion. Before network expansion, the congestion level that may trigger network expansion must be determined.
Based on the methods for measuring the quality of wireless network, this document describes how to identify and locate congestion problems, builds a mathematical model to evaluate the impact of adjusting the TCHH, AMR function, dynamic PDCHs, and dynamic SDCCHs and adding TRXs on the traffic volume, and provides a qualitative analysis on the impact of parameter adjustment on network performance.
2 Methods for Identifying Network Congestion Problems
With a significant increase in MSs on a mature network, the existing network capacity cannot meet current requirements, deteriorating user experience and network KPIs such as the TCH congestion rate and the assignment success rate. To expand the network capacity, operators may add TRXs, modify related thresholds to absorb more traffic, or enable HR and AMR functions. In addition, to accommodate increasing PS services, dynamic PDCHs can be configured and shared by both PS and CS services. Configuration of dynamic SDCCHs and PDCHs can properly optimize frequency resources to increase channel usage.
2.1 Busy-Hour Radio Resource UsageThe design of wireless network capacity involves the following activities:
1. Obtain the maximum site configuration according to the number of available frequencies and the frequency reuse factor.
2. Calculate the total design traffic volume based on available geographic information, traffic model, number of MSs, and MS distribution.
3. Obtain the number of required TCHs by querying the Erlang B table according to the total design traffic volume and call loss rate.
4. Finalize the number of sites based on the maximum configuration.
The busy-hour radio resource usage indicates the relationship between the actual busy-hour traffic load on the network and the designed busy-hour traffic load. It is an important indicator
2023-4-28 Huawei Proprietary and ConfidentialCopyright © Huawei Technologies Co., Ltd.
Page 7 of 31

Performance and Capacity Technical Clarification Confidentiality level:
for operators to evaluate whether network resources are sufficient to carry the existing traffic load and whether network capacity needs to be expanded. The busy-hour radio resource usage is calculated using the following formula:
Busy-hour radio resource usage =Actual busy-hour traffic loadDesigned busy-hour traffic load
x 100 %
Network capacity expansion is determined by the busy-hour radio resource usage specified by operation strategies of operators. For example, an operator implements resource optimization or capacity expansion when the busy-hour radio resource usage reaches about 60%; however, some international operators do not expand the network capacity even though the busy-hour radio resource usage reaches 80%.
Huawei has no unified standards for the radio resource usage. According to the GSM BSS Capacity Expansion and Performance Technical Clarification, this indicator also relates to the site configuration. For a cell configured with one or two TRXs, the congestion rate increases significantly when the radio resource usage is greater than 65%. For a cell configured with three to five TRXs, the congestion rate increases significantly when the radio resource usage is greater than 70%. For a cell configured with six or more TRXs, the congestion rate increases significantly when the radio resource usage is greater than 80%.
The preceding values are only for reference, which may be adjusted based on the actual network conditions.
Another method for determining the network resource usage is to calculate the busy-hour traffic volume per channel to identify the existing traffic load.
The formula is as follows:
Busy-hour traffic volume per channel =FR traffic volume+HR traffic volumeNumber of available TCHs (TCHFs )+Number of available TCHs (TCHHs)
If no TCHH is configured, the number of available TCHs (TCHHs) is 0 and the HR traffic volume is 0.
If TCHHs are configured, operators can directly obtain the number of available channels and the total traffic volume by querying the traffic measurement counters: K3014: Traffic Volume on TCH and K3015: Available TCHs.
According to chapter 4 "Analysis on the Relationship Between Um-Interface Traffic Volume per Channel and Congestion Rate" and traffic statistics, when the congestion rate reaches 2%, the traffic volume per channel varies depending on the site configuration mode. For example, the traffic volume per channel is 0.5 Erlang when S1 to S4 site configuration mode is used, 0.65 Erlang when S5 to S8 site configuration mode is used, and greater than 0.8 Erlang when S9 and higher site configuration mode is used.
Network capacity expansion is also determined by the busy-hour traffic volume per channel specified by operation strategies of operators. Generally, major operators that have sufficient frequency resources add TRXs to expand the capacity to ensure the network quality. Minor operators that have insufficient frequency resources adjust related parameters to increase the network capacity. For example, they may adjust the proportion of TCHHs or enable the AMR function.
2.2 TCH Congestion2.2.1 Definition of Congestion Rate on TCH
The formula for calculating Congestion Rate on TCH (All Channels Busy) is as follows:
2023-4-28 Huawei Proprietary and ConfidentialCopyright © Huawei Technologies Co., Ltd.
Page 8 of 31

Performance and Capacity Technical Clarification Confidentiality level:
Congestion Rate on TCH (All Channels Busy) = Failed TCH Seizures due to Busy TCH/TCH Seizure Requests.
This counter reflects the proportion of TCH unavailable times to the TCH seizure requests.
When the busy-hour traffic volume exceeds the designed traffic volume or the capacity distribution at all network nodes does not match the actual busy-hour traffic distribution, TCH congestion may occur in cells with a large number of MSs in busy hours. In these cases, conduct a TCH performance measurement to check whether the congestion occurs when all channels are busy.
2.2.2 Methods for Analyzing TCH CongestionTCH congestion may be caused by equipment faults, Um-interface faults, or insufficient capacity. To locate the causes of TCH congestion, follow the analysis method shown in Figure2-1.
2023-4-28 Huawei Proprietary and ConfidentialCopyright © Huawei Technologies Co., Ltd.
Page 9 of 31

Performance and Capacity Technical Clarification Confidentiality level:
Figure 2-1 Locating the causes of TCH congestion
Description of the analysis process:
When the busy-hour congestion rate on TCH is greater than 5%, a congestion analysis needs to be performed.
2023-4-28 Huawei Proprietary and ConfidentialCopyright © Huawei Technologies Co., Ltd.
Page 10 of 31
Congestion rate on TCH > 5%
Check whether TCHs in the cell are insufficient.
Filter the cells that have sufficient capacity.
Check whether the equipment is faulty.
Traffic volume per TCH
Failed TCH seizures due to busy TCH
Failed incoming inter-cell handover
(because of congestion)
Capacity
TRX availability
TCH activation attempts
(NACK/TIMEOUT)
TCH availability
LAPD protocol capability measurement Retransmission times
SDCCH dynamic allocation
Wireless network problems
Interference band analysis
TRX receive level and receive quality
Times of handover due to poor uplink
and downlink quality
Congestion rate on SDCCH
RACH overload
Uplink and downlink balance
measurement
TCH availability per adjacent cell
Mean level and timing advance
during call drops on TCH
Average level during power
control
Rate of handovers to successful TCH
seizures
Rate of incoming handovers to
outgoing handovers
Attempted handovers
(directed retry)
Frequent handovers
Coverage
Interference
Equipment or transmission faults

Performance and Capacity Technical Clarification Confidentiality level:
For a cell, if the busy-hour traffic load per TCH reaches 80% of the designed traffic load or the traffic volume per channel exceeds 0.6 Erlang, the cell is a heavy-traffic cell (for sites configured with large capacity, a cell may be considered as a heavy-traffic cell if the busy-hour traffic load exceeds 0.8 Erlang). For heavy-traffic cells, a congestion analysis needs to be performed if the congestion rate reaches 2%.
As shown in Figure 2-1, the branches 2 and 3 list possible wireless network problems and equipment faults. Table 2-1 shows only the problem causes in branch 1.
Table 2-1 Counters related to traffic load
Cause BSC-Level Traffic Statistics Cell-Level Traffic Statistics
All channels busy
Overall BSC performance measurement > access performance measurement >
TCH performance measurement
Traffic Volume on TCH (Erl) Failed TCH Seizures due to Busy TCH
Congestion Rate on TCH (All Channels Busy) (%)
TCH Availability (%)
Failed Assignments (Channel Unavailable)
Traffic Volume on TCH (Erl)
TCH Seizure Requests (All) TCH Seizure Requests (All)
Traffic load
Overall BSC performance measurement > access performance measurement >
Congestion Rate on TCH (All Channels Busy) (%)
TCH Traffic (Erl)
Traffic Volume on TCH (Erl) Traffic Volume on TCH (Erl) (1800/1900)
Failed Assignments (Channel Unavailable)
The counters in branch 1 for reference in busy hours are shown in Table 2-1. Query the TRX and channel configuration of the current cell and Erlang B table to obtain the designed traffic volume. Then compare the designed traffic volume with the actual traffic volume to check whether the TCH congestion traffic load of the cell approaches or reaches the designed traffic volume. If the TCH congestion traffic load of the cell approaches or reaches the designed traffic volume, perform an analysis, as shown in Figure 2-2.
2023-4-28 Huawei Proprietary and ConfidentialCopyright © Huawei Technologies Co., Ltd.
Page 11 of 31

Performance and Capacity Technical Clarification Confidentiality level:
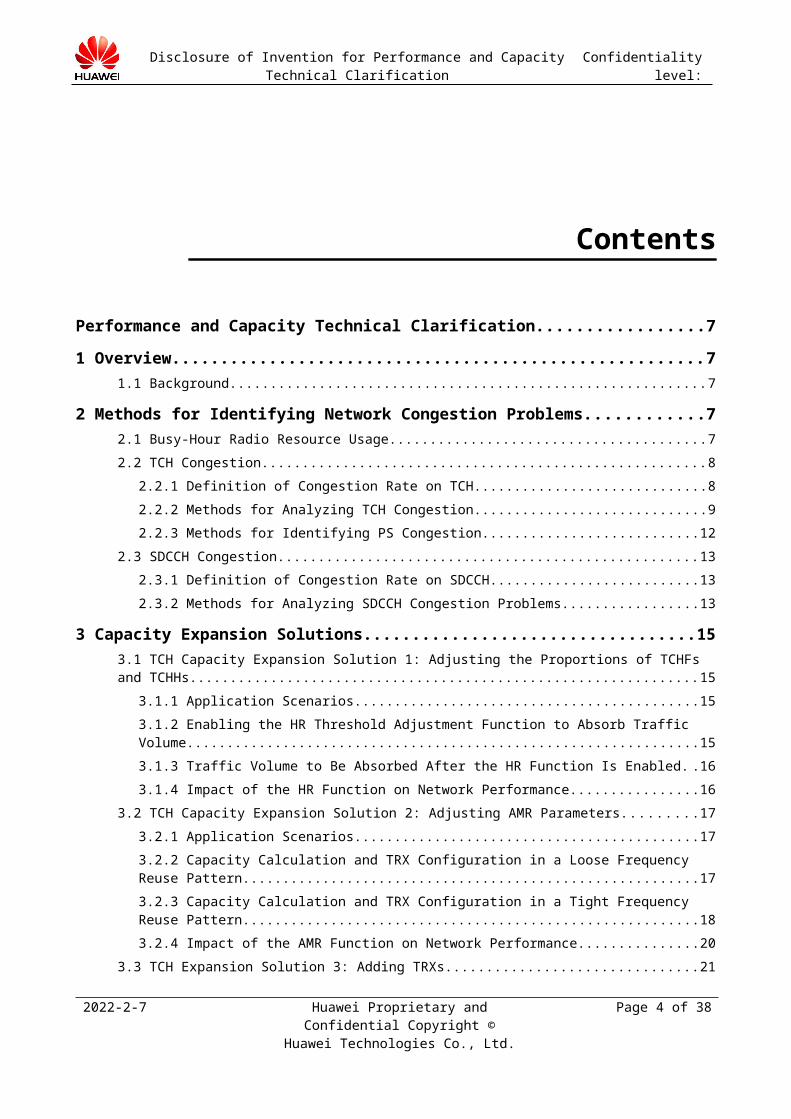
Figure 2-2 Capacity expansion analysis
Description of the analysis process:
1. The radio resource usage is the ratio of actual traffic volume to designed traffic volume. To make this calculation method applicable to various scenarios, the value of A can be defined according to actual requirements. For example, if an operator considers that the network load becomes heavy when the traffic volume reaches 60% of the designed traffic volume, A is 0.6.
2. If the actual traffic volume is larger than the product by multiplying A and the designed traffic volume, the network load approaches or exceeds the normal value specified by operators. In this case, check whether a site experiencing the congestion is isolated or has continuous coverage and whether congestion occurs in adjacent cells. If the site experiencing the congestion is isolated, perform local resource optimization (adjust the proportion of TCHHs and TCHFs) or traffic load sharing. If congestion occurs in adjacent cells, perform local capacity expansion by adding TRXs or resource optimization on the entire network.
3. If the actual traffic volume is smaller than the product by multiplying A and the deigned traffic volume, the TCHs are sufficient and you need to locate the problem and perform necessary network optimization. Commonly used network optimization methods include adjusting the coverage, access, CRO, and handover thresholds and enabling the load based handover function.
2.2.3 Methods for Identifying PS CongestionThe PS congestion rate is calculated using other counters because current traffic measurement counters do not include the congestion rate. For PS services, the downlink traffic volume is generally larger than the uplink traffic volume. Therefore, the downlink congestion is considered.
The downlink congestion rate is calculated using the following formula:
Congestion rate on PDCH= A 9103+A 9303A 9101+A 9301
NOTEA9103: Number of Failed Downlink GPRS TBF Establishments due to No ChannelA9101: Number of Downlink GPRS TBF Establishment AttemptsA9303: Number of Failed Downlink EGPRS TBF Establishments due to No Channel
2023-4-28 Huawei Proprietary and ConfidentialCopyright © Huawei Technologies Co., Ltd.
Page 12 of 31

Performance and Capacity Technical Clarification Confidentiality level:
A9301: Number of Downlink EGPRS TBF Establishment Attempts
If the calculated congestion rate on PDCH is high and the average PDCH usage reaches certain value (such as 0.8), the PDCHs are congested. In this case, adjust the maximum rate of PDCHs to increase the number of dynamic PDCHs.
Another method for identifying PS congestion is as follows:
PDCH reuse = (AR9351: Average Number of GPRS PDCHs Occupied by Downlink GPRS TBFs
+ AR9357: Average Number of Static EGPRS PDCHs Occupied by Downlink GPRS TBFs
+ AR9359: Average Number of Dynamic EGPRS PDCHs Occupied by Downlink GPRS TBFs
+ AR9365: Average Number of Static EGPRS PDCHs Occupied by Downlink EGPRS TBFs
+ AR9367: Average Number of Dynamic EGPRS PDCHs Occupied by Downlink EGPRS TBFs)
/AR9315: Average Number of PDCHs Occupied by Downlink TBF
Respectively calculate numbers of channels required for PS and CS services. The number of channels to be added for CS services is calculated based on the traffic volume and call loss rate. The number of channels to be added for PS services is calculated as follows:
Number of channels required for PS service = Reuse x Number of available channels/K (K=2)
= PDCH reuse x CR3021: Mean Number of
Available Channels (PDCH)/K
Number of channels to be added for PS services = Number of channels required for PS services – CR3021: Mean Number of Available Channels (PDCH)
2.3 SDCCH CongestionOn a GSM network, SDCCH seizure requests mainly occur in the following two cases:
1. Signaling channels are to be set up for services such as point-to-point calls, location update, and call re-establishment and the SDCCHs are required.
2. SDCCH handover (including intra-BSC handover and inter-BSC handover).
2.3.1 Definition of Congestion Rate on SDCCHThe formula for calculating the congestion rate on SDCCH is as follows:
Congestion Rate on SDCCH = Failed SDCCH Seizures due to Busy SDCCH/SDCCH Seizure Requests.
This counter reflects the proportion of SDCCH unavailable times (congested) to the SDCCH seizure requests.
2023-4-28 Huawei Proprietary and ConfidentialCopyright © Huawei Technologies Co., Ltd.
Page 13 of 31
Performance and Capacity Technical Clarification Confidentiality level:
2.3.2 Methods for Analyzing SDCCH Congestion Problems
General SDCCH capacity planning is as follows:
1. If HR service is enabled in a cell, one SDCCH/8 should be configured for each TRX with TCHHs;
2. If HR service is not enabled in a cell, the number of configured SDCCH should comply with the SDCCH Capacity Planning Guide;
SDCCH congestion may be caused by equipment faults, incorrect location update parameter setting, location area planning, or insufficient capacity. To locate the causes of SDCCH congestion, follow the analysis method shown in Figure 2-1.
2023-4-28 Huawei Proprietary and ConfidentialCopyright © Huawei Technologies Co., Ltd.
Page 14 of 31

Performance and Capacity Technical Clarification Confidentiality level:
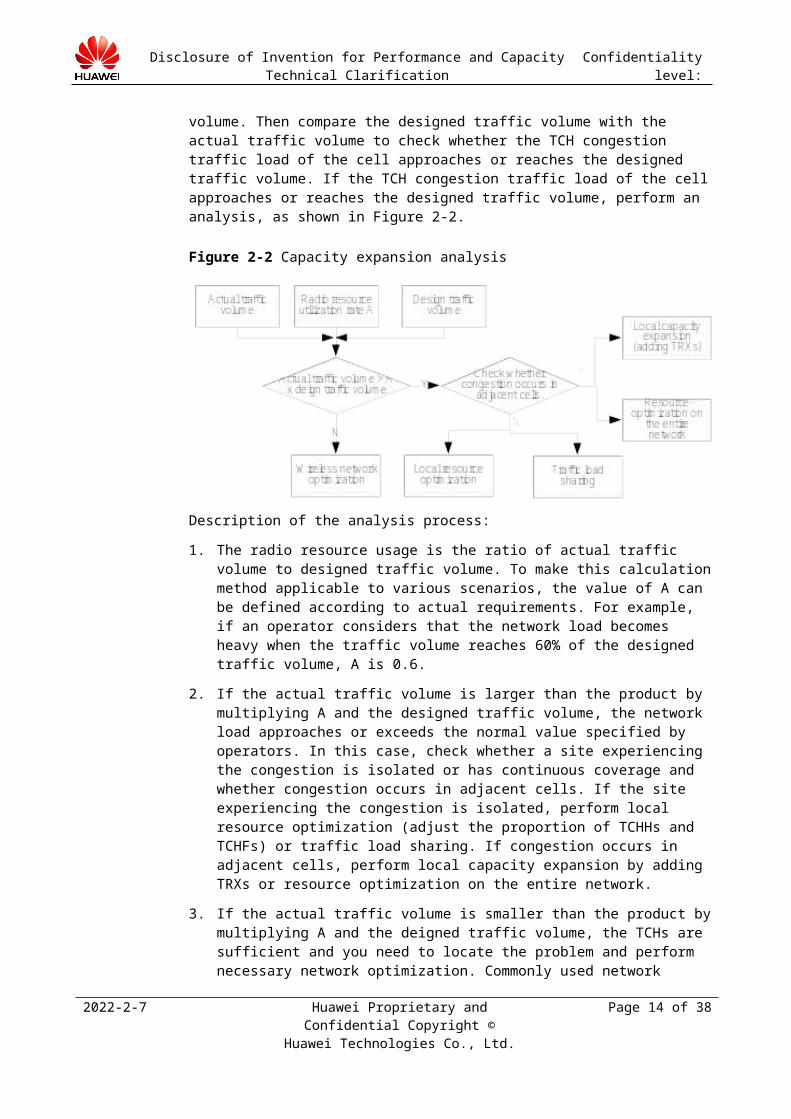
Figure 2-1 Locating the causes of SDCCH congestion
When SDCCH congestion occurs, first determine whether it is a common or an individual problem. If it is a common problem, check whether the parameters of the location update timer are properly configured and calculate whether the SDCCH capacity can meet the system requirements. If it is an individual problem, perform an analysis on the equipment, location area, and interference as follows:
1. Equipment: Check the counter TRX Availability in overall BSC performance measurement and the counter SDCCH Availability in SDCCH performance measurement and query the TCH activation attempts (NACK/TIMEOUT) to determine whether the congestion is caused by board faults.
2023-4-28 Huawei Proprietary and ConfidentialCopyright © Huawei Technologies Co., Ltd.
Page 15 of 31
Congestion rate on SDCCH > 5%
Check whether SDCCHs are insufficient.
Filter the cells that have sufficient capacity.
Traffic volume per SDCCH
Location update period
Capacity
Check whether the equipment is faulty.
TRX availability
SDCCH availability
Unsuccessful channel activation
(NACK/TIMEOUT)
SDCCH dynamic allocation
Equipment or transmission faults
TRX receive level and receive quality
Traffic volume on TCH and traffic
volume on SDCCH
Incoming handovers and outgoing handovers in
corresponding cells
Cell parameters and BSIC planning
Interference band analysis
Success rate of immediate assignments
RACH overload times
Location area planning
Interference
RACH overload times
Successful SDCCH seizures (location
update)
Wireless network problems

Performance and Capacity Technical Clarification Confidentiality level:
2. Location area planning: Improper location area planning may cause frequent location updates and further lead to SDCCH congestion. Query the location area planning and actual drive test results to analyze whether the location area boundary covers cells with a large number of MSs and whether the proportion of location updates to SDCCH seizure requests in these cells is too high. In addition, query the proportion of Successful SDCCH Seizures (location update) to SDCCH Seizure requests.
Optimization measures: Modify the location planning or increase the cell reselection hysteresis. In special cases, you can enable the SDCCH dynamic allocation function. For example, if a railway runs through the coverage area, a large number of location updates may occur when a train passes. In this case, SDCCH dynamic allocation function can be enabled.
3. Interference: On a network where the distance between BTSs is small or the BCCH frequency is aggressive, the system may receive many interference random access signals and allocate SDCCHs for these signals, resulting in congestion. As a result, in the traffic statistics, both the Success Rate of Immediate Assignments and the paging success rate decrease and RACH overload may occur.
3 Capacity Expansion Solutions3.1 TCH Capacity Expansion Solution 1: Adjusting the Proportions of TCHFs and TCHHs3.1.1 Application Scenarios
If an operator has high requirements for the network quality and the AMR function is not enabled, you are not advised to enable the HR function. On a network with existing frequency resources, if the HR function is enabled but the AMR function is not enabled, the network quality may deteriorate. Therefore, HR and AMR functions must be enabled together.
3.1.2 Enabling the HR Threshold Adjustment Function to Absorb Traffic Volume
If the existing traffic volume of a cell according to the traffic prediction is "A" and the number of configured TCHs is "a", to increase the traffic volume by d% (the traffic volume after increase may be the existing traffic volume or a predicted value) and maintain the call loss rate required by the operator at B%, you can obtain the number (b) of required TCHs by querying the Erlang B table. If no TRX is to be added, the number of TCHs to be added is as follows: Number of TCHs to be added = b – a. Assume that "x" channels in "a" TCHFs are converted to TCHHs to meet the existing requirements. Then, calculate the number of TCHHs using the following formula: x = b – a.
3.1.3 Traffic Volume to Be Absorbed After the HR Function Is Enabled
If the traffic volume of a cell is l Erlang and the call loss rate required by the operator is B % , you can obtain the number (b) of required TCHs by querying the Erlang B table. If the number of TRXs in the cell is "k", you can calculate the number of timeslots available in this cell "a". The number of TCHs that can be provided by this cell ranges from a to 2a.
2023-4-28 Huawei Proprietary and ConfidentialCopyright © Huawei Technologies Co., Ltd.
Page 16 of 31

Performance and Capacity Technical Clarification Confidentiality level:
If the existing proportion of TCHHs is 30%, c% of the TCHFs can be converted to TCHHs in busy hours and the total number of TCHs is calculated using the following formula: Total number of TCHs = a x (1 + c%). According to the total number of TCHs and the call loss rate, query the Erlang B table to calculate the maximum traffic volume using the following formula: A = Erlang B (a x (1 + c%), B % ) Erlang.
3.1.4 Impact of the HR Function on Network Performance3.1.4.1 Network Coverage
The receive level does not change obviously after the HR function is enabled.
3.1.4.2 Network QualityThe network interference is closely related to the frequency allocation, cell allocation, channel model, and interference power.
Therefore, the HR function has the following impacts on network quality:
If the number of MSs remains unchanged before and after the HR function is enabled, the interference on the entire network decreases because fewer timeslots are occupied.
If all TCHs are occupied, the interference on the entire network is different because the number of MSs is twice the number before the HR function is enabled although only half timeslots are occupied after the HR function is enabled. The interference caused by two HR MSs on one MS cannot be equivalent to that of one FR MS on the MS because the interference powers received by the interference MS from the two HR MSs are different. In addition, the signaling traffic increases as the number of MSs. In this case, if SDCCHs are not allocated properly, signaling-related KPIs may deteriorate.
3.1.4.3 Voice QualityIf the average C/I in the network is higher than 10 dB, the voice quality degradation due to HR function has a significant impact on the network voice quality. In this case, if the number of TCHHs increases, the network voice quality decreases.
If the average C/I is lower than 10 dB, the interference other than the voice quality degradation due to HR function becomes the main cause of network voice quality degradation. In this case, HR function may improve the network voice quality because of the low C/I. However, the overall voice quality has decreased below 3 dB and the voice quality needs to be improved.
3.2 TCH Capacity Expansion Solution 2: Adjusting AMR Parameters3.2.1 Application Scenarios
There are no standards for the scenarios in which the AMR function must be enabled. When the HR function is enabled, the network interference may increase with the increase of MSs. Therefore, effective anti-interference measures must be introduced to decrease the network interference, such as enabling HR AMR function. The following analysis demonstrates the considerable gains after HR AMR function is enabled. To enable the AMR function, you must
2023-4-28 Huawei Proprietary and ConfidentialCopyright © Huawei Technologies Co., Ltd.
Page 17 of 31
Performance and Capacity Technical Clarification Confidentiality level:
obtain the TRX license. Therefore, for a network with low traffic volume, the cost of enabling AMR function is high and the gains are minor. Therefore, AMR function is usually enabled in urban areas with high volume traffic.
3.2.2 Capacity Calculation and TRX Configuration in a Loose Frequency Reuse Pattern
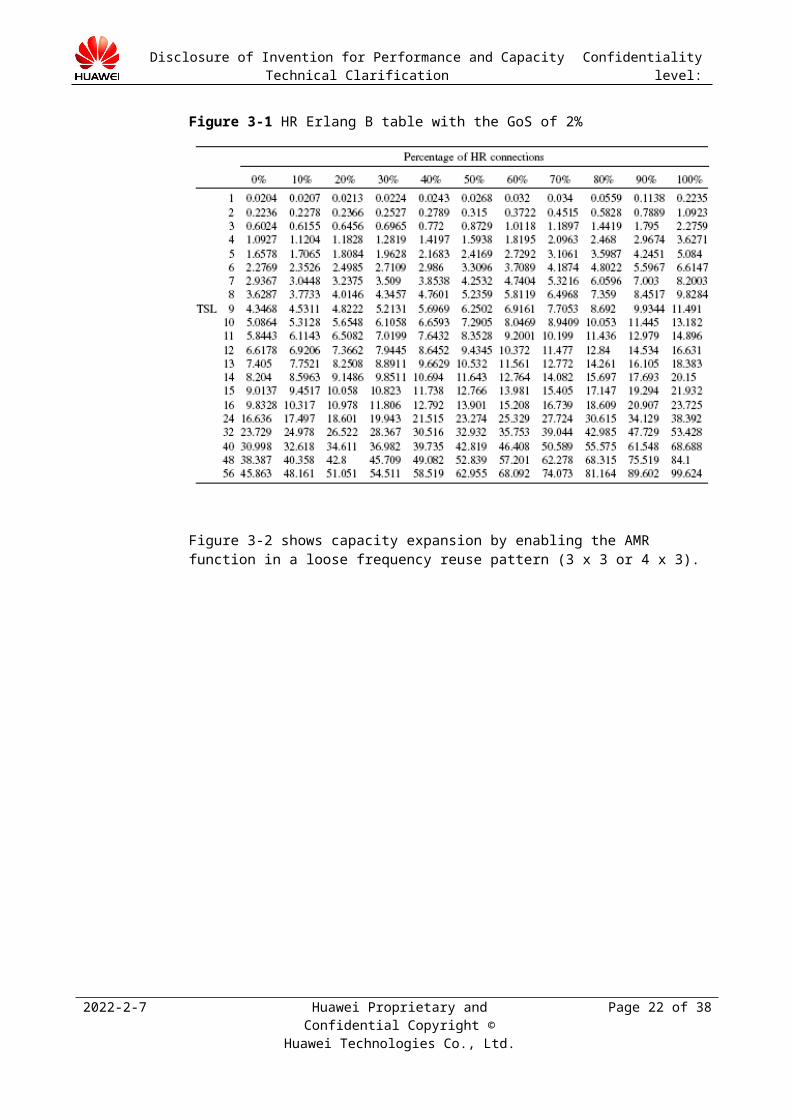
You can query the percentage of HR AMR connections, TRX configuration (number of timeslots), and traffic volume in the Erlang B table. Figure 3-1 shows the percentages of HR AMR connections with the GoS of 2%.
Figure 3-1 HR Erlang B table with the GoS of 2%
Figure 3-2 shows capacity expansion by enabling the AMR function in a loose frequency reuse pattern (3 x 3 or 4 x 3).
2023-4-28 Huawei Proprietary and ConfidentialCopyright © Huawei Technologies Co., Ltd.
Page 18 of 31
Performance and Capacity Technical Clarification Confidentiality level:
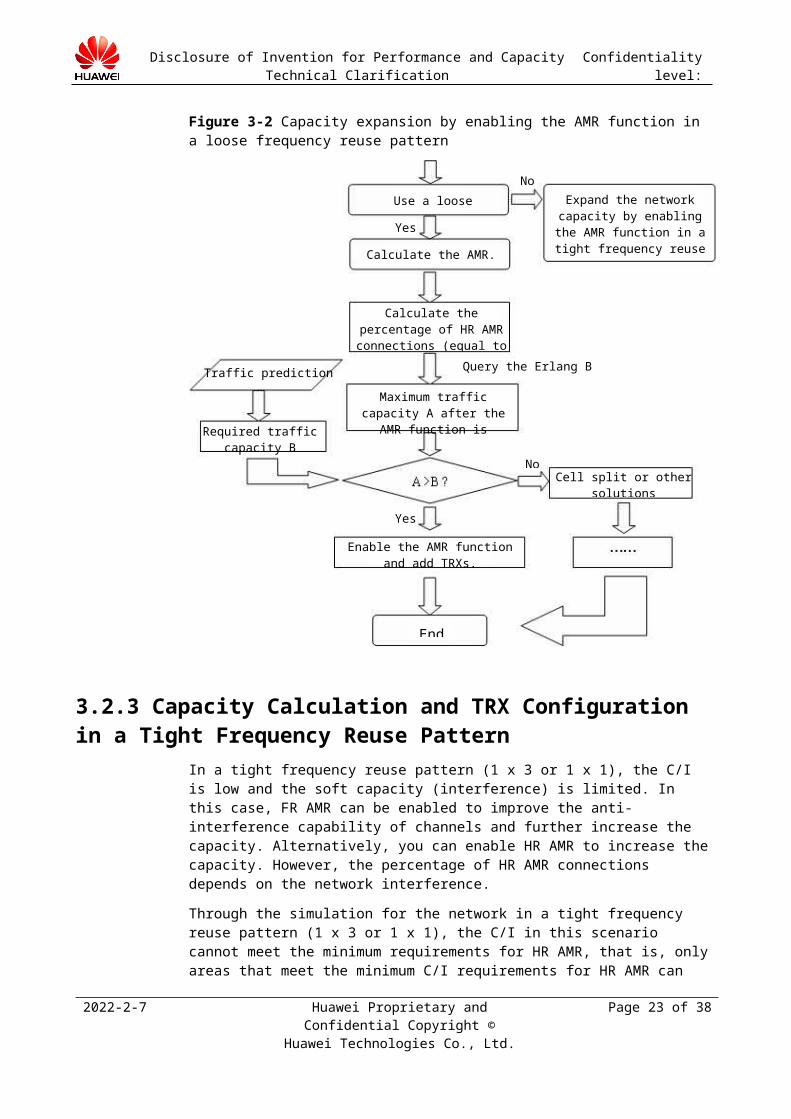
Figure 3-2 Capacity expansion by enabling the AMR function in a loose frequency reuse pattern
3.2.3 Capacity Calculation and TRX Configuration in a Tight Frequency Reuse Pattern
In a tight frequency reuse pattern (1 x 3 or 1 x 1), the C/I is low and the soft capacity (interference) is limited. In this case, FR AMR can be enabled to improve the anti-interference capability of channels and further increase the capacity. Alternatively, you can enable HR AMR to increase the capacity. However, the percentage of HR AMR connections depends on the network interference.
Through the simulation for the network in a tight frequency reuse pattern (1 x 3 or 1 x 1), the C/I in this scenario cannot meet the minimum requirements for HR AMR, that is, only areas that meet the minimum C/I requirements for HR AMR can support HR AMR calls. In areas not meeting the minimum C/I requirements, the FR AMR must be enabled. Therefore, the capacity increased by enabling HR AMR is limited by the interference distribution and the AMR penetration rate.
For example:
If 50% areas meet the minimum C/I requirements for HR AMR and the AMR penetration rate is 60%, the maximum capacity gain obtained by enabling HR AMR is 50%.
2023-4-28 Huawei Proprietary and ConfidentialCopyright © Huawei Technologies Co., Ltd.
Page 19 of 31
Use a loose frequency. reuse
Calculate the AMR.
Calculate the percentage of HR AMR connections (equal to the AMR penetration rate).
Query the Erlang B table
Maximum traffic capacity A after the AMR function is
enabled
Traffic prediction
Required traffic capacity B
Enable the AMR function and add TRXs.
End
Expand the network capacity by enabling the AMR function
in a tight frequency reuse pattern.
Cell split or other solutions
Yes
Yes
No
No
Performance and Capacity Technical Clarification Confidentiality level:
In a tight frequency reuse pattern, do as follows to obtain the capacity and TRX configuration after the AMR function is enabled:
1. Query the site configuration mode (number of channels) according to the baseline.2. Obtain the maximum traffic volume.3. Use the following formula to calculate the maximum traffic volume after the AMR
function is enabled:
Maximum traffic volume after the AMR function is enabled = Traffic volume in baseline site configuration mode x (1 + AMR capacity gain).
4. Obtain the number of channels and TRXs after the AMR function is enabled.
For example:
According to related baselines of Huawei, the maximum site configuration is S4/4/4 when 6 MHz bandwidth is used.
If each TRX has 7.2 TCHs on average, the maximum traffic volume in baseline site configuration mode is as follows:
Maximum traffic volume = 4 x 7.2 = 28.8 Erlang
If the AMR penetration rate is 60%, and 50% areas meet the minimum C/I requirements for HR AMR, the maximum capacity gain is 50%. The maximum traffic volume after the AMR function is enabled is as follows:
Maximum traffic volume = (28.8 Erlang x (1 + 50%)) = 43.2 Erlang
Number of TRXs = 43.2/7.2 = 6.
Therefore, after the AMR function is enabled, the maximum site configuration is S6/6/6 when 6 MHz bandwidth is used.
NOTEThe S6/6/6 site configuration mode is not ready for delivery at present. Large-scale commercialization of IBCA and synchronized network is not realized. The gains of ICC and SAIC can be obtained only after they are enabled together with IBCA and synchronized network.
Figure 3-1 shows the capacity expansion by enabling the AMR function in a tight frequency reuse pattern.
2023-4-28 Huawei Proprietary and ConfidentialCopyright © Huawei Technologies Co., Ltd.
Page 20 of 31
Performance and Capacity Technical Clarification Confidentiality level:
Figure 3-1 Capacity expansion by enabling the AMR function in a tight frequency reuse pattern
3.2.4 Impact of the AMR Function on Network Performance3.2.4.1 Voice Quality
According to MOS simulation tests for FR AMR, HR AMR, EFR, FR, and HR calls under different C/I ratios, when the C/I is greater than six, the quality of these calls from high to low is FR AMR, EFR, HR AMR, and FR. The result demonstrates that the network quality can be greatly improved after the AMR function is enabled. Note that HR AMR calls have the same voice quality as FR calls. However, the Um-interface bandwidth for HR AMR calls is only a half of that for FR calls. Therefore, enabling HR AMR function can significantly increase the system capacity.
2023-4-28 Huawei Proprietary and ConfidentialCopyright © Huawei Technologies Co., Ltd.
Page 21 of 31
Use a tight frequency reuse. Expand the network capacity by enabling the AMR function in a loose frequency reuse
pattern.Maximum site configuration mode
according to the baseline
Maximum traffic volume
Maximum traffic volume after the AMR function is enabled.
Channel and TRX configuration after the AMR function is enabled.
Query the Erlang B table
Maximum traffic capacity A after the AMR function is enabled
Enable AMR and add TRXs.
End
AMR penetration rate
Capacity gains obtained by enabling the AMR function
Traffic prediction
Required traffic capacity
Cell split or other solutions
No
Yes
No
Yes
Performance and Capacity Technical Clarification Confidentiality level:
3.2.4.2 Network Coverage3.2.4.2.1 AMR Speech Frame Coverage
Benefiting from the excellent anti-interference ability, the AMR codec has lower frame erasure rate (FER) than non-AMR codec. AMR calls are not interrupted in areas using non-AMR codec. Therefore, AMR codec has better coverage and can create great gains for wide coverage (in open areas) and deep coverage (in fast fading, shadow, and indoor areas). After a simulation for the coverage performance of the AMR codec (eight different bit rates) and FR codec is performed, comparison of the simulation results shows that when the FER is no more than 5%, the coverage gain of AMR codec is 5 dB higher than that of FR codec.
3.3 TCH Expansion Solution 3: Adding TRXs3.3.1 Application Scenarios
Branch 1 in 2 2.2.2.1Step 1Figure 2-1 indicates whether the congestion is caused by insufficient capacity. When both a cell and its neighboring cells experience the congestion, if the problem cannot be solved by modifying related parameters, the only method is to add TRXs. However, whether to add TRXs is determined by operation strategies of operators. Some operators that have sufficient frequency resources and expect high network quality will add TRXs to expand the network capacity.
3.3.2 Number of TRXs to Be Added for Traffic Absorption
In a cell, if the number of TRXs is "k" and the number of available TCHs is "a", do as follows to obtain the number of TRXs to be added:
1. Take the designed traffic volume or predicted traffic volume of the cell as the target traffic volume;
2. Obtain the number (b) of required TCHs by querying the Erlang B table based on the call loss rate;
3. Calculate the number (c) of SDCCHs that must be configured according to the actual location of the cell;
4. Obtain the number of TCHs to be added by b minus a;5. Round up the result of the following formula to obtain the number of TRXs to be added:
Number of TRXs to be added = (b + c + 1)/8.
3.3.3 Impact of Adding TRXs on Network Performance3.3.3.1 Network Coverage
If TRXs are added to BTS3012, external combiners may be required. The external combiner has 3 dB loss. Therefore, the coverage area reduces, which is allowed in the capacity expansion scenario.
For a multi-carrier BTS, the power of each carrier decreases with an increase of carriers. Therefore, the coverage area reduces even although no external combiner is added.
2023-4-28 Huawei Proprietary and ConfidentialCopyright © Huawei Technologies Co., Ltd.
Page 22 of 31
Performance and Capacity Technical Clarification Confidentiality level:
3.3.3.2 Network QualityIf frequency resources in an area are fixed, the frequency reuse pattern or FR load changes after TRXs are added. If the frequency reuse distance becomes smaller or the FR load increases, C/I and the network quality decrease. If more frequency resources are used and the frequency reuse pattern or FR load remains unchanged, the C/I has no significant decrease and the original network quality can be maintained.
3.4 SDCCH Capacity Expansion Solution: SDCCH Dynamic Allocation3.4.1 Application Scenarios
Generally, the SDCCH dynamic allocation function is enabled in cells where SDCCHs other than TCHs are congested. After this function is enabled, the SDCCH capacity can be adjusted to reduce the SDCCH congestion, minimize the impact of SDCCH initial configuration on the system performance, and enlarge the system capacity. This function is divided into two types: dynamic allocation from TCHs to SDCCHs and recovery from SDCCHs to TCHs. Whether to enable this function is determined based on dynamic allocation algorithm and related parameter settings. To convert TCHs to SDCCHs, three requirements must be met: 1. The number of idle SDCCHs is equal to or less than the threshold of idle SDCCHs "N1"; 2. The number of idle TCHs in a cell is greater than four or the number of TRXs; 3. The number of SDCCHs in the cell is less than the allowable maximum value. When all the three requirements are met, set related parameters to convert the TCHs to SDCCHs. After a period of time, if some SDCCHs in the cell are not occupied, the BSC recovers these SDCCHs to TCHs.
3.4.2 Estimation of Dynamic SDCCHsThis document shows how to adjust the SDCCHs based on the number of existing or predicted MSs in the traffic model for single MS to allocate sufficient SDCCHs for MSs and ensure that remaining TCHs can meet the network capacity requirements. Therefore, the rate of required dynamic SDCCHs can be obtained. If the rate of existing dynamic SDCCHs does not exceed the rate of required dynamic SDCCHs, adjustment is unnecessary; otherwise, adjust the SDCCHs.
In a cell, if the number of configured static SDCCHs is "a" ("a" timeslots; one timeslot corresponds to eight sub-channels; if the SDCCH/4 configuration is used, one timeslot corresponds to four sub-channels), the total number of TCHs is "b", and d% channels are to be configured as dynamic SDCCHs, the following formulas can be obtained:
{a +d% x b ≥Erlang (Busy-hour traffic volume on SDCCHs, GoS )¿ ¿¿¿You can query the traffic statistics to obtain the buys-hour traffic volume on SDCCHs and the busy-hour traffic volume on TCHs.
GoS depends on whether SDCCH/8 or SDCCH/4 configuration is used. For the configuration of SDCCH/8 + SDCCH/4, GoS is the call loss rate of SDCCH/8 configuration.
"b": the number of TCHs except the BCCHs and static SDCCHs.
"c": the number of TCHs that must be in idle state when the SDCCH dynamic allocation function is to be enabled.
2023-4-28 Huawei Proprietary and ConfidentialCopyright © Huawei Technologies Co., Ltd.
Page 23 of 31
Performance and Capacity Technical Clarification Confidentiality level:
Adjust the value of "d" to realize proper setting of the number of SDCCHs and TCHs to improve the radio channel usage.
3.4.3 Impact of the SDCCH Dynamic Allocation Function on Network Performance
The configuration of dynamic SDCCHs has no effect on network coverage and C/I, but affects capacity related KPIs to some extent. When dynamic SDCCHs are configured, the Congestion Rate on SDCCH decreases but the Success Rate of Immediate Assignments and Success Rate of Random Access have no significant decrease.
3.5 PDCH Capacity Expansion Solution: Allocating Dynamic PDCHs3.5.1 Application Scenarios
In cells with a large number of PS services, in addition to static PDCHs, certain dynamic PDCHs must be configured according to the probability of idle TCHs. Therefore, high transmission rate can be provided for PS services if CS services maintain uninterrupted with fewer channels occupied. In cells configured with a small number of TRXs, the rate of dynamic PDCHs is small; in cells configured with a large number of TRXs, the rate of dynamic PDCHs is large.
3.5.2 Checking Whether Capacity Expansion Is Required for PS Services
In live network, the PDCHs are shared by GPRS, EDGE, and EDGE+ services. The resource usage can be improved provided that sufficient PDCHs are allocated for the three services. EDGE+ services first, followed by EDGE services and GPRS services.
For PS services, whether to allocate dynamic PDCHs also depends on the Congestion Rate on PDCH and channel usage.
Figure 3-1 shows the procedures for calculating the number of dynamic and static PDCHs.
2023-4-28 Huawei Proprietary and ConfidentialCopyright © Huawei Technologies Co., Ltd.
Page 24 of 31

NoYes
No
YesNo
Yes
Start
Erlang for PS services
Total number of timeslots occupied by PS services (N2)
CS services in single cell
Number of timeslots occupied by CS services (N1)
Number of available dynamic PDCHs (N4)
N > N2
Number of available timeslots (N)
Add dynamic PDCHs or
TRXs.
End
N2 > N4Channel usage > a
Do not change the
configuration.
Performance and Capacity Technical Clarification Confidentiality level:
Figure 3-1 Checking whether capacity expansion is required for PS services
Detailed description:
1. Calculating the number of timeslots occupied by CS services (N1)
N1 = ErlangB (CS services in single cell (Erlang), gos_cs = 2%)/(1 + hs_tch_proportion)
hs_tch_proportion: the proportion of HR services.
2. Calculating the total number of timeslots occupied by PS services (N2) (channels shared by GRPS, EDGE, and EDGE+ services)
Calculate the number of PDCHs required for the existing Erlang for GPRS and EGPRS services.
N2 = ErlangB (existing Erlang for PS services, gos_gprs = 2%). The formula for calculating the Erlang for PS services is as follows:
Erlang for PS services =Total number of the transmitted radio data blocks x 0 .02 sDuration of busy hours (s )
The Erlang for PS services includes the initial transmission of RLC data block, retransmission of previous RLC data block, and transmission of RLC control block. Total number of the
2023-4-28 Huawei Proprietary and ConfidentialCopyright © Huawei Technologies Co., Ltd.
Page 25 of 31

Performance and Capacity Technical Clarification Confidentiality level:
transmitted data blocks = Total Number of Downlink GPRS RLC Data Blocks + Number of Downlink GPRS RLC Control Blocks + Total Number of Downlink EGPRS RLC Data Blocks + Number of Downlink EGPRS RLC Control Blocks.
For PS services, whether the channels are sufficient depends on both the congestion rate and channel usage. Therefore, you must set the threshold value (a) of channel usage based on experience. If the actual channel usage is greater than "a" and the number of required PDCHs is greater than that of available PDCHs, provide solutions for capacity expansion. If the actual channel usage is smaller than "a" and number of required PDCHs is greater than that of available PDCHs, optimize network resources.
3.5.3 Maximum Rate of PDCHsCurrently, the BSC6000 V9R8 has an internal PCU. Therefore, you need to configure PDCHs only and all TCHFs can be converted to dynamic PDCHs. The TCHHs cannot be converted to PDCHs. The number of TCHs that can be converted to dynamic PDCHs is determined by MAXPDCHRATE and MAXPDCHNUM on TRX and must be properly configured.
The MAXPDCHNUM on TRX indicates the maximum number of PDCHs on one TRX. If the dynamic PDCH distribution on TRXs does not affect network quality, retain the default value 8.
MAXPDCHRATE indicates the maximum number of TCHs that can be converted to PDCHs. Each TCHF can be converted to PDCH. In this case, the maximum number of PDCHs in a cell is calculated using the following formula (round down the result if required): MAXPDCHNUM in Cell = (Number of Configured TCHFs + Number of Initially Configured Channels (Static PDCH) x MAXPDCHRATE.
The MAXPDCHRATE can be calculated based on related algorithm and the actual number of PDCHs. The formula is shown in the following table.
Number of Initially Configured Channels (Static PDCH) a
Number of Initially Configured Channels (Dynamic PDCH) b
Number of Configured TCHFs c
MAXPDCHRATE (T) T = (Int[((a + b)/(a + c)) x 10] + 1)/10 x 100%
3.5.4 Impact of Adjusting the Maximum Rate of PDCHs on Network Performance3.5.4.1 Network Coverage
Dynamic PDCH rate adjustment has no effect on network coverage.
3.5.4.2 Network QualityBased on the planning and preceding calculation methods, the MAXPDCHRATE can be obtained to provide basis for adjustment of the rate of PDCHs. The conversion from TCHs to PDCHs requires a period of time. Therefore, although CS services have the priority, if MS
2023-4-28 Huawei Proprietary and ConfidentialCopyright © Huawei Technologies Co., Ltd.
Page 26 of 31

Performance and Capacity Technical Clarification Confidentiality level:
access requests exist during this period, the access may fail due to the delay in TCH resource allocation. Then the Congestion Rate on TCH increases.
In addition, PDCHs must be configured according to the TRX and timeslot ID in ascending order. Configure static PDCHs first, followed by dynamic PDCHs, and TCHs. Continuous distribution of PDCHs ensures allocation of continuous timeslots to MSs to increase the download rate.
4 Analysis on the Relationship Between Um-Interface Traffic Volume per Channel and Congestion Rate4.1 Shi Jiazhuang
In the network, CS services preempt resources preferentially. After dynamic PDCHs are configured, CS services still have the priority. Therefore, you only need to check whether the channels for CS services are congested. You can determine whether the congestion problem occurs according to the following counters:
1. Congestion rate
2. Traffic volume per channel
When the busy-hour traffic volume exceeds the designed traffic volume or the capacity distribution at all network nodes does not match the actual busy-hour traffic distribution, TCH congestion may occur in cells with a large number of MSs in busy hours. Determine whether a cell experiences congestion according to the Congestion Rate on TCH (All Channels Busy). For different networks, the congestion rates are different. The statistics on the relationship between the traffic volume per channel and the congestion rate shows that the congestion rate increases non-linearly with the increase of the traffic volume per channel. However, in different scenarios, the congestion rate begins to increase at different points.
The counters used for the statistics are as follows:
1. K3014: Congestion Rate on TCH
2. K3015: Available TCHs
The formula is as follows:
Traffic volume per channel = K3014: Congestion Rate on TCH/K3015: Available TCHs.
The relationship between the traffic volume per channel and the congestion rate in different site configuration modes in Shi Jiazhuang is shown in 4.1.1.1Step 1Figure 4-1, 4.1.2.1Step 1Figure 4-1, and 4.1.3.1Step 1Figure 4-1.
2023-4-28 Huawei Proprietary and ConfidentialCopyright © Huawei Technologies Co., Ltd.
Page 27 of 31

Relationship of traffic volume per channel and congestion rate when S1 to S4 site configuration mode is used
0.00%10.00%20.00%30.00%40.00%50.00%60.00%70.00%80.00%90.00%
0.00 0.20 0.40 0.60 0.80 1.00
Traffic volume per channel
Congestion
rate
Congestion rate
Relationship of traffic volume per channel and congestion rate when S5 to S8 site configuration mode is used
0.00%10.00%20.00%30.00%40.00%50.00%60.00%70.00%80.00%90.00%
0 0.2 0.4 0.6 0.8 1
Congestion
rate
Traffic volume per channelCongestion rate
Performance and Capacity Technical Clarification Confidentiality level:
4.1.1 S1 to S4 Site Configuration ModeFigure 4-1 Relationship between the traffic volume per channel and the congestion rate
4.1.2 S5 to S8 Site Configuration ModeFigure 4-1 Relationship between the traffic volume per channel and the congestion rate
2023-4-28 Huawei Proprietary and ConfidentialCopyright © Huawei Technologies Co., Ltd.
Page 28 of 31
0.00%10.00%20.00%30.00%40.00%50.00%60.00%70.00%80.00%
0 0.2 0.4 0.6 0.8 1
Relationship of traffic volume per channel and congestion rate when S9 to S12 site configuration mode is used
Traffic volume per channelCongestion rate
Congestion
rate
Performance and Capacity Technical Clarification Confidentiality level:
4.1.3 S9 and Higher Site Configuration ModeFigure 4-1 Relationship between the traffic volume per channel and the congestion rate
The statistic results show that the congestion rate increases exponentially with the increase of the traffic volume per channel. When the traffic volume per channel increases and the congestion rate is 2%:
1. If the S1 to S4 site configuration mode is used, the congestion rate begins to increase when the traffic volume per channel is less than 0.45 Erlang.
2. If the S5 to S8 site configuration mode is used, the congestion rate begins to increase when the traffic volume per channel is within 0.6–0.7 Erlang.
3. If the S9 and higher site configuration mode is used, the congestion rate begins to increase when the traffic volume per channel is larger than 0.8 Erlang.
The statistic concludes that under the same congestion rate, a site with higher configuration can have larger traffic volume per channel. In S1 to S4 site configuration mode, capacity needs to be expanded when the traffic volume per channel reaches 0.5 Erlang. In S5 to S8 site configuration mode, capacity needs to be expanded when the traffic volume per channel reaches 0.65 Erlang. In S9 and higher site configuration mode, capacity needs to be expanded when the traffic volume per channel reaches 0.8 Erlang.
5 Adjusting Capacity Related Channel Management Parameters5.1 Adjusting TCHF and TCHH Management Parameters
After the HR function is enabled, the following parameters need to be adjusted:
1. TCH Traffic Busy Threshold (%)
2023-4-28 Huawei Proprietary and ConfidentialCopyright © Huawei Technologies Co., Ltd.
Page 29 of 31

Performance and Capacity Technical Clarification Confidentiality level:
Description: According to the HWII channel allocation algorithm, if the current channel seizure ratio reaches or exceeds this value, the TCHHs are assigned preferentially; otherwise, the TCHFs are assigned preferentially.
Value range: 0–100
Default value: 60
Unit: %
2. AMR TCH/H Prior Allowed
Description: BSC determines whether to preferentially assign the TCHHs based on the channel type allowed by the MSC and the TCH usage. When the channel type allowed by the MSC is "TCHF or TCHH" (except the option of TCHF or TCHH only) and AMR TCH/H Prior Allowed is set to ON(On), TCHHs are preferentially allocated if the TCH usage is greater than the value of AMR TCH/H Prior Cell Load Threshold. If the TCH usage is no more than the value of AMR TCH/H Prior Cell Load Threshold, TCHFs are preferentially allocated.
Value range: ON(On), OFF(Off)
Default value: OFF(Off)
Unit: none
3. AMR TCH/H Prior Cell Load Threshold
Description: Determine the type of the channel to be allocated based on the channel type allowed by the MSC and the TCH usage.
When the channel type allowed by the MSC is "TCHF or TCHH" (except the option of TCHF or TCHH only) and AMR TCH/H Prior Allowed is set to YES(Yes), TCHHs are preferentially allocated if the TCH usage is greater than the value of AMR TCH/H Prior Cell Load Threshold. If the TCH usage is no more than the value of AMR TCH/H Prior Cell Load Threshold, TCHFs are preferentially allocated.
For description of cell load, see CECHMC Cell Load Threshold.
Related algorithm: AMR traffic channel allocation algorithm
Value range: 0–100
Default Value: 55
Unit: %
4. TCHH Function Switch
Description: This parameter specifies whether to enable the Abis resource adjustment TCHH function.
It specifies whether TCHHs are preferentially allocated to MSs by the BSC when Abis resources are insufficient.
If the Abis resource load is greater than Flex Abis Prior Choose Load Thred or Fix Abis Prior Choose Abis Load Thred, when the parameter is set to YES(Yes), the BSC preferentially allocates TCHHs to MSs.
Value range: YES(Yes), NO(No)
Default value: NO(No)
2023-4-28 Huawei Proprietary and ConfidentialCopyright © Huawei Technologies Co., Ltd.
Page 30 of 31
Performance and Capacity Technical Clarification Confidentiality level:
5. Flex Abis Prior Choose Load Thred (%)
Description: If the static Abis resource load is greater than the value of Fix Abis Prior Choose Abis Load Thred and the dynamic Abis resource load is greater than the value of this parameter, TCHHs are preferred; otherwise, TCHFs are preferred.
Value range: 0–100
Default value: 80
Unit: %
6. Fix Abis Prior Choose Abis Load Thred (%)
Description: This parameter controls the static Abis resource load threshold. If the static Abis resource load is smaller than the value of this parameter, TCHFs are preferred; otherwise, TCHHs are allocated preferentially according to the dynamic Abis resource load.
Value range: 0–100
Default value: 80
Unit: %
7. Ratio of TCHH (%)
Description: If the ratio of number of TCHHs to the total number of channels reaches or exceeds the value of this parameter, no TCHH is to be allocated.
Total number of channels = number of TCHHs + number of TCHFs x 2
Value range: 0–100
Default value: 100
Unit: %
8. Ratio of AMR-HR (%)
Description: If the ratio of number of AMR TCHHs to the total number of channels reaches or exceeds the value of this parameter, no AMR TCHH is to be allocated.
Total number of channels = number of TCHHs + number of TCHFs x 2
Value range: 0–100
Default value: 100
Unit: %
5.2 Description of AMR Related Parameters (GBSC V900R008C12 Performance Parameter Baseline)
For description of AMR related parameters, see the GSM AMR.
6 ReferencesNone
2023-4-28 Huawei Proprietary and ConfidentialCopyright © Huawei Technologies Co., Ltd.
Page 31 of 31
Related Documents


![Brochure - Comarch BSS Suite [Comarch’s Strengths in BSS]](https://static.cupdf.com/doc/110x72/5479a818b4795990098b4836/brochure-comarch-bss-suite-comarchs-strengths-in-bss.jpg)