1 Greywater recycling: A review of treatment options and applications Dr. Marc Pidou 1* Dr. Fayyaz Ali Memon 2 Prof. Tom Stephenson 1 Dr. Bruce Jefferson 1 Dr. Paul Jeffrey 1 1 School of Applied Sciences, Cranfield University 2 School of Engineering, Computer Science and Mathematics, University of Exeter * Corresponding author – Centre for Water Science, Building 39, Cranfield University, Cranfield, Beds. MK43 0AL. Email: [email protected] Key words: greywater, recycling, technologies.

Welcome message from author
This document is posted to help you gain knowledge. Please leave a comment to let me know what you think about it! Share it to your friends and learn new things together.
Transcript

1
Greywater recycling: A review of treatment options and
applications
Dr. Marc Pidou1*
Dr. Fayyaz Ali Memon2
Prof. Tom Stephenson1
Dr. Bruce Jefferson1
Dr. Paul Jeffrey1
1 School of Applied Sciences, Cranfield University2 School of Engineering, Computer Science and Mathematics, University of Exeter* Corresponding author – Centre for Water Science, Building 39, Cranfield University, Cranfield,
Beds. MK43 0AL.Email: [email protected]
Key words: greywater, recycling, technologies.
li2106
TextBox
Institution Of Civil Engineers. Proceedings. Engineering Sustainability, vol. 160, page 119-131

2
Abstract
Wastewater is an immense resource which could have significant applications in
regions of water scarcity. Greywater has particular advantages in that it is a large
source with a low organic content. Through critical analysis of data from existing
greywater recycling applications this paper presents a review of existing technologies
and applications; collating a disparate information base and comparing / contrasting
the strengths and weaknesses of different approaches. Findings suggest that simple
technologies and sand filters have been shown to achieve only a limited treatment of
the greywater whereas membranes were reported to provide good removal of the
solids but could not efficiently tackle the organic fraction. Alternatively, biological
and extensive schemes achieved good general treatment of greywater with a
particularly good removal of the organics. The best overall performances were
observed within the schemes combining different types of treatment to ensure
effective treatment of all the fractions.

3
Introduction
Wastewater recycling has been and continues to be practiced all over the world for a
variety of reasons including; to increase water availability, combat water shortages
and drought, and support environmental and public health protection.1 The increase
in water demand is due mainly to the steady rise in the world’s population which also
generates an increase in wastewater production. Consequently wastewater, if recycled,
becomes a significant source of water that could potentially cover for the lack of fresh
water observed elsewhere. Worldwide, the most common application for wastewater
recycling is agricultural irrigation.2 However, other options such as industrial,
recreational, environmental and urban reuse have been practised.3 The potential
sources identified for urban reuse are sewage4, greywater5 and rain water6, where
greywater is defined as domestic wastewater excluding toilet flush. In some cases,
mixed rain and grey waters7 have been used as well as a ‘light greywater’ including
only the sources from the bathroom.8
The advantage of recycling greywater is that it is a large source with a low organic
content. To illustrate, greywater represents up to 70% of total consumed water but
contains only 30% of the organic fraction and from 9 to 20% of the nutrients.9
Moreover, in an individual household, it has been established that greywater could
support the amount of water needed for toilet flushing and outdoor uses such as car
washing and garden watering.10 For example in the UK, on average, toilet flushing
and outdoor use represent 41% of total domestic water usage whereas greywater from
shower, bath, hand basin, laundry and dishwasher correspond to 44% (Table 1).
However, at larger scale, other applications such as irrigation of parks, school yards,
4
cemeteries and golf courses, fire protection and air conditioning have been
considered.12
That greywater recycling is both feasible and can contribute to sustainable water
management is now widely accepted. However, greywater only schemes are currently
the poor relations of water recycling activities on the global stage. This paper provides
a long overdue review of existing technologies and applications; collating a disparate
information base and comparing / contrasting the strengths and weaknesses of
different treatment options. Our ambition in presenting the data in this way is to
provide a critical and context sensitive analysis of the performance attributes of
technologies used for greywater treatment. The focus on treatment performance
means that a formal comparison of just how sustainable each technology option is
cannot be explicitly addressed. However, the ability to meet published quality criteria
for sub-potable water uses is a pre-condition for considering these technologies for
application and it is in this context that the information presented is of value. Of
relevance to both practitioners and researchers, the material also comprises a
contemporary account of greywater reuse applications.
Treatment technologies for greywater recycling
Investigations into the treatment and recycling of greywater have been reported since
the 1970’s.13-16 The first technologies studied were mainly physical treatment options
such as coarse filtration or membranes often coupled with disinfection.14, 15 Later in
the 1980’s and 1990’s, biological based technologies such as rotating biological
contactor17, biological aerated filters2, 18 and aerated bio-reactors19-21 were
investigated. During the same period, simple physical separators coupled with
5
disinfection processes were being developed and installed in single houses.19, 22, 23 In
the late 1990’s reports also emerged on the use of advanced technologies such as
MBRs24-27 and alternatively cheaper extensive technologies such as reed beds 28-31 and
ponds.32, 33 Interestingly, only three chemical treatments, photocatalysis35, electro-
coagulation34 and conventional coagulation36, were reported in the literature.
Schemes for greywater recycling have been found in most parts of the world. No
specific trend could be identified between the types of treatment used and the
locations; although it is thought that poorer countries will favour the use of low cost
and low maintenance technologies for economic reasons. For instance, Dallas and
Ho37 investigated the use of fragments of PET plastic from water bottles as a cheaper
media in constructed wetlands in Costa Rica. Similarly, in Jordan, Bino38 used a
simple, low cost and easy to build treatment system made of plastic barrels. Further,
in Oman, Prathapar et al.39 designed and tested a low cost, low maintenance system
based and activated carbon, sand filtration and disinfection for the treatment of
ablution water in a mosque.
No international regulations have been published to control the quality of treated
effluent for reuse. However, many countries have individually produced their own
guidelines depending on their needs. Because the main issue when using recycled
water is the potential risk to human health, the standards are usually based on
microbial content. However, as has often been shown, the aesthetics of the water to be
reused is probably as important because of the perception of the public. 40, 41
Therefore, the standards include parameters for the treatment of the organics and
solids fractions such as biochemical oxygen demand (BOD), suspended solids (SS)

6
and turbidity. Examples of standards of countries from around the world are reported
in Table 2. The differences seen in the regulations for water reuse in different
countries result in a range of values for the chosen water quality parameters. For
instance, standards for BOD, turbidity, faecal coliforms and total coliforms range
from 5-40 mg.L-1, 2-20 NTU, 0-103 cfu.100mL-1 and 0-104 cfu.100mL-1 respectively.
Consideration of all of the standards from around the world suggests that specific
targets of BOD <10 mg.L-1, turbidity <2 NTU and a non detectable level of faecal
coliforms.100mL-1 is a sensible conservative level and will be used as the main
performance criteria throughout this paper.
Twenty six of the sixty four schemes reviewed were pilot or bench scale systems for
research purpose. The other 38 systems were full scale as they were fitted in buildings
and the treated greywaters were reused for specific applications. The different
applications reported were toilet flushing, irrigation or garden watering, outdoor use
and cleaning, laundry and infiltration (Table 3). Toilet flushing and irrigation were the
most commonly used applications with 54% and 36% of the schemes respectively.
Most of the full scale schemes were installed in individual houses; only twelve of
them were at a bigger scale such as stadiums, hotels, group of houses or residences.
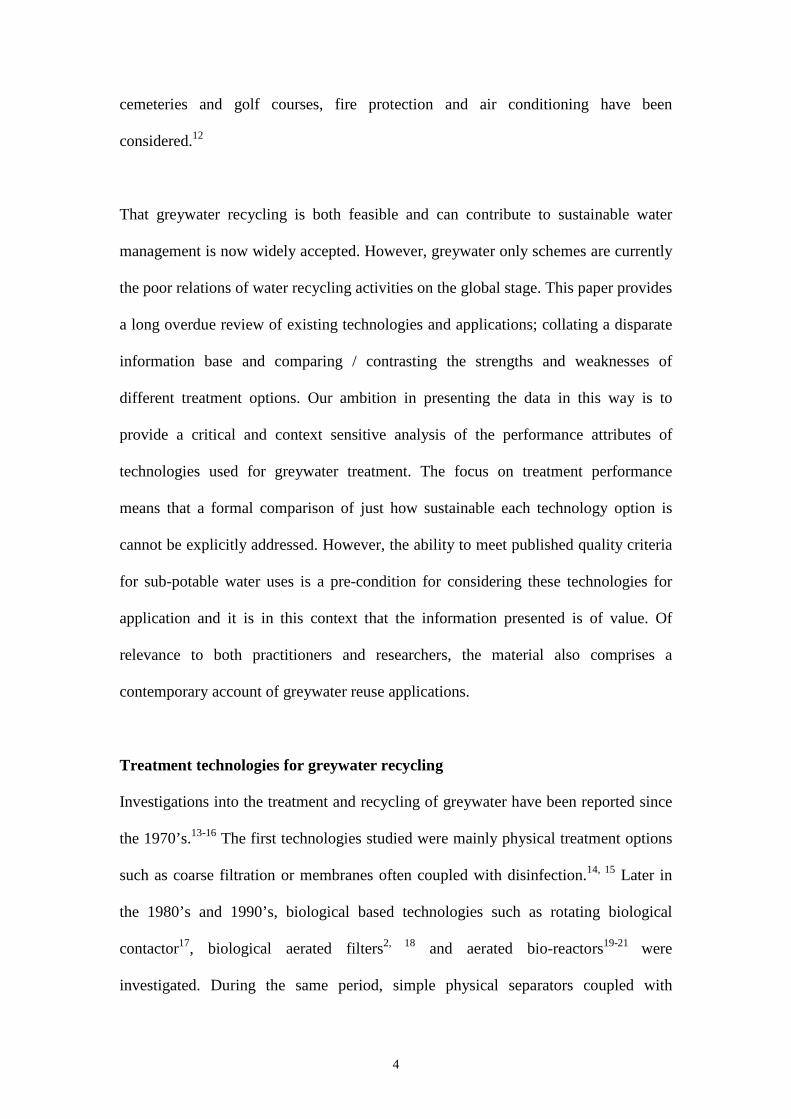
The different schemes reported varied a lot in size and the treated effluent flow rates
were found to vary between 0.01 and 622 m3.day-1. However, 70% of the schemes (of
which the flow rate was known) had a flow rate below 3.4 m3.day-1 (Figure 1).
Another way to evaluate these schemes is to classify them by type of treatment. It was
then possible to group them into five categories as follow: simple (coarse filtration
and disinfection), physical (sand filter, adsorption and membrane), biological

7
(biological aerated filter, rotating biological contactor and membrane bioreactor),
extensive (constructed wetlands) and chemical (photocatalysis, electro-coagulation
and coagulation).
Most of these technologies are operated with a screening or sedimentation stage
before and/or a disinfection stage (UV, chlorine) after. For instance, Nolde17 reported
the treatment of greywater with a rotating biological contactor preceded by a
sedimentation tank and followed by UV disinfection. Similarly, Friedler25 reported the
use of a 1 mm screen and disinfection with hypochlorite respectively before and after
a membrane bioreactor. The most commonly used technologies are the biological
systems followed by physical and extensive treatments (Table 4).
Simple treatment systems
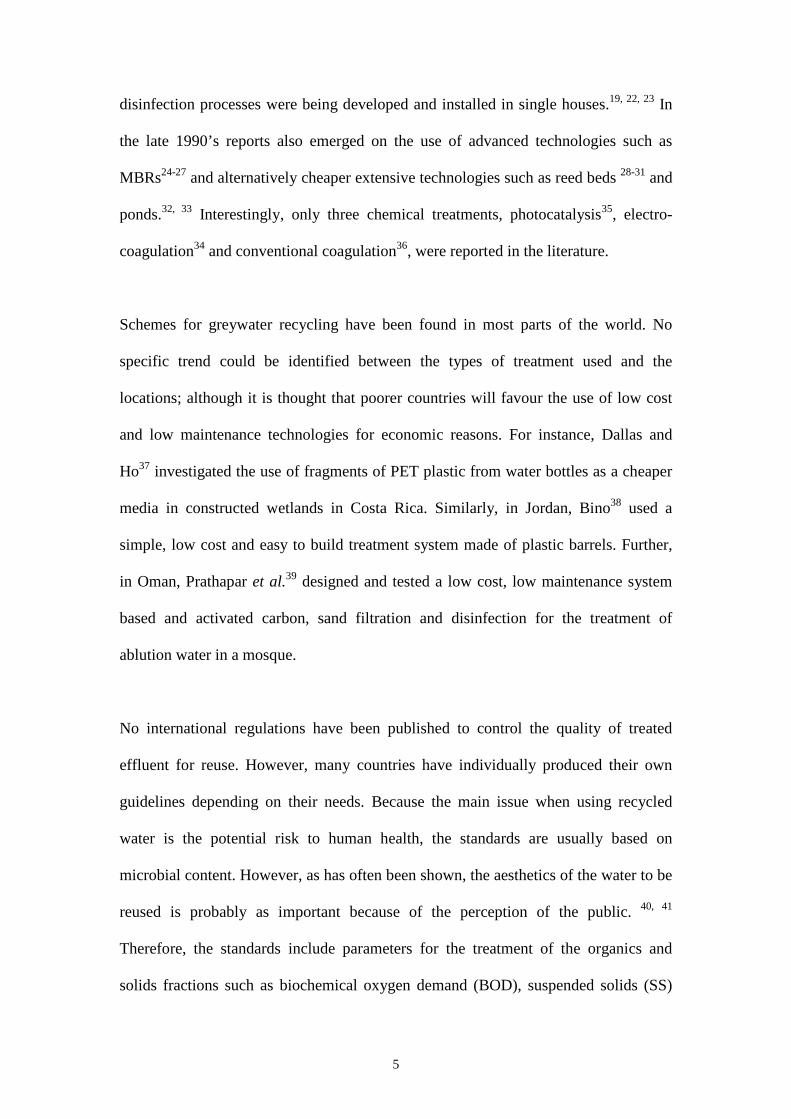
Simple technologies (Table 5) used for greywater recycling are usually two-stage
systems based on a coarse filtration or sedimentation stage to remove the larger solids
followed by disinfection (Figure 2).5, 19, 23 Mars45 reported the use of even simpler
systems with only a coarse filter or a sedimentation tank in Western Australia where
the regulation allows the reuse of greywater after such simple treatment for subsurface
irrigation.
Simple technologies provide only a limited treatment of the greywater in terms of
organics and solids. To illustrate, average removals of 70, 56 and 49% for COD,
suspended solids and turbidity have been reported in the literature (Table 5).
However, good removal of micro-organisms due to the disinfection stage have been
observed with total coliforms residuals below 50 cfu.100mL-1 in the treated

8
effluents.19, 23 Consequently, these systems are preferably used at small scale such as
single household. Moreover, they are usually used to treat low strength greywater
from bath, shower and hand basin due to the limited treatment they can achieve and
subsequent applications are toilet flushing and garden watering. Little information is
available in the literature on the hydraulic performance of these systems; however, the
hydraulic retention time (HRT) should be short as a result of their simplicity. March et
al.5 reported an HRT of 38 hours for a large scale system installed in an 81-room hotel
in Spain.
Simple systems are marketed and promoted as being simple to use and with low
operational costs.46 However, two systems installed in individual households in the
United Kingdom with similar capital and operational and maintenance (O & M) costs
of £1195 and £50/year and £1,625 and £49/year respectively were found to be
economically unsustainable as the water savings were not sufficient to cover the O &
M costs.19, 23 Only the scheme located in the hotel in Spain was reported to be
economically viable. Indeed, the system including two 300 µm nylon filters, a
sedimentation tank and disinfection with sodium hypochlorite had a capital cost of
17,000 € (~£11,500) and the O & M cost were calculated at 0.75 € (~£0.50) per cubic
meter. A saving of 1.09 € (~£0.74) per cubic meter was then attained and a pay back
period of 14 years was obtained with the system operative only 7 months per year.
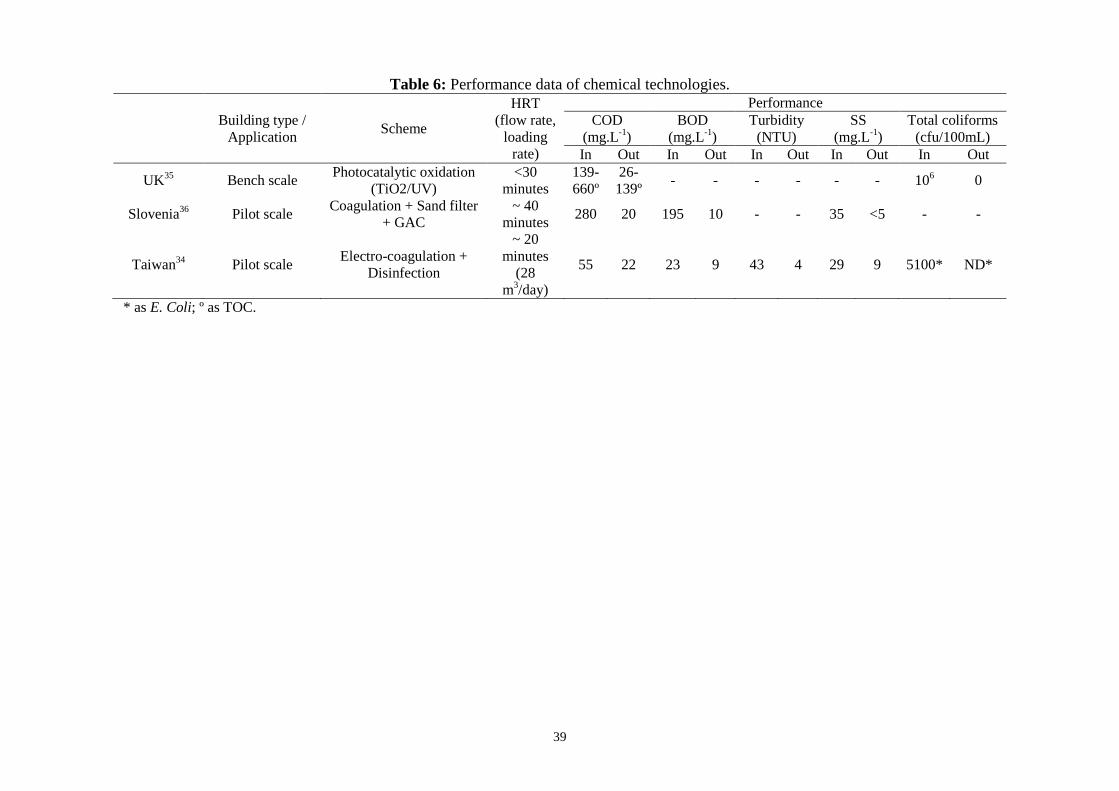
Chemical treatment systems
Only three schemes using a chemical technology for greywater recycling were
reported in the literature (Table 6; Figure 3). The treatment technology of two of the
schemes was based on coagulation with aluminium. The first one was a combination

9
of coagulation, sand filter and granular activated carbon (GAC) for the treatment of
laundry greywater.36 The second combined electro-coagulation with disinfection for
the treatment of a low strength greywater.34 The final example provided a good
treatment of the greywater with BOD and suspended solids residuals of 9 mg.L-1, a
turbidity residual of 4 NTU and undetectable levels of E. Coli. However, it should be
noted that the source had a really low organic strength with a BOD concentration of
23 mg.L-1 in the raw greywater. The first system also achieved good treatment with
residuals of 10 mg.L-1 for BOD and below 5 mg.L-1 for the suspended solids, with the
coagulation stage itself achieving 51% of the BOD removal and 100% of the
suspended solids removal. The two technologies achieved these treatments with rather
short contact times. Indeed, the hydraulic retention times in the two schemes were
around 20 and 40 minutes. Similarly, the third scheme based on photocatalytic
oxidation with titanium dioxide and UV achieved good treatment within a relatively
short time. Indeed, with an HRT of less than 30 minutes, it was reported to achieve a
90% removal of the organics and 6 log removal of the total coliforms.35
Capital costs of US$0.08/m3 (~£0.04/m3) and 0.11 €/m3 (~£0.07/m3) and O & M costs
including energy, consumables, sludge treatment and labour of US$0.19/m3
(~£0.10/m3) and 0.40 €/m3 (~£0.27/m3) were reported for the electro-coagulation
system34 and the coagulation, sand filter and GAC system36 respectively. No
information on water savings were available, it was therefore not possible to assess
the viability of these schemes.
Physical treatment systems

10
Physical systems (Table 7 & Figure 4) can be divided into two sub-categories; sand
filters and membranes. Sand filters have been found to be used alone47 or in
combination with disinfection15 or with activated carbon and disinfection.15, 22, 39 Used
as a sole treatment stage, sand filters provide a coarse filtration of the greywater.
Similarly to the simple technologies previously reviewed, sand filters achieved limited
treatment of the different fractions present in the greywater. To illustrate, Itayama et
al.47 described the treatment of high strength kitchen sink water by a soil filter and
reported removal of 67% for the BOD and 78% for suspended solids with respective
residual concentrations of 166 and 23 mg.L-1, well short of any published standards
for reuse. When coupled with a disinfection stage, only the removal of micro-
organisms is obviously improved. Indeed, Hypes et al.15 in their investigation of the
treatment of bath and laundry greywater by an earth filter combined with chlorine
based disinfection observed poor removal of the turbidity and suspended solids with
removals of 47 and 16% respectively. However, the system achieved a 4.8-log
removal of the total coliforms and a residual concentration of 34 cfu.100mL-1 was
measured in the effluent. Finally, sand filters in association with activated carbons and
disinfection does not result in a significant improvement in the removal of the solids.
Indeed, average removals of 61 and 48% were reported for turbidity and suspended
solids respectively. Nevertheless, good micro-organism removal rates were again
reported. Prathapar et al.39 and Hypes et al.15 described total coliform concentrations
in the treated effluents of 0 and 4 cfu.100mL-1. Similarly, CMHC22 reported a faecal
coliform residual of 8 cfu.100mL-1 after treatment by sedimentation and a multi media
filter.

11
Hypes et al.15 and Itayama et al.47 reported hydraulic loading rates of 0.32, 0.24 and
0.086 m3.m-2.d-1 for three systems based on filtration through soil. These were
extremely low hydraulic loading rates in comparison to typical values reported for
similar systems for the treatment of other waters and wastewaters. Indeed, Metcalf
and Eddy48 reported hydraulic loading rates ranging from 115 to 576 m3.m-2.d-1 for
simple, dual and multi-media filters with sand and/or anthracite for the treatment of
wastewater. Similarly, Vigneswaran and Visvanathan49 reported hydraulic loading
rates of 2-5 and 120-360 m3.m-2.d-1 for slow and rapid sand filter respectively.
Alternatively, treatment by membranes provided a limited removal of the organics but
an excellent removal of the dissolved and suspended solids. To illustrate, removal of
up to 100% of the turbidity and suspended solids have been recorded14, 50, 51, and
otherwise residual concentrations below 2 NTU for the turbidity and below 10 mg.L-1
for the suspended solids, sufficient to meet the strictest standards for reuse, were
generally observed. In contrast, Birks47 and Sostar-Turk et al.36 reported BOD
residuals of 86 and 53 mg.L-1 respectively, above the criteria for reuse, after treatment
with ultra-filtration (UF) membranes.
However, the pore size of the membrane used will have an important impact on the
treatment achieved. For example, Ramon et al.51 compared the performance of a
nano-filtration (NF) membrane with a molecular weight cut off (MWCO) of 0.2 kDa
and three UF membranes with MWCO of 30, 200 and 400 kDa for the treatment of
shower water. The performance was shown to be better with lower pore sizes
especially in terms of organics removal. Indeed, COD removal of 45, 49, 70 and 93%
were reported for the membranes with MWCO of 400, 200, 30 and 0.2 kDa
respectively. Differences in turbidity removal performance were less obvious with
12
similar orders of removal of 92, 94, 97 and 98%. Similarly, Sostar-Turk et al.36
investigated the use of a UF membrane (0.05 µm pore size) followed by a reverse
osmosis (RO) membrane for the treatment of laundry wastewater. The UF membrane
decreased the BOD from 195 to 86 mg.L-1 corresponding to a removal of 56%. The
RO membrane then decreased the BOD from 86 to 2 mg.L-1 corresponding to a
removal of 98%. A similar trend was observed for the removal of suspended solids
with values of 49 and 56% for the UF and RO membranes respectively. Very little
information was available on the removal of micro-organisms by membranes;
however, Jefferson et al.53 reported an average total coliforms removal of 3 log after
filtration of greywater through a micro-filtration membrane revealing limited action of
the membrane for mico-organisms removal. Similarly, Judd and Till54 reported a
general breakthrough of E. Coli when treating sewage with a micro-filtration
membrane. They also found that this phenomenon was enhanced in the presence of
proteins suggesting that proteins, when adsorbed on the surface of the membrane,
facilitated the transport of the bacteria through the pores.
The main issue when operating membranes is fouling. This will have an influence on
the operation of the systems and the costs as membrane cleaning will be needed.
Interestingly, Sostar-Turk et al.36 observed no fouling when treating laundry
wastewater with a UF membrane for 150 minutes at a flux of about 130 L.m-2.h-1 and
with a RO membrane for 120 minutes at a flux of about 37 L.m-2.h-1. Similarly, Ahn
et al.50 reported no fouling during 12 hours for the treatment of greywater through two
UF membranes and one MF membrane at flux around 200 L.m-2.h-1. These results
suggested that no fouling under those conditions occurred in the short term. However,
Nghiem et al.55 investigated the fouling of UF membranes during synthetic greywater

13
treatment. They observed that the fouling increased linearly with the organic matter
(humic acid) concentration. To limit membrane fouling the membrane stage can be
preceded by a pre-treatment such as screening or sand filter for example. To illustrate,
Ward56 studied a process combining both physical processes, sand filter and
membrane, and disinfection for the treatment of a low strength greywater. With a
residual of 8 mg.L-1 for the BOD and undetectable levels of turbidity and E. Coli, the
system was good enough to meet the strictest standards for reuse. This high level of
treatment was possible because of the sequence of processes. Indeed, the sand filter
provided a pre-treatment by removing the bigger particles. Reductions of the BOD
from 23 to 17 mg.L-1 and turbidity from 18 to 17 NTU were observed. The rest of the
treatment was then achieved by the membrane and disinfection stages.
Biological treatment systems
A wide range of biological processes have been used for greywater recycling (Table 8
& Figure 5). Processes such as fixed film reactors17, 19-20, 56-57, rotating biological
contactor17, 58, anaerobic filters38, 59, sequencing batch reactor21, membrane
bioreactors2, 24-27, 60 and biological aerated filters (BAF)2, 18, 52, 61-62 were reported in
the literature. Biological systems were rarely used individually and when it was the
case it was for investigation of the processes at pilot scale.2, 52 In most cases, the
biological processes were preceded by a physical pre-treatment such as
sedimentation17, 38, 59 or screening18, 57-58 and/or followed by disinfection.17, 19, 63 They
were also combined with membranes in processes such as MBRs24-26, sand filter63,
activated carbon18, 19 and constructed wetland.61
Biological schemes when installed at full scale were the type of treatment most
commonly seen in bigger buildings. Indeed, systems could be found in student

14
residences 18-19, 58, multi-storey buildings 17, 20 and stadiums.62, 64 Hydraulic retention
times (HRTs) ranging from 0.8 hours up to 2.8 days were reported for the biological
systems. Higher HRTs were observed for systems treating very high strength
greywaters such as laundry water24 and mixed greywater38 with BOD concentrations
of 645 and 300-1200 mg.L-1 respectively. However, HRTs in biological systems were
reported to be on average 19 hours. Very little information was available on solids
retention time (SRT) in the biological systems. Organic loading rates were found to
vary between 0.10 and 7.49 kg.m-3.day-1 for COD and between 0.08 and 2.38 kg.m-
3.day-1 for BOD. In detail, the average organic loading rate in MBRs was 0.88
kgCOD.m-3.day-1 which is lower than the typical values of 1.2-3.2 kgCOD.m-3.day-1
reported by Stephenson et al.65 for wastewater treatment. In contrast, the average
organic loading rate found for the other systems such as BAF, RBC and bio-films was
1.32 kgBOD.m-3.day-1 which is in the range of 0.3-1.4 kgBOD.m-3.d-1 reported for these
systems.48
Independent of the number and type of processes included, all schemes with a
biological stage achieved excellent organic and solids removal. Indeed, all the
biological systems reviewed but two were reported to meet the most stringent BOD
standard for reuse with residual concentrations below 10 mg.L-1. Similarly, the
turbidity concentrations in the effluents were below 8 NTU for all the systems
reviewed. And finally, all schemes but one had suspended solids residual below 15
mg.L-1. In terms of micro-organisms, once again, those schemes including a
disinfection stage achieved excellent removals with an average 5.2 log removal for
faecal coliforms and 4.8 log for total coliforms. Residual concentrations for both
faecal and total coliforms were always below 20 cfu.100mL-1. Interestingly, MBRs
15
were the only systems to achieve good micro-organism removal without the need for a
disinfection stage. To illustrate, average removal of both faecal and total coliforms
were reported at 5 log and the corresponding residual concentrations were below 30
cfu.100mL-1. Additionally, MBRs achieved excellent removal of the organic and solid
fractions with average residuals of 3 mg.L-1 for BOD, 3 NTU for turbidity and 6
mg.L-1 for suspended solids.2, 24-25, 27, 60 However, Jefferson et al.53 reported that at
small scale, the variation in strength and flow of the greywater and potential shock
loading affect the performance of biological based technologies.
To illustrate, Laine2 investigated the effect of domestic product spiking on biomass
from an MBR and reported that products such as bleach, caustic soda, perfume,
vegetable oil and washing powder were relatively toxic with EC50 of 2.5, 7, 20, 23 and
29 mL.L-1 respectively. Moreover, Jefferson et al.66 studied the reliability of a BAF
and an MBR under intermittent operation of air, feed and both. The performance of
the MBR was not affected by interruption of the feed, air or both as the time taken by
the process to return to its original performance level was always very short (in fact
no interruption in performance level was observed). A similar result was found when
the feed was stopped for 25 days. However, in comparison, the BAF did not exhibit
the same robustness. Although short term interruptions (30 minutes) did not have an
effect on the BAF performance, longer cessation of the feed and/or air, generated an
increase in the effluent concentrations and the recovery times for all the parameters.
Indeed, after an interruption of the feed of 8 hours, the recovery times were 4, 4, 40
and 48 hours for turbidity, suspended solids, faecal coliforms and total coliforms
respectively. Similarly, after the same interruption of the air, the recovery times were
4, 4, 24, 28 and 24 hours for BOD, turbidity, solids, faecal coliforms and total
16
coliforms respectively. The longest recovery times were observed after the
interruption of both air and feed simultaneously with 40, 40, 4, 24, 48 hours for BOD,
turbidity, solids, faecal coliforms and total coliforms respectively. Finally, none of the
parameters had recovered to their pre-interruption levels within 48 hours of the
interruption of the feed for 25 days.
Again, limited information is available about the costs of the systems. Surendran and
Wheatley18 reported a capital cost of £3,345 for the construction and installation of a
retro-fit system in a 40-student residence composed of a buffering tank with
screening, an aerated biofilter, a deep bed filter and GAC. The O & M costs were
£128/year including the energy, labour and consumables. With water savings of
£516/year, the pay back period is 8-9 years. They estimated that if the system was
fitted in a new building the capital cost could be reduced to £1,720 and then the
adjusted pay back period would be 4-5 years. The system reported by McQuire57
comprising a screening filter, a treatment tank with bio-film grown on aggregate balls,
a particle filter and UV disinfection unit installed in an individual house was
estimated to cost between Aus$6,200 and Aus$8,200 (£2,514-£3,325). Alternatively,
Bino38 reported a low cost, easy to built system composed of four plastic barrels
installed in a 6- person house with a capital cost of US$370 (~£197). No information
on the operational costs and water savings were reported for these two schemes.
Finally, Gardner and Millar 63 reported a capital cost of Aus$5,500 (£2,230) and O &
M costs of Aus$215/year (£87/year) for a system based on a septic tank, a sand filter
and UV disinfection. However, the water savings of Aus$83/year (£34/year) were not
enough to cover the costs. Similarly, Brewer et al.19 estimated the costs of an aerated
bioreactor combined with a sand filter, GAC and disinfection with bromine installed

17
in a student residence at £30,000 for the capital cost. But once again, the O & M costs
of £611/year exceeded the water savings of £166.
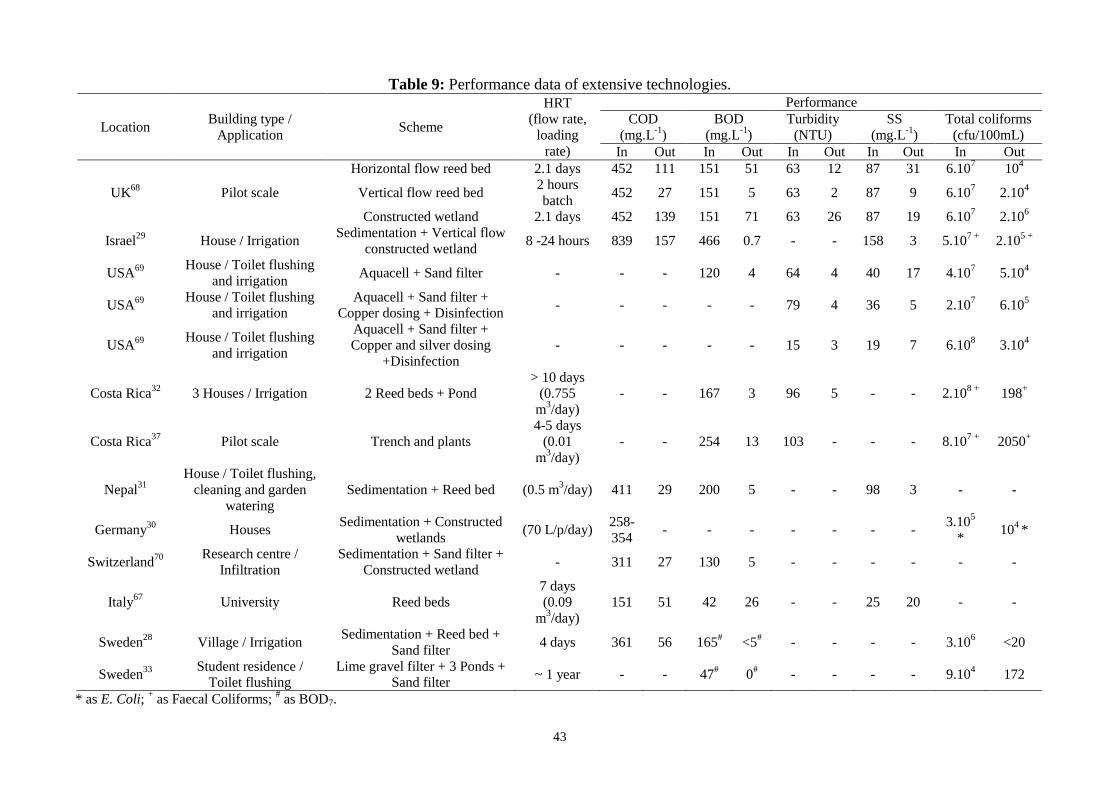
Extensive treatment technologies
Extensive technologies for greywater treatment usually comprise constructed
wetlands such as reed beds and ponds (Table 9 & Figure 6). These are often preceded
by a sedimentation stage to remove the bigger particles contained in the greywater and
a sand filter to remove any particles or media carried by the treated water. The most
common type of plants used in reed beds is Phragmites australis.28, 31, 67-68 However,
they are considered noxious weed species in Costa Rica so Dallas et al.32 and Dallas
and Ho37 investigated an alternative macrophyte, Coix lacryma-jobi. Alternatively,
two studies have investigated the use of a range of plants. Frazer-Williams et al.68
reported the use of Iris pseudocorus, Veronica beccabunga, Glyceria variegates,
Juncus effuses, Iris versicolor, Caltha palustris, Lobelia cardinalis and Mentha
aquatica in their GROW system. Similarly, Borin et al.67 reported a system planted
with ten different species (alisma, iris, typha, metha, canna, thalia, lysimachia,
lytrum, ponyederia and preselia).
The constructed wetlands reported in the literature showed good ability to treat
greywater. Indeed, an average BOD residual of 17 mg.L-1 was observed and more
than half of the extensive treatment schemes reviewed reported a residual BOD
concentration below 10 mg.L-1. Similarly, average residual concentrations of 8 NTU
for turbidity and 13 mg.L-1 for suspended solids were reported. In contrast, poor
removal of micro-organisms was described. Average removal of 3.6 and 3.2 log were
reported for faecal and total coliforms respectively, with residual concentrations

18
generally above 102 cfu.100mL-1 for both indicators. In terms of hydraulics, for the
extensive systems reported, HRT was found to vary from a couple of hours up to a
year for on particular scheme composed of three ponds.33 However, after removing
the extremes, the HRT for extensive technologies was on average 4.5 days. Borin et
al.67 compared the performance of two constructed wetlands, one planted with the
common reed Phragmites australis and the second with a range of ten species.
However, no significant differences in treatment effectiveness were observed between
the two systems. To illustrate, concentrations in the effluent of 25.8 and 26.6 mg.L-1
for the BOD, 20 and 30 mg.L-1 for the total suspended solids and 51.2 and 50.5 mg.L-1
for the COD were reported for the systems with the ten species and Phragmites
australis respectively.
Besides being seen as environmentally friendly technologies, constructed wetlands
have been considered as cheap options. Indeed, Dallas et al.32 and Shrestha et al.31
described reed beds with capital costs of US$1,000 (£531) and US$430 (£229)
respectively and very low operating costs.
Discussion and conclusions
A review of the standards for greywater recycling and the characteristics of
greywaters showed that a technology used for the treatment of greywater for reuse
should be able to achieve excellent treatment of the organic, solids and microbial
fractions (Table 2). On the other hand, the review of the greywater recycling schemes
reported to date proved that different types of technologies achieved very different
performance. Simple technologies and sand filters have been shown to achieve only a
limited treatment of the greywater whereas, membranes were reported to provide a
good removal of the solids but could not efficiently tackle the organic fraction.

19
Alternatively, biological and extensive schemes achieved good general treatment of
greywater with a particularly good removal of the organics. Although less information
was available about chemical systems, they showed promising abilities to treat
greywater with short retention times. Micro-organism removal was sufficient to meet
the standards only in schemes including a disinfection stage; however, MBRs were
the only systems able to achieve good microbial removal without the need for
disinfection.
In conclusion, the best performances were observed within those schemes combining
different types of treatment to ensure effective treatment of all the fractions. For
instance, Ward56 reported the treatment of a low strength greywater with an aerated
biological reactor followed by a sand filter, GAC and disinfection with residual
concentrations of 2 mg.L-1 for BOD, 1 NTU for turbidity and <1 cfu.100mL-1 for total
coliforms. Similarly, Friedler et al.58 investigated the treatment of bathroom greywater
by a rotating biological contactor combined with a sedimentation tank, a sand filter
and disinfection with hypochlorite and reported residuals of 0.6 NTU, 5 mg.L-1, 2
mg.L-1 and 1 cfu.100mL-1 for turbidity, suspended solids, BOD and faecal coliforms
respectively. In contrast, MBRs were the only individual technology (although they
comprise a combination of activated sludge and membrane) to be credited with
similar performance.To illustrate, Laine2 reported residuals of 1 mg.L-1 for BOD, 1
NTU for turbidity, 4 mg.L-1 for suspended solids and 1 cfu.100mL-1 for total
coliforms in a greywater treated by a side-stream membrane bioreactor. In the same
way, Liu et al.27 reported effluent concentrations of <5 mg.L-1 for BOD, <1 NTU for
turbidity, and undetectable levels of suspended solids and coliforms following
treatment by a submerged membrane bioreactor. All these systems met the most

20
stringent standards for reuse; however, the level of treatment required is often
dependent on the reuse applications (Table 2). Consequently, technologies generating
a lesser quality effluent may still be of interest for applications where the standards
are less strict.
A review of the HRT applied to each type of system demonstrated that the two
reviewed chemical systems worked with very low HRT, below an hour. With an
average HRT of 19 hours, the biological systems proved to be efficient over rather
short periods of time. Finally, the extensive technologies were the systems working at
the highest HRT with an average value of 4.5 days. The shorter HRTs observed with
biological technologies than with extensive systems for similar performance give an
advantage to the biological treatments.
Another feature of greywater recycling systems which influences their application is
the footprint as space is often limited in urban environments. Systems using
biological, chemical or physical technologies have been found to generally have a
smaller footprint than extensive technologies. For example, Fittschen and
Niemczynowicz28 reported a footprint of about 1000 m2 for a scheme including a
sedimentation tank, a reed bed, a sand filter and a pond treating the greywater of a
100-inhabitant village, corresponding to 10 m2 per inhabitant connected. Similarly,
Dallas et al.32 reported the treatment of the greywater of 7 persons from 3 houses by a
sedimentation tank, two reed beds and a pond with a total footprint of about 40 m2,
corresponding to 5.7 m2 per person. In contrast, Nolde17 reported a system composed
of a sedimentation tank, a rotating biological contactor and disinfection installed in

21
the 15 m2 basement of 70-person multi-storey building, corresponding to 0.2 m2 per
person connected.
Finally, we would note that the value of the contribution which the reviewed
technologies can make to sustainable water management will vary as a function of
local circumstances and regional preferences. Ensuring that greywater recycling
systems are complementary with Integrated Water Resources Management in
catchments or urban contexts will drive a variety of solutions and a variety of
measures of sustainability. Information on Life Cycle Cost and total energy
requirements for greywater treatment options is sparse. The trade-offs between scale
of application, embedded energy in capital equipment, operating energy requirements,
pollutant emissions, reject stream disposal, social costs, etc. etc. are the subject for a
subsequent paper. However, the power of circumstance to modify preference can be
demonstrated by the fact that a concern with carbon footprint might preclude the use
of high energy requirement technologies such as the MBR but at larger scales of
application and where higher variation in greywater quality is found, the energy
consumption of an MBR compared with other options would be much more
favourable. The review presented above provides a comprehensive data set for
developing more detailed and evidenced sustainability assessments.
References
1. USEPA (U.S. Environmental Protection Agency) Guidelines for Water Reuse.USEPA, Washington, DC, USA, 2004, Report EPA/625/R-04/108.
2. LAINE A. T. Technologies for greywater recycling in buildings. CranfieldUnniversity, UK, PhD Thesis, 2001.
3. JUDD S. Waste Water Reuse. Cranfield University, UK, 1998, Report WW-09.

22
4. SEO G. T., AHAN H. I., KIM J. T., LEE Y.J. and KIM I. S. Domesticwastewater reclamation by submerged membrane bioreactor with highconcentration powdered activated carbon for stream restoration. Water. Sci.Technol., 2004, 50, No. 2, 173-178.
5. MARCH J. G., GUAL M. and OROZCO F. Experiences on greywater re-usefor toilet flushing in a hotel (Mallorca Island, Spain). Desalination, 2004, 164,241-247.
6. DALLMER L. SQIRTS – An on-site stormwater treatment and reuse approachto sustainable water management in Sydney. Water Sci. Technol.,- 2002, 46,No. 6-7, 151-158.
7. HILLS S., BIRKS R., DIAPER C. and JEFFREY P. An evaluation of single-house greywater recycling systems. Proc. of the IWA 4th InternationalSymposium on Wastewater Reclamation & Reuse. Nov. 12-14th 2003, MexicoCity, Mexico.
8. JEFFERSON B., PALMER A., JEFFREY P., STUETZ R. and JUDD S. J.Greywater characterisation and its impact on the selection and operation oftechnologies for urban reuse. Water Sci. Technol., 2004, 50 , No. 2, 157-164.
9. KUJAWA-ROELEVELD K. and ZEEMAN G. Anaerobic treatment indecentralised and source-separation-based sanitation concepts. Rev. in Env.Sci. and Bio-Technol., 2006, 5, 115-139.
10. KARPISCAK M. M., FOSTER K. E. and SCHMIDT N. Residential waterconservation. Wat. Res., 1990, 26, 939-948.
11. ENVIRONMENT AGENCY UK. Leaflet on Conserving Water in Buildings:3- Greywater. Accessed in 2006 at www.environment-agency.gov.uk/commondata/105385/greywater_880769.pdf.
12. LU W. and LEUNG A. Y. T. A preliminary study on potential of developingshower/laundry wastewater reclamation and reuse system. Chemosphere,2003, 52, 1451-1459.
13. ARIKA M., KOBAYASHI H. and KIHARA H. Pilot plant test of an activatedsludge ultrafiltration combined process for domestic wastewater reclamation.Desalination, 1977, 23, 77-86.
14. HALL J. B., BATTEN C. E. and WILKINS J. R. Domestic wash waterreclamation for reuse as commode water supply using a filtration – reverseosmosis technique. NASA, USA, 1974, Technical Note D-7600.
15. HYPES W., BATTEN C. E. and WILKINS J. R. Processing of combineddomestic bath and laundry waste waters for reuse as commode flushing water.NASA, Langley research centre, Hampton,USA, 1975, Technical Note D-7937.
16. WINNEBERGER J. H. T. (ed.). Manual of grey water treatment practice. AnnArbor Science Publishers Ltd, Ann Arbor, Michigan, USA, 1974.

23
17. NOLDE E. Greywater reuse systems for toilet flushing in multi-storeybuildings - over ten years experience in Berlin. Urban Water, 1999, 1, No. 4,275-284.
18. SURENDRAN S. and WHEATLEY A. D. Greywater reclamation for non-potable reuse. J. CIWEM, 1998, 12, 406-413.
19. BREWER D., BROWN R. and STANFIELD G. Rainwater and greywater inbuildings: project report and case studies. BSRIA Ltd., Bracknell, UK, 2000,Report 13285/1.
20. SANTALA E., UOTILA J., ZAITSEV G., ALASIURUA R., TIKKA R. andTENGVALL J. Microbiological grey water treatment and recycling in anapartment building. Proc. of the 2nd International Advanced WastewaterTreatment, Recycling and Reuse. 14th-16th Sept. 1998, Milan, Italy.
21. SHIN H.-S., LEE S.-M., SEO I.-S., KIM G.-O., LIM K.-H. and SONG J.-S.Pilot-scale SBR and MF operation for the removal of organic and nitrogencompounds from greywater. Water Sci. Technol., 1998, 39, No. 1, 128-137.
22. CMHC (Canada Mortgage and Housing Corporation). Final assessment ofconservation Co-op’s greywater system. CHMC, Ottawa, Canada, 2002,Technical series 02-100.
23. HILLS S., SMITH A., HARDY P. and BIRKS R. Water recycling at themillennium dome. Water Sci. Technol., 2001, 43, No. 10, 287-294.
24. ANDERSEN M., KRISTENSEN G. H., BRYNJOLF M. and GRUTTNER H.Pilot-scale testing membrane bioreactor for wastewater in industrial laundry.Water Sci. Technol., 2001, 46, No. 4-5, 67-76.
25. FRIEDLER E. Performance of pilot scale greywater reuse RBC/MBR basedsystems. Proc. of the Watersave, one day event on water demand management.14th June 2005, London, UK.
26. GODDARD M. Urban greywater reuse at the D’LUX development.Desalination, 2006, 188, 135-140.
27. LIU R., HUANG H., CHEN L., WEN X. and QIAN Y. Operationalperformance of a submerged membrane bioreactor for reclamation of bathwastewater. Process Biochem., 2005, 40, No. 1, 125-130.
28. FITTSCHEN I. and NIEMCZYNOWICZ J. Experiences with dry sanitationand greywater treatment in the ecovillage Toarp. Water Sci. Technol., 1997,35, No. 9, 161-170.
29. GROSS A., SHMUELI O., RONEN Z. and RAVEH E. Recycled vertical flowconstructed wetland (RVFCW) – a novel method of recycling greywater forirrigation in small communities and households. Chemosphere, 2007, 66, No.5, 916-923.

24
30. LI Z., GUYLAS H., JAHN M., GAJUREL D. R. and OTTEPORHL R.Greywater treatment by constructed wetlands in combination with TiO2-basedphotocatalytic oxidation for suburban and rural areas without sewer system.Water Sci. Technol., 2003, 48, No. 11-12, 101-106.
31. SHRESTHA R. R., HABERL R., LABER J., MANANDHAR R. andMADER J. Application of constructed wetlands for wastewater treatment inNepal. Water Sci. Technol., 2001, 44, No. 11-12, 381-386.
32. DALLAS S., SCHEFFE B. and HO G. Reedbeds for greywater treatment –case study in Santa Elena-Monteverde, Costa Rica, Central America. Ecol.Eng., 2004, 23, 55-61.
33. GUNTHER F. Wastewater treatment by greywater separation: outline for abiologically based greywater purification plant in Sweden. Ecol. Eng., 2000,15, 139-146.
34. LIN C.-J., LO S.-L., KUO C.-Y. and WU C.-H. Pilot-scale electrocoagulationwith bipolar aluminium electrodes for on-site domestic greywater reuse. J.Environ. Eng., 2005, March, 491-495.
35. PARSONS S. A., BEDEL C. and JEFFERSON B. Chemical vs. BiologicalTreatment of Domestic Greywater. Proc. of the 9th Intl. GothenburgSymposium on Chemical Treatment. 2-4th Oct. 2000, Istanbul, Turkey.
36. SOSTAR-TURK S., PETRINIC I. and SIMONIC M. Laundry wastewatertreatment using coagulation and membrane filatration. Resour. Conserv. Recy.,2005, 44, No. 2, 185-196.
37. DALLAS S. and HO G. Subsurface flow reedbeds using alternative media forthe treatment of domestic greywater in Monteverde, Costa Rica, CentralAmerica. Water Sci. Technol., 2004, 51, No. 10, 119-128.
38. BINO M. J. Greywater reuse for sustainable water demand management. Proc.of the International Water Demand Management Conference. 30th May-3rd
June 2004, Amman, Jordan.
39. PRATHAPAR S. A., AHMED M., AL ADAWI S. and AL SIDIARI S.Design, construction and evaluation of an ablution water treatment unit inOman: a case study. Int. J. Environ. Stud., 2006, 63, No. 3, 283-292.
40. JEFFREY, P. and JEFFERSON, B. Public receptivity regarding ‘in-house’water recycling: results from a UK survey. Water Sci. Technol: Water Supply,2003, 3, No. 3, 109-116.
41. HURLIMANN, A. C. and MCKAY, J. M. What attributes of recycled watermake it fit for residential purposes? The Mawson Lakes experience.Desalination, 2006, 187, No. 1-3, 167-177.
42. TAJIMA, A. The behaviour of the pathogenic microbes in the treatedwastewater reuse system and the establishment of the new technical standardfor the reuse of treated wastewater. Proc. of the IWA Specialty Conference on

25
Wastewater Reclamation and Reuse for Sustainability, 8th-11th November2005, Jeju, Korea.
43. QUEENSLAND GOVERNMENT Onsite sewerage facilities. Guidelines forthe use and disposal of greywater in unsewered areas. QueenslandGovernment, Local Government and Planning, Brisbane, QueenslandAustralia, 2003.
44. CMHC (Canada Mortgage and Housing Corporation) Water reuse standardsand verification protocol. Research Report, CHMC, Ottawa, Canada, 2004.
45. MARS R. Case studies of greywater recycling in Western Australia. Proc. ofthe 1st International Conference on Onsite Wastewater Treatment &Recycling. 11th-13th Feb. 2004, Fremantle, Western Australia.
46. DIAPER C., DIXON A., BUTLER D., FEWKES A., PARSONS S. A.,STRATHERM M. and STEPHENSON T. Small scale water recycling systems– risk assessment and modelling. Water Sci. Technol., 2001, 43, No. 10, 83-90.
47. ITAYAMA T., KIJI M., SUETSUGU A., TANAKA N., SAITO T., IWAMIN., MIZUOCHI M. and INAMORI Y. On site experiments of the slanted soiltreatment systems for domestic gray water. Water Sci. Technol., 2004, 53, No.9, 193-201.
48. METCALF and EDDY, Inc. Tchobanoglous, G., Burton, F. L. and Stensel H.D. (eds). Wastewater Engineering – Treatment, Disposal and Reuse. McGraw-Hill series in civil and environmental engineering, New York, USA, 2003, 4thedition.
49. VIGNESWARAN S. and VISVANATHAN C. Water treatment processes:simple options. CRC Press, Boca Raton, Florida, USA, 1995.
50. AHN K.-H., SONG J.-H. and CHA H.-Y. Application of tubular ceramicmembranes for reuse of wastewater from buildings. Water Sci. Technol., 1998,38, No. 4-5, 373-382.
51. RAMON G., GREEN M., SEMIAT R. and DOSORETZ C. Low strengthgreywater characterization and treatment by direct membrane filtration.Desalination, 2004, 170, 241-250.
52. BIRKS R. Biological aerated filters and membranes for greywater treatment.Cranfield University, MSc Thesis, 1998.
53. JEFFERSON B., LAINE A., DIAPER C., PARSONS S., STEPHENSON T.and JUDD S. J. Water recycling technologies in the UK. Proc. of theTechnologies for Urban Water Recycling Conference. Cranfield University,19th Jan. 2000.
54. JUDD S. and TILL S. W. Bacterial rejection in crossflow microfiltration ofsewage. Desalination, 2000, 127, 251-260.

26
55. NGHIEM L. D., OSCHMANN N. and SCHAFER A. I. Fouling in greywaterrecycling by direct ultrafiltration. Desalination, 2006, 187, 283-290.
56. WARD M. Treatment of domestic greywater using biological and membraneseparation techniques. Cranfield University, UK, MPhil thesis, 2000.
57. MCQUIRE S. West Brunswick sustainable house water systems retrofit. Finalproject report. Accessed in 2006 at www.greenmakeover.com.au.
58. FRIEDLER E., KOVALIO R. and GALIL N. I. On-site greywater treatmentand reuse in multi-storey buildings. Proc. of the 1st International Conferenceon Onsite Wastewater Treatment & Recycling. 11th-13th Feb. 2004, Fremantle,Western Australia.
59. IMURA M., SATO Y., INAMORI Y. and SUDO R. (1995) Development of ahigh efficiency household biofilm reactor. Water Sci. Technol., 1995, 31, No.9, 163-171.
60. LESJEAN B. and GNIRSS R. Grey water treatment with a membranebioreactor operated at low SRT and low HRT. Desalination, 2006, 199, 432-434.
61. JENSSEN P. D., MOEHLUM T., KROGSTAD T. and VRALE L. Highperformance constructed wetlands for cold climates. J. Environ. Sci. Health,2005, 40, 1343-1353.
62. LODGE B. Membrane fouling during domestic water recycling. CranfieldUniversity, UK, EngD thesis, 2003.
63. GARDNER T. and MILLAR G. The performance of a greywater system at thehealthy home in South East Queensland – three years of data. Proc. of theOnsite ‘03 Conference. 30th Sept.-2nd Oct. 2003, Armidale, Australia.
64. INTERNATIONAL TECHNOLOGY SERVICE. Water reuse and recyclingin Japan. Report of Overseas Mission of Science and Technology Experts inJapan, 16th-20th Oct. 2000.
65. STEPHENSON T., JUDD S. J., JEFFERSON B. and BRINDLE K.Membrane bioreactors for wastewater treatment. IWA Publishing, London,UK, 2000.
66. JEFFERSON B., PALMER A., JUDD S. and JEFFREY P. Reliability ofbiological processes for urban reuse of grey and black water. Proc. of the IWARegional Symposium on Water Recycling in the Mediterranean Region. 26th-29th Sept. 2002, Crete, Greece.
67. BORIN M., COSSU R., LAVAGNOLO M. C. and GANDINI M.Phytotreatment of greywater with yellow water addition from an aestheticapproach. Proc. of the International Conference On-Site wastewater treatmentand recycling. 12th-14th Feb. 2004, Murdoch University, Western Australia.
27
68. FRAZER-WILLIAMS R., AVERY L., JEFFREY P., SHIRLEY-SMITH C.,LIU S. and JEFFERSON B. Constructed wetlands for urban greywaterrecycling. Proc. of the First conference on sustainable urban wastewatertreatment and reuse. 15th-16th Sept. 2005, Nicosia, Cyprus.
69. GERBA C. P., STRAUB T. M., ROSE J. B., KARSPISCAK M. M., FOSTERK. E. and BRITTAIN R. G. Water quality study of greywater treatmentsystems. Water Resour. J., 1995, 18, 78-84.
70. SCHONBORN A., ZUST B. and UNDERWOOD E. Long term performanceof the sand-plant-filter Schattweid (Switzerland). Water Sci. Technol., 1997,35, No. 5, 307-314.

28
0%
20%
40%
60%
80%
100%
0 50 100 150 200 250 300
Flow rate (m3/day)
Per
cen
tile
(%)
Fig. 1: Distribution of the flow rates of the reported technologies.

29
Fig. 2: Typical flow diagram of simple systems with either screening or sedimentationand disinfection.

30
Fig. 3: Typical flow diagram of chemical technologies with separation by filtration orflotation.

31
Fig. 4: Typical flow diagram for physical technologies.

32
Fig. 5: Typical flow diagram of biological technologies and side-stream andsubmerged MBRs.

33
Fig. 6: Typical flow diagram of extensive technologies.

34
Table 1: Distribution of domestic water usage.11
Toilet flushing 35%Wash basin 8%
Shower 5%Bath 15%
Laundry 12%Dishwasher 4%Outside use 6%Kitchen sink 15%

35
Table 2: Standards for wastewater reuse.
Application
Parameters
BOD5
(mg.L-1)TSS
(mg.L-1)Turbidity
(NTU)
FaecalColiforms
(cfu.100mL-1)
TotalColiforms
(cfu.100mL-1)
Japan 42
Toiletflushing - - <2 - ND
Landscape - - <2 - <1000Recreational - - <2 - ND
Israel 29 Wastewaterreuse 10 10 - <1 -
Spain,CanaryIslands1
Wastewaterreuse 10 3 2 - 2.2
USA,California1
Unrestrictedwater reuse - - 2 avg
5 max -2.2 avg
23 max in 30days
USA,Florida1
Unrestrictedwater reuse 20 5 -
25% of sampleND and 25
max-
Australia,Queensland
43
Greywaterreuse forgarden
watering inunsewered
area
20 30 - - 100
Canada,British
Columbia 44
Unrestrictedurban reuse 10 5 2 2.2 -

36
Table 3: Distribution of applications for greywater reuse.Applications
Toilet flushing 54 %
Irrigation and Garden watering 36 %
Outdoor use and cleaning 5 %
Laundry 2.5 %
Infiltration 2.5 %

37
Table 4: Distribution of the schemes by type of treatment.Technology Number %
Simple 8 12.5Physical 13 20.3
Biological 25 39.1Extensive 15 23.4Chemical 3 4.7
Total 64 100

38
Table 5: Performance data of simple technologies.
Location Building type/ Application Scheme
HRT(flow rate,
loadingrate)
PerformanceCOD
(mg.L-1)BOD
(mg.L-1)Turbidity
(NTU)SS
(mg.L-1)Total coliforms
(cfu/100mL)In Out In Out In Out In Out In Out
Spain5 Hotel / Toiletflushing
Screening + Sedimentation+ Disinfection 38 hours 171 78 - - 20 17 44 19 - -
UK19 House / Toiletflushing Filtration + Disinfection - 74 11 - - 2 1 - - TNTC 46
UK19 House / Toiletflushing Filtration + Disinfection - 157 47 - - 21 7 - - 2.105 13
UK23Houses /
Toiletflushing
Coarse filtration+Disinfection - - 166 - 40 - 40 - 35 - ND+
USA69House / Toiletflushing and
irrigationCartridge filter - - - - - 21 7 19 8 2.108 2.106
Australia45House /Garden
wateringSedimentation + Trench - - - - - - - 405 100 - -
Australia45House /Garden
wateringSedimentation - - - - - - - 310 195 - -
Australia45House /Garden
wateringScreening + Trench - - - - - - - 155 76 - -
TNTC: too numerous to count.
39
Table 6: Performance data of chemical technologies.
Building type /Application Scheme
HRT(flow rate,
loadingrate)
PerformanceCOD
(mg.L-1)BOD
(mg.L-1)Turbidity
(NTU)SS
(mg.L-1)Total coliforms
(cfu/100mL)In Out In Out In Out In Out In Out
UK35 Bench scale Photocatalytic oxidation(TiO2/UV)
<30minutes
139-660º
26-139º - - - - - - 106 0
Slovenia36 Pilot scale Coagulation + Sand filter+ GAC
~ 40minutes 280 20 195 10 - - 35 <5 - -
Taiwan34 Pilot scale Electro-coagulation +Disinfection
~ 20minutes
(28m3/day)
55 22 23 9 43 4 29 9 5100* ND*
* as E. Coli; º as TOC.

40
Table 7: Performance data of physical technologies.
LocationBuilding
type /Application
SchemeHRT
(flow rate,loading rate)
PerformanceCOD
(mg.L-1)BOD
(mg.L-1)Turbidity
(NTU)SS
(mg.L-1)Total coliforms
(cfu/100mL)In Out In Out In Out In Out In Out
Japan47House /Garden
wateringSoil filter (0.086
m3/m2/day) 271 42 477 166 - - 105 23 - -
USA15 Pilot scale Earth filter + Disinfection2 hours(0.32
m3/m2/day)- - - - 17 9 549
~ 460~ 2.106 34
USA15 Pilot scale Earth filter + Activatedcarbon + Disinfection
(0.24m3/m2/day) - - - - 23 9 500
~ 394~ 1.105 4
Oman39 Mosque /Irrigation
Filtration + Activatedcarbon + Sand filter +
Disinfection(1.3 m3/day) 51 35 - - 13 6 9 4 >200 0
Canada22
Apartmentbuilding /
Toiletflushing
Screening + Sedimentation+ Multi-media filter +
Ozonation(1 m3/day) - - 130 - 82 26 67 21 8870* 8*
UK56 Pilot scale Sand filter + Membrane +Disinfection
(4.37m3/day) 65 18 23 8 18 0 - - 5.103 * 0*
Israel51 Bench scale
UF membranes (400kDa) - 146 80 - - 18 1.4 - - - -UF membranes (200kDa) - 146 74 - - 17 1 - - - -UF membranes (30kDa) - 165 51 - - 24 0.8 - - - -
NF membranes - 226 15 - - 30 1 28 0 - -
Slovenia36 Pilot scale RO membrane - 130 3 86 2 - - 18 8 - -UF membrane - 280 130 195 86 - - 35 18 - -
Korea50Hotel /Toilet
flushingMembranes - 64 10 - - 10 0 - - - -
USA14 Pilot scale Coarse filtration + RO +Disinfection - - - - - 30 0 102 <10
0 5.107 0
UK52 Pilot scale UF membrane - 451 117 274 53 - - - - - -* as E. Coli; ~ as Total solids.

41
Table 8: Performance data of biological technologies.
Location Building type /Application Scheme
HRT(flow rate,
loadingrate)
PerformanceCOD
(mg.L-1)BOD
(mg.L-1)Turbidity
(NTU)SS
(mg.L-1)Total coliforms
(cfu/100mL)In Out In Out In Out In Out In Out
Japan64 Stadium / Toiletflushing
Screening + Sedimentation +Flotation + Rotating filters +
Sand filter + Disinfection
(622m3/day) 243 6 336 20 - - 207 10 - 10
Japan59 HouseAnaerobic filter + Submerged
biofilter + Sedimentation +Disinfection
(1.735m3/day) - 11 - 8 - - - 6 - -
Korea21 Pilot scale Sequencing batch reactor + MFhollow fibre membranes
13 hours(1.2
m3/day)79 30 5 5 - - 185 - - -
China27 Pilot scale Screening + Membranebioreactor 3.6 hours 130-
322 <40 99-212 <5 146-
185 <1 15-50 0 - ND
Israel58 Student flats / Toiletflushing
Screening + Rotating biologicalreactor + Sedimentation + Sand
filter + Disinfection~18 hours 158 40 59 2 33 1 43 8 6.105
+ 1+
Israel58 Student flats / Toiletflushing
Screening + Membranebioreactor + Disinfection ~18 hours 206 47 95 1 80 0 103 13 3.105
+ 27+
Jordan38 House / Irrigation Sedimentation + Anaerobicfilter 1-2 days - - 300-
1200 375 - - - 107 - -
Denmark24 Industrial laundry Membrane bioreactor2-2.5 days
(60m3/day)
1700 50 645 2 - - - - - -
Germany17 Apartment building /Toilet flushing
Sedimentation + Rotatingbiological contactor + UV
Disinfection
(2.1m3/day)
100-200 - 43-
85 <4 - - - - 104-105 <104
Germany17 House / Toiletflushing
Fluidized bed reactor + UVDisinfection
(0.04m3/day)
113-633 - 60-
256 <4 - - - - 103-105 <104
Finland20 Apartment building /Toilet flushing
Aerated biofilter + UVDisinfection - 800
0 75 - - - - - - 1.106
+ 20+
Australia57House / Toilet
flushing, laundry andgarden watering
Screening + Biofilm + UVDisinfection - - - - 9 - 6 - 9 - 0*

42
Building type /Application Scheme
HRT(flow rate,
loadingrate)
PerformanceCOD
(mg.L-1)BOD
(mg.L-1)Turbidity
(NTU)SS
(mg.L-1)Total coliforms
(cfu/100mL)In Out In Out In Out In Out In Out
Australia63 House / Toilet flushingand outdoor use
Septic tank + Sand filter + UVDisinfection - - - 97 6 - 1 48 3 2.105 9
Norway61 Houses / Irrigation Septic tank + Aerated biofilter+ Constructed wetland - - 62 - <10# - - - - - <100
Germany60 Pilot scale Membrane bioreactor 10 hours 493 24 - - - - 7 4 - -
UK18 Student residence /Toilet flushing
Screening + Aerated biofilter+ Deep-bed filter + Activated
carbon- - - - 9 - 1 - 6 - 995
UK52 Pilot scale Biological aerated filter4 hours
(0.4m3/m2/h)
363 80 131 5 - - 109 8 - -
UK19 Student residence /Toilet flushing
Biological reactor + Sandfilter + GAC + Disinfection
(263m3/year) 201 62 - - 212 5 - - 7.105 3
UK2 Pilot scale Biological aerated filter3.7 hours
(0.328m3/day)
128 13 41 4 - 3 52 6 2.106 2.104
UK2 Pilot scale Submerged membranebioreactor
13.6 hours(0.071
m3/day)128 7 41 1 - 4 52 4 2.106 2
UK2 Pilot scale Membrane aeration bioreactor0.8 hours
(0.225m3/day)
128 17 41 9 - 7 52 13 2.106 2.104
UK2 Pilot scale Side-stream Membranebioreactor
2.8 days(0.137
m3/day)273 2 181 1 - 1 58 4 3.104 1
UK62 Pilot scale Biological aerated filter + UFmembrane 1.2 hours 80 6 - - 25 0 52 1 6.105 <1
UK56 Pilot scale Biological reactor + Sandfilter + GAC
(2.88m3/day) 34 12 21 2 20 1 - - 2.102 <1
UK62 Arena / Toilet flushing Biological aerated filter1.25-5
hours (120m3/day)
84 14 - - - - 31 3 3.105 3.103
+ as Faecal Coliforms; # as BOD7.
43
Table 9: Performance data of extensive technologies.
Location Building type /Application Scheme
HRT(flow rate,
loadingrate)
PerformanceCOD
(mg.L-1)BOD
(mg.L-1)Turbidity
(NTU)SS
(mg.L-1)Total coliforms
(cfu/100mL)In Out In Out In Out In Out In Out
UK68 Pilot scale
Horizontal flow reed bed 2.1 days 452 111 151 51 63 12 87 31 6.107 104
Vertical flow reed bed 2 hoursbatch 452 27 151 5 63 2 87 9 6.107 2.104
Constructed wetland 2.1 days 452 139 151 71 63 26 87 19 6.107 2.106
Israel29 House / Irrigation Sedimentation + Vertical flowconstructed wetland 8 -24 hours 839 157 466 0.7 - - 158 3 5.107 + 2.105 +
USA69 House / Toilet flushingand irrigation Aquacell + Sand filter - - - 120 4 64 4 40 17 4.107 5.104
USA69 House / Toilet flushingand irrigation
Aquacell + Sand filter +Copper dosing + Disinfection - - - - - 79 4 36 5 2.107 6.105
USA69 House / Toilet flushingand irrigation
Aquacell + Sand filter +Copper and silver dosing
+Disinfection- - - - - 15 3 19 7 6.108 3.104
Costa Rica32 3 Houses / Irrigation 2 Reed beds + Pond> 10 days
(0.755m3/day)
- - 167 3 96 5 - - 2.108 + 198+
Costa Rica37 Pilot scale Trench and plants4-5 days
(0.01m3/day)
- - 254 13 103 - - - 8.107 + 2050+
Nepal31House / Toilet flushing,
cleaning and gardenwatering
Sedimentation + Reed bed (0.5 m3/day) 411 29 200 5 - - 98 3 - -
Germany30 Houses Sedimentation + Constructedwetlands (70 L/p/day) 258-
354 - - - - - - - 3.105
* 104 *
Switzerland70 Research centre /Infiltration
Sedimentation + Sand filter +Constructed wetland - 311 27 130 5 - - - - - -
Italy67 University Reed beds7 days(0.09
m3/day)151 51 42 26 - - 25 20 - -
Sweden28 Village / Irrigation Sedimentation + Reed bed +Sand filter 4 days 361 56 165# <5# - - - - 3.106 <20
Sweden33 Student residence /Toilet flushing
Lime gravel filter + 3 Ponds +Sand filter ~ 1 year - - 47# 0# - - - - 9.104 172
* as E. Coli; + as Faecal Coliforms; # as BOD7.
Related Documents