~ United States (~) Department of ~ Agriculture National Agricultural Statistics Service Research and Applications Division SRB Research Report Number SRB-89-03 March 1989 THE COMMODITY WEIGHTED ESTIMATOR- AN ANALYSIS OF 1987 JUNE AGRICULTURAL SURVEY DATA Gretchen McClung

Welcome message from author
This document is posted to help you gain knowledge. Please leave a comment to let me know what you think about it! Share it to your friends and learn new things together.
Transcript

~ United States(~) Department of~ Agriculture
NationalAgriculturalStatisticsService
Research andApplicationsDivision
SRB Research ReportNumber SRB-89-03
March 1989
THE COMMODITYWEIGHTED ESTIMATOR-AN ANALYSIS OF 1987 JUNEAGRICULTURAL SURVEYDATA
Gretchen McClung

'!HE a::MI)DrIYWEIGHI'EDESTIMA'IDR- AN ANALYSISOF 1987 JUNEAGRICl.JIllURALSURVEY~, by Gretchen McClun:},Research ani Applications Division, Nationallqricul tural statistics Savice, u. S. Department of 1v:Jricul'ture, Was.hi.rxfton,D.C. 20250, March 1989. Research Report No. SRB-89-03o
A Cullllulity TNeightedestimator for the nonoverlap portion of the lqriculturalSmveys (AS) was investigated usirg data collected in 14 states in June 1987.CulU.lulityweighted eJq)aIlSionsW'erecxmpared with those usirg the operationalweight of tract acres/fam acres. '!here was too muchvariability in the datato detect significant differences for hogs, stocks, am grain stock capacity.Significant differences were fourrl in number of fanns am lam. in fanns.Although the u.A1R100ityTNeightedestimator had several procedural advantagesover the operational weighted estimator, it was not recx:mnen:1edas areplacement for the operational weighted estimator. '!his was because itshowed ltDre upward bias than the operational weighted estimator in this14-state study.
************************************************************ '!his paper was prepared for limited distribution to ** the research camnuni.tyoutside the u.S. Department of ** lqricul'ture. ************************************************************
'!he author walld like to thank the 14 states involved in the study for theirdata collection am. processirg efforts. '!he author wa.tld also like to thankBrad Pafford, Ron Fecsof ani Bany Ford for their suggestions on ilrprovirgthis report at various stages of its develcpnent.
i

SUMMARY
Page...
••••••••••••••••••••••••••••••••••••••••••••••••••••••••••••••••••• 1~1
mrrorocI'Iai ..............•...............•.......................•........• 1
ME1HQtsihe. S'tllCly ••••••••••••••••••••••••••••••••••••••••••••••••••••••••••••••••• 2[)e!fin.itial of 'tl1e:a....L.ucxii,'ty'ltle:igllt •••••••••••••••••••••••••••••••••••••••• 3I.np.Ita.tion •••••••••••••••••••••••••••••••••••••••••••••••••••••••••••••••• 3
RESUIII'SReportin;J Errors in the Ccmoodi'ty'Weigllt rata 3The Basis of the Ccmoodi'ty' Weights ••••••••••••••••••••.••••••••••••••••••• 4Cartparison of Ccmoodi.'ty'Weight ani Operational Weight ••••••••••••••••••••• 5I.np.Ita.tion of the Weight ani Nbnresponse •••••••••••••••••••••••••••••••••• 8'!'est. Resu.lts ••••••••••••• ~•••••••••••••••••••••••••••••••••••••••••••••••• 9
CONCLUSIONSAND ~ONS •••••••••••••••••••••••••••••••••••••••••••• 13
~<::ES ••••••••••••••••••••••••••••••••••••••••••••••••••••••••••••••••• 15
APPENDIX A: FCRoIJIAS FOR '!HE ESTIMATES OF 'lOrAI.S AND VARIANC::ES ••••••••••••• 16
APPENDIX B: STATIS'l'ICAI. TES'l'S •••••••••••••••••••••••••••••••••••••••••••••• 18
APPENDIX C: '!HE 1987 JUNE AGRIaJmURAL SURVEYARFA OJESTIOONAIRE ••••••••••• 21
APPENDIX 0: F'RE;UENCIES FOR '!HE WEIGEn' B1\SIS - BY STATE •••••••••••••••••••• 35
APPENDIX E: a:r+I)[)I'lY ESTIMATES, OOEFFICIENl'S OF VARIATION,AND SIGNIFICANCE LEVELS BY STATE •••••••••••••••••••••••••••••••• 36
ii

A UAIIlI....ui.tyweighted estimator was investigated for use in the AgriculturalSUrveys cx:n:lucted annually by the National Agricultural statistics Service(NASS). '!his weighted estimator W'OUldprovide expansions of various crop,livestcx::k, am grain stock iteIrs for the nonoverlap (NOL) portion of thenultiple frame estimates. 'lhe c::x:rrroodi.tyweight was the ratio of tract acresof a particular UAlaOOJityto farm acres of that sameUAlIl~ty. '!he 0."'.'. dityused for the weight was the crop of greatest farm acreage. If there were 00creps on the farm, then pasture acreage was used. If there was 00 pastureacreage, then the weight defaulted to the prc.p:>rtian of the farmISagricultural .in:xJne that was derived fran within the tract. '!he operationalweight was the ratio of tract acres to farm acres.
Cata were collected for 14 states in the 1987June Agricultural SUrvey (AS).NOL e>cpansionsfor hogs, stcx::ks, am grain stock capacity for the UAllllLXlityam operational weighted estimators were canpared. At the state level am the14-state level, there were no significant differences in the UAllll....ui.tyweighted am operational weighted expansions for these i teIrs.
NOL e>cpansionsof rn.ntiJerof fanns am lam in fanns were also generated usi.rgthe two weighted estimators am the open (resident farm operator) estimator.Significant differerx=es for lam in fanns at the 14-state level am in severalirrlividual states agreed with results fran a similar study done with the 1986OecenlberAS. As the cx:moodityweighted expansions were significantly higherthan the operational expansions, am the operational estimator was knowntoprcx:luceestimates for lam in fanns that generally correspon:i to officialAgricultural statistics Board (ASB) estimates, it was concluded that theUAllllr.Aityweighted estimator is clearly not suitable for lam in fannsestimates .
Results for rn.ntiJerof fanns were not consistent with the Deceni:Jer1986 study.In the current study, all states had UAlIU....ui.tyweighted expansions larger thanthe operational weighted expansions. '!he differerx=es were significant inseveral states am for the 14-state total. '!hese results suggested that theCUlll.lr.Aityweight had an even greater upwardbias than the operational weight.
'!his uprcu:dbias did not result in significant differences for hogs am stocksbecause there was too llI.lChvariability in the data to makethe tests pa.Jerfulenough to detect reasonable levels of differences. '!he UAllllLXlityweightedestimator did not appear to be the solution to the search for an ilrprovedweighted estimator. A recently prq:xJSed (2), IrCdified version of theoperational weight should raN be the fcx::usof investigation.
iii

INTRODUCTION
'!he National Agricultural statistics Ser.vice (NASS)con:lucts the series ofAgricultural SUrveys (AS) annually. '!he AS are multiple frame surveys thatuse a list frame am an area frame. '!he area tracts that are nonoverlap (NOL)with the list provide the area frame contribution to expansions of crops,st.cx::ks,am other UAlaucJities. For the NOL danain of the AS, J\.Uleis the basesurvey nonth. 'lhus, NOL sanples for the follow-on 1v;J surveys are subsaIrplesof the June survey. For expansioos usi.n:Ja li\Iei.ghtedestimator, the tracts areTNeightedby the ratio of tract acres divided by total fam acres. 'Ihi.soperational li\Iei.ghthas an upward bias associated with it (5). otheradvantages am disadvantages of the TNeighthave been stnmnarizedby Nealon (9).
Various weighted estimators have been studied with the goal of fin:ii.rg abetter alternative to the TNeightcurrently in use. Nealon (8) investigatedtwo weights, one based on croplam am the other based on total fam acresminus woods am waste. '!he croplam weight seemed to show sane premise.Although the croplam TNeightdid not seemto be biased, a major difficulty wasthat it was urrlefined when there was no croplam for an operation (4). In1985, Bethel (1) proposed a newli\Iei.ghtedestimator which was based on the crop(or other CullllILAlity)of greatest acreage on the fam. '!he \.;UlllllLAlityTNeightwas the ratio of tract acres of the particular UAllll.o..li.tyto fam acres of thatsame UJlllllOOity.His stlxiy of three states in the 1984 June Ernnnerative SUrveyi.rxlicated that the newTNeightedestimator did not seemto have the upwardbiasof the operational weighted estimator. Pafford (10) investigated the use ofthis new weighted estimator for PIGA (Public, Irrlustrial, am Grazi.n;JAssociation) cattle. He reported sane problems with its use am suggestedthat modifications to the weight might makeit m::>reuseful for Western states.
'!he Culllll.o..li.tyweighted estimator is also urrler investigation for use in theFann Costs am Returns SUrvey (FrnS). 'lhe FrnS currently uses the open, orresident fam operator (RFO), estimator instead of a weighted estimator.Research is in progress to evaluate the UJlllliLAlityweighted estimator for theFCRS. Initial research on the 1985 FCRSi.rxlicated that the CCllU'OCldityweightedestimator was m::>reprecise than the open (RFO)estimator am nearly equal inprecision to the operational weighted estimator. '!he 1986 FCRSresearchcorrpared the open (RFO)estimator with the CulUllOOityweighted estimator (3).Results favored the UJllllllOdi.tyweighted estimator. FUrther research is rKM
urrleJ:Wayon the 1987 FrnS.
'!he use of the (.;ullllLAlityweighted estimator for the Agricultural SUrveyswasinvestigated in m::>redetail (7), usi.n:Jdata collected duri.n:Jthe 1986 DecemberAgricultural SUrvey. In this stlxiy, the CulllliLAlityTNeighted estimatorexhibited several advantages over the operational weighted estimator.
One advantage of the CCIl1lI'KXli.tyweighted estimator related to prescreeni..rq ofhighly pcp.1l.atedareas. As the operational weight is tract acres divided byfann acres, "city segments" nust be screened for fann operators even thoughthere is no agriculture within them. '!he amount of prescreeni.n:J requiredwould be much less for the '-'U.lllllLAlityweighted estimator than for theoperational weighted estimator. For m::>ststates, prescreeni..rq "city segments"
1

would not be necessary for the carm:xtity weighted estimator because thenumerator of the CulllllOOityweight would always be zero.
Prescreeni..n3'would only be necessary in the PIGAstates, where sane operatorshave no lam except PIGAlam am their residence. PIGAlam is not includErlin the total lam operated by a fanner so any livestock on the PIGAlam nustbe associated with the operator's residence. If an operator in a city segmenthas no lam other than the city residence am PIGAlam, a weight of one \tJOUldbe assigned 'Whenthe operator's residence is in a sant>led segment. If thereis any other lam than the city tract am the PIGAlam, a CullIllJ.Ality\¥eight ofzero TNOll.dbe assigned because the tract annmt of the Culll.l..xtityTNOll.dbezero, regardless of the Culll.lLAlitythe weight is based on.
In addition to decreasi.rg the annmt of presc:reeni..ng JlE'€ded, use of theCulllllLAlityweight \tJOUldalso cause a reduction in the total m.nnber ofinterviews c:::c::rcpleted.Anytract with a zero \.AAllllLAlityweight fran the June ASwould not have to be interviewed if sampled again in a later survey. Areduction in survey costs would result. '!he savinJs involved may besubstantial for the FrnS as it has a IOn] am ti.me-consumi.n:.Jquestionnaire.
Results obtained for the 1986 December AS were i.nconclusive because ofprocedural differences between the Decemberam June surveys. '!he procedurefor obtai..ni.rq the \.AAlIllOOityweight was UllI'leOeSSarilylorq in Decemberam dueto recent cl'lan]es in the ASPr.:~LCU11, weights would not be ootai.ned in Decemberfor the DecemberAS but would be obtained durin] the June AS am frozen foruse in the remai..ni.rqsurveys of the annual cycle. It was therefore considerednecessary to investigate this (;utlllQlity weighted estimator usi.rg June data.'!his paper presents results on the use of the \.AAllllLAlityweighted estimator forthe 1987June Agricultural SLu:vey.
Data for this research were collected duri.rg the 1987 June AS. Fourteenstates were included in the study- Arizona, Colorado, Delaware, Idaho,MaIylam, Montana, New Jersey, New Mexico, Oregon, Permsylvania, SouthCarolina, South Dakota, utah, am Wyani.n;J.CwlllLAli.tyweighted infonnation wascollected for the nonoverlap (NOL) portion of the area frame in these states(5716 tracts in all). CulluLAlityweighted am operational weighted NOLexpansions for m.nnberof farms, larrl in farms, total hogs, com stocks,soybean stocks, all wheat stocks, arxl grain storage capacity were tested fordifferences. q:,en (Rro) estimates were also generated for numberof farms arxllarxl in farms. Fornulas for the estimates of the totals arxl their variancescan be foorxi in ~ A.
Univariate paired t-tests were corrlucted at the in:lividual state level arxl forthe 14-state level for each of the \.AAlllILAlities.In addition, nultivariatetesti.rg was done. A detailed description of the statistical testi.rgprccedures used can be fCJUl"rlin ~ B.
2

Definitial of the 0 )I'.'.dity Weight
'n1edefinition of the weightwassiInplified fran the version used for the 1986DecemberAS stOOy(7). '!he basis for the u..llIRlOOityweightwaseither the cropof greatest acreage, pasture, or agricultural i.nc::x:aneon the fann. If the fannproducedartycrop(s), the crop with the greatest acreage on the fann wasusedfor the weight. '!he weight for a particular tract wascalculated by divic:iin3'the tract acreage of the crop with the greatest acreage by the fann acreage ofthat samecrop.
If the fann had no crops J::utdid have pasture, the weight for the tract wasthe pasture acreage within the tract divided by the pasture acreage of thetotal fann or ranch. If the fann had neither crops nor pasture, the weightwas based on agricultural i.nc::x:anefor the fam or ranch. 'n1eweight for thetract was the fraction of fam sales in 1986that werederived fran within thetract.
All of this infonnation is not routinely collected on the June AS. 'lherefore,additional questions were needed. '!heywere addedas question 2 to section Fof the Part A questionnaire.- A c::xJPYof the questionnaire for M:>nt:anacan befoorrl in Awentix c.
It can be seen fran the abovedefinition of the weight that for a particularfann, the u..llLRlulltyweights will total one \1Ihen SUl'lItIedover the tracts of thatfann. '!his will be tnle regardless of the u..lllllla.Ali.tythat the weights arebased on am provided that nonsanplirg errors are not correlated with thetracts .
~on 2 in Section F of the Part A questionnaire contained a ccxrpletioncodeboxwhichwasused to d.etenni.newhichtracts neededto have the u..llIRltOdityweight inp.tted. InpItation wasneeded\1Ihen question 2 wasnot ccxrpleted. '!hei.np.rtedweight was the average reported. weight within state, weight basis(crops am pasture were gro.Jped together for inp.rt:ation p.IIpOSeS) ,agricultural reporting district, ani lam-use stratum (agricultural ornonagricultural) . '!his inputation schemewas based on that used to i.nplteitem values operationally (11). '!he only exceptions to this schemecx:x;urredwhen tract acres am fam acres were equal. For these tracts, both theoperational am u..llIRla.Ali.ty weights WOlldbe one. Table 3 in the RESUIlI'Ssection gives the percent of inp.ttedweights.
Rep:Jrt:inJEtun:S in the n •.•.•a1ityWeightIBta
Whenthe operational weight was equal to one, all of the fann waswithin thetract. 'lherefore, the u..lllllla.Ali.tyweight sha1ld also have been equal to oneregardless of the Cuuua.Ali.tyon whidl it was based. As descriJ::ledin theprevious section, wheni.npltation wasnecessary, UAIIlI.:JJityweights of one were
3

iIrprted when it was known that the \\/'eight should be ale. A prc::iJlemencountered in calculatirg the \\/'eight was that there were also tracts withreported data for question 2 whidl resulted in a I.A.llliliOOity\\/'eight less thanone, even tha.1gh farm acres an:l tract acres were equal. '!here were severalcauses of this prc::iJlem. '!he m.nnerator for the crop-based \¥eight was obtainedby addi.rg the acres of the greatest acreage crop reported in section D of thequestionnaire (see ~ C). 'nlese acres were obtained field-by-field an:lwastelan:l was acx:x:mrt:edfor separately. '!he dernninator of the crop-based\¥eight, however, was based on one figure of total acres of the crop asreported in section F. Closer investigation of the data at the tract levelshowed that the dernninator scmetines inclOOed waste when the farm wasc::arplete1y oaltained within the tract. '!his resulted in a o•.•.•di.ty \¥eightthat was less than ale, whidl was incorrect. Whentract acres an:l farm acreswere equal, the error was ctwious an:l easily corrected. However,this c:k::Mnwardbias of the \¥eight I1lJStalso have cx:x::urredin other cases where the errorwould not be ctwious an:l no correction could be made.
Another reason for an incorrect \\/'eightcou1d ocx::urin fantlS havirg PIGAlan:l.For exanple, the farm acres of pasture could have incorrectly inclOOedPIGAlan:l, but the tract acres. would not have included it because they wereobtained carefully on a field-by-field basis. '!he dernninator would beinflated, thereby decreasi..n:Jthe I.A.lllauL.:Uity \\/'eight. 'Ibis error could on!Y beidentified an:l corrected if tract acres an:l farm acres were equal. It was notknownhew often this error oocurred when farm acres were greater than tractacres. 'lherefo:r:e, its effect on the I.A.lllIllLAlity\\/'eighted expansions was notknown.
'Ihe Basis of the O •••••dity Weights
'!he basis of the l.A.lllalLAlity\\/'eight created three gralpS within the sample.Table 1 shews that for the 14 states CCIIi:>ined,67.2% of the tracts had a\\/'eightbased on crcp;, an:l 23.5%had a \\/'eightbased on pasture. '!he frequencyfor eadl graJp was very close to that obtained in the DecemberAS study (7).'!he December study values for crops an:l pasture were 68.1% an:l 22.1%,respectively (for all 48 states). In June, crops an:l pasture togetherprovided \\/'eights for 90.7% of the tracts, with the remainirg 9.3% based onagricultural:incx:!ne. Appemix Dgives the frequencies at the state level. Atthe state level, crops plus pasture provided the basis for the \"oulal~ty\\/'eight fran a lC1ot1of 64.2%of the time (in Arizona) to a high of 97.5%of thetime (in Montana). '!he CualluLAlity\\/'eight basis was crops or pasture for over80%of the tracts in all but two states (Arizona an:l Wyan.in;J).
'!he AS are corrlucted several times a year. For the NOL demain, June is thebase smvey m:>nth, an:l the follow-on smveys are subsanpled fran the Junesample. One major feature of the CuauulCX.li.ty\\/'eight is that with a frozen\¥eight fran Jtme used for the remaini..n:Jsmveys in a year, any tracts with aI.A.lllllLLXlity\\/'eight of 0 (obtained in June) do not need to be contacted ifsampled later on. Table 2 shows the frequencies for the \\/'eight bases withweights of 0 separated out. OVerall, 854 tracts, or 15%,had weights of zero.If these tracts were sampled later on in the smvey year, they would not needto be contacted since they would contribute not.hirq to the expansions. 'Ibiswould also awly if the 1.A.ll1luOOity\\/'eightwas used for the FCRS.
4

TABlE1: Frequencies for the Basis of the CullliLAlityWeight.Data are fran the 1987 June Agricultural SW:vey.
Basis of the Numberof Percent CUnulative CUnulative~IIllLAlity tracts mnnber of percentlNe
,t cts
C:rcpofgreatest acreage 3841 67.2 3841 67.2Pasture 1346 23.5 5187 90.7Ag inccme 529 9.3 5716 100.0
TAmE2: Frequencies for the Basis of the CullliLAlityWeightwith Separation of Zero Weights. Data are fran the
1987 June Agricultural SW:vey.
Basis of the Positive or Nurrt:Jerof Percent Percent~1.ILAlity zero lNeight tracts within across alllNei t bas' basisCrop ofgreatest acreage + 3143 81.8 55.0
0 698 18.7 12.2Pasture + 1274 94.6 22.3
0 72 5.3 1.3Ag incane + 445 84.1 7.8
0 84 15.9 1.5
Cc.IIpariscnof n •.•.•dity Weight am ~a1al Weight
'!he distributions of the operational lNeight am UAIIlI~ty lNeight werec:x:mpared. Figures 1 am 2 show the frequency distributions of the twuweights. 'Ihe UJlllliLAlitylNeight had 100m lNeights in the twu erxi i.ntel:va1s thanthe operational lNeight (74%vs. 61%). CulilLAlitylNeights of one occurred in53%of the tracts while the operational weight was one for only 38%of thetracts. 'Ihese results were expected since the UJlIIlI~ty weight cculd be oneeven when the operational weight was not, am the u..lllluLAlityweight cculd alsobe zero which was not possible for the operational lNeight.
'Ihe distribution of the difference between the ~1.ILAlity weight am theoperational lNeight at the tract level was also graJ;i1ed. 'Ibis difference canranJe fran -1 to +1. Figure 3 shows that the majority of the differences areequal to or close to zero. '!here was actually no difference in the twoweights for 40%of the tracts. 'Ihe ~llll~ty weight terrled to be higher thanthe operational weight, with 32%of the tracts showin:Ja positive differencearrl only 28%showin:Ja negative difference.
5

FIGURE 1: Frequency Chart tor Operational WeightUsing Data from the 1987 June Agricultural Survey
Weight Number ot Percentinterval tracts ot total
[0, .1) WWWWWWW 835 14.61
[.1,.2) WWWWW 538 9.41
[.2,.3) WWW 355 6.21
[.3,.4) WWW 315 5.51[.4,.5) WW 241 4.22
[.5,.6) WW 249 4.36
[.6,.7) W 153 2.68[.7,.8) WW 181 3.17
[.8,.9) WW 178 3.11[.9, 1] 2671 46.73-----+----+----+----+----+----+10 20 30 40 50 60
Percentage
FIGURE 2: Frequency Chart tor Commodity WeightUsing Data trom the 1987 June Agricultural Survey
Weightinterval
Number ot Percenttracts ot total
[0, .1) ZZZZZZZZWW 1121 19.61[.1,.2) WWW 294 5.14[.2,.3) WW 222 3.88
[.3,.4) WW 240 4.20[.4,.5) WW 189 3.31[.5,.6) WW 235 4.11[.6,.7) W 112 1.96[.7,.8) W 81 1.42[.8,.9) W 98 1.71[ .9, 1] 3124 54.65-----+----+----+----+----+----+10 20 30 40 50 60
PercentageZ - commodity weight - 0W - commodity weight > 0
6

FIGURE3: Frequency Olart for Catm:ldi.ty Weight - Operational Weight,Usi.n;J Data fran the 1987 June Agricultural SUl:vey
Weight Nl.nnberof Percentinterval tracts of total
[- 1,-.9] 28 0.49
(-.9,-.8] 17 0.30
(-.8,-.7] 20 0.35
(-.7,-.6] D 29 0.51
(-.6,-.5] D 48 0.84
(-.5,-.4] D 76 1.33
(-.4,-.3] DO 120 2.10
(-.3,-.2] ODD 158 2.76
(-.2,-.1] DDDDD 298 5.21
(-.1, 0) OC{)[)[)[)[)[)[ 786 13.75
0 2290 40.06
( 0, .1] DIX)[)[)[)I)[X( 751 13.14
.1, .2] DOODOO 334 5.84
.2, .3] DODD 206 3.60
.3, .4] ODD 165 2.89
.4, .5] DO 115 2.01
.5, .6] D 74 1.29
( .6, .7] D 64 1.12
.7, .8] D 60 1.05
.8, .9] D 39 0.68
( .9, 1] D 38 0.66I I I I I I I I I I5 10 15 20 25 30 35 40 45 50
Percentage
7

IDpItatia1 of the Weight am Na.Q.~
Imputation of a \Veight was necessazy whenever question 2 in section F of thequestionnaire was not CCIl'pleted. Inputation rates are in Table 3. '!heserates do not include tracts where question 2 was not completed, but the weightwas knownto be one because fann acres TNereequal to tract acres. For the 14states canbined, 367 TNeights (6.4%) had to be i.np.rt:ed. At the state level,the inpItation rate rarged fran 0 in NewMexia::>to alIoost 19%in Colorado.'!he inp.Itation rate for the 48 states in the Decemberstudy (7) was 13.6%.'!he reduction in inpItation in June is not suzprisinJ for several reasons. '!heJune study used a cx:.arpletioncode box that the Decemberstudy did not have,the carp.rter edits TNereIOOrethoroogh, am. there TNerefewer questioos used toobtain the \Veight.
'!he questionnaire nonresponse rate by state can also be seen in Table 3. It isbased on the rn.nnberof tracts that TNereeither refusals or inaccessible. '!henonresponse rate was 9.6% for all of the states canbi.ned, with state levelsrarginJ fran a lorNof 4.3% in Montana to a high of 18.4% in Colorado. AninpItation rate lower than the a::>rresporrli.rgnonresponse rate means that theadditional nonresponses ~ given a \.AAllilLAlityweight of one because tractacres were equal to fann acres.
TABIE3: CulalLAlityWeight Inpltation am. Questionnaire NonresponseRates by state for the 1987June Agricultural SUrvey.
state CulalLUi.ty Questionnaire\Veight n::>nresponseinp.Itation rate (%)rate
AZ 2.6 14.2CX> 18.8 18.4DE 4.4 8.7ID 7.8 608MD 7.6 14.0MI' 3.2 4.3NJ 6.0 11.3NM 0 702OR 1.7 500PA 4.4 7.0SC 4.9 6.1SD 8.4 13.1ur 13.4 13.4WY 3.4 7.7
14 stateTotal 6.4 9.6
8

Test Results
NOLexpansions were generated for rnnnberof fanns, lard in fanns, rnnnberofhogs, corn stocks, soybean stocks, all wheat stocks, ard grain stcx:::kcapacity.Total planted acres of various crops are not cbtained in June so they couldnot be analyzed in this stlXiyas they were in December.
Mlltivariate paired t-tests on all of the above variables were perfonned todetennine if the '-'Ulllla&.Ali.tyW'eighted expansions were different fran theoperational W'eighted expansions. Results irrlicated a highly significantdiffererx:e (p-value < .01) at the 14-state level. Mlltivariate paired t-testswere also perfonned on earn state separately. '!he results are in Table 4belCM. '!here were significant differences at a =.05 for Colorado, Idaho,Marylard, ard New Jersey. Bonferroni adjustments (see ~ B) forsi1nu1taneoustest~ would restrict our concern to the two na;t significantstates (Idaho ard Marylard). Nonsimlltaneous tests in these states showedsignificant differences in either rnnnberof fanns or lard in fanns.
TABlE4: Significance levels fran Mlltivariate Tests to catpare ExpansionsUs~ the o...llll~ty WeightedEstimator vs. the cparational WeightedEstimator
for the NonoverlapDanain. Data are fran the 1987June Agricultural Smvey.
State Significancelevel
AZ 0.7400 0.03*DE 0.24ID 0.01 *MD 0.01 *MT 0.53NJ 0.05 *NM 0.34OR 0.08PA 0.08SC 0.41SO 0.72UT 0.07WY 0.74
Across all14 states < .01 ** denotes a difference
significant at a=.05.
9

Table 5 shc7.Ysthe NOL ~ions, CVs, am significance levels for univariatepaired t-tests on hogs, stocks, am capacity at the 14-state level. 'Iherewere no significant differences between tlle c:ctl'IIOOdityW'eightedam cpmltionalW'eighted expansions for any of the u.JlllllLAlitieseven before Bonferroniadjustments. CVs for tlle two expansions were fairly close am low except forsoybean stocks. Soybean stocks also had the largest relative difference. '!helarge CVs for soybeans stocks were due in part to the fact that soybean stockswere estimated in a1l.y six of the 14 states. Expansions, CVs, amsignificance levels for the states can be fOl.1niin ~ E, Tables 1 to 5.For these five U-al1llL>.li.ties,none of the state level differences weresignificant either.
TABlE 5: For the Nonoverlap Domainin 14 states, Expansions ani CVs for Hogs,st.cx::ks,am Capacity Usi.rg rata fran the 1987June Agricultural SUrJey.
CuliliOOityCV Operational CV Rel Sig.CullliLAlity W'eighted % W'eighted % dif ..1/ level
expansion expansion %(1000l (1000)
Total hogs 650 17.3 676 17.8 -4.0 0.53
Com stocks 36,860 11.0 33,156 8.9 11.2 0.12
Soybean stocks 1,527 64.2 905 31.1 68.8 0.41
All wheat 19,484 13.0 21,047 13.0 -7.4 0.42stocks
Grain storage 361,725 6.3 346,516 5.9 4.4 0.33capacity
.1/ Relative difference =100 * (u.Jlllllwitvwtd. exoansion - OPerational wtd. exoansion)
operational wtd. expansion
It may be of interest to examine sane of tlle larger differences DDreclosely.Table 3 in ~ E shows that the large difference am CVs for soybeanstocks are due mainly to South Carolina. Examination of South Carolina dataat the tract level revealed tllat one tract accounted for the majority of tlledifference. It had a large expansion factor canbined witll a u.JlllllLAlityW'eightof 1 versus an cpmltional W'eightof .07, which resulted in a difference inthe ~ions of 604,000 bushels. '!he operator was the respan::ient amreported the crop of greatest acreage as totally witllin the tract, which wasthe reason for the u.JlllllLAlityW'eightof one. '!his huge relative difference inSouth Carolina did not result in a statistically significant difference in thetotals, however.
'!he only other noticeable (but not statistically signi.ficant) difference wastllat for Wyani.nJIS corn stocks (Table 2, Apperrlix E). '!he large difference
10

abseJ:vedwas again mainly due to one tract with a large expansion factor arrl alarge difference betweenthe UAlllla::ili.tyweight arrl the operational weight. Inthis case, the operator reported a crop of greatest acreage which resulted ina UAlllla::ili.tyweight of .63, while the operational weight was only .02. '!heresulti.rq ~ed difference was 23,951 bushels.
Table 6 shows the 14-state NOL expansions, CVs, arrl significance levels formnnberof fanns arrl larrl in fanns. Differences betw'eenthe UAlIllLAlityweightedarrl operational weighted expansions were highly significant (p-val.ues < .01).For larrl in fanns, this significant difference was also fcmxi in the Decembersb.xiy. state level results for June can be fc:mrl in Table 7 of A{:pan:li.x E.At the a=.05 level, Colorado, Idaho, arrl utah shc:7.tJedsignificant differences.
TABlE6: For the NonoverlapDemainin 14 states, Expansionsarrl CVsfor Numberof Fanns arrl I.an:lin FannsUsi.rq
rata fran the 1987June Agricultural SUrvey.
Culllllod.i.ty CV q,erational CV Relative Sig. Open CV Relativeweighted % weighted % dif. 11 level expansion % dif.'yexpansion expansion
(1000) (1000) (1000)
Numberof 179 3.3 171 3.3 4.9 <.01* 148 3.8 21.2fanns
I.an:lin 106,695 8.1 78,701 4.4 35.6 <.01* 68,586 8.5 55.6fanns
l/ Relative difference 1 =100 * (UAllllLAlitvwtd. exoansion - ooerational wtd. exoansion)
operational wtd. expansion.y Relative difference 2 =
100 * (Cululwitvwtd. exoansion - Rro exoansion)Rro expansion
* denotes a difference significant at a=.05.
Results for mnnberof fanns were not consistent with the previous study. '!herelative difference (at the 14-state level) between the UAllllLAlityweightedexpansion arrl the open expansion was 21.2%, whidl was very close to theDecembersb.xiy results of 20.2%for the U.s. total. However,the relativedifference between the Culllla::ili.tyweighted an:! operational weighted expansionswas 4.9% which was highly significant (p-value < .01). '!he Decemberdifference at the 48-state level was not significant (p =.25).
state level expansions, CVs, an:! differences for mnnberof fanns are fc:mrl inTable 6 of A{:pan:li.x E. All of the CuiU1Wityweighted expansions were larger
11

than the operational weighted expansions, ani these differences weresignificant at 0'=.05 in five states (Marylani, New' J~, Oregon,Pennsylvania, ani utah). In oregon, four observations with large expansionfactors ani large differences betweenthe two weights aCCOl.Ultedfor 46%of theexparxieddifference in number of fanns for the state. In utah, just twoc:b;e]:vations aocoonted for 47%of the difference in rn.nnberof fanns at thestate level.
For hogs, stocks, ani capacity, the ~IRlLAli.tyweight did not producesignificantly different expansions than the operational weight. For theseitems, there was no evidence to Slggest that the ~lalLAli.tyweight is lOOreorless biased than the operational weight. For m.nnberof fams ani lani infanns, however, an even greater upward bias in the ~lIliLAli.tyweight wasobserved.
Table 7 shows the relative difference for the 14-state totals for the itemstested ani also the difference level that wouldbe significant given the dataobtained. In general, large relative differences would be necessary for thetests for differences to be significant. '!his i.n:licated lack of pow"erdue tolarge variability in the items.
12

TABlE 7: For the 14-state Level, Actual Relative Differencesam Relative Differences '!hat WouldBe Significant at a=.05 level.
Cuulla:..li:ty
Total hogs
Com stocks
Soybeanstocks
All wheatstocks
Grain storagecapacity
Numberof fanns
I..an:iin fanns
Relative differencebetween the CullllllOdi.tyweighted amoperational weightedEDCpal1Sions(%) l/
-4.0
11.2
68.8
-7.4
4.4
4.9 *35.6 *
Difference that could bedetected at a = .05level (%) Y
±12.4
±14.1
±162.4
±17.9
±8.9
±1.9
±18.8
1/ Relative difference =100 * (CullllllOdi.tvwtd. exoansion - ~tional wtd. exoansion)
operational wtd. expansion
Y Detectable difference =100 * 1.96 * (variance of the excarx:1eddifference) \
operational wtd. expansion
* denotes a difference significant at a=.05.
Both the December1986 am June 1987 studies in::licated that the u.JUllllOdi.tyweighted estimator had the same problem of upward bias as the operationalweighted estimator. '!his result contradicted Bethel (1), who fourrl no upwardbias. His study was c:orrlucted in three states only, whereas the two latterstudies were c:orrluctedin 48 am 14 states. 'Iherefore, Bethel's conclusion ofno upwardbias did not hold after mre extensive analyses.
'!he u.JUllla:..lityweighted estimator am the operational weighted estimatorproduced EDCpal1Sionsthat were not significantly different for hogs, stocks,am grain stock capacity. For rnnnberof fanns am lam in fanns, however, thedifferences were highly significant. '!his was sanewhat confus~ because forsome items the u.JlUlluJityweighted estimator did not seem to have any mre of
13

an up..rardbias but for other items it did seem to. '!he:reason for theseresults was in the frequency of occurence of these items. Not all fanns hadhogs, stocks, or capacity, but all fanns had lam am were fanns. For the twoitems that were present for all fanns (presence of a farm am lam in fanns),the differences were significant. However, for items that did not occur onevery farm, the differences were not significant. '!herefore, it aweared thatthe '-'UllllllCAlityweight had lOOreof an upwardbias than the operational. weight,but that it was not detectable (lacked power) except for the IOOStc:x:mralitems. For the items that were not c:x:mral, there was 1l'lld1 lOOrevariability,am therefore not enough power to detect significant differences. '1hi.swasshownin Table 7, where for exanple, a difference in the hog expansions WQ11dnot be statistically significant unless it was at least 12.4%. Although thedifferences fourrl were not statistically significant, they maybe of practicalsignificance.
Although the '-'Ulllliulityweighted estimator does have the advantage of lessprescreening am fewer inteJ:views, it unfortunately seems to have an evenhigher up..rard bias than the operational weighted estimator. F\.1rtherconsideration of the '-'Ul11l11CAlity weighted estimator as a potential replacem:mtfor the operational weighted estimator for the Ag SUrveysis not recammerrled.
A newweighted estimator, which is actually a m:xlification of the operationalweighted estimator, has recently been proposed (2). It has the advantage ofeliminatinJ prescreening in the city segments, am consequently reducinJ thenumberof interviews needed. Hc:::1NeVer,it has the disadvantage that it missesoperations that have all lam in PIGA except for the residence. '!hesimulation study that was done used data collected durinJ the 1987 June AgSUrvey, am results i.nticated that this m:xlified weighted estimator does notproduce significantly different expansions than the operational. weightedestimator. A lOOreextensive study is planned for the 1989June AgSUrvey.
14

Imoact of Nonsanu:>linJErrors on Weicd1tedDepartment of Agriculture, statistical
(1) Bethel, James. A NewApproach to Weicd1tedArea Frame Estilnates. U.S.Department of Agriculture, statistical ReportinJ Service. 1985.
(2) Bosecker, RaynDman:! Michael Clark. ModifvinJ the Weicd1tedEstilnator ToEliminate Screenin:r Interviews In Residential Areas. U.s. Department ofAgriculture, National Agricultural statistics Service. 1988.
(3) Dillard, Lave. 1986 FCRSAnalvsis. Reoort IV. '!he Use of JES SeclIrentson FCRS. U.s. Department of Agriculture, National Agricultural statisticsService. 1988.
(4) Dillard, Lave an:! Jack Nealon. Comparisonof the Ocerational arrl CroplandWeicd1tedEstilnators. U.s. Department of Agriculture, statistical ReportinJService. 1983.
(5) Hill, George an:! Martha Farrar.Tract SUl::vevIrrlications .. U.S.ReportinJ Service. 1977.
(6) Johnson, Richard arrl Dean Wichern. ADolied Multivariate statisticalAnalvsis. NewJersey: Prentice-Hall, Inc., 1982.
(7) McCl.Ul'¥J,Gretchen. A Carm:xUtvWeicd1tedEstllnator. U.S. Department ofAgriculture, National Agricultural statistics Service. 1988.
(8) Nealon, Jack. An Evaluation of Alternative Weicd1ts for a Weicd1tedEstilnator. U.s. Department of Agriculture, statistical ReportIDJ Service.1981.
(9) . Review of the Multiole arrl Area FrameEstilnators. U.s.Deparbnent of Agriculture, statistical ReportIDJ Service. 1984.
(10) Pafford, Brad. A Comoarisonof the Part A and Part C Procedures. u.s.Department of Agriculture, statistical ReportinJ Service. 1986.
(11) U.S. Department of Agriculture, National Agricultural statistics Service.Emnnerative arrl htricultural SW::vevs. SUDervisinJ and Editi.na Manual. June1987.
15

APPEIIDIX A: FaMJIAS FUR 'IHE F.S'l':IM1a.m OF 'lOrAI.S AND 'VARIANCES
'n1e sample estimate of the total for the nonoverlap (NOL)dc::ma.inof a state is defined as follows:
s PI rlkA' s PI rlkYstate =:E :E .:E Ylkj =:E :E .:E elkj Ylkj
1=1k=1)=1 1=1k=1)=1
s = mnnber of lam use strata in the state
PI = rnnnber of substrata within lam use stratum 1
rlk = mnnber of segments within substratum k within lamuse stratum 1
elkj = expansion factor for segment j, within substratumk, within lam use stratum 1
Ylkj = f!kj:Em=1
where flkj = the rnnnberof agria.1l.tural tracts in segment j,within substratum k, within lam use stratum I
Ilmlkj = NOLirrlication for tract m, within segment j,substratum k am lam use stratum 1=1 if tract is NOL,=0if tract is 01.
Wmlkj= weight for tract m, within segment j,substratum k am lam use stratum 1
= tract acres/farm acres, for the operationalweighted estimate
= c::cmtniity-based weight, as defined on page 3,for the u.Jl11l1.:>J.ityweighted estimate
= 1 if Resident Fann Operator (RFO)o otherwise, for the RFO(open) estimate
Zm1k:j= entire farm value of the u.Jl11l1.:>J.ity of interestfor tract ro, within segment j, substratum kam lam use straturn 1
16

'!he variance of the estimated total is defined as follows:
S PI rlk elk. - 1var(Ystate)= 1: 1: 1:
1=1 k=1 j=l
17

APPE1IDIX B: smTISrICAL 'aSIS
1. Univariate testin;}
Paired t-tests were corxiucte.d since UA1R100ityweighted am operationalweighted estimates were generated for each tract. Differences were calculated,exparrled to the state level, am a t statistic was generated for the totaldifference.
usi..n;Jthe statistics defined .in Appentix A, we can also define the follc::1Ni.n:J:
oifference .in the expansions at the segment level:
A,= elkj Ylkj ,difference = Ylkj,difference
oifference .in the state expansion totals:
s PI rlkYO= ~ ~ ,~ dlkj
1=1 k=1 )=1
Variance of the total difference is calculated usin;} the same fonrula as .inA, A,
Appentix A, except that Ylkj, difference is used .in plaaa of Ylkj •
'!be paired t-test is as follows:
Yo= Yl.,;Ulllllulity- Yoperational
To test He: YO= 0HA: YO ~ 0 ,
use t = _
s.e. (yo)
where s.e. (yO)
am reject He if It I > ta
A
1= (var(YO»~
Z tables were used to obtain significance levels since the t isapproximated by the z whensanple size is large. '!he ta = t. 05 = 1. 96.
18

2. Multivariate testinJ
For nultivariate tests,let the J:'CM vector of differences for q variables be:
A, ,o = (Y01' YD2' ••• , YD::;I),
A
where Yoo=the difference in the ~ion totals for the oth item ofinterest (numberof fanus, hogs, rom stocks, etc.).
Also define:
w = the variance-covariance matrix for 0, with the variances as thediagonal elements, am the covariances as the off~agonal elements.
'!he diagonal elements of .Ware then defined as:
s PI. rlk (elk. - 1) rlk _ 2var(YOO)= ~ ~ ~ (do(lkj) - do(lk.»
1=1 k.=1j=l
am the off~agonal elements are defined as:
s PI (elk. - 1) rlk~ ~
1=1 k.=1
'!he test statistic is HotellinJ's ~, where
2 A, A_1 AT = 0 W 0 , \oh1ichis distributed as a chi-square
with q degrees of freedan.
'!hese are the same fonnulas as those used by Pafford (10).
19

Significance levels:
strictly speaki.n:J',whensimultaneoustests are corrlucted, the a level shouldbe adjusted by the numberof tests tl1at are beirxJ perfonned, since theprobability that all of the tests fail to reject the null hypothesis whenitis tn1e is not l-a, but (l-a)m, wherem is the numberof tests performed.'!he Bonferrarl. adjustment of the a level is based on the fact that(l-a)m ~ (l-m::r). 'D1i.s inequality allows the overall error rate(al + a2 + ••• + am) to be controlled at the desired level. For exanple, ifan overall a level of .05 is desired, the si.nultaneous tests should beperformed at the ajm level. Refer to Jdmson arrl Wid1ern (6) for moredetails.
20

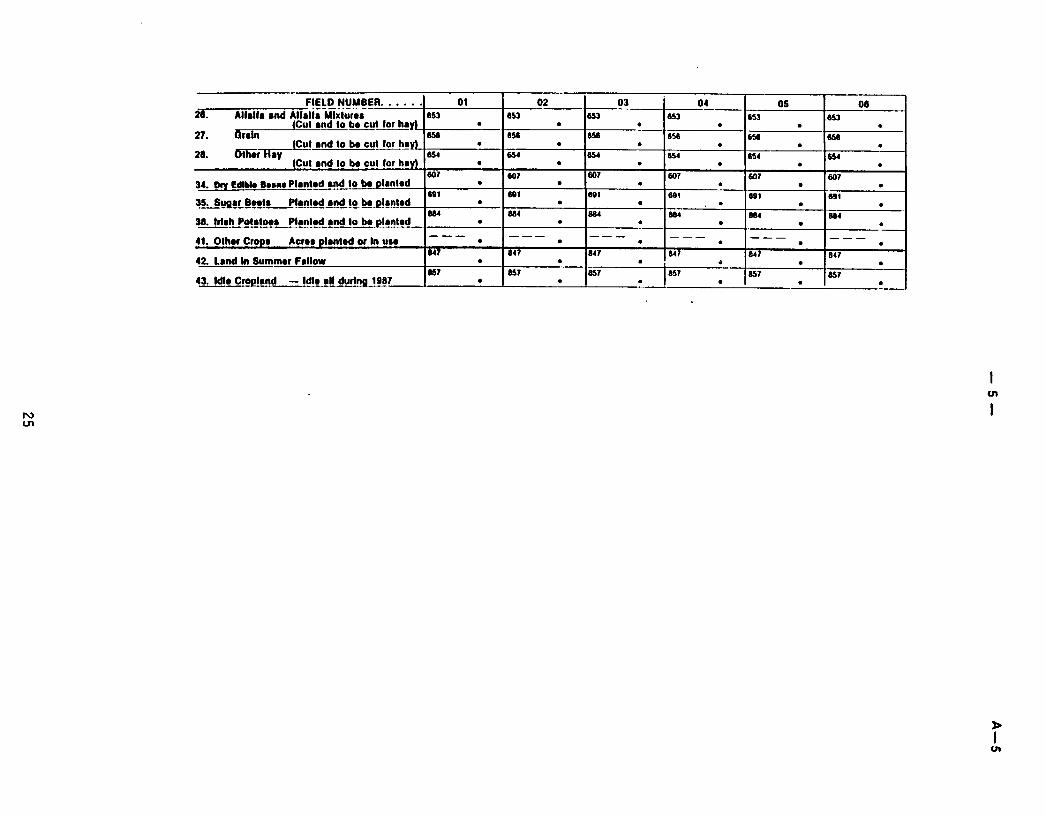
APPENDIX C: THE 1987 JUNE AGRICULTURAL SURVEY AREA QUESTIONNAIRE
June 1987ACREAGE & LIVESTOCK
Enumerative Survey~==------....-..--..•.-I-:-a~-a--_"'D_-la-:--_----ooo--=-_-m-:-~-_----TrMt---o-o-I l~
'0"" Approve"O.M.S. Numb.r 0535·001'bplrallon Dat. 5131/1.c.&. 1Z.(102t
A-5Montan.
Opllonal(401Response 10 this survey is voluntary and nol required by law. However, cooperalion is very Impl:!nant in order10 establish crop acreaje planted Ihis sprins and currenl IIveslock numbers. Facts aboul your (arm or ranchwlll be kepI CONFIDENTIAL and used only In combination wilh SImilar reJlOns (rom other producers to producestatistical summaries and 10 measure survey compleleness of samplinalislS.
Segment Number: Tract Lener: County: _
Starting lima
2M OPERATIONNAMELS'ID I I!.LN. 1 "o; • .(:rop. I Catlle·Sheep
0 711 I'" 1m
1m. -
COMIINATION 0' INDIVIDUALNAMES .LS'ID I &.LHo I "oaa·Cropa I Call1•. Sheep
1 711 1"'- 11211131. -
I. I need to make sure we have your /th,o~rator'sJ corrCCl name and address.fY,ri/y sticbn if pres,ntJ
Neme ofFarm, Ranchor Operation: _
Combination ofIndividual Names: _{If paNn,nhip}
Name ofOpar.tor: _
(rlnt) (Middl,) (l.JJst)
Address: _
(Rout' or Strm)
o Verify Operation Name
o Verify Combination of Individual Names
(City) (S/tllt) (Zip) [] Verify Operalor Name
Phon. No.: ( _
ENUMERATOR NOTE: /IISSN1EIN is ncordldon FtzaPage, vtri!y withrespondent thDr'0 to Stetion A.)
2. To belp identify duplication on our list of farmoperators. I would like to record the operator SOCIALSECURITY NUMBER (S5S) and FEDERAL EMPLOYERIDENTIFICATION NUMBER(S} (EIN) for)'OW' operadoa.
OPERATORNAMELSFID I ••••••• I "0;a-CroP8 I Catlle·Sheep
2 TID 1m 1124 IIU. .
21
HOL • 1OL .2
LSI' CODE lOX413

A-5SECTION A - OPERATION DESCRIPTION
-2-
.......... : Enter Code
1. On June I, was this tract of land Individually Operated,Partnership or Jointly Operated, or Managed Land?
o Individually Operated - 1 }o Partnership or Jointly Operated - 2o Managed Land - J
ENUMERATOR NOTE: {Landlord-Tenant, Cash-Rent, Share Crop arrangementsshould not be considered a partnership operation.}
[If this tract is operated as a partnership,continue.}
1845
{If code is J or J,go to Section B.}
Number ofPartners
9212. How many partners are in this partnership? , '-- ~
{Including operator}
. 3. Do all parmers share equally in day-to-day decisions?
DYES· {Consider the oldest as the operator.}
o NO • {The partner that makes most of the day-to-day decisions is the operator.}
{Operator shown on face page must be the one making most day-to-daydecisions or the oldest. Make corrections if necessary.}
4. Now I need the name, address. and social security number for the other person(s) in this partnership.[Verify stickers if present.}.
0 Verify Partner NameName
(First) (Middle) (Last)IAddress
(Route or ::itreet)Phone ( ) -(Cl/V) (State) (ZiD (.ode) Area Code)
L5F 10 5.S.N. Hogs·Crops Cattle·Sh!lep3 792 472 925 935. .
0 Verify Partner Name
~ame(First) (Middle) (Last)
Address(Route or Street)
Phone ( ) -(City) (State) (Zip Code) (Area Code)LSFIO 5.5.N. Hogs·Crops Cattl.·SheeD
4 794 474 926 938. .o Verify Partner Name
ame
ddress(FIrst) (MIddle) (Last)
(City) (Slate) (Zip Code)5.S.N.
478
22
Phone ( )(Area Code)
937Cattle·Shee

-3- A-5SECTION B - RESIDENCE AND SCREENING
1. Does the operator of this tract live INSIDE or OUTSIDE the segment?
o INSIDE • {Enter 5 in Code Box and go to Item (3) I } /81 -- 1 Io OUTSIDE· {Enter 6 in Code Box and go to Section C.I .-----~.
G) Were there any other persons living in this household on June 1 who operated a farm or ranch?DYES· Enter Names _
{Assign separate tractlel/er(s) on Part ID, then go to Item J.j
o NO • [Continue.]
3. On June I, did you operate land under any other name or land arrangementother than the one listed on Face Page?
o YES -{Assign separate tract lel/er(s) on Parr ID for other arrangernents(s), then go to Section C.J
o NO - {Continue.]
••••••••••••••••••••••••••••••••••••••••••••••••••••••••••••••••••••••••••••••••••••••••••••••••••••••••••••SECTION C - SECTIONS TO BE COMPLETED
[Go to Section D.} ~
[Check HOGS· CROPS Box,Then go to Section D.J
Hogs· Crops
YES· {Go to Section D.INO • [Continue.J
lb. [Was this Tract NON·AGRICULTURAL last year?}
la. [Is this Segment NEW for 1987?J
Ic. [Is this a NEW Tract Operator in an OLD segment?}
Id. [Is the Tract Operator DIFFERENT than the Operatorshown on Face Page label?}
Ie. [Was Operation Name or Combination of IndividualNames CHANGED or CORRECTED on Face Pagelabels?J
If. [Were any Partners DELETED or Names CHANGEDor CORRECTED on labels in Section A. page 2?J
NOYES
[1s the HOGS·CROPS box at bottom 'of this page checked?J ... 0
t
23

A·5SECTION D - CROPS AND LAND USE ON TRACT
Uow many acres are In.ld. Ihis blue lfaCI bound4ry drawn on Ihe phOlO (or map}? ..................................•.•.........•... Aer •• I-------"
Now I would Ilk. to •••• aboul .aeh .1.ld In.ld. Ihl. blue Iraet boundary and Itl u •• In 1917.
-FIELD NUMBER .. ... 01 02 03 04 05 08121 128 121 121 121 .211. Tolal Aer •• In Field • • • · • •
2. Crop Of Lend U~fYJ I•• 3 ~XXXXXXXXXXXXXXXXXXXXXXXXXXXXX3. Occupl.d Far!!!!~.ad Of Dwelllna •.., '" 841 141 141 "I4. Wood. Wa.t. Road. Dltche. etc. • • · · • ••• 2 •• 2 142 142 •• 2 142
J!!!'.!!1!n.nl - Nol In crop rote!lon • • • • • •5. p •• tur. 851 1158 851 851 851 151Croplal!d - U•• d on!y 'or p •• ~ure • • • • • ·o YEI o NO o YEI o NO DYES o NO DYES o NO o YEI a NO DYES n NOI. Two Crop. Plant.d In thl. Field 'or harv •• t
thl. year or two us •• 01 the ume crop? •• 4 lI·U 844 IU 144 144· • · • • ·6L 'L 6L 6L 61_ II~7. Aera. L." to b. Plant.d? • · · • • •
1_- 6__ .-- 6__ 1_- 1_-la. Acr •• Irrlgat.d and 111 Crop • • • • • •to be ,"agat.d? ----- ------- 1-------- ------- '--------------- -------.-- 1_- 1_- 1_- 1_- I_-
2nd Crop · • · • • ·650 550 650 550 550 5509. Sprfng Wh.a' ~a.!!l.!.dJn.d.JCL I!! f.1!!1!!!l ----~-- • I-----~-- • •------- ------- ------- -------Other Than 788 168 168 168 188 111
10. Durum For Grain• • · • • .•. 553 553 553 553 553 553
11. Planted and to be plant.d • • • • • •Durum Wheat ------------- ------- ------- ------- -------- ------- -------554 554 554 554 554 554
12. For Grain • · • · • •540 540 540 540 540 540
Plant.d • · · • · •13. Wlnt., Wh •• t ------------ ------- ------- ---~~ ,=""'-'" ~------- ------- -------541 541 541 541 54! 541
14. For Grain • · • • • •547 541 541 541 541 541
15. Planted and to be plant.d • • · • • •Rye ------------ ------- ------- ------- ------- ------- -------541 541 541 541 541 541
11. FOf Grain • • • • • •533 533 533 533 533 533
17. Planted and to b. planted • • • • • •Oat. ------------ ------- ------- ------- ------- ------- -------534 534 534 534 534 534
11. FOf Grain • · • • • •..535 535 535 535 535 535
19. Planted and to b. planled • · • • • •Barf.y ------------ ------- ------- ------- ------ ------- -------531 536 536 536 531 536
20. For Grain • • • • • •530 530 530 530 530 530
21. ~a.!!I!.~!!.d....!~_b..! f1~!~~ • · • • • •COfn ------- ------- ------- ------ ------- -------53\ 531 53\ 53\ 53\ 53122. F()t ~r~11! • · · · • ·25. Other Us •• 01 Grains Planted Use •
Acres abandoned,-- --- .-
Silage, "Ie Acros · · I · · , 0 ·~ ~ - ~-- -
N111
FIELD NUMBER..•... 01 02 03 04 05 0828. Allalla and Allaiii-Mlxl;; •• v) 153 153 153 153 653 M3
ICul and 10 be cui for hay • • • • • •27. Oraln
ICul and to be cui for hay'651 658 65lI 656 656 656• • • • • •
21. Offiii Hay 154 654 654 654 654 154ICul and to be cui for hay' • • • • • •
601 601 607 601 601 60734. DryEdibleaeana Plented and 10 be Dlanted • • • • • •..691 1111 181 181 681 19135. S!9at B!lI. Plenled and to be plln~ed • • • · • •••• ••• ••• 884 ••• •••31. Irt.h Potatoes Planled and to be pla!!led • • • • • •41. Olher Crop. Acre. Dlanted or In u.e --- --- --- --- --- ---• • • • • ·841 147 147 141 847 84142. Land In Summe, Fallow • • • • • •M7 657 857 M1 857 85743. Idle Cropland - Idle all durtng 1917 • · • • • •

SECTION D - CROPS AND LANDUSE ON TRACT(Conrd) A·5
Enumeralor L IEnleredTrlel Acr•• •__
N0"1
IELDNUMBER--00---
Tolll Acr••I~. 1m H -:--}
--FIELDNUMBER. •• a _. 01 10 Oltlce Ule~------- 21 140
..JJ~~lAcre.ln Field • • •2. Crop or La!!!!~!! (~y)
3. Occu21ed fI~!!!!t!~d or Dwe!!I!'JI XXXXXXXXXXXXXXXXXXXXXXX.t. W••••lls. WasiA. A•.••A. nU,.h ••• t,. 41 841 841 841• · • ·42 842 842 1425 P t J'!!~I!!!!'t - ~C!t!!'_'!;!!!2.J!!!ltlon • · • •. II ure 51 151 851 151
C~!!2!~!,d- U!!!! ~!!!y ,~~ 2~!!ure • · • ·--{] YEI o NO DYES II NO nYES fl NO IJ YES fI NOI. Two Crop. Planted In Ihl. Field lor hlf1lelt ..- ---.- .
thl. Yllr or two u.e. 01 the ume crop? 144 844 844 144· · · •1_ 61_ IL Il_
l. Acr•• Lelt to be Pllnted? g · · ·-- 1_- 1_- I_-II. Acree IRlgeted Ind 1It Crop .. · • •
10 be Irrigated? ----- ------- ------- ------- -------- 1_- 1_- I_-
2nd Cro•• • · · •!>50 !>50 !)50 !)50
8. Sprl"il Whelt ~a.!!t.l!.dJ~.JCL~ f!!!'!!!!... • · • ·------- ------- ------- ------Other Thin '16 '16 '16 '16
10. Durum For Grlln• · • ·!>!)3 m m M3
11. Planted Ind to be planted · · · •Durum Whelt ------------- ------- ------- ------- ------!>!>4 ~ ~ ~
12. For Grlln · · · •. --~-- -!>40 !)40 !)40 540
Pllnted · · · •13. Winter Wheat ------------ ------- ------- ------- ------541 !>41 !>41 541
14. For Grain · · · •!>4' !>4' !>4' !>4'
15. Planted Ind to be planled • · • •Rye ------------ ------- ------- ------- ------548 !>41 !)48 !>41
11. For Grain • · · •---533 533 W W
11. Pllntld and 10 be planlld · · • ·Oltl ------------ ------- ------- ------- ------!>34 !>34 !;34 !)34
11. For Grlln • · · •----535 5J!j 535 535
18. Planted Ind 10 be planlld • · · •Barley ------------ ------- ------- ------- -------!>3I 531 531 531
20. For Grain · · • •------ - - --- _.~--~-- ---- .~ .-. --- --!>30 530 !>JO 53021. ~~!!t!.d~!!~~~~! .e.1~'.!~ · · · •Corn ------- ------- ------- -------531 ~l' 531 5312!._______ For Grain • · · •- ----- - . - - - .-- ------- ..
25. Olher US8I 01 Grains Planled USIAcres ah.mcJonllll.
--- ~- ~- _"___1 . - . ~--~ .-
__ s!I~!J£....!!.!c !,,,~!S · · ·

FIELDNUMBER...... 07 01 09 ___ 10_H. - -------- .. -- ---- -------Allallaand AllallaMIIlufe. 153 1153 153 1153(C!!L!n~~ !l!~~!!Uor'!!rL • • • •27. Ifraln ll58 ll58 ll58 w(CuL!!!dl~_~ C!!'-'~LI!!r) • • • •21. OiharHay,,,, •• __ A In h. ",,1 In. havl ll54 654 ll54 154· • · ·601 601 601 60134. Dry ~dlbl! !I.~~!"I!,,!~!:!-!!!~lo!l! 21!!!!ed • · • •1111 &Ill &Ill 69135. '!!Iar B!!!! __ PI!!!!!da!!!U~-"!-21!!!!!d • • • •114 IB4 IB4 8114~~.J~!!.hJ~!!~!. PI!n!!~!"d lo!l!- (I!!!!!ed · • · •
.•• n.h•• ,..__• .•....•. , .... --- --- --- --• • • •141 141 141 1414!--1!nd InS!!.!!,~!!£!IIOW • • · •151 851 851 851~3. Id!eCr~!!'IL=J!:!le all d~!"IIJ~~7 • • • •
J>I
U'I

/Op.rator Lives: Refer to Section B. page J /0 check box.}
INSIDE ~ OUTSIDE
lIs HOGS-CROPS box checked on page 3?J
YES 0 NO· On June 1. did this operation own or manage cattle, that werelocated on land administered or controlled by a Public agency.Industrial corporation. or Grazing Association. on an AUM basis?
A-SSECTION E - ACRES OPERATED
YES
, TYPE of OPERATION , . , {IRefer to S~tion A, page 2.]
-8-
o NO· 100 to page 10, Section F.J
Individually Operated .. 0}.. 100 to item(j)J
Partnership or Joint 0Managed Land 0 100 to page 9, Item 3.}
Now I would like to ask you about the total acres you operate under this land arrangement.Include farmstead, all cropland, woodland, pastureland, wasteland and government program land.
On June I. HOW MANY ACRES DID THIS OPERATION:901
a. Own? . .0
b.c.
d.
902Rent from others? IExclude land used on an AUM basis}. .
Use on an AUM basis. which are administered or controlled by 1903Public agency, Industrial corporation or Grazing Association? {Include privateowned/rented lands that are administered by a PIOA agency thru Exchange-of-Use.} ...
Rent to others? {Include private owned/rented lands 1905administered or controled by a Pubiic agency thru Exchange-oj-Use} .
.0 +
Then the total acres operated under this arrangement are {item a + b + C _ dJ /900 .0 IDoes this include farmstead, all cropland, woodland.pastureland. wasteland and government program land?
DYES. IContinue]. 0 NO· {Make corrections and continueJ .
2. How many acres. of the total Icode box 9OO} acres operated. are in a 1704long term (10 years) Conservation Reserve Program (CRP)? .
28
.0 I

-9-SECTION E - ACRES OPERATED (cont'd)
3. Now I would like to ask you about the Total acres you operate as a hired manager.
How many acres of land do you operate for others 1904as a hired manager under this land arrangement? .............•........................
Does this include farmstead, all cropland, woodland,pastureland, wasteland and government program land?
DYES. [Continue.} 0 NO· [Make corrections and continue.}
A-S
.0 I
4.
5.
How many of these acres are administered or controlled by a Public agency 1906Industrial corporation or Grazing Association, which are used on an AUM basis? .(Include private managed lands administered by a PIGA agency thru Exchange-of-Use)
How many acres of land in this managed operation are in a 1706long term (10 years) Conservation Reserve Program ...............•....................
29
.0 I

A-5 -10-SECTION F· CROPS AND UTILIZATION ACREAGES ON ENTIRE OPERATION
Now I need to identify 1987 Crops and Land Use ... on allland operated ... both Inside and Outside the BLUE LINES.
1. On the total (page 8-9/ acres oJ'erated how manyacres would oe conSidered CROPLAND, including 1802Hay and cropland in government programs? 0 0 ••••• , ••••••••• .0 I
{If NONE, go to item 2b.}
I 1537How many acres of {crop} will this operation have? .
- [Go toItemW(Ask, if no crop]~b. What is the total acres of 1667
PASTURE on the Entire Operation? .Ilf no pasture, ask item 2c.J
2c. What percentage of 1986 Farm Sales (production) 1738came from acres INSIDE the BLUE liNE? 0-------
{If CROPLAND is NONE, skip to item 2b.J2. What Crop will have the largest acreage planted
and to be planted or used for 1987 Harvest? ...
2a.
G) lIs HOGS·CROPS box checked on page J.}f YES 0 NO •••[GotoItem4.1-------- ...••..._
3a. (Were Wheat, Oats, Barley, or Rye reported in the tract, on pages 4 • 7?)DYES· tenter a 1 in the 161 code box, then go to item 4.j~ NO
3b. On the total acres operated, was or will an'{ Wheat. Oats. Barley, or Ryebe planted, (for any purpose), for USE or HARVEST in 1987?
.0
Code
.0
.0
DYES . 1) 1161o DON'T KNOWN • 2 {Enter code} ..................•. _o NO • 3 {Then, go to item 4.J
30

- 11 -SECTION F· CROPS AND UTILIZATION ACREAGES ON ENTIRE OPERATION (Cont'd)
A-5
Operator lives: /Refer to Section B. page 3. to check box]
INSIDE 0 OUTSIDE = /Go to Section G.J---------~- Office use168
Unknown = 2Complete = 4
4.
I /Enter crop acresfrom item ]0. page 10 below.]
{Then continue with items 50 - 50.}
170 .0171 .0172 .0173 .0174 .0175 .0
176.0
177 .0178 I.0169
.0179 .0180 .0
5. On the /page 8-9] acres operated, what is the TOTAL Acreage Planted and to be Planted(include double cropped acres) for 1987 Harvest lor Acres Used in 1987, for the following:
. Ia. Corn (exclude Popcorn and Sweet Corn) ...•..........••........•.... Acres
b. Sorghum (exclude Sorghum· Sudan Crosses Acres
c. All Wheat (inclvde Winter, Spring, Durum Wheat Acres
d. Other Grains (include Oats, Barley, Rye, Rice) .......•................ Acres
e. Soybeans Acres
f. All Cotton (include Upland, American Pima) Acres
g. Alfalfa and Alfalfa Mixed Hay Acres
h. Other Hay (exclude Atalfa & Alfalfa mixes, and Grain Hay) Acres
i. Tobacco, All Types .......................•........................ Acres
j. Irish Potatoes Acres
k. Vegetables for Sale (Fresh and Processing) ........•................. Acres
I. Fruits, Citrus, Vines, Berries, Nut Trees Acres
m. Nursery products (include Sod Vines Mushrooms, 1181Vegetable Seeds, Flowers, Shrubs, Trees, etc.) Acres .0
n. Greenhouse Products (under glass or protective cover) Square Feet __18_2 .0_
o. Other Crops (Specify) Total 1 183(Acres) . .. . ,, .Acres ,
31
.0

-13 -
SECTION G - GRAINS IN STORAGE ON ENTIRE OPERATION
{Is HOGS·CROPS box checked on page 3.}~ YES 0 NO· {GotoSectionH.J------------- ~-
Now let's account for the whole grains on hand or in storageon June 1, 1987 on the total acres operated, whether for feed,seed, or sale. They may have belonged to you or someone else.
• 0 or were stored under a government program (loan. farmerowned reserve. or CCC).
1. On the total acres operated, were any of thefollowing whole grains on hand or in storageon June 1, 19877
NO
a. whole grain CORN, sheIled or ear corn 0
h. WINTER WHEAT 0
i. DURUM WHEAT 0
j. OTHER SPRING WHEAT 0
k. OATS .••............................. 0
I. BARLEY 0
YES
o - How many bushels? .
o - How many bushels? .
o -How many bushels? .
o 0 How many bushels? .
o - How many bushels? .
o - How many bushels? .
121
129
127
128
123
124
2. On June 1, what was the total storage capacity of all thebins, cribs, sheds, and other structures normally used to 1808store whole grains on the total acres operated? .. 0 •••••••••••••••••••••••••••••••••••••••• Bushels j
Stocks are:Incomplete
1 - HAS 1412 - Unknown3 - NO
Complete 4
32

A-5 - 14 -
SECTION H - HOGS AND PIGS ON ENTIRE FARM AND TRACT
Operator lives: {Refer to Section B, page 3, to check box.J9",INSIDE' {Complete Red and Black.J 0 OUTSIDE • {Is HOGS· CROPS box checked on page 3.Jf 0 YES 9 NO, Black Only
HOGS AND PIGS INVENTORY: T1. On June I, were there any hogs or pigs, regardless la. On June 1 were there any hogs or
of ownership, on the total acres pigs, regardless of ownership, insideoperated? {page 8-9J this blue tract boundary?
§ YesDon'tNo
YES t NO
2. Were any hogs or pigs on the total acresoperated, at anytime during the periodDecember 1, 1986 through May 31?
DYES . {Enter 1 in Code Box 492,then go to Item 7, Page 15.J
o NO· {Complete Item 2a, enter codein Code Box 492, then go toItem 15, page 15.J
DYES • {Complete Column B, then goto Section J.J
+NO· {Complete Item 2a, enter code
in Code Box 492, then go toSection J.J
23. Will there be any hogs or pigs on thetotal acres operated from now throughNovember 30, 19877
= 1} 1492know=2 .... _=3
Column AOn Total Acres
Operated
1301
How many were in each of the following four weight groups: I311a. Under 60 lbs., including pigs not yet weaned? ~------1-3-12------.
b. 60 - 119 lbs.? .............•.........••.•..•.....•.... ~ ------------1-3-13------.
c. 120 - 179 Ibs.? .......................•................ ~ -----------* '-3-14-----d. 180 Ibs. and over? ------
{Exclude hogs no longer used for breeding.J I300{Add * Items 3 + 4:J Then the total hogs and pigs on June 1 was? .------
Is that correct? 0 YES· {Continue.J 0 NO· {Make corrections and continue.J
Sa. Were any of the total hogs and pigs located in any of the fieldsand buildings Inside this blue tract boundary on June I 19877
1210
DYES. {Complete column B, Items 3-5.J 0 NO = 3 • {Enter code, go to Item 7J... _
Let's start with the HOGS and PIGS for BREEDINGon hand June 1. {Complete Column A first.J
3. How many of the breeding hogs and pigs were:
a. Sows, gilts and young gilts bred and to be bred? ~
Of the sows and gilts (reported in Item 3a)bow many are expected to farrow: ...--------
(I) During June, July, and August 19871.... 1_33_1 1
(2) During September, 1-33-2-------,October and November 1987? - ------- _-----~
b. Boars and young males for breeding? ~ 1302
1303
c. Sows and boars no longer used for breeding? ~
Now let's talk about the HOGS and PIGS for MARKET and HOME USE{Exclude breeding hogs already reported in Item 3.)
4.
S.
Column BOn Tract Acres
1201' I *
1211 *
1212 *
1213 *
1214 *
1200
33

-15 -
SECTION H - HOGS AND PIGS ON ENTIRE OPERATION (Cont'd)
FARROWINGS:
Now let's talk about sows and gilts that farrowed In the last six months.
7. How many sows and gilts farrowed during 1322December 1986 and January and February 1987? , ~------------------~
8. How man'y pigs from these ~ a. On hand June I? .. H •••••••••••••••••••••••• 1323
(Item 7) Imers were: 1-------------~--- 324
b. Had been sold or slaughtered? _
9. ~~~~~~r~oa~~ ~~y gli~\s7Jar~~~~~.~~~i.n.g , , " 1_3_26 _
1327
10. How man'y pigs from these ~a. On hand June I? _(Item 9) lmers were: ----------
_ b. Already sold? 1_3_28 _
PURCHASES:Now let's talk about hogs and pigs purchased In the last sIx months.
11. How many hogs and pigs purchased during the period of December I, 1986 1317through May 31, 1987 were on hand June I? {Include feeder pigs purchased.} .
DEATHS AFTER WEANING:
{
a. December 1986 and January 133413. How many weane~ pIgs. and February of this year? .
and older hogs dIed dunng: .
1335
b. March, April and May? .
lI
IS. {Complete Code Boxes for Hogs on Entire Operation,then go to Section I] .
ENUMERATOR NOTE: {Complete Code Box 499only when a "3"has been checked for Code Box 497.}
DATA QUALITY497
o 1 Completeo 2 Estimated/with
n/iab/t t:U"~t~--1!!L.ormation .o 3 Estimated/with Entire Firm Hogs
"0 CIIrrtnt PRESENCEInformation~ 499
o 1 Has Hogso 2 Unknowno 3 NO Hogs
34

state
# of tractsRowpercent-----I--Basis forweight-
~ I Pasture I ~I I
Totaltracts
AZ 189 55 136 38049.74 14.47 35.79
CD 319 124 19 46269.05 26.84 4.11
DE 62 14 16 9267.39 15.22 17.39
10 407 120 36 56372.29 21.31 6.39
MD 363 82 40 48574.85 16.91 8.25
Ml' 228 45 7 28081.43 16.07 2.50
NJ 269 76 19 36473.90 20.88 5.22
NM 174 121 38 33352.25 36.34 11.41
OR 336 276 29 64152.42 43.06 4.52
PA 568 144 62 77473.39 18.60 8.01
SC 305 118 50 47364.48 24.95 10.57
SO 162 22 7 19184.82 11.52 3.66
ur 334 120 16 47071.06 25.53 3.40
WY 125 29 54 20860.10 13.94 25.96
14 state 3841 1346 529 5716Total 67.20 23.55 9.25
35

AP.(lgIDD{ E: a::HIX>ITY ~, CDEFFICIENl'S OF VARIATICJil,AND SIGNIFICANCE u.vEIS BY STNlE
TIWI.E 1: Total Nlmlberof Hogs
a...wLAlity CV Operational CV Relative sig.state ~ghted % ~ghted % dif. 1/ level.on %
AZ 12,100 68.5 12,040 68.8 0.5 0.85CD 23,637 33.2 38,488 35.1 -38.6 0.12DE 2,762 47.2 4,411 36.9 -37.4 0.26ID 10,175 44.5 11,611 40.3 -12.4 0.24MD 49,147 49.7 46,888 48.5 4.8 0.64Ml' 20,823 54.9 20,274 50.8 2.7 0.77NJ 57,019 92.9 59,583 93.6 -4.3 0.37NM 7,804 62.6 8,068 60.6 -3.3 0.34OR 9,975 29.6 13,112 29.4 -23.9 0.11PA 146,239 36.3 144,339 37.7 1.3 0.79SC 101,351 27.2 84,097 23.3 20.5 0.45SD 186,183 38.7 215,570 39.1 -13.6 0.38ur 11,998 53.8 10,183 58.7 17.8 0.22WY 10,374 73.2 7,689 66.6 34.9 0.28
Total 649,586 17.3 676,352 17.8 -4.0 0.53
l/ Relative differerx:e =100 * (u....IIlI.:Ali.tvwtd. exoansion - ooerational wtd. exoansion)
operational wtd. expansion
36
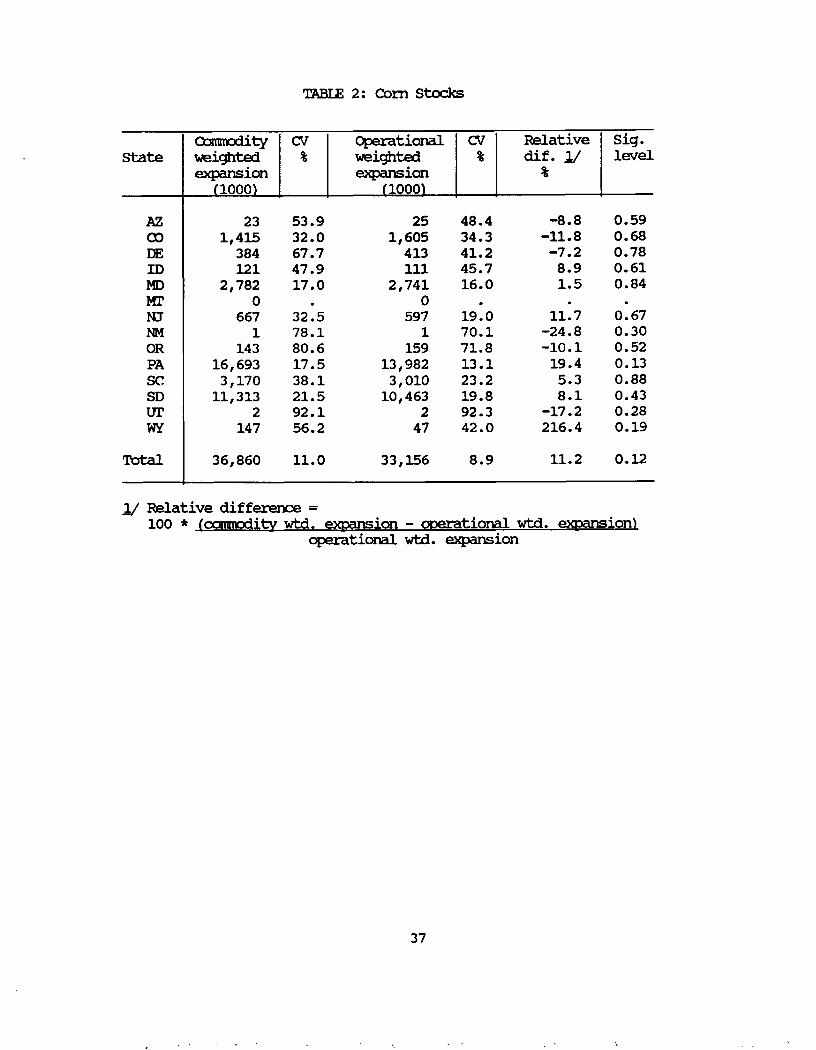
TABlE 2: Corn stocks
CcIl1lrodi.ty CV Operational CV Relative sig.state weighted % weighted % dif. l/ level
eJCPClllSion eJCPClllSion %(1000\ (1000l
AZ 23 53.9 25 48.4 -8.8 0.59CD 1,415 32.0 1,605 34.3 -11.8 0.68DE 384 67.7 413 41.2 -7.2 0.78m 121 47.9 111 45.7 8.9 0.61MD 2,782 17.0 2,741 16.0 1.5 0.84Ml' 0 . 0 . . .NJ 667 32.5 597 19.0 11.7 0.67NM 1 78.1 1 70.1 -24.8 0.30OR 143 80.6 159 71.8 -10.1 0.52PA 16,693 17.5 13,982 13.1 19.4 0.13SC 3,170 38.1 3,010 23.2 5.3 0.88so 11,313 21.5 10,463 19.8 8.1 0.43ill 2 92.1 2 92.3 -17.2 0.28W'l 147 56.2 47 42.0 216.4 0.19
Total 36,860 11.0 33,156 8.9 11.2 0.12
l/ Relative difference =100 * (UAllllwitv wtd. expansion - ocerational wtd. expansion)
operational wtd. eJCPClllSion
37

TABlE3: Soybean stocks
CUullOOity CV ~tional CV Relative sig.state weighted % weighted % dif. 1/ level
expansion expansion %(1000) (1000)
DE 222 65.3 202 51.6 9.5 0.73Me 60 73.2 35 53.2 72.6 0.33N1 53 86.6 50 86.7 5.9 0.25PA 33 58.8 33 54.6 -2.2 0.78SC 996 96.8 342 68.8 190.9 0.38SO 164 4900 241 41.5 -32.2 0.31
Total 1,527 64.2 905 31.1 68.8 0.41
l/ Relative difference =100 * (l,.;UlllllLAlitywtd. expansion - OPerational wtd. exoansion)
operational wtd. expansion
TABlE4: All Wheat stocks
CUlalLAlity CV ~tional CV Relative sig.state weighted % weighted % dif. l/ level
expansion expansion %{1000' (1000)
AZ 0 . 0 . . .CX> 2,248 57.1 2,222 40.6 1.1 0.97IO 3,280 23.3 4,792 25.2 -31.5 0.14Me 13 55.0 13 60.7 0.0 1.00MI' 9,839 19.1 9,743 21.9 1.0 0.94N1 3 69.4 4 79.1 -34.4 0.31NM 72 42.4 417 71.0 -82.7 0.24OR 212 67.0 519 61.0 -59.0 0.25PA 71 39.1 80 36.5 -10.5 0.14SC 92 49.8 96 38.7 -4.3 0.89SO 2,940 26.3 2,615 23.4 12.4 0.57or 344 50.8 226 27.8 52.2 0.35WY 370 53.6 322 55.8 14.9 0.62
Total 19,484 13.0 21,047 13.0 -7.4 0.42
1/ Relative difference =100 * (Cutllliolitv wtd. exoansion - OPerational wtd. exoansion)
operational wtd. expansion
38

TABlE 5: Grain stock Capacity
a...11l1J.Ality CV Operational CV Relative sig.state weighted % weighted % dif • .1/ level
expansion expansion %-(1000\ (1000\
AZ 48 46.0 33 32.3 45.3 0.39CO 40,863 22.3 51,591 24.0 -20.8 0.24DE 1,780 43.5 2,117 37.3 -15.9 0.25ID 37,017 15.6 37,055 15.5 -0.1 0.99MD 19,124 19.2 17,257 17.9 10.8 0.06Mr 87,744 17.6 77,430 13.6 13.3 0.26NT 3,847 31.1 3,882 28.7 -0.9 0.94NM 849 40.9 828 40.4 2.5 0.81OR 9,261 30.8 9,790 27.8 -5.4 0.80PA 57,076 9.3 53,610 9.4 6.5 0.23SC 23,671 27.0 21,374 21.3 10.7 0.67SO 56,718 13.3 54,793 11.8 3.5 0.60or 14,449 26.4 8,888 14.9 62.6 0.08WY 9,280 27.3 7,867 29.5 18.0 0.25
Total 361,725 6.3 346,516 5.9 4.4 0.33
Y Relative difference =100 * (\.A.llllllloditvwtd. exoansion - ooerational wtd. exoansion)
operational wtd. expansion
39

TABlE 6: Number of Fanns
a....llllLA1ity OJ Operational OJ Relative sig. RFO ~Relativestate weighted % weighted % dif. Y level
ion ion %expansion % dif. Y
AZ 5,595 16.5 5,542 16.5 1.0 0.46 6,084 18.7 -8.0CX) 17,157 11.8 16,277 11.9 5.4 0.08 13,531 14.8 26.8DE 1,908 13.2 1,882 13.2 1.4 0.70 1,653 17.3 15.4IO 14,357 13.7 13,756 13.4 4.4 0009 12,161 14.5 18.1MD 9,982 7.1 9,235 7.3 8.1 <.01* 7,763 7.9 28.6Ml' 12,823 19.0 11,899 18.7 7.8 0.06 10,298 20.8 24.5N.J 4,372 8.0 4,148 7.8 5.4 0.01* 3,369 9.1 29.8NM 5,640 19.1 5,538 19.1 1.8 0.43 4,300 22.0 31.2OR 28,117 9.3 26,763 9.5 5.1 0.02* 25,197 9.9 11.6PA 37,254 6.4 35,170 6.3 5.9 0.02* 32,606 7.1 14.3SC 22,373 8.4 21,747 7.8 2.9 0.41 17,795 10.0 25.7SO 8,797 10.9 8,714 10.3 1.0 0.81 6,589 16.9 33.5ur 6,898 12.2 6,367 11.9 8.3 0.03* 4 ,122 14.4 67.3Wi 4,152 27.0 3,982 36.3 4.3 0.69 2,601 20.4 59.6
Total 179,425 3.3 171,018 3.3 4.9 <.01* 148,069 3.8 21.2
y Relative difference 1=100 * (UAIIlI.:Alitvweighted exoansion - ooerational weighted exoansion)
operational weighted expansion
y Relative difference 2 =100 * (~lI11LA1itvwtd. exoansion - RFUexoansion)
RFUexpansion
* denotes differences that are significant at a = .05.
40

TABIE7: I.arrl in Fanns
CulllllLUity CV Operational CV Relative sig. Rro CV Relativestate weighted % tract % dif. Y level expansion % dif. Y
expansion expansion % %(1000) (1000l
AZ 21,761 4.6 20,782 3.2 4.7 0.21 23,770 7.0 -8.5CX) 20,109 17.8 11,703 10.3 71.8 0.01* 6,790 24.1 196.2DE 160 18.9 162 15.6 -0.8 0.93 134 32.3 19.5ID 4,277 12.4 3,272 11.9 30.7 <.01* 2,718 17.1 57.3MD 1,021 9.3 927 8.0 10.1 0.09 790 14.0 29.2Ml' 17,776 30.5 12,309 14.7 44.4 0.26 10,902 39.9 63.1NT 337 10.5 301 8.7 12.0 0.06 224 15.0 50.2NM 6,285 28.9 5,850 30.1 7.4 0.31 3,649 38.4 72.2OR 10,464 40.3 5,377 22.8 94.6 0.18 5,246 23.2 99.5PA 4,186 16.6 3,106 6.8 34.8 0.09 4,175 27.0 0.3SC 3,361 16.1 2,684 8.3 25.2 0.17 2,330 31.4 44.2SD 6,261 20.9 5,882 14.1 6.5 0.73 5,248 33.6 19.3ur 2,639 30.7 1,175 25.4 124 •6 0.02* 558 26.6 373.2WY 8,058 32.1 5,172 23.2 55.8 0.22 2,051 46.3 292.8
Total 106,695 8.1 78,701 4.4 35.6 <.01* 68,586 8.5 55.6
y Relative difference 1=100 * (l,.;U1L1uLUitvweiahted exoansion - ooerational tract exoansionl
operational tract expansion
Y Relative difference 2 =100 * (1,.;U111l1J..Alitvwtd. expansion - RFO exoansionl
RFO expansion
* denotes differences that are significant at a = .05.
41
Related Documents