14 March 2018 Five years into its strategy, there is plenty for Greggs to do. Its shops, which all now look and work like value food-on-the-go outlets, must spread out from their high street origins. Its manufacturing bases are being transformed, at substantial projected returns. But most importantly, its wide-ranging food offer will take time to be known by non-customers, we believe. Their gradual buy-in should provide a tailwind to Greggs’ mission to gain share. Year end Revenue (£m) PBT* (£m) EPS* (p) DPS (p) P/E (x) Yield (%) 12/16 894.2 80.3 62.0 31.0 19.6 2.6 12/17 960.0 81.8 64.5 32.3 18.8 2.7 12/18e 1,027.0 85.5 66.5 33.3 18.3 2.7 12/19e 1,105.5 91.0 71.6 35.8 17.0 2.9 Note: *PBT and EPS are normalised, excluding amortisation of acquired intangibles, exceptional items and share-based payments. Food-on-the-go strategy goes on Where next for Greggs’ strategy, now that the entire estate has been repurposed on the food-on-the-go operating model? The full answer to this references the fourfold strategy as a whole: not only the shops, but also the food offer, the supply chain project, and the enabling of service through support systems. It is through these enhancements that the brand is aiming to become the customer’s favourite for food-on-the-go, with the share gains that implies. The estate is still developing with non-retail locations such as transport hubs; the food offer is pushing boundaries with, for instance hot food, creating the possibility of evening opening, and the supply chain project is entering its heaviest investment phase, with substantial returns to come according to the company’s projections. Supply chain enhances both value and convenience Greggs’ brand is founded on convenience and value, and the rationalisation of its manufacturing bases into product specialisation centres should enhance both by providing a reliable supply of quality products at lower economic cost. Management expects the five-year project to provide annualised returns on investment of 23%. It is just entering its third year with a peak investment of £37m. Brand transformation that is a slow burn Greggs is a well-loved national brand, but unlike other brand transformation stories, does not advertise its new identity above the line. As a result, we believe non- customers will be relatively slow to understand the transformation of the brand. In one sense this is an advantage since it implies investment in the brand will have a relatively long and sustained return. Valuation: Stable growth and yield not fully valued Our valuation approach adds peer comparison to the DCF metric: comparisons are not exact but, like consumers, investors have a choice in the space. Our DCF values the shares at 1,536p, our peer comparison at 1,335p. Our blended valuation is therefore 1,436p (previously 1,226p), implying a FY18e P/E multiple of 21.6x and EV/EBITDA of 8.6x, undemanding given Greggs’ stable growth and yield prospects. Greggs Final results Value discovery Price 1,215p Market cap £1,230m Net cash (£m) at December 2017 54.5 Shares in issue 101.2m Free float 100% Code GRG Primary exchange LSE Secondary exchange N/A Share price performance % 1m 3m 12m Abs (4.8) (9.9) 18.8 Rel (local) (5.9) (7.1) 18.9 52-week high/low 1399.0p 1002.0p Business description With over 1,800 shops, nine regional bakeries and 19,500 employees, Greggs is the UK’s leading ‘bakery food-on-the-go’ retailer. It utilises vertical integration to offer differentiated products at competitive prices Next events AGM trading update 9 May 2018 Interim results 31 July 2018 Analysts Paul Hickman +44 (0)20 3681 2501 Neil Shah +44 (0)20 3681 5700 [email protected] Edison profile page Retail Greggs is a research client of Edison Investment Research Limited

Welcome message from author
This document is posted to help you gain knowledge. Please leave a comment to let me know what you think about it! Share it to your friends and learn new things together.
Transcript

14 March 2018 Five years into its strategy, there is plenty for Greggs to do. Its shops,
which all now look and work like value food-on-the-go outlets, must spread
out from their high street origins. Its manufacturing bases are being
transformed, at substantial projected returns. But most importantly, its
wide-ranging food offer will take time to be known by non-customers, we
believe. Their gradual buy-in should provide a tailwind to Greggs’ mission
to gain share.
Year end Revenue
(£m) PBT* (£m)
EPS* (p)
DPS (p)
P/E (x)
Yield (%)
12/16 894.2 80.3 62.0 31.0 19.6 2.6
12/17 960.0 81.8 64.5 32.3 18.8 2.7
12/18e 1,027.0 85.5 66.5 33.3 18.3 2.7
12/19e 1,105.5 91.0 71.6 35.8 17.0 2.9
Note: *PBT and EPS are normalised, excluding amortisation of acquired intangibles, exceptional items and share-based payments.
Food-on-the-go strategy goes on
Where next for Greggs’ strategy, now that the entire estate has been repurposed
on the food-on-the-go operating model? The full answer to this references the
fourfold strategy as a whole: not only the shops, but also the food offer, the supply
chain project, and the enabling of service through support systems. It is through
these enhancements that the brand is aiming to become the customer’s favourite
for food-on-the-go, with the share gains that implies. The estate is still developing
with non-retail locations such as transport hubs; the food offer is pushing
boundaries with, for instance hot food, creating the possibility of evening opening,
and the supply chain project is entering its heaviest investment phase, with
substantial returns to come according to the company’s projections.
Supply chain enhances both value and convenience
Greggs’ brand is founded on convenience and value, and the rationalisation of its
manufacturing bases into product specialisation centres should enhance both by
providing a reliable supply of quality products at lower economic cost. Management
expects the five-year project to provide annualised returns on investment of 23%. It
is just entering its third year with a peak investment of £37m.
Brand transformation that is a slow burn
Greggs is a well-loved national brand, but unlike other brand transformation stories,
does not advertise its new identity above the line. As a result, we believe non-
customers will be relatively slow to understand the transformation of the brand. In
one sense this is an advantage since it implies investment in the brand will have a
relatively long and sustained return.
Valuation: Stable growth and yield not fully valued
Our valuation approach adds peer comparison to the DCF metric: comparisons are
not exact but, like consumers, investors have a choice in the space. Our DCF
values the shares at 1,536p, our peer comparison at 1,335p. Our blended valuation
is therefore 1,436p (previously 1,226p), implying a FY18e P/E multiple of 21.6x and
EV/EBITDA of 8.6x, undemanding given Greggs’ stable growth and yield prospects.
Greggs Final results
Value discovery
Price 1,215p
Market cap £1,230m
Net cash (£m) at December 2017 54.5
Shares in issue 101.2m
Free float 100%
Code GRG
Primary exchange LSE
Secondary exchange N/A
Share price performance
% 1m 3m 12m
Abs (4.8) (9.9) 18.8
Rel (local) (5.9) (7.1) 18.9
52-week high/low 1399.0p 1002.0p
Business description
With over 1,800 shops, nine regional bakeries and
19,500 employees, Greggs is the UK’s leading
‘bakery food-on-the-go’ retailer. It utilises vertical
integration to offer differentiated products at
competitive prices
Next events
AGM trading update 9 May 2018
Interim results 31 July 2018
Analysts
Paul Hickman +44 (0)20 3681 2501
Neil Shah +44 (0)20 3681 5700
Edison profile page
Retail
Greggs is a research client of
Edison Investment Research
Limited
Greggs | 14 March 2018 2
Investment summary
Company description: Food-on-the-go specialist
Over the past five years Greggs has transformed itself from a national bakery chain into a food-on-
the-go retailer with a broad offering. There are four strategic pillars supporting the current aim of
becoming the customers' favourite for food-on-the-go. These are: (1) great-tasting freshly
prepared food; (2) the best customer experience; (3) competitive supply chain; and (4) first-class
support teams. Greggs has widened its food range to encompass healthy options such as salads
and wraps, as well as its traditional baked products. It has developed competitive hot drinks and is
extending its hot food ranges, giving the potential for evening opening. Substantially the whole
estate has been repurposed to the food-on-the-go operating model and image, and a modernisation
of the supply chain is approaching its peak investment phase. A major SAP development is
streamlining support functions, and a central stock ordering system relieves store staff of clerical
distraction while reducing cost. Greggs does not advertise above the line, and as a result we
believe non-customers will be relatively slow to understand the transformation of the brand. In a
way this is an advantage since it implies investment in the brand will have a relatively long and
sustained return.
Financials: Solid earnings growth, strong cash and yield
Greggs has a good record of like-for-like sales growth, averaging 3.5% over the last two years. In
2017 our expectations were met with 7.4% revenue growth to £960m and, after successful
management of inflationary pressures, 4.7% growth in operating profit to £81.7m. Our trading
forecast for 2018 is slightly upgraded by 2% at the PBT level, although higher tax means that our
EPS forecast is barely changed. We forecast EPS growth of 3.2%, 7.6% and 8.6% over the next
three years. Greggs has a strong balance sheet with £54.5m net cash at December 2017: after a
high level of capital investment in the estate and particularly the supply chain in 2018, we still
forecast £40m net cash by the end of 2018. The dividend yields 2.7% and there is a progressive
dividend policy, with the potential for special dividends to be paid if there is excess cash.
Sensitivities: Consumer economy and retail landscape
We see the main sensitivities as:
Challenges within the consumer economy.
Resurgence of input, including currency and regulatory cost pressures.
Marginalisation of terrestrial retail locations faster than management can act to relocate.
Execution risk from the supply chain programme, and concentration of supply sites.
Changes to immigration policy causing labour shortages and cost increases.
Valuation: Peer comparisons and DCF blend to 1,436p
We add a peer comparison to our previous DCF valuation metric. On a DCF basis, we apply a 6.9%
cost of equity (previously 5.1%), with a 2% perpetuity growth rate (previously a terminal multiple of
8 times). As a result of these assumptions we now define a valuation of 1,536p per share
(previously 1,226p). Against a disparate multi-site retail peer group, Greggs stands at a c 20%
premium on a P/E basis, and a c 16% discount on EV/EBITDA and EV/sales measures. Adjusting
to peer group averages for both forecast years would produce a valuation of 1,051p on a P/E basis,
1489p on an EV/EBITDA basis and 1,465p on an EV/sales basis. These in turn average to 1,335p.
Our blended valuation is therefore 1,436p (previously 1,226p), implying an FY18e P/E multiple of
21.6x and EV/EBITDA of 8.6x.

Greggs | 14 March 2018 3
Company description: Next phase of strategy
With origins in local bakeries, Greggs adopted a strategy in 2013 of transforming itself into a value
food-on-the-go retailer. This has now evolved to the current aim of becoming the customers'
favourite for food-on-the-go.
Greggs’ strategy is built on four pillars:
1. Great-tasting freshly prepared food: Greggs seeks to differentiate itself by highlighting high-
quality and freshly prepared food, which is also competitively priced in the value market.
2. Best customer experience: the key elements are service and convenience. Convenience is
strongly defined by location as well as format, areas of strong focus. Service needs to be
simple and straightforward, and the company focuses on its in-store processes.
3. Competitive supply chain: hand-in-hand with the developing estate, Greggs is working to
rationalise what used to be a regional bakery estate into centres for national production of its
major product lines.
4. First class support teams: the support function is largely governed by systems, where the
company is implementing SAP throughout the organisation.
We go on to examine where the company is now and where it is going on the main planks of its
strategy.
Fresh food offer: Meeting wider consumer needs
Greggs has purposefully evolved its food selection to appeal to a wider range of customers, while
retaining existing ones.
Exhibit 1: Examples of current products
Source: Greggs
Non-traditional ranges adopted as part of the strategy include:
Healthy ranges: Greggs aims to be at the forefront of the battle to reduce sugars, salt and fats
in food-on-the-go (FOTG) products. The company formalised its Balanced Choice sub brand in
mid-2014 representing meals containing less than 400 calories, creating new focus on what
had previously been a relatively small range of options. Currently, the store fit-out reflects
significant shelf area devoted to Balanced Choice, and the range is seeing high single-digit
growth (healthy options more widely defined are growing in double digits).
Breakfast: Greggs has for many years maintained a value meal deal for breakfast, which is
competitive against alternative vendors. It has progressively rolled out the options and now for
example offers croissants, porridge and wraps, as well as sausage and bacon rolls. The
standard offer of a sausage and egg roll and a hot drink recently increased in price from £2 to
£2.25, but is still competitive against McDonald’s, for example. The development of the
breakfast range is a significant step in the move towards relative balance between dayparts.

Greggs | 14 March 2018 4
Hot drinks: the company has targeted coffee shops in its upgrade of coffee and other hot
drinks. Significant investment in additional coffee machines has driven speed of service and
choice extension. Coffee is an example of a product that can pull in new customers to
experience store interiors.
Hot food: while Greggs has always had the equipment to heat traditional baked product such
as sausage rolls, bacon and sausages, the extension of the range opens up new sources of
business. Examples of range extension have been soups, hot sandwiches, and burritos. While
the move into hot food creates challenges in terms of workflows and prompt customer service,
these are not insurmountable, and there is a major medium-term opportunity for extension into
evening opening when the stores are traditionally closed, creating the potential for
transformation in utilisation of the store asset.
The experience: Convenience, location and format
Store repurposing
Greggs has made decisive progress in moving its offer from that of a high street baker to the
current food-on-the-go brand. The store refurbishment objective has been emphatically achieved,
with substantially all its sites now refurbished on a food-on-the-go format.
Exhibit 2: Greggs pre-2013 – a high street bakery
Exhibit 3: Greggs contemporary format – value food-on-the-go
Source: Greggs Source: Greggs
Location and market shift
Active estate management has resulted in gross churn of 46% of the estate since 2012:
Exhibit 4: Gross estate churn 2013-17
Source: Greggs
136257
453
677849
1671 1650 1698 17641854
2013 2014 2015 2016 2017
Gross churn Total estate
Greggs | 14 March 2018 5
The emphasis within estate development is now shifting to locate the brand in its most appropriate
market. This is not necessarily on high streets, and 34% of the estate, some 630 stores, are now
located in travel and workplace locations, up from 20% in 2012. These include transport hubs, bus
stations, train stations, petrol stations, office developments and drive-thrus. In March 2018 Greggs
opened its first shop on the London Tube, at Westminster, and there is scope for this to be followed
by others. In addition, the medium-term objective is for 40% of the estate to be in such locations.
Greggs is expanding its geography to new territory such as the county of Devon, and is adding to
its footprint in Northern Ireland, currently 10. The business model is evolving, with 202 shops now
trading in franchise formats, an increase of 45 in the year. Franchise offers some protection from
reduction of footfall in traditional retail locations.
Looking forward, management sees potential in digital order pads of the kind adopted by
McDonald’s, although these would be subject to appropriate system changes. In addition, delivery
trials are underway with Uber, which could result in further revenue opportunities.
Competitive supply chain: Modernisation, rationalisation
In March 2017 Greggs announced a substantial programme to upgrade its national manufacturing
and distribution infrastructure. Over five years, the £100m investment programme aims to create
additional national manufacturing centres of excellence and increase capacity to serve more than
2,000 outlets. The plan is to create national centres of excellence in specified products, capturing
national economies of scale and ensuring consistency of product quality across the brand.
In 2016 Greggs opened a new distribution centre in Enfield, and closed bakeries at Twickenham
and Sleaford that were unsuitable for upgrade. In 2017 the company completed the transfer of its
Edinburgh operations to its Glasgow bakery, which has been extended to become a centre of
excellence for Yum Yum production. The Leeds bakery has been extended to create a centre of
excellence for cake and muffin manufacturing. 2018 will be the peak year for investment, including
the creation of a centre of excellence for doughnuts at the Gosforth Park bakery.
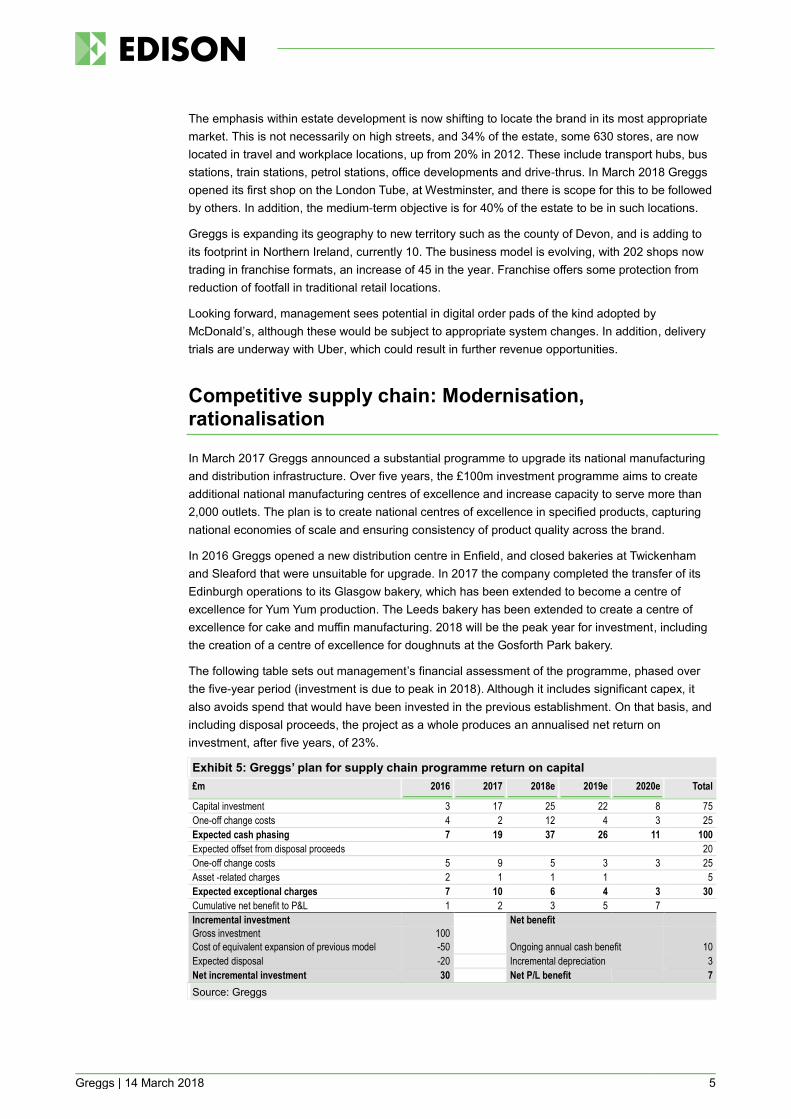
The following table sets out management’s financial assessment of the programme, phased over
the five-year period (investment is due to peak in 2018). Although it includes significant capex, it
also avoids spend that would have been invested in the previous establishment. On that basis, and
including disposal proceeds, the project as a whole produces an annualised net return on
investment, after five years, of 23%.
Exhibit 5: Greggs’ plan for supply chain programme return on capital
£m 2016 2017 2018e 2019e 2020e Total
Capital investment 3 17 25 22 8 75
One-off change costs 4 2 12 4 3 25
Expected cash phasing 7 19 37 26 11 100
Expected offset from disposal proceeds 20
One-off change costs 5 9 5 3 3 25
Asset -related charges 2 1 1 1 5
Expected exceptional charges 7 10 6 4 3 30
Cumulative net benefit to P&L 1 2 3 5 7
Incremental investment Net benefit
Gross investment 100
Cost of equivalent expansion of previous model -50 Ongoing annual cash benefit 10
Expected disposal -20 Incremental depreciation 3
Net incremental investment 30 Net P/L benefit 7
Source: Greggs

Greggs | 14 March 2018 6
First-class support teams
Greggs’ vision of FOTG depends crucially on prompt and efficient service. This is particularly
important in Greggs’ small physical format. While management is working to even out differential
demand between dayparts, queues at busy times such as lunchtime remain common and there is
an obvious risk of losing customers as well as causing dissatisfaction. Conversely, an improved rate
of service can directly contribute to revenue.
Greggs invests in technology and processes to free staff time to devote to customer service, as well
as to reduce absolute cost. The supply chain investments covered above should support
progressive improvement in stock availability. Following the deployment of SAP Finance in FY16,
the company successfully rolled out its central forecasting and replenishment process in FY17,
replacing traditional, shop-based, manual ordering processes. This brings benefits in terms of
improved product availability, and management expects lower wastage as staff become more
experienced with the system's capabilities. In addition, the system should bring staff efficiency and
better customer service by freeing store staff from a regular clerical exercise. In 2018 the remaining
SAP support modules, human resources, payroll and property management, are to be
implemented.
Brand image: Little-known transformation
Greggs is a national brand: its footprint of 1,854 stores compares well with competitors such as
Marks & Spencer (c 1,000), Morrisons (c 500) and MacDonald’s (c 1,200). The comparison is not
exact, but Greggs management considers its competitive set to be supermarkets, convenience
stores, delivery outlets and coffee shops (in that order).
While customers’ acceptance of Greggs’ wider and more contemporary offer is reflected in its
consistently improving like-for-like sales, we think wider awareness of the change in the brand
among non-customers is likely to be a slow burn.
Greggs does invest in marketing on social media. It has 685,000 followers on Facebook, 139,000
on Twitter and 15,000 on Instagram. Its social media sites are managed to generate a flow of ‘fun’
content. They typically publicise product offers, promotions and events, examples being free coffee
with a local newspaper, or dinner for two at Greggs on Valentine’s Day. They also serve as a
channel for customer reaction both negative and positive to the company’s products and service,
giving a valuable opportunity for dialogue with the customer.
Unlike competitors such as McDonald’s, Tesco, and Domino’s Pizza, Greggs does not invest in
above-the-line advertising. Management takes the view that direct sight, word of mouth and social
media channels are a more cost-effective and efficient method. However, these channels are also
slower than above-the-line advertising and, like any fast-changing offer, it takes non-customers
longer to appreciate that the offer may now be relevant to them. It is also true that increasing
frequency of visits among existing customers is a relatively easy target, which it would be
inadvisable to ignore.
It is beyond the scope of this note to gauge the effect of direct advertising on a brand repositioning
exercise, but logic dictates that there is one, and Burberry, McDonald’s and Tesco are among major
companies that thought it advisable to communicate brand repositioning using the media. We make
three deductions:
1. Greggs’ widespread shop presence, communicating the food-on-the-go image, is undoubtedly
helpful in showing non-customers as well as customers what the brand represents.
2. The move to new locations is likely to attract the attention of further new customers.

Greggs | 14 March 2018 7
3. However, without above-the line advertising, the message will take longer to percolate into the
national consciousness.
This is good and bad for the company’s prospects. The benefit of changed market perceptions may
take longer to be reflected in the top line. However, the significant costs of above-the-line
advertising are avoided.
Management analyses that its shop investments currently pay back in two years for a relocated
shop and three years for a new shop (both take an additional year when the supply chain is taken
into account). In addition, improving brand perception should pull in new customers over time,
enhancing like-for-likes and lengthening investment returns.
Greggs’ market: On-the-go value food
We consider Greggs in the context of the eating out market and also as a value food retailer.
The UK eating out market: Mind the definitions
Eating out in the UK is a £95bn market, which has grown strongly in recent years:
Exhibit 6: Out-of-home food market growth (£bn)
Source: ONS. Note: Year to September, current prices. Annual growth % shown.
However, what was once a well-defined restaurant market has fragmented under the influence of
lifestyle changes, time shortage and cost pressures. As the market develops, there is an increasing
distinction between three categories: dine-in restaurants, takeaway and delivery.
Dine-in model under threat
Traditional terrestrial, sit-down restaurant models are being threatened by over-supply and at best
flat demand, while margins have been threatened by higher food, labour and rent costs. The
Restaurant Group, which first signalled trading problems in January 2016, recorded like-for-like
sales down 3.9% for that year and 3.0% for 2017. Following a review, the company identified the
loss of value-conscious customers as the primary cause, resulting from significant price increases
and the removal of popular value offers. Byron, the premium hamburger restaurant, entered a
restructuring deal in January 2018 in which 20 of its 67 restaurants will probably close. Jamie’s
restaurant organisation also announced in January 2018 that 12 of its 37 outlets would close.
Delivery sales model positive
By contrast, Domino’s Pizza increased like-for-like sales by 4.8% in 2017. Just Eat’s app-based
delivery operation recorded 40% UK revenue growth in 2016 and 27% at interim in June 2017. We
believe the Just Eat example, while relevant to the sector as a whole, should be treated with
caution. Just Eat, like its more premium competitors, Deliveroo and UberEats, is a platform for
1.2%
3.8%
2.1%4.7%
7.0%
75
80
85
90
95
100
Sept 13 Sept 14 Sept 15 Sept 16 Sept 17

Greggs | 14 March 2018 8
home delivery, which tends to convert existing takeaway and dine-in restaurants to its model to the
extent they participate. This is not necessarily relevant to Greggs, whose customers are already out
and about.
Takeaway model is robust
The takeaway sector itself has performed strongly. The number of dedicated takeaway outlets
increased by almost 10% between 2013 and 2015, to 36,855. Spending on takeaways grew to
£9.9bn in 2016, up 34% since 2009 (according to research commissioned by Just Eat). It is forecast
to grow by a CAGR of 2.6% to reach £11.2bn by 2021. On this basis, Greggs would be supplying
c 10% of the market, which seems questionable.
Not all commentators reflect the distinction between delivery and food-on-the-go, but MCA has
publicised the forecast from its Food-to-go report that this market will grow by 2.8% in 2018, despite
the headwinds facing the consumer economy. BFFF, the UK’s frozen food association, presented to
its conference in June 2017 that food-to-go is growing 16 times faster than grocery, at 6.5%, and is
forecast to continue growing at a CAGR of 6.2% to £21.7m in 2021. On that basis, Greggs currently
has around 6% of the market.
While Greggs retains some seating, it is predominantly a takeaway operation, as the company’s
strapline food-on-the-go indicates. In this way it is different from either dine-in or delivery models.
Following refurbishments over the last five years, the vast majority of the Greggs shop estate now
operates in a food-on-the-go format. To the extent it is represented on high streets it is exposed to
declines in terrestrial shopping footfall. However, the company is taking action to address this, with
increasing presence in workplace, travel and leisure locations.
In addition, the rebalancing of the offer towards food-on-the-go itself means that revenue is not so
dependent on high street shoppers, as the customer base increasingly consists of working people,
including those who are on the move in their jobs.
Greggs social media presence
In 2016 the company relaunched Greggs Rewards, its digital loyalty scheme. Greggs Rewards
includes an app which customers can scan in the shop to get free coffee and other products. The
app extends payment options through a reloadable account. Greggs Rewards has now been
upgraded to include satisfaction ratings and is growing rapidly, providing better information on
customers and so helping the company meet their needs.
As noted on page 5 above, a trial partnership for ‘click and deliver’ with Uber is being tested under
the name Greggs Delivered. If rolled out, this would expand the scope of social media to Greggs’
business model.
Greggs within the value retail market
Another relevant dimension in which to view Greggs’ market presence is that of value food retail, its
London Stock Exchange sector. With 2018 CPI inflation forecast at 2.4%, real household income
growth at 1% (source: BoE), and personal borrowing set for some degree of correction driven by
interest rate rises, consumers are increasingly under pressure. While staple food and drink is to
some extent insulated from pressures affecting discretionary purchases, even here the consumer
faces challenges. It is well known that value food retailers are gaining market share from traditional
supermarkets. In the two years to December 2017, a group made up of Aldi, Lidl and Asda
increased UK market share by 1.2% to 27.1%, whereas Tesco, Sainsbury’s and Waitrose slipped
0.9% to 44.4%, according to Kantar’s online indicator.

Greggs | 14 March 2018 9
Management: Energetic and task driven
The team under Roger Whiteside has engaged with the change task with a sense of conviction and
urgency. Whiteside is a career retailer originally from Marks & Spencer, where he acquired
experience of operating multi-site food retail. He was on the founding team at Ocado, and CEO of
Threshers before joining Punch Taverns. On becoming CEO of Greggs in 2013, he set out his
vision for the brand’s transformation, which has since become his mission.
Sensitivities: Consumer economy and retail landscape
Greggs is clearly exposed to a challenged consumer economy. Consumer confidence has been
on a downward trend since late 2015, and we believe that rises in real disposable income
during calendar 2018 will be small, while inflation, though moderating slightly, will still be
substantial compared to many consumers’ experience of the economy over the last five years.
In addition, rising interest rates are deliberately intended to curb consumer borrowing. While
Greggs’ value offer may mean that it gains market share, this may not be enough to offset
macro declines in consumer spend. Operational gearing is high:
Exhibit 7: Greggs’ operational leverage (gross/operating margin)
2014 2015 2016 2017 2018e
Gross margin 62.2% 63.5% 63.7% 63.7% 63.7%
Operating margin 7.2% 8.7% 9.0% 8.6% 8.3%
Operational leverage 8.6 7.3 7.1 7.4 7.6
Source: Greggs, Edison Investment Research
We assume in our model that FY17 marked the peak of input cost pressures, but it is possible
that commodity or currency prices could move against Greggs and, critically, the rest of the
sector again in FY18e. Clearly, a recovery in sterling’s value or weakness in commodity prices
would have the opposite, positive effect.
Greggs has been focusing its store expansion plans on sites away from traditional shopping
locations. Non-high street locations now represent 34% of the estate and Greggs sees this
increasing to 40%. This is a necessary reaction to the reality that many traditional retail
locations will be marginalised due to terrestrial shopping models becoming uncompetitive.
Although Greggs’ estate policy as well as the change in its market offer addresses this threat,
the risk remains that the market switch could be harder or faster than management assumes.
Conversely, these trends may mean less competition for sites, and franchising may be an
effective way of avoiding their effects.
Execution risk is a constant. Greggs is undertaking a major manufacturing consolidation
programme. Glitches are inevitable, but we draw considerable comfort from the success that
management has enjoyed in its major supply chain investment programme to date. As the
programme becomes complete, the supply of certain products from a single source introduces
an element of additional risk as the cost of achieving economies of scale.
Changes to immigration policy may have severe implications for Greggs in common with the
wider leisure retailing sector.

Greggs | 14 March 2018 10
Financials: Positive record and prospects
2017 results: Balance of investment effort
Greggs’ results improved in the second half, with marginally higher revenue growth and much
higher operating margin than in the first. Also, at the operating and pre-tax level, they showed an
expected turnaround from a first half that had lagged the previous year.
Exhibit 8: Results summary
£m H116 H216 FY16 H117 H217 FY17 Growth
H1 H2 FY
Revenue 422.0 472.2 894.2 452.9 507.2 960.0 7.3% 7.4% 7.4%
Gross margin 63.2% 64.2% 63.7% 63.3% 64.1% 63.7%
Operating profit pre-property, exceps 27.2 50.9 78.1 27.6 54.3 81.7 1.5% 6.6% 4.6%
Operating margin 6.4% 10.8% 8.7% 6.1% 10.7% 8.6%
Property disposal gains 2.2 0 2.2 0.3 0.2 0.5
Finance income 0.0 0.0 0.0 (0.2) (0.2) (0.4)
Pre-tax profit pre exceptionals 29.4 50.9 80.3 27.7 54.1 81.8 -5.6% 6.2% 1.9%
Note: Exceptional charges (5.2) (9.9)
Source: Greggs
Revenue has showed a robust and consistent trading pattern, with sustained like-for-like sales
increases averaging around 3.5% over the last two years:
Exhibit 9: Steady underlying LFL sales progression
Source: Greggs. Note: Adjusted for Christmas and New Year trading pattern Q416, Q117. Reported levels were 6.4% and 3.6% respectively.
Gross margins have been held consistent with ingredient cost pressure in the year mitigated by
cost reductions, mainly emanating from the supply chain actions:
Exhibit 10: Margin analysis
£m FY16 FY17
Revenue 894.2 960.0
Gross margin 63.7% 63.7%
Distribution & selling costs 49.5% 49.6%
Admin expenses 5.5% 5.5%
EBIT before property and exceptional items 8.7% 8.6%
Property disposal gains 0.3% 0
EBIT pre-exceptional items 80.3 82.2
Operating margin 9.0% 8.6%
Source: Greggs
Distribution costs as a percentage of sales increased slightly as a result of wage rates contributing
to 3.1% overall wage and salary inflation and training costs. Administrative costs are up in absolute
terms in line with systems investment.
Property gains were at insignificant levels compared with an unusually high level in FY16.
0%
1%
2%
3%
4%
5%
6%
Q116 Q216 Q316 Q416 Q117 Q217 Q317 Q417 Wk 1-8 18

Greggs | 14 March 2018 11
Outlook and forecasts: Slight underlying upgrade
During the first eight weeks of 2018 sales have moved positively. Managed like-for-like sales grew
by 3.2%, and total sales were up 6.2%. At the same time, there is a clearer picture on the level of
continuing food and packaging inflationary pressure, and it does show some slight easing, with
ingredient inflation at 3-4% compared with 6.5% in 2017. On the other hand, people costs are
expected to rise by 3.6%, compared with 3.1% in 2017, including the impact of the National Living
Wage, while workplace pension costs bring a slight increase compared with the 2017 impact of the
Apprenticeship Levy in 2017. Overall, with ingredient costs at c 25% and people costs c 40% of the
cost base, we estimate that these factors net out to a c 0.5% reduction in cost pressures y-o-y.
As a result, we slightly upgrade our FY18 forecast, by 4.7% at EBITDA level, and 5.7% PBT (after
reduced finance charges compared with the higher pension financing charge in 2017) although, as
a result of higher tax guidance, our EPS forecast is little changed:
Exhibit 11: Changes to forecasts
EPS (p) PBT (£m) EBITDA (£m)
Old New % chg. % growth Old New % chg. % growth Old New % chg. % growth
2018e 66.6 66.5 (0.1) 3.2 83.9 85.5 1.9 5.7 136.8 142.0 3.8 4.7
2019e 71.6 7.6 91.0 6.5 153.3 8.0
2020e 77.8 8.6 98.1 7.7 164.0 7.0
Source: Edison Investment Research
Both our 2019 and 2020 forecasts are new, and we continue to forecast modest growth in earnings
as a result of continuing like-for-like positive growth, investment in site expansion, and the benefits
of the supply chain improvement programme.
Cash flow and balance sheet: Strong support for investment
Greggs is very cash productive, with cash conversion from EBITDA of 99% in 2017 and 102% for
2018 on our forecast. It finished 2017 with net cash of £54.5m against our previous forecast of
£40.1m. This was mainly the result of c £10m of delayed spend on supply chain investment, as well
as smaller working capital differences. We do not expect those delays to affect the realisation of
project benefits, although they contribute to an expected peak year for investment in the supply
chain at £37m. Combined with consistent net investment of c £40m and the next phase of the
systems project, this results in a high point for the expected capex total of £95m.
Exhibit 12: Capital investment
Source: Greggs
Management reiterates its guidance of a target of at least £40m of net cash flow, and we forecast
that reducing to £43m in 2019.
0
20
40
60
80
100
2016 2017 2018e 2019e 2020e
£m
Retail IT & Other Supply chain

Greggs | 14 March 2018 12
Valuation: Investors have a choice
We are broadening our approach to valuation. Previously, we valued Greggs purely on a DCF
basis, on the premise that there were no realistic comparators. We now value the shares jointly on
a DCF and a peer valuation basis. In terms of peers, we take into account a range of multi-site
consumer companies. Although there is admittedly no exact competitor within the group, we feel
that, like consumers, investors have a choice in the relevant consumer space and that it is more
realistic to look at Greggs in context.
DCF: Revised and standardised basis for the valuation
We apply a 6.9% cost of equity based on an assumed risk-free rate of 2%, an equity risk premium
of 7% and beta of 0.7. We previously used a 5.1% discount rate. We introduce a terminal value
based on this rate and a 2% perpetuity growth rate, which is a more widely used approach than our
previous assumed terminal multiple of 8x. In extending our published forecast to a 10-year cash
projection we assume revenue growth fading from 5% to 2% and EBITDA margin rising from 14.0%
to 14.5% between 2020 and 2027.
As a result of these assumptions, we define a valuation of 1,536p per share (previously 1,226p).
Varying the discount and terminal growth assumptions would affect the valuation as follows:
Exhibit 13: Sensitivity of valuation to discount rate and terminal growth rate
Discount rate (%)
4.9% 5.9% 6.9% 7.9% 8.9% 9.9%
3.0% 3,639 2,397 1,793 1,435 1,198 1,031
2.5% 3,002 2,127 1,650 1,350 1,143 993
2.0% 2,585 1,926 1,536 1,279 1,096 960
1.5% 2,291 1,771 1,444 1,219 1,056 932
1.0% 2,072 1,647 1,367 1,168 1,020 906
Source: Edison Investment Research
Peer comparisons: Valuation method
Compared with the peer group, Greggs stands at a c 20% premium on a P/E basis and a c 16%
discount premium on EV/EBITDA and EV/sales measures. Adjusting to peer group averages for
both forecast years would produce a valuation of 1,051p on a P/E basis, 1,489p on an EV/EBITDA
basis and 1,465p on an EV/sales basis. These in turn average to 1,335p.
Exhibit 14: Peer comparison
Market cap (m)
Fiscal y/e
CCY P/E (x) EV/EBITDA (x) EV/sales (x)
Dec-18 Dec-19 Dec-18 Dec-19 Dec-18 Dec-19
Conviviality 525 04/2016 GBP 12.8 11.9 9.8 9.3 0.7 0.7
Wetherspoon 1,092 07/2016 GBP 16.7 16.3 9.2 8.8 0.9 0.8
SSP Group 2,277 09/2016 GBP 23.8 21.6 10.5 9.8 1.5 1.4
Marston's 789 09/2016 GBP 8.3 7.7 8.9 8.6 0.7 0.7
Patisserie Holdings 343 09/2016 GBP 18.5 17.0 11.5 10.5 3.0 2.7
McColl's 228 11/2016 GBP 8.9 7.9 4.7 4.4 1.8 1.8
Dunkin' Brands 5,051 12/2016 USD 20.6 18.7 14.2 13.3 5.8* 5.5*
Domino's Pizza 1,413 12/2016 GBP 17.4 15.7 12.6 11.3 2.9* 2.7*
Average 15.9 14.6 10.2 9.5 1.4 1.4
Greggs 1,119 12/2016 GBP 19.0 17.6 8.6 8.0 1.2 1.1
Premium/(discount) 19.6% 20.7% (15.6%) (16.1%) (16.7%) (18.3%)
Source: Bloomberg, Edison Investment Research. Note: Annualised to December. *Non-comparable as franchised revenue: excluded.
Our blended rate between the two metrics we use is therefore 1,436p (previously 1,226p), implying
the following multiples:
Greggs | 14 March 2018 13
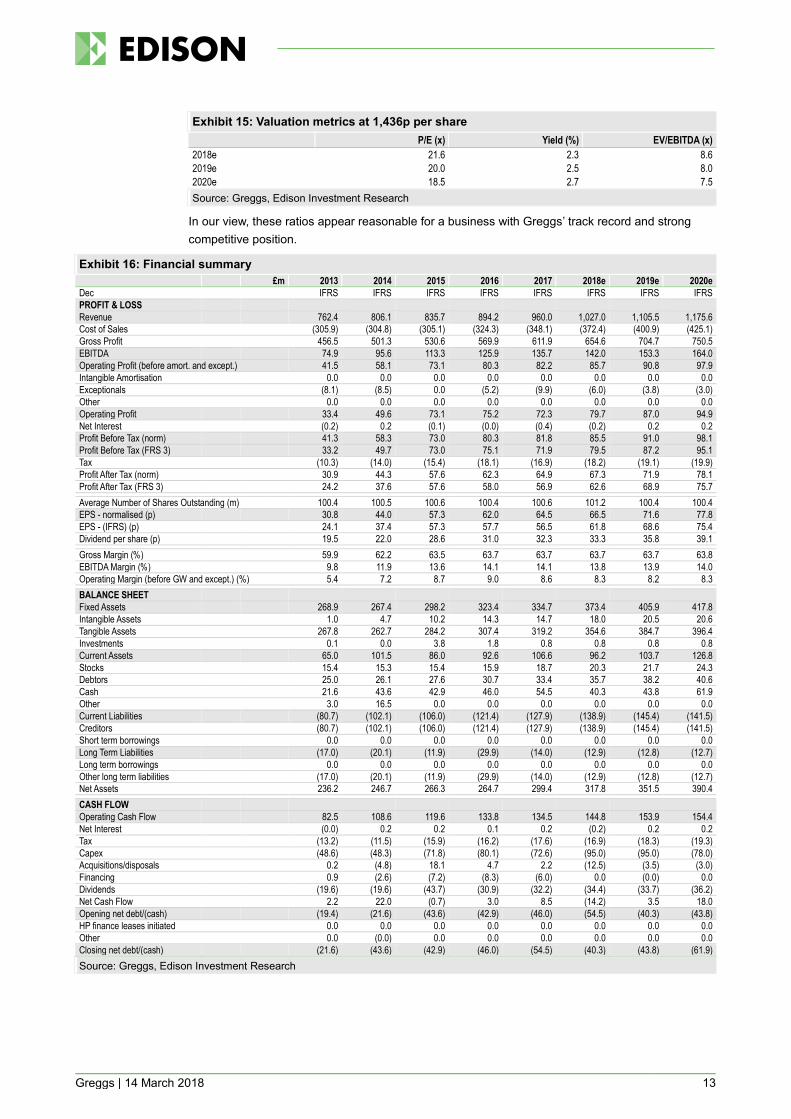
Exhibit 15: Valuation metrics at 1,436p per share
P/E (x) Yield (%) EV/EBITDA (x)
2018e 21.6 2.3 8.6
2019e 20.0 2.5 8.0
2020e 18.5 2.7 7.5
Source: Greggs, Edison Investment Research
In our view, these ratios appear reasonable for a business with Greggs’ track record and strong
competitive position.
Exhibit 16: Financial summary
£m 2013 2014 2015 2016 2017 2018e 2019e 2020e
Dec IFRS IFRS IFRS IFRS IFRS IFRS IFRS IFRS
PROFIT & LOSS
Revenue 762.4 806.1 835.7 894.2 960.0 1,027.0 1,105.5 1,175.6
Cost of Sales (305.9) (304.8) (305.1) (324.3) (348.1) (372.4) (400.9) (425.1)
Gross Profit 456.5 501.3 530.6 569.9 611.9 654.6 704.7 750.5
EBITDA 74.9 95.6 113.3 125.9 135.7 142.0 153.3 164.0
Operating Profit (before amort. and except.) 41.5 58.1 73.1 80.3 82.2 85.7 90.8 97.9
Intangible Amortisation 0.0 0.0 0.0 0.0 0.0 0.0 0.0 0.0
Exceptionals (8.1) (8.5) 0.0 (5.2) (9.9) (6.0) (3.8) (3.0)
Other 0.0 0.0 0.0 0.0 0.0 0.0 0.0 0.0
Operating Profit 33.4 49.6 73.1 75.2 72.3 79.7 87.0 94.9
Net Interest (0.2) 0.2 (0.1) (0.0) (0.4) (0.2) 0.2 0.2
Profit Before Tax (norm) 41.3 58.3 73.0 80.3 81.8 85.5 91.0 98.1
Profit Before Tax (FRS 3) 33.2 49.7 73.0 75.1 71.9 79.5 87.2 95.1
Tax (10.3) (14.0) (15.4) (18.1) (16.9) (18.2) (19.1) (19.9)
Profit After Tax (norm) 30.9 44.3 57.6 62.3 64.9 67.3 71.9 78.1
Profit After Tax (FRS 3) 24.2 37.6 57.6 58.0 56.9 62.6 68.9 75.7
Average Number of Shares Outstanding (m) 100.4 100.5 100.6 100.4 100.6 101.2 100.4 100.4
EPS - normalised (p) 30.8 44.0 57.3 62.0 64.5 66.5 71.6 77.8
EPS - (IFRS) (p) 24.1 37.4 57.3 57.7 56.5 61.8 68.6 75.4
Dividend per share (p) 19.5 22.0 28.6 31.0 32.3 33.3 35.8 39.1
Gross Margin (%) 59.9 62.2 63.5 63.7 63.7 63.7 63.7 63.8
EBITDA Margin (%) 9.8 11.9 13.6 14.1 14.1 13.8 13.9 14.0
Operating Margin (before GW and except.) (%) 5.4 7.2 8.7 9.0 8.6 8.3 8.2 8.3
BALANCE SHEET
Fixed Assets 268.9 267.4 298.2 323.4 334.7 373.4 405.9 417.8
Intangible Assets 1.0 4.7 10.2 14.3 14.7 18.0 20.5 20.6
Tangible Assets 267.8 262.7 284.2 307.4 319.2 354.6 384.7 396.4
Investments 0.1 0.0 3.8 1.8 0.8 0.8 0.8 0.8
Current Assets 65.0 101.5 86.0 92.6 106.6 96.2 103.7 126.8
Stocks 15.4 15.3 15.4 15.9 18.7 20.3 21.7 24.3
Debtors 25.0 26.1 27.6 30.7 33.4 35.7 38.2 40.6
Cash 21.6 43.6 42.9 46.0 54.5 40.3 43.8 61.9
Other 3.0 16.5 0.0 0.0 0.0 0.0 0.0 0.0
Current Liabilities (80.7) (102.1) (106.0) (121.4) (127.9) (138.9) (145.4) (141.5)
Creditors (80.7) (102.1) (106.0) (121.4) (127.9) (138.9) (145.4) (141.5)
Short term borrowings 0.0 0.0 0.0 0.0 0.0 0.0 0.0 0.0
Long Term Liabilities (17.0) (20.1) (11.9) (29.9) (14.0) (12.9) (12.8) (12.7)
Long term borrowings 0.0 0.0 0.0 0.0 0.0 0.0 0.0 0.0
Other long term liabilities (17.0) (20.1) (11.9) (29.9) (14.0) (12.9) (12.8) (12.7)
Net Assets 236.2 246.7 266.3 264.7 299.4 317.8 351.5 390.4
CASH FLOW
Operating Cash Flow 82.5 108.6 119.6 133.8 134.5 144.8 153.9 154.4
Net Interest (0.0) 0.2 0.2 0.1 0.2 (0.2) 0.2 0.2
Tax (13.2) (11.5) (15.9) (16.2) (17.6) (16.9) (18.3) (19.3)
Capex (48.6) (48.3) (71.8) (80.1) (72.6) (95.0) (95.0) (78.0)
Acquisitions/disposals 0.2 (4.8) 18.1 4.7 2.2 (12.5) (3.5) (3.0)
Financing 0.9 (2.6) (7.2) (8.3) (6.0) 0.0 (0.0) 0.0
Dividends (19.6) (19.6) (43.7) (30.9) (32.2) (34.4) (33.7) (36.2)
Net Cash Flow 2.2 22.0 (0.7) 3.0 8.5 (14.2) 3.5 18.0
Opening net debt/(cash) (19.4) (21.6) (43.6) (42.9) (46.0) (54.5) (40.3) (43.8)
HP finance leases initiated 0.0 0.0 0.0 0.0 0.0 0.0 0.0 0.0
Other 0.0 (0.0) 0.0 0.0 0.0 0.0 0.0 0.0
Closing net debt/(cash) (21.6) (43.6) (42.9) (46.0) (54.5) (40.3) (43.8) (61.9)
Source: Greggs, Edison Investment Research

Greggs | 14 March 2018 14
Contact details Revenue by geography
Greggs Fernwood House Clayton Road Newcastle Upon Tyne NE2 1TL +44 (0)191 281 7721 https://corporate.greggs.co.uk
Management team
CEO: Roger Whiteside Finance Director: Richard Hutton
Appointed CEO in February 2013. Roger began his career at Marks & Spencer, where he spent 20 years. He was one of the founding team of Ocado, serving as joint MD from 2000 to 2004. From 2004 to 2007 he was CEO of Threshers before joining Punch Taverns, ultimately becoming chief executive.
Richard Hutton qualified as a chartered accountant with KPMG and gained career experience with Procter & Gamble before joining Greggs in 1998. He was appointed FD in May 2006.
Principal shareholders (%)
Sun Life 5.9%
Standard Life Aberdeen 5.0%
Brewin Dolphin Holdings 4.6%
GCM Collateral Holdings 4.4%
Van Lanschot NV 3.9%
Franklin Resources 3.5%
BlackRock 3.0%
Companies named in this report
Conviviality , Wetherspoon (JDW) SSP Group (SSPG) Marston's (MARS) Patisserie Holdings (CAKE), McColl's Retail Group (MCLS), Dunkin' Brands (DNKN)
Domino's Pizza (DOM), McDonald’s (MCD), Marks & Spencer (MKS), WM Morrison Supermarkets (MRW), Just Eat (JE), Restaurant Group (RTN), Burberry(BRBY)
Edison is an investment research and advisory company, with offices in North America, Europe, the Middle East and AsiaPac. The heart of Edison is our world-renowned equity research platform and deep multi-sector expertise. At Edison Investment Research, our research is widely read by international investors, advisers and stakeholders. Edison Advisors leverages our core research platform to provide differentiated services including investor relations and strategic consulting. Edison is authorised and regulated by the Financial Conduct Authority. Edison Investment Research (NZ) Limited (Edison NZ) is the New Zealand subsidiary of Edison. Edison NZ is registered on the New Zealand Financial Service Providers Register (FSP number 247505) and is registered to provide wholesale and/or generic financial adviser services only. Edison Investment Research Inc (Edison US) is the US subsidiary of Edison and is regulated by the Securities and Exchange Commission. Edison Investment Research Pty Limited (Edison Aus) [46085869] is the Australian subsidiary of Edison. Edison Germany is a branch entity of Edison Investment Research Limited [4794244]. www.edisongroup.com
DISCLAIMER Copyright 2018 Edison Investment Research Limited. All rights reserved. This report has been commissioned by Greggs and prepared and issued by Edison for publication globally. All information used in the publication of this report has been compiled from publicly available sources that are believed to be reliable, however we do not guarantee the accuracy or completeness of this report. Opinions contained in this report represent those of the research department of Edison at the time of publication. The securities described in the Investment Research may not be eligible for sale in all jurisdictions or to certain categories of investors. This research is issued in Australia by Edison Investment Research Pty Ltd (Corporate Authorised Representative (1252501) of Myonlineadvisers Pty Ltd (AFSL: 427484)) and any access to it, is intended only for "wholesale clients" within the meaning of the Corporations Act 2001 of Australia. The Investment Research is distributed in the United States by Edison US to major US institutional investors only. Edison US is registered as an investment adviser with the Securities and Exchange Commission. Edison US relies upon the "publishers' exclusion" from the definition of investment adviser under Section 202(a)(11) of the Investment Advisers Act of 1940 and corresponding state securities laws. As such, Edison does not offer or provide personalised advice. We publish information about companies in which we believe our readers may be interested and this information reflects our sincere opinions. The information that we provide or that is derived from our website is not intended to be, and should not be construed in any manner whatsoever as, personalised advice. Also, our website and the information provided by us should not be construed by any subscriber or prospective subscriber as Edison’s solicitation to effect, or attempt to effect, any transaction in a security. The research in this document is intended for New Zealand resident professional financial advisers or brokers (for use in their roles as financial advisers or brokers) and habitual investors who are “wholesale clients” for the purpose of the Financial Advisers Act 2008 (FAA) (as described in sections 5(c) (1)(a), (b) and (c) of the FAA). This is not a solicitation or inducement to buy, sell, subscribe, or underwrite any securities mentioned or in the topic of this document. This document is provided for information purposes only and should not be construed as an offer or solicitation for investment in any securities mentioned or in the topic of this document. A marketing communication under FCA Rules, this document has not been prepared in accordance with the legal requirements designed to promote the independence of investment research and is not subject to any prohibition on dealing ahead of the dissemination of investment research. Edison has a restrictive policy relating to personal dealing. Edison Group does not conduct any investment business and, accordingly, does not itself hold any positions in the securities mentioned in this report. However, the respective directors, officers, employees and contractors of Edison may have a position in any or related securities mentioned in this report. Edison or its affiliates may perform services or solicit business from any of the companies mentioned in this report. The value of securities mentioned in this report can fall as well as rise and are subject to large and sudden swings. In addition it may be difficult or not possible to buy, sell or obtain accurate information about the value of securities mentioned in this report. Past performance is not necessarily a guide to future performance. Forward-looking information or statements in this report contain information that is based on assumptions, forecasts of future results, estimates of amounts not yet determinable, and therefore involve known and unknown risks, uncertainties and other factors which may cause the actual results, performance or achievements of their subject matter to be materially different from current expectations. For the purpose of the FAA, the content of this report is of a general nature, is intended as a source of general information only and is not intended to constitute a recommendation or opinion in relation to acquiring or disposing (including refraining from acquiring or disposing) of securities. The distribution of this document is not a “personalised service” and, to the extent that it contains any financial advice, is intended only as a “class service” provided by Edison within the meaning of the FAA (ie without taking into account the particular financial situation or goals of any person). As such, it should not be relied upon in making an investment decision. To the maximum extent permitted by law, Edison, its affiliates and contractors, and their respective directors, officers and employees will not be liable for any loss or damage arising as a result of reliance being placed on any of the information contained in this report and do not guarantee the returns on investments in the products discussed in this publication. FTSE International Limited (“FTSE”) © FTSE 2018. “FTSE®” is a trade mark of the London Stock Exchange Group companies and is used by FTSE International Limited under license. All rights in the FTSE indices and/or FTSE ratings vest in FTSE and/or its licensors. Neither FTSE nor its licensors accept any liability for any errors or omissions in the FTSE indices and/or FTSE ratings or underlying data. No further distribution of FTSE Data is permitted without FTSE’s express written consent.
Frankfurt +49 (0)69 78 8076 960
Schumannstrasse 34b
60325 Frankfurt
Germany
London +44 (0)20 3077 5700
280 High Holborn
London, WC1V 7EE
United Kingdom
New York +1 646 653 7026
295 Madison Avenue, 18th Floor
10017, New York
US
Sydney +61 (0)2 8249 8342
Level 12, Office 1205
95 Pitt Street, Sydney
NSW 2000, Australia
100%%
UK
Related Documents