p. 1 Greenhouse Gas Emissions and Climate Change Jürgen Scheffran Institute of Geography, CliSAP/CEN Universität Hamburg “Energy and Climate Policy" (63-951) Lecture 6, June 9, 2016

Welcome message from author
This document is posted to help you gain knowledge. Please leave a comment to let me know what you think about it! Share it to your friends and learn new things together.
Transcript

p. 1
Greenhouse Gas Emissions and Climate Change
Jürgen ScheffranInstitute of Geography, CliSAP/CEN
Universität Hamburg
“Energy and Climate Policy" (63-951) Lecture 6, June 9, 2016

p. 2
Connection between energy and climate impacts
CO2 emissions
CO2 concentration in atmosphere
Global mean temperature
Natural resources
Societal stability and conflict
Energy in production and consumption
Human security risks

p. 3
Earth‘s mean annual radiant energy and heat balance:The Greenhouse effect
From Houghton et al. (1996: 58).

p. 4
Global carbon cycle
Main annual fluxes in GtC/yr: pre-industrial ‘natural’ fluxes in black and ‘anthropogenic’ fluxes in redIPCC 2007: WG1

p. 5
IPCC

p. 6
Greenhouse gas emission trends(IPCC 2014)
Total anthropogenic GHG emissions have risen more rapidly from 2000 to 2010 than in the previous three decades (high confidence).
CO2 remains the major anthropogenic GHG with 76% of total GHG emissions in 2010 weighed by GWP100 (high confidence).
Over the last four decades total cumulative CO2 emissions have increased by a factor of 2 from about 900 GtCO2 for the period 1750–1970 to about 2000 GtCO2 for 1750–2010 (high confidence).
Regional patterns of GHG emissions are shifting along with changes in the world economy (high confidence).
Current GHG emission levels are dominated by contributions from the energy supply, Agriculture, Forestry and Other Land‐Use (AFOLU)
Industry and building sectors gain considerably in importance (robust evidence, high agreement).

p. 7
Total annual anthropogenic GHG emissions by groups of gases 1970-2010
IPCC 2014

p. 8
Cumulative CO2 emissions have more than doubled since 1970
IPCC 2014
p. 9
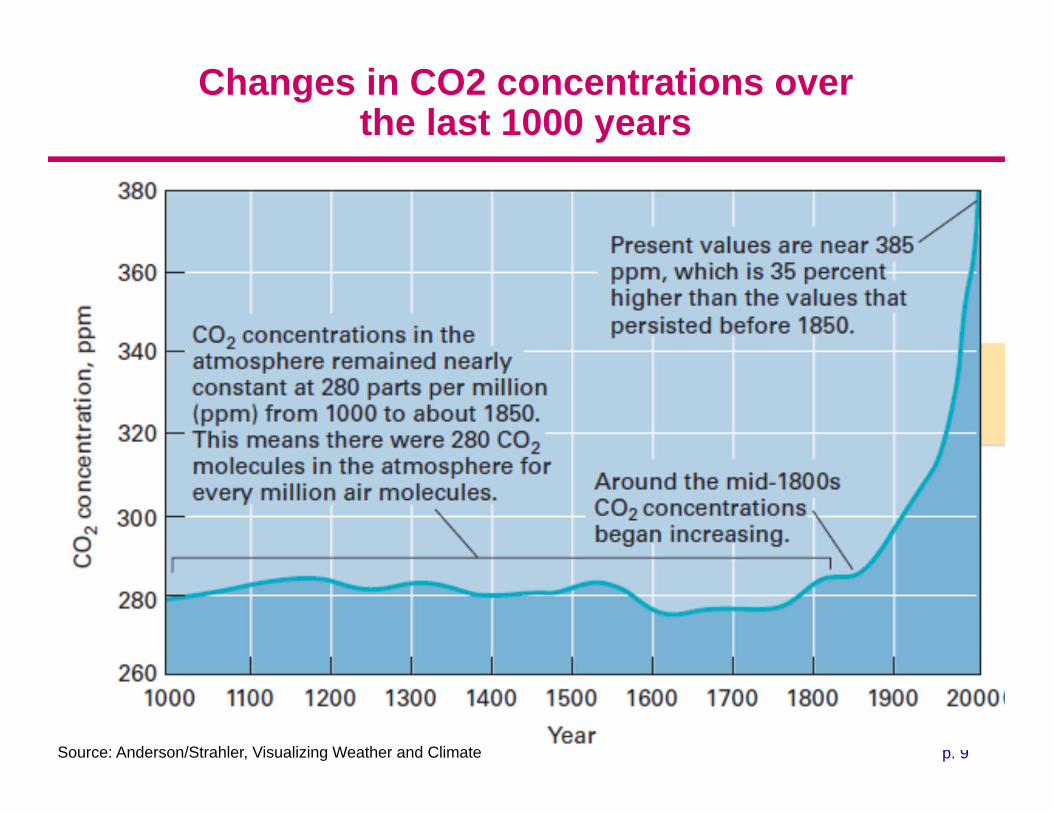
Changes in CO2 concentrations overthe last 1000 years
Source: Anderson/Strahler, Visualizing Weather and Climate

p. 10Source: IPCC 2013, WG1
Probability density functions for the effective radiative forcing
Radiative forcing: change in the net, downward minus upward, radiative flux (expressed in W m–2) at the tropopause or top of atmosphere due to a change in an external driver of climate change

p. 11
Global air temperature
Source: Anderson/Strahler, Visualizing Weather and Climate

p. 12
Observed and projected climate variables for different IPCC reports
Source: IPCC 2013, AR5-WG1

p. 13
Total radiative forcing and cumulative carbon emissions since 1751 in baseline scenario compared to RCP scenarios
IPCC-WG3 (2014)
p. 14
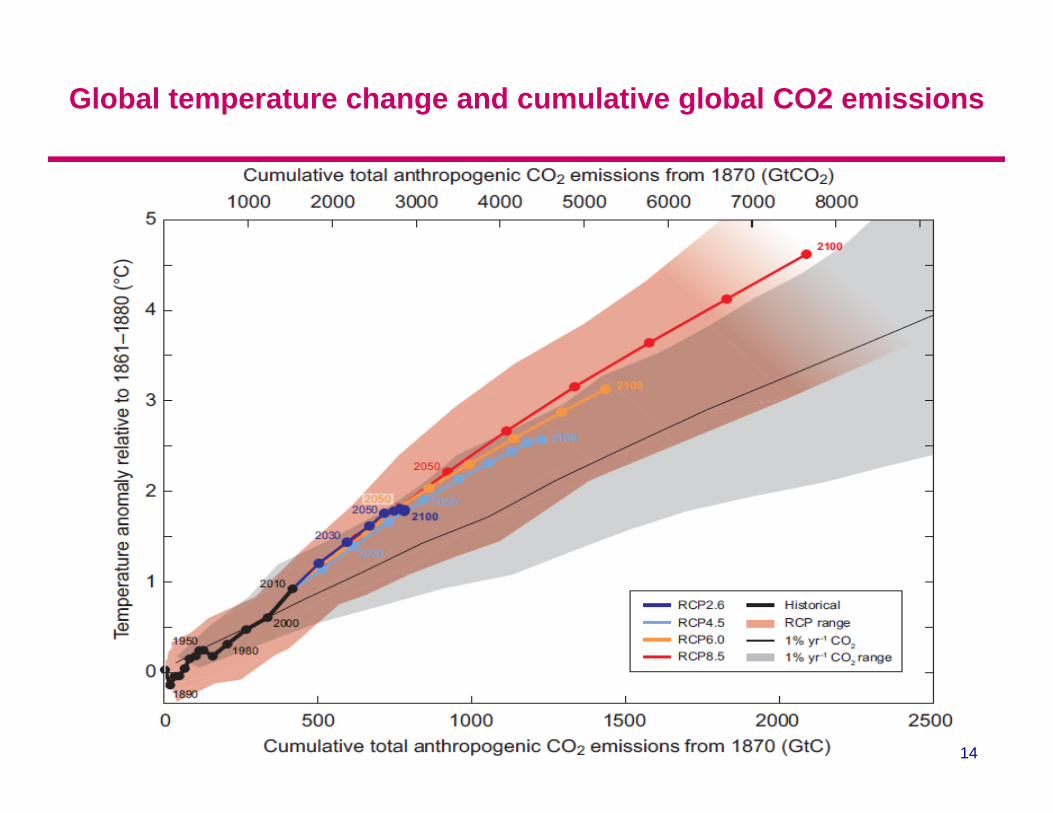
Global temperature change and cumulative global CO2 emissions

p. 15Source: IPCC 2013, AR5-WG1
Global mean precipitation versus temperature changes relative to 1986–2005

p. 16
Anomalies relative to 1880–1919 for surface temperature, 1960–1980 for ocean heat content, 1979–1999 for sea iceSource: IPCC 2013, WG1
Comparison of observed and simulated climate change

p. 17
Observed changes in annual average surface temperature
Source: IPCC 2013, WG1

p. 18
Projected changes in annual average surface temperature
Source: IPCC 2013, WG1

p. 19
Observed changes in annual average precipitation
Source: IPCC 2013, WG1

p. 20
Projected changes in annual average precipitation
Source: IPCC 2014, WG1

p. 21
Projections of climate change-driven biome shiftsin the context of land use
Source: IPCC 2013, AR5-WG1

p. 22
Summary of estimated impacts of observed climate changes on yields over 1960–2013
Number of data points analyzed within parentheses for each category (Source: IPCC 2014)
Source: IPCC 2014, WG2
Data points

p. 23
Key terms of climate impacts(IPCC-WG2 2014)
Impacts: Effects on natural and human systems, including effects on lives, livelihoods, health, ecosystems, economies, societies, cultures, services, and infrastructure due to the interaction of climate changes or hazardous climate events occurring within a specific time period and the vulnerability of an exposed society or system.
Exposure: Presence of people, livelihoods, species or ecosystems, environmental functions, services, and resources, infrastructure, or economic, social, or cultural assets in places and settings that could be adversely affected.
Vulnerability: Propensity or predisposition to be adversely affected; variety of concepts and elements including sensitivity or susceptibility to harm, lack of capacity to cope and adapt.
Hazard: Potential occurrence of natural or human-induced physical event, trend or physical impact that may cause loss of life, injury, or other health impacts, damage and loss to property, infrastructure, livelihoods, service provision, ecosystems & environmental resources.
Risk: Potential for consequences where something of value is at stake and where the outcome is uncertain. Risk is often represented as probability of occurrence of hazardous events or trends multiplied by the impacts if these events or trends occur.
Risk = probability x impact

p. 24
Vulnerability and risk in climate-society interaction

p. 25
Multidimensional vulnerability driven by intersecting dimensions of inequality

p. 26
Global temperature and risks
Source: IPCC 2014, WG2

p. 27
Global patterns of impacts in recent decades attributed to climate change
Source: IPCC 2014, WG2

p. 28
Risks of tropical storms for urban centers
Source: WBGU 2007

p. 29
World Map of the Global Climate Risk Index 1995-2014

p. 30
Source: Scheffran/Battaglini 2011

p. 31
Climate change risks for human security and the interactions between livelihoods, conflict, culture and migration
Source: IPCC 2014, WG2

p. 32Source: Lenton et al 2008
Tipping elements in the climate system

p. 33
Long-term time scales for stabilization
Source: IPCC 2001, Synthesis Report.Source: Intergovernmental Panel on Climate Change, Climate Change 2001: Synthesis Report—Summary for Policymakers. www.ipcc.ch/pdf/assessment-report/ar4/syr/ar4_syr_spm.pdf
Related Documents


![Greenhouse Gas Emissions and Emissions Trading in North … · 2020. 2. 23. · 2002] Stephenson-Greenhouse Gas Emissions, Kyoto and U.S. Response 45 greenhouse gas molecules. This](https://static.cupdf.com/doc/110x72/60facf56e286b02f9b10de99/greenhouse-gas-emissions-and-emissions-trading-in-north-2020-2-23-2002-stephenson-greenhouse.jpg)
