GREENHOUSE GAS CATALYTIC REFORMING TO SYNGAS A thesis submitted in partial fulfillment of the requirements for the degree of Master of Science Earth Resources Engineering NOAH W. WHITMORE Dr. Marco J. Castaldi, Advisor Dr. Robert Farrauto, Advisor Department of Earth and Environmental Engineering (HKSM) Fu Foundation School of Engineering and Applied Science Columbia University in the City of New York May, 2007

Welcome message from author
This document is posted to help you gain knowledge. Please leave a comment to let me know what you think about it! Share it to your friends and learn new things together.
Transcript
GREENHOUSE GAS CATALYTIC REFORMING TO SYNGAS
A thesis submitted in partial fulfillment of the requirements for the degree of Master of Science
Earth Resources Engineering
NOAH W. WHITMORE
Dr. Marco J. Castaldi, Advisor Dr. Robert Farrauto, Advisor
Department of Earth and Environmental Engineering (HKSM) Fu Foundation School of Engineering and Applied Science
Columbia University in the City of New York
May, 2007

2
© Noah W. Whitmore 2007

3
ACKNOWLEDGEMENTS
I would to thank Dr. Castaldi for allowing me to engage in fundamental and socially relevant
research and for cultivating a research environment which promotes student growth. I would
like to thank Dr. Farrauto for his guidance and support through my duration at Columbia. Also, I
wish to acknowledge soon-to-be Dr. Eilhann Kwon for his assistance and advising in the lab.
Finally, I’d like to acknowledge my family and friends in the Pacific Northwest whom I’ve
missed over the past two years.

4
TABLE OF CONTENTS GREENHOUSE GAS CATALYTIC REFORMING TO SYNGAS
1. Landfill gas to energy . . . . . . . . . . . . . . . . . . . . . . . . . . . . . . . . . . . . . . . . . . . . . . . 6 1.1 Landfill gas: an environmental hazard 1.2 Landfill gas: a renewable energy resource 1.3 Scaling: estimations of gas flow rates 1.4 Energy conversion technologies 1.5 System efficiencies and energy production
2. Dry reforming technology . . . . . . . . . . . . . . . . . . . . . . . . . . . . . . . . . . . . . . . . . . . . 19 2.1 Thermodynamics 2.2 Literature review
3. Experimental design . . . . . . . . . . . . . . . . . . . . . . . . . . . . . . . . . . . . . . . . . . . . . . . . 36 3.1 Reactor design 3.2 Catalysts 3.3 Reactor specifications 3.4 Heat supply 3.4.1 Temperature profile experiment 3.4.2 Heat transfer from furnace to gas 3.4.3 Temperature versus flowrates 3.5 Temperature acquisition 3.6 Gas supply 3.7 Gas analysis
4. Experimental methods . . . . . . . . . . . . . . . . . . . . . . . . . . . . . . . . . . . . . . . . . . . . . . . 48 4.1 Steady state reactor studies
4.1.1 Baseline reactor studies 4.1.2 Stoichiometric reforming 4.1.3 Varying CO2 4.1.4 Varying CH4
4.2 Deactivation studies 4.2.1 On-stream activity 4.2.2 TGA 4.2.3 TGA-DTA
5. Results . . . . . . . . . . . . . . . . . . . . . . . . . . . . . . . . . . . . . . . . . . . . . . . . . . . . . . . . . . . 55 5.1 Baseline studies 5.2 Stoichiometric reforming 5.3 Varying CO2 5.4 Varying CH4 5.5 Deactivation 5.6 Catalyst poisoning from heavy metal deposition
6. Discussion . . . . . . . . . . . . . . . . . . . . . . . . . . . . . . . . . . . . . . . . . . . . . . . . . . . . . . . . 98 7. Conclusions . . . . . . . . . . . . . . . . . . . . . . . . . . . . . . . . . . . . . . . . . . . . . . . . . . . . . . . 101
5
CMASS TECHNOLOGY DEMONSTRATIONS
1. Executive summary . . . . . . . . . . . . . . . . . . . . . . . . . . . . . . . . . . . . . . . . . . . . . . . . . . 102 2. Ammonia synthesis . . . . . . . . . . . . . . . . . . . . . . . . . . . . . . . . . . . . . . . . . . . . . . . . . . 103
2.1 Introduction 2.2 Experimental set-up 2.3 Experimental procedure 2.4 Results
3. Ammonia decomposition . . . . . . . . . . . . . . . . . . . . . . . . . . . . . . . . . . . . . . . . . . . . . 118 3.1 Introduction 3.2 Experimental set-up 3.3 Experimental procedure 3.4 Calculations 3.5 Results
LITERATURE CITED . . . . . . . . . . . . . . . . . . . . . . . . . . . . . . . . . . . . . . . . . . . . . . . . . . . 135

6
1. LANDFILL GAS TO ENERGY In the United States, approximately 1 ton of municipal solid waste (MSW) is generated per
person per year [1]. Of this waste, approximately 22 % is recycled, 14 % is combusted in waste-
to-energy facilities, and 55 % is landfilled [2]. When MSW is deposited at a landfill, it
decomposes anaerobically via the simplified reaction
C6H10O4 + 1.5H2O = 3.25CH4 + 2.75CO2,
generating a gaseous mixture of roughly 50 % methane and 50 % carbon dioxide by volume, as
well as trace amounts of volatile organic compounds [2]. Untreated, landfill gas poses various
environmental concerns; captured, LFG is a local renewable energy source. While
approximately 2.6 million tons of methane is captured annually from landfills in the United
States, 70 % of which is used to generate heat or electricity [3], efficient utilization of LFG is an
area for research and development.
1.1 Landfill gas: an environmental hazard. Landfill gas, if not flared or utilized, poses an explosion hazard, is an emission source of volatile
organic compounds (VOCs), and is composed primarily of potent greenhouse gases [1]. The
VOCs with the greatest concentrations in LFG are toluene and dichloromethane at respective
levels of 26 and 35 ppm, and the total amount of non-captured VOCs is approximately 2350 tons
per year [2]. Landfills are also the largest source of anthropogenic methane emissions in the
United States [4], producing 7.2 billion Nm3 per year [2]. Currently, only 4.3 billion Nm3 is
captured, resulting in atmospheric emissions of 2.9 billion Nm3 per year [2]. It is estimated that
the global warming potential of methane is 23 times greater than an equal volume of carbon
dioxide [5], so the successful capture and conversion of CH4 to produce energy and its less
7
potent products of combustion, or to CO and H2 to be used for chemical synthesis, rapidly
reduces the global warming impact. Methane lost from landfills in the US is equivalent to 35.7
million tons atmospheric carbon per year, or 2 % of the total US anthropogenic carbon
emissions. In addition to this uncaptured methane released from landfills are 3.29 millions tons
carbon in the form of uncaptured CO2, and 2.3 million tons carbon equivalent from the
successful combustion of captured CH4 [2]. While it is clear that improvements in the
percentage of captured methane will yield the greatest reductions in global warming impact from
landfills, more efficient utilization of captured LFG as a renewable energy source is an intriguing
area for research and development.
1.2 Landfill gas: a renewable energy resource. Landfill gas is a low-cost, local, renewable energy resource. Two viable methods of LFG usage
are direct combustion on or near a landfill site and conversion of the LFG to syngas which can
then be further converted to a liquid fuel for distribution. While LFG is a low-to-medium-BTU
gas with an average heating value of 540 kJ/Nm3, it contains enough chemical energy to sustain
the operation of a gas turbine or internal combustion engine, and can be used to produce heat and
power. The presence of a significant amount of CO2 in the mixture means that the flame
characteristics are substantially different from those of natural gas. The result is reduced flame
temperatures and burning rates, and a narrower range of flame stability, yielding lower
combustion efficiency [6]. Further, the high concentration of CO2 increases the amount of NOx
produced per gram of CH4 through enhancement of the prompt mechanism [6]. One way to
increase the combustion efficiency is to recuperate some of the thermal energy of the products of
combustion to pre-heat the reactants, increasing the temperature in the reaction zone. Another
approach would be to raise the heating value of the reactants by adding a high-grade fuel to the

8
mixture. Hydrogen enhanced combustion would provide the benefits of reducing undesired
emissions, allow ignition at lean conditions and low temperatures, and provide flame stability at
low temperatures. However, a high fraction of hydrogen fuel would typically result in higher
costs if hydrogen is produced and purchased off-site.
As mentioned above, landfill gas can also be reformed catalytically to syngas (hydrogen and
carbon monoxide) via the dry reforming reaction:
CH4 + CO2 → 2CO + 2H2 ; ΔH298 = +247 kJ/mol
While this process is currently an area for continuing research in catalysis, recent studies,
including this work, suggest that Rhodium or Nickel based catalysts may be formulated for this
process and could be commercially available for use in the near future.
To illustrate ideal combustion performance characteristics for various degrees of landfill gas
reforming, adiabatic flame temperatures were calculated for varying equivalence ratios, along
with the stoichiometric enthalpy of combustion of the various fuel compositions in Figure 1.1.
As the syngas content in LFG increases, the adiabatic flame temperature increases, as does the
zone of high flame temperature with respect to equivalence ratio.

9
(a)
(b)
Fig. 1.1. (a) Adiabatic flame temperature is shown versus equivalence ratio for various fuel compositions with air as the oxidant. (b) Enthalpies of combustion are shown for various fuel compositions at stoichiometric air:fuel ratios where the fuel is considered to be the mix of LFG and syngas.

10
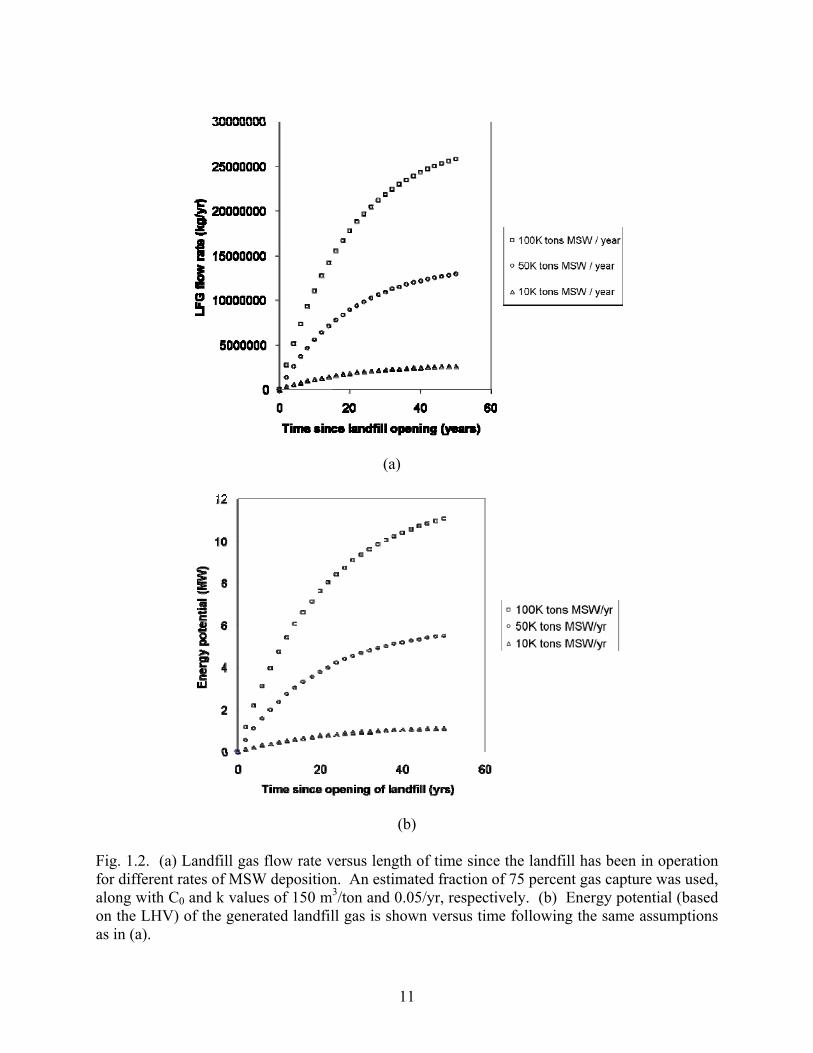
1.3 Scaling: estimations of gas flow rates from landfills. The amount of LFG that is generated from a landfill is primarily affected by the amount of solid
waste in place, the depth of the landfill, the age of the landfill, the type of waste, the rate at
which the landfill receives waste, and the amount of precipitation the landfill receives (EPA). In
arid climates which receive less than about 25 inches of rain per year, the gas flow rate is likely
to be low, but may continue for a longer period of time than for moist climates [1]. Taking an
average of reported industrial values for different landfills in the United States, about 5.7 m3 of
landfill gas is produced per ton of MSW in place per year [1]. Therefore, a rough estimate of the
gas flow from a 5 million ton landfill would be 28.5 million m3/yr.
A first-order decay model can be used to account for changing gas flow rates during the lifetime
of a landfill (EPA). Where Q is the amount of landfill gas generated per year (m3/yr), C0 is the
total methane generation potential of the waste (m3/ton), R is the average waste disposal rate
during the years which the landfill is open (tons/yr), f is the fraction of landfill gas captured, k is
the rate of methane generation (1/yr), t0 is the time since the landfill was opened (yr), and tc is the
time since the landfill was closed (yr), a model can be generated to estimate the flow rate of
captured gas at a particular point in time:
Q = 2 f C0 R (exp(-ktc)-exp(-kt0))
The total methane generation potential C0 is dependent on the type of waste, but an average can
be taken as approximately 150 m3/ton. The rate of methane generation k depends on climate, but
an average can be taken as 0.05/yr for a medium moisture climate. So, given an average rate of
MSW disposal and the time of operation of the landfill, a gas flow rate can be estimated, as
shown in Figure 1.2.
11
(a)
(b)
Fig. 1.2. (a) Landfill gas flow rate versus length of time since the landfill has been in operation for different rates of MSW deposition. An estimated fraction of 75 percent gas capture was used, along with C0 and k values of 150 m3/ton and 0.05/yr, respectively. (b) Energy potential (based on the LHV) of the generated landfill gas is shown versus time following the same assumptions as in (a).
12
1.4 Energy conversion: alternative options. Several technologies exist which are suitable for either direct use or power production and
cogeneration from landfill gas. Depending on several different factors, such as the size of the
landfill, the presence of an existing energy market, project costs, and potential revenue sources,
any given recovery system may be most suitable for a particular landfill.
1.4.1 Direct use: sale of landfill gas for small scale boiler applications One simple and cost effective method to utilize landfill gas is to sell the gas as a low-Btu fuel for
boiler or industrial process use where heat is needed. In this case, the major capital cost lies in
the construction of a pipeline for the customer to access the supply. This cost may range
between $250,000 to $500,000 per mile. In addition, if landfill gas is used directly in a boiler
application, the cost of retrofitting a boiler can range from $120,000 - $300,000 for boilers from
10,000 to 80,000 lb/hr. Once the retrofits are made to the boiler, the operating and maintenance
costs are similar to the costs of using conventional fuels. Additionally, the need to retrofit,
which is caused by the low-Btu value of the fuel, may be avoided through reforming the fuel to a
mixture of synthesis gas.
1.4.2 Cogeneration: internal combustion engine with combined heat and power: The internal combustion engine is the most widely used conversion technology in landfill gas
applications. This is due to the relatively high efficiency, low cost, and good size match for
many landfills, which commonly produce between 1 and 3 MW. The efficiency of an engine
modified for landfill gas use sacrifices less than 5 percent when compared to a natural gas
engine, and when waste heat is recovered from the engine cooling jacket and lube system to
make hot water, as well as from the engine exhaust to make low pressure steam, efficiencies

13
increase dramatically. The capital costs for internal combustion engine projects are
approximately $1,200 per kW output.
1.4.3 Cogeneration: gas turbine with combined heat and power As the size of the landfill increases, and electricity production increases to around 5 MW, it
becomes more cost-effective to use a gas turbine, taking advantage of the economies of scale of
the technology. The gas turbine cycle is especially useful to utilize exhaust heat to produce
steam and heat for reforming and heating applications. Capital cost estimates range from about
$1,200 – 17,000 per kW for landfills from 1-10 million tons. A schematic of the gas turbine with
combined heat and power and reformer is shown in Fig. 1.3.
Fig. 1.3. Schematic of gas turbine with combined heat and power and reforming technology. 1.4.4 Cogeneration: fuel cell with combined heat and power Another promising energy conversion technology is the fuel cell, which offers a high ideal
efficiency, small size and quiet operation, and flexibility with regard to sizing. However, fuel
cell systems are still in the development phase and their cost-effectiveness is currently low.
Nonetheless, it is worthwhile to determine the efficiency of a fuel cell system, assuming that the

14
cost comes down and some basic engineering issues become resolved in the near future. A
common fuel cell, the proton exchange membrane fuel cell, runs on hydrogen and oxygen, and
could be used to provide electricity from fully reformed landfill gas, as long as the carbon
monoxide is reduced to a level of 10 ppm before the fuel mixture reaches the fuel cell. A
schematic of the fuel cell system is shown in Figure 1.4.
Fig. 1.4. Schematic of fuel cell system to convert landfill gas into electricity and useable heat. 1.5 System efficiencies and energy production Electrical production, electrical efficiency, and overall combined heat and power efficiencies
were calculated for varying extents of reforming and various energy conversion technologies.
Calculations were performed for two different sizes of open landfills. A capture factor of 75 %
was included, which is reflected in the overall electricity production, but not in the efficiencies of
the energy conversion systems. Electrical efficiency was defined as the ratio of electrical work
output to the total lower heating value of the captured landfill gas. Overall combined heat and
power efficiency was defined as the ratio of combined electricity and leftover heat available
divided by the lower heating value of the captured landfill gas.
15
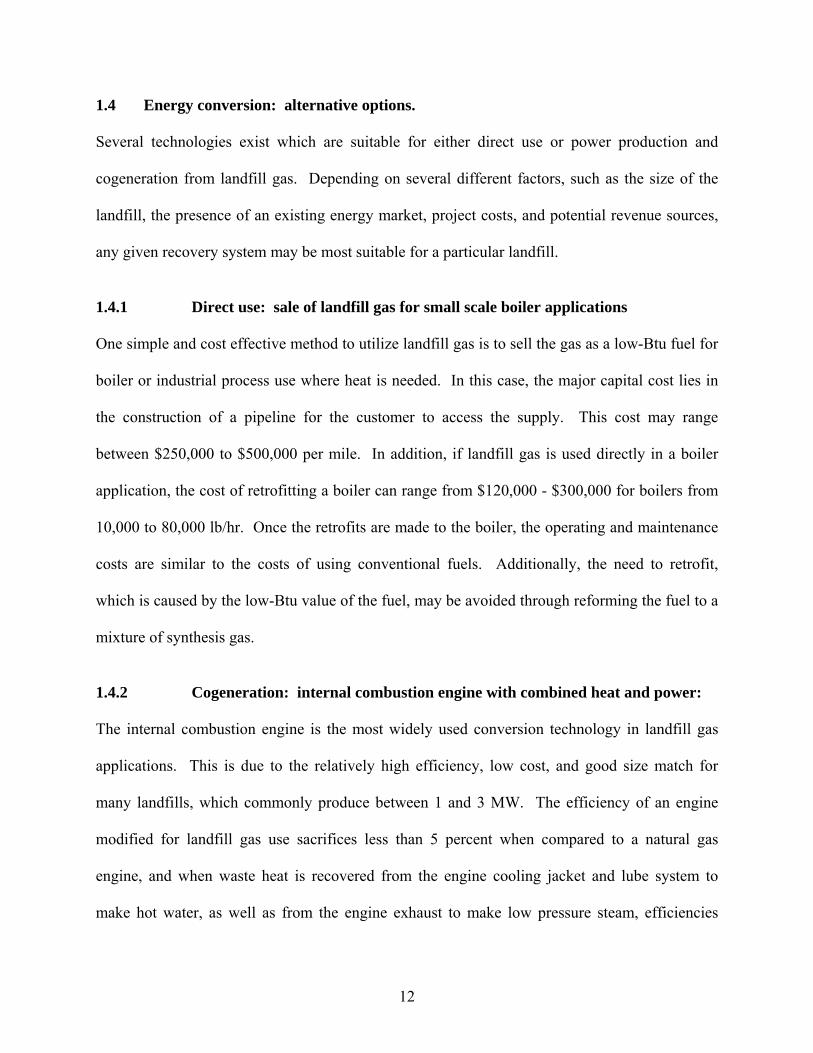
As seen in Figures 1.5 and 1.6, electricity generation and efficiency increases as the percent of
reformed landfill gas increases. The internal combustion engine is more efficient than the gas
turbine in this regime of power production, but the fuel cell system provides the greatest
potential for electricity production. However, if you consider only the hydrogen generated from
the reformed methane and CO2 molecules, as the electricity carrier for the system, the efficiency
decreases by about a factor of two. The water gas shift reaction serves to double the amount of
hydrogen in the system, as well as add heat to the system, increasing electrical and overall
combined heat and power efficiencies to very high values.
(a)

16
(b)
Fig. 1.5. Electricity generation is shown for different fuel compositions and energy conversion systems for a 0.5 megaton landfill (a), and for a 2.5 megaton landfill (b).
(a)
(b)
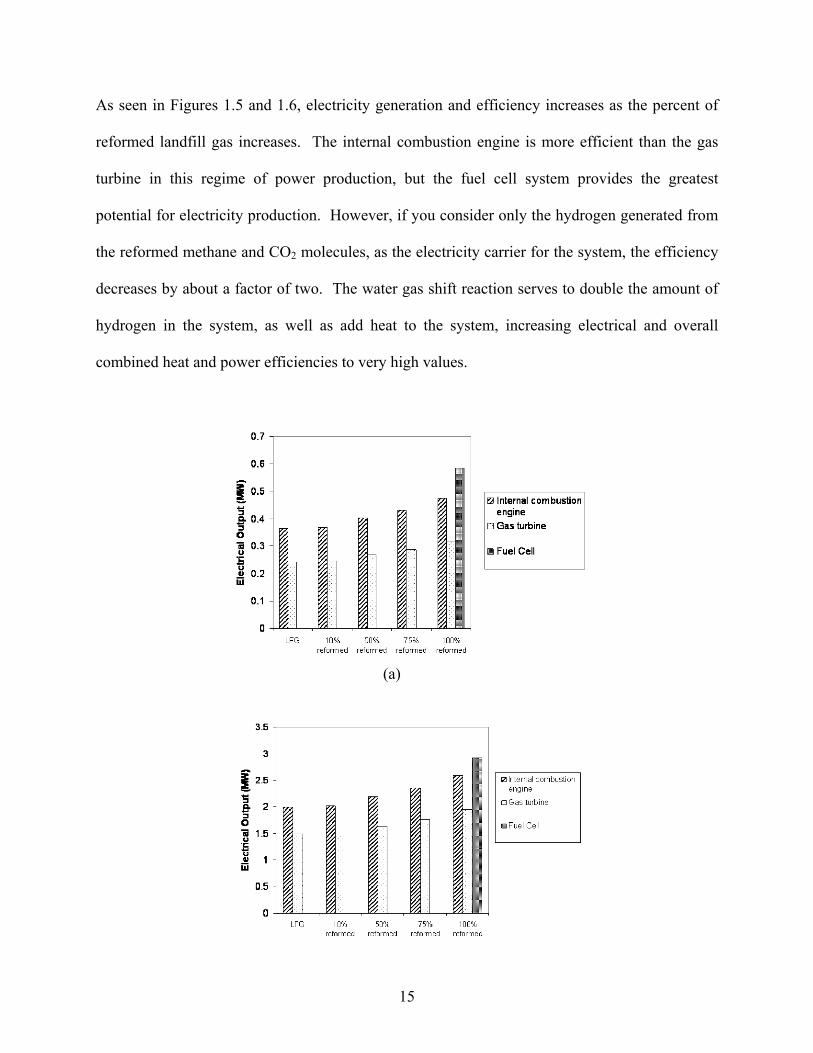
Fig. 1.6. Electrical efficiency is shown for different fuel compositions and energy conversion systems for a 0.5 megaton landfill (a), and for a 2.5 megaton landfill (b). While the electrical efficiency increases with increasing synthesis gas content, overall combined
heat and power efficiency declines. This is due to the fact that the waste heat that would
17
otherwise be available must be used to supply the heat for the highly endothermic reforming
reaction.
(a)
(b)
Fig. 1.7. Overall thermal efficiency is shown for different fuel compositions and energy conversion systems for a 0.5 megaton landfill (a), and for a 2.5 megaton landfill (b).

18
From the standpoint of generating electricity, high degrees of reforming make sense. If waste
heat is a valuable commodity, using the landfill gas as-is is most efficient, not considering the
fuel cell system.
Using the electricity production generated from a 2.5 megaton landfill under the fuel cell system
as a basis for scaling, electricity potential from United States municipal solid waste production is
on the order of 16.5 GW. This represents approximately almost 4 % of the approximately 400
GW electricity demanded in the Unites States. At this scaling, the potential for electricity
generation from landfills should not be ignored.
Alternative waste management involves the direct combustion of municipal solid waste in mass
burn facilities. While the landfill gas to energy system produces about 370 kWh electricity and
330 kWh heat per ton MSW at peak production, highly efficient waste-to-energy facilities
generate 302 kWh net electricity and 878 kWh heat per ton MSW. As the direct combustion
method employed by waste-to-energy facilities also provides a substantial land-use advantage,
the waste-to-energy approach is probably a more effective approach to generating useable energy
from MSW. But, as the current MSW management practice in the US involves landfilling 55 %
of the total MSW generated, LFG is a significant source of renewable energy to be utilized, and
the development and commercialization of a reforming technology would serve to vastly
improve the efficiency of LFG utilization.

19
2. DRY REFORMING TECHNOLOGY The development of stable dry reforming technology is attractive for social, environmental, and
economical reasons, and is suited for many applications. Aside from LFG utilization, the
reaction is an attractive route to produce syngas with low H2:CO ratios and is also well-suited for
use in chemical energy transmission systems (CETS).
Syngas is typically produced via steam methane reforming or methane partial oxidation,
resulting in high H2:CO ratios.
CH4 + H2O → CO + 3H2 ; ΔH298 = +206 kJ/mol
CH4 + ½ O2 → CO + 2H2 ; ΔH298 = -71 kJ/mol
However, synthesis of methanol and long-chain liquid hydrocarbons via the Fischer-Tropsch
process, which use syngas as the starting feedstock, would be more efficient if conducted with
syngas of low H2:CO ratios. For these end uses, the dry reforming reaction is a more
advantageous route to generate syngas.
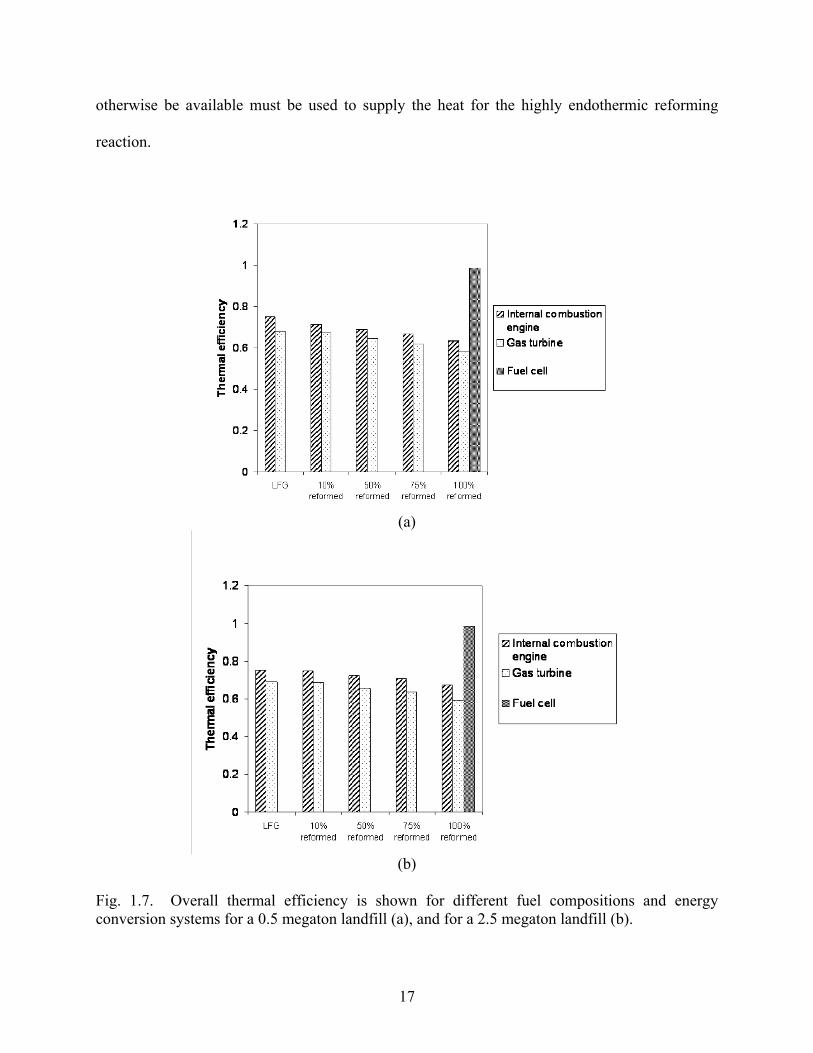
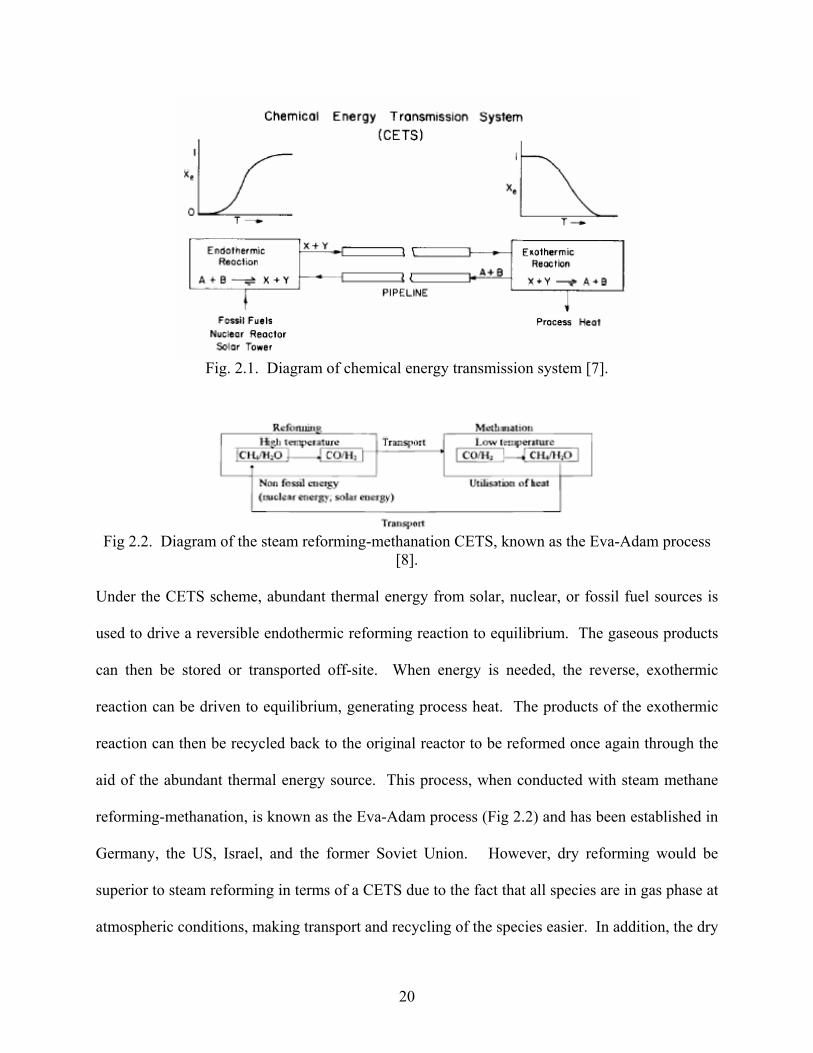
The high endothermicity of the dry reforming reaction also makes it suitable to store abundant
thermal solar or nuclear energy as chemical energy in chemical energy transmission systems
(CETS), shown in Fig 2.1.
20
Fig. 2.1. Diagram of chemical energy transmission system [7].
Fig 2.2. Diagram of the steam reforming-methanation CETS, known as the Eva-Adam process
[8].
Under the CETS scheme, abundant thermal energy from solar, nuclear, or fossil fuel sources is
used to drive a reversible endothermic reforming reaction to equilibrium. The gaseous products
can then be stored or transported off-site. When energy is needed, the reverse, exothermic
reaction can be driven to equilibrium, generating process heat. The products of the exothermic
reaction can then be recycled back to the original reactor to be reformed once again through the
aid of the abundant thermal energy source. This process, when conducted with steam methane
reforming-methanation, is known as the Eva-Adam process (Fig 2.2) and has been established in
Germany, the US, Israel, and the former Soviet Union. However, dry reforming would be
superior to steam reforming in terms of a CETS due to the fact that all species are in gas phase at
atmospheric conditions, making transport and recycling of the species easier. In addition, the dry
21
reforming is energetically superior. The major disadvantage lies in the thermodynamic tendency
for coke formation during the dry reforming reaction, deactivating the catalyst.
Thermodynamics Occurring simultaneously with the dry reforming reaction are side reactions which may cause the
formation of coke or alter the relative concentrations of species being produced. One possible
side reaction is the reverse of the water-gas-shift (WGS) reaction:
CO + H2O → CO2 + H2 (WGS)
In addition, there are several side reactions to consider which may result in coke formation,
including:
2CO → C + CO2 (CO disproportionation)
CO + H2 → C + H2O (CO reduction)
CH4 → C + 2H2 (CH4 decomposition) To gauge the thermodynamic tendency for these reactions to occur, the change in Gibbs free
energy was plotted versus temperature for the different reactions.

22
(a)
(b)
Fig. 2.3. The change in Gibbs free energy is plotted versus temperature for various reactions.

23
Taking ΔG < 0 to predict thermodynamic favorability for the forward reaction to occur, the dry
reforming reaction is not favored until the temperature reaches 650°C. The water-gas-shift
reaction is favored up until 825°C, then the reverse reaction becomes favorable. However, the
magnitude of ΔG for the WGS is relatively low, meaning that the presence of both of either the
product or reactant species could drive the reaction in either direction.
The CO disproportionation (Boudouard reaction) and CO reduction reactions are favored at
temperatures up to 700°C and 675°C, respectively. CH4 decomposition does not become
favorable until temperatures beyond 550°C. In the temperature range from 550°C to 675°C,
carbon deposition is favored by each of the CO disproportionation, CO reduction, and CH4
decomposition reactions. This can be considered the region where severe coking is expected.
Thermodynamic equilibrium calculations were performed with GASEQ to measure the
equilibrium mole fraction of solid carbon generated due to each of the carbon deposition
reaction, as seen in Fig 2.4. The program GASEQ determines the equilibrium concentrations by
minimizing Gibbs free energy. The Gibbs free energy G of the mixture at pressure p is given by:
GRT
x GRT
xxx
x pi
nSpi i
ii
ii= +
∑+
⎛
⎝⎜
⎞
⎠⎟
=∑
1
0
ln ln
where the equilibrium number of moles of species i is xi (i = 1 to nSp),Gi0 is the molar free
energy at 1 atmosphere of species i, and xi∑ is the total number of moles in the mixture. At
equilibrium G/RT is at a minimum.
24
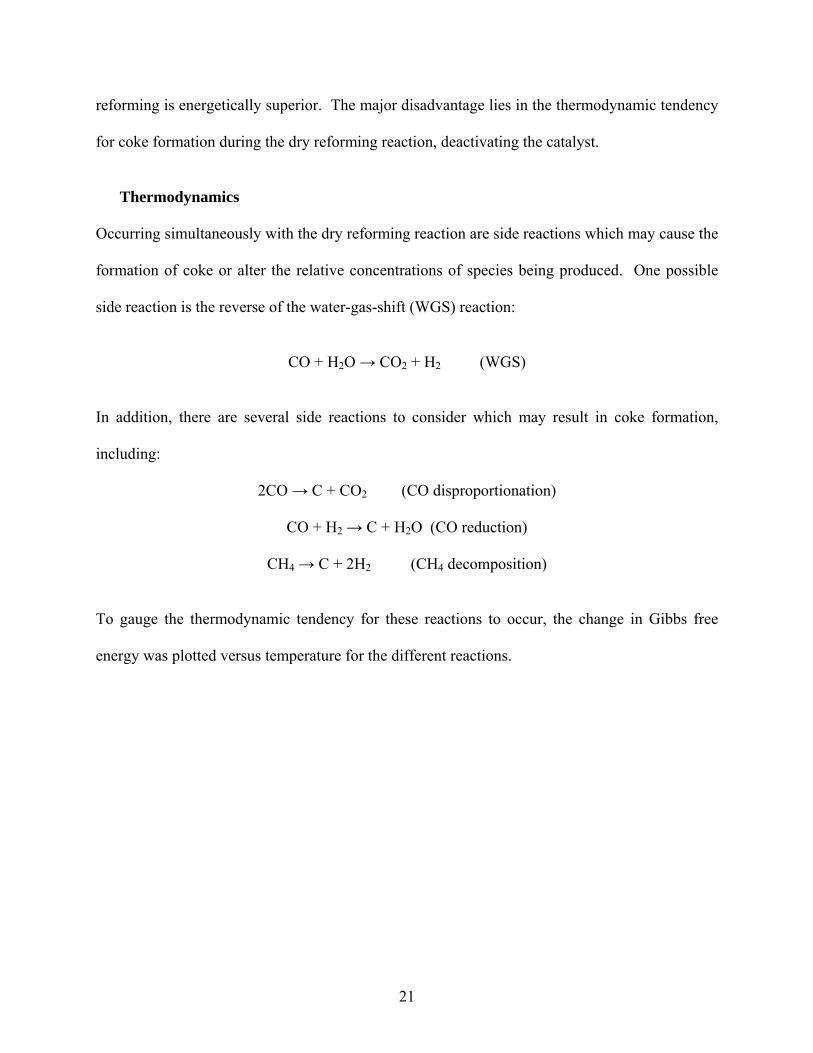
Fig. 2.4. Equilibrium mole fraction of solid carbon formed from various carbon deposition reactions is plotted versus temperature.
As expected, the equilibrium mole fractions of carbon follow the trends predicted by the relative
values of the change in Gibbs free energy for the reactions that were discussed previously. At
temperatures up to about 600°C, CO disproportionation generates the greatest equilibrium mole
fraction of solid carbon, followed by CO reduction and CH4 decomposition. Then, from about
600°C to 700°C, CO disproportionation generates the greatest equilibrium mole fraction of solid
carbon, followed by CH4 decomposition and CO reduction. Above 700°C, CH4 decomposition
results in the highest mole fraction, followed by CO disproportionation and CO reduction.
To provide a better picture of the expected concentrations of species which result from reforming
CH4 with CO2, thermodynamic equilibrium calculations were conducted for the dry reforming
reaction. Calculations were performed for a temperature range of 400°C to 900°C with an inlet
of 0.083 moles CH4, 0.083 moles CO2, and 0.834 moles Ar which are the inlet conditions for
many of the catalytic reforming studies performed, described in the following sections.
25
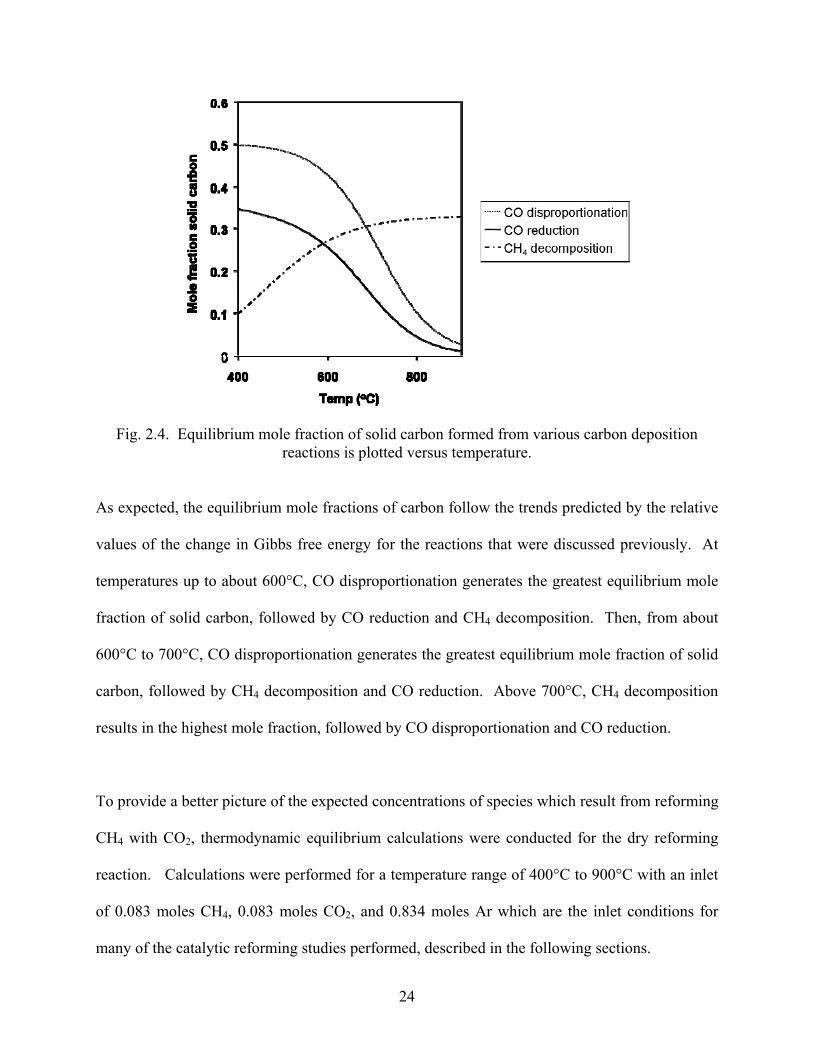
Fig. 2.5. Equilibrium mole fraction is plotted versus temperature.
From these calculations, it is shown that the greatest amounts of solid carbon are expected at low
temperatures, with the equilibrium mole fraction decreasing with increasing temperature until
about 900°C. While the thermodynamic favorability of the CH4 decomposition reaction
increases with increasing temperature, the reverse of both the CO disproportionation and CO
reduction are favored at increasing temperature, which results in less carbon formation at higher
temperatures.
In the region where carbon forms, the H2:CO and CO2:CH4 ratios are greater than one. In
addition, a high fraction of water is also expected, decreasing with increasing temperature. Each
of these results can be attributed to the dominance of the CO disproportionation and reduction

26
reactions with respect to CH4 decomposition, resulting in the generation of C, H2O, and CO2
while consuming CO.
Calculations for the effects of pressure and the feed ratio of CO2:CH4 on equilibrium
concentrations and carbon deposition regions have been presented in literature [8]. The reports
have shown that increasing the ratio of CO2:CH4 decreases the equilibrium mole fraction of solid
carbon, while increasing the pressure increases the mole fraction of carbon present. No
experimental studies have been found which have explored the effects of increasing pressure on
the kinetics.
2.2 Literature review The first comprehensive dry reforming experiments were conducted by Fischer and Tropsch in
1928 [9]. They studied the reaction over Fe, Co, Ni, Cu, Mo and W supported on clay, silica and
MgCO3 or mixed with Al2O3. Gas compositions corresponding to thermodynamic calculations
were measured and Ni and Co were found to be the preferred catalysts with activity increasing
with loading of Al2O3.
The first comprehensive kinetic study was conducted by Bodrov et al in 1967, who found that
the kinetics for dry reforming over a Ni film matched the kinetic model they had constructed
from a similar study of steam reforming [10]. Bodrov proposed the following model to describe
the dry reforming reaction in which * denotes an active site on the catalyst surface, → denotes a
slow irreversible reaction, and denotes a quasi-equilibrated reaction:

27
CH4 + * → CH2* + H2 (1) CO2 + * CO + O* (2) O* + H2 H2O + * (3) CH2* + H2O CO* + 2H2 (4) CO* + CO + * (5)
In this model, after methane has dissociated to CH2 and H2 (1), and after RWGS has produced
H2O (2 and 3), the remaining methane-derived CH2 species is reformed with H2O to produce a
net result of 2CO and 2H2 (4 and 5). If you remove steps 3 and 4, which is the equilibriated
RWGS, then you are left with a simple steam reforming mechanism, resulting in a 1:3 product
ratio of CO and H2. Since the RWGS is assumed to be fast relative to the first step of methane
activation and decomposition, you can expect the kinetics to be nearly the same for CO2
reforming as for H2O reforming of methane. The early proposal of a reaction mechanism by
Bodrov formed the initial model from which recent studies have attempted to refine and build
upon.
With increasing research, considerable insight has been attained in recent years resulting in
proposals of both modified and alternative reaction mechanisms, dependent on the type of
catalyst, the carrier, and even the temperature. But before the kinetics of the overall catalytic dry
reforming reaction can be understood fully, an understanding of the elementary steps which may
or may not be involved in the mechanism is necessary.
In 1972, Jens Rostrup-Nielsen studied the equilibria of the methane decomposition and carbon
monoxide decomposition (disproportionation) in the temperature range of 450-750°C on various
28
Ni catalysts [11]. It was found that the equilibria constants of the CO disproportionation and
methane decomposition reactions were influenced by Ni catalysts resulting in higher equilibrium
concentrations of CO and CH4, respectively, than those predicted using graphite equilibria. At
lower temperatures, the deviation is more pronounced, becoming less pronounced as temperature
increases. The experimental equilibrium correlates with crystallite size of the catalyst; the
greatest deviations from the graphite data were observed on catalysts with small Ni crystallites.
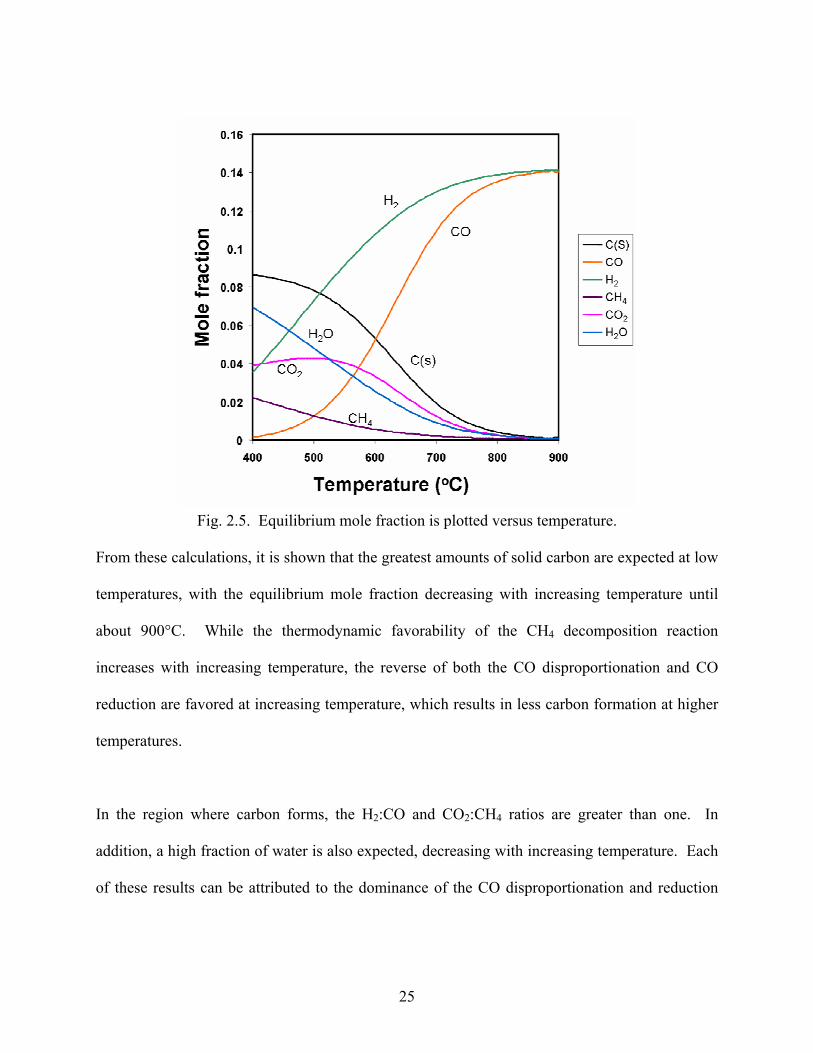
The deviation from the thermodynamic graphite calculation was explained by a more disordered
structure of the carbon (which formed as whiskers, as seen in Fig. 2.6), and by a contribution
from the surface energy of the carbon whisker. As the whisker diameter is related to the size of
the Nickel crystal, the size of the Ni crystal affects the carbon formation. The deviations were
less for the methane decomposition than they were for the CO disproportionation reaction.
Chemical composition, such as the use of carriers or promoters, did not appear to have an effect
on the observed equilibria data. Further, it was found that sulfur chemisorbed on the Ni surface
prevented the carbon deposition reactions.

29
Fig 2.6. Whisker carbon formed by CH4 decomposition over Ni catalyst. (Rostrup-Nielsen 1972)
In later publications in the 1980s and 1990s, Rostrup-Nielsen further details his research and
insights into the carbon deposition reactions over Ni catalysts [12]. As stated previously, the
Boudouard and methane decomposition reactions are catalyzed by Ni, causing carbon to grow as
a fibre/whisker. The chemisorption of methane on Ni involves the breaking of a C-H bond,
which necessitates that the molecule has sufficient energy to overcome a barrier of about 52 kJ
(12.4 kilocalories)/mol. The methane is converted to carbon through stepwise dehydrogenation:
CH4 = CH3* → CH2* → CH* = C*
Adsorbed carbon atoms that don’t react away with gaseous molecules dissolve inside the nickel
crystal and solve as carbon nucleated from the unexposed backside of the crystal. It was found

30
that adsorbed oxygen atoms had no effect on the chemisorption of methane, except decreasing
the number of available sites.
In the context of steam methane reforming, in which the primary carbon deposition route is
methane decomposition, Rostrup-Nielsen describes carbon formation as to be related to one of
two different general conditions. One limit which will result in carbon formation is a kinetic
allowance in spite of overall thermodynamics. In these conditions, local processes allow
methane to decompose into carbon instead of reacting with steam even though thermodynamics
predict no carbon formation after equilibrium of the reforming and shift reactions. The other
limit in which carbon may form is dictated by thermodynamics; carbon will be formed if the
equilibriated gas shows affinity for carbon.
Methane dissociation, carbon dioxide dissociation, and the dry reforming reaction were studied
by Erdohelyi et al in 1993 using Rh catalysts on various supports [13]. The dissociation of CH4
on Rh was seen at 423°K, producing H2 and small amounts of C2H6; the intermediate species is
undoubtedly CH3, which primarily and rapidly decomposes further to surface carbon and
hydrogen atoms, as no CH3 or CHx species were identified. With regard to the decomposition of
CH4, Al2O3 was the best support for Rh, followed by TiO2, MgO, and SiO2. The amounts of
C2H6 also decreased in this order.
The same study showed that the dissociation of CO2 was aided by the addition of CH4; the
hydrogen formed in the CH4 decomposition promotes the dissociation of CO2. Erdohelyi et al
postulated that the dissociation of CH4 is facilitated by the adsorbed O formed in the
decomposition of CO2, activating the CH4. This seemingly conflicts with Rostrup-Nielsen’s

31
findings over Ni catalysts that oxygen atoms only affected CH4 chemisorption and activation by
restricting the amount of available sites. Erdohelyi et al also found that the rate of carbon aging
from reactive carbidic carbon to amorphous carbon to graphite increases with increasing
temperature. But in the dry reforming studies, no deactivation of the Rh catalysts was
experienced, meaning that the surface carbon formed reacted away efficiently before stable
amorphous or graphitic carbon is formed. In addition, the ratio of CO:H2 was found to be greater
than one, indicating the presence of secondary processes.
Rostrup-Nielsen & Hansen expanded upon previous studies of methane decomposition, CO
disproportionation, and reforming over Ni to include the use of noble metals as catalysts,
publishing a report in 1993 [14]. The equilibrium constants for methane decomposition were
found to be even smaller for noble metals than Ni, deviating further from the graphite
equilibrium. At 500°C, the highest rate of carbon formation through methane decomposition
followed the order Ni >> Rh> Ir,Ru > Pt, Pd, while at 650°C, the order was Ni > Pd, Rh > Ir > Pt
> Ru. For the dry reforming studies conducted in the temperature range of 550-600°C, the
activity followed the order Ru, Rh > Ir > Ni, Pt, Pd. The dry reforming catalyst activity trend
followed a similar trend for steam reforming, but dry reforming had slower rates and less of a
pronounced difference between Ni and the noble metals. In addition, there was no significant
difference in the activation energies between steam and dry reforming.
In a study conducted by Richardson & Paripatyadar, Rh and Ru were shown to be suitable
catalysts for dry reforming, both displaying high activity, and Rh showing no evidence of carbon
deposition in the temperature range from 600-800° C [7]. While Ru and Rh had similar
activities, Rh showed greater stability. After 8hrs on stream, deactivation was seen at

32
temperatures of 600 and 700 deg C on both Ru and Rh, with deactivation decreasing with
increasing temperature. However, the Rhodium catalyst was not regenerable, so the deactivation
on Rh is assumed to have been from a poison in the feed, which desorbs more easily at the higher
temperatures. Carbon formation via methane thermal decomposition was not a likely source of
decomposition, as the equilibrium constant increases with increasing temperature. Carbon
deposition via CO disproportionation would be the likely cause, as its equilibrium constants
decrease with increasing temperatures. The higher resistance to deactivation for Rh agrees with
other studies which have shown it to be inactive towards the Boudouard reaction, while Ru
quickly deactivates.
Significant controversy exists regarding whether or not the support affects the mechanism,
activity, and deactivation of Rh based catalysts. While some studies have suggested that activity
is greater on unreducible oxides than on reducible oxides, other studies show no influence from
support on dry reforming rates. Of great significance in these studies is the effect of dispersion
of Rh crystallites from the support, which must be held constant if supports are to be compared.
In 1996, Zhang et al found that the specific activity of Rh catalysts decreases with respect to
carrier in the order of yttria-stabilized zirconica (YSZ) > Al2O3 > TiO2 > SiO2 > La2O3 > MgO,
while deactivation rates decreased in the order of TiO2, MgO >> YSZ, Al2O3, La2O3, SiO2 [15].
They also found that deactivation decreased with increasing Rh particle size, which conflicts
with reports earlier reports of deactivation on Ni catalysts. Further, the study showed that
activity increased with dispersion, or with decreasing Rh crystal size. Sigl et al closely examined
the role of vanadia promoted SiO2 on Rh, finding activity to increase by a factor of 15-20 [16].
33
Ceria is an intriguing promoter or carrier that should be considered for the dry reforming
reaction, selectively producing CO and H2. It has been shown that CeO2 supported catalysts have
high levels of basic sites, which selectively favor the formation of CO over CO2 in steam
methanol reforming [17]. In addition, CeO2 provides stabilization for the Al2O3 carrier against
sintering and serves as a good steam reforming catalyst for the reactions of unburned
hydrocarbons. However the reducibility of ceria and its ability to store and release oxygen is the
most intriguing aspect, possibly resulting in a new and attractive mechanism. Possible
advantages include the facilitation of CH4 dissociation due to the presence of available oxygen,
and the conversion of deposited carbon to CO. On Pt/CexZr1−xO2 catalyts, it was found that the
conversion of CH4 and CO2 was strongly correlated with Ce content in the support and that
maximum conversion occurred at the composition that exhibited the maximum reducibility [18].
Recently, Wei and Iglesia conducted studies on Rh/Al2O3 and Rh/ZrO2, measuring forward rates
and activation energies for CO2 and H2O reforming of methane [19]. Forward methane reaction
rates were found to be proportional to CH4 pressures and were independent of the identity and
concentration of co-reactants or products at 600°C. Forward rates were calculated by correcting
measured net rates for approach to equilibrium, η:
[ ] [ ][ ][ ] eqK
1PPPP
2CO4CH
22H
2CO ×=η
where Keq is the equilibrium constant at the given temperature and Pi is the prevalent partial
pressure of species i. Then the forward rate, rn, was given in terms of the observed net rate, rn,
as:

34
η−=
1n
fr
r .
It was found that the concentration of reactant products influenced net rates only by varying the
distance from equilibrium for the overall reaction; their effects disappear when these
thermodynamic effects are taken into account by converting experimental net rates to forward
reaction rates. Forward CO2 rates also increased linearly with CH4 partial pressure but were
independent of CO2 partial pressure. A mechanism was proposed:
CH4 + 2 ∗ → CH3∗ + H∗ (1)
CH3∗ + ∗ → CH2∗ + H∗ (2)
CH2∗ + ∗ → CH∗ + H∗ (3)
CH∗ + ∗ → C∗ + H∗ (4)
CO2 + 2∗ CO∗ + O∗ (5)
C∗ + O∗ CO∗ + ∗ (6)
CO∗ CO + ∗ (7)
H∗ + H∗ H2∗ + ∗ (8)
H∗ + O∗ OH∗ + ∗ (9)
OH∗ + H∗ H2O∗ + ∗ (10)
H2O∗ H2O + ∗ (11)
Further, this study concluded that forward reaction rates were dependent on dispersion, but not
on support type.

35
Most recently, Rh/La2O3 catalysts were studied for dry reforming, suggesting a support-
dependent mechanism (Munera, 2006 #102). Oxycarbonates were detected via laser Raman
spectroscopy, at it was proposed that there are two rate limiting steps, including the
decomposition of CH4 to C and 2H2, and the reaction of surface C with oxycarbonates present in
the working catalyst. Under this mechanism, after following Wei & Iglesia’s method of
correction for forward rates, it was found that the forward methane reaction rate had a reaction
order of 0.61 with respect to CH4 and 0.37 with respect to CO2. The proposed mechanism is
shown:
CH4 + * CH4*
CH4* → C* + 2H2
CO2 + La2O3 La2O2CO3
La2O2CO3 +C* → La2O3 + 2CO + *
The following experimental work was conducted to further explore and substantiate different
proposals for the kinetics of the dry reforming reaction, a topic of great interest for
environmental, social, and economic benefit.

36
3. EXPERIMENTAL DESIGN In order to experimentally obtain dry reforming reaction and deactivation kinetics and to conduct
preliminary process simulation of the LFG reforming reaction, a plug-flow reactor (PFR) system
was designed and fabricated. Steady-state, isothermal experiments were performed over Rh/γ-
Al2O3 monoliths and Ni based pellet catalysts in the PFR. Thermogravimetric Analysis was
performed to determine the amount of carbon deposition on Rh/γ-Al2O3 powder.
3.1 Reactor design
Based on literature reports of dry reforming conversions over various catalysts, a differential
plug-flow reactor was designed to perform kinetic studies. Dry reforming reaction rates and
corresponding catalyst volumes were obtained from literature, and space velocities were
calculated to determine the appropriate scaling for reactor components. Space velocity was
defined in terms of the total volumetric flowrate Q and the bulk volume of the monolith or pellet
catalyst bed V:
VQGHSV =
Starting with a fixed monolith reactor volume of 3.62 cm3, mass flow controllers were ordered to
provide a total flow of 240-960 ml/min, while staying at least 20 % from the maximum or
minimum output of the flow controller. This resulted in a GHSV of 4,000-16,000 1/hr, which
was calculated to be an appropriate range to conduct kinetic studies for Ni based catalysts. The
catalyst volume could then be adjusted to increase or decrease the space velocity if needed.
37
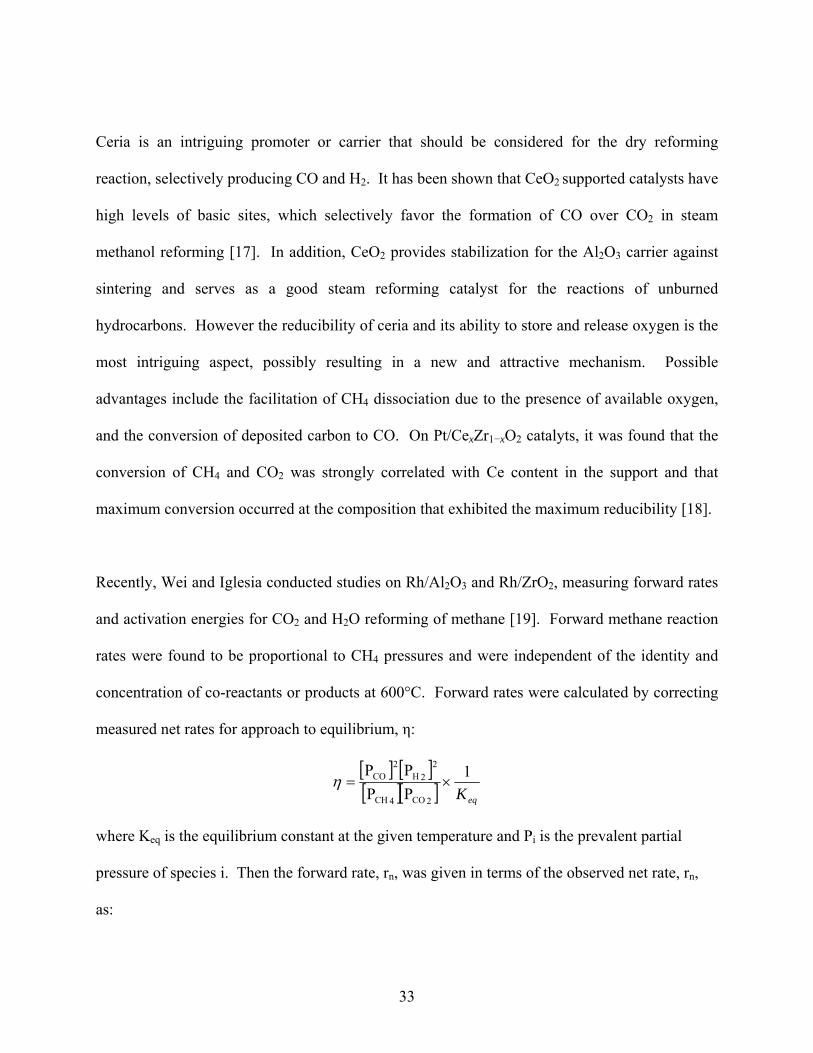
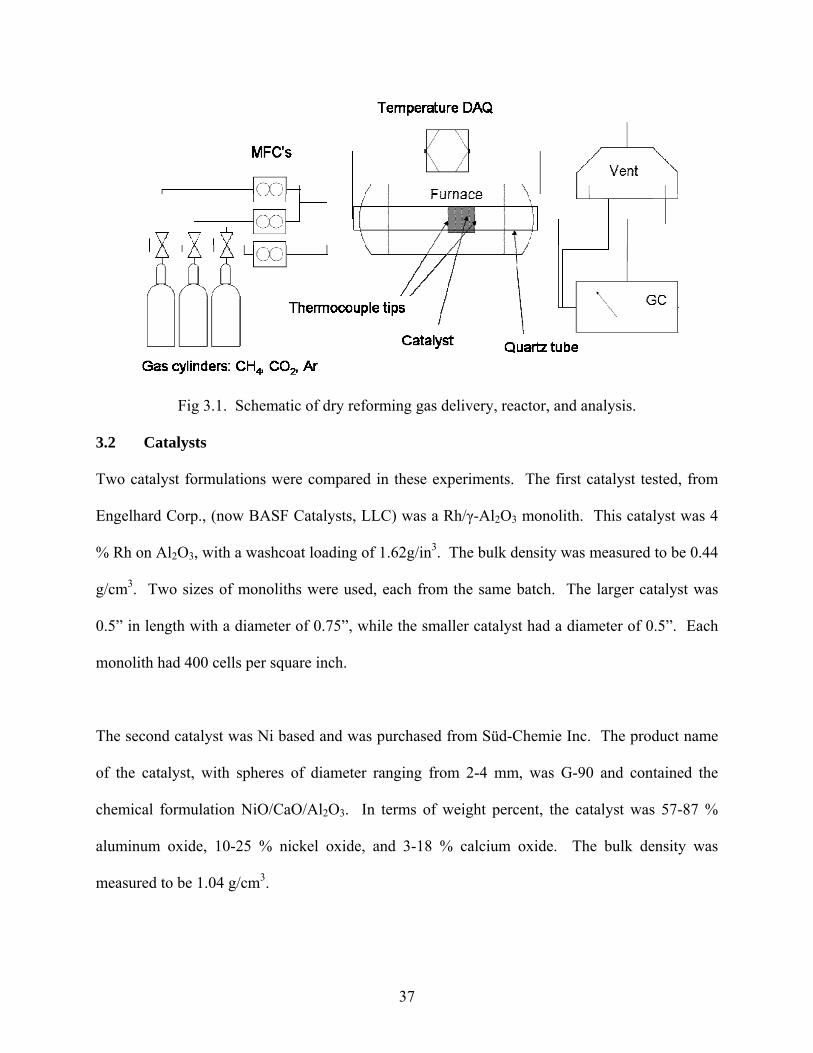
Fig 3.1. Schematic of dry reforming gas delivery, reactor, and analysis.
3.2 Catalysts
Two catalyst formulations were compared in these experiments. The first catalyst tested, from
Engelhard Corp., (now BASF Catalysts, LLC) was a Rh/γ-Al2O3 monolith. This catalyst was 4
% Rh on Al2O3, with a washcoat loading of 1.62g/in3. The bulk density was measured to be 0.44
g/cm3. Two sizes of monoliths were used, each from the same batch. The larger catalyst was
0.5” in length with a diameter of 0.75”, while the smaller catalyst had a diameter of 0.5”. Each
monolith had 400 cells per square inch.
The second catalyst was Ni based and was purchased from Süd-Chemie Inc. The product name
of the catalyst, with spheres of diameter ranging from 2-4 mm, was G-90 and contained the
chemical formulation NiO/CaO/Al2O3. In terms of weight percent, the catalyst was 57-87 %
aluminum oxide, 10-25 % nickel oxide, and 3-18 % calcium oxide. The bulk density was
measured to be 1.04 g/cm3.
38
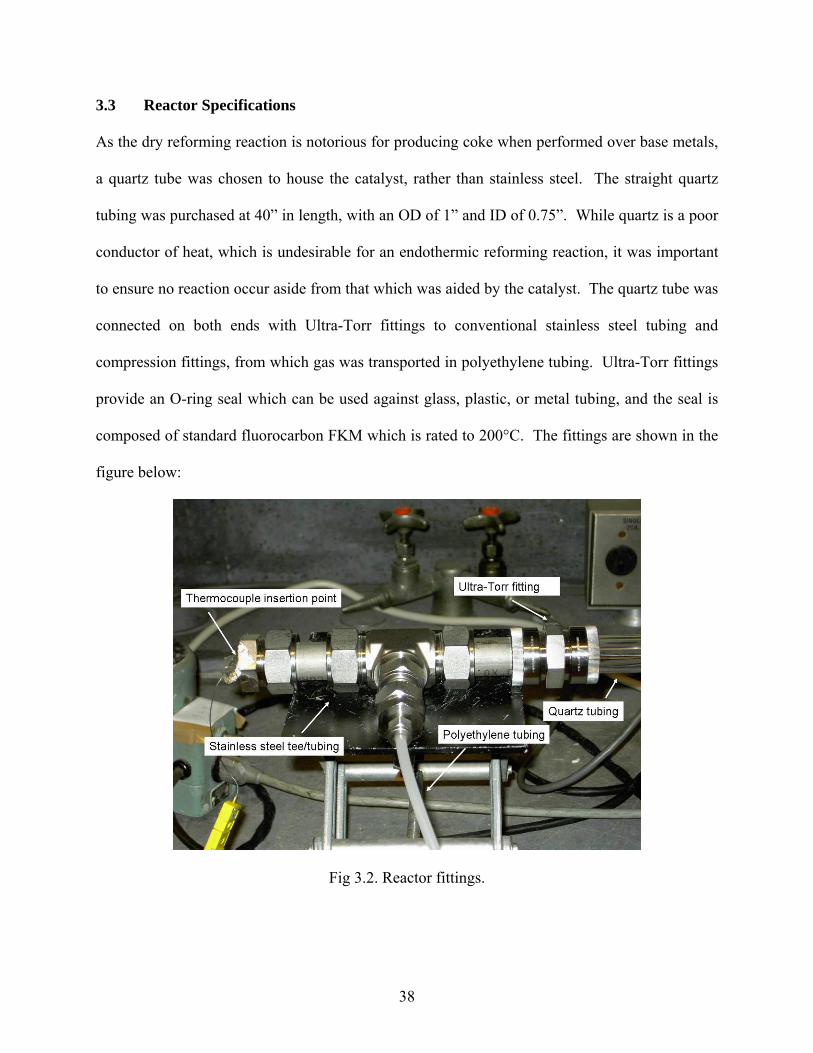
3.3 Reactor Specifications
As the dry reforming reaction is notorious for producing coke when performed over base metals,
a quartz tube was chosen to house the catalyst, rather than stainless steel. The straight quartz
tubing was purchased at 40” in length, with an OD of 1” and ID of 0.75”. While quartz is a poor
conductor of heat, which is undesirable for an endothermic reforming reaction, it was important
to ensure no reaction occur aside from that which was aided by the catalyst. The quartz tube was
connected on both ends with Ultra-Torr fittings to conventional stainless steel tubing and
compression fittings, from which gas was transported in polyethylene tubing. Ultra-Torr fittings
provide an O-ring seal which can be used against glass, plastic, or metal tubing, and the seal is
composed of standard fluorocarbon FKM which is rated to 200°C. The fittings are shown in the
figure below:
Fig 3.2. Reactor fittings.
39
The tube was taken to BASF (Engelhard) to be shortened to 32” in length to ease the operation of
the reactor for a single researcher. Before cutting the tube, calculations were conducted to
ensure that the temperature of the gas leaving the reactor would not be so high as to melt the O-
ring seals in the fittings outside.
3.4 Heat supply
A two-stage 750 Watt Multiple Unit ™ furnace was used to provide heat for the reaction. The
maximum operating temperature of the furnace is approximately 1000°C, the length is 64cm, and
maximum tube diameter is 2”. The temperature of each furnace was controlled via two Variac
voltage transformers.
3.4.1 Furnace temperature profile
Before the catalyst could be positioned in the reactor, an experiment was performed to obtain a
temperature profile for the furnace, illustrating the heat loss and regions of constant temperature.
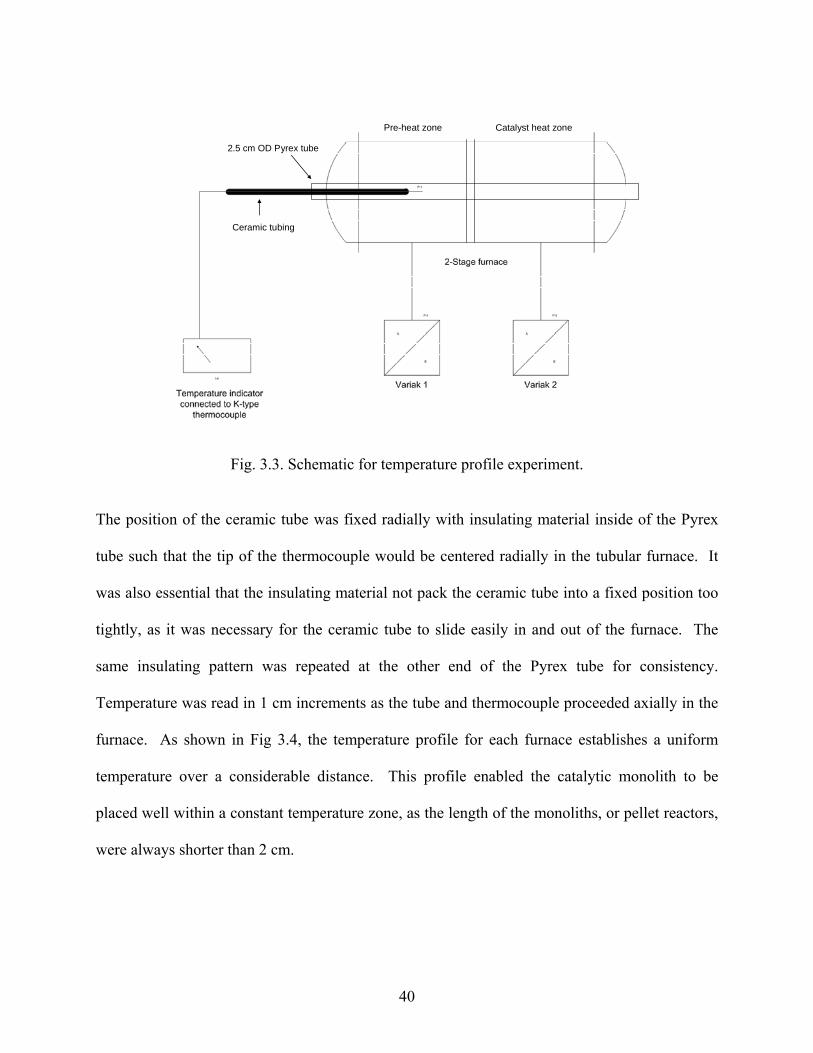
Each stage of the two-stage furnace was heated to approximately 300°C at its hottest point. A
2.5 cm OD Pyrex tube extended 9.5 cm out from each end of the furnace. Temperature readings
were attained by placing a K-type thermocouple inside of a 0.5 cm OD ceramic tube with the
thermocouple protruding 6 cm from the end of the tube. The accuracy of the K-type readings
were confirmed by comparing temperature readings with an E-type at a couple different
positions within the furnace, and the readings were within about 1 degree C.
40
Pre-heat zone Catalyst heat zone
2.5 cm OD Pyrex tube
Ceramic tubing
Fig. 3.3. Schematic for temperature profile experiment.
The position of the ceramic tube was fixed radially with insulating material inside of the Pyrex
tube such that the tip of the thermocouple would be centered radially in the tubular furnace. It
was also essential that the insulating material not pack the ceramic tube into a fixed position too
tightly, as it was necessary for the ceramic tube to slide easily in and out of the furnace. The
same insulating pattern was repeated at the other end of the Pyrex tube for consistency.
Temperature was read in 1 cm increments as the tube and thermocouple proceeded axially in the
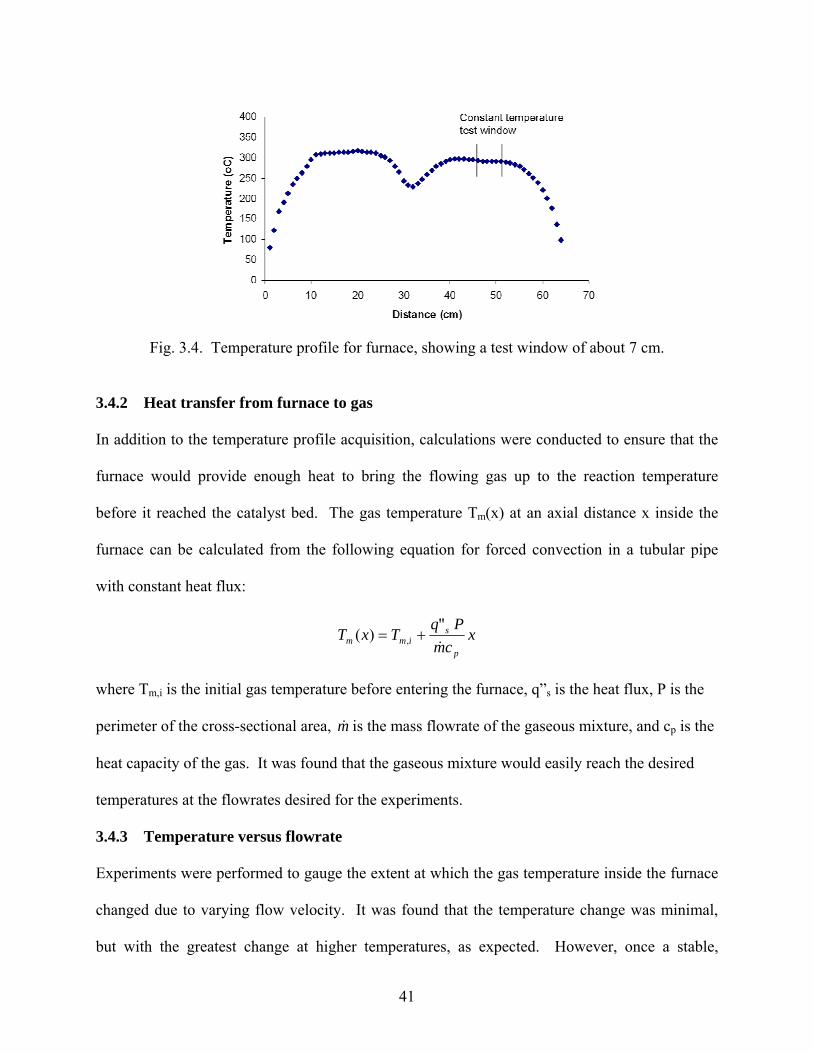
furnace. As shown in Fig 3.4, the temperature profile for each furnace establishes a uniform
temperature over a considerable distance. This profile enabled the catalytic monolith to be
placed well within a constant temperature zone, as the length of the monoliths, or pellet reactors,
were always shorter than 2 cm.
41
Fig. 3.4. Temperature profile for furnace, showing a test window of about 7 cm.
3.4.2 Heat transfer from furnace to gas
In addition to the temperature profile acquisition, calculations were conducted to ensure that the
furnace would provide enough heat to bring the flowing gas up to the reaction temperature
before it reached the catalyst bed. The gas temperature Tm(x) at an axial distance x inside the
furnace can be calculated from the following equation for forced convection in a tubular pipe
with constant heat flux:
xcm
PqTxT
p
simm &
")( , +=
where Tm,i is the initial gas temperature before entering the furnace, q”s is the heat flux, P is the
perimeter of the cross-sectional area, m& is the mass flowrate of the gaseous mixture, and cp is the
heat capacity of the gas. It was found that the gaseous mixture would easily reach the desired
temperatures at the flowrates desired for the experiments.
3.4.3 Temperature versus flowrate
Experiments were performed to gauge the extent at which the gas temperature inside the furnace
changed due to varying flow velocity. It was found that the temperature change was minimal,
but with the greatest change at higher temperatures, as expected. However, once a stable,

42
targeted flow was established, the temperature stabilized and remained unchanged as long as the
flow remained constant.
120.8121
121.2
121.4121.6121.8
122
122.2122.4122.6
0 200 400 600 800 1000
Argon flowrate (ml/min)
Inle
t tem
p (d
eg C
)
331331.5
332332.5
333333.5
334334.5
335335.5
336336.5
0 200 400 600 800 1000
Argon flowrate (ml/min)
Inle
t tem
p (d
eg C
)
573
574
575
576
577
578
579
580
581
582
583
0 200 400 600 800 1000
Argon flowrate (ml/min)
Inle
t tem
p (d
eg C
)
Fig. 3.5. At three different fixed voltage settings, temperature at the inlet of the reactor is shown versus varying flowrate.

43
3.5 Temperature acquisition
Closed-bead, grounded, K-type thermocouples from Omega were used to acquire temperature at
the inlet and outlet of the catalyst bed. Holes were drilled in stainless steel caps at the ends of
the tube-fittings 1/32 inch diameter, and the thermocouples were inserted through these holes and
fed towards the reactor. The thermocouples were centered radially by placing them in blank
ceramic monoliths. Initially, quartz fritted discs were used to fix the radial position of the
thermocouples on either end of the reactor, but the ceramic putty which was used to fix the thin
thermocouples to the frits proved to form too fragile of a bond. Temperature readings were
acquired with an Omega OMB-DAQ-54 data acquisition system.
Fig 3.6. Reactor shown with fritted discs holding thermocouples on either end of the monolith.
44
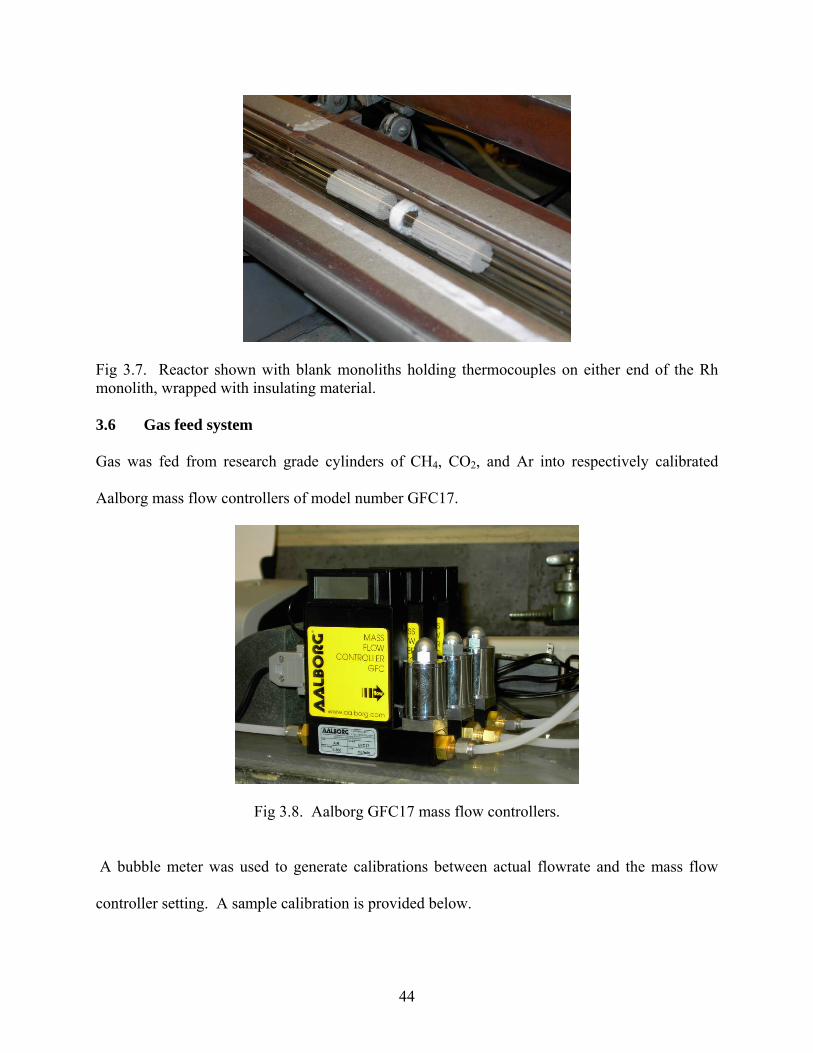
Fig 3.7. Reactor shown with blank monoliths holding thermocouples on either end of the Rh monolith, wrapped with insulating material. 3.6 Gas feed system
Gas was fed from research grade cylinders of CH4, CO2, and Ar into respectively calibrated
Aalborg mass flow controllers of model number GFC17.
Fig 3.8. Aalborg GFC17 mass flow controllers.
A bubble meter was used to generate calibrations between actual flowrate and the mass flow
controller setting. A sample calibration is provided below.

45
CH4 (with H2 MFC)y = 1.2818x + 1.1676
0102030405060708090
100
0 10 20 30 40 50 60 70 80
Actual flowrate (ml/min)
MFC
set
ting
Fig 3.9. Calibration for methane using MFC originally calibrated for hydrogen.
Table 2.1. Items purchased to conduct reactor studies.
Unit Vendor Item Part No. (quantity)
Mass flow control Aalborg Instruments Mass flow control (NH3) 500ml/min) SKUW9459 (1)
Mass flow control (H2) 100ml/min) GFCS010031 (1) Mass flow control (Ar) 1000ml/min) GFCS010047 (1) Power adapters PS-GFC-110NA-2 (3) Reactor tube Chemglass Quartz tube (32" length, 1" OD, 3/4" ID) CGQ-0800-66 (2) Quartz fritted disk (3/4", extra coarse) CGQ-0207-09 (2) Reactor fittings Swagelok Ultra Torr union (1" OD) SS-16-UT-6 (2) Reducing union tee SS-1610-3-16-12 (2)
Cap (1" tube OD) SS-1610-C (2) Stainless steel tube (1" length, 3/4" OD) 321-12-X-3 (2) Stainless steel tube (1" length, 1" OD) 321-16-X-1 (4) Themocouples Omega K-type (32" length, 1/32" OD) KMQXL-032G-32 (5)
3.7 Gas analysis
Gas analysis was conducted with an Agilent 3000 Micro GC, pictured below.
46
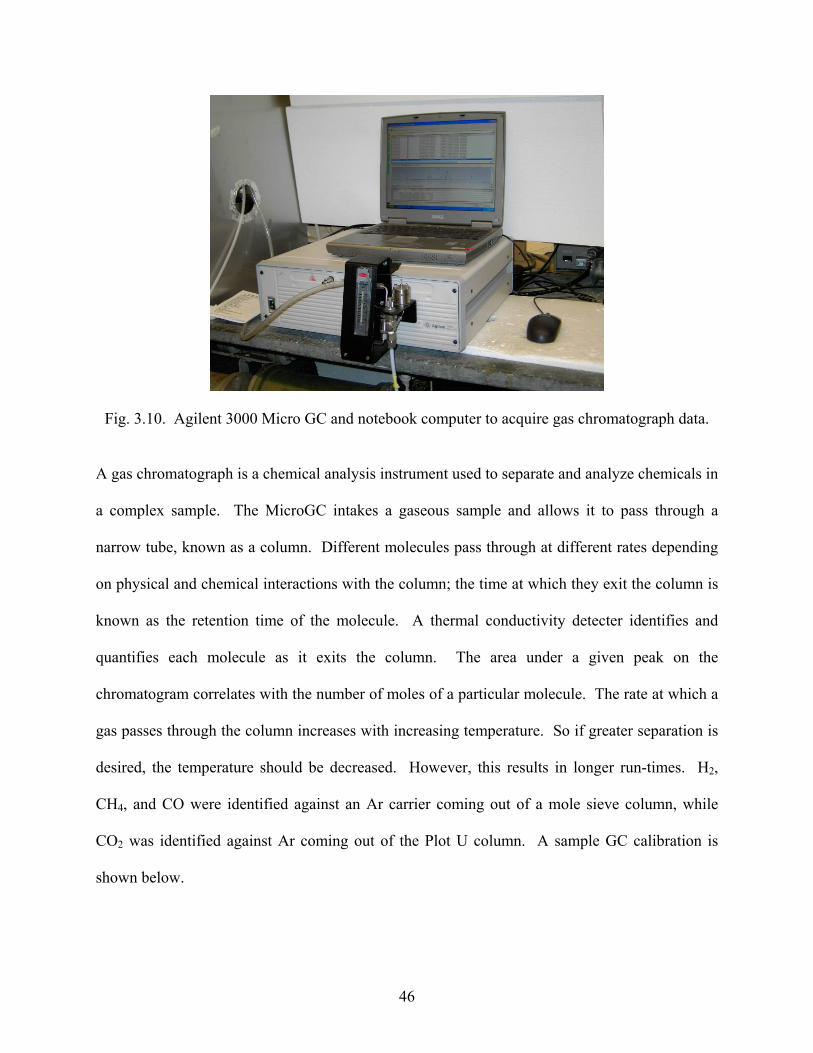
Fig. 3.10. Agilent 3000 Micro GC and notebook computer to acquire gas chromatograph data.
A gas chromatograph is a chemical analysis instrument used to separate and analyze chemicals in
a complex sample. The MicroGC intakes a gaseous sample and allows it to pass through a
narrow tube, known as a column. Different molecules pass through at different rates depending
on physical and chemical interactions with the column; the time at which they exit the column is
known as the retention time of the molecule. A thermal conductivity detecter identifies and
quantifies each molecule as it exits the column. The area under a given peak on the
chromatogram correlates with the number of moles of a particular molecule. The rate at which a
gas passes through the column increases with increasing temperature. So if greater separation is
desired, the temperature should be decreased. However, this results in longer run-times. H2,
CH4, and CO were identified against an Ar carrier coming out of a mole sieve column, while
CO2 was identified against Ar coming out of the Plot U column. A sample GC calibration is
shown below.

47
y = 1.67501E-05x + 2.24696E-03
0
0.2
0.4
0.6
0.8
1
1.2
0 10000 20000 30000 40000 50000 60000 70000
area
CO m
ole
fract
ion
Fig 3.11. Calibration curve for CO is shown.
48
4. EXPERIMENTAL METHODS 4.1 Steady state reactor studies Experiments were performed using the catalytic PFR system described previously to explore dry
reforming conversion and kinetics at varying temperatures, space velocities, and feed ratios.
4.1.1 Baseline reactor studies Prior to conducting catalytic dry reforming PFR studies, reactant gas compositions were sent
through the PFR at high temperatures and varying space velocities without catalyst to measure
baseline conversion. Total gas flows ranged from 420-900 ml/min (furnace residence times of
0.43-0.2 min) with furnace temperatures up to 900°C. Partial pressures of the feed gases,
dictated by mass flow controller settings, were 0.083 atm CH4, 0.083 CO2, and 0.834 atm Ar.
Conversion was measured by taking GC samples of the reactor effluent.
Detailed procedure.
1. The MFCs were plugged in to warm up; the local setpoints on the units were checked to
be dialed off.
a. After 30 minutes of warming up, the valves at the gas cylinders were opened to
provide a pressure of 25 psi to the MFCs while leaving the MFC flow dialed off.
2. GC calibration.
a. The calibration gas cylinder was connected to a spare mass flow controller or
rotometer, which sent pure calibration gas with known concentrations of H2, CO,
CH4, and CO2 into the GC. Calibrations and retention times were checked.
3. Reactor assembly.

49
a. Thermocouples were inserted through the tiny holes in the end caps and were fed
through until they protruded out of the fittings. Then, the ends of the
thermocouples were pushed through the center channel of the blank monoliths so
that they protruded 1 cm out from the end.
b. The blank monoliths (containing thermocouples) were placed inside of the quartz
tube, and the Ultra-Torr fittings were sealed.
c. The thermocouple/monoliths were pushed into the tube such that one
thermocouple tip was located 47 cm downstream into furnace and the other was
48.5cm downstream. Then, they were taped in place on the outside of the cap
with alumina tape, sealing the hole in which they were inserted.
4. The mass flow controllers were dialed to the desired setting, and then sent to the GC to
check the calibrations. If they did not hit the expected mole fractions from the GC
calibrations, the gas flow on the mass flow controllers was adjusted. Typically, an
adjustment of more than 5 ml/min was not needed. When the calibrations were in order,
the MFCs were turned off.
5. Tube connections were checked from gas cylinders to mass flow controllers (MFCs),
from the MFCs to the connecting cross, from the cross to the reactor, and from the reactor
to the GC.
6. The argon flow was turned on to 500 ml/min, leaving the CH4 and CO2 off.
7. The two-stage furnace was turned on. The Variacs were set very high initially to the
ramp up to the desired temperature quickly. Then small adjustments were made to keep
the temperature constant at the desired temperature.
8. The CO2 and the CH4 MFCs were dialed on.

50
9. Six GC samples were taken at each condition. Each time the GC took a sample,
temperature was recorded.
10. CH4 and CO2 MFCs were turned off.
11. Furnace was turned off.
12. When the reactor temperature dropped below 200°C, the Ar MFC was turned off.
13. Gas cylinders were closed.
4.1.2 Stoichiometric reforming studies Stoichiometric dry reforming studies were performed over Rh/γ-Al2O3 monolith and Ni catalysts
at space velocities from 7,000-34,000 1/hr and temperatures from 500-590°C. Partial pressures
of the feed gases, controlled by mass flow controllers, were 0.083 atm CH4, 0.083 CO2, and
0.834 atm Ar. Conversion was measured by taking GC samples of the reactor effluent.
Detailed procedure.
1. Insulation pretreatment.
a. The insulating material that was to be used to wrap the Rh/γ-Al2O3 monolith was
placed inside of the empty quartz tube.
b. The reactor was assembled with thermocouples, but no catalyst, as in the baseline
experiments.
c. 200 ml/min air was flowed through the reactor, while the temperature was
increased to 700°C. Air flow was held for 15 minutes at 700°C.
d. The air flow and furnace was shut off and allowed to cool.
e. The pre-treated insulation was removed from the empty tube and wrapped around
the Rh/γ-Al2O3 monolith to the appropriate 0.75” diameter.
51
2. The MFCs were plugged in to warm up; the local setpoints on the units were checked to
be set at zero ml/min of outlet flow.
a. After 30 minutes of warming up, the valves at the gas cylinders were opened to
provide a pressure of about 25 psi to the MFCs while leaving the MFC flow
dialed off.
3. GC calibration.
a. The calibration gas cylinder was connected to a spare mass flow controller or
rotometer, which sent pure calibration gas with known concentrations of H2, CO,
CH4, and CO2 into the GC. Calibrations and retention times were checked.
4. Reactor assembly.
a. The catalyst was placed inside of the quartz tube so that the tube was centered in
the furnace and the front end of the monolith was 47 cm downstream in the
furnace.
b. Thermocouples were inserted through the tiny holes in the end caps and were fed
through until they protruded out of the fittings. Then, the ends of the
thermocouples were pushed through the center channel of the blank monoliths so
that they protruded 1 cm out from the end.
c. The blank monoliths (containing thermocouples) were placed inside of the quartz
tube, and the Ultra-Torr fittings were sealed.
d. The thermocouple/monoliths were pushed into the tube such that one
thermocouple tip was located 47 cm downstream into furnace and the other was
48.5cm downstream. Then, they were taped in place with alumina tape, sealing
the hole in which they were inserted.

52
5. The mass flow controllers were dialed to the desired setting and the mixture was sent
directly to the GC to check the calibrations. If they did not meet the expected mole
fractions from the GC calibrations, the gas flow on the mass flow controllers was
adjusted. When the calibrations were in order, the MFCs were turned off.
6. Tube connections were checked from gas cylinders to mass flow controllers (MFCs),
from the MFCs to the connecting cross, from the cross to the reactor, and from the reactor
to the GC.
7. The argon flow was turned on to 500 ml/min, leaving the CH4 and CO2 off.
8. The two-stage furnace was turned on. The Variacs were set very high initially to the
ramp up to the desired temperature quickly. Then small adjustments were made to keep
the temperature constant at the desired temperature.
9. The CO2 and the CH4 MFCs were dialed on.
10. Six GC samples were taken at each temperature for a given space velocity. Each time the
GC took a sample, temperature was recorded.
11. CH4 and CO2 MFCs were turned off.
12. Feed gas was routed to the GC, where the calibrations for the next flow settings were to
be checked. When the calibrations were in line, experiments were repeated at the new
space velocity, at the same temperature range.
13. When experiments were finished, reactive gases were turned off and the furnace was
turned off.
14. When the reactor temperature dropped below 200°C, the Ar MFC was turned off.
15. Gas cylinders were closed.

53
4.1.3 Varying CO2 Dry reforming studies were performed over a Rh/γ-Al2O3 monolith with CO2 partial pressures
from 0.042-0.25 atm and temperatures from 500-590°C, at space velocities of 15,000 and 34,000
1/hr. The partial pressure of CH4 was held constant at 0.083, while the partial pressure of Ar was
tuned to maintain a constant space velocity. Conversion was measured by taking GC samples of
the reactor effluent. The detailed procedure was very similar to that of the stoichiometric
reforming procedure.
4.1.4 Varying CH4 Dry reforming studies were performed over a Rh/γ-Al2O3 monolith with CH4 partial pressures
from 0.042-0.25 atm and temperatures from 500-590°C, at space velocities of 15,000 and 34,000
1/hr. The partial pressure of CO2 was held constant at 0.083, while the partial pressure of Ar was
tuned to maintain a constant space velocity. Conversion was measured by taking GC samples of
the reactor effluent. The detailed procedure was very similar to that of the stoichiometric
reforming procedure.
4.2 Deactivation studies Experiments were conducted with the PFR, as well as with thermogravimetric analysis, to
examine catalyst deactivation. A preliminary TGA-DTA test was also conducted over a spent
Rh/γ-Al2O3 sample to measure thermal evolution in an oxidizing atmosphere.
4.2.1 On-stream activity Throughout the Rh/γ-Al2O3 monolith PFR studies, initial test conditions were periodically
repeated so that changes in activity could be checked.

54
4.2.2 TGA Thermogravimetric analysis was also conducted in a TG-DTA/DSC Apparatus STA 409PC/4/H
Luxx manufactured by Netsch. After a background test was performed a Rh/γ-Al2O3 powder
sample was placed in the TGA and gas flow rates of 10 ml/min CH4, 10 ml/min CO2, and 100
ml/min Ar were turned on, controlled by Aalborg MFCs. Temperature was ramped up to the
desired temperature, where isothermal conditions were maintained for over three hours while
mass percent change was recorded.
4.2.3 TGA-DTA After the TGA study was conducted to measure mass percent change while reforming,
simultaneous DTA-TGA in an oxidizing atmosphere was conducted over the spent sample to
measure heat of reaction and mass change. Gas flowrates of 10 ml/min O2 and 100 ml/min Ar
were sent into the TGA which held the spent sample, and temperature was ramped up to 800°C.
Mass percent change and differential thermal analysis were conducted simultaneously.

55
5 RESULTS 5.1 Baseline studies. Experimental measurements of outlet species from the PFR without catalyst showed no
measurable conversion up to 900°C, with furnace residence times of 0.43-0.20 minutes (inlet gas
composition of 0.083 atm CH4, 0.083 atm CO2, 0.834 atm Ar). At 900°C and at the longest
residence time, H2 and CO were detected at ppm level.
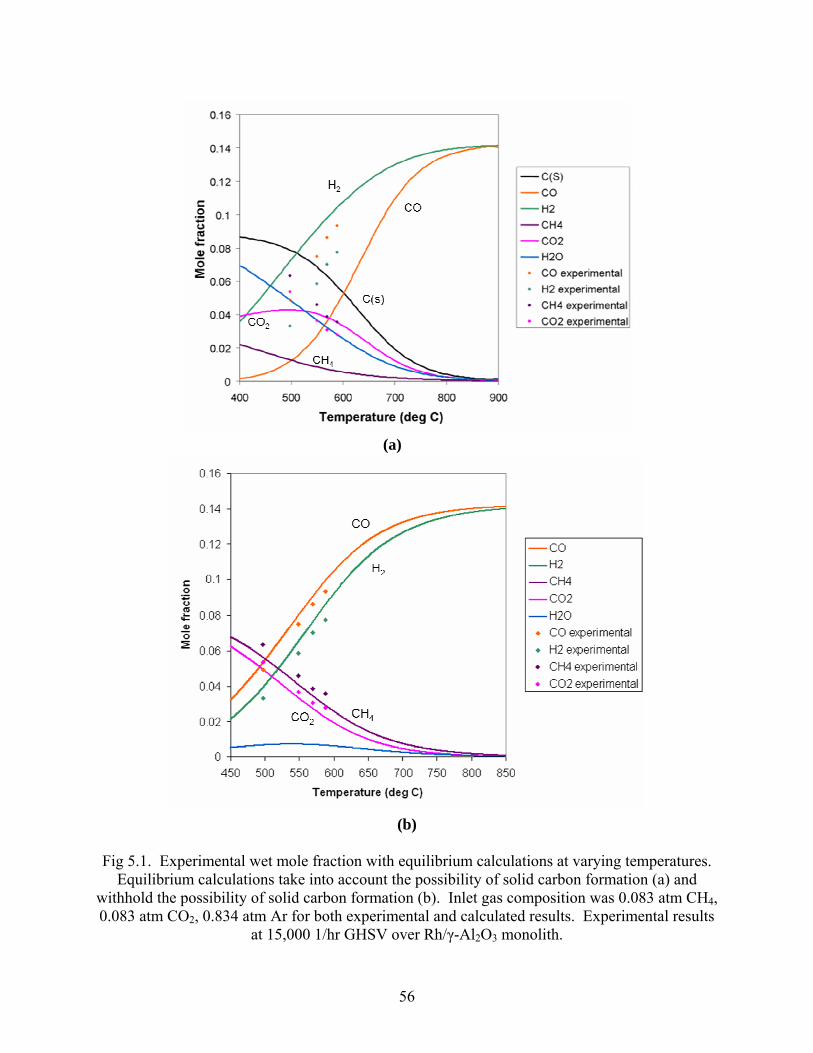
5.2 Stoichiometric dry reforming studies. Experimental measurements of effluent species concentrations from the Rh/γ-Al2O3 monolith
reactor deviated from thermodynamic equilibrium calculations which included the possibility for
solid carbon formation (Fig 5.1a). Concentrations of CO were far beyond that which was
predicted resulting in a CO:H2 ratio greater than unity, and other species showed no correlation
to predicted concentrations over the temperature range from 500-590°C. When compared with
thermodynamic equilibrium calculations which restrict the possibility of forming solid carbon,
however, the experimental data shows strong correlation (Fig 5.1b).
56
(a)
(b)
Fig 5.1. Experimental wet mole fraction with equilibrium calculations at varying temperatures.
Equilibrium calculations take into account the possibility of solid carbon formation (a) and withhold the possibility of solid carbon formation (b). Inlet gas composition was 0.083 atm CH4, 0.083 atm CO2, 0.834 atm Ar for both experimental and calculated results. Experimental results
at 15,000 1/hr GHSV over Rh/γ-Al2O3 monolith.

57
As the space velocity was decreased to 7,000 1/hr, the observed mole fractions approached the
thermodynamic equilibrium predictions that precluded the possibility of carbon formation, with
closest approach at the highest temperature (Fig 5.2). At 7,000 1/hr and 590°C, equilibrium is
achieved ± 5 %, with conversions of nearly 70 % of the reactants. As space velocity is increased
by a factor of 5, conversions drop to approximately 20 % at 500°C (60 % of equilibrium).
Conversion x is calculated as the change in flowrate divided by the initial flowrate:
io
ifio
mmm
x&
&& −= .
(a) (b)

58
(c) (d)
Fig 5.2. Fraction to equilibrium versus GHSV at 500°C (a), 550°C (b) 570°C (c), and 590°C
(d). Inlet gas composition was 0.083 atm CH4, 0.083 atm CO2, 0.834 atm Ar.
Data reproducibility
As each experimental condition was repeated six times to produce a data point, a range was
produced; the mean average was taken, along with x and y error bars representing maximum and
minimum temperatures and mole fractions. A representative illustration of the typical range
throughout PFR investigations is seen in Fig 5.3. As indicated by the error bars, the range from
minimum to maximum is very tight. While there was little deviation in the GC measurements or
between the mean temperatures, a gradient of up to 40°C was measured between the inlet and
outlet of the reactor, resultant of the strong endothermicity of the reactions occurring.

59
Fig 5.3. Wet mole fraction versus temperature for inlet gas composition of 0.083 atm CH4, 0.083 atm CO2, 0.834 atm Ar and GHSV of 15,000 1/hr. Error bars indicate maximum and
minimum temperatures and mole fractions in a dataset of six repetitions.
Net reaction rates were calculated for CH4 and CO2 in terms of rate of disappearance, and for H2
and CO in terms of rate of appearance. First, measured inlet and outlet mole fractions, Xio and
Xif, were converted to inlet and outlet mass fractions Yio and Yif
mix
iii MW
MWXY =
where MWi is the molecular weight of the species and MWmix is the calculated molecular weight
of the mix, with Ar composing the balance of the measured species and neglecting other
unmeasured species. Reaction rate ri was then calculated as

60
gRhMWm
YiYiri
totofi
&)( −=
where m& is the mass flowrate, and g-Rh is the amount of Rhodium deposited on the catalyst in
grams. The value of g-Rh is calculated on the basis that the entire catalyst (ceramic monolith
and washcoat) was measured to have a bulk density of 1.99 g-cat/in3, and the Rh/Al2O3 washcoat
is loaded at 1.62 g-Rh/Al2O3/in3 with 4 % Rh. Reaction rates versus space velocities are shown
below in Fig 5.4, at temperatures from 500-590°C, and reaction rate is plotted versus temperature
in Fig 5.5. As seen in Fig 5.4, reaction rates are increasing with space velocity, even at the lowest
residence time. This indicates that the reaction is likely to be limited by bulk mass transfer. For
this reason, this study will consider only net rates of reactions without a correction for approach
to equilibrium, as suggested by Wei & Iglesia to rigorously obtain forward rates. Reaction rates
with respect to increasing space velocity or temperature decrease in the order of CO > H2 > CO2
> CH4.

61
(a) (b)
(c) (d)
Fig 5.4. Reaction rate versus GHSV at 500°C (a), 550°C (b) 570°C (c), and 590°C (d). Inlet gas
composition was 0.083 atm CH4, 0.083 atm CO2, 0.834 atm Ar.

62
Fig 5.5. Reaction rate versus temperature at 34,000 1/hr. Inlet gas composition was 0.083 atm CH4, 0.083 atm CO2, 0.834 atm Ar.
Arrhenius plots of reaction rate and turnover frequency (TOF) versus 1000/T are shown in
Figures 5.6 and 5.7, allowing simple calculation of activation energies, Ea, and rate constants, K,
from the slope and intercept, respectively. An expression for the forward rate of reaction
(approximated here as experimental net rate) can be generated as
ri = KPCH4αPCO2
β.
ri = k0exp(-Ea/RT)PCH4
αPCO2β
. If the partial pressures of CH4 and CO2 are kept constant then you can set
A = k0PCH4αPCO2
β .
Then, the expression for the rate of reaction is simplified and the natural logarithm is taken to
generate a convenient plot from which to gather the activation energies and rate constants.
63
ri = A exp(-Ea/RT)
ln ri = lnA – (Ea/RT)
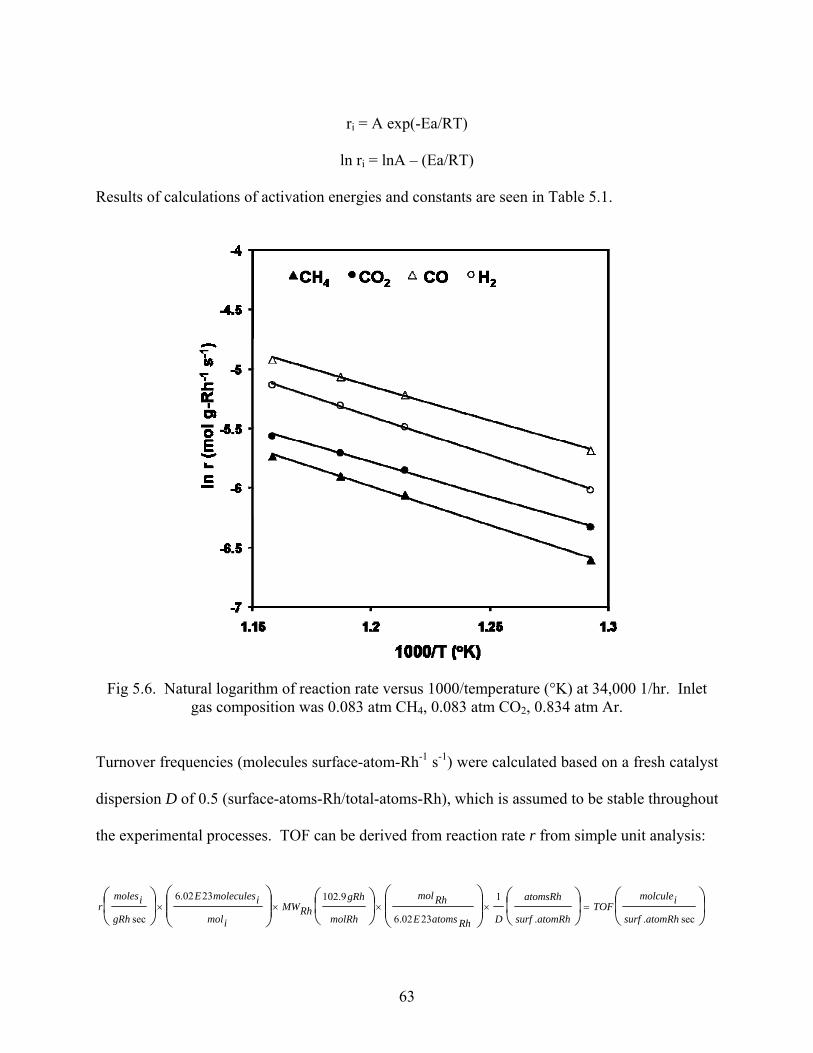
Results of calculations of activation energies and constants are seen in Table 5.1.
Fig 5.6. Natural logarithm of reaction rate versus 1000/temperature (°K) at 34,000 1/hr. Inlet gas composition was 0.083 atm CH4, 0.083 atm CO2, 0.834 atm Ar.
Turnover frequencies (molecules surface-atom-Rh-1 s-1) were calculated based on a fresh catalyst
dispersion D of 0.5 (surface-atoms-Rh/total-atoms-Rh), which is assumed to be stable throughout
the experimental processes. TOF can be derived from reaction rate r from simple unit analysis:
⎟⎠⎞
⎜⎝⎛
⎟⎠⎞
⎜⎝⎛
⎟⎟⎠
⎞⎜⎜⎝
⎛⎟⎠⎞
⎜⎝⎛
⎟⎟⎠
⎞⎜⎜⎝
⎛⎟⎠⎞
⎜⎝⎛
=××××sec..
1
2302.6
9.1022302.6
sec atomRhsurf
imolculeTOF
atomRhsurf
atomsRh
DRhatomsE
Rhmol
molRh
gRhRhMW
imol
imoleculesE
gRh
imolesr
64
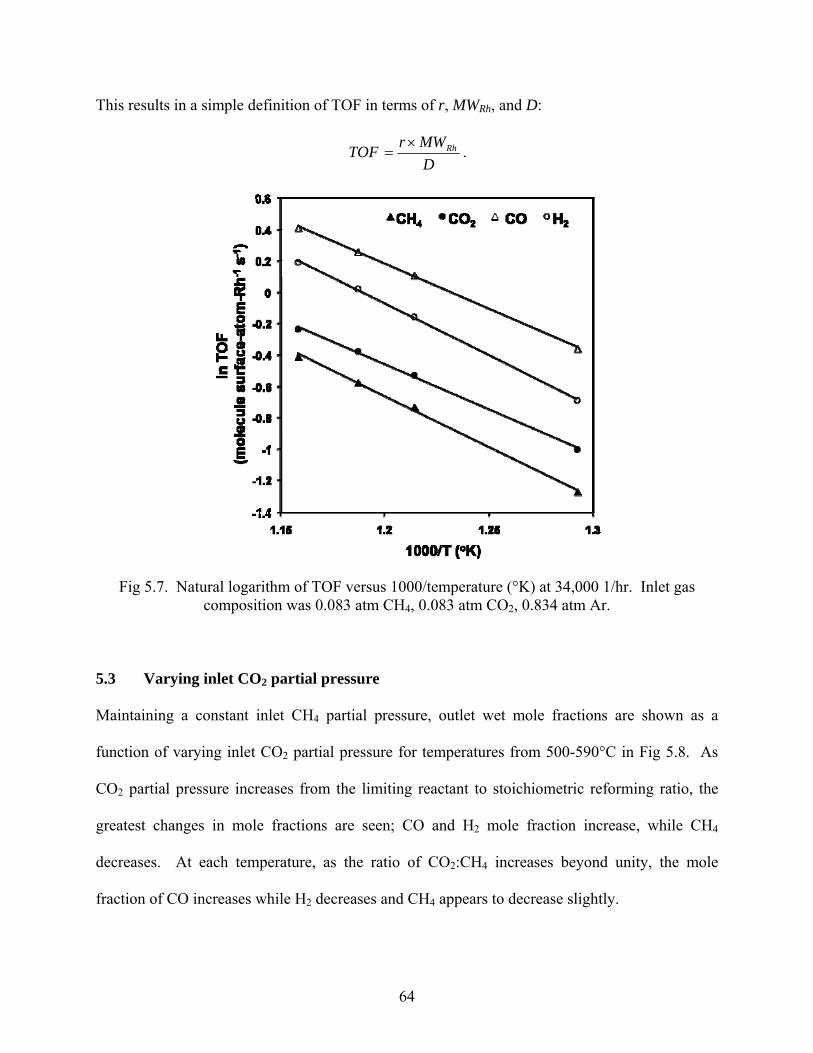
This results in a simple definition of TOF in terms of r, MWRh, and D:
DMWrTOF Rh×
= .
Fig 5.7. Natural logarithm of TOF versus 1000/temperature (°K) at 34,000 1/hr. Inlet gas composition was 0.083 atm CH4, 0.083 atm CO2, 0.834 atm Ar.
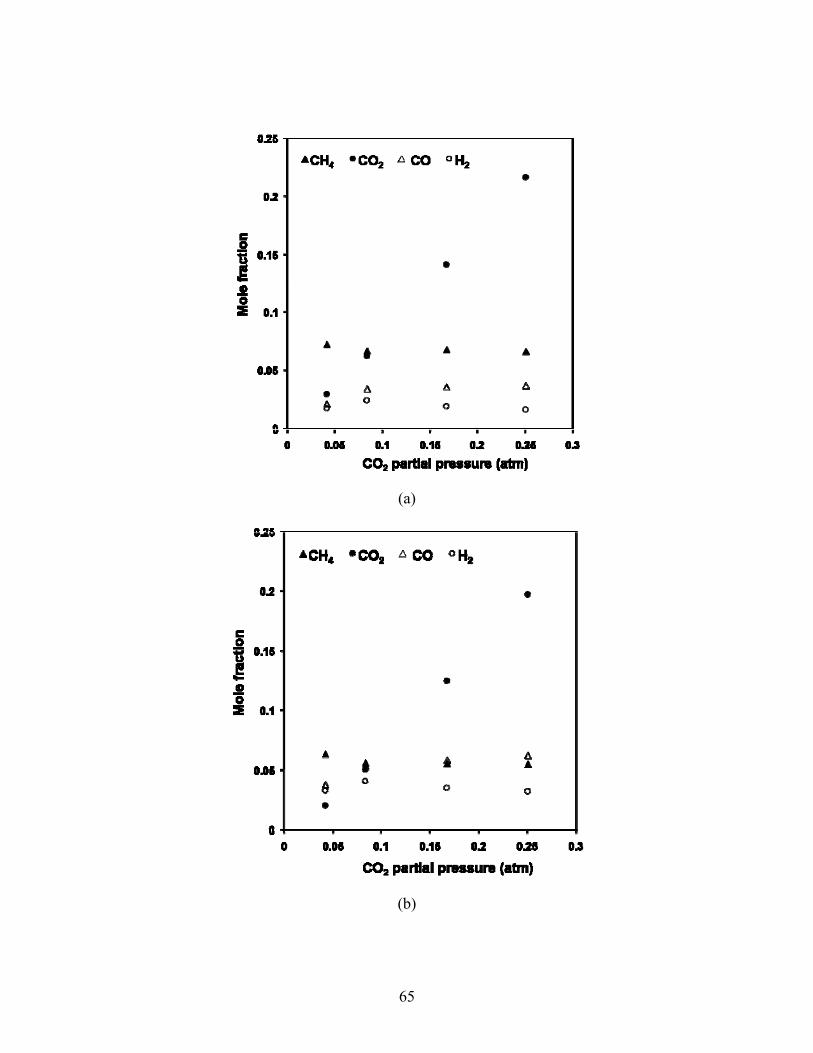
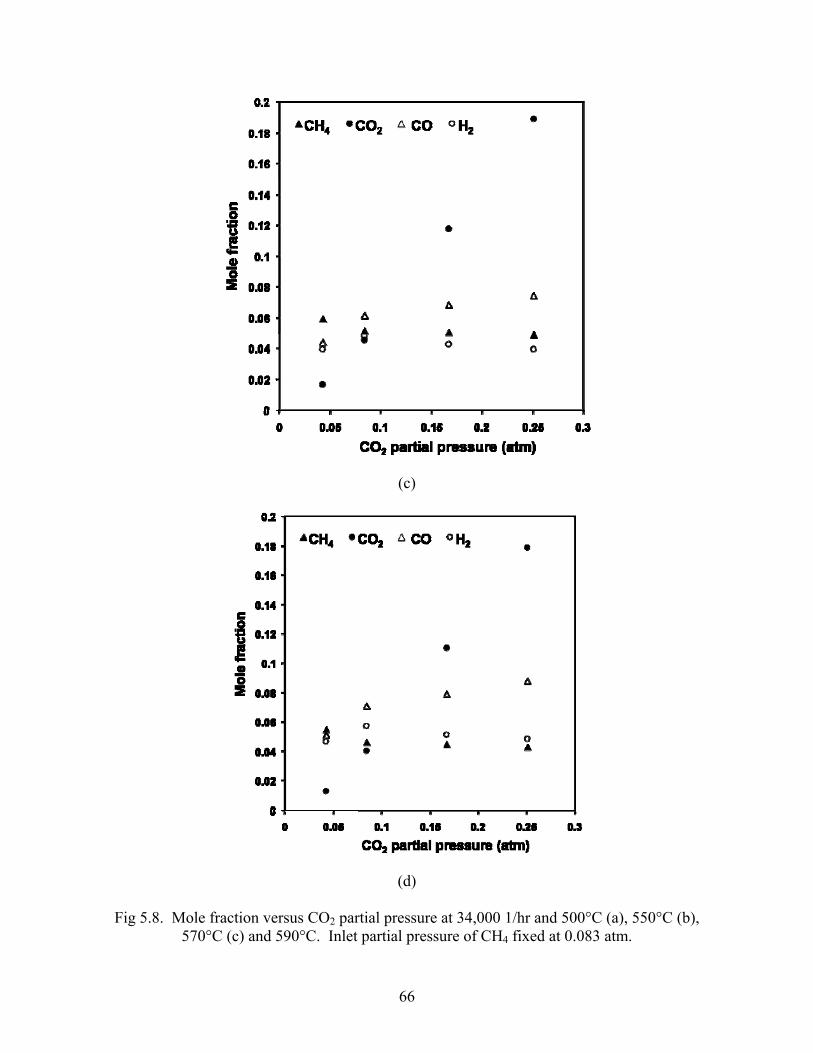
5.3 Varying inlet CO2 partial pressure Maintaining a constant inlet CH4 partial pressure, outlet wet mole fractions are shown as a
function of varying inlet CO2 partial pressure for temperatures from 500-590°C in Fig 5.8. As
CO2 partial pressure increases from the limiting reactant to stoichiometric reforming ratio, the
greatest changes in mole fractions are seen; CO and H2 mole fraction increase, while CH4
decreases. At each temperature, as the ratio of CO2:CH4 increases beyond unity, the mole
fraction of CO increases while H2 decreases and CH4 appears to decrease slightly.
65
(a)
(b)
66
(c)
(d)
Fig 5.8. Mole fraction versus CO2 partial pressure at 34,000 1/hr and 500°C (a), 550°C (b), 570°C (c) and 590°C. Inlet partial pressure of CH4 fixed at 0.083 atm.
67
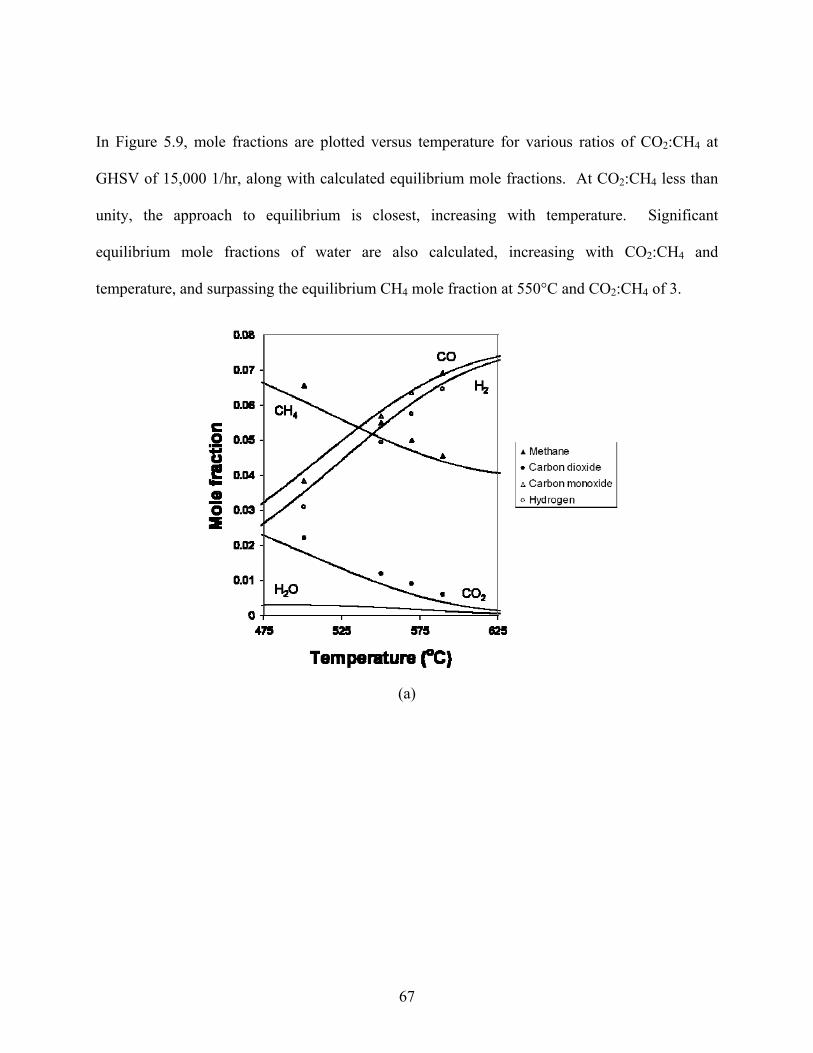
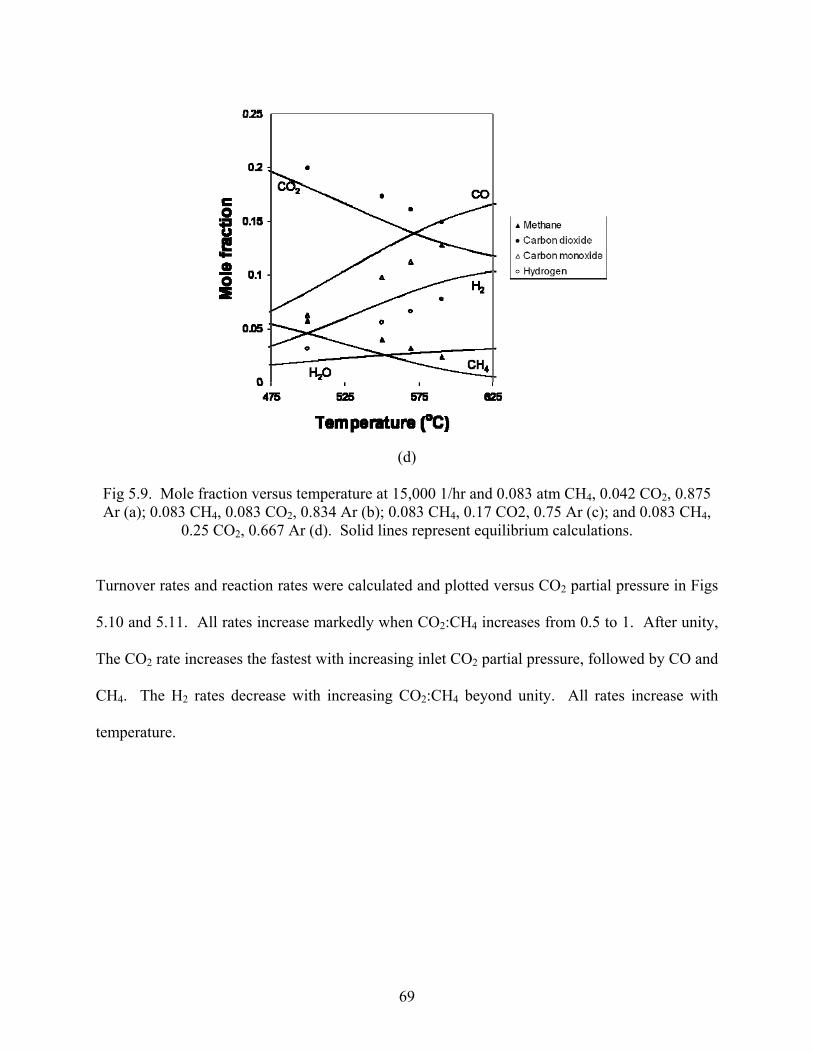
In Figure 5.9, mole fractions are plotted versus temperature for various ratios of CO2:CH4 at
GHSV of 15,000 1/hr, along with calculated equilibrium mole fractions. At CO2:CH4 less than
unity, the approach to equilibrium is closest, increasing with temperature. Significant
equilibrium mole fractions of water are also calculated, increasing with CO2:CH4 and
temperature, and surpassing the equilibrium CH4 mole fraction at 550°C and CO2:CH4 of 3.
(a)

68
(b)
(c)
69
(d)
Fig 5.9. Mole fraction versus temperature at 15,000 1/hr and 0.083 atm CH4, 0.042 CO2, 0.875 Ar (a); 0.083 CH4, 0.083 CO2, 0.834 Ar (b); 0.083 CH4, 0.17 CO2, 0.75 Ar (c); and 0.083 CH4,
0.25 CO2, 0.667 Ar (d). Solid lines represent equilibrium calculations.
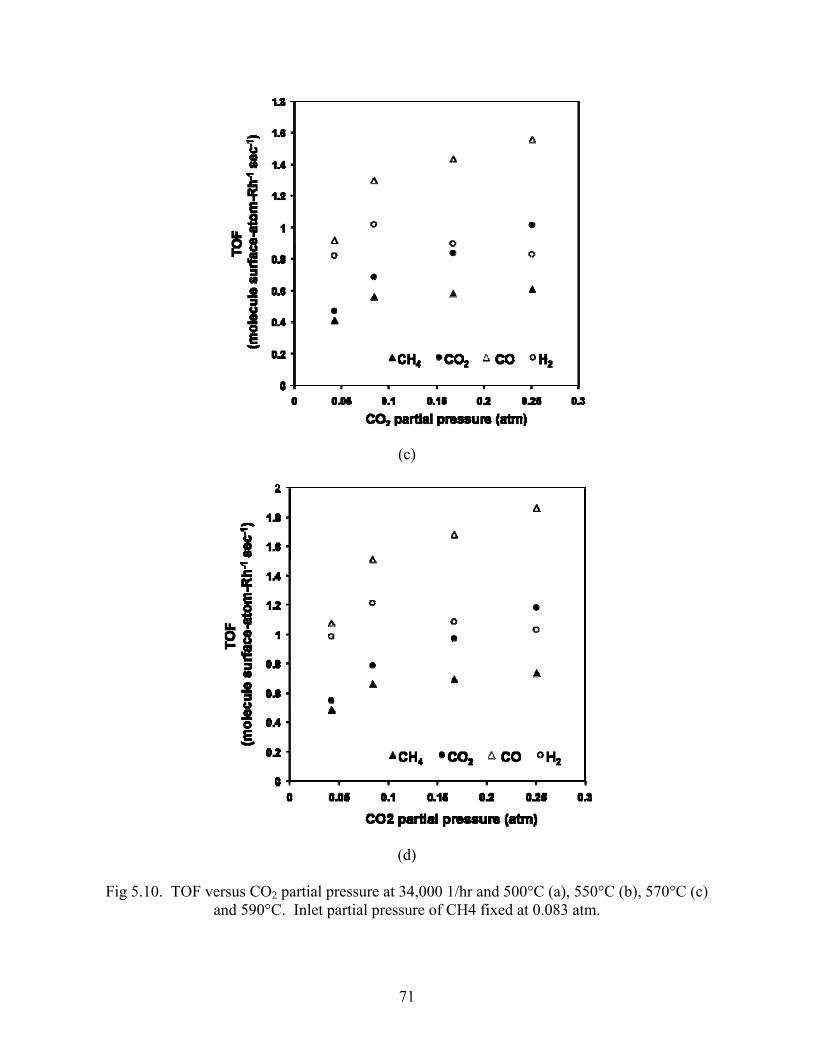
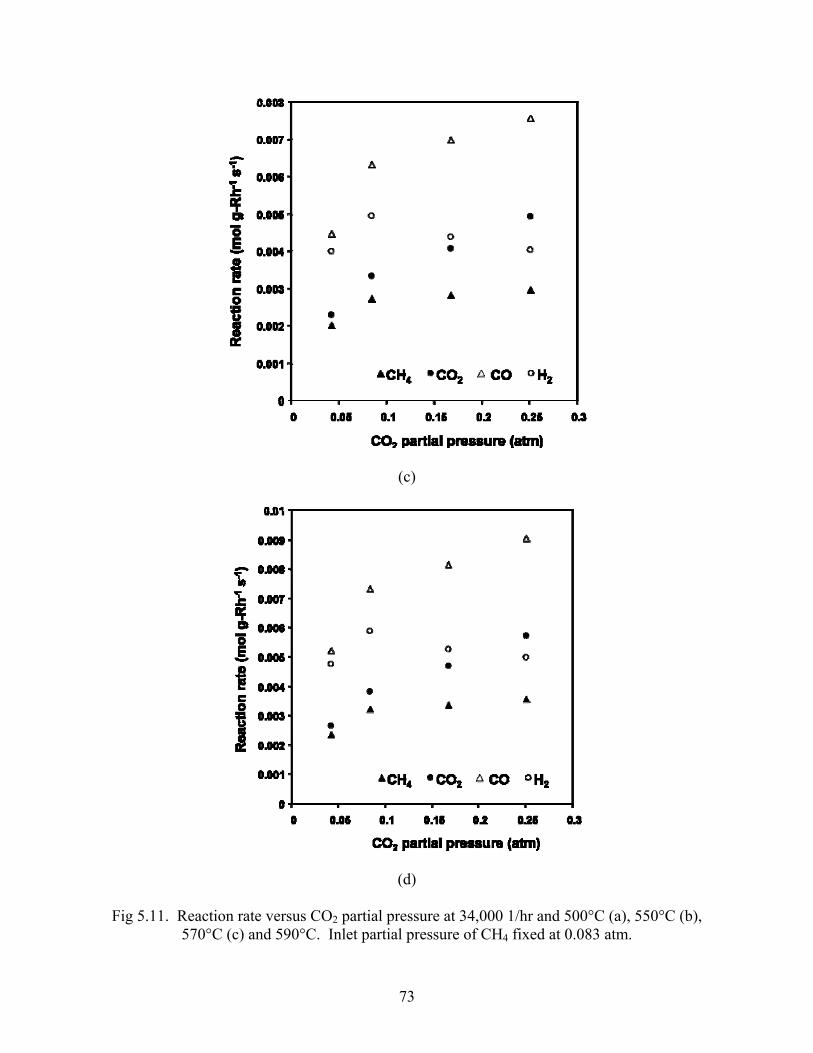
Turnover rates and reaction rates were calculated and plotted versus CO2 partial pressure in Figs
5.10 and 5.11. All rates increase markedly when CO2:CH4 increases from 0.5 to 1. After unity,
The CO2 rate increases the fastest with increasing inlet CO2 partial pressure, followed by CO and
CH4. The H2 rates decrease with increasing CO2:CH4 beyond unity. All rates increase with
temperature.

70
(a)
(b)
71
(c)
(d)
Fig 5.10. TOF versus CO2 partial pressure at 34,000 1/hr and 500°C (a), 550°C (b), 570°C (c) and 590°C. Inlet partial pressure of CH4 fixed at 0.083 atm.

72
(a)
(b)
73
(c)
(d)
Fig 5.11. Reaction rate versus CO2 partial pressure at 34,000 1/hr and 500°C (a), 550°C (b), 570°C (c) and 590°C. Inlet partial pressure of CH4 fixed at 0.083 atm.

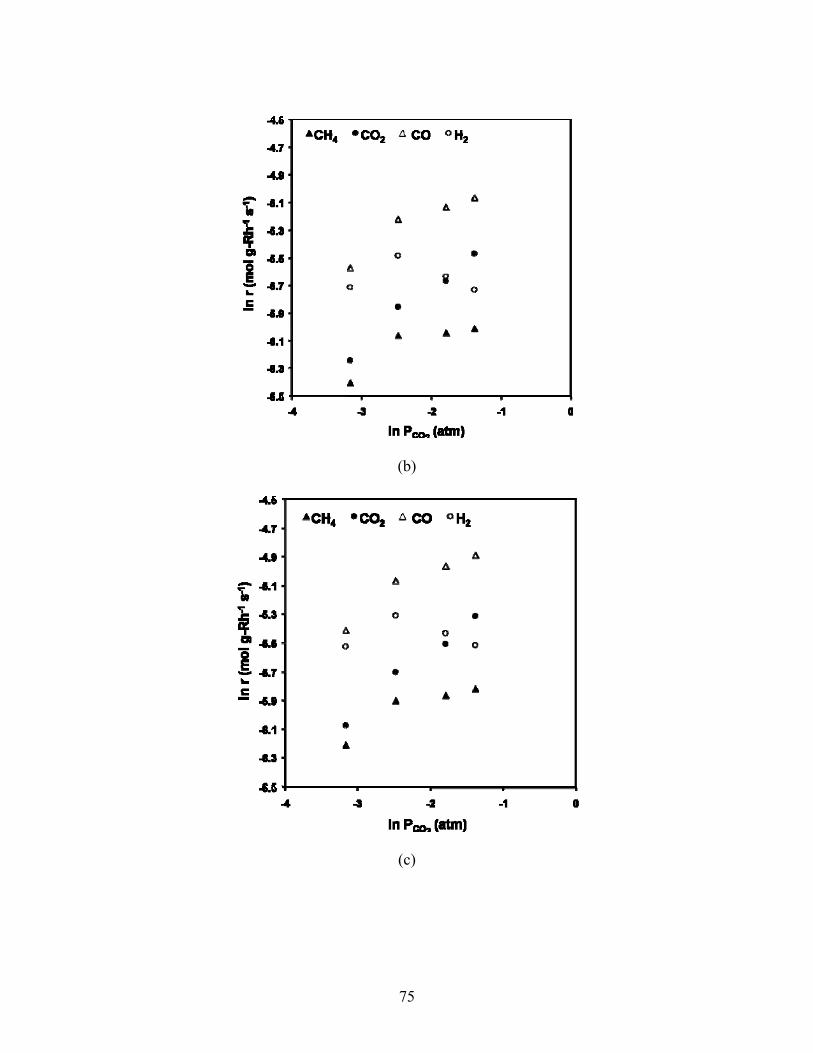
74
The natural log of reaction rates were plotted versus the natural log of inlet CO2 partial pressures to obtain reaction order with respect to CO2. Beginning with the forward rate expression
ri = k0exp(-Ea/RT)PCH4αPCO2
β,
and taking temperature and CH4 partial pressure to be constant, setting
B = k0exp(-Ea/RT)PCH4
α
then, the expression for the rate becomes
ri = BPCO2
β.
Taking the natural logarithm produces a convenient form of equation to plot in which the slope
yields the reaction order, β:
ln ri = ln(BPCO2 β)
ln ri = lnB + βln(PCO2)
Trendlines were fit to the log-log graphs, and reaction orders are reported in Table 5.2.
(a)
75
(b)
(c)
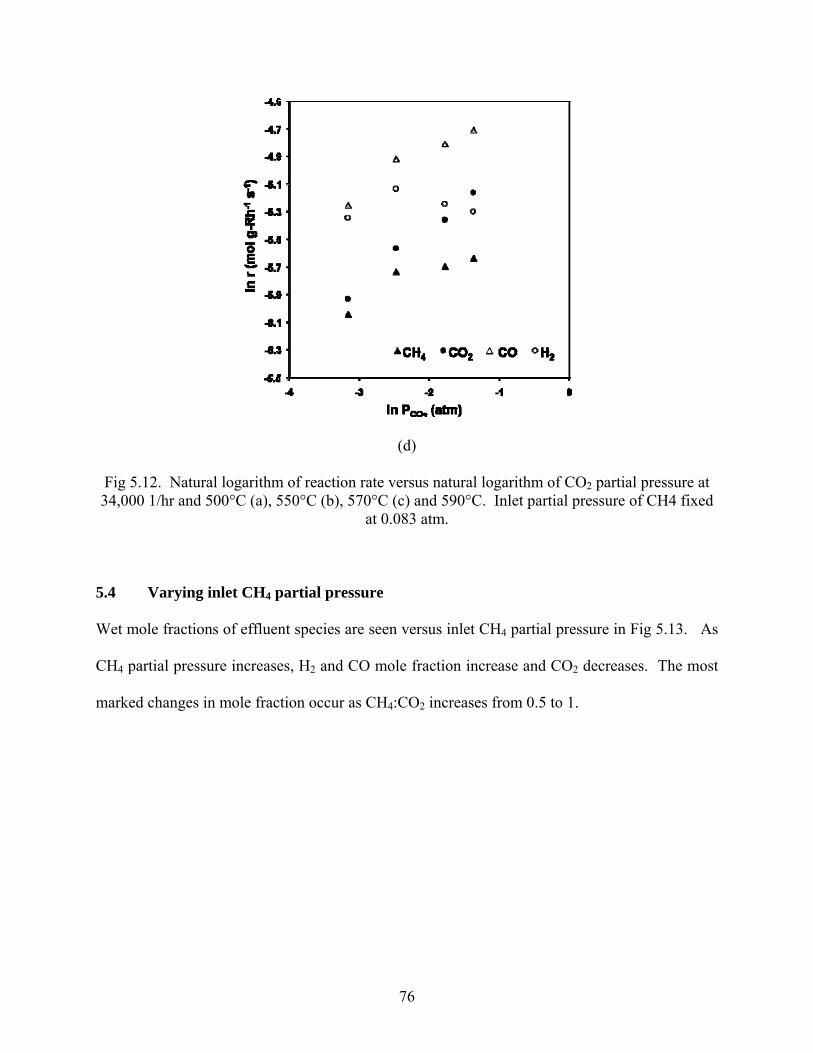
76
(d)
Fig 5.12. Natural logarithm of reaction rate versus natural logarithm of CO2 partial pressure at 34,000 1/hr and 500°C (a), 550°C (b), 570°C (c) and 590°C. Inlet partial pressure of CH4 fixed
at 0.083 atm.
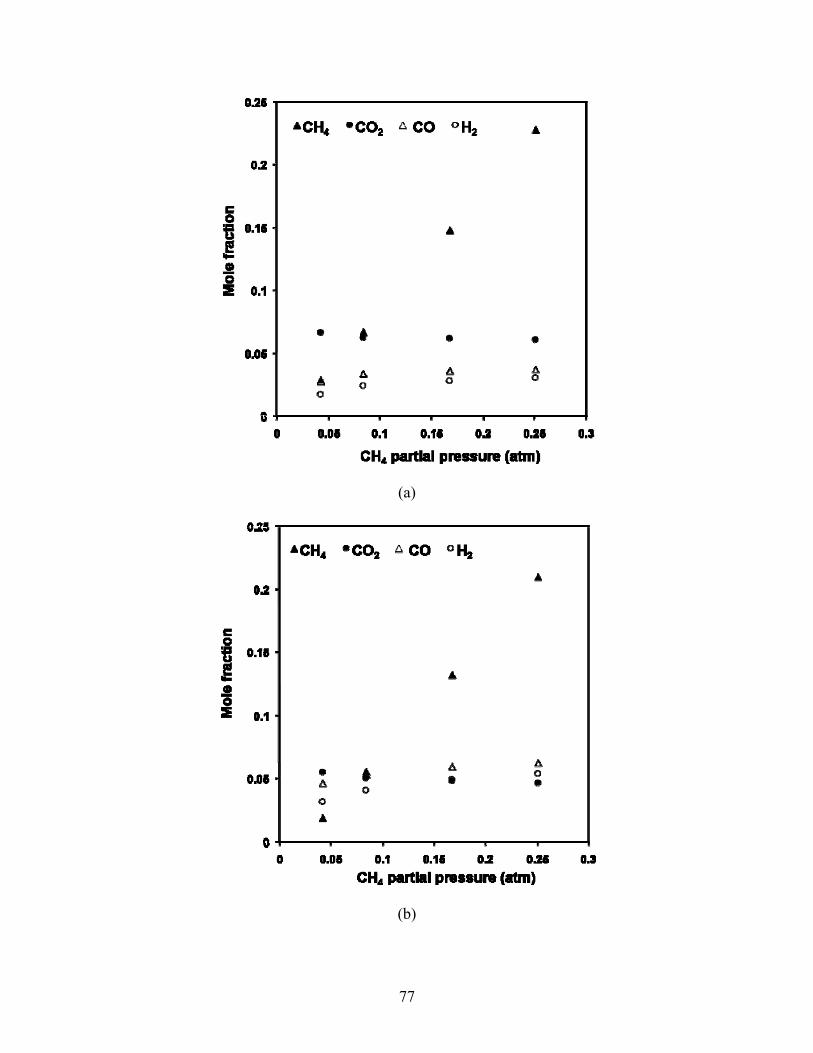
5.4 Varying inlet CH4 partial pressure Wet mole fractions of effluent species are seen versus inlet CH4 partial pressure in Fig 5.13. As
CH4 partial pressure increases, H2 and CO mole fraction increase and CO2 decreases. The most
marked changes in mole fraction occur as CH4:CO2 increases from 0.5 to 1.
77
(a)
(b)

78
(c)
(d)
Fig 5.13. Mole fraction versus CH4 partial pressure at 34,000 1/hr and 500°C (a), 550°C (b), 570°C (c) and 590°C. Inlet partial pressure of CO2 fixed at 0.083 atm.
79
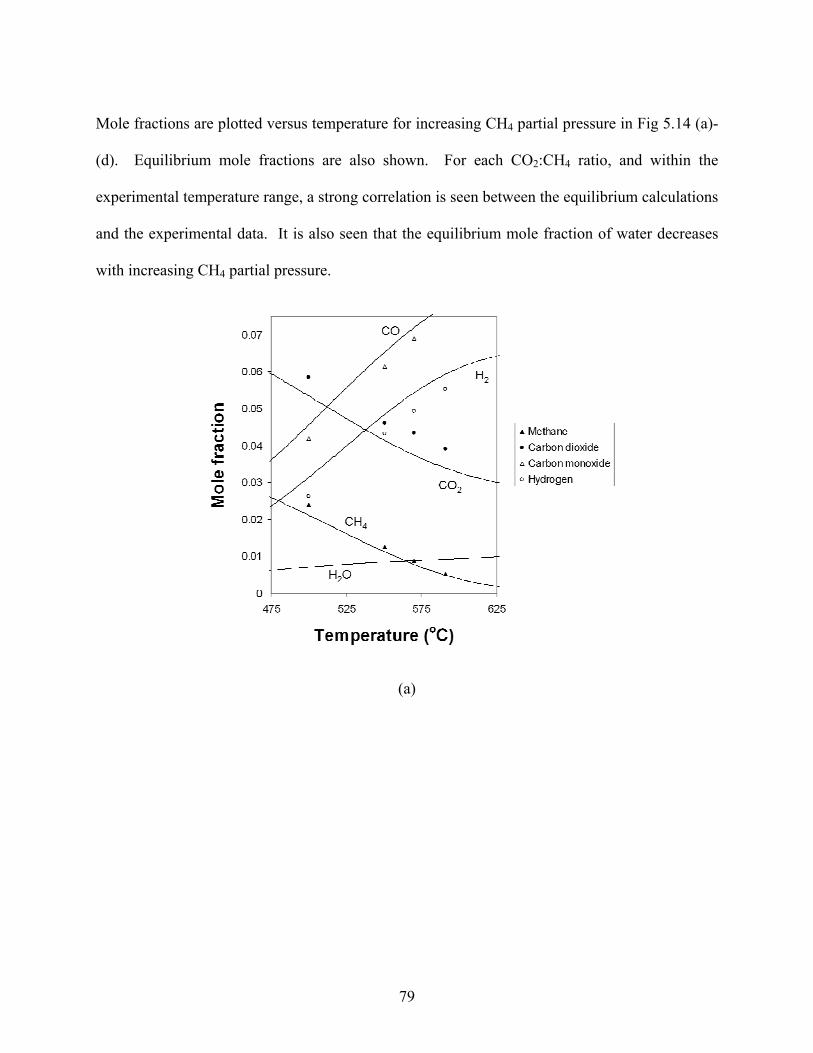
Mole fractions are plotted versus temperature for increasing CH4 partial pressure in Fig 5.14 (a)-
(d). Equilibrium mole fractions are also shown. For each CO2:CH4 ratio, and within the
experimental temperature range, a strong correlation is seen between the equilibrium calculations
and the experimental data. It is also seen that the equilibrium mole fraction of water decreases
with increasing CH4 partial pressure.
(a)

80
(b)
(c)
81
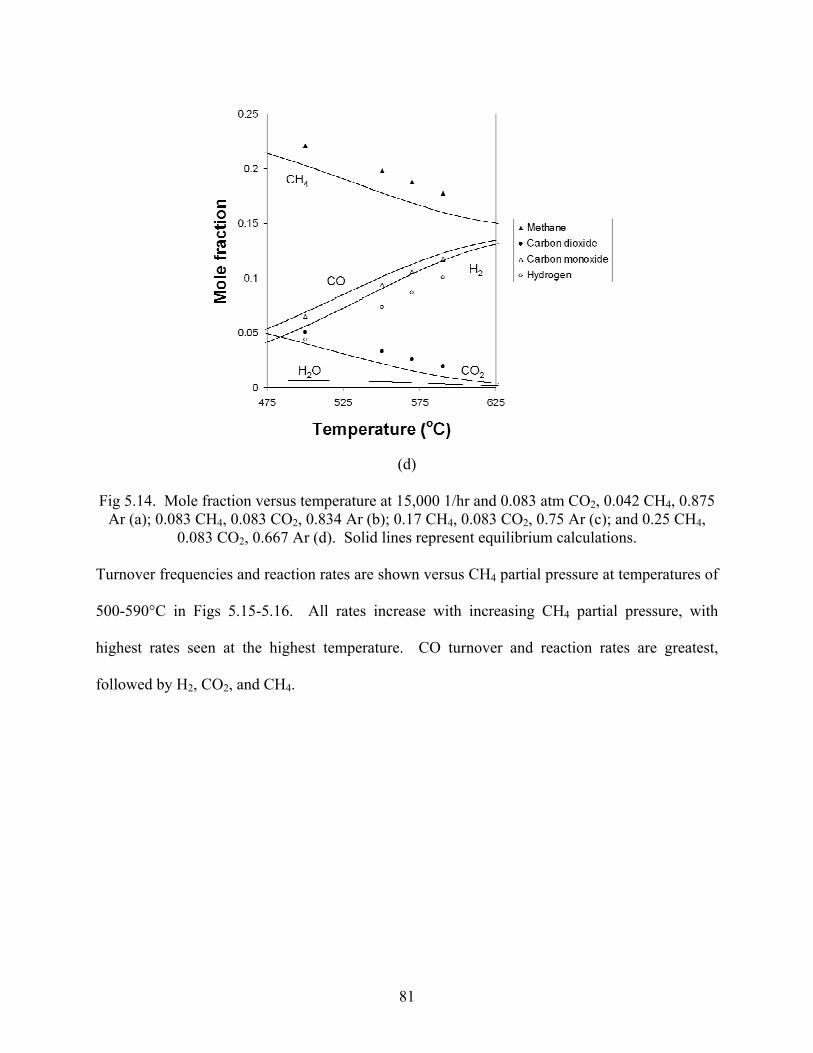
(d)
Fig 5.14. Mole fraction versus temperature at 15,000 1/hr and 0.083 atm CO2, 0.042 CH4, 0.875
Ar (a); 0.083 CH4, 0.083 CO2, 0.834 Ar (b); 0.17 CH4, 0.083 CO2, 0.75 Ar (c); and 0.25 CH4, 0.083 CO2, 0.667 Ar (d). Solid lines represent equilibrium calculations.
Turnover frequencies and reaction rates are shown versus CH4 partial pressure at temperatures of
500-590°C in Figs 5.15-5.16. All rates increase with increasing CH4 partial pressure, with
highest rates seen at the highest temperature. CO turnover and reaction rates are greatest,
followed by H2, CO2, and CH4.
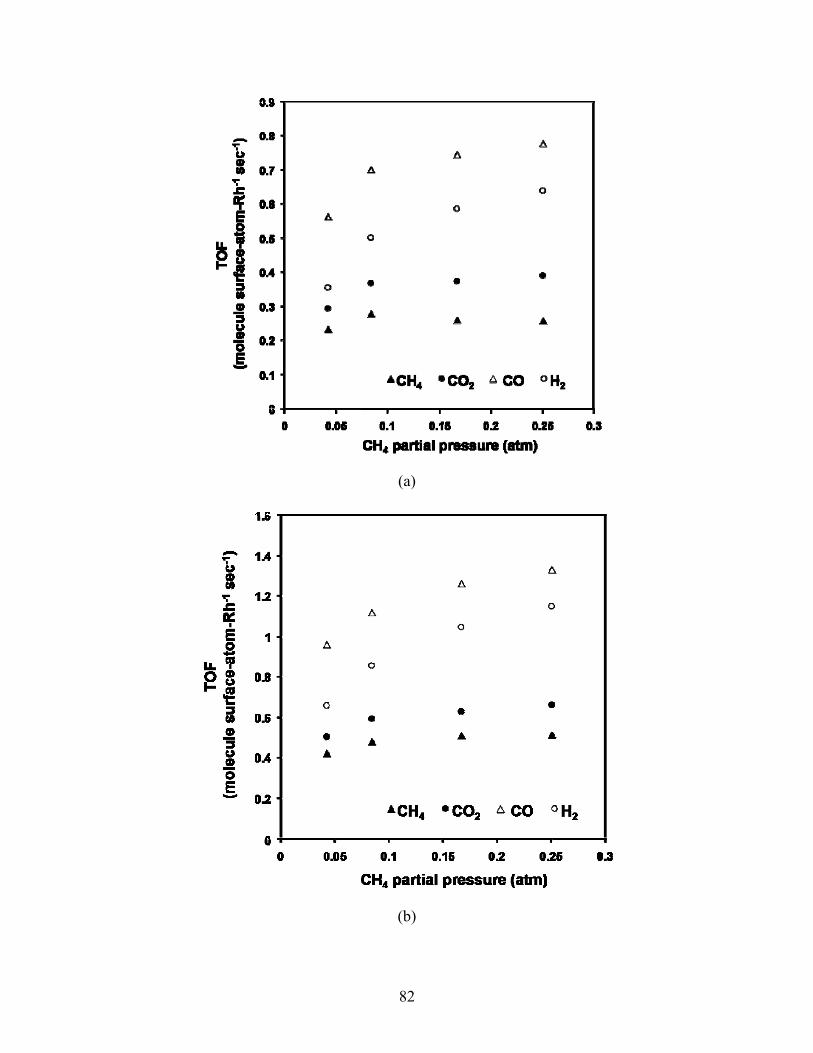
82
(a)
(b)

83
(c)
(d)
Fig 5.15. TOF versus CH4 partial pressure at 34,000 1/hr and 500°C (a), 550°C (b), 570°C (c) and 590°C. Inlet partial pressure of CO2 fixed at 0.083 atm.

84
(a)
(b)

85
(c)
(d)
Fig 5.16. Reaction rate versus CH4 partial pressure at 34,000 1/hr and 500°C (a), 550°C (b), 570°C (c) and 590°C. Inlet partial pressure of CO2 fixed at 0.083 atm.

86
As conducted previously for the CO2 reaction order, CH4 reaction order was determined at
varying temperatures by plotting the natural logarithm of reaction rate versus the natural log of
the inlet CH4 partial pressure. Beginning with the forward rate expression
ri = k0exp(-Ea/RT)PCH4
αPCO2β
,
and taking temperature and CO2 partial pressure to be constant, setting
C = k0exp(-Ea/RT)PCO2 β
then, the expression for the rate becomes
ri = CPCH4α
.
Taking the natural logarithm produces a convenient form of equation to plot in which the slope
yields the reaction order, α:
ln ri = ln(CPCH4 α)
ln ri = lnC + αln(PCH4)
Trendlines were fit to the log-log graphs, and reaction orders are reported in Table 5.2.

87
(a)
(b)

88
(c)
(d)
Fig 5.17. Natural logarithm of reaction rate versus natural logarithm of CH4 partial pressure at 34,000 1/hr and 500°C (a), 550°C (b), 570°C (c) and 590°C. Inlet partial pressure of CO2 fixed
at 0.083 atm.

89
Rates and activation energies for dry reforming at various CO2:CH4 ratios and temperatures over
Rh/Al2O3 are summarized in Table 5.1. The rate constants can be calculated using the reported
values of A under specific conditions, and the reaction orders reported in Table 5.2. From Table
5.1, it is shown that the activation energies for rCO2 and rCO are equivalent at 0.5 ≤ CO2:CH4 ≤ 2.
The highest activation energies are for rCH4 at low CO2:CH4 ratios, and for rH2 for high CO2:CH4
ratios. The lowest activation energies are seen for rCO2 at high CO2:CH4 ratios.
In Table 2, it is shown that when CO2 is the limiting reactant, the CO2 reaction order (β) for each
species is very high. For rCH4, the reaction order in CH4 (α) is less than β when CO2:CH4 is less
than unity, but α is greater than β when CO2:CH4 > 1. For rCO2, β is greater than α. For rCO, α is
less than β when CO2:CH4 is less than unity, but α is greater than β when CO2:CH4 > 1. Also,
for rCO, α is about equal to β at high CO2:CH4 ratios. The value of α is greatest for rH2, but β is
negative for CO2:CH4 ≥ 1, decreasing with decreasing temperature.
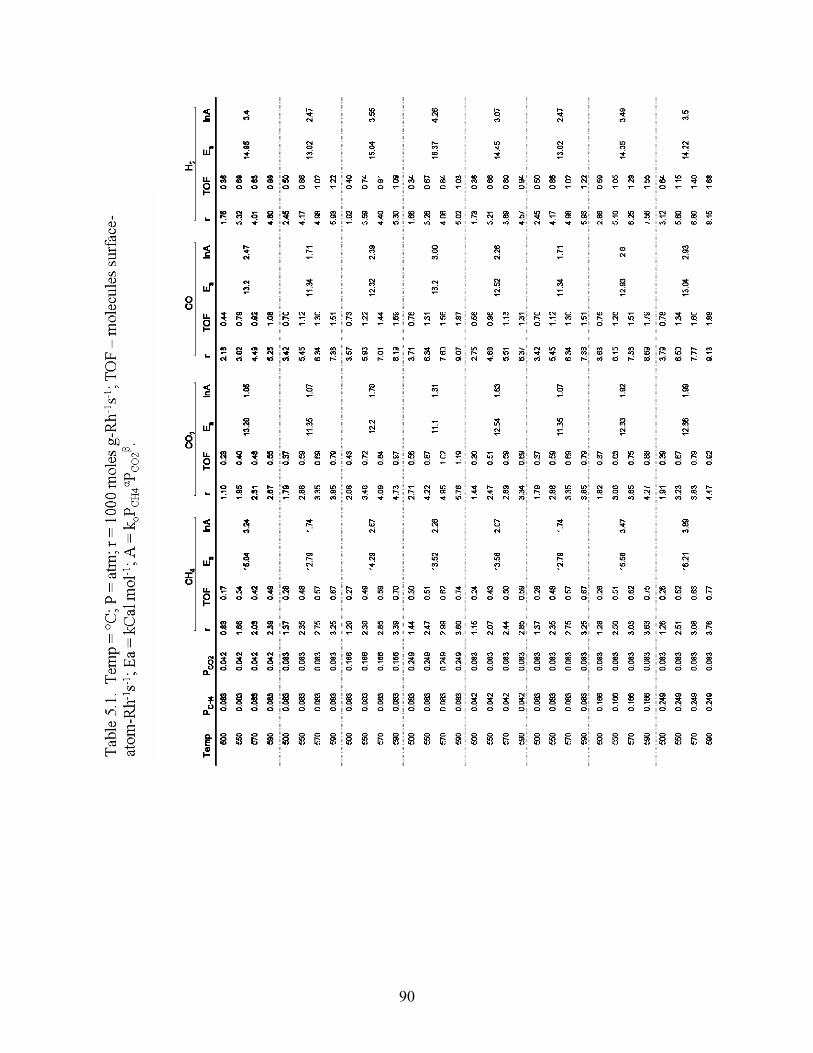
90

91

92
Mass balances
Calculations of atom balances for H, C, and O, were conducted to measure the extent at which
the GC measurements accounted for all of the species in the effluent mixture. The calculation
for percent difference for a specific atom Ni, is given as
100×−
o
of
NiNiNi
where Nif is the number of atoms detected and Nio is the number of atoms fed into the reactor.
Results for atom balances are shown in Table 5.3 for varying CO2:CH4 ratios and varying
temperatures. As expected, as the equilibrium mole fraction of H2O increases, so does the
percentage of H and O atoms that go unaccounted for in the GC measurements of CH4, CO2, H2,
and CO.

93
Table 5.3. Atom balances are shown for varying CO2:CH4 ratios and varying temperatures (°C).
5.5 Deactivation During the studies with the Rh/γ-Al2O3 monolith catalyst, there was no observed deactivation on
the reactor after 24 hours of testing. However, since coke buildup is an important aspect of dry
reforming of CH4 and CO2, tests were conducted to determine where carbon formation would
occur on a catalyst known to form coke during operation.
Plug-flow reactor studies were also performed using a packed bed of Ni based catalyst. Flowing
a stoichiometric feed of CO2 and CH4, it was found that the Ni catalyst quickly deactivated due
to coke build up, plugging the reactor. As seen in Fig 5.18, reforming initially occurred for the
first hour, producing a product mixture with H2:CO ratios greater than unity. However, as coke
began to build up, the reactor became plugged, considerable flow to release through the

94
thermocouple insertion point, increasing the residence time of the gas that actually passed
through the reactor. This resulted in an apparent increasing levels of conversion as measured by
the GC. The Ni catalyst is shown in the reactor following the study in Fig 5.19.
Fig 5.18: Mole fraction versus time at 15,000 1/hr and 540°C for Ni catalyst and inlet gas
composition of 0.083 atm CH4, 0.083 atm CO2, 0.834 atm Ar.
Fig 5.19. Nickel catalyst following stoichiometric reforming studies. The catalyst began as spherical pellets, but became engrossed by solid carbon buildup.

95
The extent of catalyst deactivation was also studied on the Rh/γ-Al2O3 monolith throughout the
reforming investigations. Periodically, initial test conditions were repeated to see if any change
in activity had occurred. As seen in Fig. 5.20, activity was consistent for a reforming time period
of 25 hours.
Fig 5.20. Mole fraction versus time at 15,000 1/hr and 500°C for Rh catalyst and inlet gas composition of 0.083 atm CH4, 0.083 atm CO2, 0.834 atm Ar.
Deactivation on Rh was also studied using thermogravimetric analysis. Mass percent change
was measured versus time for a stoichiometric feed of reforming gas at two isothermal
temperatures, as seen in Figs 5.21 and 5.22. The mass percent change at 550°C was greater than
the mass percent change at 590°C. After the dry reforming run at 550°C in the TGA, the catalyst
sample was subjected to an oxidizing atmosphere to measure the mass percent change
simultaneously differential thermal analysis. The quantitative results from this experiment were
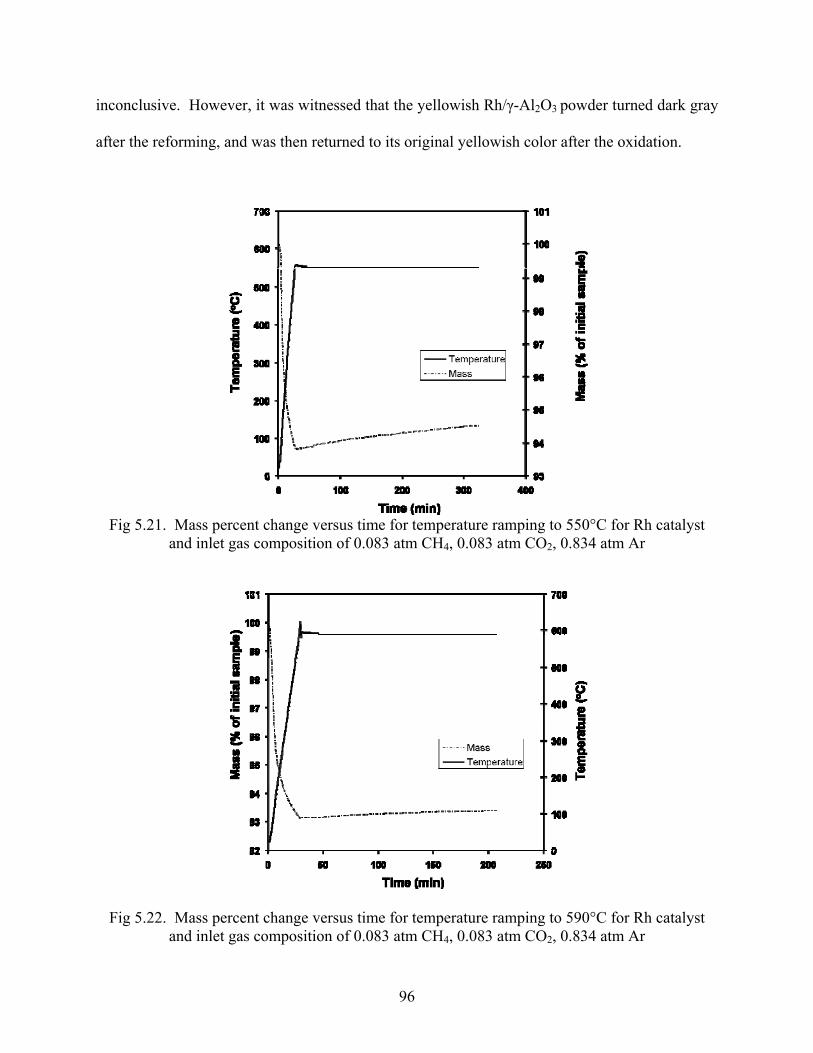
96
inconclusive. However, it was witnessed that the yellowish Rh/γ-Al2O3 powder turned dark gray
after the reforming, and was then returned to its original yellowish color after the oxidation.
Fig 5.21. Mass percent change versus time for temperature ramping to 550°C for Rh catalyst
and inlet gas composition of 0.083 atm CH4, 0.083 atm CO2, 0.834 atm Ar
Fig 5.22. Mass percent change versus time for temperature ramping to 590°C for Rh catalyst and inlet gas composition of 0.083 atm CH4, 0.083 atm CO2, 0.834 atm Ar

97
5.6 Catalyst poisoning from heavy metal deposition. During dry reforming testing with the Rh/γ-Al2O3 monolith, deactivation from coke buildup was
experienced due to faulty procedure. A thin copper tube was used to push the monolith into the
reactor, which resulted in a deposition of Cu onto the catalyst, facilitating coke buildup and
catalyst deactivation. This was avoided by using a glass tube instead of the copper tube.

98
6. DISCUSSION In the temperature range in which thermodynamics predict severe coking to occur, the Ni based
catalyst produced large amounts of coke while the Rh/γ-Al2O3 monolith catalyst was stable,
displaying an impressive kinetic inhibition towards the pathways which lead to coke formation.
Thermodynamic calculations indicated that CO disproportionation would be the likely route to
carbon deposition during dry reforming, and the Rh/γ-Al2O3 monolith proved to inhibit this side
reaction. At low space velocities, experimental measurements of CH4, CO2, H2, and CO mole
fractions were within at least 5 % of thermodynamic equilibrium calculations which were
conducted without allowing for the formation of solid carbon. While a catalyst cannot alter the
thermodynamics of a reaction in terms of the enthalpy or Gibbs free energy, which dictates
equilibrium conditions, it can produce a new reaction pathway which serves to inhibit certain
intermediate steps, altering the concentrations of product species. This was exhibited by the
Rh/γ-Al2O3 monolith catalyst.
As net reaction rates over the Rh/γ-Al2O3 monolith were found to be increasing with increasing
space velocity up to 34,000 1/hr, it was postulated that the reaction was not kinetically
controlled, but rather limited by transport in the form of bulk mass transfer. For this reason, a
kinetic study of the forward reaction rates was not appropriate. At the highest space velocity,
however measured mole fractions were far off from equilibrium (30-40 % away). For these
reasons, an examination of the dry reforming kinetics in terms of net rates including secondary
processes, but estimated as unaffected by approach to equilibrium, was conducted.

99
It was found that the activation energy of rCO2 was equal to the activation energy of rCO at all feed
ratios except for CO2:CH4 of 3. This suggests that the kinetically relevant step which produces
CO is the same step which consumes CO2. The likely elementary step, as originally proposed by
Bodrov, is:
CO2 + * CO + O*
This also means that the kinetically relevant pathway to CO production lies in the activation of
CO2, rather than the activation of CH4, subsequent H extraction, and C oxidation seen in steps 1-
6 proposed by Wei and Iglesia.
For rCH4, it is seen that the activation energy decreases with increasing CO2:CH4. This likely
means that CH4 activation is facilitated by the presence of CO2 or one of its products of
dissociation, such as O. While CH4 activation may be also aided by the presence of H2O (or OH)
which would be present at higher CO2:CH4 ratios, H2O cannot be produced unless CH4 is first
activated. So, it is postulated that adsorbed O facilitates CH4 activation, agreeing with
Erdohelyi’s conclusions but disagreeing with Rostrup-Nielsen’s findings over Ni.
These findings gives two-fold support to the prediction that ceria would be a positive contributor
to the dry reforming catalyst. Firstly, ceria has been shown to possess high numbers of basic
sites, which selectively favor the conversion of CO2 to CO, which has been shown here to be a
slow step. Secondly, ceria has been shown to be a good oxygen storage component, with the
ability to store and release O, which can activate the CH4. With CH4 activation commonly
assumed to be rate limiting, ceria would aid the kinetics of both slow steps.

100
At stoichiometric reforming conditions, the activation energy for rH2 is about equal to the
activation energy for rCH4. However, Ea for rH2 increases with increasing CO2:CH4, as opposed
to Ea for rCH4. This may mean that H atoms combine with excess O atoms to form OH, which
then combines with another H atom to form H2O, significantly competing with the formation of
H2 and increasing the activation energy.
The mechanism proposed by Wei and Iglesia is valid within these conclusions based on
calculations using net rates, except for the fact that CO2 activation becomes a kinetically relevant
step. Dependency on CO2 is further substantiated when reaction orders are examined. For rCH4,
the average reaction order for CH4 is 0.11, while the average reaction order for CO2 is 0.29. For
rCO2, the average reaction order for CH4 is 0.15, while the average reaction order for CO2 is 0.47.
This appears to conflict with Wei and Iglesia’s findings that rCH4 and rCO2 were solely dependent
on CH4; Wei and Iglesia’s finding that rCO2 is solely dependent on CH4 is most remarkable,
suggesting that CO2 is not catalytically converted to another species unless CH4 is present.
101
7. CONCLUSIONS It has been shown that a Rh/γ-Al2O3 monolith can be an effective catalyst for CO2-reforming of
methane at CO2:CH4 ratios from 0.3-3.0, showing stable activity at conditions which
thermodynamically predict the formation of solid carbon. TGA tests did reveal slight mass
increases on Rh/γ-Al2O3 powder at stoichiometric feed ratios and temperatures of 550°C and
590°C, so it is recommended that further studies be performed to determine the cause for the
change in mass and the identity of the deposited species. In addition, it is suggested that
alternative Rh-based catalyst formulations, including ceria promotion, be designed to hasten the
kinetics of the slowest steps and further suppress carbon deposition. As the dry reforming of
methane has been shown to be highly dependent on CO2 in regimes of relatively high
conversions, likely due to the facilitation of CH4 activation by O, it is recommended that other
oxygen-containing species be added to the system, either in the form of H2O or pure O2. The
addition of pure O2 would also serve the purpose of adding energy for the strongly endothermic
reforming reaction, which is commonly heat-transfer limited at levels of high-throughput, via
partial oxidation of methane.

102
CMASS Technology Demonstrations
1. Executive Summary Catalytic ammonia synthesis and decomposition experiments were conducted to
determine the scaling for ammonia synthesis and decomposition reactors onboard a Walrus
reference vehicle. It was determined that in order to synthesize 100 tons of ammonia over 72
hours, a 0.67 m3 bed of iron-based catalyst weighing 2.2 tons would be needed at operating
conditions of 150 bar, 435 °C, and space velocity of 15,000 Nm3/m3/hr. To decompose
ammonia at a rate of 100 tons over 72 hours, a nickel-based reactor would need to be 0.72 m3
and would weigh 0.82 tons, while a rhodium based reactor would be 0.67 m3 and would weigh
only 0.33 tons at operating conditions of atmospheric pressure, 615 °C, and space velocity of
3,200 ml NH3 STP/cm3 catalyst/hr. The performance of the catalyst systems went as expected
and deliverables were met according to schedule. This report satisfies the program deliverables
and thus completes the program.

103
2. Ammonia Synthesis
2.1 Introduction Experiments were performed using a Parr Instruments benchtop pressure vessel to
synthesize ammonia (NH3) from nitrogen (N2) and hydrogen (H2) gas in the presence of an iron-
based catalyst. The purpose of the experiments was to determine the catalytic reaction rate of
ammonia synthesis under different operating conditions, which can then be used to extrapolate
the size and performance of the Walrus reference vehicle system.
The catalyst was procured from Süd-Chemie specifically for the ammonia synthesis
process and is used widely throughout the ammonia synthesis industry. Unlike traditional iron-
based catalyst ammonia synthesis catalysts, Süd Chemie’s AmoMax-10 is based on a non-
stoichiometric ferrous oxide, so-called wustite (Fe1-xO). This catalyst has been shown to provide
a higher activity than the stoichiometric ferrous oxide, magenetite (Fe3O4), due to the cubical
crystal structure of wustite which provides superior pore structure and higher surface area, as
well as better mechanical strength than the magnetite-based catalyst. Other additives which
serve to promote and stabilize the catalyst include aluminum oxide, calcium oxide, potassium
oxide, and other undisclosed co-catalysts, with each additive composing less than 5 percent of
the catalyst by weight. The bulk density of the un-reduced Amomax-10 catalyst is between 3.0
and 3.3 kg/l and was purchased at a sample price of $500/liter.
The primary results, discussed in detail in the Results section, are that the catalyst
performed as expected in terms of reaction rates of NH3 synthesis. All goals were met in terms
of time and performance.

104
2.2 Experimental Setup The ammonia synthesis reactor is shown in a schematic in Figure 1. It consists of a high-
pressure, high-temperature Parr Instruments Model 4642 vessel assembly. The removable vessel
holds an internal volume of 2 liters and contains a suspended catalyst basket capable of holding a
maximum of 150 cm3 of catalyst. To ensure that the inlet mixture of N2 and H2 flowed directly
through the catalyst bed, a stainless steel tube was fitted from the gas inlet inside the top of the
reactor down to the crest of the catalyst basket, shifting the point of mixing closer to the catalyst
bed. The vessel is sealed with a high-temperature flexible graphite gasket with 35 ft-lbs of
torque, allowing a maximum pressure rating of 1900 psi. The reactor pressure is read by a
pressure transducer atop the vessel, and the reactor temperature is read by a J-type thermocouple
inserted into a thermowell inside of the vessel. The thermocouple also serves as the reference for
the PID temperature controller, Parr Instruments Model 4835. The temperature controller serves
to heat and control the temperature via a Parr Instruments heater assembly Model 4913 which
encases the reactor vessel.
The mass flowrate and stoichiometry of the inlet H2 and N2 are controlled with Aalborg
GFC17 mass flow controllers which are fed by tanks of ultra-high-purity gas, delivered at 500
psi via high pressure regulators. After passing through the reactor vessel, the gaseous mixture
exits into a high-pressure condensing unit at room temperature. As the hot gas flows out the top
of the condensing unit, thermal energy is absorbed via a heat exchanger comprised of an
adjacent, parallel channel of cooling water flow. This exchange of heat causes the ammonia to
condense into liquid phase and drip down to accumulate at the bottom of the sampling vessel.
After a given amount of time, the condensed ammonia was released into an Erlenmeyer flask
which was resting in an ice bath. The ammonia was then weighed to determine the production

105
rate and reaction rate. In addition, the gaseous mixture exiting from the top of the condensing
unit was sent to an Agilent 3000 Micro GC instrument to analyze the concentrations of the
species and detect any ammonia that failed to condense.
An alternative method of measuring the production rate and reaction rate was also
employed to minimize the uncertainty of the measurement. The cooling water flow was turned
off to the heat exchanger, thus allowing any produced NH3 to remain in the vapor phase, the exit
at the top of the condensing unit was closed with an on-off valve, and the line to the GC was
removed. With all of the reacted and un-reacted products still in vapor phase, the gaseous
mixture released into the condensing unit and was then channeled out the bottom of the
condensing unit to the line connecting to the Agilent 3000 Micro GC instrument to analyze the
concentrations of the species. Finally, the products were vented to a hood. This method of
analysis allowed for simultaneous detection of all species in the entire product stream.
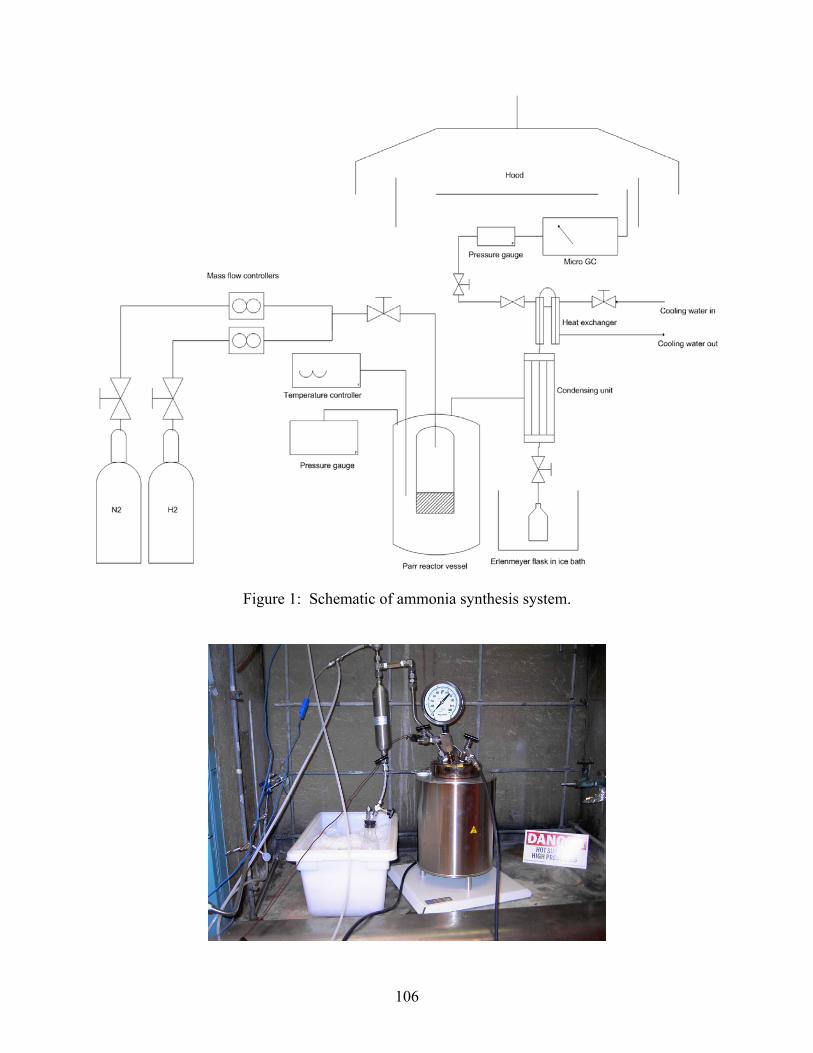
106
Figure 1: Schematic of ammonia synthesis system.
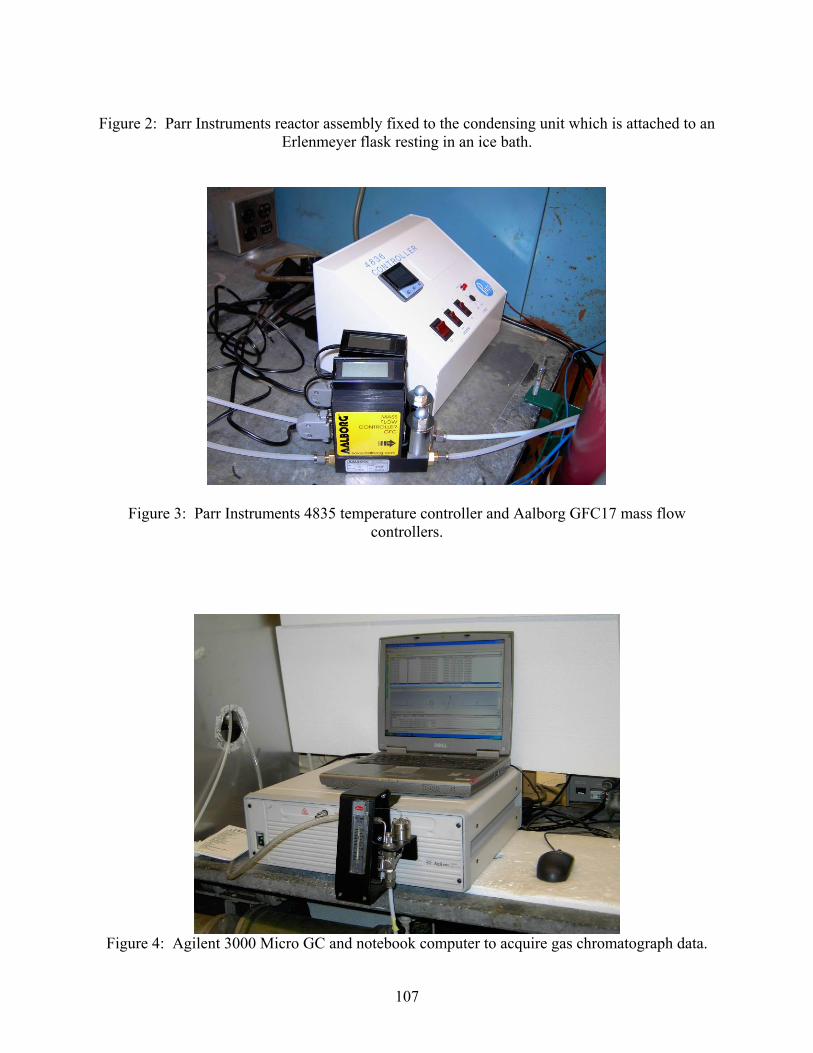
107
Figure 2: Parr Instruments reactor assembly fixed to the condensing unit which is attached to an
Erlenmeyer flask resting in an ice bath.
Figure 3: Parr Instruments 4835 temperature controller and Aalborg GFC17 mass flow controllers.
Figure 4: Agilent 3000 Micro GC and notebook computer to acquire gas chromatograph data.

108
2.3 Experimental Procedure
1) Reactor assembly.
a. The reactor vessel was removed from the heating unit, opened, and the iron
catalyst was loaded into the catalyst basket.
b. A graphite gasket was placed around the diameter of the opened vessel and the
vessel was closed.
c. The split ring was fastened around the top of the vessel, and the reactor was
sealed with 35 ft-lbs of torque via a torque wrench.
d. The final ring enclosure was finger-tightened and the vessel was placed back into
the heating unit.
2) Mass flow controllers were powered on and the temperature controller was set to the
desired temperature.
3) All connections were checked on the reactor and condensing unit and the cooling water
was turned on. The line to the GC was unattached so that the gas would initially vent
directly to the hood. All valves were closed.
4) Purging and charging the system.
a. The nitrogen tank was linked directly to the reactor vessel and the valve between
the gas inlet on the reactor and the nitrogen regulator was opened.
b. The nitrogen tank was opened and the delivery pressure was slowly increased to
300 psi, so that 300 psi of nitrogen filled the reactor.
c. The outlet valve on the nitrogen regulator was closed.
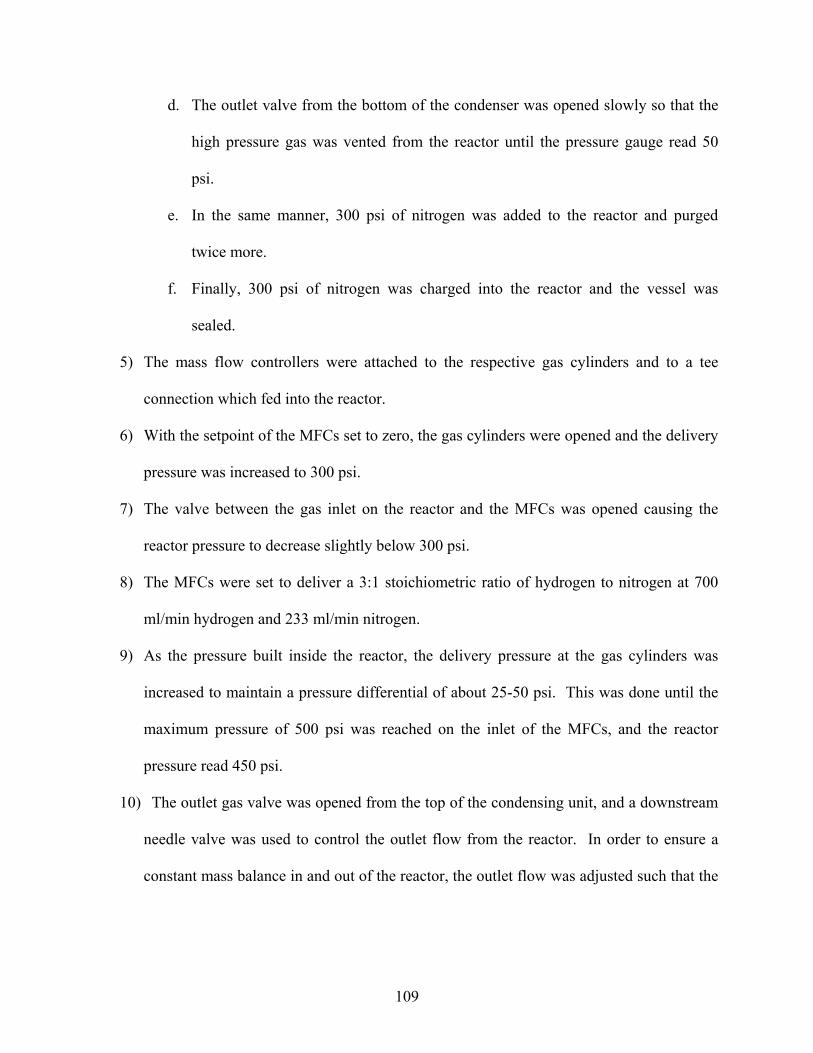
109
d. The outlet valve from the bottom of the condenser was opened slowly so that the
high pressure gas was vented from the reactor until the pressure gauge read 50
psi.
e. In the same manner, 300 psi of nitrogen was added to the reactor and purged
twice more.
f. Finally, 300 psi of nitrogen was charged into the reactor and the vessel was
sealed.
5) The mass flow controllers were attached to the respective gas cylinders and to a tee
connection which fed into the reactor.
6) With the setpoint of the MFCs set to zero, the gas cylinders were opened and the delivery
pressure was increased to 300 psi.
7) The valve between the gas inlet on the reactor and the MFCs was opened causing the
reactor pressure to decrease slightly below 300 psi.
8) The MFCs were set to deliver a 3:1 stoichiometric ratio of hydrogen to nitrogen at 700
ml/min hydrogen and 233 ml/min nitrogen.
9) As the pressure built inside the reactor, the delivery pressure at the gas cylinders was
increased to maintain a pressure differential of about 25-50 psi. This was done until the
maximum pressure of 500 psi was reached on the inlet of the MFCs, and the reactor
pressure read 450 psi.
10) The outlet gas valve was opened from the top of the condensing unit, and a downstream
needle valve was used to control the outlet flow from the reactor. In order to ensure a
constant mass balance in and out of the reactor, the outlet flow was adjusted such that the

110
reactor pressure was fixed at 450 psi. A more sensitive pressure transducer was used as
reference while making small adjustments to the outlet flow with the needle valve.
11) The line to the GC was attached.
12) GC samples were taken until a 3:1 ratio of hydrogen and nitrogen was seen, indicating
that steady state had been reached.
13) Any condensed ammonia was then purged from the bottom of the condenser by quickly
opening and shutting the valve.
14) The time was recorded and a sample was then accumulated over a desired time period of
between 5 and 8 hours. During this time, constant attention was given to the outlet
flowrate to ensure that the pressure stayed fixed at 450 psi.
15) Every half hour, the reactor temperature and pressure were recorded, as well as GC
samples taken. In addition, the cooling water flowrate was measured by using a
stopwatch to time how long it took to fill a 250 ml graduated cylinder.
16) One hour before the sample period would end, an ice bath was filled so that an
Erlenmeyer flask would be brought down to a cool temperature before liquid ammonia
was released into the flask.
17) When the end of the sampling time had been reached, a needle valve was opened slowly
to allow liquid ammonia to drip into the Erlenmeyer flask. Once all of the liquid had
been drained, the valve was closed.
18) The flask containing the ammonia was then taken to a scale and weighed.
19) Reactor shutdown.
a. The heating unit was turned off.
b. The valve at the top of the condensing unit was closed.

111
c. Gas cylinders were closed and the MFCs were set to zero flowrate.
d. The valve at the bottom of the condenser was opened slowly to purge the gas
from the system.
e. The MFCs were then detached at both ends and powered off.
f. The temperature controller was powered off, the line to the GC was detached, and
the cooling water to the heat exchanger was turned off.
20) After the reactor had cooled, the vessel was removed, opened, and the catalyst was
removed and weighed.
2.4 Results Experimental determination of ammonia production rates and catalytic reaction rates
were found to be consistent with expected trends and were found to be on the order of expected
values. As Figure 5 shows, the molar fraction of ammonia in the outlet stream initially increases
with increasing temperature due to kinetics, but then becomes limited by the thermodynamic
equilibrium, which decreases with increasing temperature.
After conducting the synthesis experiments with a catalyst bed of 0.42 kg, it was
hypothesized that the same ammonia production rate could be met with less catalyst. It was
expected that the rate of the synthesis was being limited by thermodynamics rather than the
amount of catalyst, so the amount of catalyst was reduced to 0.017 kg, based on the expected
reaction rate at 31 bar from the expected trend shown in Figure 8.
The hypothesis was confirmed when the space velocity was increased to 10,000 1/hr from
400 1/hr and roughly the same output of NH3 was achieved. The discrepancies between NH3
mole fractions at a given temperature and different space velocities is attributed to uncertainties
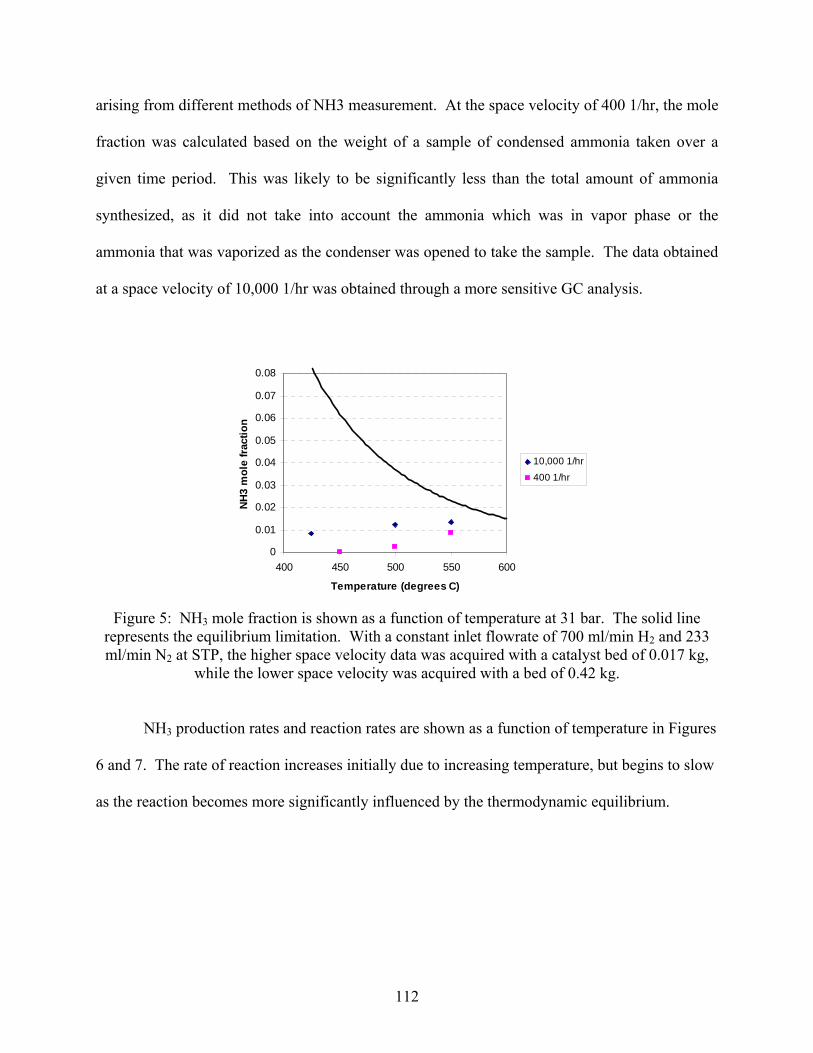
112
arising from different methods of NH3 measurement. At the space velocity of 400 1/hr, the mole
fraction was calculated based on the weight of a sample of condensed ammonia taken over a
given time period. This was likely to be significantly less than the total amount of ammonia
synthesized, as it did not take into account the ammonia which was in vapor phase or the
ammonia that was vaporized as the condenser was opened to take the sample. The data obtained
at a space velocity of 10,000 1/hr was obtained through a more sensitive GC analysis.
0
0.01
0.02
0.03
0.04
0.05
0.06
0.07
0.08
400 450 500 550 600
Temperature (degrees C)
NH
3 m
ole
frac
tion
10,000 1/hr
400 1/hr
Figure 5: NH3 mole fraction is shown as a function of temperature at 31 bar. The solid line
represents the equilibrium limitation. With a constant inlet flowrate of 700 ml/min H2 and 233 ml/min N2 at STP, the higher space velocity data was acquired with a catalyst bed of 0.017 kg,
while the lower space velocity was acquired with a bed of 0.42 kg. NH3 production rates and reaction rates are shown as a function of temperature in Figures
6 and 7. The rate of reaction increases initially due to increasing temperature, but begins to slow
as the reaction becomes more significantly influenced by the thermodynamic equilibrium.

113
0
0.00000002
0.00000004
0.00000006
0.00000008
0.0000001
0.00000012
0.00000014
0.00000016
0.00000018
0.0000002
400 450 500 550 600
Temperature (degrees C)
NH3
synt
hesi
s ra
te (k
g NH
3 / s
)
10,000 1/hr
Figure 6: NH3 synthesis rate is shown versus temperature. Weight of the catalyst = 0.017 kg.
0.000000
0.000002
0.000004
0.000006
0.000008
0.000010
400 450 500 550 600
Temperature (degrees C)
Rea
ctio
n ra
te
(kg
NH
3 / k
g ca
taly
st /
s)
10,000 1/hr
Figure 7: NH3 reaction rate is shown versus temperature.
In Figures 8 and 9, NH3 production is shown versus pressure. The experimentally
determined reaction rate was compared to previously reported reaction rates by Süd-Chemie and
it was found that the experimental data aligned with the expected trend. As shown in Figure 9,
as pressure decreases, the catalyst performance tends to decreases linearly until a critical point is
reached where the rate at which the reaction rate decreases begins to increase non-linearly. In

114
Figure 9, the wustite catalyst is compared with the magnetite catalyst, and demonstrates much
better performance at lower pressures.
0.00000
0.00005
0.00010
0.00015
0.00020
0.00025
0 50 100 150 200 250
Pressure (bar)
Rea
ctio
n ra
te (k
g N
H3
/ kg
cata
lyst
/ s)
AmoMax-10 (Sud-Chemie)AmoMax-10 (ColumbiaUniversity)
Figure 8: Reaction rates for the Süd-Chemie Amomax iron catalyst are shown versus pressure at
425 degrees Celsius. The experimental data provided by Süd-Chemie align with the expected trend connecting to experimental data acquired in this experiment.
0.00
0.05
0.10
0.15
0.20
0.25
0.30
0.35
0.40
0 50 100 150 200 250
Pressure (bar)
NH
3 m
ole
fract
ion
AmoMax-10 (ColumbiaUniversity)
AmoMax-10 (Sud-Chemie)
Magnetite (Sud-Chemie)
Figure 9: NH3 mole fraction is shown versus pressure for different iron-based catalysts at a
temperature of 425 degrees Celsius.

115
Figures 10 and 11 demonstrate effluent NH3 mole fraction and NH3 reaction rate versus temperature at a pressure of 150 bar and space velocity of 15,000 1/hr. For the AmoMax-10 catalyst, NH3 output meets the thermodynamic equilibrium at 435 degrees Celsius.
0.00
0.05
0.10
0.15
0.20
0.25
0.30
325 375 425 475 525
Temperature (degrees C)
NH
3 m
ole
fract
ion
AmoMax-10 (Sud-Chemie)
Magnetite (Sud-Chemie)
Figure 10: NH3 mole fraction versus temperature for different iron-based catalysts at 150 bar
and 15,000 1/hr, provided by Süd-Chemie. The solid line represents the thermodynamic equilibrium.
0.00000
0.00005
0.00010
0.00015
0.00020
0.00025
0.00030
300 350 400 450 500 550
Temperature (degrees C)
Rea
ctio
n ra
te (k
g N
H3
/ kg
cata
lyst
/ s)
AmoMax-10(Sud-Chemie)
Figure 11: Reaction rate versus temperature for AmoMax-10 catalyst at 150 bar and 15,000 1/hr,
provided by Süd-Chemie. Finally, in Figures 12 and 13 and in Tables 1 and 2, a catalytic ammonia synthesis reactor
is scaled to decompose 100 tons of ammonia over 72 hours (0.35 kg/s). In Figure 12, it is
demonstrated that a minimum reactor size is reached at a temperature of about 435 degrees
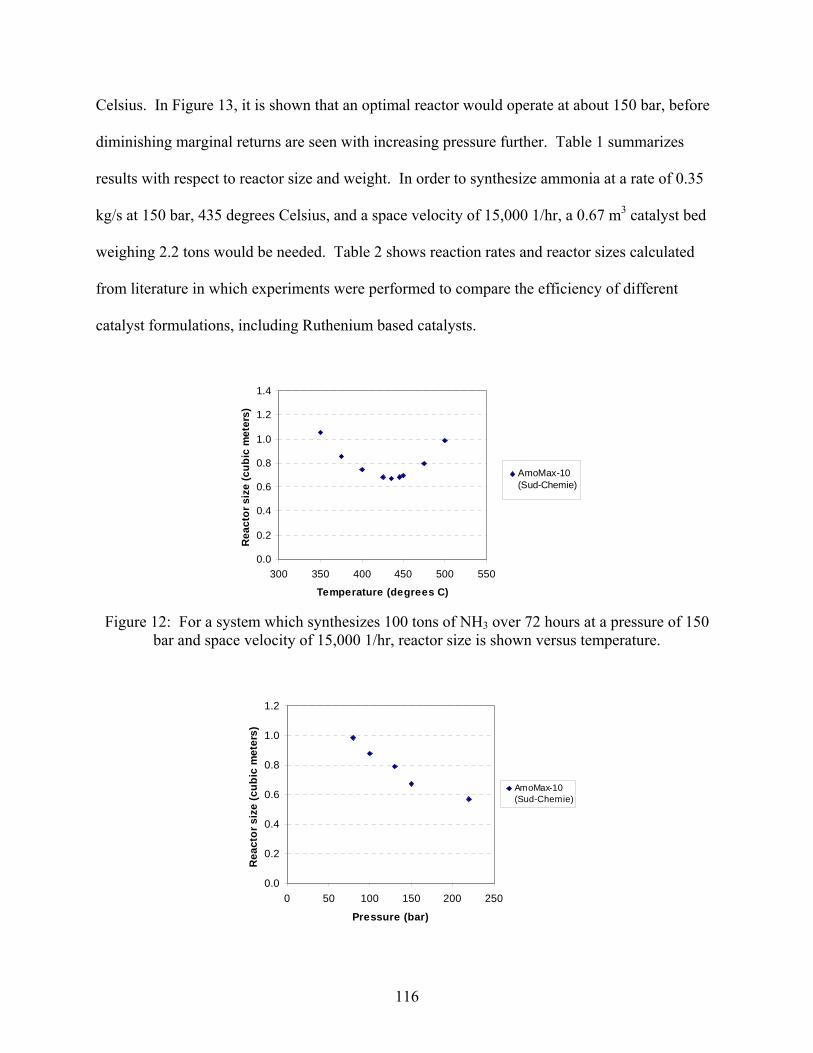
116
Celsius. In Figure 13, it is shown that an optimal reactor would operate at about 150 bar, before
diminishing marginal returns are seen with increasing pressure further. Table 1 summarizes
results with respect to reactor size and weight. In order to synthesize ammonia at a rate of 0.35
kg/s at 150 bar, 435 degrees Celsius, and a space velocity of 15,000 1/hr, a 0.67 m3 catalyst bed
weighing 2.2 tons would be needed. Table 2 shows reaction rates and reactor sizes calculated
from literature in which experiments were performed to compare the efficiency of different
catalyst formulations, including Ruthenium based catalysts.
0.0
0.2
0.4
0.6
0.8
1.0
1.2
1.4
300 350 400 450 500 550
Temperature (degrees C)
Rea
ctor
siz
e (c
ubic
met
ers)
AmoMax-10(Sud-Chemie)
Figure 12: For a system which synthesizes 100 tons of NH3 over 72 hours at a pressure of 150
bar and space velocity of 15,000 1/hr, reactor size is shown versus temperature.
0.0
0.2
0.4
0.6
0.8
1.0
1.2
0 50 100 150 200 250
Pressure (bar)
Rea
ctor
siz
e (c
ubic
met
ers)
AmoMax-10(Sud-Chemie)
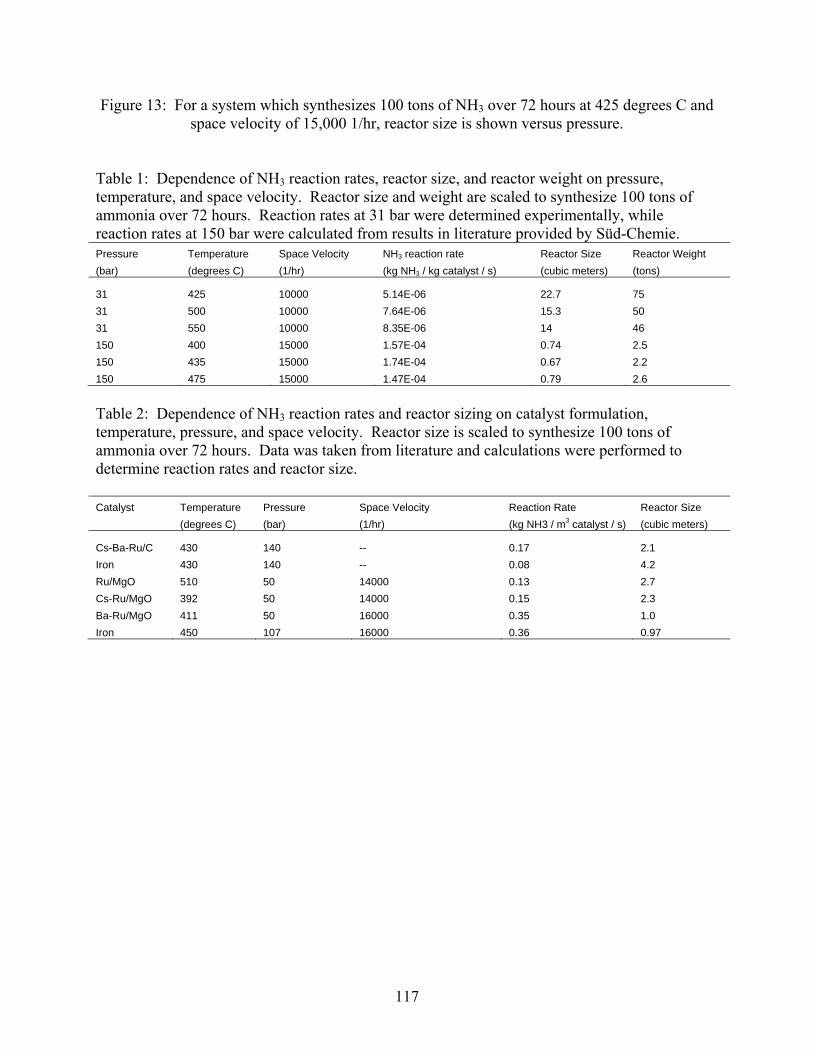
117
Figure 13: For a system which synthesizes 100 tons of NH3 over 72 hours at 425 degrees C and space velocity of 15,000 1/hr, reactor size is shown versus pressure.
Table 1: Dependence of NH3 reaction rates, reactor size, and reactor weight on pressure, temperature, and space velocity. Reactor size and weight are scaled to synthesize 100 tons of ammonia over 72 hours. Reaction rates at 31 bar were determined experimentally, while reaction rates at 150 bar were calculated from results in literature provided by Süd-Chemie. Pressure Temperature Space Velocity NH3 reaction rate Reactor Size Reactor Weight (bar) (degrees C) (1/hr) (kg NH3 / kg catalyst / s) (cubic meters) (tons)
31 425 10000 5.14E-06 22.7 75 31 500 10000 7.64E-06 15.3 50 31 550 10000 8.35E-06 14 46 150 400 15000 1.57E-04 0.74 2.5 150 435 15000 1.74E-04 0.67 2.2 150 475 15000 1.47E-04 0.79 2.6
Table 2: Dependence of NH3 reaction rates and reactor sizing on catalyst formulation, temperature, pressure, and space velocity. Reactor size is scaled to synthesize 100 tons of ammonia over 72 hours. Data was taken from literature and calculations were performed to determine reaction rates and reactor size. Catalyst Temperature Pressure Space Velocity Reaction Rate Reactor Size (degrees C) (bar) (1/hr) (kg NH3 / m3 catalyst / s) (cubic meters)
Cs-Ba-Ru/C 430 140 -- 0.17 2.1 Iron 430 140 -- 0.08 4.2 Ru/MgO 510 50 14000 0.13 2.7 Cs-Ru/MgO 392 50 14000 0.15 2.3 Ba-Ru/MgO 411 50 16000 0.35 1.0 Iron 450 107 16000 0.36 0.97

118
3. Ammonia Decomposition
3.1 Introduction
Experiments were completed using a stainless steel bulkhead flow-reactor to determine
the performance of NiO/CaO/Al2O3 and Rh/Al2O3 catalysts with respect to their ability to
decompose ammonia (NH3) into nitrogen (N2) and hydrogen (H2). The purpose of these
experiments was to determine the relationship between the conversion efficiency of a given
catalyst with the operating temperature of the decomposition reactor. This data is then used to
extrapolate the size and performance of a Walrus reference vehicle system.
Two different catalyst formulations were compared in these experiments. The first
catalyst was designed by Süd-Chemie Inc. and recommended by engineers in the catalyst
division to fulfill the goals of these experiments. The product name of the spherical catalysts
with diameter ranging from 2-4 mm is G-90 and contains the chemical formulation
NiO/CaO/Al2O3. In terms of weight percent, the catalyst is 57-87 % aluminum oxide, 10-25 %
nickel oxide, and 3-18 % calcium oxide. The density of the catalyst, in terms of the mass
contained inside a fixed packed bed with volume approximated as a cylinder, was measured to be
1.04 g/cm3. A one-liter sample of the catalyst was obtained at a cost of $500 from Süd-Chemie.
The second catalyst tested, from Engelhard Corp., was a Rh/Al2O3 monolith. This
catalyst was 4 % Rh by weight, and was measured to have a density of 0.44 g/cm3 in terms of a
fixed monolith with the volume approximated as a cylinder. The Rh monoliths were donated
from Engelhard Corp. by Dr. Robert Farrauto but can be purchased at an estimated price of
$2,600/liter.

119
The primary results, discussed in detail in the Results section, are that the catalyst
performed as expected in terms of reaction rates of NH3 decomposition. All goals were met in
terms of time and performance.
3.2 Experimental Setup
The ammonia decomposition reactor is shown in a schematic in Figure 1. It consists of a
stainless steel bulkhead reactor core, loaded with either pellets or a monolith catalyst, inside of a
two-stage furnace. The furnace temperature was controlled via two Variac voltage transformers.
K-type thermocouples were imbedded directly inside of the catalyst bed and downstream of the
bed, and temperature readings were acquired with an Omega OMB-DAQ-54 data acquisition
system. The mass flow rate of each inlet gas into the reactor was controlled with Aalborg mass
flow controllers of model number GFC17, which were fed gas from cylinders of pure anhydrous
ammonia, argon, and hydrogen. The outlet flow from the catalytic reactor was sent to an Agilent
3000 Micro GC instrument to analyze the concentrations of particular species in the outlet stream
and finally vented to a hood.

120
Two-stage furnace with stainless steel flow-through
bulkhead reactor
Ar H2 NH3
CPU -- thermocouple DAQ
Figure 1: Schematic of ammonia decomposition system.
Figure 2: Two-stage furnace opened to show stainless steel bulkhead reactor. Beneath the furnace are the Variac voltage controllers as well as the Omega data acquisition hardware to
acquire temperature readings.

121
Figure 3: Aalborg GFC17 mass flow controllers.
Figure 4: Agilent 3000 Micro GC and notebook computer to acquire gas chromatograph data.
3.3 Experimental Procedure
14. Reactor assembly.

122
a. Thermocouples were inserted into stainless steel bulkhead reactor such that the
first thermocouple was centered radially in the reactor and imbedded 1 cm into
the catalyst bed axially, and the second was 3.54 cm downstream from the first
thermocouple, also centered radially.
b. The bulkhead reactor was loaded with 2 cm of pellets (5.7 cm3) or with a 1.2 cm
long monolith (3.42 cm3).
i. If using pellets, a non-catalytic wire mesh was used to pack the bed tight
so that there was no bypass.
c. The reactor was placed inside the furnace such that the catalyst bed began at a
point 47 cm downstream into furnace where it was experimentally determined
that the furnace provided a constant temperature profile for a distance greater than
the catalyst bed.
15. Tube connections were checked from gas cylinders to mass flow controllers (MFCs),
from the MFCs to the connecting tee, from the tee to the reactor, and from the reactor to
the hood. The line from the reactor outlet to the GC was left unattached initially so that
outlet from the pre-reduction step was vented directly to the hood.
16. The MFCs were plugged in to warm up; the local setpoints on the units were checked to
be set at zero ml/min of outlet flow.
a. After 30 minutes of warming up, the valves at the gas cylinders were opened to
provide a pressure of about 25-40 psi to the MFCs while leaving the outlet flow
off.

123
17. The two-stage furnace was turned on (the Variacs were set high initially to gain the first
400 degrees C, then backed off to the appropriate setting on the Variac to gain rest of the
heat).
18. Pre-reduction.
a. Once the furnace reached steady state at 500 degrees C in the catalyst bed, the
local setpoints on the MFCs were adjusted such that a mixture of 200 ml/min Ar
and 25 ml/min H2 were flowed into the reactor for 1 hr to pre-reduce the catalyst.
b. The H2 flow was then turned off via the MFC setpoint, and the H2 tube from the
MFC to the inlet tee was unscrewed at the tee and capped.
c. The system was flushed with 200 ml/min Ar for 30 minutes.
19. A tube connecting the outlet flow from the reactor to the GC was attached.
20. The connection at the inlet tee was switched from the Ar tube to the NH3 tube.
21. NH3 was fed in at the lowest flowrate (100ml/min for pellets or 60 ml/min for monolith)
until no Argon is seen on chromatogram (at least 60 minutes).
22. When steady state was reached at the first chosen temperature and space velocity,
sampling with the GC was initiated.
a. When the GC turned on to take a sample, temperature was recorded. Since the
thermocouple reading was instantaneous but the GC sample was taken after the
gas had traveled approximately 10 m downstream through 1/8 inch ID tubing,
there was a short time lag (approximately 2 minutes) between the temperature
readings and the GC sample. But, if steady state conditions were met for a time
greater than the lag time, a correction for the offset was not needed.

124
b. As many samples were taken as needed to ensure that the system was in steady
state.
23. NH3 flowrate was then increased to achieve the next desired space velocity. The Variak
was adjusted to reach the same temperature in the catalyst bed as seen with previous run.
24. When steady state was reached again with the new flowrate, sampling resumed with the
GC. This procedure was repeated at different flowrates (space velocities) while
maintaining the same catalyst temperature.
25. Once sampling was exhausted at a particular temperature, NH3 flow was reduced back to
the initial space velocity.
26. The Variac was adjusted to attain steady state at the next highest temperature, and the GC
samplings repeated at the same space velocities as sampled previously.
27. The Variac was adjusted to attain steady state at the next highest temperature, and the GC
samplings were repeated at the same space velocities as sampled previously.
28. Once three temperatures were tested with varying space velocities, the furnace was shut
down, the system was flushed with argon for 30 minutes, and the MFCs were powered
down.
3.4 Calculations Prior to data collection, the Micro GC was calibrated to provide a correlation between the area
under a chromatogram peak of a particular gas and its concentration in mole fraction. An
example of the linear correlation is seen in Figure 5. A linear trendline and equation was fit to
the calibration data so that a particular area would correlate to a particular mole fraction when
the outlet gas from the reactor was sampled.

125
y = 3.84346E-07x - 5.69465E-02
00.10.20.30.40.50.60.70.80.9
1
0 500000 1000000 1500000 2000000
area
Mol
e fr
actio
n
Figure 5: A sample GC calibration for N2. The equation for the line of best fit provides a simple
correlation between area under the N2 peak of the chromatogram and its mole fraction. An example of the calculations which provide mole fractions from the data acquired from the
Micro GC are seen in Table 1. When ammonia is present in a molar fraction of about 25 %, the
equation y = (3.6395E-07)*(area)+(7.7897E-02) serves as a reasonable linear correlation to
calculate the exact molar fraction. At much smaller concentrations, another equation is used to
provide a better fit.
Table 1: Sample calculations for the concentration of NH3 at a particular space velocity and temperature. The mean average and standard deviation was taken from the calculations of mole fraction.
Temp (oC)
Flow rate (ml/min)
Space velocity (ml NH3 STP/cm3 catalyst/hr)
Area of NH3 from GC
Concentration of NH3 (mole fraction) Avg.
St. dev.
y = (3.6395E-07)*(area)+(7.7897E-02) 505.8 100 1053 484132 0.2595 0.2578 0.0017 505.9 100 1053 484295 0.2596 505.9 100 1053 482498 0.2588 506.3 100 1053 476006 0.2561 506.4 100 1053 476981 0.2566 506.5 100 1053 475410 0.2559

126
3.5 Results
Figures 6, 7, and 8 show a direct comparison between the performance of the different
catalysts at 505, 575, and 615 °C, respectively. The data in these figures show that the nickel
based catalyst has superior performance at low space velocities, for all temperatures, but has
similar or poorer performance compared to the rhodium based catalyst at higher space velocities,
for all temperatures.
0.3
0.4
0.5
0.6
0.7
0.8
0.9
1
0 1000 2000 3000 4000
Space velocity (1/hr)
Con
vers
ion
(mol
e fr
actio
n)
Nickel
Rhodium
Figure 6: Dependence of conversion of ammonia (in mole fractions decomposed) on the space velocity (ml NH3 STP / cm3 catalyst / hr) for a reactor core temperature of 505 °C. Y-error bars
represent standard deviations.

127
0.75
0.8
0.85
0.9
0.95
1
0 1000 2000 3000 4000
Space velocity (1/hr)
Con
vers
ion
(mol
e fr
actio
n)
Nickel
Rhodium
Figure 7: Dependence of the conversion of ammonia (in mole fraction decomposed) on the
space velocity for a reactor core temperature 575 °C. Y-error bars represent standard deviations.
0.75
0.8
0.85
0.9
0.95
1
0 1000 2000 3000 4000
Space velocity (1/hr)
Con
vers
ion
(mol
e fr
actio
n)
Nickel
Rhodium
Figure 8: Dependence of the conversion of ammonia (in mole fraction decomposed) on the
space velocity for a reactor core temperature 615 °C. Y-error bars represent standard deviations.
Figures 9, 10, and 11 show the dependence of the individual species concentrations at the
reactor outlet on the space velocity for the nickel catalyst, for temperatures of 505, 575, and 615
°C. The data match the anticipated trends, in that nitrogen and hydrogen mole fractions decrease
as the ammonia decomposition rate decreases. Figures 12, 13, and 14 show similar data for the
rhodium catalyst, and this data matches the anticipated trends as well.
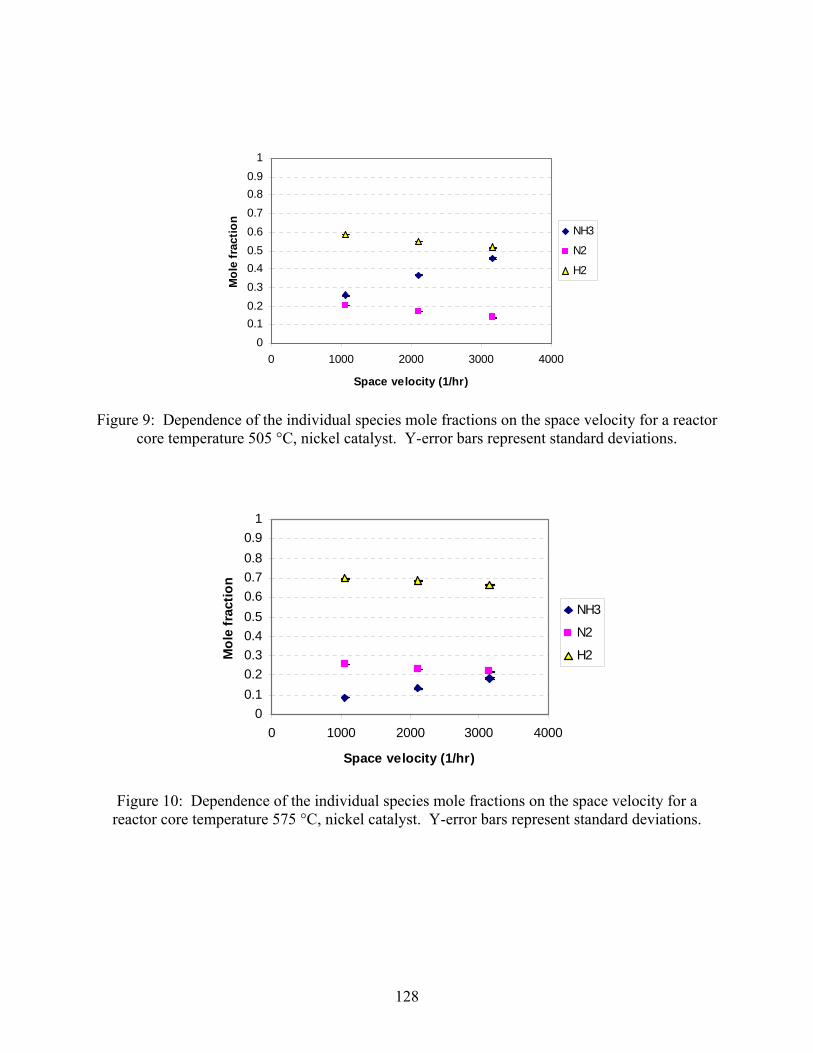
128
00.10.20.30.40.50.60.70.80.9
1
0 1000 2000 3000 4000
Space velocity (1/hr)
Mol
e fr
actio
nNH3
N2
H2
Figure 9: Dependence of the individual species mole fractions on the space velocity for a reactor
core temperature 505 °C, nickel catalyst. Y-error bars represent standard deviations.
00.10.20.30.40.50.60.70.80.9
1
0 1000 2000 3000 4000
Space velocity (1/hr)
Mol
e fr
actio
n
NH3
N2
H2
Figure 10: Dependence of the individual species mole fractions on the space velocity for a
reactor core temperature 575 °C, nickel catalyst. Y-error bars represent standard deviations.

129
00.10.20.30.40.50.60.70.80.9
1
0 1000 2000 3000 4000
Space velocity (1/hr)
Mol
e fr
actio
n
NH3
N2
H2
Figure 11: Dependence of the individual species mole fractions on the space velocity for a
reactor core temperature 615 °C, nickel catalyst. Y-error bars represent standard deviations.
0
0.1
0.2
0.3
0.4
0.50.6
0.7
0.8
0.9
1
0 1000 2000 3000 4000
Space velocity (1/hr)
Mol
e fr
actio
n
NH3
N2
H2
Figure 12: Dependence of the individual species mole fractions on the space velocity for a
reactor core temperature 505 °C, Rhodium catalyst. Y-error bars represent standard deviations.
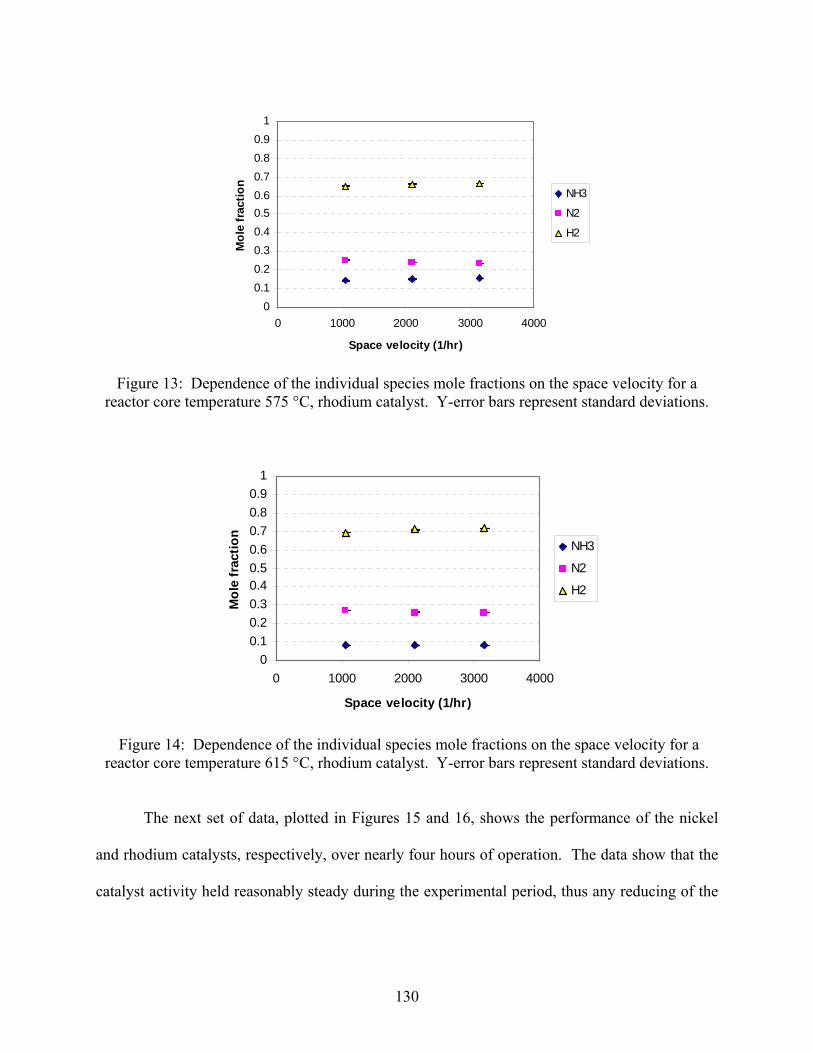
130
00.10.20.30.40.50.60.70.80.9
1
0 1000 2000 3000 4000
Space velocity (1/hr)
Mol
e fr
actio
n
NH3
N2
H2
Figure 13: Dependence of the individual species mole fractions on the space velocity for a
reactor core temperature 575 °C, rhodium catalyst. Y-error bars represent standard deviations.
00.10.20.30.40.50.60.70.80.9
1
0 1000 2000 3000 4000
Space velocity (1/hr)
Mol
e fr
actio
n
NH3
N2
H2
Figure 14: Dependence of the individual species mole fractions on the space velocity for a
reactor core temperature 615 °C, rhodium catalyst. Y-error bars represent standard deviations.
The next set of data, plotted in Figures 15 and 16, shows the performance of the nickel
and rhodium catalysts, respectively, over nearly four hours of operation. The data show that the
catalyst activity held reasonably steady during the experimental period, thus any reducing of the

131
catalyst (burning away of the oxides during initial use) is negligible and the catalyst performance
can be assumed to be steady state.
00.10.20.30.40.50.60.70.80.9
1
0 50 100 150 200 250
Time (minutes)
Mol
e fr
actio
n
NH3
N2
H2
Figure 15: Dependence of the effluent molar fractions of ammonia, nitrogen, and hydrogen with
time for the nickel catalyst at 575 °C and a space velocity of 790 (1/hr).
00.10.20.30.40.50.60.70.80.9
1
0 50 100 150 200
Time (minutes)
Mol
e fr
actio
n
NH3
N2
H2
Figure 16: Dependence of the effluent molar fractions of ammonia, nitrogen, and hydrogen with
time for the rhodium catalyst at 550 °C and a space velocity of 2100 (1/hr).
In Figures 17 and 18, the reaction rate for ammonia decomposition is shown versus
temperature for the nickel and rhodium catalysts. The rhodium catalyst demonstrates higher
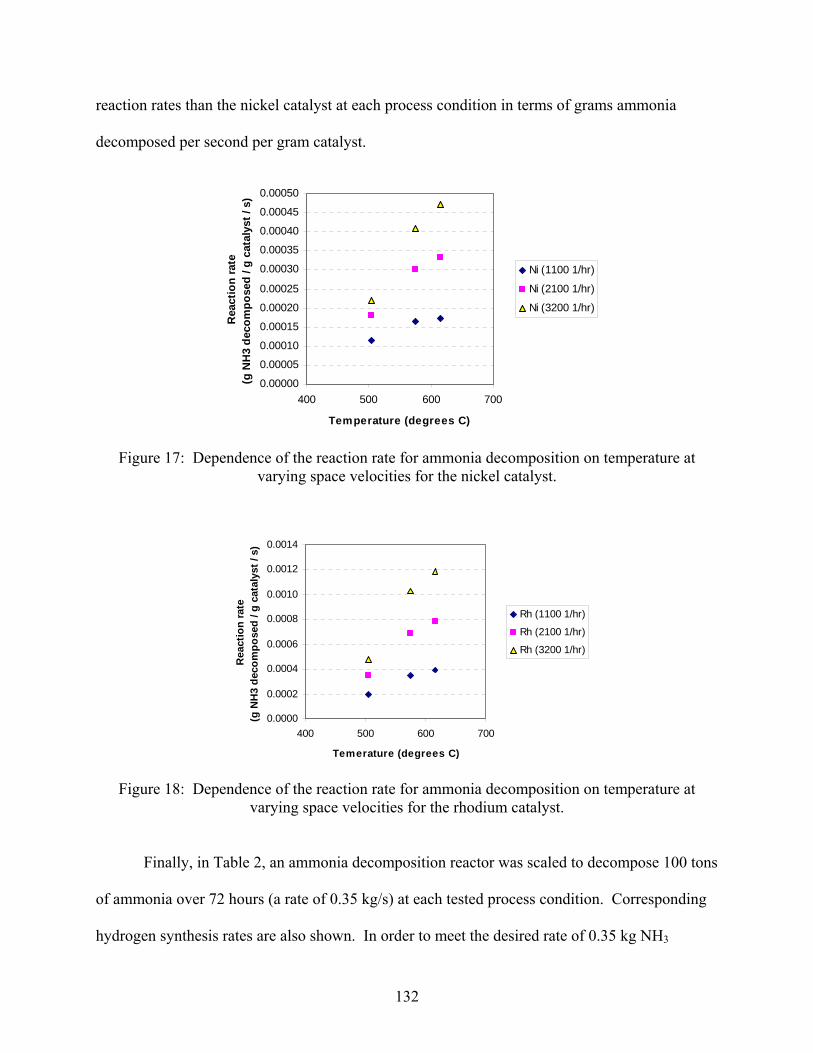
132
reaction rates than the nickel catalyst at each process condition in terms of grams ammonia
decomposed per second per gram catalyst.
0.00000
0.00005
0.00010
0.00015
0.00020
0.00025
0.00030
0.00035
0.00040
0.00045
0.00050
400 500 600 700
Temperature (degrees C)
Rea
ctio
n ra
te
(g N
H3
deco
mpo
sed
/ g c
atal
yst /
s)
Ni (1100 1/hr)
Ni (2100 1/hr)
Ni (3200 1/hr)
Figure 17: Dependence of the reaction rate for ammonia decomposition on temperature at
varying space velocities for the nickel catalyst.
0.0000
0.0002
0.0004
0.0006
0.0008
0.0010
0.0012
0.0014
400 500 600 700
Temerature (degrees C)
Rea
ctio
n ra
te
(g N
H3
deco
mpo
sed
/ g c
atal
yst /
s)
Rh (1100 1/hr)
Rh (2100 1/hr)
Rh (3200 1/hr)
Figure 18: Dependence of the reaction rate for ammonia decomposition on temperature at
varying space velocities for the rhodium catalyst.
Finally, in Table 2, an ammonia decomposition reactor was scaled to decompose 100 tons
of ammonia over 72 hours (a rate of 0.35 kg/s) at each tested process condition. Corresponding
hydrogen synthesis rates are also shown. In order to meet the desired rate of 0.35 kg NH3

133
decomposed per second at 615 °C and a space velocity of 3200 1/hr, a nickel-based reactor
would need to be 0.72 m3 and would weigh 0.82 tons, while a rhodium based reactor would be
0.67 m3 and would weigh only 0.33 tons.

134
Table 2: Dependence of hydrogen production rates, ammonia decomposition rates, and reactor size and weight on catalyst type, temperature, and space velocity. Reactor size and weight are scaled to decompose 100 tons of ammonia over 72 hours. Weight of Ni catalyst = 5.9 g and weight of Rh catalyst = 1.5 g. Catalyst Temperature Space Velocity H2 synthesis rate NH3 decomposition rate Reactor Size Reactor Weight
(base metal) (degrees C) (ml NH3 STP/ cm3 catalyst/hr)
(L H2 STP/ g catalyst/s)
(g NH3 decomposed/ g catalyst/s) (cubic meters) (tons)
Ni 505 1100 0.00025 0.00011 2.92 3.35 Ni 505 2100 0.00039 0.00019 1.87 2.14 Ni 505 3200 0.00047 0.00022 1.54 1.76 Rh 505 1100 0.00043 0.00020 4.00 1.94 Rh 505 2100 0.00076 0.00035 2.26 1.10 Rh 505 3200 0.00103 0.00048 1.67 0.81 Ni 575 1100 0.00036 0.00017 2.04 2.34 Ni 575 2100 0.00065 0.00030 1.12 1.28 Ni 575 3200 0.00088 0.00040 0.83 0.95 Rh 575 1100 0.00075 0.00035 2.27 1.10 Rh 575 2100 0.00147 0.00069 1.16 0.56 Rh 575 3200 0.00220 0.00103 0.77 0.38 Ni 615 1100 0.00037 0.00017 1.94 2.22 Ni 615 2100 0.00072 0.00034 1.01 1.16 Ni 615 3200 0.00101 0.00047 0.72 0.82 Rh 615 1100 0.00085 0.00040 2.01 0.98 Rh 615 2100 0.00170 0.00079 1.01 0.49 Rh 615 3200 0.00255 0.00119 0.67 0.33
135
LITERATURE CITED
1. EPA, Landfill Methane Outreach Program. 2006. 2. Themelis, N.J., The environmental impacts: Assessing waste-to-energy and landfilling in
the US. Waste Management World, 2002: p. 35-41. 3. Themelis, N.J. and P.A. Ulloa, Methane generation in landfills. Renewable Energy, 2006.
32(7): p. 1243-1257. 4. Weitz, K.A., et al., The impact of municipal solid waste management on greenhouse gas
emissions in the United States. Journal of the Air & Waste Management Association, 2002. 52(9): p. 1000-1011.
5. Administration, E.I., Emissions of Greenhouse Gases in the United States 2003. Comparison of global warming potentials from the IPCC's second and third assessment reports, 2003.
6. W. Qin, F.N.E., T.T. Tsotsis, Fundamental and environmental aspects of landfill gas utilization for power generation. Chemical Engineering Journal, 2001. 82: p. 157-172.
7. Richardson, J.T. and S.A. Paripatyadar, Carbon dioxide reforming of methane with supported rhodium. Applied Catalysis, 1990. 61(2): p. 293-309.
8. Wang, S., G.Q. Li, and G.J. Millar, Carbon Dioxide Reforming of Methane To Produce Synthesis Gas over Metal-Supported Catalysts: State of the Art. Energy & Fuels, 1996. 10(4): p. 896-904.
9. Fischer, F. and H. Tropscii, Conversion of methane into hydrogen and carbon monoxide. Brennstoff-Chemie, 1928. 9: p. 39-46.
10. Bodrov, I.M. and L.O. Apel'baum, Reaction kinetics of methane and carbon dioxide on a nickel surface. Kinetika i Kataliz, 1967. 8(2): p. 379-82.
11. Rostrup-Nielsen, J.R., Equilibriums of decomposition reactions of carbon monoxide and methane over nickel catalysts. Journal of Catalysis, 1972. 27(3): p. 343-56.
12. Rostrup-Nielsen, J.R., Production of synthesis gas. Catalysis Today, 1994. 18(4): p. 305-24.
13. Erdohelyi, A., J. Cserenyi, and F. Solymosi, Activation of methane and its reaction with carbon dioxide over supported rhodium catalysts. Journal of Catalysis, 1993. 141(1): p. 287-99.
14. Rostrup-Nielsen, J.R. and J.H. Bak Hansen, Carbon dioxide-reforming of methane over transition metals. Journal of Catalysis, 1993. 144(1): p. 38-49.
15. Zhang, Z.L., et al., Reforming of methane with carbon dioxide to synthesis gas over supported rhodium catalysts. I. Effects of support and metal crystallite size on reaction activity and deactivation characteristics. Journal of Catalysis, 1996. 158(1): p. 51-63.
16. Sigl, M., et al., CO2 reforming of methane over vanadia-promoted Rh/SiO2 catalysts. Topics in Catalysis, 1999. 8(3,4): p. 211-222.
17. Ranganathan, E., Methanol steam reforming over Pd/ZnO and Pd/CeO2 catalysts. Applied Catalysis A: General, 2005. 289(2): p. 153-162.
18. Noronha, F.B., Correlation between catalytic activity and support reducibility in the CO2 reforming of CH4 over Pt/CexZr1-xO2 catalysts. Chemical Engineering Journal, 2001. 82: p. 21-31.
19. Wei, J. and E. Iglesia, Structural requirements and reaction pathways in methane activation and chemical conversion catalyzed by rhodium. Journal of Catalysis, 2004. 225(1): p. 116-127.
Related Documents