GREEN SUPPLY CHAIN MANAGEMENT AND ORGANIZATIONAL PERFORMANCE OF FOOD AND BEVERAGE MANUFACTURING FIRMS IN KENYA BY ANNE MUMBI NDERITU A RESEARCH PROJECT SUBMITTED IN PARTIAL FULFILLMENT OF THE REQUIREMENTS FOR THE AWARD OF THE DEGREE OF MASTER OF BUSINESS ADMINISTRATION (MBA), SCHOOL OF BUSINESS, UNIVERSITY OF NAIROBI. SEPTEMBER, 2016

Welcome message from author
This document is posted to help you gain knowledge. Please leave a comment to let me know what you think about it! Share it to your friends and learn new things together.
Transcript
GREEN SUPPLY CHAIN MANAGEMENT AND ORGANIZATIONAL
PERFORMANCE OF FOOD AND BEVERAGE MANUFACTURING FIRMS IN
KENYA
BY
ANNE MUMBI NDERITU
A RESEARCH PROJECT SUBMITTED IN PARTIAL FULFILLMENT OF THE
REQUIREMENTS FOR THE AWARD OF THE DEGREE OF MASTER OF
BUSINESS ADMINISTRATION (MBA), SCHOOL OF BUSINESS, UNIVERSITY
OF NAIROBI.
SEPTEMBER, 2016
ii
DECLARATION
This research project is my original work and has not been presented for an award in any
other university.
Signed………………………………. Date……………………………………
Anne Mumbi Nderitu.
Reg No: D61/72799/2014
This research project has been submitted for examination with my approval as the
university supervisor.
Signed…………………………….. Date………………………………………
Mr. Joel Lelei
Department of Management Science,
School of Business,
University of Nairobi.

iii
DEDICATION
This research project is dedicated to my daughter Natalie, fiancé Henry Muhoro, my
siblings, Simon and Sheila Nderitu and my parents for their support while undertaking
my studies. Thank you and God bless.

iv
ACKNOWLEDGEMENTS
I wish to express my utmost gratitude to God for giving me health and wisdom to conduct
this study. I appreciate my parents for their encouragement and support. I also appreciate
my supervisor, Mr. Lelei for guiding me in conducting the research.
v
TABLE OF CONTENTS
DECLARATION............................................................................................................... ii
DEDICATION.................................................................................................................. iii
ACKNOWLEDGEMENTS ............................................................................................ iv
ABSTRACT .................................................................................................................... viii
LIST OF TABLES ........................................................................................................... ix
CHAPTER ONE: INTRODUCTION ............................................................................. 1
1.1 Background ......................................................................................................... 1
1.1.1 Green Supply Chain Management ..................................................................... 2
1.1.2 Organizational Performance .............................................................................. 3
1.1.3 Green Supply Chain Management and Organizational Performance ................ 3
1.1.4 Food and Beverage Industry in Kenya............................................................... 4
1.2 Research Problem ..................................................................................................... 6
1.3 Objective of the Study .............................................................................................. 8
1.4 Value of the Study .................................................................................................... 8
CHAPTER TWO: LITERATURE REVIEW .............................................................. 10
2.1 Introduction ............................................................................................................. 10
2.2 Theoretical Foundation ........................................................................................... 10
2.2.1 Stakeholder Theory .......................................................................................... 10
2.2.3 Theory of Technology Diffusion ..................................................................... 12
2.3.1 Reverse logistics .............................................................................................. 13
2.3.2 Green Technology Adoption............................................................................ 14
2.3.3 Green Supplier Assessment ............................................................................. 15
2.2.4 Corporate Social Responsibility ...................................................................... 15
2.5 Empirical Literature ................................................................................................ 15
2.6 Conceptual Framework ........................................................................................... 17
CHAPTER THREE: RESEARCH METHODOLOGY ............................................ 18
3.1Introduction .............................................................................................................. 18
vi
3.2 Research Design...................................................................................................... 18
3.3 Population of the Study ........................................................................................... 18
3.4 Data Collection ....................................................................................................... 18
3.5 Data analysis .......................................................................................................... 19
CHAPTER FOUR ........................................................................................................... 21
DATA ANALYSIS, PRESENTATION AND INTERPRETATION ......................... 21
4.1 Introduction ............................................................................................................. 21
4.1.1 Response Rate .................................................................................................. 21
4.2 Demographic Information ....................................................................................... 21
4.2.1 Gender distribution .......................................................................................... 21
4.2.2 Age Distribution............................................................................................... 22
4.2.3 Education Level ............................................................................................... 23
4.2.4 Period of Service .............................................................................................. 23
4.2.5 Position in the Organization............................................................................. 24
4.2.6 Period of Operation in Kenya ......................................................................... 24
4.3 Adoption of Green Supply Chain Management...................................................... 25
4.3.1 Environmental Management Department ........................................................ 25
4.3.2 Environmental Management Policy ................................................................. 26
4.3.3 Green Supply Chain Management ....................................................................... 27
4.4 Challenges of Green Supply Chain Management ................................................... 29
4.5 Green Supply Chain Management and Organizational Performance ..................... 31
4.5.2 Regression ............................................................................................................ 32
4.6 Discussion of the Findings ...................................................................................... 35
CHAPTER FIVE ............................................................................................................ 38
SUMMARY OF FINDINGS CONCLUSION AND RECOMMENDATIONS ........ 38
5.1 Introduction ............................................................................................................. 38
5.2 Summary of Findings .............................................................................................. 38
5.3 Conclusion .............................................................................................................. 39
5.4 Recommendations ................................................................................................... 40
5.5 Limitations of the Study.......................................................................................... 40
5.6 Suggestions for Further Studies .............................................................................. 41

vii
REFERENCES ................................................................................................................ 42
APPENDIX II: LIST OF LARGE FOOD AND BEVERAGE MANUFACTURERS
IN NAIROBI.................................................................................................................... 50
viii
ABSTRACT
Utilization of green supply chain management has been limited in that a decade ago it
was almost non-existent. The study aimed at establishing the extent to which the food and
beverage manufacturing industry in Kenya have adopted green supply chain
management, come up with challenges faced by the food and beverage manufacturing
industry by practicing green supply chain management practices and determining the
effect of green supply chain management on performance of and beverage and food
manufacturing in the Kenyan industry. The research is guided by the following theories;
stakeholder theory, resource dependence theory and the theory of technology diffusion. A
descriptive survey research design was employed in the study. Descriptive survey design
is utilized to grant researchers to collect, compile, and interpret information. This
research centred on large food and beverage manufacturing firms in Kenya which was 46.
Collection of primary data was by using of semi-structured questionnaire. The targeted
interviewees were procurement managers and quality assurance managers in the beverage
and food manufacturing firms in Nairobi, Kenya. Analysis of data was by using tables,
frequencies, mean standard deviation and percentages. Relationships between green
supply chain management and organizational performance was assessed and explained by
conducting a regression analysis. The study concluded that on reverse logistics there
exists a positive correlation coefficient with organizational performance of Food and
Beverage Manufacturing Industry in Kenya. There is also a positive relationship between
reverse logistics and organizational Performance of Food and Beverage Manufacturing
Industry in Kenya. On the green technology adoption, the study found out there was
strong positive correlation between green technology adoption and organizational
performance of Food and Beverage Manufacturing Industry in Kenya. The study further
concludes that a strong positive correlation coefficient exists between green supplier
assessment and performance in the organization of Food and Beverage Manufacturing
Industry in Kenya. The study further concludes a relationship that is positive between
Green supplier assessment and organizational performance of Food and Beverage
Manufacturing Industry in Kenya. On the corporate social responsibility and
organizational performance, the study concludes existence of a strong positive correlation
coefficient with organizational performance of Food and Beverage Manufacturing
Industry in Kenya. The study recommends that Kenyan Government, through Kenya
Environmental Authority should develop policies that make it a requirement for all
manufacturing firms to adopt environmentally friendly practices in the entire supply
chain.

ix
LIST OF TABLES
Table 4.2.1: Gender Distribution ................................................................................... 22
Table 4.2.2: Age Distribution ........................................................................................ 22
Table 4.2.3: Education Level .......................................................................................... 23
Table 4.2.4: Period of Service ......................................................................................... 23
Table 4.2.5: Position in the Organization ....................................................................... 24
Table 4.2.6: Period of Operation in Kenya ..................................................................... 25
Table 4.3.1: Environmental Management Department ................................................... 25
Table 4.3.2: Environmental Management Policy ........................................................... 26
Table 4.3.3: Extent of Adoption of Green Supply Chain Management.......................... 27
Table 4.4 : Challenges of Green Supply Chain Management ....................................... 29
Table 4.5.1: Organizational performance ....................................................................... 31
Table 4.5.2.1:Correlations................................................................................................. 32
Table 4.5.2.2:Regression Model Summary....................................................................... 33
Table 4.5.2.3 ANOVA of green supply chain management Influence on organizational
Performance ...................................................................................................................... 34
Table 4.5.2.4 Regression Coefficients ............................................................................. 34
CHAPTER ONE: INTRODUCTION
1.1 Background
Increases in energy levels and material consumption due to rapid economic growth, has
contributed to the environmental issues and resource depletion problems. Organizations
face competitive, regulatory, and community pressures thus it has become increasingly
significant to Balancing environmental performance and economic performance. Most
organizations nowadays are going green in their business due to concerns on
environmental sustainability (Elder, 2010). Individuals and organizations high demand
for raw materials has in the years brought about events such as the energy crisis and
consumerist behavior. There is focus on preservation and use of materials that are
recycled due to diminishing sources of raw materials. Green supply chain management is
a well rounded phenomenon in that it includes people, processes, organization and
technology. Nagel (2010), observed that Green supply chain management in the nations
that are developed like China has become important for enterprises that want to be
sustainable in the environmental and boost performance in circumstances where there is
increased drivers, market pressure, competition and a lot of regulations.
Consequently to Costa (2014) only some high-profile organizations mainly firms in the
consumer goods sectors and chemical firms and those that have been through pressures
from consumers who are green directly in order to implement it. In South Africa green
supply chain management is a new phenomenon, in public procurement decisions
environmental benchmarking are playing a role. In South Africa, all state bodies consider
environmental phenomenon through environmental impact assessments for larger
development projects that are required by government laws (Public Sector Procurement,
2002).

2
Performance of the organization has in time been constrained to outcomes in the
economy measured by market expansion, performance in stock market, profitability and
liquidity. Build up has been broken into sustainable growth rate dimensions of size in
terms of assets, sales and employees. An organization growth rate will eventually
decrease if it‟s a rate above the level of its sustainability. Stock (2004) concluded that by
reducing disposal and liability costs, green supply chain management improves a firm's
economic position and an organization's public image hence conserve resources.
A vast dimension of policies, institutional and legislative that ensure there is protection of
the environment (Odhiambo, 2008) that direct all business activities have been put in
place by Kenyan government.
1.1.1 Green Supply Chain Management
Green supply chain management is a selection of contractors, purchase of
environmentally friendly goods and services, and the setting requirements of the
environment in a contract. Green supply chain management may be used in some cases to
refer to of bio based or recycled materials or nontoxic chemicals, buying of goods and
services with specific characteristics like energy or water efficacy (Russel, 2012).
According to Nagel (2010), it incorporates the health of humans and concerns regarding
the environment and into the search for services of excellence and products at cutthroat
prices. It also means buying goods and services that have the lowest environmental
impacts. Green supply chain management practice the acquiring of products that take into
consideration the economic, social, and environmental impact that such acquisition has
on communities and people (Walker, 2009).
3
Challenges that face the application of green supply chain management include; the lack
of organizational change, poor regulatory and legal structures, and relatively high cost
and the resources required to apply green supply chain management are common in
manufacturing sectors (Blome, 2014).
1.1.2 Organizational Performance
The Business Dictionary (2014), performance of an organization is an inquiry of
company‟s goals and objectives in comparison to its performance. There are three
primary outcomes in corporate organizations, namely: shareholder value performance,
financial performance, production capacity performance and market performance. By
organizations measuring their performance, they are able to plan and forecasting demand
and supply, to counter competition, comply with regulations like NEMA environmental
laws, and international standards like the ISO 14000. Generally, organizational
performance can be classified under objective and subjective measures.
It is observed a major paradigm for planning that is green supply chain management has
emerged recently (Burke, 2009). A lot of research has been done in management of
operations in the internal organizational and performance measurement (Gunasekaranet,
2004).
1.1.3 Green Supply Chain Management and Organizational Performance
The aim of green supply chain management is to minimize the negative effects of
purchasing on health of individuals and the environment. By using life-cycle costing and
using the techniques and methodologies, green supply chain management is a tool for
economic rationalization. Green supply chain management may have an effect on the
market of green goods, by generating demand for innovative products and services it can

4
be a driver of innovation as well (Testa, 2012). On the long run the demand reduces
prices and the positive changes towards green economy can be generated (Lin, 2011).
The environmental performance of the purchasing organization and other suppliers‟
environmental performance may be improved with green supply chain management.
Green supply chain management implementation can result in positive changes within an
organization since it gives a chance for procurement development projects hence can
greatly impact the performance of an organization.
1.1.4 Food and Beverage Industry in Kenya
Food processing consists of multiple value chains beginning with agricultural production
and reaching into domestic, regional, and global markets. Beverage or drink processing
firms are concerned with products ranging from drinking bottle alcohol, non-alcoholic
drinks, bottled water, fruit or vegetable juices and soft drinks (carbonated drinks).Apart
from forming part of the culture of the society, drinks also fulfill a basic need. In
published statistics food processing is grouped with beverages and tobacco, and the
combined total in 2008 was Kshs 58.6 billion, or about 2.8% of GDP (Pfitzer, 2008).
Due to the large dependence of the Kenyan economy on agriculture for its manufacturing
sector, the food and beverage industry is a very vital industry in Kenya. Agricultural
products that have value being added and foods that are processed whose preparation is
quick and simple have demand created by the above together with the influx of people in
urban areas. The firms have been driven by this demand into vigorous struggle for
sustainable competitive advantage. Work is being done by many food and beverage
industries to improve their environmental performance and goods and a logical extension
of this work has been green supply chain management. The organizations have adopted
green supply chain management practices like public buyers for various goods such as

5
paints, paper used in the office, cleaners and renewable energy. Green supply chain
management practices that encompass a large range of goods, services and issues of the
environment have also been developed by a few others (Odhiambo, 2008). These efforts
become better known as the business grows, green supply chain management is industry
advancing (Lucas, 2007).
Food and beverage industry in Kenya is a basic productive sectors singled out for
development and expansion of the economy thus it has enormous possibilities for
creation of employment, reducing or eradicating poverty and creation of wealth. The
sector continues to positively contribute towards accomplishment of Millennium
Development Goals in the intermediate and far reaching term especially the aim of goal
eradicating hunger and extreme poverty and the goal of Development and Global
Partnership. The largest component of the Kenyan manufacturing sector remains to be
sector that processes food which is food, beverages and tobacco
So as to supply the domestic and neighboring markets, operations in Nairobi have been
established by major multinationals either as companies that are foreign owned or
Kenyan shareholding that are joint ventures. An example is Guinness PLC partners with
East African Breweries Ltd and Diageo Group to make and supply bottled beer to the
South and East Africa markets. The same high standards of products well known around
the world are produced by this company. There are other companies such as Coca cola,
Del Monte, Kurusu food products etc. that are engaged in beverage production (Okello,
2010).
The application of green supply chain management practice has a number of challenges
that food and beverage industry need to overcome in order to green their organizations.

6
Some of these challenges are inadequate appropriate technology, the arrangement
between green requirement and lean practices; sustainable program implementation,
standards, and communications planning (Schluter, 2012). Lack of sustainable energy
consumption, management of solid and liquid wastes, and compliance with
environmental regulations are some of other challenges encountered.
1.2 Research Problem
According to Buchalcevova and Gala (2012), more serious involvement in designing
and implementing green supply chain management is done by procuring organizations
and other supply chain partners focusing on aspects which can be included in the
activities of procuring such as issues of the environment and other aspects of the pillars
of development that are sustainable. According to Archie and Kevin (2014), due to the
intricacy, turmoil and changes that are expeditious, More deliberation to their
environment is being paid by organizations and hence forming and applying practices and
strategies that will boost their continuity and expansion (Hsu & Hu, 2008). Companies
have started considering issues of the environment from a competitive view point due to
the need to revamp efficiency in the organization, waste reduction.
Over half of the Kenya‟s exports are made of food and beverages comprising of more
than a thousand businesses. Sectors that produce including meat and dairy products, fruits
and vegetable processing, edible fats, grain milling, oils, beverages and fish processing
comprise this sector. Green supply chain management practice implementation has
challenges which are needed to be overcome by the food and beverage industry in order
to green their organizations. Some of these challenges are inadequate appropriate
technology to sustain companies and their endeavor to go green and processes in the
business needed to capture the correct data in the supply chain, sustainability program
7
application which is sustainable, awareness, standards, communications planning and
development of business case (Schulte, 2012).
A number of studies relating to green supply chain management have been conducted.
For example; Vashta (2012), studied responsiveness of green supply chain management
in the food and beverages manufacturing firms in Nairobi, Kenya. The study found out
the gains faced by organizations that applied green supply chain management was
development in systems of information; usage of materials that are recycled is
encouraged and the experience of firms, cost reductions because of proper utilization of
available productive resources. Mwaura (2016) did a research on green distribution
practices and competitiveness of food manufacturing firms in Kenya. The research
findings indicated that, technology has greatly influenced distribution techniques with
more firms using the internet as a distribution channel. Support for green distribution
practices is an indicator that firm managers are willing to embrace this form of
distribution by taking control of their own distribution patterns.
Nyakundi (2013) did a study on food processing firm‟s adoption of green manufacturing
practices by in Mombasa County, Kenya. The results obtained indicated that green
manufacturing practices adoption was at implementation stage as most food processing
had considered adoption. The study also established that the major perceived benefits of
adopting green manufacturing were; reduction of waste water, reduction of frequency of
environmental accidents and reduction in scrap rate. Gatari and Were (2014), did a study
on application challenges of green supply chain management in manufacturing sector in
Kenya: Unga Limited Kenya, case study. The results showed that, there was inadequate
change in the organization and its structures to support implementation of green supply
chain management.
8
Research done with Hussein and Shale (2014), in manufacturing sector in Kenya on
effects of procurement practices that are sustainable on performance of organization
found that re-usability of products, ethical practices ,Social Corporate Responsibility, and
supplier involvement contribute to green supply chain management on these firms. With
all this studies it implies that little research has been done of the real impact of green
supply chain practice of the overall organization performance. With these knowledge
gaps this study therefore tends to examine effect of green supply chain management on
performance of the organization of food and beverage manufacturing industry in Kenya.
1.3 Objective of the Study
i. Extent to which the manufacturing industry in Kenya for food and beverage has
adopted green supply chain management.
ii. Challenges faced by manufacturing industry in Kenya of food and beverage by
practicing green supply chain management practices.
iii. To determine association between green supply chain management on
organizational performance of food and beverage manufacturing industry in
Kenya.
1.4 Value of the Study
The findings of this research will enable food and beverage industry in Kenya to get a
clear picture of the benefits that accrue to organizations that have embraced the concept
of green supply chain management practices. This will motivate the organizations to give
serious attention to this idea. This study also will aid beverage and food manufacturing
companies to better comprehend the challenges they may meet in the course of
implementing the green supply chain management concept. Also, manufacturers in the
food and beverage industry can make use of knowledge to implement effective eco-

9
friendly practices and performances that will enhance their competitive advantage and
improve their profitability.
This study is also important to the Government of Kenya through the National
Environmental Management Authority in the making of policies and regulations ruling
the environmental friendly operations in Kenyan industries for a healthy environment.
Further, the research will contribute positively to the body of knowledge by providing
policy effects for the government of Kenya in supporting green supply chain management
practices among different industries. Through the findings of this study, the policy
makers may be in a position to know what needs to be done to improve green supply
chain management practices in the manufacturing industry.
To the scholar, the study will build up to the current information of green supply chain
management practices and performance field. It will also refine and extend the present
study especially in Kenya. The study findings will be of great use to academicians and
researchers as they will add to the information build up in the area of green supply chain
management.
10
CHAPTER TWO
LITERATURE REVIEW
2.1 Introduction
This part shows an analysis of the linked information as brought out by various
researchers, authors, scholars and analysts on the effect of green supply chain
management on organizational performance. The chapter also provides the theories
underpinning the study.
2.2 Theoretical Foundation
The various theories that will inform the research on the consequence of green supply
chain management on performance of the organization are examined by this section. The
study is guided by the following theories; stakeholder theory, resource dependence theory
and the theory of technology diffusion.
2.2.1 Stakeholder Theory
Freeman (1994) stakeholders are described as any person who has an influence the
accomplishment of the organizations aims. Stakeholder theory has been presented both as
within that of business ethics and within the framework of organization theories.
Stepping beyond the neo classical theory where the company‟s goal is profit
maximization and benefiting the shareholders only.
The theory is important to the study because green supply chain management practices
strongly depend on the participation of their shareholders, customers, suppliers, and
employees. Consumer awareness has led to the demand of industry improvement on their
environmental performance. Also due to the emergence of green products, consumers are
willing to pay premium prices has increased. Consumers can reject the products of
11
companies with poor environmental management reputation. Similarly suppliers may
stop delivering inputs to protect their own reputation.
2.2.2 Resource Dependence Theory
Salancik and Pfeffer in 1978 have postulated theory of resource dependence in their
publication, organizations external control. It basically argues that constraints and effects
to organizations by their environments. Resource Dependence Theory (RDT)
fundamentally assumes that the organizations behavior and those decisions of the
organization and actions are influenced by reliance and useful resources.
Theory of resource dependence firms rely on assets given by others in order to nourish
their expansion as well as other firms who are dependent (Pfeffer & Salancik, 1978). The
presumption of this theory is the firm cannot be independent with regard to resources for
survivors. Hence resources must be depended on from exterior parties to manage and
challenge this dependence with other organizations for long term development (Davis,
2010). With unity between partners and resource sharing beneficial for environmental
improvement (Boyd, 2009).
Relationship between organizations is critical for managing green manufacturing to
achieve good results, where resource sharing and partner coordination are beneficial for
environmental improvements the theory is applicable to this study. The argument for the
dissemination of practices in environment through the supply chain is presented by the
power of the development aspects of resource dependence. It has been found that the
larger firm needed sound practices in the environment to adopt by smaller organizations
given their power over smaller firms (Hillman, 2009).
12
2.2.3 Theory of Technology Diffusion
Technological progress was described by Josef Schumpeter as containing of several
stages: “invention” – the number one being application of the technical knowhow of an
idea; “innovation” – the next being a new product being business introduction of an idea
and “diffusion” – the passive use of a new method of doing things by several individuals
(Schumpeter, 1962). Thus the benefits of a new technology are vastly enjoyed through
the diffusion process
The economics of technology diffusion tries to critically analyze the factors that affect its
progress while exploring the reasons why diffusion is not instantaneous. Technology
diffusion theory encourages organizations to be specific and to adopt environmental
friendly technologies that protect the environment.
The theory is applicable to this study since green production is rapidly growing in
importance which requires green technology adoption. Emerging economies expand as
populations grow and the resources in the world are going through numerous challenges.
In supply chain management, the green technology adoption plays a key role in
companies‟ systems of production which provide the growing requirement for goods, are
linked to adverse environment impacts.
2.3 Green Supply Chain Management
The choosing of goods and services that reduce environmental impacts is
environmentally responsible or 'green' procurement. At all the various stages of its life
process a firm is required to do an examination of the effects of a product on the
environment (Blome, 2014).

13
The commitment of a firm to contemplate and reduce the environmental results of its
actions is demonstrated by practicing green supply chain management demonstrates. It
therefore makes both monetary and environmental sense (2012, Sterner). Limited natural
resources are consumed or used in a sustainable manner in producing green like
sustainable forestry.
The classification of green supply chain management is a necessary first step in the
process of discussing them. Shrivastava (1995) proposed classifying green supply chain
management practices into five topics based on their management general inclination:
environment. Most studies support a more straightforward typology for characterizing
green supply chain management as belonging to categories such as reverse logistics,
green technology adoption, green supplier assessment and corporate social responsibility.
2.3.1 Reverse logistics
This deals with issues such as reclaiming, reconditioning or discarding to utilize
resources. The practice of reverse logistics is one in which a producer consistently
accepts products that have been formerly shipped from the utilization point for possible
disposal, remanufacturing or recycling, (Fleischmann 2009). Reverse logistics embodies
logistics including: rehabilitate, source reduction, returning products, disposal of waste,
reuse of material, material distribution, mending and remanufacturing according to
reverse logistics by Rogers (2007).
Pishvaee, and more (2009) states that “most of the logistics networks are not equipped to
handle the return products in reverse channels.”
14
2.3.2 Green Technology Adoption
Green technology is a term mostly used alternatively to clean technology. Other terms
like as “mitigation and adaptation technologies,” and “environmental technologies,”
“climate related technologies,” or deviations thereof. (Feder, 2013). Sustainability is
promoted using green technology while greenhouse gas emissions are reduced, or help in
the climate change solution. A variety of products and systems can be included in green
technology. “Environmentally Sound Technologies” was developed by the International
Patent Classification Committee. The following general categories of such technologies
are included in the Green Inventory: alternative energy production, agriculture/forestry,
energy nuclear power generation, transportation, conservation, waste management, and
administrative, regulatory or design aspects (Gollin, 2011).
Green technology which facilitates clean and renewable energy is the most significant.
Burning of fossil fuels is the core giver to the release of man-made carbon dioxide. Due
to combustion of gas, coal and oil eighty percent of such CO2 arises (Sunding, 2012). It
should also be noted these resources that cannot be renewed are evaluated to last only
sixty years besides emissions of carbon arising from the use of energy sources.
Combustion of fossil fuels as energy alternatives require to be taken accordingly.
Consumption technologies and manufacture is an expansive area of covered by green
technology. Involved in the choosing and utilization of green technologies is the
utilization of technologies of environment for assessing and overseeing, remediation and
restoration and pollution prevention and control (Adesina, 2011). This minimization can
be in consumption such as efficient appliances or hybrid cars or in production like SO2
windmills or scrubbers.
15
2.3.3 Green Supplier Assessment
Screening of suppliers on the basis of their performance of the environment and
conducting business with only those that achieve certain standards of the
environment or is what green supply chain management is understood to comprise.
A “green” efficiency between suppliers that has an intrinsic value and is in high favor of
companies has been there in the recent years. Current aspects are taken into account to be
more precious and also the ancient selection criteria such as lead time, flexibility, costs
and quality (Handfield, 2012). Disappearing in nature rapidly without having any damage
is its main characteristic.
The existence of differentiated management of supplier approaches in GSC projects is
recognized by the information of supplier management in green supplier change (Green,
2010).
2.2.4 Corporate Social Responsibility
The core “responsibility” historically for companies has been money making and
increasing value of the shareholder within the business world (Navi, 2012). Company
monetary responsibility has been the bottom line driving force this new driving force is
referred to as corporate social responsibility. Corporate social responsibility is sometimes
defined as the company “triple bottom line” the inclusivity of the company‟s financial,
environmental and social performance in conducting its business (Crane, 2007).
2.5 Empirical Literature
Kipkorir (2015) did a study on factors influencing implementation of green supply chain
management in multinational tea companies in Kericho County. As a survey for the study
three multinational companies were used. Employees from the department of stores and
16
procurement were targeted by the study in all the three companies. The total number of
staff working in the procurement department a census of 35 employees from the three
companies was used. Financial support is the most constraint that affects the
implementation of green supply chain management as revealed by the study.
Nderitu (2014) did a case study of East African breweries limited on the effects of green
supply chain management practices on an organization performance in manufacturing
industry. The sample size was 37 which stood for 30% of the target population, the
findings showed that results of the manufacturing industry were an input many factors.
Performance excellence is contributed to by green supply chain management attributes.
Makkonen (2014), studied on the role of company‟s sustainable procurement practices in
conscious consumer buying behavior. Conducting primary and secondary research
composed the empirical part. The research method was a customer survey, and the
approach of primary research was quantitative. All customers of Ekotin were targeted by
the questionnaire. Customers required environmentally friendly products, organic
products and no toxic chemicals as indicated by the findings.
Nyakundi (2013) did a study on adoption of green manufacturing practices by food
processing firms in Mombasa County, Kenya. A series of food processing firms in
Mombasa County listed by Kenya Association of Manufacturers (KAM) were targeted. A
sample of 66 firms was taken. The results obtained indicated that green manufacturing
practices adoption was at implementation stage as most food processing had considered
adoption. The study also established that the major perceived benefits of adopting green
manufacturing were; reduction of waste water, reduction of frequency of environmental
accidents and reduction in scrap rate.
17
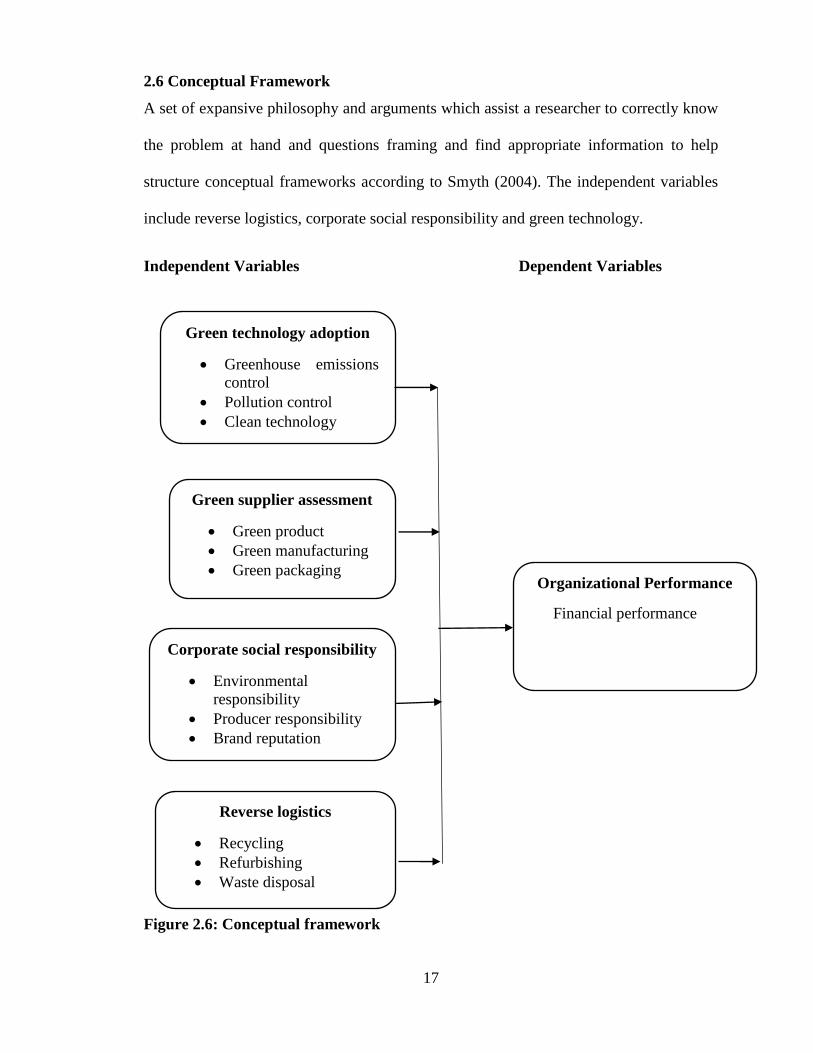
2.6 Conceptual Framework
A set of expansive philosophy and arguments which assist a researcher to correctly know
the problem at hand and questions framing and find appropriate information to help
structure conceptual frameworks according to Smyth (2004). The independent variables
include reverse logistics, corporate social responsibility and green technology.
Independent Variables Dependent Variables
Figure 2.6: Conceptual framework
Reverse logistics
Recycling
Refurbishing
Waste disposal
Green technology adoption
Greenhouse emissions
control
Pollution control
Clean technology
Green supplier assessment
Green product
Green manufacturing
Green packaging
Corporate social responsibility
Environmental
responsibility
Producer responsibility
Brand reputation
Organizational Performance
Financial performance
18
CHAPTER THREE
RESEARCH METHODOLOGY
3.1Introduction
This chapter gives an analysis of the outline of the methods used in this research It
centers on data collection methods, research design and concludes with data analysis and
methods of data presentation that were used in this study.
3.2 Research Design
The research used the descriptive survey research design. Descriptive survey research
design allows researchers to collect, shorten and analyse information with the aim of
interpretation (Orodho, 2002). It also enables the researcher to show the features of the
variables of interest due to its suitability in data collection to give feedback on the
research questions, Mugenda and Mugenda (2003). Thus there is justification for
descriptive design being most fit and justifiably used in the study.
3.3 Population of the Study
The research was a census targeting the big beverage and food firms that manufacture in
Nairobi, Kenya. The food and beverage manufacturing firms in Nairobi Kenya are forty
six (46) showed in the attached appendix (KAM, 2013).
3.4 Data Collection
The data that is primary was collected using semi-structured questionnaire.
The questionnaire targets procurement managers and quality assurance managers from
the food and beverage manufacturing firms in Nairobi, Kenya. The questionnaires were
emailed, drop and pick later method to to all respondents. The questionnaires were
broken down to four sections:
19
Section demographic information, Section B - adoption of green supply chain
management, Section C- challenges of green supply chain management and Section D-
green supply chain management and organizational performance.
3.5 Data analysis
The filled questionnaires were tested for completeness, reliability and validity and were
then subjected to analysis.
So as to evaluate and discern the relationships between the dependent and independent
variables of the study regression analysis was performed. Linear regression and multiple
regressions are the two key classes of regression. One independent variable is used linear
regression uses to foretell the solution of Y, whilst two or more independent variables use
multiple regressions to foretell the solution.
The common form of regression is:
Linear Regression: Y = β0 + βX + ɛ (1)
Multiple Regression: Y = β0 + β1X1 + β2X2 + β3X3+ β4X4 + ɛ
Where;
Y = Organizational Performance – (measured by financial performance, production
capacity and market performance)
X1 = Reverse logistics – (measured by recycling, refurbishing and waste disposal)
X2 = Green technology adoption – (measured by pollution control, clean technology and
greenhouse emissions control)
X3 = Green supplier assessment – (measured by green product, green manufacturing and
green packaging)

20
X4 = Corporate social responsibility - (measured by environmental responsibility,
producer responsibility and brand reputation)
Constant Term …………………………. β0
Β 1, β 2 , β3, β4 = Beta coefficients;
Error Term………………….. Ɛ

21
CHAPTER FOUR
DATA ANALYSIS, PRESENTATION AND INTERPRETATION
4.1 Introduction
This discussion in this part is the explanation and showing of field findings. The chapter
shows the information on the background of the interviewees, analysis of the findings on
the basis on the aims of the study.
4.1.1 Response Rate
The study focused on a size of the sample of 92 interviewees whilst 74 completed and
presented the questionnaires giving a rate of response of 80.43%. This rate of response
was adequate to conclude that the research the way it is, acted as a representation.
Mugenda and Mugenda (2003), a rate of response of fifty percent is enough for analysis
and reporting.
4.2 Demographic Information
This sub-section critically analyses on respondent‟s information in the background;
mainly it includes gender distribution, age distribution, education level, respondent‟s
position, period worked with the firm, period of operation, number of employees and
ownership of the firm.
4.2.1 Gender Distribution
The research needed to find how the respondents were distributed according to gender.
After the state analysis was done the results are shown in table 4.2.1
22
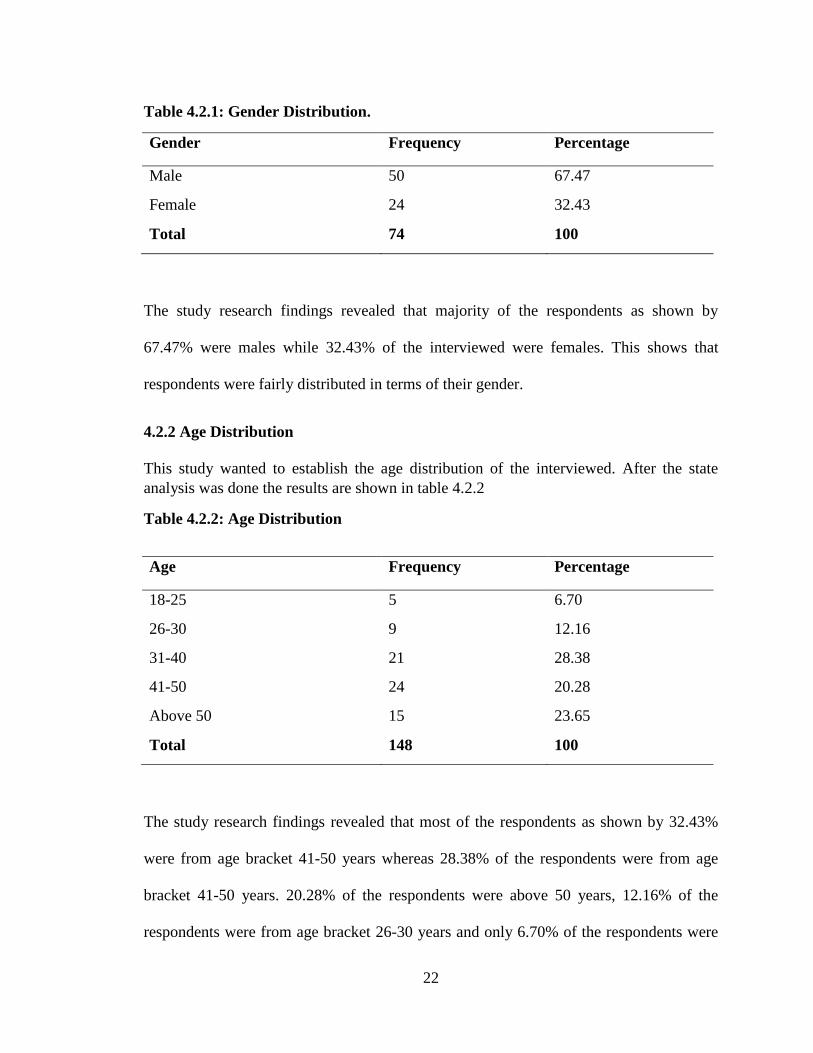
Table 4.2.1: Gender Distribution.
Gender Frequency Percentage
Male 50 67.47
Female 24 32.43
Total 74 100
The study research findings revealed that majority of the respondents as shown by
67.47% were males while 32.43% of the interviewed were females. This shows that
respondents were fairly distributed in terms of their gender.
4.2.2 Age Distribution
This study wanted to establish the age distribution of the interviewed. After the state
analysis was done the results are shown in table 4.2.2
Table 4.2.2: Age Distribution
Age Frequency Percentage
18-25 5 6.70
26-30 9 12.16
31-40 21 28.38
41-50 24 20.28
Above 50 15 23.65
Total 148 100
The study research findings revealed that most of the respondents as shown by 32.43%
were from age bracket 41-50 years whereas 28.38% of the respondents were from age
bracket 41-50 years. 20.28% of the respondents were above 50 years, 12.16% of the
respondents were from age bracket 26-30 years and only 6.70% of the respondents were
23
from age bracket 18-25 years . Thus this shows that interviewees were fairly distributed
in accordance with their age.
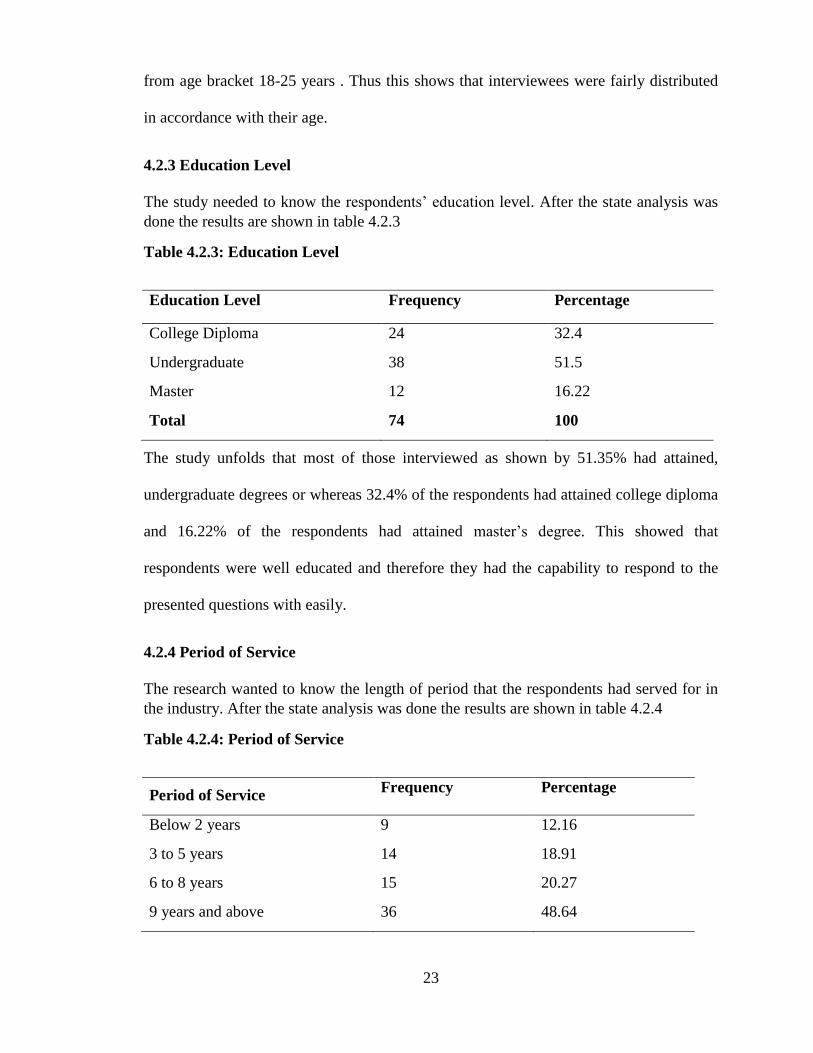
4.2.3 Education Level
The study needed to know the respondents‟ education level. After the state analysis was
done the results are shown in table 4.2.3
Table 4.2.3: Education Level
Education Level Frequency Percentage
College Diploma 24 32.4
Undergraduate 38 51.5
Master 12 16.22
Total 74 100
The study unfolds that most of those interviewed as shown by 51.35% had attained,
undergraduate degrees or whereas 32.4% of the respondents had attained college diploma
and 16.22% of the respondents had attained master‟s degree. This showed that
respondents were well educated and therefore they had the capability to respond to the
presented questions with easily.
4.2.4 Period of Service
The research wanted to know the length of period that the respondents had served for in
the industry. After the state analysis was done the results are shown in table 4.2.4
Table 4.2.4: Period of Service
Period of Service Frequency Percentage
Below 2 years 9 12.16
3 to 5 years 14 18.91
6 to 8 years 15 20.27
9 years and above 36 48.64
24
Total 74 100
The study research findings, revealed that most of the respondents as illustrated by
48.64% had served the industry for more than 9 years whereas 20.27% of the respondents
had worked in the industry for a duration of 6 to 8 years, 18.91% had served the industry
for 3 to 5 years and only 12.16% of the interviewees had worked in the industry for less
than 2years. Therefore this shows that majority of the interviewees had worked in the
industry for a substantial time and therefore had the capability to give valid information
regarding this research
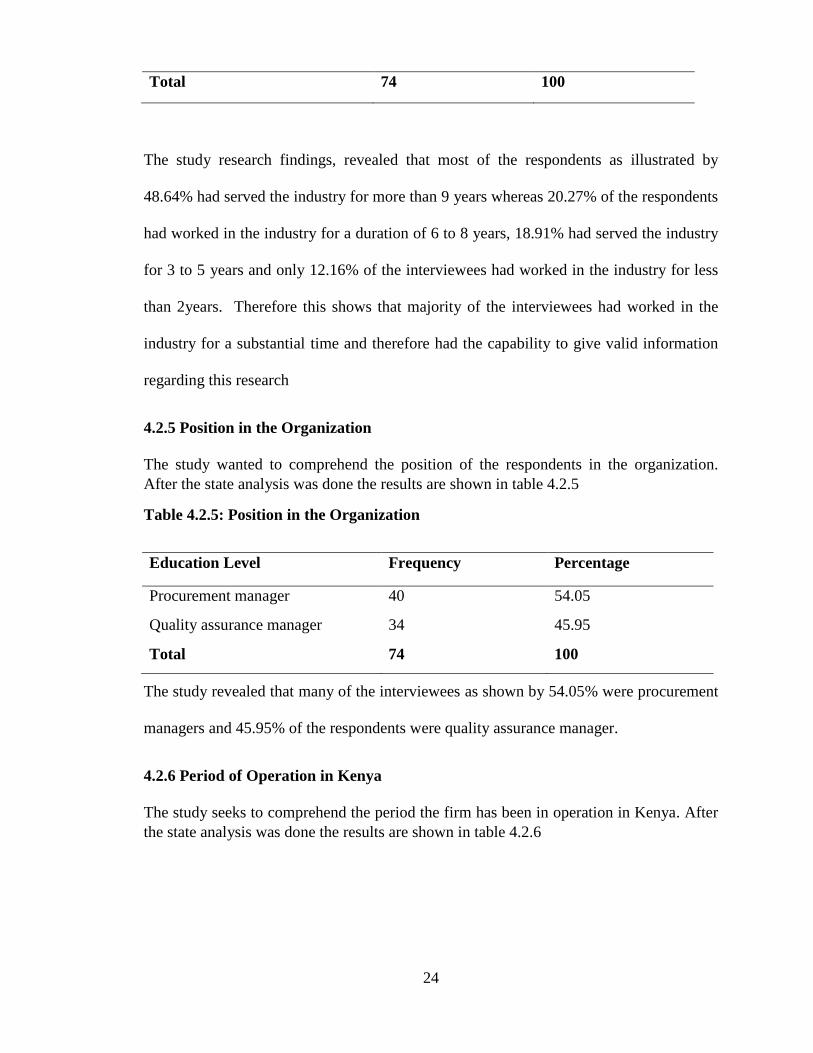
4.2.5 Position in the Organization
The study wanted to comprehend the position of the respondents in the organization.
After the state analysis was done the results are shown in table 4.2.5
Table 4.2.5: Position in the Organization
Education Level Frequency Percentage
Procurement manager 40 54.05
Quality assurance manager 34 45.95
Total 74 100
The study revealed that many of the interviewees as shown by 54.05% were procurement
managers and 45.95% of the respondents were quality assurance manager.
4.2.6 Period of Operation in Kenya
The study seeks to comprehend the period the firm has been in operation in Kenya. After
the state analysis was done the results are shown in table 4.2.6
25
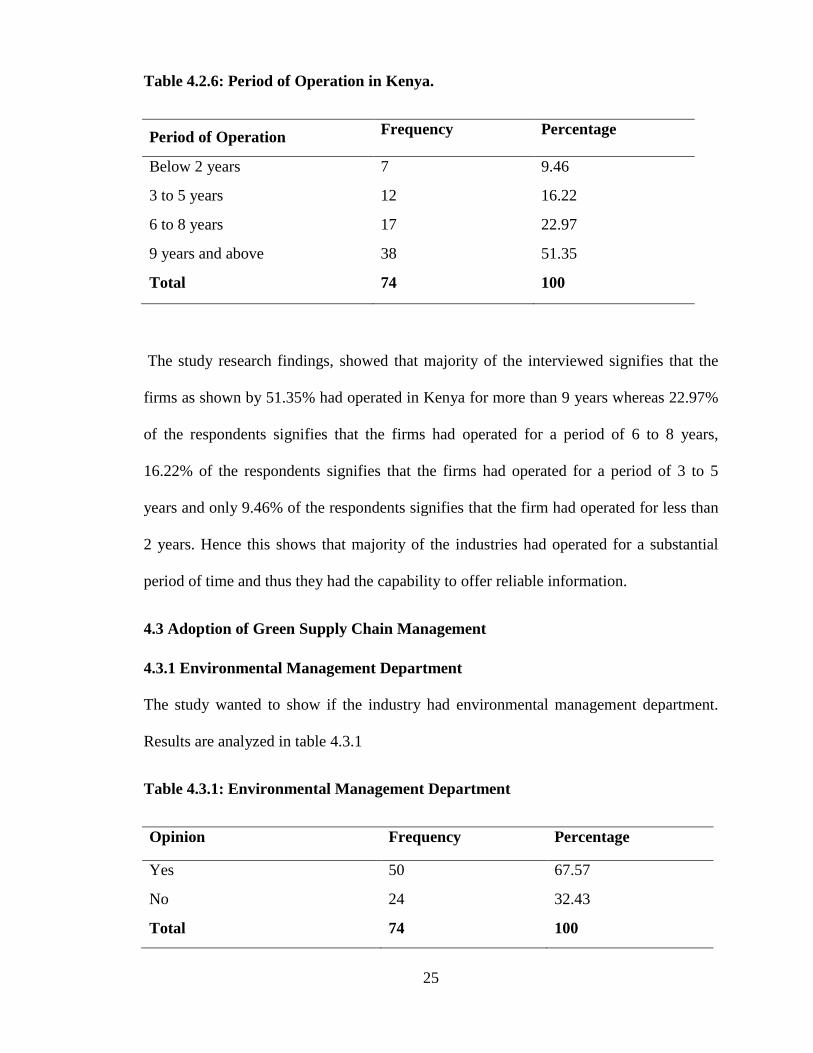
Table 4.2.6: Period of Operation in Kenya.
Period of Operation Frequency Percentage
Below 2 years 7 9.46
3 to 5 years 12 16.22
6 to 8 years 17 22.97
9 years and above 38 51.35
Total 74 100
The study research findings, showed that majority of the interviewed signifies that the
firms as shown by 51.35% had operated in Kenya for more than 9 years whereas 22.97%
of the respondents signifies that the firms had operated for a period of 6 to 8 years,
16.22% of the respondents signifies that the firms had operated for a period of 3 to 5
years and only 9.46% of the respondents signifies that the firm had operated for less than
2 years. Hence this shows that majority of the industries had operated for a substantial
period of time and thus they had the capability to offer reliable information.
4.3 Adoption of Green Supply Chain Management
4.3.1 Environmental Management Department
The study wanted to show if the industry had environmental management department.
Results are analyzed in table 4.3.1
Table 4.3.1: Environmental Management Department
Opinion Frequency Percentage
Yes 50 67.57
No 24 32.43
Total 74 100

26
The results illustrate that most of the respondents as shown by 67.57% agreed that the
food and beverage manufacturing industry in Kenya had environmental management
department, whereas 32.43% were of the contrary opinion. This implies that
environmental management department has an impact on food and beverage
manufacturing industry in Kenya. This indicates that industries ensure necessary changes
are conducted; environmental problems are identified and resolved.
4.3.2 Environmental Management Policy
The study sought to establish whether the industry had environmental management
policy. Findings are analyzed in table 4.3.2
Table 4. 3.2: Environmental Management Policy
Opinion Frequency Percentage
Yes 52 70.27
No 22 29.72
Total 74 100
The results show that most of the respondents as shown by 70.27% agreed that the food
and beverage manufacturing industry in Kenya had environmental management policy,
whereas 29.72% were of the contrary opinion. This implies that environmental
management policy has an impact on food and beverage manufacturing industry in
Kenya.
27
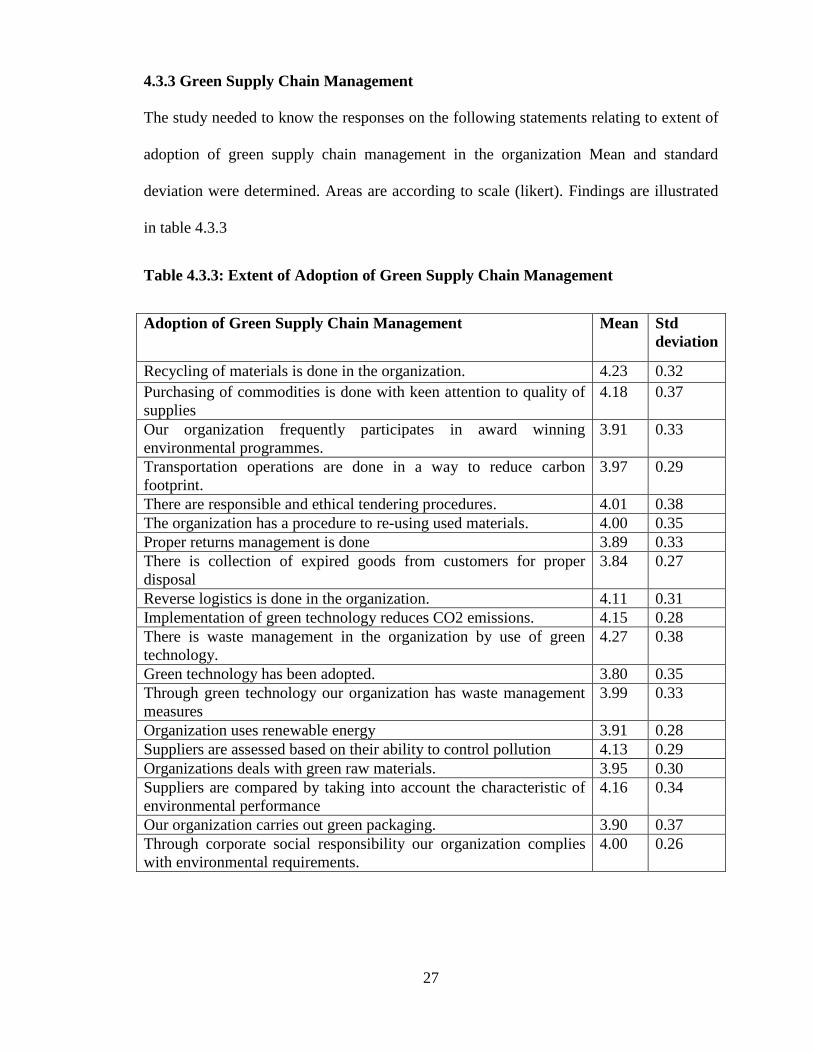
4.3.3 Green Supply Chain Management
The study needed to know the responses on the following statements relating to extent of
adoption of green supply chain management in the organization Mean and standard
deviation were determined. Areas are according to scale (likert). Findings are illustrated
in table 4.3.3
Table 4.3.3: Extent of Adoption of Green Supply Chain Management
Adoption of Green Supply Chain Management Mean Std
deviation
Recycling of materials is done in the organization. 4.23 0.32
Purchasing of commodities is done with keen attention to quality of
supplies
4.18 0.37
Our organization frequently participates in award winning
environmental programmes.
3.91 0.33
Transportation operations are done in a way to reduce carbon
footprint.
3.97 0.29
There are responsible and ethical tendering procedures. 4.01 0.38
The organization has a procedure to re-using used materials. 4.00 0.35
Proper returns management is done 3.89 0.33
There is collection of expired goods from customers for proper
disposal
3.84 0.27
Reverse logistics is done in the organization. 4.11 0.31
Implementation of green technology reduces CO2 emissions. 4.15 0.28
There is waste management in the organization by use of green
technology.
4.27 0.38
Green technology has been adopted. 3.80 0.35
Through green technology our organization has waste management
measures
3.99 0.33
Organization uses renewable energy 3.91 0.28
Suppliers are assessed based on their ability to control pollution 4.13 0.29
Organizations deals with green raw materials. 3.95 0.30
Suppliers are compared by taking into account the characteristic of
environmental performance
4.16 0.34
Our organization carries out green packaging. 3.90 0.37
Through corporate social responsibility our organization complies
with environmental requirements.
4.00 0.26
28
From the research results most of the respondents agreed that; recycling of materials is
done in the organization (M=4.23, SD =0.32), purchasing of commodities is done with
keen attention to quality of supplies (M=4.18, SD =0.37), the organization frequently
participates in award winning environmental programmes (M=3.91, SD =0.33),
transportation operations are done in a way to reduce carbon footprint (M=3.97, SD
=0.29), there is responsible and ethical tendering procedures (M=4.01, SD =0.38).
The study findings concur with Handfield (2012), expertise between dealers and
suppliers, which have an intrinsic value and have high standing in companies view.
Green product is not a usually applied agent. Green packaging is a packaging method that
wants to protect the environment with friendly material.
The study established that the organization has a procedure to re-using used materials
(M=4.00, SD =0.35),proper returns management is done (M=3.89, SD =0.33),there is
collection of expired goods from customers for proper disposal (M=3.84, SD
=0.27),reverse logistics is done in the organization (M=4.11, SD =0.31),implementation
of green technology reduces CO2 emissions (M=4.15, SD =0.28),there is waste
management in the organization by use of green technology (M=4.27, SD =0.38),green
technology has been adopted (M=3.80, SD =0.35),through green technology our
organization has waste management measures (M=3.99, SD =0.33),organization uses
renewable energy (M=3.91, SD =0.28),suppliers are assessed based on their ability to
control pollution (M=4.13, SD =0.29). The findings confirm Sunding, (2012), argument
that the important green technology is one which upholds renewable and clean energy.
The largest share of sources of greenhouse emissions of gas globally is made up by
energy supply. 80% of such CO2 comes up as a result of burning coal, gas and oil.

29
The study further revealed that the organization does business only with businesses that
meet environmental expectations and standards (M=4.20, SD =0.36),organizations deals
with green raw materials (M=3.95, SD =0.30),suppliers are compared by considering the
characteristic of performance of environment (M=4.16, SD =0.34),our organization
carries out green packaging (M=3.90, SD =0.37),through corporate social responsibility
our organization comply with environmental requirements (M=4.00, SD =0.26). The
findings are in line with Feder (2013), green technology is used to promote reduction of
greenhouse gas emissions and being sustainable.
4.4 Challenges of Green Supply Chain Management
The study seeks to know the challenges faced by the organizations in adoption of green
supply chain management on each of the following. Mean and standard deviation were
determined. Areas are according to scale (likert). Results are shown in table 4.4
Table 4.4: Challenges of Green Supply Chain Management
Challenges of Green Supply Chain Management Mean Std
deviation
Adoption of green practices is costly thus becomes an impediment. 4.51 0.21
Lack of green supply chain management knowledge hinders
adoption.
4.03 0.17
The organization has not implemented structural and organization
changes to support green Supply chain management
4.41 0.26
There is lack of management support in the organization. 4.12 0.22
Business processes and inappropriate technology and needed affects
adoption.
4.33 0.21
Perception that green products cost more hence affecting demand. 3.96 0.19
Lack of understanding of the concept 4.22 0.25
There is conflict with authority due to waste management issues. 4.00 0.30
Organization has lost business due to environmental requirements 4.16 0.28
Lack of technical expertise by regulators who impose it 4.31 0.20
Existence of other techniques or initiatives 4.08 0.27
Miscommunication between environmental professionals and
business leads to conflicts
4.12 0.26

30
Lack of enforceable government policies and regulations 3.81 0.28
Lack of training of staff on the environmental practices 4.34 0.27
Lack of public awareness leading to low demand for organization
products.
4.09 0.17
Resistance to change by the organization employees. 3.86 0.19
Many of the respondents are in agreement that from the research findings; high cost has
been an impediment to adoption of green practices (M=4.51, SD =0.21),lack of green
supply chain management knowledge hinders adoption (M=4.03, SD =0.17),the
organization has not implemented structural and organization changes to support green
Supply chain management (M=4.41, SD =0.26),there is lack of management support in
the organization (M=4.12, SD =0.22), lack of business processes and appropriate
technology and needed affects adoption (M=4.33, SD =0.21), perception that green
products cost more hence affecting demand (M=3.96, SD =0.19), lack of understanding
of the concept (M=4.22, SD =0.25), there is conflict with authority due to waste
management issues (M=4.00, SD =0.30).The findings concur with Adesina (2011}. The
study established that the organization has lost business due to environmental
requirements (M=4.16, SD =0.28),lack of technical expertise by regulators who impose it
(M=4.31, SD =0.20),existence of other techniques or initiatives (M=4.08, SD =0.27),
miscommunication between environmental professionals and business managers
(M=4.12, SD =0.26),lack of enforceable government policies and regulations (M=3.81,
SD =0.28),lack of training of staff on the environmental practices (M=4.34, SD
=0.27),lack of public awareness leading to low demand for organization products
(M=4.09, SD =0.17), resistance to change by the organization employees (M=3.86, SD
=0.19). The findings are in line with Nagel (2010), that green supply chain management
is used to define to buying of services and products with unique characteristics example
31
like water or energy efficiency, or use of nontoxic chemicals, bio based or recycled
materials.. It includes environmental concerns health of humans and into the looking for
quality services and products at fair prices.
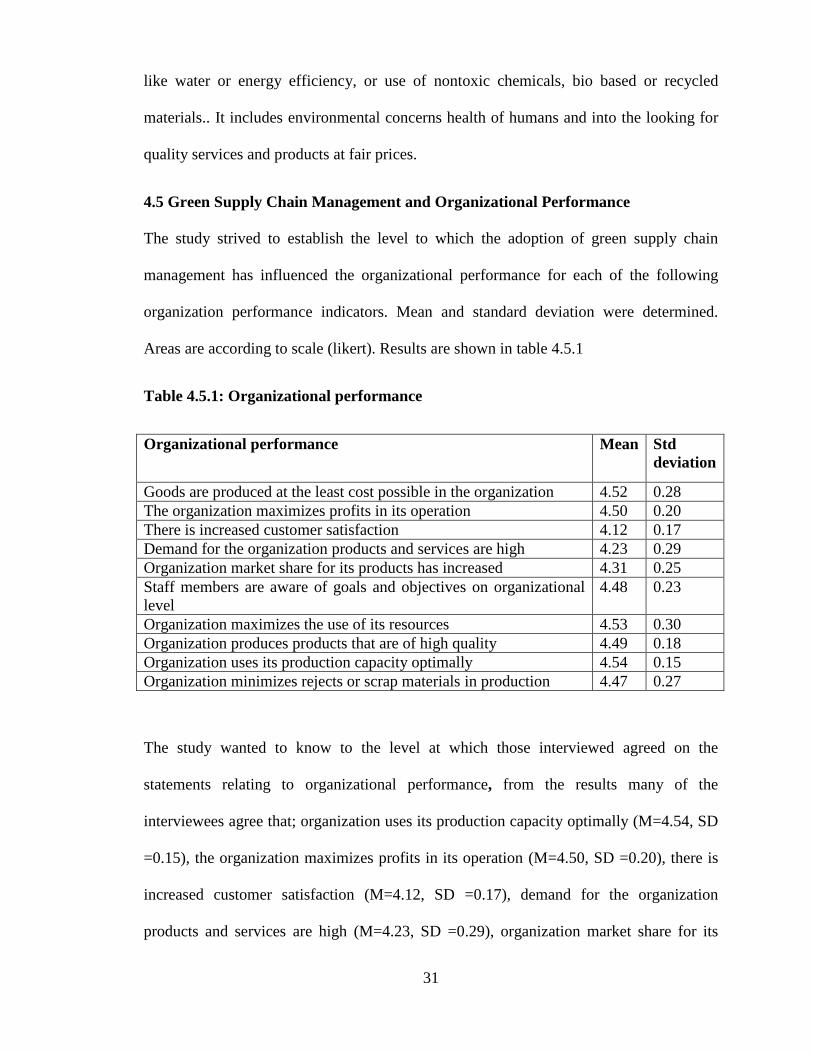
4.5 Green Supply Chain Management and Organizational Performance
The study strived to establish the level to which the adoption of green supply chain
management has influenced the organizational performance for each of the following
organization performance indicators. Mean and standard deviation were determined.
Areas are according to scale (likert). Results are shown in table 4.5.1
Table 4.5.1: Organizational performance
Organizational performance Mean Std
deviation
Goods are produced at the least cost possible in the organization 4.52 0.28
The organization maximizes profits in its operation 4.50 0.20
There is increased customer satisfaction 4.12 0.17
Demand for the organization products and services are high 4.23 0.29
Organization market share for its products has increased 4.31 0.25
Staff members are aware of goals and objectives on organizational
level
4.48 0.23
Organization maximizes the use of its resources 4.53 0.30
Organization produces products that are of high quality 4.49 0.18
Organization uses its production capacity optimally 4.54 0.15
Organization minimizes rejects or scrap materials in production 4.47 0.27
The study wanted to know to the level at which those interviewed agreed on the
statements relating to organizational performance, from the results many of the
interviewees agree that; organization uses its production capacity optimally (M=4.54, SD
=0.15), the organization maximizes profits in its operation (M=4.50, SD =0.20), there is
increased customer satisfaction (M=4.12, SD =0.17), demand for the organization
products and services are high (M=4.23, SD =0.29), organization market share for its
32
products has increased (M=4.31, SD =0.25). The findings are in line with Gunasekaran et
al., (2004), that a lot of research has been done on management of organizational internal
operations and measurement of performance.
The study established that staff members are aware of goals and objectives on
organizational level (M=4.48, SD =0.23), organization produces products that are of high
quality (M=4.49, SD =0.18), organization minimizes rejects or scrap materials in
production (M=4.47, SD =0.27), organization maximizes the use of its resources
(M=4.53, SD =0.30), goods are produced at the least cost possible in the organization
(M=4.52, SD =0.28).
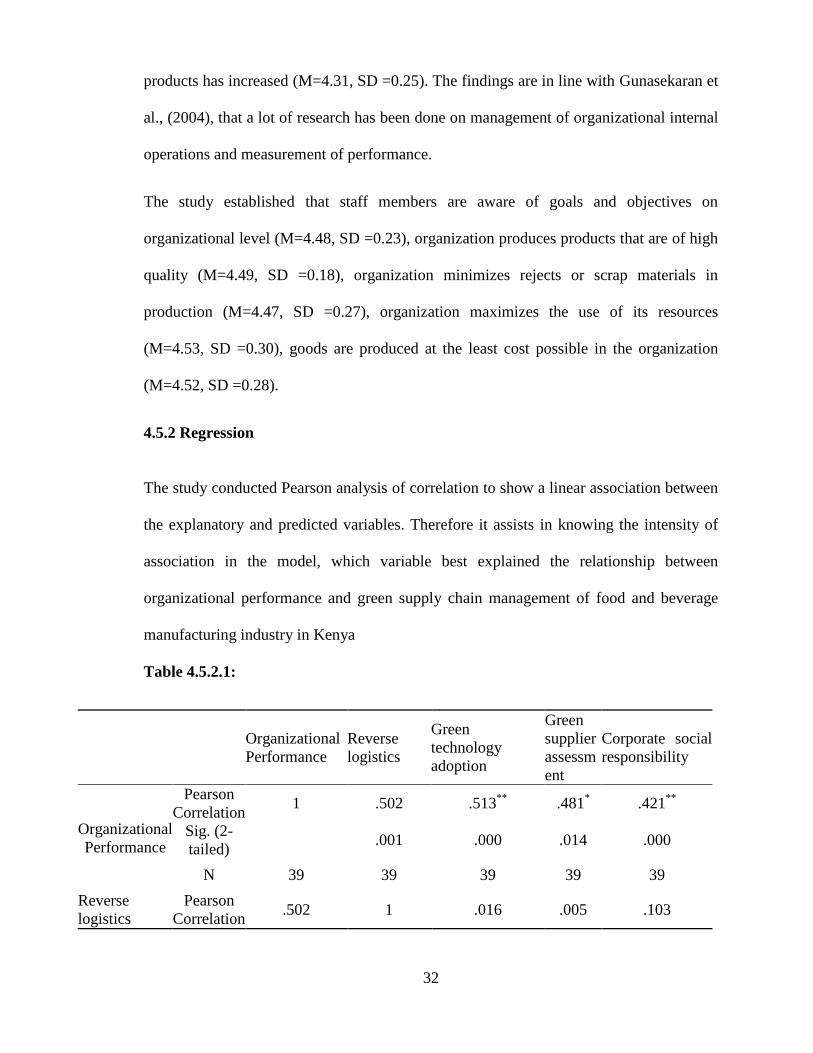
4.5.2 Regression
The study conducted Pearson analysis of correlation to show a linear association between
the explanatory and predicted variables. Therefore it assists in knowing the intensity of
association in the model, which variable best explained the relationship between
organizational performance and green supply chain management of food and beverage
manufacturing industry in Kenya
Table 4.5.2.1:
Organizational
Performance
Reverse
logistics
Green
technology
adoption
Green
supplier
assessm
ent
Corporate social
responsibility
Organizational
Performance
Pearson
Correlation 1 .502 .513
** .481
* .421
**
Sig. (2-
tailed) .001 .000 .014 .000
N 39 39 39 39 39
Reverse
logistics
Pearson
Correlation .502 1 .016 .005 .103

33
Sig. (2-
tailed) .001 .898 .965 .406
N 39 39 39 39 39
Green
technology
adoption
Pearson
Correlation .513
** .016 1 .746
** .021
Sig. (2-
tailed) .000 .898 .000 .863
N 39 39 39 39 39
Green supplier
assessment
Pearson
Correlation 481
* .005 .746
** 1 .052
Sig. (2-
tailed) .014 .965 .000 .676
N 39 39 39 39 39
Corporate
social
responsibility
Pearson
Correlation .421
** .103 .021 .052 1
Sig. (2-
tailed) .000 .406 .863 .676
N 39 39 39 39 39
The research found that there was positive correlation coefficient between Reverse
logistics and Organizational Performance, as demonstrated by 0.502 correlation factor
this relationship is strong and was found to be statistically significant as the significant
value was 0.001 which is less than 0.05, the study found that there was positive
correlation coefficient between green technology adoption and Organizational
Performance, as demonstrated by correlation factor of 0.513 this relationship is strong
and was shown to be statistically significant as the criticalt value was 0.000 which is less
than 0.05,
Discussion of findings is done below.
Table 4.5.2.2 Regression Model Summary
Model R R
Square
Adjusted R Square Std. Error of the
Estimate
1 0.899a
0.808 0.720 0.01
34
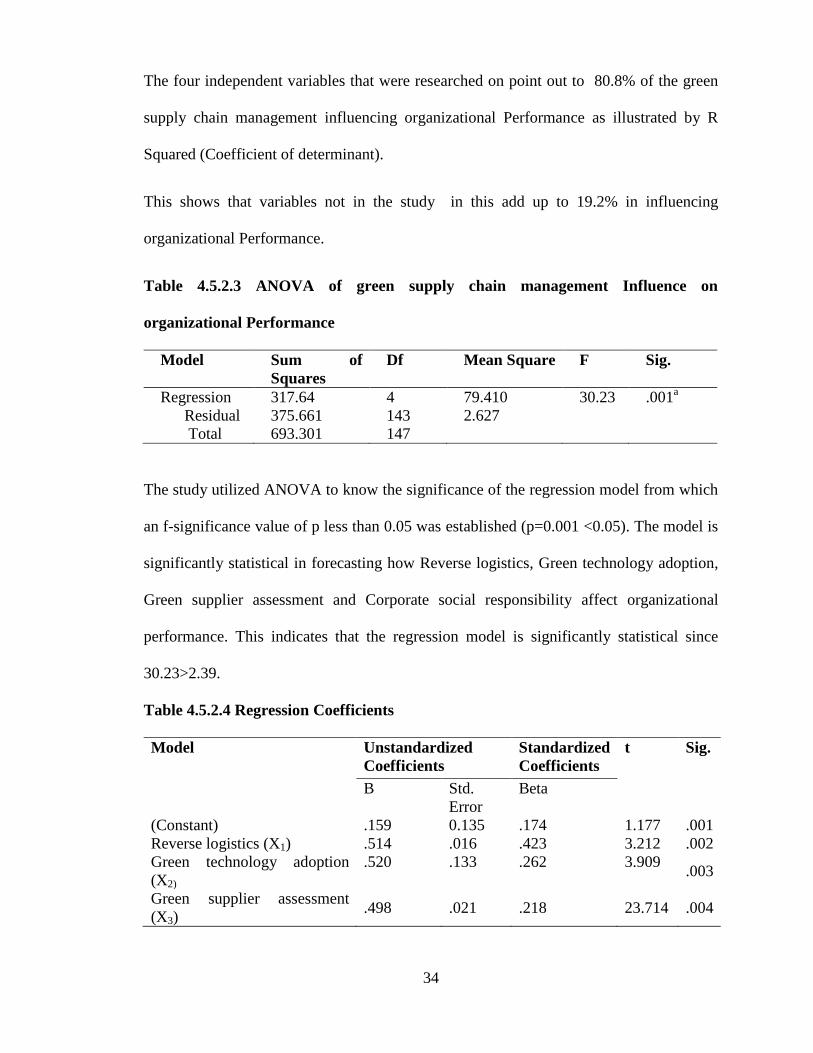
The four independent variables that were researched on point out to 80.8% of the green
supply chain management influencing organizational Performance as illustrated by R
Squared (Coefficient of determinant).
This shows that variables not in the study in this add up to 19.2% in influencing
organizational Performance.
Table 4.5.2.3 ANOVA of green supply chain management Influence on
organizational Performance
Model Sum of
Squares
Df Mean Square F Sig.
1 Regression
Residual
Total
317.64
375.661
693.301
4
143
147
79.410
2.627
30.23 .001a
The study utilized ANOVA to know the significance of the regression model from which
an f-significance value of p less than 0.05 was established (p=0.001 <0.05). The model is
significantly statistical in forecasting how Reverse logistics, Green technology adoption,
Green supplier assessment and Corporate social responsibility affect organizational
performance. This indicates that the regression model is significantly statistical since
30.23>2.39.
Table 4.5.2.4 Regression Coefficients
Model Unstandardized
Coefficients
Standardized
Coefficients
t Sig.
B Std.
Error
Beta
(Constant) .159 0.135 .174 1.177 .001
Reverse logistics (X1) .514 .016 .423 3.212 .002
Green technology adoption
(X2)
.520 .133 .262 3.909 .003
Green supplier assessment
(X3) .498 .021 .218 23.714 .004
35
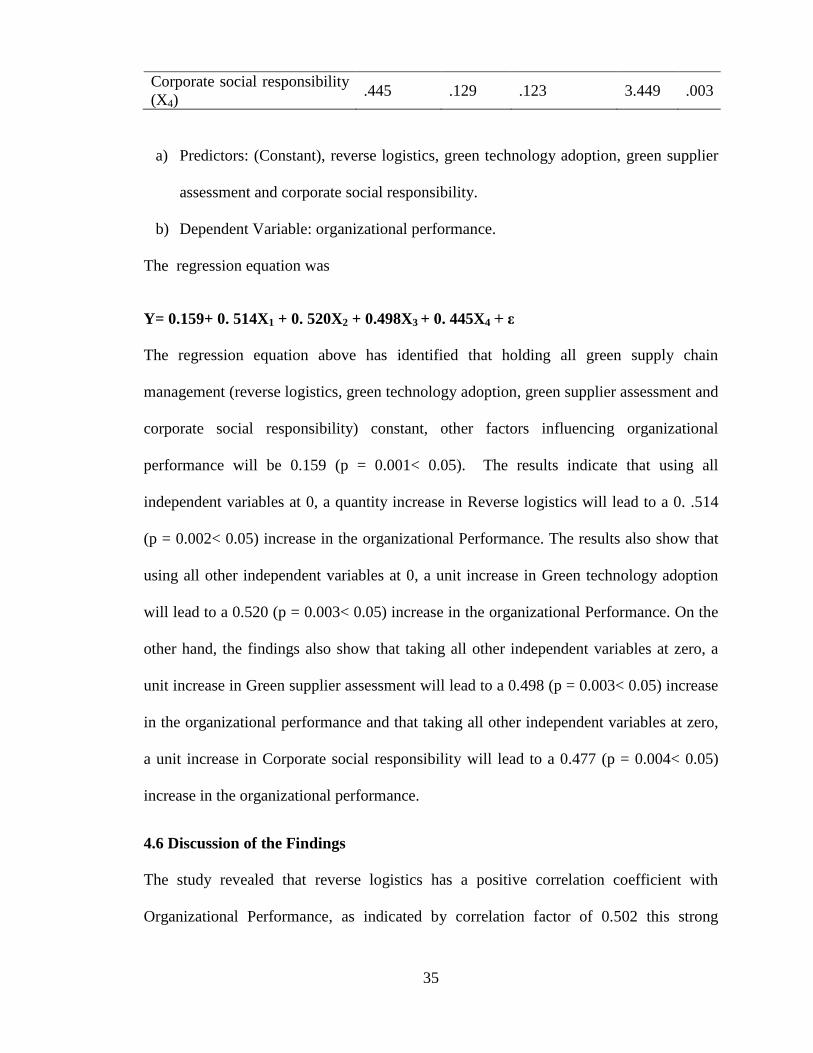
Corporate social responsibility
(X4) .445 .129 .123 3.449 .003
a) Predictors: (Constant), reverse logistics, green technology adoption, green supplier
assessment and corporate social responsibility.
b) Dependent Variable: organizational performance.
The regression equation was
Y= 0.159+ 0. 514X1 + 0. 520X2 + 0.498X3 + 0. 445X4 + ε
The regression equation above has identified that holding all green supply chain
management (reverse logistics, green technology adoption, green supplier assessment and
corporate social responsibility) constant, other factors influencing organizational
performance will be 0.159 (p = 0.001< 0.05). The results indicate that using all
independent variables at 0, a quantity increase in Reverse logistics will lead to a 0. .514
(p = 0.002< 0.05) increase in the organizational Performance. The results also show that
using all other independent variables at 0, a unit increase in Green technology adoption
will lead to a 0.520 (p = 0.003< 0.05) increase in the organizational Performance. On the
other hand, the findings also show that taking all other independent variables at zero, a
unit increase in Green supplier assessment will lead to a 0.498 (p = 0.003< 0.05) increase
in the organizational performance and that taking all other independent variables at zero,
a unit increase in Corporate social responsibility will lead to a 0.477 (p = 0.004< 0.05)
increase in the organizational performance.
4.6 Discussion of the Findings
The study revealed that reverse logistics has a positive correlation coefficient with
Organizational Performance, as indicated by correlation factor of 0.502 this strong

36
relationship was found to be statistically significant as the critical value was 0.001 which
is less than 0.05, The study further realized that taking all other independent variables at
zero, a unit increase in Reverse logistics will lead to a 0. .514 increase in the
organizational Performance. The findings are in line with Carter (2008), reverse logistics
is more than recycling packaging materials and reusing containers.
The study further established that purchasing of commodities is done with keen attention
to quality of supplies, the organization frequently participates in award winning
environmental programmes, transportation operations are done in a way to reduce carbon
footprint, and there is responsible and ethical tendering procedures. The study established
that the organization has a procedure to re-using used materials ,proper returns
management is done ,there is collection of expired goods from customers for proper
disposal ,reverse logistics is done in the organization ,implementation of green
technology reduces CO2 emissions ,there is waste management in the organization by use
of green technology ,green technology has been adopted through green technology our
organization has waste management measures and organization uses renewable energy
The study further established that high cost has been an impediment to adoption of green
practices ,lack of green supply chain management knowledge hinders adoption ,the
organization has not implemented structural and organization changes to support green
Supply chain management ,there is no management support in the organization, lack of
appropriate technology and business processes needed affects adoption, perception that
green products cost more hence affecting demand , lack of understanding of the concept,
there is conflict with authority due to waste management issues .The findings concur with
37
On the other hand, the study found that green supplier assessment has positive correlation
coefficient with organizational performance.
The study established that the organization has lost business due to environmental
requirements ,lack of technical expertise by regulators who impose it ,existence of other
techniques or initiatives ,lack of communication between business managers and
environmental professionals to gain knowledge ,lack of enforceable government policies
and regulations ,lack of training of staff on the environmental practices and lack of public
awareness.
38
CHAPTER FIVE
SUMMARY OF FINDINGS CONCLUSION AND RECOMMENDATIONS
5.1 Introduction
This chapter shows the outline of the results of the scrutiny of green supply chain
management and organizational performance of Beverage and food Manufacturing
Industry in Kenya, finalization and recommendations are drawn there to. The chapter is
structured into summary of findings, conclusions, recommendations, study limitations
and areas of further studies.
5.2 Summary of Findings
The study shows a positive correlation coefficient between reverse logistics and
Organizational Performance of Food and Beverage Manufacturing Industry in Kenya.
The study further found a positive influence of reverse logistics the organizational
Performance of Food and Beverage Manufacturing Industry in Kenya which increases
organizational Performance in terms of green supply chain management. The study
further established that purchasing of commodities is done with keen attention to quality
of supplies; the organization frequently participates in award winning environmental
programmes.
On the green technology adoption, the study found that there was strong positive
correlation between green technology adoption and organizational performance of
beverage and food Manufacturing Industry in Kenya. This shows that an increased green
technology adoption leads to increased organizational performance of Food and Beverage
Manufacturing Industry in Kenya. The findings also revealed that taking all other
independent variables constant, increase in green technology adoption leads to an
39
increase in the organizational performance. The findings concur with Gollin (2011),
Green technology is important in promoting sustainability and reducing of greenhouse
gas emissions.
On the other hand, the study established a strong positive correlation coefficient between
green supplier assessment and organizational performance of Beverage and food
Manufacturing Industry in Kenya. The findings also show a positive relationship between
Green supplier assessment and organizational performance of Beverage and food
Manufacturing Industry in Kenya. The study further found that inadequate
communication between professionals of environment and business managers to gain
knowledge, influence organizational performance of Food and Beverage Manufacturing
Industry in Kenya.
The study established a strong positive correlation coefficient between organizational
performance and social corporate responsibility and of Food and Beverage
Manufacturing Industry in Kenya. The study also revealed a positive relationship
between corporate social responsibility and the organizational performance of Food and
Beverage Manufacturing Industry in Kenya.
5.3 Conclusion
This study has provided a comprehensive review of green supply chain management and
organizational performance of Beverage and food Manufacturing Industry in Kenya.
Basing on the results of this research, the conclusion is that there exists positive
correlation coefficient among reverse logistics and Organizational Performance of Food
and Beverage Manufacturing Industry in Kenya. There is also a relationship that is
positive between reverse logistics and organizational Performance of Food and Beverage

40
Manufacturing Industry in Kenya. On the green technology adoption, the study found that
there was strong positive correlation between green technology adoption and
organizational performance of Food and Beverage Manufacturing Industry in Kenya. The
study also concluded there is a positive relation of green technology adoption on
organizational performance of Food and Beverage Manufacturing Industry in Kenya.
The study further concludes that a strong positive correlation coefficient and positive
relationship exists between green supplier assessment and organizational performance of
Food and Beverage Manufacturing Industry in Kenya. On the corporate social
responsibility and organizational performance, the study concludes existence of a strong
positive correlation coefficient with organizational performance of Food and Beverage
Manufacturing Industry in Kenya.
5.4 Recommendations
The study recommends that that Food and Beverage Manufacturing Industry in Kenya
and also organizations that are non-manufacturing should adopt green supply chain
practices in all their processes. This is because there are economic benefits in green
supply chain management.
The study recommends that Kenyan Government, through NEMA should develop rules
and regulations that make it a requirement for all manufacturing firms to adopt
environmentally friendly practices in the entire supply chain.
5.5 Limitations of the Study
The research results were applicable to Food and Beverage Manufacturing Industry in
Kenya only. The findings can therefore not be generalized to all organizations. Most of

41
the respondents were very busy and therefore were not in a position to provide all the
necessary information.
5.6 Suggestions for Further Studies
The research focused on green supply chain management and performance of the
organization in Beverage and food Manufacturing Industry in Kenya. Similar research
should be done on Green Supply Chain Management and Economic Performance of
Beverage and food manufacturing Industry in Kenya
42
REFERENCES
Adesina, A. A., & Zinnah, M. M. (2011). Technology characteristics, farmers'
perceptions and adoption decisions: A Tobit model application in Sierra Leone.
Agricultural economics, 9(4), 297-311.
Blome, C,Hollos,D.& Paulraj, A. (2014). Green procurement and green supplier
development: antecedents and effects on supplier performance. International Journal of
Production Research, 52(1), 32-49.
Blome, M. J. (2013). Encouraging green procurement practices in business: a Canadian
case study in programme development. Greener Purchasing: Opportunities and
Innovations, 108-117.
Boyd, B. (2009). Corporate linkages and organizational environment: A test of the
resource dependence model. Strategic Management Journal, 11(6), 419-430.
Carter, C. R., & Ellram, L. M. (2008). Reverse logistics: a review of the literature and
framework for future investigation. Journal of business logistics, 19(1), 85.
Cooper, D.R & Schindler, P.S. (2006). Business Research Methods (8th edn) McGraw-
Hill: New York.
Costa S.G., Lima E.P, (2014),"Green supply chain management",
Crane, A., & Matten, D. (Eds.). (2007). Corporate social responsibility (Vol. 2). Sage.
Creswell, J.W. & Clark, V.P. (2007). Designing and conducting mixed methods research.
Thousand Oaks: Sage Publications Inc
Davis, G. F., & Cobb, J. A. (2010). Resource dependence theory: Past and future.
Research in the Sociology of Organizations, 28(1), 21-42.
Donaldson, T., & Preston, L. E. (2010). The stakeholder theory of the corporation:
Concepts, evidence, and implications. Academy of management Review, 20(1), 65-91.
Dooley, D. (2007). Social Research Methods. New Delhi: Prentice Hall.
Edler, J., Ruhland, S., Hafner, S., Rigby, J., Georghiou, L., Hommen, L., ...&Papadakou,
M. (2010). Innovation and public procurement. Review of issues at stake. ISI Fraunhofer
Institute Systems and Innovation Research, Karlsruhe.
Feder, G., &Umali, D. L. (2013). The adoption of agricultural innovations: a review.
Technological forecasting and social change, 43(3), 215-239.
Fischer, H. (2010). The research on green purchasing [D], Foreign Economic and Trade
University. Implications for integrated product policy (IPP). Journal of Cleaner
Production 13, 705-715
43
Fleischmann, M., Bloemhof-Ruwaard, J. M., Dekker, R., Van der Laan, E., Van Nunen,
J. A., & Van Wassenhove, L. N. (2009). Quantitative models for reverse logistics: A
review. European journal of operational research, 103(1), 1-17.
Freeman, R. E. (1994). The politics of stakeholder theory: Some future directions.
Business ethics quarterly, 4(04), 409-421.
Gatari, N. C., & Were, S. (2014). Challenges Facing Implementation of Green supply
chain management.
Gollin, D., Morris, M., &Byerlee, D. (2011). Technology adoption in intensive post-
green revolution systems. American Journal of Agricultural Economics, 87(5), 1310-
1316.
Green, K., Morton, B., & New, S. (2010). Purchasing and environmental management:
interactions, policies and opportunities. Business Strategy and the Environment, 5(3),
188-197.
Hall, C. A. (2006). Integrating Concepts and Models from Development Econoimcs with
Land use Change in the Tropics. Environment, Development and Sustainability, 8(1), 19-
53.
Handfield, R., Walton, S. V., Sroufe, R., &Melnyk, S. A. (2012). Applying
environmental criteria to supplier assessment: A study in the application of the Analytical
Hierarchy Process. European Journal of Operational Research, 141(1), 70-87.
Hauschildt①a, V., & Schulze-Ehlers, B. (2014). An Empirical Investigation into the
Adoption of green procurement Practices in the German Food Service Industry.
International Food and Agribusiness Management Review, 17(3), 1.
Hillman, A. J., Withers, M. C., & Collins, B. J. (2009). Resource dependence theory: A
review. Journal of management.
Holme, R., & Watts, P. (2009). Corporate social responsibility. Geneva: World Business
Council for Sustainable Development.
Hsu, S. & Hu, H. (2008), Comprehensive and configurable metrics for supplier selection.
Int. J. Prod.Econ. 105, 510–523. Journal of Manufacturing Technology Management,
Vol. 25 Iss 8 pp. 1105 – 1134
Jensen, M. C. (1999). Value maximization, stakeholder theory, and the corporate
objective function. Journal of applied corporate finance, 14(3), 8-21.
Jones, T. M., & Wicks, A. C. (2010). Convergent stakeholder theory. Academy of
management review, 24(2), 206-221.
Kipkorir, L. E., &Wanyoike, D. M.(2015).factors influencing implementation of green
procurement in multinational tea companies in kericho county.
44
Kombo, D. K. & Tromp, D. L. A (2006). Proposal and Thesis Writing. Nairobi. Paulines
Publications.
Lee, A. H., Kang, H. Y., Hsu, C. F., & Hung, H. C. (2009). A green supplier selection
model for high-tech industry. Expert systems with applications, 36(4), 7917-7927.
Lee, D. F., &Kim, D. J. (2008). Use the supply relationship to develop lean and green
suppliers. Supply chain management: An international Journal, 10(1), 60-68.
Lin, N. A. S. (2011). A review: the impacts of green practices adoption on green
performance in the Malaysian automotive industry. Journal of Sustainable Development
Studies, 2(1)
Makkonen, A. (2014). The role of company's sustainable procurement practices in
conscious consumer buying behaviour. Case: EkotinOy.
Marron, D. B. (2007). Buying green: government procurement as an instrument of
environmental policy. Public Finance Review, 25(3), 285-305.
McWilliams, A. (2011). Corporate social responsibility. Wiley Encyclopedia of
Management.
Michelsen, O., & de Boer, L. (2009). Green procurement in Norway; a survey of
practices at the municipal and county level. Journal of Environmental Management,
91(1), 160-167.
Michelsen, O., & de Boer, L. (2009). Green procurement in Norway; a survey of
practices at the municipal and county level. Journal of Environmental Management,
91(1), 160-167.
Mugenda, O. M., &Mugenda, A. G. (2003). Research Methods: Quantitative and
Qualitative Approaches. Nairobi: Acts
Mwaura, A. W., Letting, N., Ithinji, G., &Orwa, B. H. (2016).Green distribution practices
and competitiveness of food manufacturing firms in kenya.
Nagel, M. H. (2010). Environmental supply-chain management versus green procurement
in the scope of a business and leadership perspective. In Electronics and the
Environment, 2000. ISEE 2000. Proceedings of the 2000 IEEE International Symposium
on (pp. 219-224). IEEE.
Navi, S. T. (2012). Corporate social responsibility.
Nderitu, K. M., &Ngugi, K. (2014). Effects Of green procurement Practices On An
Organization Performance In Manufacturing Industry: Case Study Of East African
Breweries Limited. European Journal of Business Management, 2(1), 341-352.
45
Ngechu. M. (2004). Understanding the research process and methods. An introduction to
research methods. Acts Press, Nairobi.
Noci, G. (2007). Designing „green‟vendor rating systems for the assessment of a
supplier's environmental performance. European Journal of Purchasing & Supply
Management, 3(2), 103-114.
Nyakundi, B. M. (2013). Adoption of green manufacturing practices by food processing
firms in Mombasa County, Kenya (Doctoral dissertation, University of Nairobi).
Okello, J. J. (2010). Compliance with international food safety standards: The case of
green bean production in Kenyan family farms (Doctoral dissertation, Michigan State
University).
Okemba, P. O. (2014). Green supply chain management practices as determinants of
supply chain performance in Kenya‟s manufacturing firms: A case study of Nairobi-
based firms in the food and beverage sector. Strategic Journal of Business & Change
Management, 1(2).
Ouru, L. M. (2015). Green supply chain performance management practices in large
manufacturing firms in Nairobi, Kenya (Doctoral dissertation, University of Nairobi).
Pfeffer, J., &Salancik, G. R. (1978). The external control of organizations: A resource
dependence perspective. Stanford University Press.
Pfitzer, M., &Krishnaswamy, R. (2008). The Role of the Food & Beverage Sector in
Expanding Economic Opportunity. CSR Initiative Report, 20, 9.
Pishvae, M. P., & Dekker, R. (2009). A framework for reverse logistics. In Reverse
Logistics (pp. 3-27). Springer Berlin Heidelberg.
Rainbird, M. (2014). A framework for operations management: the Supply chain,
International Journal of Physical Distribution & Logistics Management, Vol. 34, No. 3/4.
Rha, J. S. (2010). The impact of green supply chain practices on supply chain
performance.
Rogers, D. S., &Tibben-Lembke, R. S. (1999). Going backwards: reverse logistics trends
and practices (Vol. 2). Pittsburgh, PA: Reverse Logistics Executive Council.
Russel, T. (Ed.). (2012). Greener purchasing: Opportunities and innovations. Greenleaf
Publications.
Salam, M. A. (2008, December). Green supply chain management adoption in
manufacturing supply chain. In Proceedings of the 9th Asia Pasific Industrial Engineering
and Management Systems Conference (pp. 3-5).
Schluter, M. (2012). Constraints on Kenya's food and beverage exports (Vol. 43). Intl
Food Policy Res Inst.
46
Schumpeter, J. A. (1962). The theory of technology diffussion: An inquiry into profits,
capital, credit, interest, and the business cycle (Vol. 55). Transaction publishers.
Smith, E. E., & Perks, S. (2010). A perceptual study of the impact of green practice
implementation on the business functions. Southern African Business Review, 14(3), 1-
29.
Sterner, E. (2012). „Green procurement of buildings: a study of Swedish clients'
considerations. Construction Management & Economics, 20(1), 21-30.
Sunding, D., &Zilberman, D. (2012). The agricultural innovation process: research and
technology adoption in a changing agricultural sector. Handbook of agricultural
economics, 1, 207-261.
Testa, F., Iraldo, F., Frey, M., &Daddi, T. (2012). What factors influence the uptake of
GPP (green public procurement) practices? New evidence from an Italian survey.
Ecological Economics, 82, 88-96.
Vashta, J. W. (2012). Green supply chain management and supply chain responsiveness
among food and beverages manufacturing firms in Nairobi, Kenya (Doctoral
dissertation).
Walker, H., &Brammer, S. (2009). Sustainable procurement in the United Kingdom
public sector. Supply Chain Management: An International Journal, 14(2), 128-137.

47
APPENDIX I: QUESTIONAIRE
Section: A: Demographic Information
Respondents.
1. Gender
Male [ ] Female [ ]
2. Age group in years
18-25[ ] 26-30[ ] 31-40 [ ] 41-50 [ ] Above 50 [ ]
3. Please indicate the highest level of education attained? (Tick as applicable)
College Diploma…… ...……………. [ ]
Undergraduate ...……………………. [ ]
Master ………………………………. [ ]
Others (specify)
……………………………………………………………………………...
4. Indicate your period of service in this firm
2 years or below [ ] 3 to 5 years [ ]
6 to 8 years [ ] 9 years and above [ ]
5. Indicate your position in this organization
Procurement manager [ ]
Quality assurance manager [ ]
Others (specify)
……………………………………………………………………………...
FIRM
6. Indicate how long has the firm been in operation in Kenya. {Years}
2 years or below [ ] 3 to 5 years [ ]
6 to 8 years [ ] 9 years and above [ ]
SECTION B: ADOPTION OF GREEN SUPPLY CHAIN MANAGEMENT
7. Does your firm have environmental management department?
Yes [ ]
No [ ]
8. Does your firm have an environmental management policy?
Yes [ ]
No [ ]
9. Indicate your level of agreement with each the following statements relating to
extent of adoption of Green Supply chain management in your organization. Use
the scale :
1- Strongly disagree ; 2-Disagree; 3- Undecided; 4- Agree;
5- Strongly Agree
PRACTICES 1 2 3 4 5
Recycling of materials is done in the organization.

48
Purchasing of commodities is done with keen attention to quality of
supplies.
Our organization frequently participates in award winning
environmental programmes.
Transportation operations are done in a way to reduce carbon
footprint.
There is a responsible and ethical tendering procedure.
The organization has a procedure to re-using used materials.
Proper returns management is done
There is collection of expired goods from customers for proper
disposal
Reverse logistics is done in the organization.
Implementation of green technology reduces CO2 emissions.
There is waste management in the organization by use of green
technology.
Green technology has been adopted.
Through green technology our organization has waste management
measures
Organization uses renewable energy
Suppliers are assessed based on their ability to control pollution
Our organization does business only with those that meet
environmental regulations and standards
Organizations deals with green raw materials.
Suppliers are compared by considering the qualitative characteristic
of environmental performance
Our organization carries out green packaging.
Through corporate social responsibility our organization complies
with environmental requirements.
SECTION C: CHALLENGES OF GREEN SUPPLY CHAIN MANAGEMENT
10. Indicate the extent to which the organization has faced each of the following
challenges in adoption of green supply chain management. Use the scale :
1-No extent; 2-Little extent; 3- Moderate extent; 4- Great extent;
5- Very great Extent;
Challenges 1 2 3 4 5
High cost has been an impediment to adoption of green practices.
Lack of green supply chain management knowledge hinders
adoption.
The organization has not implemented structural and organization
changes to support green Supply chain management
There is lack of management support in the organization.
Lack of appropriate technology and business processes needed affects
adoption.
Perception that green products cost more hence affecting demand.

49
Lack of understanding of the concept
There is conflict with authority due to waste management issues.
Organization has lost business due to environmental requirements
Lack of technical expertise by regulators who impose it
Existence of other techniques or initiatives
Lack of communication between business managers and
environmental professionals to gain knowledge
Lack of enforceable government policies and regulations
Lack of training of staff on the environmental practices
Lack of public awareness leading to low demand for organization
products.
Resistance to change by the organization employees.
SECTION D: GREEN SUPPLY CHAIN MANAGEMENT AND
ORGANIZATIONAL PERFORMANCE
1. Indicate the extent to which adoption of green supply chain management has
affected the organizational performance for each of the following organization
performance indicators. Use the scale :
1-No extent; 2-Little extent; 3- Moderate extent 4- Great Extent
5- Very great Extent
2.
Organizational performance 1 2 3 4 5
Goods are produced at the least cost possible in the organization.
The organization maximizes profits in its operation.
There is increased customer satisfaction
Demand for the organization products and services are high.
Organization market share for its products has increased
Staff members are aware of goals and objectives on organizational level.
Organization maximizes the use of its resources.
Organization produces products that are of high quality.
Organization uses its production capacity optimally.
Organization minimizes rejects or scrap materials in production.
THANK YOU
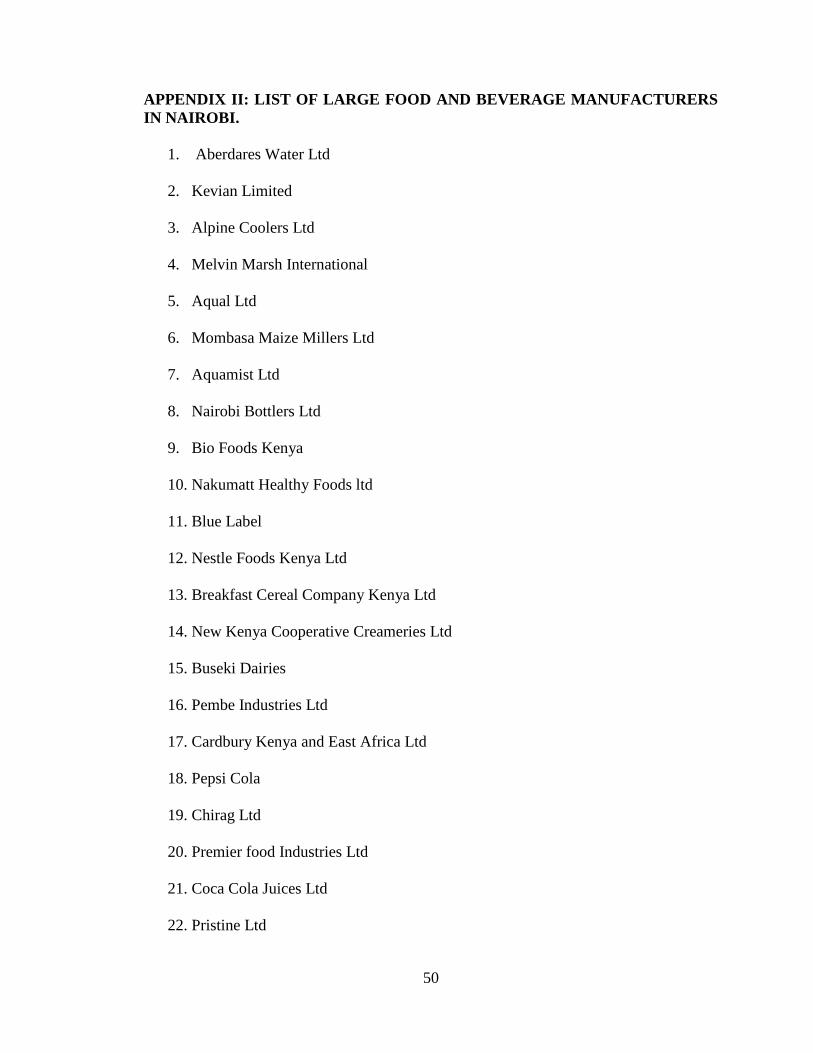
50
APPENDIX II: LIST OF LARGE FOOD AND BEVERAGE MANUFACTURERS
IN NAIROBI.
1. Aberdares Water Ltd
2. Kevian Limited
3. Alpine Coolers Ltd
4. Melvin Marsh International
5. Aqual Ltd
6. Mombasa Maize Millers Ltd
7. Aquamist Ltd
8. Nairobi Bottlers Ltd
9. Bio Foods Kenya
10. Nakumatt Healthy Foods ltd
11. Blue Label
12. Nestle Foods Kenya Ltd
13. Breakfast Cereal Company Kenya Ltd
14. New Kenya Cooperative Creameries Ltd
15. Buseki Dairies
16. Pembe Industries Ltd
17. Cardbury Kenya and East Africa Ltd
18. Pepsi Cola
19. Chirag Ltd
20. Premier food Industries Ltd
21. Coca Cola Juices Ltd
22. Pristine Ltd
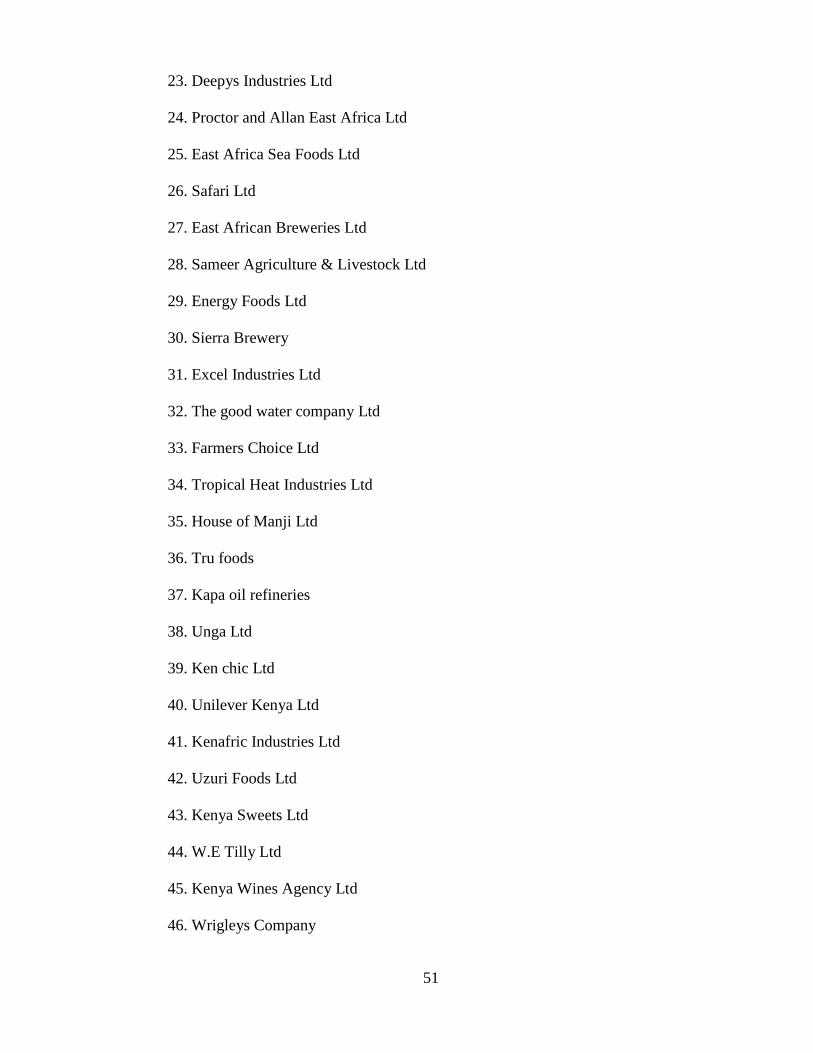
51
23. Deepys Industries Ltd
24. Proctor and Allan East Africa Ltd
25. East Africa Sea Foods Ltd
26. Safari Ltd
27. East African Breweries Ltd
28. Sameer Agriculture & Livestock Ltd
29. Energy Foods Ltd
30. Sierra Brewery
31. Excel Industries Ltd
32. The good water company Ltd
33. Farmers Choice Ltd
34. Tropical Heat Industries Ltd
35. House of Manji Ltd
36. Tru foods
37. Kapa oil refineries
38. Unga Ltd
39. Ken chic Ltd
40. Unilever Kenya Ltd
41. Kenafric Industries Ltd
42. Uzuri Foods Ltd
43. Kenya Sweets Ltd
44. W.E Tilly Ltd
45. Kenya Wines Agency Ltd
46. Wrigleys Company
Related Documents