THE VALUE OF GREEN INFRASTRUCTURE FOR URBAN CLIMATE ADAPTATION The Center for Clean Air Policy February 2011 Josh Foster Ashley Lowe Steve Winkelman

Welcome message from author
This document is posted to help you gain knowledge. Please leave a comment to let me know what you think about it! Share it to your friends and learn new things together.
Transcript
THE VALUE OF GREEN INFRASTRUCTURE FOR URBAN CLIMATE ADAPTATION
The Center for Clean Air Policy
February 2011
Josh Foster Ashley Lowe
Steve Winkelman
About CCAP Since 1985, CCAP has been a recognized world leader in climate and air quality policy
and is the only independent, non-profit think-tank working exclusively on those issues at the local, national and international levels. Headquartered in Washington, D.C., CCAP helps policymakers around the world to develop, promote and implement innovative, market-based solutions to major climate, air quality and energy problems that balance both environmental and economic interests. For more information about CCAP, please
visit www.ccap.org.
Acknowledgements CCAP applauds the vision, leadership, and effort of our ten partners in the Urban Leaders
Adaptation Initiative: Chicago, King County, Los Angeles, Miami-Dade County, Milwaukee, Nassau County, New York City, Phoenix, San Francisco, and Toronto. Over
the last few years we have been impressed with the partners’ commitment to climate adaptation, progress in adaptation planning, and their development and implementation of best practices for managing emerging and future climate change impacts. This report was made possible by support from the Rockefeller Foundation and the Surdna Foundation.

This report is dedicated to John H. Foster, a pioneer in the economic valuation of wetlands in Massachusetts in the early 1970s justifying state and later national wetlands protection laws. Because he asked then about the value of wetlands, we are able to ask now about how green infrastructure, climate adaptation, and community resilience are connected.
TABLE OF CONTENTS
EXECUTIVE SUMMARY.......................................................................................................................... II
WHAT IS GREEN INFRASTRUCTURE? ............................................................................................... 3
ECO-ROOFS ................................................................................................................................................ 5
GREEN ROOFS–ONE SOLUTION, MULTIPLE BENEFITS ............................................................................... 6 Economic Costs and Benefits of Green Roofs....................................................................................... 8
WHITE ROOFS–ADAPTING TO THE URBAN HEAT ISLAND EFFECT ............................................................. 9 Economic Costs and Benefits of White Roofs...................................................................................... 10
BLUE ROOFS– ADDRESSING WATER MANAGEMENT CHALLENGES .......................................................... 11 Economic Costs and Benefits of Blue Roofs........................................................................................ 12
COMPARING PERFORMANCE AND VALUE OF ECO-ROOF TYPES ............................................................... 13
GREEN ALLEYS AND STREETS .......................................................................................................... 14
GREEN ALLEYS: PERMEABLE PAVEMENT ................................................................................................. 15 GREEN ALLEYS: DOWNSPOUT DISCONNECTION AND RAIN WATER COLLECTION ................................... 16 ECONOMIC COSTS AND BENEFITS OF GREEN ALLEYS .............................................................................. 18 LOW IMPACT DEVELOPMENT ................................................................................................................... 19
URBAN FORESTRY ................................................................................................................................. 21
Economic Costs and Benefits of Urban Forestry................................................................................ 23
MANAGERIAL, INSTITUTIONAL AND MARKET-BASED APPROACHES TO CLIMATE
RESILIENCE ............................................................................................................................................. 27
MANAGERIAL APPROACHES...................................................................................................................... 28 INSTITUTIONAL APPROACHES................................................................................................................... 29 MARKET MECHANISMS ............................................................................................................................. 30
CONCLUSIONS: IMPLICATIONS FOR POLICY, RESEARCH AND TECHNICAL
ASSISTANCE ............................................................................................................................................. 31
ASKING THE RESILIENCE QUESTION ........................................................................................................ 31 DELIVERING ADAPTIVE SOLUTIONS THROUGH CLIMATE EXTENSION SERVICES...................................... 33 CLOSING THOUGHTS ON GREEN INFRASTRUCTURE AND RESILIENCE...................................................... 34
APPENDIX: EXAMPLES OF COMPREHENSIVE GREEN INFRASTRUCTURE STRATEGIES 1
The Value of Green Infrastructure for Urban Climate Adaptation
ii
EXECUTIVE SUMMARY
In this paper CCAP provides information on the costs and benefits of “green” infrastructure solutions for bolstering local adaptation to climate change. Pioneering cities and counties have used green practices to increase community resilience by planning for, and adapting to, emerging climate change impacts. Generally, resilience means that communities can better withstand, cope with, manage, and rapidly recover their stability after a variety of crises. Practices such as green roofs, urban forestry, and water conservation are familiar to local governments as strategies to enhance sustainability and quality of life and they are increasingly being seen as best practices in climate adaptation. These solutions can help build adaptive capacity through planning, preparing, or reducing climate-related vulnerabilities, but the uncertainty involved in calculating their economic and social costs and benefits is a barrier to action for local governments. This report will evaluate the performance and benefits of a selection of green infrastructure solutions, using their range of technological, managerial, institutional, and financial innovations as a proxy for their value for climate adaptation. Over the coming century, climate change scenarios project that urban regions will be managing extremes of precipitation and temperature, increased storm frequency and intensity, and sea-level rise. The problems with which urban areas are already coping may already be indicating–or at least mimicking – that climate change impacts have begun to occur and are likely to worsen in the future. Often green approaches are combined with modifications to other traditional “hard” infrastructures such as expanding storm-sewers and streets or building storm-water storage tunnels. In recent thinking, portfolios of “green” infrastructure and technologies have been indentified as ‘best practices’ at the local level when combined with traditional “grey” infrastructure to achieve greater urban sustainability and resilience. In addition, green infrastructure is now being recognized for its value as a means for adapting to the emerging and irreversible impacts of climate change. Consequently, some local governments have adopted green infrastructure as a hedge against climate change risks, particularly if the strategies result in multiple other benefits. The discovery of the multiple benefits of green infrastructure has induced action regardless of the timing, extent, and rate of climate change impacts. Given the challenges of accurately calculating the incremental costs and benefits of climate adaptation policies, this report will use the costs, benefits, and performance of various green infrastructure practices as proxies for their value to climate adaptation across a range of technological, managerial, institutional, and financial innovations. Green infrastructure approaches help to achieve sustainability and resilience goals over a range of outcomes in addition to climate adaptation. The climate adaptation benefits of green infrastructure are generally related to their ability to moderate the impacts of extreme precipitation or temperature. Benefits include better management of storm-water runoff, lowered incidents of combined storm and sewer overflows (CSOs), water capture and conservation, flood prevention, storm-surge protection, defense against sea-level rise,
The Value of Green Infrastructure for Urban Climate Adaptation
iii
accommodation of natural hazards (e.g., relocating out of floodplains), and reduced ambient temperatures and urban heat island (UHI) effects. The U.S. Environmental Protection Agency (EPA) has also identified green infrastructure as a contributor to improved human health and air quality, lower energy demand, reduced capital cost savings, increased carbon storage, additional wildlife habitat and recreational space, and even higher land-values of up to 30%. The value of green infrastructure actions is calculated by comparison to the cost of “hard” infrastructure alternatives, the value of avoided damages, or market preferences that enhance value (e.g. property value). Green infrastructure benefits generally can be divided into five categories of environmental protection: (1) Land-value, (2) Quality of life, (3) Public health, (4) Hazard mitigation, and (5) Regulatory compliance. Examples of “green” infrastructure and technological practices include green, blue, and white roofs; hard and soft permeable surfaces; green alleys and streets; urban forestry; green open spaces such as parks and wetlands; and adapting buildings to better cope with floods and coastal storm surges. Green technologies and infrastructure solutions are often implemented with a single goal in mind, such as managing storm-water or reducing local ambient heat, and the costs and benefits are often evaluated in the same way. However, the full net-benefit of green infrastructure development can only be realized by a comprehensive accounting of their multiple benefits. For example, trees filter water, slow runoff, cool local and regional urban heat effects and clean air. Additionally, some adaptation practices provide co-benefits to climate mitigation goals by helping to reduce greenhouse gas emissions. For example, trees absorb and store carbon and can provide shade that reduces man-made cooling needs and hence electricity demand. Application of green infrastructure approaches range in scale from individual buildings, lots, and neighborhoods to entire cities and metro regions and the benefits range in scale accordingly. Green infrastructure can be implemented via large centralized public “macro” projects or smaller decentralized “micro” applications on private property. Therefore, the benefits of green infrastructure can be measured at the building or site level such that the individual owners reap the private benefits or, if spread across many private owners, the benefits can be aggregated to an entire community, city, county, region, or even nation. Community implementation of green infrastructure particularly helps local governments to achieve environmental, sustainability, and adaptation goals within their jurisdictions. Depending on circumstances and motivations, CCAP Urban Leaders partners and other pioneering communities have embraced the application of green infrastructure and
The Value of Green Infrastructure for Urban Climate Adaptation
iv
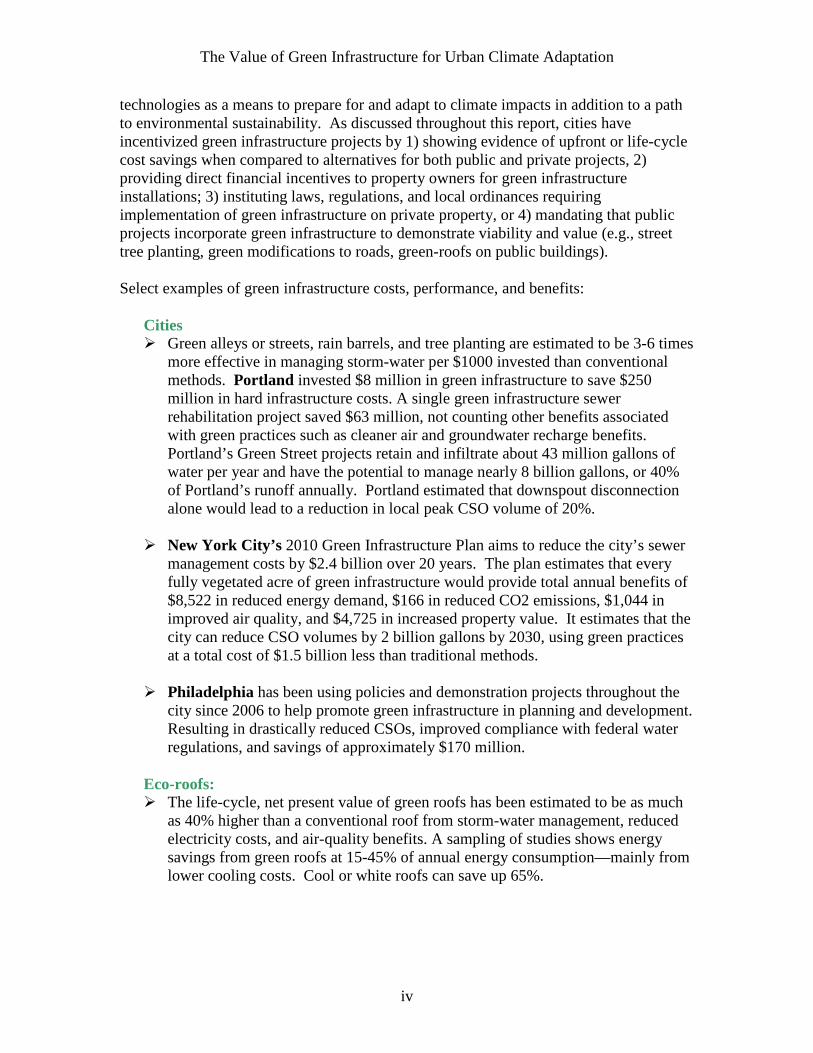
technologies as a means to prepare for and adapt to climate impacts in addition to a path to environmental sustainability. As discussed throughout this report, cities have incentivized green infrastructure projects by 1) showing evidence of upfront or life-cycle cost savings when compared to alternatives for both public and private projects, 2) providing direct financial incentives to property owners for green infrastructure installations; 3) instituting laws, regulations, and local ordinances requiring implementation of green infrastructure on private property, or 4) mandating that public projects incorporate green infrastructure to demonstrate viability and value (e.g., street tree planting, green modifications to roads, green-roofs on public buildings). Select examples of green infrastructure costs, performance, and benefits:
Cities � Green alleys or streets, rain barrels, and tree planting are estimated to be 3-6 times
more effective in managing storm-water per $1000 invested than conventional methods. Portland invested $8 million in green infrastructure to save $250 million in hard infrastructure costs. A single green infrastructure sewer rehabilitation project saved $63 million, not counting other benefits associated with green practices such as cleaner air and groundwater recharge benefits. Portland’s Green Street projects retain and infiltrate about 43 million gallons of water per year and have the potential to manage nearly 8 billion gallons, or 40% of Portland’s runoff annually. Portland estimated that downspout disconnection alone would lead to a reduction in local peak CSO volume of 20%.
� New York City’s 2010 Green Infrastructure Plan aims to reduce the city’s sewer
management costs by $2.4 billion over 20 years. The plan estimates that every fully vegetated acre of green infrastructure would provide total annual benefits of $8,522 in reduced energy demand, $166 in reduced CO2 emissions, $1,044 in improved air quality, and $4,725 in increased property value. It estimates that the city can reduce CSO volumes by 2 billion gallons by 2030, using green practices at a total cost of $1.5 billion less than traditional methods.
� Philadelphia has been using policies and demonstration projects throughout the
city since 2006 to help promote green infrastructure in planning and development. Resulting in drastically reduced CSOs, improved compliance with federal water regulations, and savings of approximately $170 million.
Eco-roofs: � The life-cycle, net present value of green roofs has been estimated to be as much
as 40% higher than a conventional roof from storm-water management, reduced electricity costs, and air-quality benefits. A sampling of studies shows energy savings from green roofs at 15-45% of annual energy consumption—mainly from lower cooling costs. Cool or white roofs can save up 65%.
The Value of Green Infrastructure for Urban Climate Adaptation
v
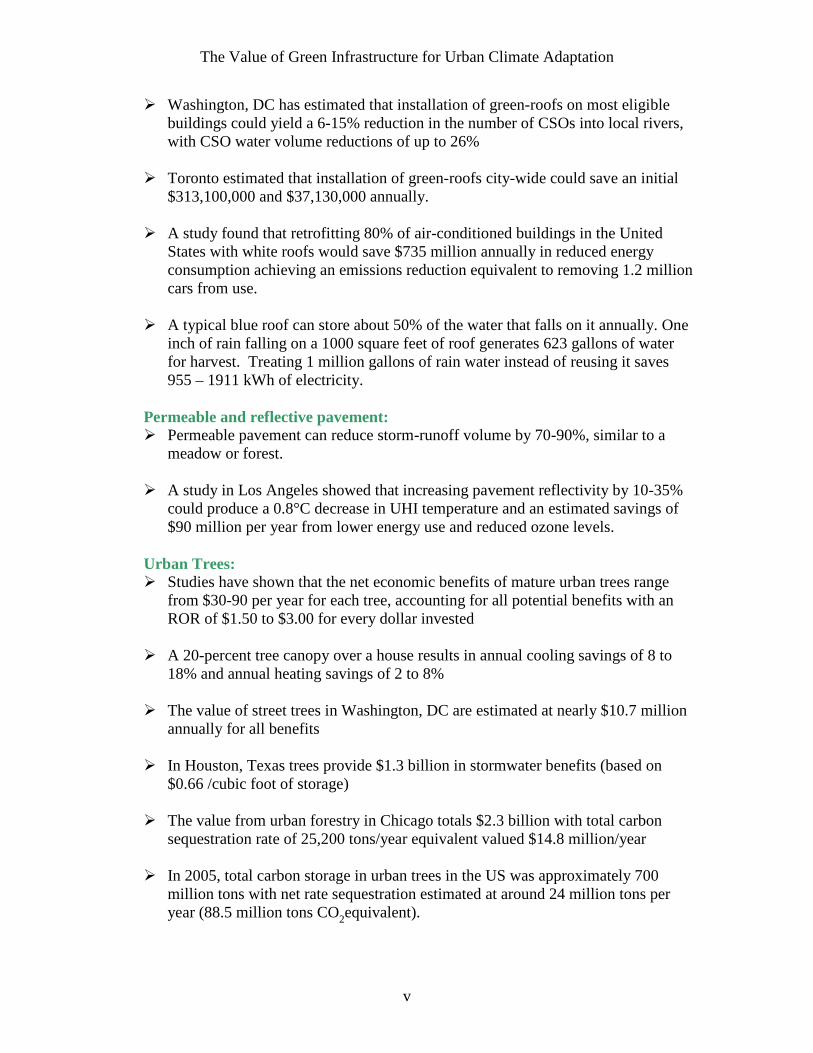
� Washington, DC has estimated that installation of green-roofs on most eligible buildings could yield a 6-15% reduction in the number of CSOs into local rivers, with CSO water volume reductions of up to 26%
� Toronto estimated that installation of green-roofs city-wide could save an initial
$313,100,000 and $37,130,000 annually.
� A study found that retrofitting 80% of air-conditioned buildings in the United States with white roofs would save $735 million annually in reduced energy consumption achieving an emissions reduction equivalent to removing 1.2 million cars from use.
� A typical blue roof can store about 50% of the water that falls on it annually. One
inch of rain falling on a 1000 square feet of roof generates 623 gallons of water for harvest. Treating 1 million gallons of rain water instead of reusing it saves 955 – 1911 kWh of electricity.
Permeable and reflective pavement: � Permeable pavement can reduce storm-runoff volume by 70-90%, similar to a
meadow or forest. � A study in Los Angeles showed that increasing pavement reflectivity by 10-35%
could produce a 0.8°C decrease in UHI temperature and an estimated savings of $90 million per year from lower energy use and reduced ozone levels.
Urban Trees: � Studies have shown that the net economic benefits of mature urban trees range
from $30-90 per year for each tree, accounting for all potential benefits with an ROR of $1.50 to $3.00 for every dollar invested
� A 20-percent tree canopy over a house results in annual cooling savings of 8 to
18% and annual heating savings of 2 to 8% � The value of street trees in Washington, DC are estimated at nearly $10.7 million
annually for all benefits
� In Houston, Texas trees provide $1.3 billion in stormwater benefits (based on $0.66 /cubic foot of storage)
� The value from urban forestry in Chicago totals $2.3 billion with total carbon
sequestration rate of 25,200 tons/year equivalent valued $14.8 million/year
� In 2005, total carbon storage in urban trees in the US was approximately 700 million tons with net rate sequestration estimated at around 24 million tons per year (88.5 million tons CO2equivalent).
The Value of Green Infrastructure for Urban Climate Adaptation
vi
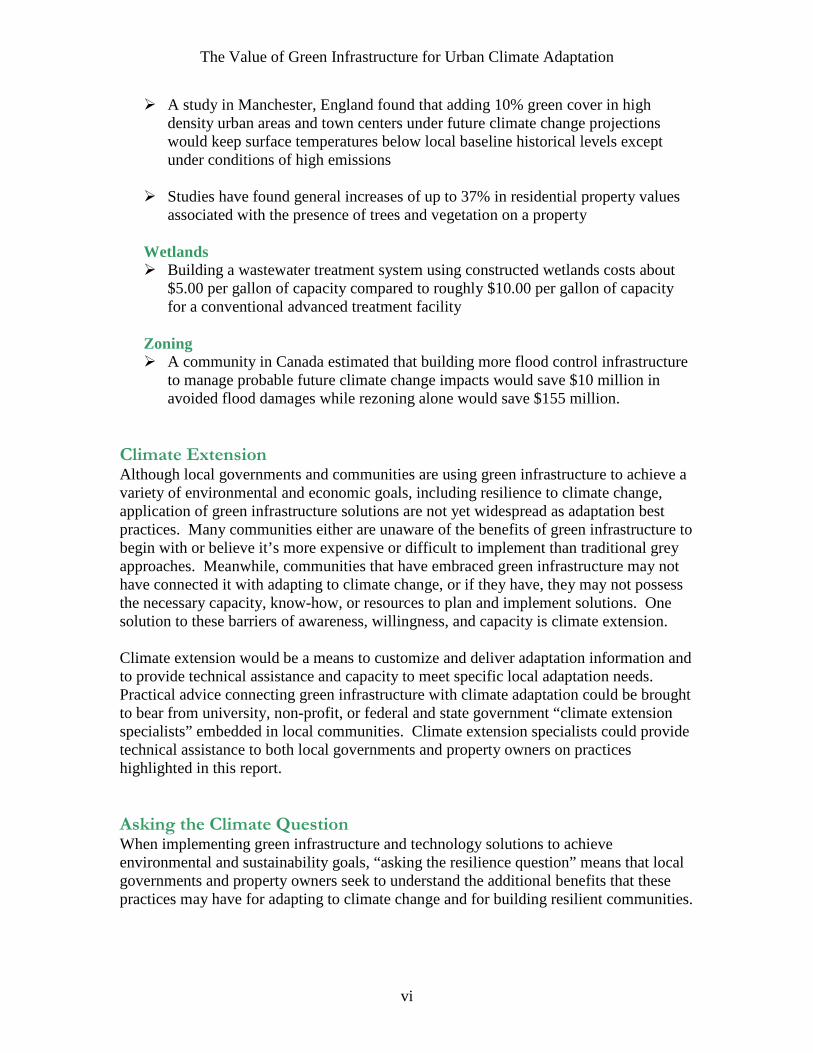
� A study in Manchester, England found that adding 10% green cover in high density urban areas and town centers under future climate change projections would keep surface temperatures below local baseline historical levels except under conditions of high emissions
� Studies have found general increases of up to 37% in residential property values
associated with the presence of trees and vegetation on a property
Wetlands � Building a wastewater treatment system using constructed wetlands costs about
$5.00 per gallon of capacity compared to roughly $10.00 per gallon of capacity for a conventional advanced treatment facility
Zoning � A community in Canada estimated that building more flood control infrastructure
to manage probable future climate change impacts would save $10 million in avoided flood damages while rezoning alone would save $155 million.
Climate Extension Although local governments and communities are using green infrastructure to achieve a variety of environmental and economic goals, including resilience to climate change, application of green infrastructure solutions are not yet widespread as adaptation best practices. Many communities either are unaware of the benefits of green infrastructure to begin with or believe it’s more expensive or difficult to implement than traditional grey approaches. Meanwhile, communities that have embraced green infrastructure may not have connected it with adapting to climate change, or if they have, they may not possess the necessary capacity, know-how, or resources to plan and implement solutions. One solution to these barriers of awareness, willingness, and capacity is climate extension. Climate extension would be a means to customize and deliver adaptation information and to provide technical assistance and capacity to meet specific local adaptation needs. Practical advice connecting green infrastructure with climate adaptation could be brought to bear from university, non-profit, or federal and state government “climate extension specialists” embedded in local communities. Climate extension specialists could provide technical assistance to both local governments and property owners on practices highlighted in this report. Asking the Climate Question When implementing green infrastructure and technology solutions to achieve environmental and sustainability goals, “asking the resilience question” means that local governments and property owners seek to understand the additional benefits that these practices may have for adapting to climate change and for building resilient communities.
The Value of Green Infrastructure for Urban Climate Adaptation
vii
At the intersection of sustainability, smart growth, and climate adaptation is a desire for more resilient communities that are less vulnerable to natural and human induced hazards and disasters. Diversity, flexibility, sustainability, adaptability, self-organization, and the ability to evolve and learn are seen as key system attributes of community resilience. In the face of climate change, adaptive capacity is seen as encompassing resilience focusing more comprehensively on planning, preparing, and implementing adaptive solutions. “Asking the resilience question”—means that local planning and building decisions need to incorporate how to prepare for and manage impacts from climate change and weather extremes—essentially “mainstreaming” resilience by enhancing adaptive capacity.
The Value of Green Infrastructure for Urban Climate Adaptation
1
THE VALUE OF GREEN INFRASTRUCTURE
FOR URBAN CLIMATE ADAPTATION
“Urban systems provide ideal laboratories for understanding resiliency and for developing dual-use technologies, practices, and systems that provide value even
if no negative events occur.”1 Over the coming century, climate change scenarios project that urban regions will be expected to manage extremes of precipitation and temperature, increased storm frequency and intensity, and sea-level rise. Increases in problems with which urban areas are already coping may be indicating–or at least mimicking – that climate change impacts are already occurring and are likely to worsen in the future.2 In practice, these impacts will mean coping with:
• Longer and hotter heat waves • Increased urban heat island (UHI) impacts such as heat related illness and higher
cooling demand and costs • More damaging storms and storm surges • Greater river flooding • Increased frequency and intensity of combined sewer overflows (CSOs) • More intense and extended duration of droughts • Longer water supply shortages, and • Declines in local ecosystem services, such as the loss of coastal wetlands that
buffer communities against hurricanes. The associated impacts on buildings, water and transportation infrastructure, emergency preparedness, planning, quality of life, and effective management of these stresses are only now being considered. For example, among CCAPs Urban Leaders partners: � Chicago expects an increase in days at or above 90°F from 15 days to 66 days per
year under projected high rates of greenhouse gas emissions and an additional 30 days over 100°F. Overall, heat waves are projected to be longer, more frequent, and more intense with associated increases on public health impacts, including mortality. The frequency of rainfall events delivering more than 2.5 inches in 24 hours are also projected to increase, accompanied by associated changes in flood risks and the need for improved stormwater management.3
1Brad Allenby and Jonathan Fink, “Toward Inherently Secure and Resilient Societies” (12 August 2005) Vol. 309 SCIENCE MAGAZINE, pages 1034-36 (American Academy for the Advancement of Science) 2EPA Reducing Urban Heat Islands: Compendium of Strategies (October 2008): Urban Heat Island Basics <http://www.epa.gov/heatisld/resources/compendium.htm> 3Chicago Climate Change Action Plan-Climate Change and Chicago: Projections and Potential Impacts, Executive Summary (May 18, 2008). Convening Lead Authors: Katharine Hayhoe, Texas Tech University; Donald Wuebbles, University of Illinois at Urbana-Champaign: http://www.chicagoclimateaction.org/pages/research___reports/8.php
The Value of Green Infrastructure for Urban Climate Adaptation
2
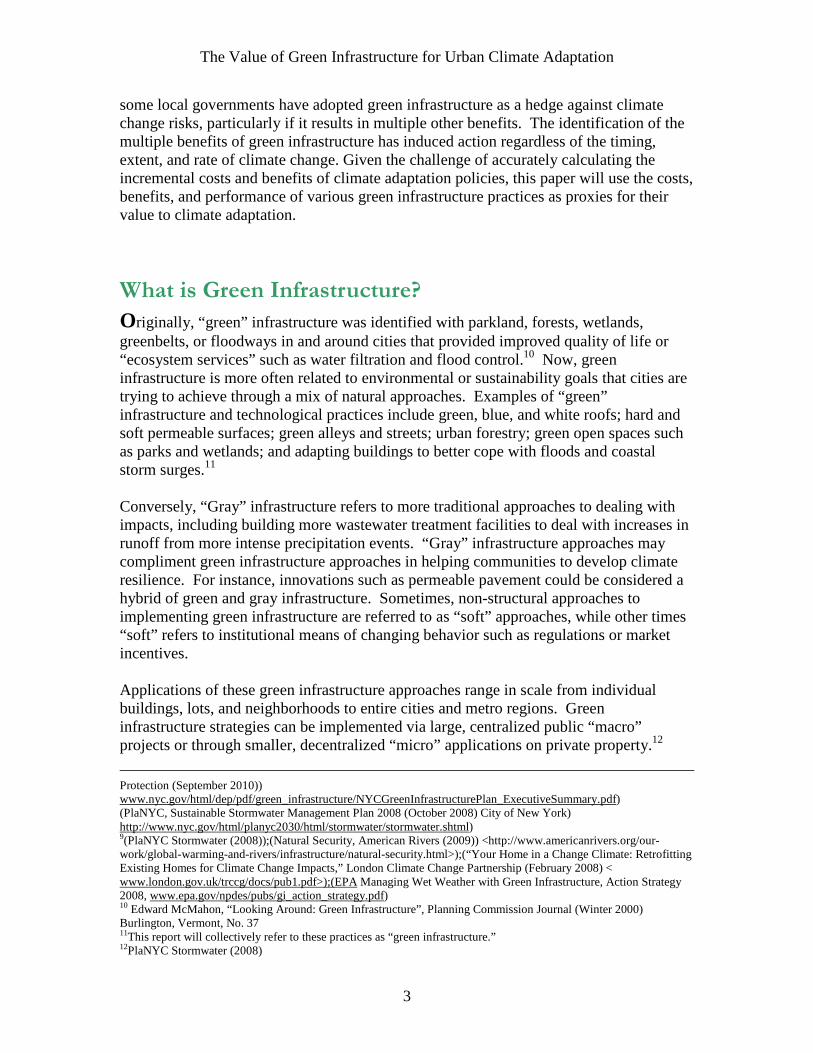
� In Toronto, during particularly intense rainfall in August 2005, a storm washed out part of Finch Avenue and caused flash flooding to creeks, rivers and ravines, eroding stream-banks and damaging trees and parks. More than 4,200 basements were flooded. The damage to public and private property was estimated at $400-500 million – the most expensive storm in Toronto’s history. The Finch Avenue washout alone cost $40 million to repair. Although this specific event cannot be attributed directly to climate change, Toronto is preparing for more of these kinds of storms as climate change threatens to increase the frequency of intense rain events.4
� As a low-lying coastal community, Miami-Dade County is particularly vulnerable to
the potential impacts of sea-level rise, higher storm surge, and more frequent and intense hurricanes. According to a recent study, Miami currently is ranked first out of 20 cities in the world in total assets exposed to coastal flooding during a 1 in 100 year storm surge. Miami’s current exposed asset value is estimated at over $416 billion, and this is projected to increase to over $3.5 trillion by the 2070s.5
Characteristics of a resilient urban system are its ability to bounce back from impacts which may include elements of flexibility, diversity, sustainability, adaptability, self-organization, self-sufficiency, and learning.6 However, community resilience and climate adaptation are difficult to assign value, given uncertainties about future climate impacts and the subsequent difficulty in knowing when a community is adequately “adapted.” Multiple goal, no-regrets policies centered on “green-infrastructure” can offer measureable benefits regardless of how climate changes. In recent thinking, when combined with conventional “grey” infrastructure development activities, portfolios of “green” technologies and infrastructure have been indentified as ‘best practices’ at the local level for achieving greater urban sustainability and resilience.7 In addition, green infrastructure is now being recognized for its value as a means for adapting to the emerging and irreversible impacts of climate change.8,9 Consequently,
4Ahead of the Storm: Preparing Toronto for Climate Change, Development of a Climate Change Adaptation Strategy, REPORT, April 18, 2008: http://www.toronto.ca/teo/adaptation.htm 5Climate Change Advisory Task Force (CCATF) Initial Recommendations (April 2008) http://www.miamidade.gov/derm/climatechange/taskforce.asp 6Richard Klein, Robert Nichols, Frank Thomalla, “Resilience to natural hazards: How useful is this concept?” Environmental Hazards 5 (2003) 35-45 <http://www.sciencedirect.com/science?_ob=ArticleURL&_udi=B6VPC-4CBW8SR-1&_user=10&_coverDate=12%2F31%2F2003&_rdoc=1&_fmt=high&_orig=search&_origin=search&_sort=d&_docanchor=&view=c&_searchStrId=1580151226&_rerunOrigin=google&_acct=C000050221&_version=1&_urlVersion=0&_userid=10&md5=65767ac9a548f79b3e7ad867eee1dac6&searchtype=a> 7For purposes of this report: “grey” infrastructure are conventional storage structures (reservoirs, detention ponds) and conveyances (pipes, canals) used to manage drinking, sewer, or storm water usually constructed of concrete or metal; also including streets, roads, bridges, and buildings that do no incorporate technologies intended to achieve environmental goals. “Green Infrastructure” are technologies implemented to achieve specific environmental goals typically using natural vegetated materials but also innovative “grey” materials (e.g. permeable pavement, white roofs) 8Green Infrastructure (GI) practices, particularly for storm-water management, are considered synonymous with Low Impact Development (LID), Sustainable Urban Drainage Systems (SUDS), Stormwater Source Controls (SSCs), and Best Management Practices (BMPs). This report will collectively refer to these practices as “green infrastructure.” (“NYC Green Infrastructure Plan: A Sustainable Strategy for Clean Waterways” (Department of Environmental
The Value of Green Infrastructure for Urban Climate Adaptation
3
some local governments have adopted green infrastructure as a hedge against climate change risks, particularly if it results in multiple other benefits. The identification of the multiple benefits of green infrastructure has induced action regardless of the timing, extent, and rate of climate change. Given the challenge of accurately calculating the incremental costs and benefits of climate adaptation policies, this paper will use the costs, benefits, and performance of various green infrastructure practices as proxies for their value to climate adaptation.
What is Green Infrastructure?
Originally, “green” infrastructure was identified with parkland, forests, wetlands, greenbelts, or floodways in and around cities that provided improved quality of life or “ecosystem services” such as water filtration and flood control.10 Now, green infrastructure is more often related to environmental or sustainability goals that cities are trying to achieve through a mix of natural approaches. Examples of “green” infrastructure and technological practices include green, blue, and white roofs; hard and soft permeable surfaces; green alleys and streets; urban forestry; green open spaces such as parks and wetlands; and adapting buildings to better cope with floods and coastal storm surges.11 Conversely, “Gray” infrastructure refers to more traditional approaches to dealing with impacts, including building more wastewater treatment facilities to deal with increases in runoff from more intense precipitation events. “Gray” infrastructure approaches may compliment green infrastructure approaches in helping communities to develop climate resilience. For instance, innovations such as permeable pavement could be considered a hybrid of green and gray infrastructure. Sometimes, non-structural approaches to implementing green infrastructure are referred to as “soft” approaches, while other times “soft” refers to institutional means of changing behavior such as regulations or market incentives. Applications of these green infrastructure approaches range in scale from individual buildings, lots, and neighborhoods to entire cities and metro regions. Green infrastructure strategies can be implemented via large, centralized public “macro” projects or through smaller, decentralized “micro” applications on private property.12
Protection (September 2010)) www.nyc.gov/html/dep/pdf/green_infrastructure/NYCGreenInfrastructurePlan_ExecutiveSummary.pdf) (PlaNYC, Sustainable Stormwater Management Plan 2008 (October 2008) City of New York) http://www.nyc.gov/html/planyc2030/html/stormwater/stormwater.shtml) 9(PlaNYC Stormwater (2008));(Natural Security, American Rivers (2009)) <http://www.americanrivers.org/our-work/global-warming-and-rivers/infrastructure/natural-security.html>);(“Your Home in a Change Climate: Retrofitting Existing Homes for Climate Change Impacts,” London Climate Change Partnership (February 2008) < www.london.gov.uk/trccg/docs/pub1.pdf>);(EPA Managing Wet Weather with Green Infrastructure, Action Strategy 2008, www.epa.gov/npdes/pubs/gi_action_strategy.pdf) 10 Edward McMahon, “Looking Around: Green Infrastructure”, Planning Commission Journal (Winter 2000) Burlington, Vermont, No. 37 11This report will collectively refer to these practices as “green infrastructure.” 12PlaNYC Stormwater (2008)
The Value of Green Infrastructure for Urban Climate Adaptation
4
Therefore, the benefits of green infrastructure can be measured at the building or site level such that the individual owners reap the private benefits or, if spread across many private owners, the benefits can be aggregated to an entire community, city, county, region, or even nation. However, to achieve these benefits of scale there must be coordinated implementation across a broader area involving multiple parties to reach certain critical levels of participation. Consequently, community-level, rather than individual-level implementation of green infrastructure particularly helps local governments to achieve environmental, sustainability, and adaptation goals within their jurisdictions.
The climate adaptation benefits of green infrastructure are generally related to its ability to moderate the expected increases in extreme precipitation or temperature. Benefits include better management of storm-water runoff, lowering incidents of combined storm and sewer overflows (CSOs), water capture and conservation, flood prevention, accommodation of natural hazards (e.g., relocating out of floodplains), reduced ambient temperatures and urban heat island (UHI) effects, and defense against sea level rise (with potential of storm-surge protection measures). The U.S. Environmental Protection Agency (EPA) has also identified green infrastructure as a contributor to improving human health and air quality, lowering energy demand, reducing capital cost savings, increasing carbon storage, expanding wildlife habitat and recreational space, and even increasing land-values by up to 30%.13 Given the above benefits, green infrastructure approaches help to achieve sustainability and resilience goals over a range of outcomes, in addition to climate adaptation. The value of green infrastructure is calculated by comparing the costs of green practices to “hard” infrastructure alternatives, the value of avoided damages, or market preferences that enhance value, like property value.14 Green infrastructure benefits generally can be divided into five categories of environmental protection: (1) Land-value, (2) Quality of life, (3) Public health, (4) Hazard mitigation, and (5) Regulatory compliance.15 Green technologies and infrastructure solutions are often implemented with a single goal in mind, such as managing storm-water or reducing local ambient heat, and the costs and benefits are often evaluated in the same way. However, their full net-benefit can only be realized by a comprehensive accounting of their multiple benefits. For example, trees filter water, slow runoff, cool local and regional urban heat effects, and clean air.
13EPA Wet Weather (2008) 14S. Wise et al, Integrating Valuation Methods to Recognize Green Infrastructure's Multiple Benefits, Center for Neighborhood Technology (CNT), Chicago, April 2010 (http://www.cnt.org/repository/CNT-LID-paper.pdf) 15(EPA “Reducing Stormwater Costs through Low Impact Development (LID) Strategies and Practices, December 2007 <http://www.epa.gov/owow/NPS/lid/costs07/documents/reducingstormwatercosts.pdf>);(Natural Security, American Rivers (2009))
The Value of Green Infrastructure for Urban Climate Adaptation
5
Additionally, some adaptation practices provide co-benefits to climate mitigation goals by helping to reduce greenhouse gas emissions. For example, trees absorb and store carbon and can provide shade that reduces man-made cooling needs and hence electricity demand. Consequently, when implementing green infrastructure and technology solutions to achieve environmental and sustainability goals, “asking the resilience question” means that local governments and property owners seek to understand the additional benefits that these practices may have for adapting to climate change and for building resilient communities. The following sections explore the costs, performance and benefits of various types of green infrastructure practices.
Eco-Roofs
In terms of climate adaptation, eco-roofs are generally installed to respond to two primary climate drivers–extreme precipitation and temperature. There are three main types of eco-roofs: Green roofs (vegetated), white roofs (cooling), and blue roofs (water managing). Green, blue, and white roofs have distinct and overlapping benefits compared to typical “black” roofs meant solely to provide shelter. Communities or building owners with limited budgets, who are primarily interested in energy savings or reducing peak energy demand, generally focus on cool roofs. Those who can consider life-cycle costs and public benefits, and who are interested in broader environmental impacts (particularly improving storm-water management) may choose to install green roofs. Sustainability leaders, such as Chicago and New York City, recognize the value and opportunity for both cool and green roof technologies and are supporting efforts to encourage both options.16 Eco-roofs are usually established to achieve additional environmental and sustainability goals, including:
• Water conservation • Storm-water runoff and water quality management • Local and regional cooling • Aesthetic value • Electricity savings • Habitat provision for wildlife • Carbon absorption
There are three primary types of eco-roofs: Green roofs, White roofs and blue roofs. The next sections will describe the properties, costs and benefits associated with each type of eco-roof. 16EPA Reducing Urban Heat Islands: Compendium of Strategies (October 2008): Green Roofs < http://www.epa.gov/heatisld/resources/compendium.htm>
The Value of Green Infrastructure for Urban Climate Adaptation
6
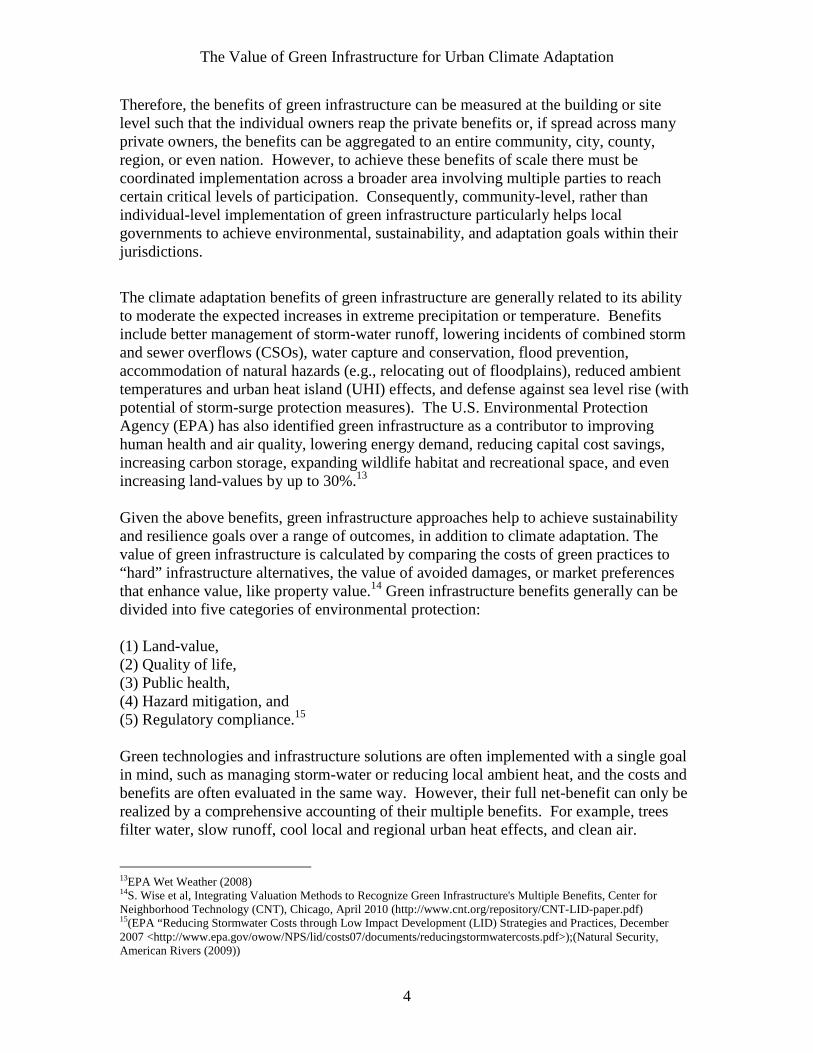
Green Roofs–One Solution, Multiple Benefits Green (vegetated) roofs are partially or completely covered with plants or trees appropriate to the local climate which grow in 3-15 inches of soil, sand, or gravel planted over a waterproof membrane. They also may include additional layers such as root barriers, drainage nets, or irrigation systems. Vegetation may be planted modularly in trays for ease of maintenance or on soil spread across the roof. Roofs may need to be structurally reinforced when built to support the extra weight. Older buildings can be retrofitted for this purpose unless they have already reinforced for other reasons. Green roofs can be either intensive (80-100 lbs. per sq. ft.) or extensive (15-50 lbs. per sq. ft.). Extensive roofs typically have aesthetic goals and are grown on shallower surface material costing from $6-43 per square foot to install.17 Intensive roofs are installed at $20-85 per square foot and use deeper soil and hardier plants that better tolerate a variety of water conditions. Annual maintenance costs for vegetated roofs vary greatly depending on the nature of the roof, climate conditions, and local labor rates, but experience shows annual costs are 2-3% of construction per year after vegetation has been established.18 Green roofs also protect the underlying roofing material from wind damage, UV rays, and regulate temperature impacts by as much as 21°C, increasing roof life-spans by 2-3 times and achieving associated life cycle cost savings.19 Green roofs can reduce annual stormwater run-off by 50-60% on average, including peak runoff.20 Vegetated roofs control between 30-90% of the volume and rate of stormwater runoff, detaining 90% of volume for storms less than one inch and at least 30% for larger storms.21 Intensive roofs are approximately twice as good at runoff management as extensive roofs. Seasonal and physiological evapotranspiration rates for
17A typical flat black roof costs $2.50-3.50 per square foot. The 4 Kinds of Flat Roofs (This Old House Website). http://www.thisoldhouse.com/toh/article/0,,1110914,00.html 18PlaNYC Stormwater (2008) 19National Institute of Building Sciences website, Extensive Green Roof – Definition <http://www.wbdg.org/resources/greenroofs.php> 20Green Roof: Final Presentation, Gateway Team, Columbia University Green Roof Project Submission Date (July 26, 2007) <http://community.seas.columbia.edu/cslp/reports/summer07/greenroofGreen_roof_final_pdr.pdf> 21RETENTION temporarily holds or slows stormwater releases from a site—primarily to delay peak flows. DETENTION holds storm-water on-site until it can be released or reused on-site
Figure 1: Structure of a Green Roof (Source: heatusa.com)
The Value of Green Infrastructure for Urban Climate Adaptation
7
plants also impact effectiveness of runoff control, with summer growing season being better than winter. Up to 85% of some water nutrient pollutants can be captured by intensive green roofs once established. These characteristics have tangible benefits for urban communities. Washington, DC has estimated that installation of green-roofs on most eligible buildings could yield a 6-15% reduction in the number of combined sewer overflows into local rivers, with CSO water volume reductions of up to 26%.22 Additionally, in New York City installing one 40-square-foot green roof could result in 810 gallons of stormwater captured per roof per year. If each installation cost $1,000 then a $100,000 dollar investment could lead to over 81,000 gallons of stormwater captured, according to a recent study by Riverkeepers.23 A green roof can also filter air pollutants, including particulate matter (PM) and gaseous pollutants such as nitrogen oxide (NOX), sulfur dioxide (SO2), carbon monoxide (CO), and ground-level ozone (O3). Researchers estimate that a 1,000-square foot green roof can remove about 40 pounds of PM from the air annually while also producing oxygen and removing carbon dioxide (CO2).
Forty pounds of PM is roughly equivalent to the
annual emissions of 15 passenger cars. The temperature benefits of green roofs extend to climate change mitigation as well. Vegetation and the growing medium on green roofs also can store carbon. Modeling has determined that green roofs may reduce building energy use for electricity consumption by 2 - 6% over conventional roofs, particularly for summer cooling.24 One study estimated carbon sequestration at 375 grams per square meter for green roofs. However, because many of the plants are small and the growing medium layer is relatively thin, green roofs tend not to have as large a carbon storage capacity as trees or urban forests.25 One of the greatest benefits of green roofs is their ability to combat the urban heat island effect. Green roofs in some cases reduce surface temperature by 30-60°C and ambient temperature by 5°C, compared to conventional black roofs. A study in Portland calculated that a neighborhood with 100% green roofs could reduce heat island effects by 50-90%. Additionally, studies of New York City and Toronto estimate that a 0.4°C reduction in the regional UHI effect can be achieved with installation of green roofs on only 50% eligible roofs across the entire city. Similarly, an Environment Canada study determined that greening 6% of available roof space in Toronto would reduce summer temperatures by 1°C to 2°C overall.26 In terms of quality of life improvements, the inclusion of green roofs in a city landscape has been shown to reduce noise pollution by 2 – 8 decibels. 27
22PlaNYC Stormwater (2008) 23PlaNYC, Water Quality Initiatives website <http://www.nyc.gov/html/planyc2030/html/plan/water_quality-green-roofs.shtml> 24CNT Multiple Benefits (April 2010) 25EPA Heat Islands Compendium (October 2008): Green Roofs 26Time to Tackle Toronto’s Warming Climate change adaptation options to deal with heat in Toronto, Eva Ligeti, Clean Air Partnership (2007) <www.cleanairpartnership.org/pdf/time_to_tackle_toronto_warming.pdf> 27CNT Multiple Benefits (April 2010)
The Value of Green Infrastructure for Urban Climate Adaptation
8
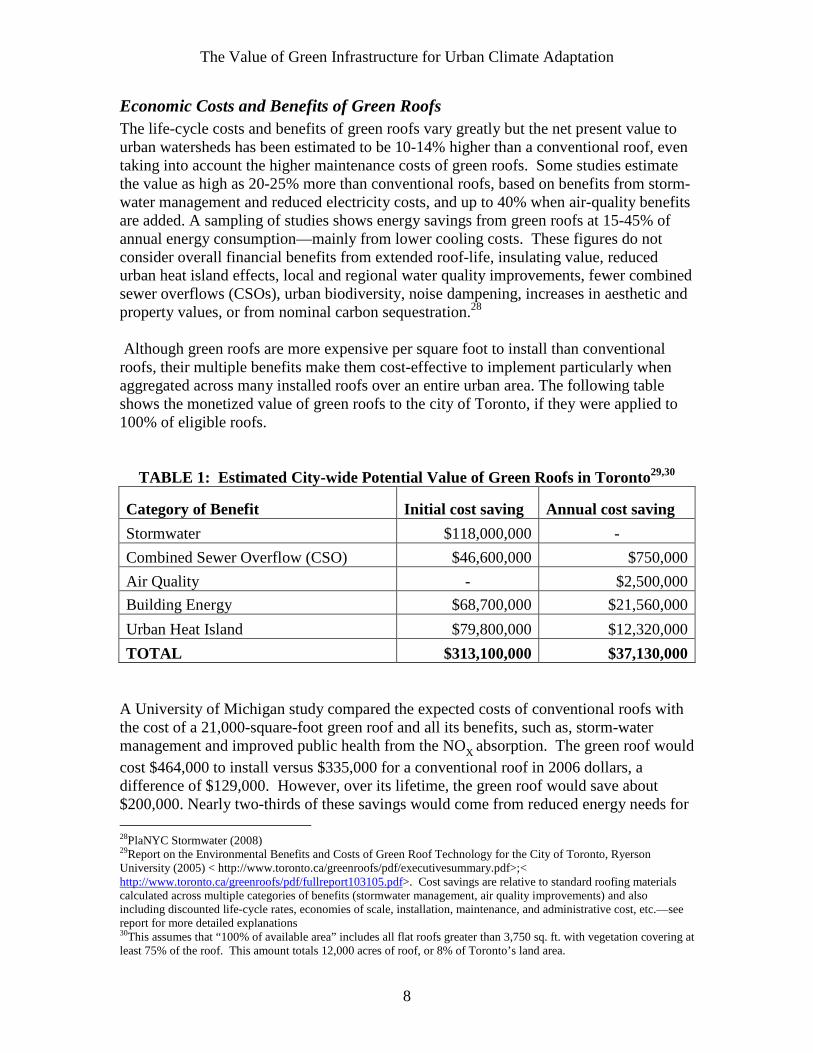
Economic Costs and Benefits of Green Roofs The life-cycle costs and benefits of green roofs vary greatly but the net present value to urban watersheds has been estimated to be 10-14% higher than a conventional roof, even taking into account the higher maintenance costs of green roofs. Some studies estimate the value as high as 20-25% more than conventional roofs, based on benefits from storm-water management and reduced electricity costs, and up to 40% when air-quality benefits are added. A sampling of studies shows energy savings from green roofs at 15-45% of annual energy consumption—mainly from lower cooling costs. These figures do not consider overall financial benefits from extended roof-life, insulating value, reduced urban heat island effects, local and regional water quality improvements, fewer combined sewer overflows (CSOs), urban biodiversity, noise dampening, increases in aesthetic and property values, or from nominal carbon sequestration.28 Although green roofs are more expensive per square foot to install than conventional roofs, their multiple benefits make them cost-effective to implement particularly when aggregated across many installed roofs over an entire urban area. The following table shows the monetized value of green roofs to the city of Toronto, if they were applied to 100% of eligible roofs.
TABLE 1: Estimated City-wide Potential Value of Green Roofs in Toronto29,30
Category of Benefit Initial cost saving Annual cost saving
Stormwater $118,000,000 -
Combined Sewer Overflow (CSO) $46,600,000 $750,000
Air Quality - $2,500,000
Building Energy $68,700,000 $21,560,000
Urban Heat Island $79,800,000 $12,320,000
TOTAL $313,100,000 $37,130,000 A University of Michigan study compared the expected costs of conventional roofs with the cost of a 21,000-square-foot green roof and all its benefits, such as, storm-water management and improved public health from the NOX absorption. The green roof would cost $464,000 to install versus $335,000 for a conventional roof in 2006 dollars, a difference of $129,000. However, over its lifetime, the green roof would save about $200,000. Nearly two-thirds of these savings would come from reduced energy needs for 28PlaNYC Stormwater (2008) 29Report on the Environmental Benefits and Costs of Green Roof Technology for the City of Toronto, Ryerson University (2005) < http://www.toronto.ca/greenroofs/pdf/executivesummary.pdf>;< http://www.toronto.ca/greenroofs/pdf/fullreport103105.pdf>. Cost savings are relative to standard roofing materials calculated across multiple categories of benefits (stormwater management, air quality improvements) and also including discounted life-cycle rates, economies of scale, installation, maintenance, and administrative cost, etc.—see report for more detailed explanations 30This assumes that “100% of available area” includes all flat roofs greater than 3,750 sq. ft. with vegetation covering at least 75% of the roof. This amount totals 12,000 acres of roof, or 8% of Toronto’s land area.
The Value of Green Infrastructure for Urban Climate Adaptation
9
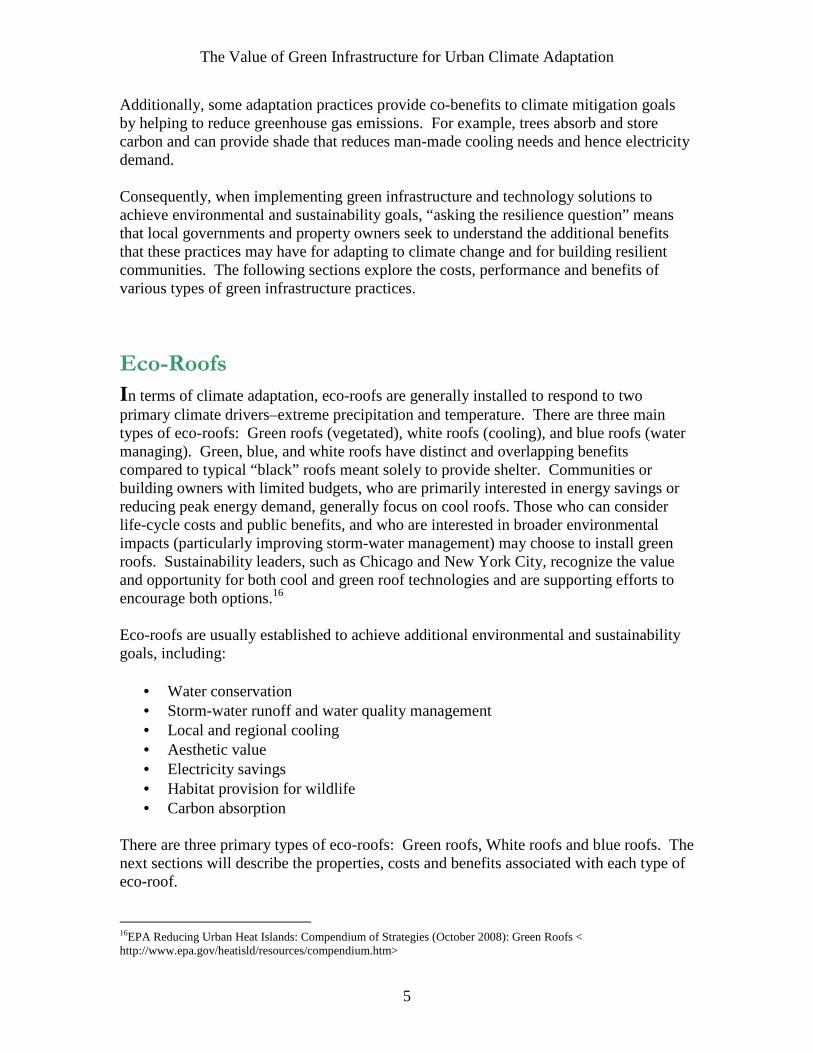
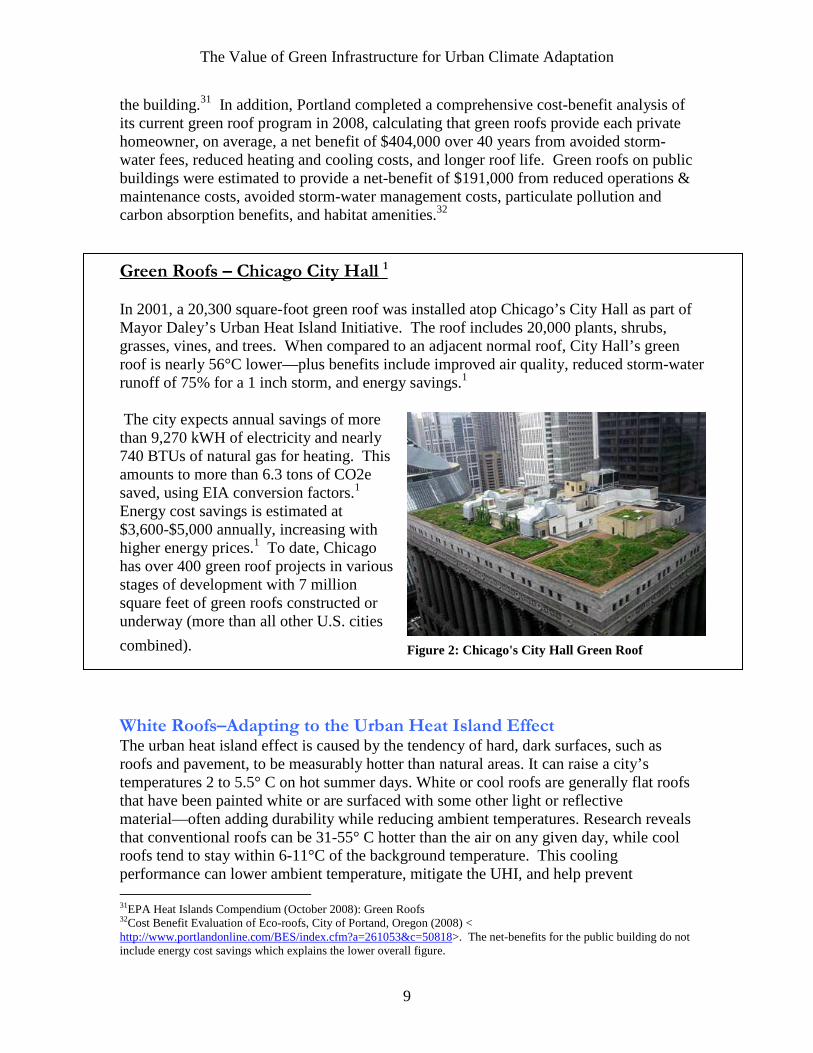
the building.31 In addition, Portland completed a comprehensive cost-benefit analysis of its current green roof program in 2008, calculating that green roofs provide each private homeowner, on average, a net benefit of $404,000 over 40 years from avoided storm-water fees, reduced heating and cooling costs, and longer roof life. Green roofs on public buildings were estimated to provide a net-benefit of $191,000 from reduced operations & maintenance costs, avoided storm-water management costs, particulate pollution and carbon absorption benefits, and habitat amenities.32 Green Roofs – Chicago City Hall 1 In 2001, a 20,300 square-foot green roof was installed atop Chicago’s City Hall as part of Mayor Daley’s Urban Heat Island Initiative. The roof includes 20,000 plants, shrubs, grasses, vines, and trees. When compared to an adjacent normal roof, City Hall’s green roof is nearly 56°C lower—plus benefits include improved air quality, reduced storm-water runoff of 75% for a 1 inch storm, and energy savings.1 The city expects annual savings of more than 9,270 kWH of electricity and nearly 740 BTUs of natural gas for heating. This amounts to more than 6.3 tons of CO2e saved, using EIA conversion factors.1 Energy cost savings is estimated at $3,600-$5,000 annually, increasing with higher energy prices.1 To date, Chicago has over 400 green roof projects in various stages of development with 7 million square feet of green roofs constructed or underway (more than all other U.S. cities
combined). White Roofs–Adapting to the Urban Heat Island Effect The urban heat island effect is caused by the tendency of hard, dark surfaces, such as roofs and pavement, to be measurably hotter than natural areas. It can raise a city’s temperatures 2 to 5.5° C on hot summer days. White or cool roofs are generally flat roofs that have been painted white or are surfaced with some other light or reflective material—often adding durability while reducing ambient temperatures. Research reveals that conventional roofs can be 31-55° C hotter than the air on any given day, while cool roofs tend to stay within 6-11°C of the background temperature. This cooling performance can lower ambient temperature, mitigate the UHI, and help prevent 31EPA Heat Islands Compendium (October 2008): Green Roofs 32Cost Benefit Evaluation of Eco-roofs, City of Portand, Oregon (2008) < http://www.portlandonline.com/BES/index.cfm?a=261053&c=50818>. The net-benefits for the public building do not include energy cost savings which explains the lower overall figure.
Figure 2: Chicago's City Hall Green Roof
The Value of Green Infrastructure for Urban Climate Adaptation
10
mortality during heat waves.33 White vinyl roofs are the most reflective common material used, reflecting 80% of the sun’s rays compared to only 6% reflection on a conventional black roof and avoiding 70% of the heat absorption experienced on black roofs. Some coatings can reach even higher levels of reflectivity.34
Economic Costs and Benefits of White Roofs The cost of white roofs is comparable to that of conventional roofs, costing between $0.20 and $6.0 per square foot to install.35 Energy savings from cool roofs result in monetary savings from reduced cooling costs, varying from 10-70% in total energy use savings per building. Additionally, reductions in the peak demand for cooling energy range from 14-38% after installation. A study of 11 US cities determined that the average net cost savings from reduced energy consumption reached $0.22 per square foot of installed cool roof per year.36
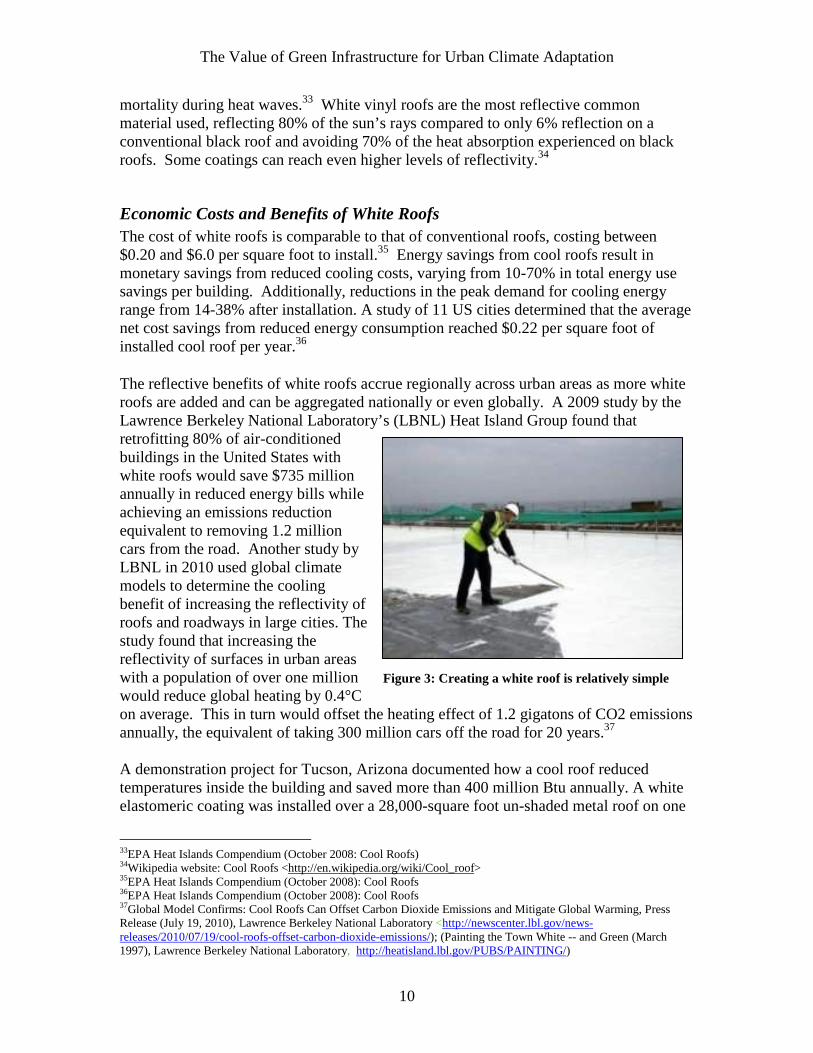
The reflective benefits of white roofs accrue regionally across urban areas as more white roofs are added and can be aggregated nationally or even globally. A 2009 study by the Lawrence Berkeley National Laboratory’s (LBNL) Heat Island Group found that retrofitting 80% of air-conditioned buildings in the United States with white roofs would save $735 million annually in reduced energy bills while achieving an emissions reduction equivalent to removing 1.2 million cars from the road. Another study by LBNL in 2010 used global climate models to determine the cooling benefit of increasing the reflectivity of roofs and roadways in large cities. The study found that increasing the reflectivity of surfaces in urban areas with a population of over one million would reduce global heating by 0.4°C on average. This in turn would offset the heating effect of 1.2 gigatons of CO2 emissions annually, the equivalent of taking 300 million cars off the road for 20 years.37 A demonstration project for Tucson, Arizona documented how a cool roof reduced temperatures inside the building and saved more than 400 million Btu annually. A white elastomeric coating was installed over a 28,000-square foot un-shaded metal roof on one
33EPA Heat Islands Compendium (October 2008: Cool Roofs) 34Wikipedia website: Cool Roofs <http://en.wikipedia.org/wiki/Cool_roof> 35EPA Heat Islands Compendium (October 2008): Cool Roofs 36EPA Heat Islands Compendium (October 2008): Cool Roofs 37Global Model Confirms: Cool Roofs Can Offset Carbon Dioxide Emissions and Mitigate Global Warming, Press Release (July 19, 2010), Lawrence Berkeley National Laboratory <http://newscenter.lbl.gov/news-releases/2010/07/19/cool-roofs-offset-carbon-dioxide-emissions/); (Painting the Town White -- and Green (March 1997), Lawrence Berkeley National Laboratory, http://heatisland.lbl.gov/PUBS/PAINTING/)
Figure 3: Creating a white roof is relatively simple
The Value of Green Infrastructure for Urban Climate Adaptation
11
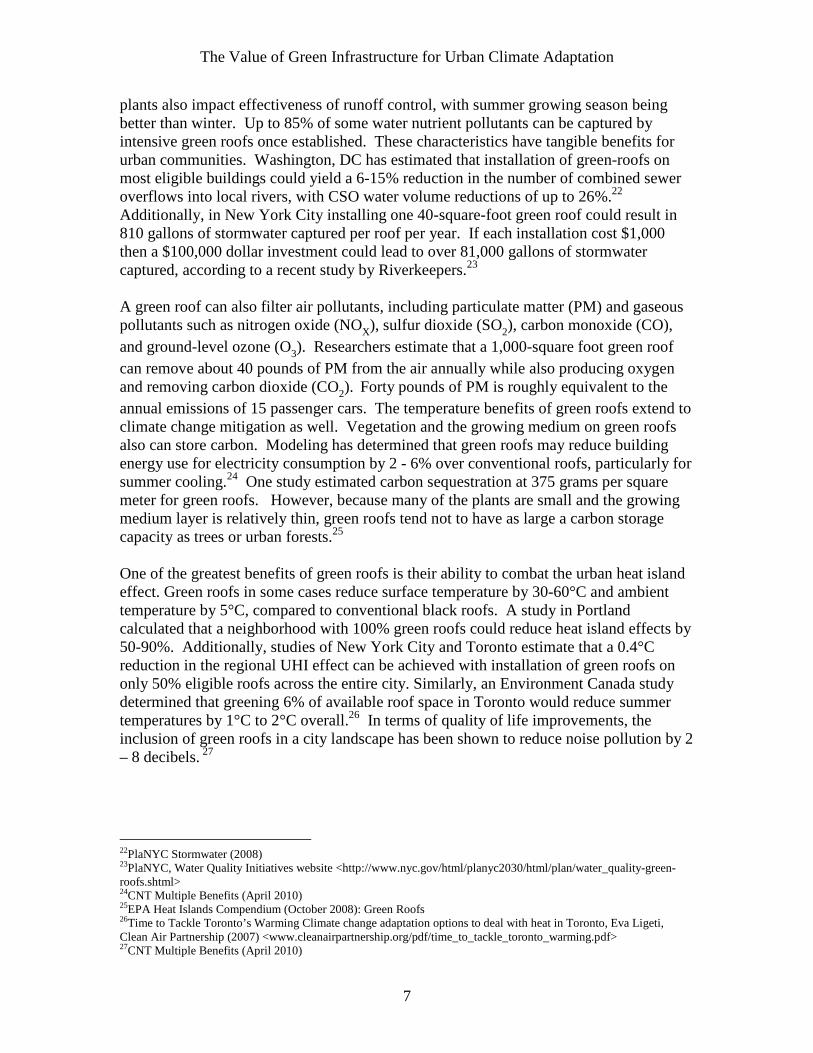
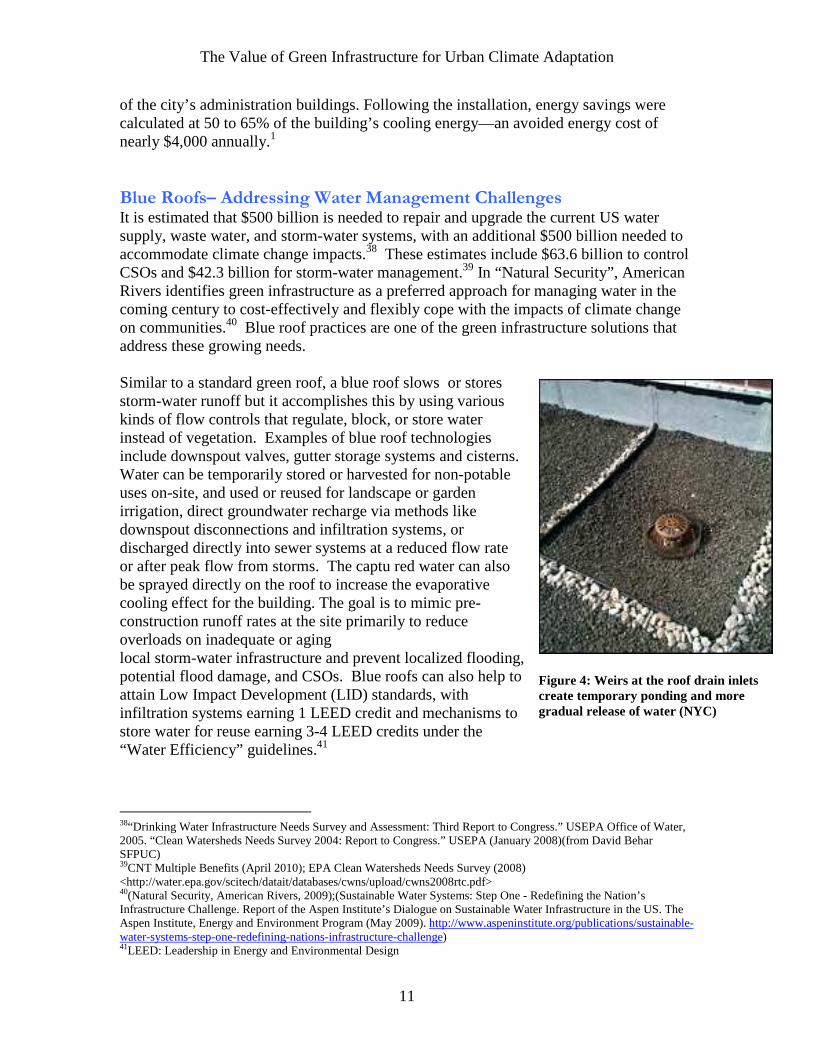
of the city’s administration buildings. Following the installation, energy savings were calculated at 50 to 65% of the building’s cooling energy—an avoided energy cost of nearly $4,000 annually.1 Blue Roofs– Addressing Water Management Challenges It is estimated that $500 billion is needed to repair and upgrade the current US water supply, waste water, and storm-water systems, with an additional $500 billion needed to accommodate climate change impacts.38 These estimates include $63.6 billion to control CSOs and $42.3 billion for storm-water management.39 In “Natural Security”, American Rivers identifies green infrastructure as a preferred approach for managing water in the coming century to cost-effectively and flexibly cope with the impacts of climate change on communities.40 Blue roof practices are one of the green infrastructure solutions that address these growing needs. Similar to a standard green roof, a blue roof slows or stores storm-water runoff but it accomplishes this by using various kinds of flow controls that regulate, block, or store water instead of vegetation. Examples of blue roof technologies include downspout valves, gutter storage systems and cisterns. Water can be temporarily stored or harvested for non-potable uses on-site, and used or reused for landscape or garden irrigation, direct groundwater recharge via methods like downspout disconnections and infiltration systems, or discharged directly into sewer systems at a reduced flow rate or after peak flow from storms. The captu red water can also be sprayed directly on the roof to increase the evaporative cooling effect for the building. The goal is to mimic pre-construction runoff rates at the site primarily to reduce overloads on inadequate or aging local storm-water infrastructure and prevent localized flooding, potential flood damage, and CSOs. Blue roofs can also help to attain Low Impact Development (LID) standards, with infiltration systems earning 1 LEED credit and mechanisms to store water for reuse earning 3-4 LEED credits under the “Water Efficiency” guidelines.41
38“Drinking Water Infrastructure Needs Survey and Assessment: Third Report to Congress.” USEPA Office of Water, 2005. “Clean Watersheds Needs Survey 2004: Report to Congress.” USEPA (January 2008)(from David Behar SFPUC) 39CNT Multiple Benefits (April 2010); EPA Clean Watersheds Needs Survey (2008) <http://water.epa.gov/scitech/datait/databases/cwns/upload/cwns2008rtc.pdf> 40(Natural Security, American Rivers, 2009);(Sustainable Water Systems: Step One - Redefining the Nation’s Infrastructure Challenge. Report of the Aspen Institute’s Dialogue on Sustainable Water Infrastructure in the US. The Aspen Institute, Energy and Environment Program (May 2009). http://www.aspeninstitute.org/publications/sustainable-water-systems-step-one-redefining-nations-infrastructure-challenge) 41LEED: Leadership in Energy and Environmental Design
Figure 4: Weirs at the roof drain inlets create temporary ponding and more gradual release of water (NYC)
The Value of Green Infrastructure for Urban Climate Adaptation
12
Economic Costs and Benefits of Blue Roofs Adding blue roof flow controls adds less than $1 - 4 per square foot in additional or incremental cost to the design of a new flat roof. Additionally, blue roofs do not require the expensive structural reinforcement that is required in cases of green roof retrofits. They also need less maintenance (particularly at start-up), and do not discharge the nutrients and chemicals that may run off of green roofs. A typical blue roof with storage capability can store about 50% of the water that falls on it annually.42 One inch of rain falling on a 1,000 square feet of roof generates 623 gallons of water for harvest. 43 Installing blue roofs can create energy savings and result in emission reductions as well. Treating 1 million gallons of rain water uses 955 – 1911 kWh of electricity. In California, the system-wide energy cost to convey, treat, and distribute 1 million gallons of water is 12,700 kWh, or 8.6 tons CO2.44 By decreasing the amount of water needing treatment communities can save energy and cut carbon emissions at the same time. Savings per gallon captured and used will depend on the local market value of water. Storm-water detention and retention value will also vary locally depending on savings from local storm-water fees, or more generally from improved local water quality (including avoided Clean Water Act regulatory fees), or damage avoided from CSOs or flooding.
Seattle, Washington provides an example of various blue roof practices in action. Their rain catcher pilot program consists of three different types of rainwater collection systems:
1. Tight-line–directs rainwater outflow to a pipe that flows under the yard through weep holes in the sidewalk, reducing volumes deposited in the storm drain via the curb.
2. Tight-lined cistern–a cistern at the point of initial outflow that collects water
during the storm event and releases it slowly into the underground pipes.
3. Orifice cisterns–include an operable valve which can be opened during the wet season, discharging a small amount of water onto an adjacent permeable surface such as a lawn or rain garden to slow down flow. It can also be closed to store up to 500 gallons of roof runoff, which can be used later for irrigation.
Each cistern cost the city a total of $1000 with $325 of that sum paying for the wholesale purchase of the cistern and $675 to installation and overhead. Seattle is currently analyzing the impact of cisterns on the combined sewer system as part of a grant.45
42EcoStructure website, “Blue is the New Green” Blog (February 2010) http://www.eco-structure.com/water-conservation/blue-is-the-new-green.aspx. 43CNT Multiple Benefits (April 2010) 44CNT Multiple Benefits (April 2010) 45Low Impact Design Toolkit, What Will You Do with San Francisco’s Stormwater. San Francisco Public Utility (SFPUC). Urban Stormwater Planning Charette (September 2007)<sfwater.org/Files/Reports/UWP_toolkit.pdf>
The Value of Green Infrastructure for Urban Climate Adaptation
13
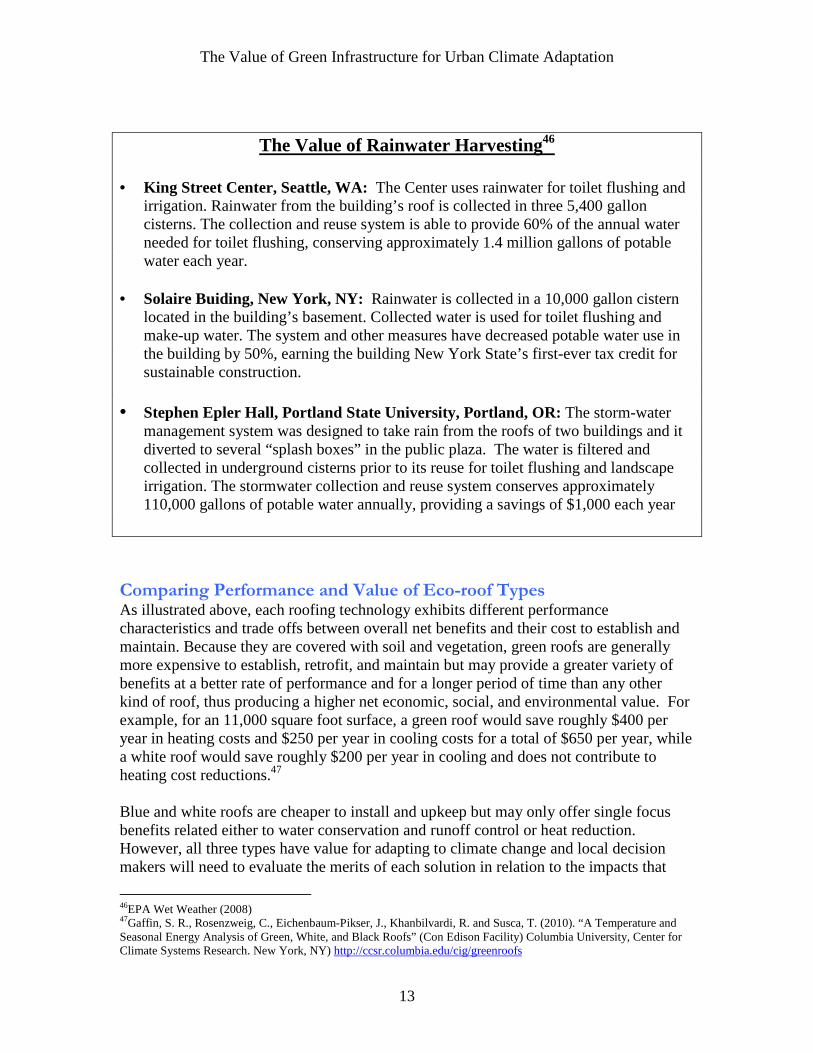
The Value of Rainwater Harvesting46
• King Street Center, Seattle, WA: The Center uses rainwater for toilet flushing and irrigation. Rainwater from the building’s roof is collected in three 5,400 gallon cisterns. The collection and reuse system is able to provide 60% of the annual water needed for toilet flushing, conserving approximately 1.4 million gallons of potable water each year.
• Solaire Buiding, New York, NY: Rainwater is collected in a 10,000 gallon cistern
located in the building’s basement. Collected water is used for toilet flushing and make-up water. The system and other measures have decreased potable water use in the building by 50%, earning the building New York State’s first-ever tax credit for sustainable construction.
• Stephen Epler Hall, Portland State University, Portland, OR: The storm-water
management system was designed to take rain from the roofs of two buildings and it diverted to several “splash boxes” in the public plaza. The water is filtered and collected in underground cisterns prior to its reuse for toilet flushing and landscape irrigation. The stormwater collection and reuse system conserves approximately 110,000 gallons of potable water annually, providing a savings of $1,000 each year
Comparing Performance and Value of Eco-roof Types As illustrated above, each roofing technology exhibits different performance characteristics and trade offs between overall net benefits and their cost to establish and maintain. Because they are covered with soil and vegetation, green roofs are generally more expensive to establish, retrofit, and maintain but may provide a greater variety of benefits at a better rate of performance and for a longer period of time than any other kind of roof, thus producing a higher net economic, social, and environmental value. For example, for an 11,000 square foot surface, a green roof would save roughly $400 per year in heating costs and $250 per year in cooling costs for a total of $650 per year, while a white roof would save roughly $200 per year in cooling and does not contribute to heating cost reductions.47 Blue and white roofs are cheaper to install and upkeep but may only offer single focus benefits related either to water conservation and runoff control or heat reduction. However, all three types have value for adapting to climate change and local decision makers will need to evaluate the merits of each solution in relation to the impacts that
46EPA Wet Weather (2008) 47Gaffin, S. R., Rosenzweig, C., Eichenbaum-Pikser, J., Khanbilvardi, R. and Susca, T. (2010). “A Temperature and Seasonal Energy Analysis of Green, White, and Black Roofs” (Con Edison Facility) Columbia University, Center for Climate Systems Research. New York, NY) http://ccsr.columbia.edu/cig/greenroofs
The Value of Green Infrastructure for Urban Climate Adaptation
14
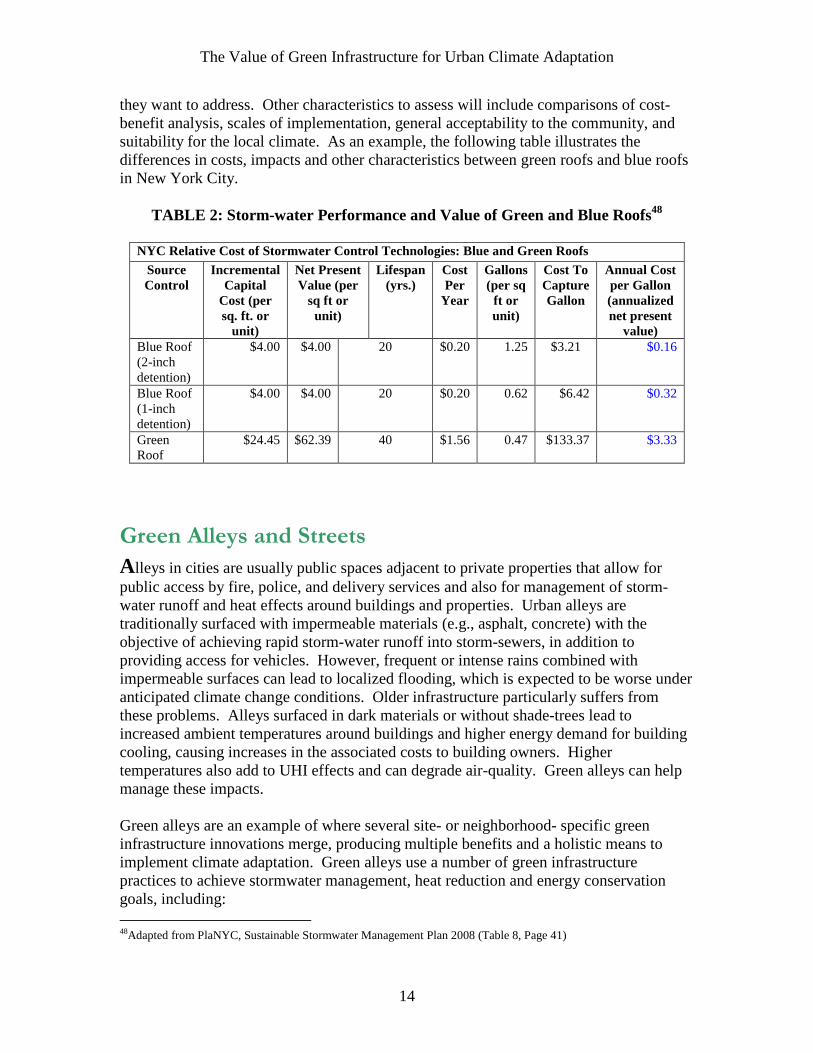
they want to address. Other characteristics to assess will include comparisons of cost-benefit analysis, scales of implementation, general acceptability to the community, and suitability for the local climate. As an example, the following table illustrates the differences in costs, impacts and other characteristics between green roofs and blue roofs in New York City.
TABLE 2: Storm-water Performance and Value of Green and Blue Roofs48
NYC Relative Cost of Stormwater Control Technologies: Blue and Green Roofs Source Control
Incremental Capital
Cost (per sq. ft. or
unit)
Net Present Value (per
sq ft or unit)
Lifespan (yrs.)
Cost Per
Year
Gallons (per sq ft or unit)
Cost To Capture Gallon
Annual Cost per Gallon (annualized net present
value) Blue Roof (2-inch detention)
$4.00 $4.00 20 $0.20 1.25 $3.21 $0.16
Blue Roof (1-inch detention)
$4.00 $4.00 20 $0.20 0.62 $6.42 $0.32
Green Roof
$24.45 $62.39 40 $1.56 0.47 $133.37 $3.33
Green Alleys and Streets
A lleys in cities are usually public spaces adjacent to private properties that allow for public access by fire, police, and delivery services and also for management of storm-water runoff and heat effects around buildings and properties. Urban alleys are traditionally surfaced with impermeable materials (e.g., asphalt, concrete) with the objective of achieving rapid storm-water runoff into storm-sewers, in addition to providing access for vehicles. However, frequent or intense rains combined with impermeable surfaces can lead to localized flooding, which is expected to be worse under anticipated climate change conditions. Older infrastructure particularly suffers from these problems. Alleys surfaced in dark materials or without shade-trees lead to increased ambient temperatures around buildings and higher energy demand for building cooling, causing increases in the associated costs to building owners. Higher temperatures also add to UHI effects and can degrade air-quality. Green alleys can help manage these impacts. Green alleys are an example of where several site- or neighborhood- specific green infrastructure innovations merge, producing multiple benefits and a holistic means to implement climate adaptation. Green alleys use a number of green infrastructure practices to achieve stormwater management, heat reduction and energy conservation goals, including: 48Adapted from PlaNYC, Sustainable Stormwater Management Plan 2008 (Table 8, Page 41)
The Value of Green Infrastructure for Urban Climate Adaptation
15
• Permeable and reflective pavements, • Rain-gardens (vegetation installed in artificial depressions to capture rainwater), • Downspout disconnects and rain-barrels, • Tree-planting, • Landscaping and bio-swales (artificially contained vegetation), • Cisterns, • Eco-roofs, and • Recycled materials.49 In addition, green alleys can earn LEED credits for their contributions to urban sustainability. Permeable pavement can earn credits for storm-water water quality maintenance, UHI reductions, and recycled materials while landscaping can earn water efficiency credits.50,51 Slower runoff and storm-water capture generally reduces municipal pumping demand and electricity costs, meeting both mitigation and adaptation objectives. The following sections will discuss two green alley tools in detail, permeable pavement and downspout disconnection/rainwater collection. Green Alleys: Permeable Pavement Permeable pavement is made out of materials that allow water to soak back into the ground rather than running over it and into other stormwarter management systems. The goal of permeable pavement strategies is to produce runoff characteristics in cityscapes that are similar to those in a meadow or a forest. Studies have shown that permeable pavement with proper “sub-soiling” (maintenance of a porous layer of soil underneath) can reduce runoff volume by 70 to 90%.52 Permeable pavement in a typical alley can infiltrate 3 inches of rainwater from a 1-hour storm with an infrastructure life expectancy of 30 to 35 years.53 It is typically designed with the capacity to manage a 10-year rain event within a 24-hour period—a standard that will likely need to be adjusted for to account for projected increases in frequency and intensity of storms in the future. Research also indicates that permeable pavement offers other benefits to cities, including reducing the need for road salt application on streets in the winter by as much as 75% and reducing road noise by 10 decibels.54,55
49Chicago Green Alley Handbook <http://www.cityofchicago.org/city/en/depts/cdot/provdrs/alley/svcs/green_alleys.html> <http://www.cityofchicago.org/content/dam/city/depts/cdot/Green_Alley_Handbook_2010.pdf> 50National Ready Mixed Concrete Association (NRMCA) website, Using Pervious Concrete to Achieve LEED Points <http://www.perviouspavement.org/benefits_LEEDcredit.htm> 51(Norbert Delatte, “Sustainability Benefits of Pervious Concrete Pavement” (2010)(Cleveland State University) and Stuart Schwartz (University of Maryland-Baltimore Campus)<www.claisse.info/2010%20papers/p14.pdf>));(Chicago Green Alley Handbook). 52“Greening Gets Down and Dirty,” Timothy B. Wheeler, Baltimore Sun (August 20, 2010)< http://articles.baltimoresun.com/2010-08-20/features/bs-gr-subsoiling-20100820_1_polluted-runoff-storm-drains-storm-water-pollution> 53Rooftops to Rivers (2006) NRDC 54CNT Multiple Benefits (April 2010) 55Effective Curve Number and Hydrologic Design of Pervious Concrete-Water Systems; Stuart Schwartz (University of Maryland-Baltimore Campus), Journal of Hydrologic Engineering, ASCE (June 2010)< http://cedb.asce.org/cgi/WWWdisplay.cgi?264283>
The Value of Green Infrastructure for Urban Climate Adaptation
16
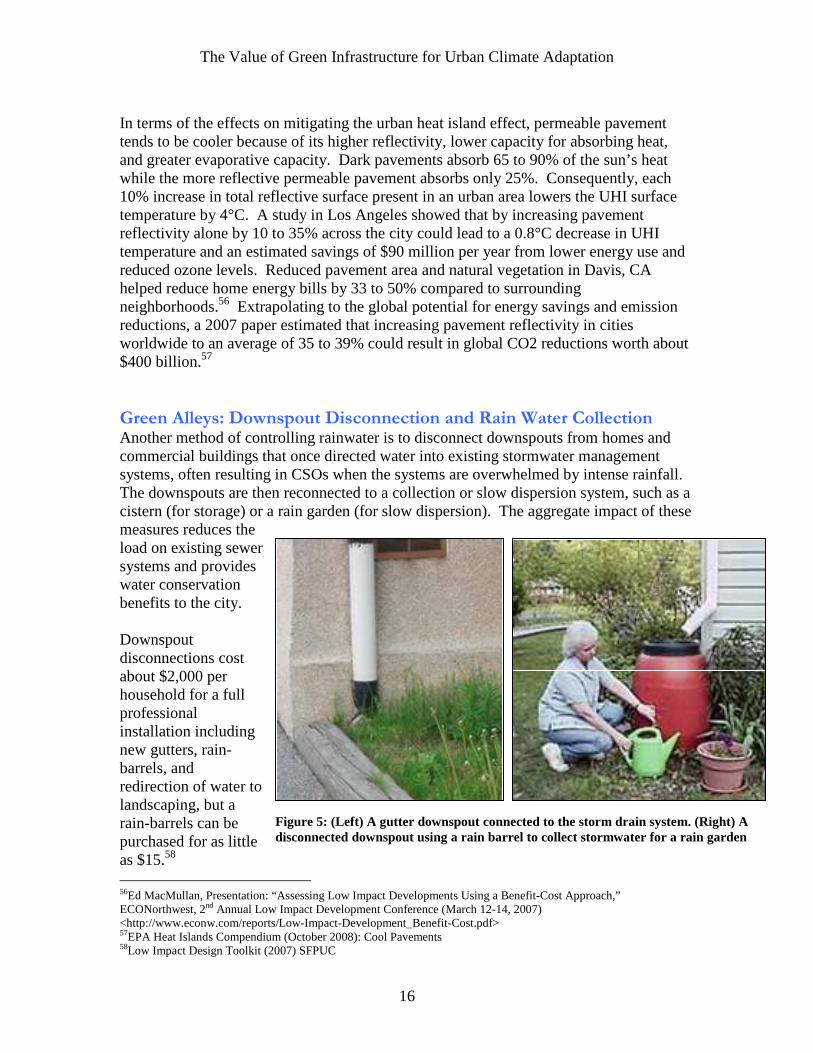
In terms of the effects on mitigating the urban heat island effect, permeable pavement tends to be cooler because of its higher reflectivity, lower capacity for absorbing heat, and greater evaporative capacity. Dark pavements absorb 65 to 90% of the sun’s heat while the more reflective permeable pavement absorbs only 25%. Consequently, each 10% increase in total reflective surface present in an urban area lowers the UHI surface temperature by 4°C. A study in Los Angeles showed that by increasing pavement reflectivity alone by 10 to 35% across the city could lead to a 0.8°C decrease in UHI temperature and an estimated savings of $90 million per year from lower energy use and reduced ozone levels. Reduced pavement area and natural vegetation in Davis, CA helped reduce home energy bills by 33 to 50% compared to surrounding neighborhoods.56 Extrapolating to the global potential for energy savings and emission reductions, a 2007 paper estimated that increasing pavement reflectivity in cities worldwide to an average of 35 to 39% could result in global CO2 reductions worth about $400 billion.57 Green Alleys: Downspout Disconnection and Rain Water Collection Another method of controlling rainwater is to disconnect downspouts from homes and commercial buildings that once directed water into existing stormwater management systems, often resulting in CSOs when the systems are overwhelmed by intense rainfall. The downspouts are then reconnected to a collection or slow dispersion system, such as a cistern (for storage) or a rain garden (for slow dispersion). The aggregate impact of these measures reduces the load on existing sewer systems and provides water conservation benefits to the city. Downspout disconnections cost about $2,000 per household for a full professional installation including new gutters, rain-barrels, and redirection of water to landscaping, but a rain-barrels can be purchased for as little as $15.58 56Ed MacMullan, Presentation: “Assessing Low Impact Developments Using a Benefit-Cost Approach,” ECONorthwest, 2nd Annual Low Impact Development Conference (March 12-14, 2007) <http://www.econw.com/reports/Low-Impact-Development_Benefit-Cost.pdf> 57EPA Heat Islands Compendium (October 2008): Cool Pavements 58Low Impact Design Toolkit (2007) SFPUC
Figure 5: (Left) A gutter downspout connected to the storm drain system. (Right) A disconnected downspout using a rain barrel to collect stormwater for a rain garden
The Value of Green Infrastructure for Urban Climate Adaptation
17
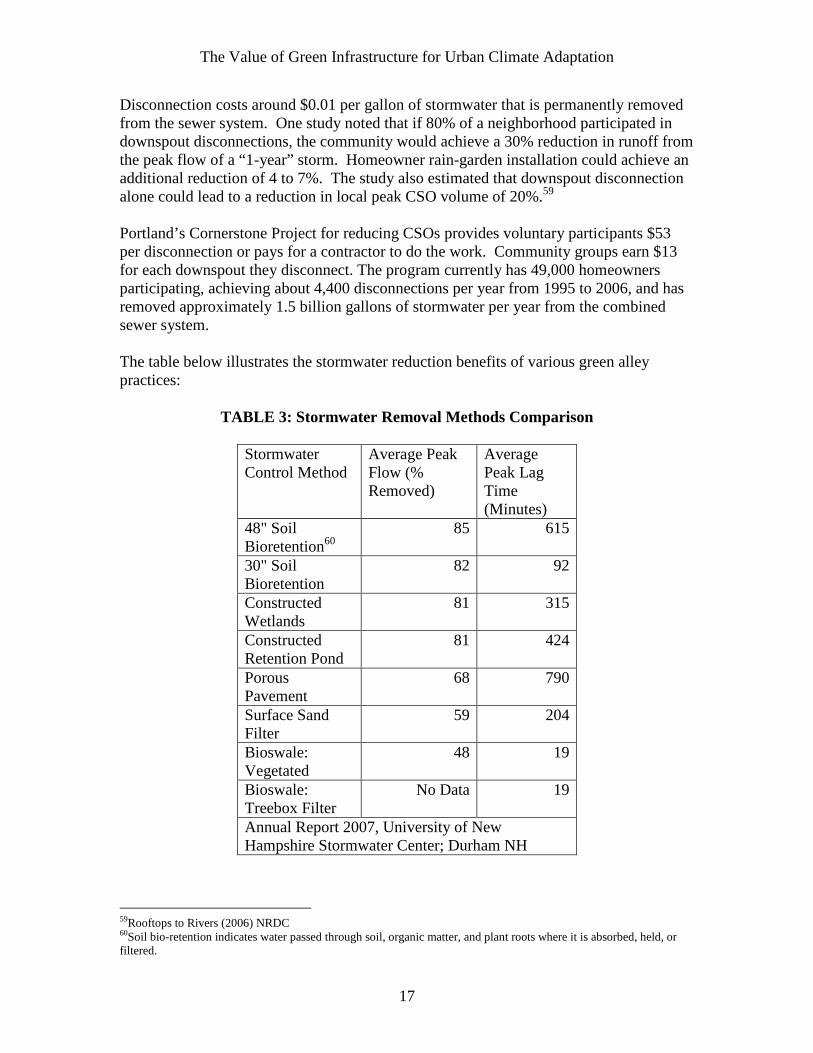
Disconnection costs around $0.01 per gallon of stormwater that is permanently removed from the sewer system. One study noted that if 80% of a neighborhood participated in downspout disconnections, the community would achieve a 30% reduction in runoff from the peak flow of a “1-year” storm. Homeowner rain-garden installation could achieve an additional reduction of 4 to 7%. The study also estimated that downspout disconnection alone could lead to a reduction in local peak CSO volume of 20%.59 Portland’s Cornerstone Project for reducing CSOs provides voluntary participants $53 per disconnection or pays for a contractor to do the work. Community groups earn $13 for each downspout they disconnect. The program currently has 49,000 homeowners participating, achieving about 4,400 disconnections per year from 1995 to 2006, and has removed approximately 1.5 billion gallons of stormwater per year from the combined sewer system. The table below illustrates the stormwater reduction benefits of various green alley practices:
TABLE 3: Stormwater Removal Methods Comparison
Stormwater Control Method
Average Peak Flow (% Removed)
Average Peak Lag Time (Minutes)
48" Soil Bioretention60
85 615
30" Soil Bioretention
82 92
Constructed Wetlands
81 315
Constructed Retention Pond
81 424
Porous Pavement
68 790
Surface Sand Filter
59 204
Bioswale: Vegetated
48 19
Bioswale: Treebox Filter
No Data 19
Annual Report 2007, University of New Hampshire Stormwater Center; Durham NH
59Rooftops to Rivers (2006) NRDC 60Soil bio-retention indicates water passed through soil, organic matter, and plant roots where it is absorbed, held, or filtered.
The Value of Green Infrastructure for Urban Climate Adaptation
18
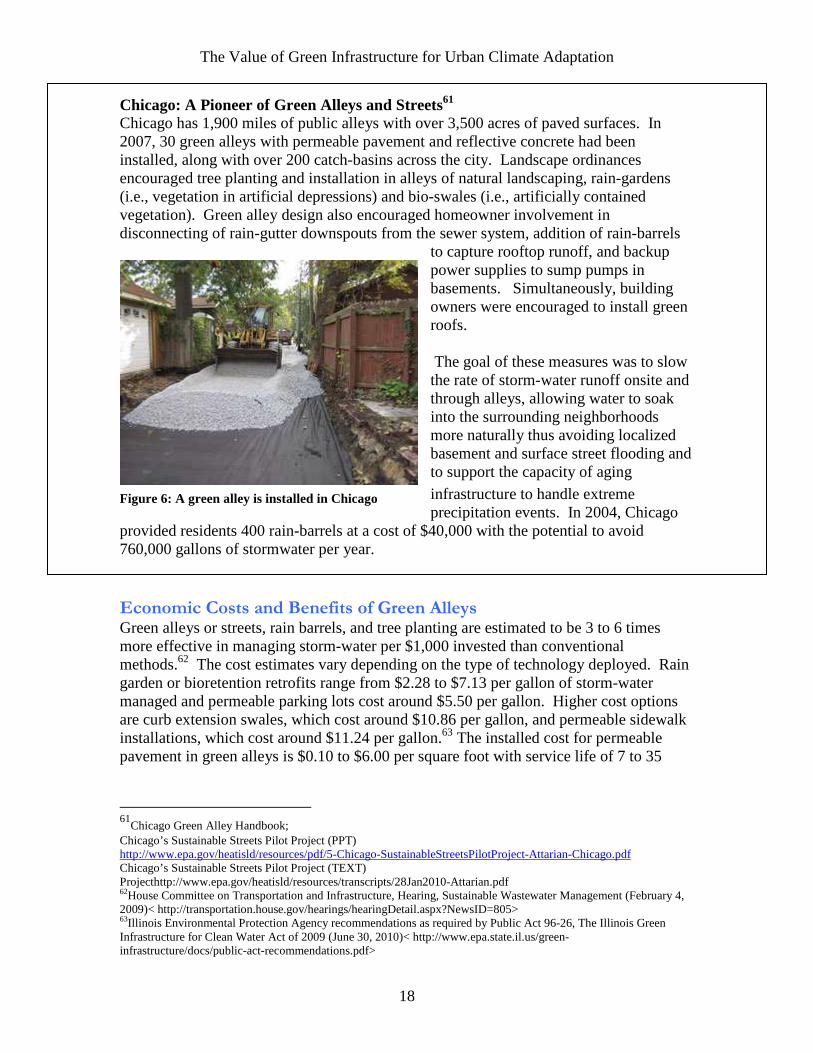
Chicago: A Pioneer of Green Alleys and Streets61 Chicago has 1,900 miles of public alleys with over 3,500 acres of paved surfaces. In 2007, 30 green alleys with permeable pavement and reflective concrete had been installed, along with over 200 catch-basins across the city. Landscape ordinances encouraged tree planting and installation in alleys of natural landscaping, rain-gardens (i.e., vegetation in artificial depressions) and bio-swales (i.e., artificially contained vegetation). Green alley design also encouraged homeowner involvement in disconnecting of rain-gutter downspouts from the sewer system, addition of rain-barrels
to capture rooftop runoff, and backup power supplies to sump pumps in basements. Simultaneously, building owners were encouraged to install green roofs. The goal of these measures was to slow the rate of storm-water runoff onsite and through alleys, allowing water to soak into the surrounding neighborhoods more naturally thus avoiding localized basement and surface street flooding and to support the capacity of aging infrastructure to handle extreme precipitation events. In 2004, Chicago
provided residents 400 rain-barrels at a cost of $40,000 with the potential to avoid 760,000 gallons of stormwater per year. Economic Costs and Benefits of Green Alleys Green alleys or streets, rain barrels, and tree planting are estimated to be 3 to 6 times more effective in managing storm-water per $1,000 invested than conventional methods.62 The cost estimates vary depending on the type of technology deployed. Rain garden or bioretention retrofits range from $2.28 to $7.13 per gallon of storm-water managed and permeable parking lots cost around $5.50 per gallon. Higher cost options are curb extension swales, which cost around $10.86 per gallon, and permeable sidewalk installations, which cost around $11.24 per gallon.63 The installed cost for permeable pavement in green alleys is $0.10 to $6.00 per square foot with service life of 7 to 35
61
Chicago Green Alley Handbook; Chicago’s Sustainable Streets Pilot Project (PPT) http://www.epa.gov/heatisld/resources/pdf/5-Chicago-SustainableStreetsPilotProject-Attarian-Chicago.pdf Chicago’s Sustainable Streets Pilot Project (TEXT) Projecthttp://www.epa.gov/heatisld/resources/transcripts/28Jan2010-Attarian.pdf 62House Committee on Transportation and Infrastructure, Hearing, Sustainable Wastewater Management (February 4, 2009)< http://transportation.house.gov/hearings/hearingDetail.aspx?NewsID=805> 63Illinois Environmental Protection Agency recommendations as required by Public Act 96-26, The Illinois Green Infrastructure for Clean Water Act of 2009 (June 30, 2010)< http://www.epa.state.il.us/green-infrastructure/docs/public-act-recommendations.pdf>
Figure 6: A green alley is installed in Chicago
The Value of Green Infrastructure for Urban Climate Adaptation
19
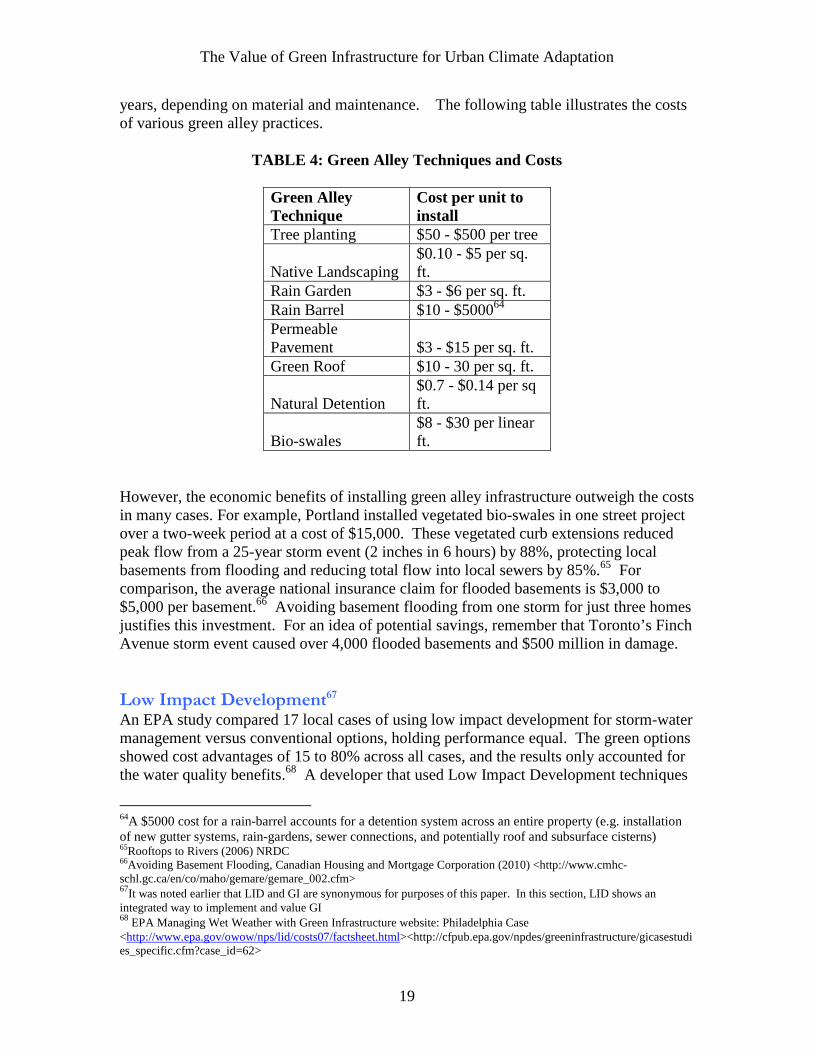
years, depending on material and maintenance. The following table illustrates the costs of various green alley practices.
TABLE 4: Green Alley Techniques and Costs
Green Alley Technique
Cost per unit to install
Tree planting $50 - $500 per tree
Native Landscaping $0.10 - $5 per sq. ft.
Rain Garden $3 - $6 per sq. ft. Rain Barrel $10 - $500064 Permeable Pavement $3 - $15 per sq. ft. Green Roof $10 - 30 per sq. ft.
Natural Detention $0.7 - $0.14 per sq ft.
Bio-swales $8 - $30 per linear ft.
However, the economic benefits of installing green alley infrastructure outweigh the costs in many cases. For example, Portland installed vegetated bio-swales in one street project over a two-week period at a cost of $15,000. These vegetated curb extensions reduced peak flow from a 25-year storm event (2 inches in 6 hours) by 88%, protecting local basements from flooding and reducing total flow into local sewers by 85%.65 For comparison, the average national insurance claim for flooded basements is $3,000 to $5,000 per basement.66 Avoiding basement flooding from one storm for just three homes justifies this investment. For an idea of potential savings, remember that Toronto’s Finch Avenue storm event caused over 4,000 flooded basements and $500 million in damage. Low Impact Development67 An EPA study compared 17 local cases of using low impact development for storm-water management versus conventional options, holding performance equal. The green options showed cost advantages of 15 to 80% across all cases, and the results only accounted for the water quality benefits.68 A developer that used Low Impact Development techniques
64A $5000 cost for a rain-barrel accounts for a detention system across an entire property (e.g. installation of new gutter systems, rain-gardens, sewer connections, and potentially roof and subsurface cisterns) 65Rooftops to Rivers (2006) NRDC 66Avoiding Basement Flooding, Canadian Housing and Mortgage Corporation (2010) <http://www.cmhc-schl.gc.ca/en/co/maho/gemare/gemare_002.cfm> 67It was noted earlier that LID and GI are synonymous for purposes of this paper. In this section, LID shows an integrated way to implement and value GI 68 EPA Managing Wet Weather with Green Infrastructure website: Philadelphia Case <http://www.epa.gov/owow/nps/lid/costs07/factsheet.html><http://cfpub.epa.gov/npdes/greeninfrastructure/gicasestudies_specific.cfm?case_id=62>
The Value of Green Infrastructure for Urban Climate Adaptation
20
like those used in green alleys in residential subdivisions sold lots for $3,000 more than lots in competing areas that did not use LID. Replacing curbs, gutters, and storm sewers with roadside bio-swales in a residential subdivision could save a developer $70,000 per mile, or $800 per residence. In Los Angeles County it was estimated that while LID stormwater controls would cost $2.8-$7.4 billion, they would deliver benefits of $5.6-$18 billion. Using LID throughout a watershed that reduces downstream flooding can result in economic benefits of $54 to $343 per developed acre.69 For an example of the costs of LID, Seattle has developed flexible and adaptable natural drainage systems to manage storm-water. The 72-acre Viewlands Cascade project used “vegetated cells” to reduce storm-runoff by 75 to 80% and peak flow rates by 60% with top performance in small rain events. The project used green infrastructure practices including a curving street, vegetated swales, and additional plantings, resulting in a 99% reduction of monitored surface runoff at a cost of $850,000 (or $3 to $5 per square foot).70
Green Values Calculators71
The Center for Neighborhood Technology (CNT) in Chicago has developed several storm-water management tools. The National Green Values Calculator helps users compare costs, benefits, and performance of green infrastructure and Low Impact Development across neighborhoods when compared to conventional infrastructure. The
tool then recommends BMPs primarily to reduce impermeable surfaces, and increase capture and infiltration of storm-water. The Green Values Stormwater Calculator allows users to generate rough values for hydrologic outputs and financial benefits for green storm-water practices on their properties.
Various green interventions can be entered into the tool, including downspout disconnections, permeable pavement, green roofs, tree cover, and drainage swales. Users then enter associated parameters including lot and roof size, number of trees, square feet of permeable pavement, average slope and soil type, etc. The tool then calculates
volumes for lot and site improvements for storm-water detention, annual discharge, reductions in peak flow, and ground-water recharge when compared to no improvements. The final output shows reduction in life-cycle costs and increase in monetary benefits. The Green Stormwater Ordinance Compliance Calculator helps user evaluate and comply with stormwater BMPs for regulated developments in Chicago.
69Ed MacMullan, Presentation: Low Impact Development (2007) 70Low Impact Design Toolkit (2007) SFPUC 71Green Values® Stormwater Toolbox website & calculator <greenvalues.cnt.org>
The Value of Green Infrastructure for Urban Climate Adaptation
21
Urban Forestry
Planting and maintaining trees in urban settings is considered a quintessential green infrastructure practice with multiple benefits for resilience, adaptation, and even climate mitigation. The benefits of urban forestry extend from individual neighborhood trees to widely distributed urban forests. As noted earlier, trees contribute to adaptation by intercepting and filtering storm-water runoff to prevent flooding and improve water quality, absorbing pollutants to clean the air, providing wind-breaks to protect buildings from wind damage, and regulating heat island effects through shading and evaporation. Simultaneously, trees contribute to mitigation by lowering cooling demand for electricity and directly sequestering carbon. Trees provide wildlife habitat and ecosystem services, and have been shown to increase property values. For centuries they have contributed to overall urban quality of life. Dead trees even can be recycled into mulch. Urban forestry programs establish trees in public spaces such as parks, along streets and alleys, or in any available open areas that local governments manage (along stream right-of-ways, around public buildings, or in city-owned vacant lots). Urban forestry can extend to green-belts around cities that buffer waterways and regulate development, and even to acquisition and management of lands to preserve urban watersheds so that drinking water supply and quality is protected. Local ordinances often guide property owners’ responsibilities for trees as a private and public good. Urban forestry delivers a range of stormwater and UHI benefits to communities. A typical medium-sized tree can intercept as much as 2,380 gallons of rainfall per year.72 During the summer, with trees in full leaf, evergreens and conifers in Sacramento, CA were found to intercept over 35% of the rainfall that hit them during smaller rainfall events. Trees reduce runoff and erosion from storms by about 7% and reduce the need
72Fact Sheet #4 website: Control Stormwater Runoff with Trees, Watershed Forestry Resource Guide, A Partnership of the Center For Watershed Protection and US Forest Service - Northeastern Area State & Private Forestry http://www.forestsforwatersheds.org/reduce-stormwater/
Trees slow and reduce stormwater runoff–improving
and protecting the quality of drinking water.1 • In Houston, TX trees in the provide $1.3 billion in stormwater benefits (based on $0.66
/cubic foot of storage) • In Austin, TX trees provide $122 million in stormwater benefits (based on a national
average of $2/cubic foot of storage) • In Atlanta, GA trees provide $833 million in stormwater benefits (based on a national
average of $2/cubic foot of storage)

The Value of Green Infrastructure for Urban Climate Adaptation
22
for erosion control.73 In Oakland, CA the continuous tree canopy is estimated to intercept 4 inches of rain, or 108,000 gallons of water, per acre in a typical year. 74 Trees can reduce runoff in urban areas by up to 17%.75 In terms of mitigating UHI impacts, trees typically absorb 70 to 90% of sunlight in summer and 20 to 90% in winter, with the biggest seasonal variation seen in deciduous trees (versus evergreens) that lose their leaves annually. One study showed that trees can reduce the maximum surface temperature of the roofs and walls of buildings by 11 to 25º C. The estimated effect of new shade trees planted around houses resulted in annual cooling energy savings of 1% per tree while annual heating energy use decreased by almost 2% per tree.76 Direct energy savings from shading by trees and vegetation could reduce carbon emissions in various U.S. metropolitan areas by roughly 1.5 to 5% due to decreases in cooling energy use.77 A climate modeling study in Manchester, England found that adding 10% green cover like grass and shrubs in high density areas would keep surface temperatures below historical baseline levels, except under conditions of high CO2 emissions. In the model, when green roofs were also added to high density areas, temperatures stayed below baseline levels even under the high emissions scenarios. Conversely, the studies also show that if green cover is left unaltered, temperatures are expected to increase about 3.3 to 3.8°C.78 In addition to these benefits, trees absorb and reduce various pollutants found in the urban environment, including particulate matter (PM), nitrogen oxides (NOX), sulfur dioxide (SO2), carbon monoxide (CO), and ground-level ozone (O3). One study predicted that increasing the urban canopy of New York City by 10% could lower ground-level ozone by about 3%. Another study estimated that one million additional trees in a city could lower emissions of NOx by almost a quarter ton per day and particulate matter by over one ton per day. A 2006 study estimated that urban trees in the United States remove 784,000 tons of pollutant per year at an economic value of $3.8 billion.
The study focused only on deposition of ground-level ozone, PM, NO2, SO2 and
CO. Although the estimated changes in local ambient air quality were modest, typically less than 1%, the study noted that additional benefits would be gained if urban temperature and energy impacts from trees and vegetation were also included.79
73EPA Heat Islands Compendium (October 2008): Trees and Vegetation 74Fact Sheet #4 Website 75“Benefits of Trees” Factsheet (website), Houston Area Urban Forestry Council <http://www.h-gac.com/community/livable/forestry/documents/benefits_of_trees.pdf 76EPA Heat Islands Compendium (October 2008): Trees and Vegetation 77EPA Heat Islands Compendium (October 2008): Trees and Vegetation 78Adapting Cities For Climate Change: The Role Of The Green Infrastructure S.E. GILL, J.F. HANDLEY, A.R. ENNOS And S. PAULEIT, Built Environment Vol. 33, No. 1 (2007)< http://www.fs.fed.us/ccrc/topics/urban-forests/docs/Gill_Adapting_Cities.pdf> 79EPA Heat Islands Compendium (October 2008): Trees and Vegetation
The Value of Green Infrastructure for Urban Climate Adaptation
23
Economic Costs and Benefits of Urban Forestry The primary costs associated with planting and maintaining trees or other vegetation, include purchasing seeds or saplings, planting, and routine maintenance such as pruning, pest and disease control, and watering. Other costs of urban forestry include program administration, lawsuits and liability, root damage, and tree stump removal. Generally, however, the benefits of urban trees outweigh the costs. Costs to establish trees vary depending on type of species, location, and climate zone. The city of Chicago estimates that urban forestry costs $50 to $500 per tree to establish. A five-city study estimates an annual maintenance cost of $15 to $65 per tree. Studies have shown that the net economic benefits of mature urban trees range from $30 to $90 per year for each tree, accounting for all of the benefits listed above. Cities can accrue a rate of return on each tree of approximately $1.50 to $3.00 for every dollar invested.80 Many studies also show that trees and other vegetative landscaping can increase property values. Studies have found general increases of about 3 to 10% in residential property values associated with the presence of trees and vegetation on a property. Other studies indicate increases from 2 to 37%.81 In areas with high median residential sales prices, these property value increases are often among the largest categories of benefits for a community.82 A study in Portland showed that trees added $8,870 to the sale prices of residential properties, reducing time on market by 1.2 days.83 Trees in Portland, Oregon generate approximately $13 million per year in property tax revenues by increasing real estate values.84 Some communities have begun to achieve infrastructure cost savings by looking to the ecosystem services provided by urban forestry when used in lieu of “grey” infrastructure investments for managing stormwater. In 1997, New York City decided against constructing a new water filtration plant that would have cost $6 billion to construct and $300 million per year to operate. Instead, the city is spending far less–$1.5 billion over 10 years–to improve Catskill watershed forest protection. By securing the source of the water, the forests will naturally filter and purify the drinking water at a significantly reduced investment.85 A modeling study showed that Washington, DC could potentially realize annual operational savings between $1.4 and $5.1 million per year from reduced pumping and treatment costs by implementing additional urban forestry practices.86
80EPA Heat Islands Compendium (October 2008): Trees and Vegetation 81City Trees and Property Values, Kathleen Wolf (2007) University of Washington, Seattle < http://www.cfr.washington.edu/research.envmind/Policy/Hedonics_Citations.pdf> 82EPA Heat Islands Compendium (October 2008): Trees and Vegetation 83CNT Multiple Benefits (April 2010) 84Haan Fawn Chau, Green Infrastructure for Los Angeles: Addressing Urban Runoff and Water Supply Through Low Impact Development, City of Los Angeles (April 17, 2009)<http://www.ci.la.ca.us/san/wpd/Siteorg/program/Exec-Summ-Grn-Infrastruct.pdf> 85Sandra L. Postel and Barton H. Thompson, Jr., “Watershed protection: Capturing the benefits of nature’s water supply services” Natural Resources Forum 29 (2005) 98–108< http://www.consrv.ca.gov/dlrp/watershedportal/Documents/Watershed%20ProtectnNat%20Res%20Forum05.pdf> 86“The Green Build-out Model: Quantifying the Stormwater Management Benefits of Trees and Green Roofs in Washington, DC.” Casey Trees and LimnoTech. Under EPA Cooperative Agreement CP-83282101-0 (May 15, 2007)< http://www.caseytrees.org/planning/greener-development/gbo/index.php>
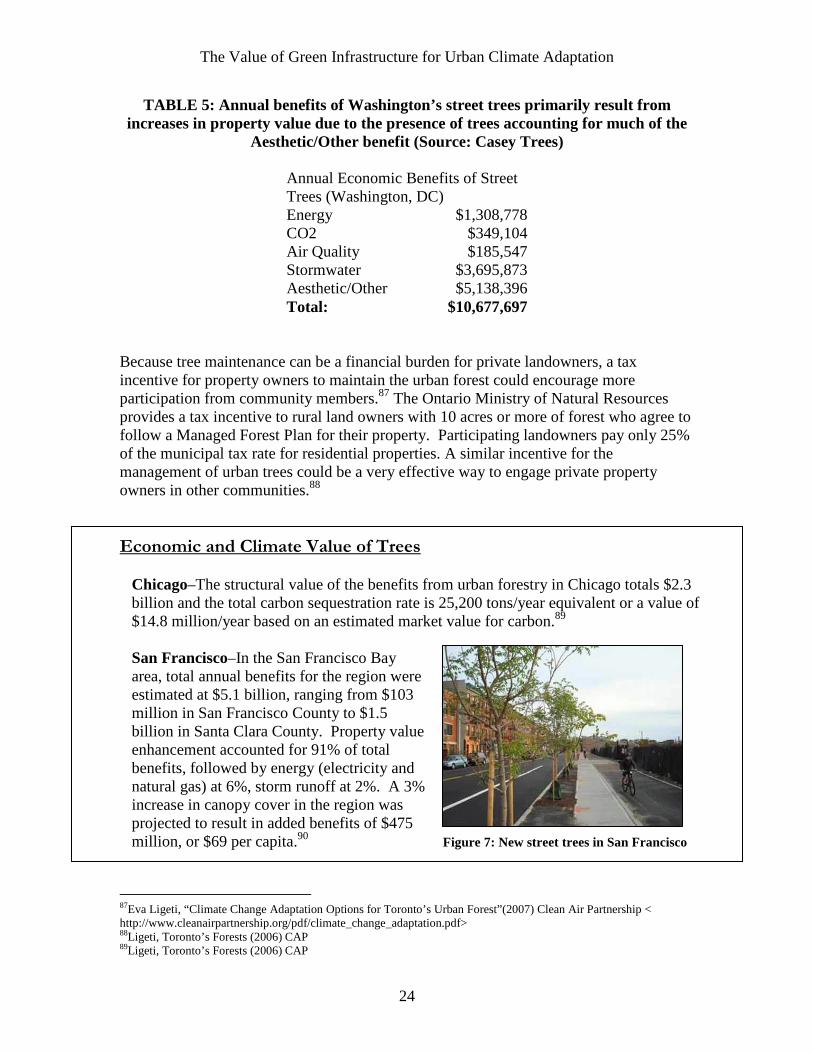
The Value of Green Infrastructure for Urban Climate Adaptation
24
TABLE 5: Annual benefits of Washington’s street trees primarily result from increases in property value due to the presence of trees accounting for much of the
Aesthetic/Other benefit (Source: Casey Trees)
Annual Economic Benefits of Street Trees (Washington, DC) Energy $1,308,778 CO2 $349,104 Air Quality $185,547 Stormwater $3,695,873 Aesthetic/Other $5,138,396 Total: $10,677,697
Because tree maintenance can be a financial burden for private landowners, a tax incentive for property owners to maintain the urban forest could encourage more participation from community members.87 The Ontario Ministry of Natural Resources provides a tax incentive to rural land owners with 10 acres or more of forest who agree to follow a Managed Forest Plan for their property. Participating landowners pay only 25% of the municipal tax rate for residential properties. A similar incentive for the management of urban trees could be a very effective way to engage private property owners in other communities.88 Economic and Climate Value of Trees
Chicago–The structural value of the benefits from urban forestry in Chicago totals $2.3 billion and the total carbon sequestration rate is 25,200 tons/year equivalent or a value of $14.8 million/year based on an estimated market value for carbon.89 San Francisco–In the San Francisco Bay area, total annual benefits for the region were estimated at $5.1 billion, ranging from $103 million in San Francisco County to $1.5 billion in Santa Clara County. Property value enhancement accounted for 91% of total benefits, followed by energy (electricity and natural gas) at 6%, storm runoff at 2%. A 3% increase in canopy cover in the region was projected to result in added benefits of $475 million, or $69 per capita.90
87Eva Ligeti, “Climate Change Adaptation Options for Toronto’s Urban Forest”(2007) Clean Air Partnership < http://www.cleanairpartnership.org/pdf/climate_change_adaptation.pdf> 88Ligeti, Toronto’s Forests (2006) CAP 89Ligeti, Toronto’s Forests (2006) CAP
Figure 7: New street trees in San Francisco
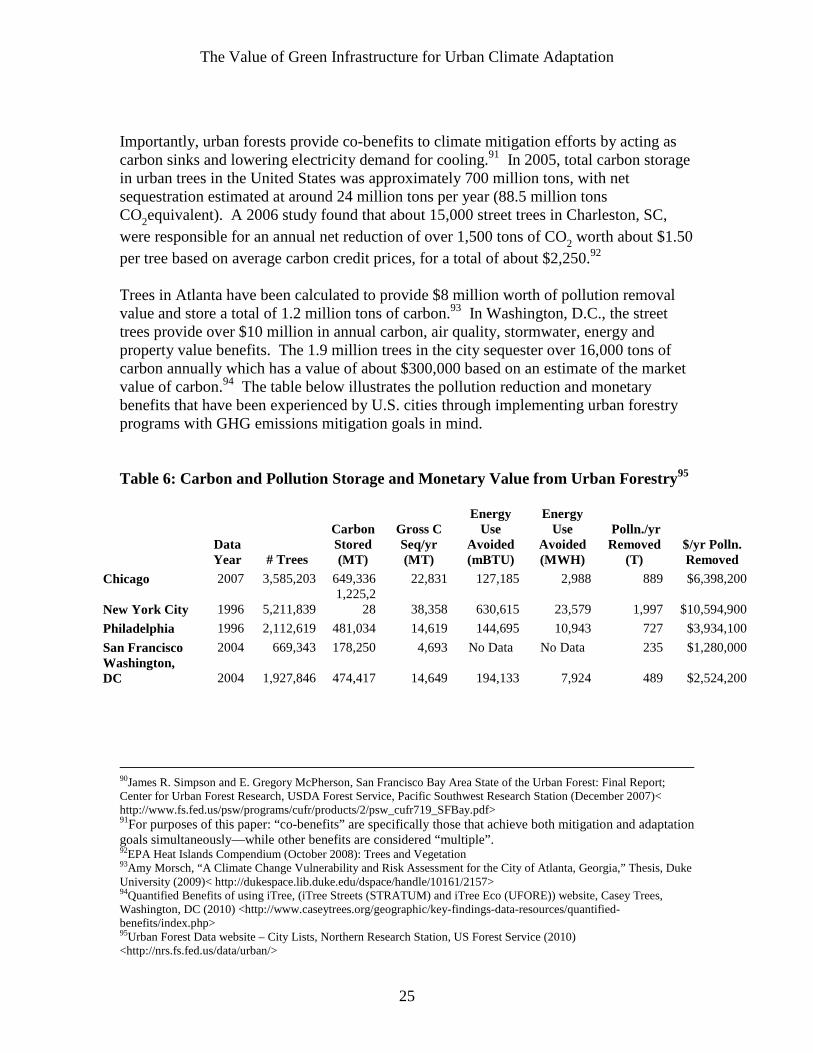
The Value of Green Infrastructure for Urban Climate Adaptation
25
Importantly, urban forests provide co-benefits to climate mitigation efforts by acting as carbon sinks and lowering electricity demand for cooling.91 In 2005, total carbon storage in urban trees in the United States was approximately 700 million tons, with net sequestration estimated at around 24 million tons per year (88.5 million tons CO2equivalent). A 2006 study found that about 15,000 street trees in Charleston, SC, were responsible for an annual net reduction of over 1,500 tons of CO2 worth about $1.50 per tree based on average carbon credit prices, for a total of about $2,250.92 Trees in Atlanta have been calculated to provide $8 million worth of pollution removal value and store a total of 1.2 million tons of carbon.93 In Washington, D.C., the street trees provide over $10 million in annual carbon, air quality, stormwater, energy and property value benefits. The 1.9 million trees in the city sequester over 16,000 tons of carbon annually which has a value of about $300,000 based on an estimate of the market value of carbon.94 The table below illustrates the pollution reduction and monetary benefits that have been experienced by U.S. cities through implementing urban forestry programs with GHG emissions mitigation goals in mind. Table 6: Carbon and Pollution Storage and Monetary Value from Urban Forestry95
Data Year # Trees
Carbon Stored (MT)
Gross C Seq/yr (MT)
Energy Use
Avoided (mBTU)
Energy Use
Avoided (MWH)
Polln./yr Removed
(T) $/yr Polln. Removed
Chicago 2007 3,585,203 649,336 22,831 127,185 2,988 889 $6,398,200
New York City 1996 5,211,839 1,225,2
28 38,358 630,615 23,579 1,997 $10,594,900
Philadelphia 1996 2,112,619 481,034 14,619 144,695 10,943 727 $3,934,100
San Francisco 2004 669,343 178,250 4,693 No Data No Data 235 $1,280,000 Washington, DC 2004 1,927,846 474,417 14,649 194,133 7,924 489 $2,524,200
90James R. Simpson and E. Gregory McPherson, San Francisco Bay Area State of the Urban Forest: Final Report; Center for Urban Forest Research, USDA Forest Service, Pacific Southwest Research Station (December 2007)< http://www.fs.fed.us/psw/programs/cufr/products/2/psw_cufr719_SFBay.pdf> 91For purposes of this paper: “co-benefits” are specifically those that achieve both mitigation and adaptation goals simultaneously—while other benefits are considered “multiple”. 92EPA Heat Islands Compendium (October 2008): Trees and Vegetation 93Amy Morsch, “A Climate Change Vulnerability and Risk Assessment for the City of Atlanta, Georgia,” Thesis, Duke University (2009)< http://dukespace.lib.duke.edu/dspace/handle/10161/2157> 94Quantified Benefits of using iTree, (iTree Streets (STRATUM) and iTree Eco (UFORE)) website, Casey Trees, Washington, DC (2010) <http://www.caseytrees.org/geographic/key-findings-data-resources/quantified-benefits/index.php> 95Urban Forest Data website – City Lists, Northern Research Station, US Forest Service (2010) <http://nrs.fs.fed.us/data/urban/>
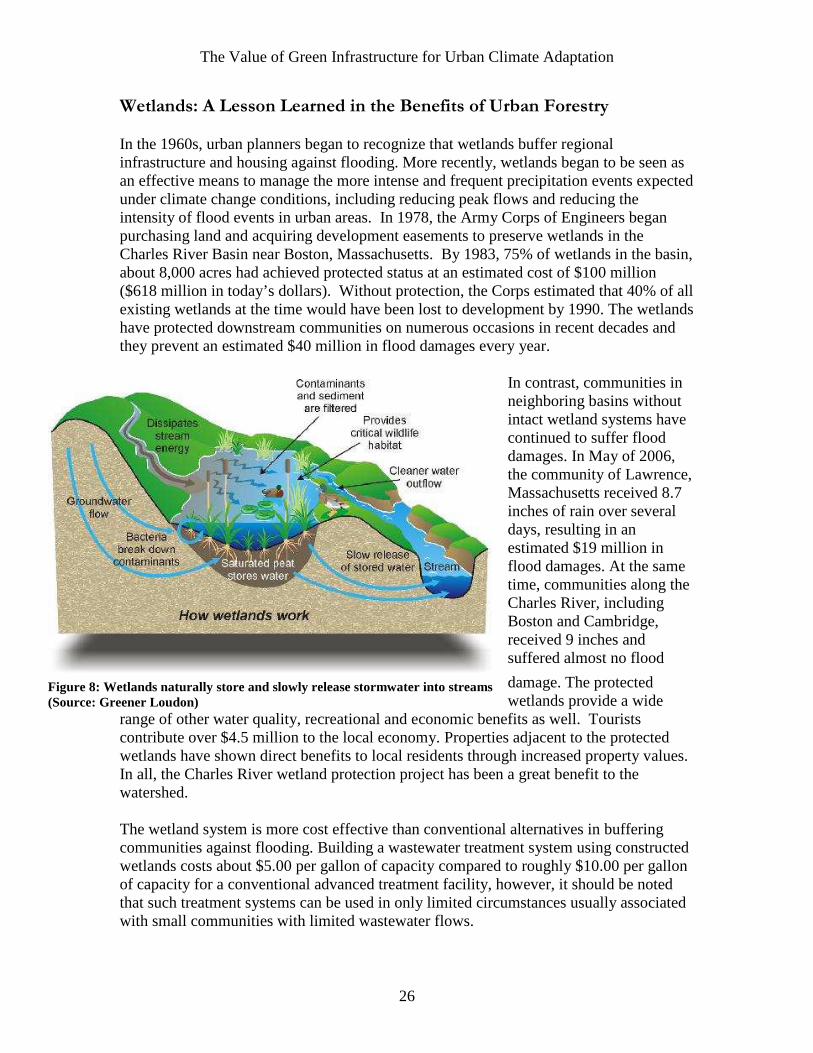
The Value of Green Infrastructure for Urban Climate Adaptation
26
Wetlands: A Lesson Learned in the Benefits of Urban Forestry In the 1960s, urban planners began to recognize that wetlands buffer regional infrastructure and housing against flooding. More recently, wetlands began to be seen as an effective means to manage the more intense and frequent precipitation events expected under climate change conditions, including reducing peak flows and reducing the intensity of flood events in urban areas. In 1978, the Army Corps of Engineers began purchasing land and acquiring development easements to preserve wetlands in the Charles River Basin near Boston, Massachusetts. By 1983, 75% of wetlands in the basin, about 8,000 acres had achieved protected status at an estimated cost of $100 million ($618 million in today’s dollars). Without protection, the Corps estimated that 40% of all existing wetlands at the time would have been lost to development by 1990. The wetlands have protected downstream communities on numerous occasions in recent decades and they prevent an estimated $40 million in flood damages every year.
In contrast, communities in neighboring basins without intact wetland systems have continued to suffer flood damages. In May of 2006, the community of Lawrence, Massachusetts received 8.7 inches of rain over several days, resulting in an estimated $19 million in flood damages. At the same time, communities along the Charles River, including Boston and Cambridge, received 9 inches and suffered almost no flood
damage. The protected wetlands provide a wide
range of other water quality, recreational and economic benefits as well. Tourists contribute over $4.5 million to the local economy. Properties adjacent to the protected wetlands have shown direct benefits to local residents through increased property values. In all, the Charles River wetland protection project has been a great benefit to the watershed. The wetland system is more cost effective than conventional alternatives in buffering communities against flooding. Building a wastewater treatment system using constructed wetlands costs about $5.00 per gallon of capacity compared to roughly $10.00 per gallon of capacity for a conventional advanced treatment facility, however, it should be noted that such treatment systems can be used in only limited circumstances usually associated with small communities with limited wastewater flows.
Figure 8: Wetlands naturally store and slowly release stormwater into streams (Source: Greener Loudon)
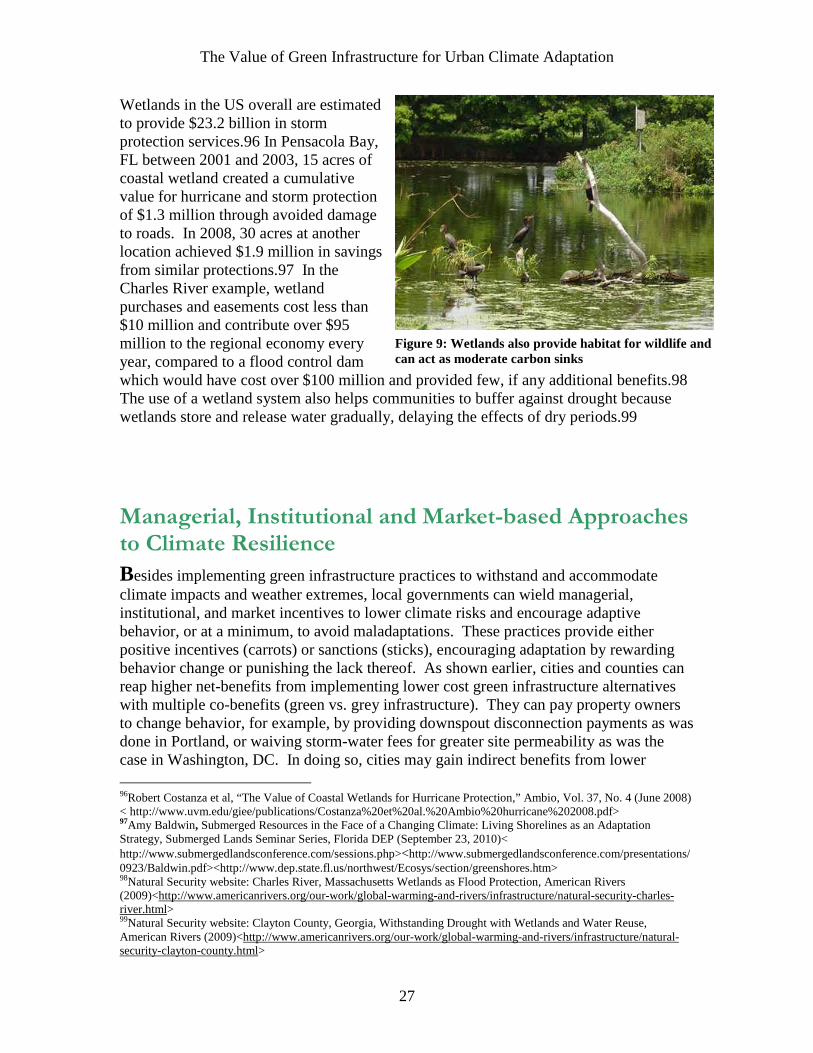
The Value of Green Infrastructure for Urban Climate Adaptation
27
Wetlands in the US overall are estimated to provide $23.2 billion in storm protection services.96 In Pensacola Bay, FL between 2001 and 2003, 15 acres of coastal wetland created a cumulative value for hurricane and storm protection of $1.3 million through avoided damage to roads. In 2008, 30 acres at another location achieved $1.9 million in savings from similar protections.97 In the Charles River example, wetland purchases and easements cost less than $10 million and contribute over $95 million to the regional economy every year, compared to a flood control dam which would have cost over $100 million and provided few, if any additional benefits.98 The use of a wetland system also helps communities to buffer against drought because wetlands store and release water gradually, delaying the effects of dry periods.99
Managerial, Institutional and Market-based Approaches to Climate Resilience
Besides implementing green infrastructure practices to withstand and accommodate climate impacts and weather extremes, local governments can wield managerial, institutional, and market incentives to lower climate risks and encourage adaptive behavior, or at a minimum, to avoid maladaptations. These practices provide either positive incentives (carrots) or sanctions (sticks), encouraging adaptation by rewarding behavior change or punishing the lack thereof. As shown earlier, cities and counties can reap higher net-benefits from implementing lower cost green infrastructure alternatives with multiple co-benefits (green vs. grey infrastructure). They can pay property owners to change behavior, for example, by providing downspout disconnection payments as was done in Portland, or waiving storm-water fees for greater site permeability as was the case in Washington, DC. In doing so, cities may gain indirect benefits from lower 96Robert Costanza et al, “The Value of Coastal Wetlands for Hurricane Protection,” Ambio, Vol. 37, No. 4 (June 2008) < http://www.uvm.edu/giee/publications/Costanza%20et%20al.%20Ambio%20hurricane%202008.pdf> 97Amy Baldwin, Submerged Resources in the Face of a Changing Climate: Living Shorelines as an Adaptation Strategy, Submerged Lands Seminar Series, Florida DEP (September 23, 2010)< http://www.submergedlandsconference.com/sessions.php><http://www.submergedlandsconference.com/presentations/0923/Baldwin.pdf><http://www.dep.state.fl.us/northwest/Ecosys/section/greenshores.htm> 98Natural Security website: Charles River, Massachusetts Wetlands as Flood Protection, American Rivers (2009)<http://www.americanrivers.org/our-work/global-warming-and-rivers/infrastructure/natural-security-charles-river.html> 99Natural Security website: Clayton County, Georgia, Withstanding Drought with Wetlands and Water Reuse, American Rivers (2009)<http://www.americanrivers.org/our-work/global-warming-and-rivers/infrastructure/natural-security-clayton-county.html>
Figure 9: Wetlands also provide habitat for wildlife and can act as moderate carbon sinks
The Value of Green Infrastructure for Urban Climate Adaptation
28
insurance premiums and increased tax revenue from the higher property values that green infrastructure can produce. They may also enjoy the benefits of greater competiveness due to the adaptation jobs that may be created by building green infrastructure. Savings from avoided public health or disaster impacts, a more reliable water supply, faster economic recovery after disasters, energy savings, and carbon storage are other benefits that cities can expect when implementing green infrastructure measures. Managerial Approaches
Green management practices may include planning, urban design, and smart growth approaches that incorporate green infrastructure into the urban landscape. Examples are higher density housing that accommodates green open spaces, large-scale urban forestry projects in neighborhoods or in green-belts around cities, or coastal wetlands buffering against hurricane storm surges or river flooding. Accommodating climate impacts is another adaptation strategy that may be implemented by decision makers, with the goal of intentionally absorbing impacts by designing communities in ways that aim to minimize damage rather than preventing it.100 Examples include local building codes in flood zones that mandate raising buildings or bridges above current and future flood-levels or requiring that first floors are “floodable”. 101 Some municipalities are intentionally designing roads as flood canals to channel water away from downtowns to increase their flood resilience, or establishing park and recreation land in town-centers as “green” floodways for when local rivers overtop their banks (for example: Grand Forks, South Dakota). The Dutch are beginning to designate parts of urban and rural areas of the Netherlands that are floodable in anticipation of future climate change, including building houses that can float in floods or flood canals through downtown Rotterdam.102 Retreating from floodplains that are frequently inundated or coastal areas threatened by sea-level rises is another strategy. Timing of expenditures is another management strategy that can be used because adaptation practices can be implemented as needed. For example, building or raising dykes can be staged until sea-level actually rises, however, planning, preparation, permitting, land acquisition, and appropriating funding can be done in advance of the need to construct. The key element of this kind of strategy is to plan and prepare in the present so that actions can be taken in the future as needed faster and at a lower cost than reactionary measures. Decision-makers can allocate funds in unconventional ways to ensure better climate adaptation. For instance, recognizing the water management benefits of green roofs, the Toronto City Council allocated $200,000 from Toronto’s
100Accommodation strategies—in comparison to retreating from a floodplain, or building a flood-barrier to prevent any damages 101Successful adaptation to climate change across scales W. Neil Adger, Nigel W. Arnella, Emma L. Tompkins, Global Environmental Change 15 (2005) 77–86< http://research.fit.edu/sealevelriselibrary/documents/doc_mgr/422/UK_Successful_Adaptation_to_CC_-_Adger_et_al_2005.pdf> 102(Adger et al (2005));(also: “Floating houses built to survive Netherlands floods: Anticipating more climate change, architects see another way to go” (November 09, 2005) By Peter Edidin, New York Times <shttp://articles.sfgate.com/2005-11-09/home-and-garden/17399121_1_flood-zones-dutch-floating>)
The Value of Green Infrastructure for Urban Climate Adaptation
29
water budget to encourage green roof construction in 2009. Subsidies were made available to property owners of $10 per square meter, up to a maximum of $20,000, for new and retrofit green roofs. Finally, there also is a critical need for local decision makers to be provided with climate change information relating to temperature change, rainfall frequency and intensity changes, floodplain adjustments, sea level rise, and storm surge changes to use to support decisions on green infrastructure implementation and other adaptive actions. King County: A Prime Example of Managerial Adaptation King County Flood Control District was reformed to merge multiple flood management zones into a single county entity for funding and policy oversight for projects and programs—in part in anticipation of increased stormwater flows from climate change. King County floodplains have been declared federal flood disaster areas 10 times since 1990 with floods in 2006 costing $33 million in damages. The primary goal of redistricting was to ensure $345 million of funding was available for maintenance, repairs, and upgrades of flood protection infrastructure such as levees. The district’s key strategies and objectives related to climate adaptation and green infrastructural include:
• Reducing risk by permanently removing flood, erosion, and landslide prone residential structures
• Reducing risk exposure by elevating structures and strengthening flood facilities • Improving floodwater conveyance and capacity by reconnecting rivers to their
floodplain • Providing safe access to homes and businesses by protecting key transportation
routes • Natural resource protection actions include sediment and erosion control, stream
corridor restoration, watershed management, forest and vegetation management, and wetland restoration and preservation103
Institutional Approaches
Insurance, finance, laws, and regulations are institutional mechanisms that can be used to incentivize adaptive behavior. Some of useful institutional mechanisms include:
• Local zoning of land-use ( such as density requirements for smart growth or rolling easements to address sea-level rise),
103King County Flood Control District- FAQ (November 2008)< http://www.kingcountyfloodcontrol.org/pdfs/kcflood_faqs.pdf>; King County Flood Control District Annual Report 2008<http://your.kingcounty.gov/dnrp/library/water-and-land/flooding/kcfzcd/crs-recertification/flood-control-district-2008-annual-report.pdf; King County Flood Control District, Hazard Mitigation Plan (March 2010)< http://your.kingcounty.gov/dnrp/library/water-and-land/flooding/local-hazard-mitigation-plan-update/KCFCD_HazardPlan_Mar2010.pdf>
The Value of Green Infrastructure for Urban Climate Adaptation
30
• Building codes, green infrastructure design standards, • Landscape ordinances, or • Federal, state, and local environmental statutes.
For example, Chicago uses a regulatory disincentive to encourage developers to include more trees in their site designs. If a construction design stipulates that a tree will be removed, the tree is assessed and assigned a dollar value which the developer must pay to the City. This measure has been encouraging developers to re-visit their designs and preserve existing trees. Insurance also helps to hedge against climate risks. To define communities eligible for insurance against flooding, the National Flood Insurance Program under the Federal Emergency Management Agency (FEMA) maps flood elevations for 1 in 100 year flood frequencies. However, the program does not currently accommodate climate change projections for increased flood frequency and intensity in determining insurability. The current mapping program may even be providing incentives for property owners to build in risky areas through the use of obsolete maps and the tolerance of repeated claims in frequently flooded locations.104 Additionally, although FEMA provides Pre-Disaster Mitigation funding to eligible communities for assessing, planning, and preparing in advance for disasters, climate change is not yet a hazard criteria. Making the appropriate changes to include climate impacts in how insurance programs assess risks could have a large effect on adaptive behavior. A study in Saskatchewan, Canada in 2008 showed that using zoning approaches to address climate change impacts can be more cost-effective than conventional grey infrastructure methods. This climate and economic modeling study compared zoning methods to hard infrastructure approaches in their ability to avoid cost impacts from climate change-induced flooding over the next 25 years. Building more flood infrastructure was found to save an estimated $10 million in avoided flood damages, while rezoning alone would save $155 million, over 15 times more.105 What this section also highlights is that federal funding of actions in local areas should be tied to policies and measures that account for climate change risks and federal measures should be adapted to account for these risks. Market Mechanisms Market mechanisms shift the cost of implementing green infrastructure in positive directions, increasing the feasibility of implementation. As discussed throughout this paper, local governments can reap financial benefits from green infrastructure by using cheaper green alternatives or avoiding costs of future climate damage. They can also provide funding directly to property owners for on site implementation. For example, 104Legally, the program defines flood zones using historic climate data applied to current conditions 105Christensen, Paul N., Gordon A. Sparks, and Harvey Hill (2008) “ Adapting to Climate Extreme Events Risks across Canada’s Agricultural Economic Landscape: An Integrated Pilot Study of Watershed Infrastructure System Adaptation.” Climate Change Impact and Adaptation Program. Natural Resources Canada Project No. A1473. Prepared for Natural Resources Canada by Department of Civil and Geological Engineering, University of Saskatchewan, Saskatoon, SK; Prairie Farm Rehabilitation Administration; Agriculture and Agri-Food Canada < http://www.policyresearch.gc.ca/page.asp?pagenm=2010-0041_09>
The Value of Green Infrastructure for Urban Climate Adaptation
31
California initiated the Cool Savings Program which provided rebates to building owners for installing roofing materials with high solar reflectivity and low thermal absorption. The California Energy Commission paid incentives of 15 to 25 cents per square foot of eligible roofing area. The program was so successful that California revised its Title 24 to make cool roofs on certain new or renovated buildings mandatory starting in 2005. In the future, new mortgage products imitating PACE loans may incorporate the costs of adaptation into private property transactions. 106 Noted above, tax credits for green infrastructure implementation, reduced storm-water fees rewarding greater site permeability, or rebates for downspout disconnection are just a few examples of how to change price incentives by making some behaviors cheaper or more expensive. For example, starting in 2007, New York City aimed to support the installation of extensive green roofs by enacting a property tax abatement to offset 35% of the installation cost of a green roof. Keeping discount rates low also makes investing in green infrastructure that has longer-term benefits more valuable. As noted earlier, demonstrated increases in property values from green-infrastructure raising tax revenue, or lowering insurance premiums from greater site resilience also creates market incentives.
Conclusions: Implications for Policy, Research and Technical Assistance Asking the Resilience Question
Green infrastructure is a means for simultaneously advancing environmental sustainability, smart growth, and now climate adaptation goals in urban settings with a goal of creating more resilient metropolitan communities. Although definitions of these concepts are at times vague and not entirely complementary they do overlap to a significant extent.107 Sustainable development seeks goals of environmental protection, economic viability, and long-term resource continuity along with equity and social justice particularly for vulnerable populations. Smart growth uses the tools of planning and urban design to achieve resource efficiencies, building density, mixed land-uses, open space, public transit oriented development, and enhanced quality of life. More recently, climate adaptation policies and practices have sought to build the capacity of local communities and decision makers to better assess and manage risks, impacts, and opportunities from irreversible climate change and extreme weather (floods, droughts, wildfire, sea-level rise, and public health threats, etc.). Adaptation to climate change also is seen as having ecological, economic, and social dimensions.108
106PACE: Property Assessed Clean Energy allows a local government to provide loans to homeowners for renewable energy and efficiency retrofits paying back via tax bills. However, PACE currently has been defined by the Federal government as an illegal lien on houses so the future of this mechanism is in question. 107Intergovernmental Panel on Climate Change (IPCC), 4th Assessment Report (2007): WG II Adaptation 108 IPCC, AR4 (2007)
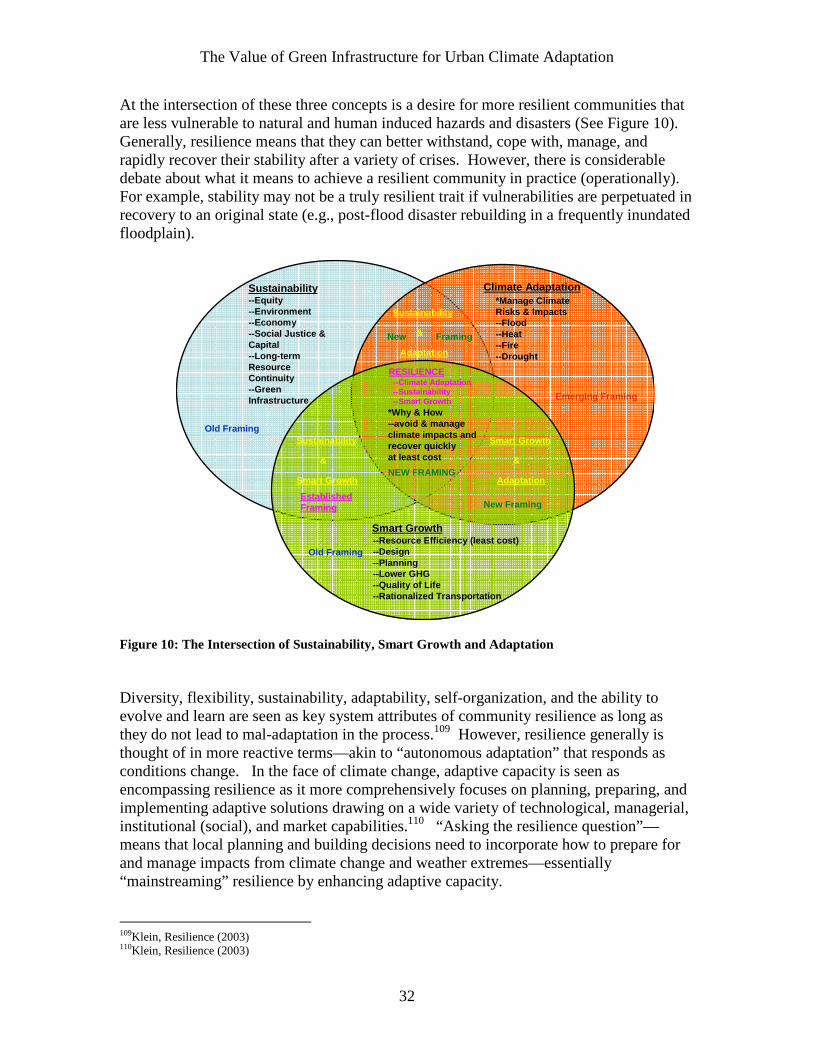
The Value of Green Infrastructure for Urban Climate Adaptation
32
At the intersection of these three concepts is a desire for more resilient communities that are less vulnerable to natural and human induced hazards and disasters (See Figure 10). Generally, resilience means that they can better withstand, cope with, manage, and rapidly recover their stability after a variety of crises. However, there is considerable debate about what it means to achieve a resilient community in practice (operationally). For example, stability may not be a truly resilient trait if vulnerabilities are perpetuated in recovery to an original state (e.g., post-flood disaster rebuilding in a frequently inundated floodplain).
Figure 10: The Intersection of Sustainability, Smart Growth and Adaptation Diversity, flexibility, sustainability, adaptability, self-organization, and the ability to evolve and learn are seen as key system attributes of community resilience as long as they do not lead to mal-adaptation in the process.109 However, resilience generally is thought of in more reactive terms—akin to “autonomous adaptation” that responds as conditions change. In the face of climate change, adaptive capacity is seen as encompassing resilience as it more comprehensively focuses on planning, preparing, and implementing adaptive solutions drawing on a wide variety of technological, managerial, institutional (social), and market capabilities.110 “Asking the resilience question”—means that local planning and building decisions need to incorporate how to prepare for and manage impacts from climate change and weather extremes—essentially “mainstreaming” resilience by enhancing adaptive capacity. 109Klein, Resilience (2003) 110Klein, Resilience (2003)
Climate Adaptation*Manage Climate Risks & Impacts--Flood--Heat--Fire--Drought
Sustainability--Equity--Environment--Economy--Social Justice &Capital--Long-termResourceContinuity--Green Infrastructure
Smart Growth--Resource Efficiency (least cost)--Design--Planning--Lower GHG--Quality of Life--Rationalized Transportation
Sustainability
Smart Growth
&
Sustainability
Adaptation
&
Smart Growth
Adaptation
&
*Covers Multiple Scales--Building--Site--Neighborhood--City--Region
Established Framing
RESILIENCE--Climate Adaptation--Sustainability--Smart Growth
*Covers Multiple Benefits & Best Practices*Plus Other Incentives
Old Framing
Old Framing
Emerging Framing
New Framing
FramingNew
NEW FRAMING
Paper will focus on the intersection of “new framings”
*Why & How--avoid & manageclimate impacts andrecover quickly at least cost
The Value of Green Infrastructure for Urban Climate Adaptation
33
Delivering Adaptive Solutions through Climate Extension Services
A lthough local governments and communities are using green infrastructure to achieve a variety of environmental and economic goals, including resilience to climate change, application of green infrastructure solutions are not yet widespread as adaptation best practices. Many communities either are unaware of the benefits of green infrastructure to begin with or believe it’s more expensive or difficult to implement than traditional grey approaches. Meanwhile, communities that have embraced green infrastructure may not have connected it with adapting to climate change, or if they have, they may not possess the necessary capacity, know-how, or resources to plan and implement solutions. One solution to these barriers of awareness, willingness, and capacity is climate extension. Climate extension would be a means to customize and deliver adaptation information and to provide technical assistance and capacity to meet specific local adaptation needs. Practical advice connecting green infrastructure with climate adaptation could be brought to bear from university, non-profit, or federal and state government “climate extension specialists” embedded in local communities. The most important information that climate extension specialist could provide would be timely and up to date forecasts and information on likely climate change impacts in the local urban area. They also could provide technical assistance to both local governments and property owners on green infrastructure practices highlighted in this report including: installing green roofs to mitigate urban heat island effects and manage storm-water, changes to building codes encouraging green infrastructure practices, managing urban forestry operations, and establishing green alley, downspout disconnection, and water conservation incentive programs. Extension specialists could help city managers make the case to elected officials and citizens about the value and multiple benefits of green infrastructure in the context of climate change adaptation. Organizations, such as, Casey Trees, the Center for Watershed Protection, the Center for Neighborhood Technology, American Rivers, and ICLEI Local Governments for Sustainability are beginning to fulfill climate extension roles. Universities in Arizona, Florida, Massachusetts, and Oregon have hired climate extension specialists to work with farmers, land and resource managers, and urban decision makers. NOAA’s National Sea Grant Program is working with states on piloting climate extension in coastal communities.111 Several CCAP Urban Leaders partners have made clear connections between green infrastructure and climate adaptation in their city management and outreach programs including Chicago, Miami-Dade County, New York City and Toronto providing extension to their own citizens
111NOAA Sea Grant Initiates $1.2 Million Community Climate Change Adaptation Initiative: http://www.noaanews.noaa.gov/stories2010/20100909_seagrant.html
The Value of Green Infrastructure for Urban Climate Adaptation
34
Closing Thoughts on Green Infrastructure and Resilience
This report provides evidence of the value of green infrastructure for local climate adaptation based on significant net benefits and successful local action. In providing comparable cost, performance, and benefits data across a selection of green infrastructure practices the report avoids equating each practice as a solution to a single climate related problem but rather shows that a mix of approaches is best. For example, white roofs are often promoted as a panacea to reducing urban heat island effects while ignoring the value of vegetated roofs to both lower temperature and to manage storm runoff at comparable net benefit (even at higher initial investment). Instead, this report encourages consideration of the multiple benefits of single green infrastructure solutions, the trade-off among solutions to achieve multiple benefits, and how a combination of solutions may lead to the highest net climate adaptation benefits depending on local needs, capacities, and resources. For example, a building with a combination vegetated, white, and blue roof, surrounded by green alleys incentivized under a downspout disconnect program, and encouraged by a permeable pavement ordinance, shaded by street trees, and buffered from floods by local wetlands, not only receives multiple net-benefits from green infrastructure but de facto is more adapted to and mitigates climate change. If all public and private property owners in a neighborhood, city, or county simultaneously implement these practices the result is greater overall climate resilience across a region. Interest in green infrastructure continues to grow with recognition from federal, state, and local governments that practices can be used to solve multiple environmental problems--complimenting more traditional infrastructure solutions. The connection to climate adaptation is emerging—in some cases explicitly. Urban Leaders partners Chicago, New York City, Toronto, Miami-Dade and King Counties are all implementing green infrastructure as an adaptation strategy. American Rivers and New York City have made clear linkages between storm-water, river basin management, climate adaptation, and community resilience in local urban planning. At the federal level, Dr. Steven Chu, the Secretary of Energy, promotes white roofs as a means to lower global and urban temperatures as well as energy used for cooling—even if he does not frame it as climate adaptation. National policies on green infrastructure and climate adaptation are beginning to emerge. In July 2009, Senators Tom Udall and Sheldon Whitehouse introduced S 3561 ‘The Green Infrastructure for Clean Water Act of 2010’ finding that green infrastructure can ameliorate the impacts of climate change on water resources. In October 2010, the White House Climate Change Adaptation Task Force made recommendations to President Obama for how Federal Agency policies and programs can better prepare the United States to respond to the impacts of climate change.112 In the report, Joyce Coffee, Urban Leader partner from Chicago is quoted: “The Federal Government should use the precautionary principle to encourage cities to plan for greater uncertainty and variability when building green and grey infrastructure by asking respondents to describe how their planned projects adapt to climate change.” Later in the report, The Nature Conservancy
112White House Climate Change Adaptation Task Force www.whitehouse.gov/administration/eop/ceq/initiatives/adaptation; Final Report: www.whitehouse.gov/sites/default/files/microsites/ceq/Interagency-Climate-Change-Adaptation-Progress-Report.pdf
The Value of Green Infrastructure for Urban Climate Adaptation
35
notes: “While certain hard infrastructure responses to climate change will be needed, it is clear that effective long term adaptation to climate change will depend on reducing the vulnerability and increasing the resilience of ecosystems and their essential services.” Although these references are encouraging, connecting green infrastructure and climate adaptation in national policies in support of local resilience will be an on-going policy challenge. Asking the Resilience Question is another way of emphasizing the continuing importance of mainstreaming resilience into the decisions of elected leaders, local managers, businesses, and citizens. Evidence from this report shows that a combination of green infrastructure practices at the intersection of sustainability, smart growth, and climate adaptation create strategies producing the highest net-benefits to individuals and society as a whole. Ultimately, the net-value of enhanced social, environmental, and economic resilience from green-infrastructure will be at the core of resilient communities in a climate changed future.
The Value of Green Infrastructure for Urban Climate Adaptation
1
APPENDIX: EXAMPLES OF COMPREHENSIVE GREEN INFRASTRUCTURE STRATEGIES Depending on circumstances and motivations, CCAP Urban Leaders partners and other pioneering communities have embraced the application of green infrastructure and technologies as a means to prepare for and adapt to climate impacts and as a path to environmental sustainability. Often green approaches are combined with modifications to other traditional “hard” infrastructures (e.g., fixing, expanding, or redesigning storm-sewers and streets, building storm-water storage tunnels, etc.). As discussed throughout this report, cities have incentivized green infrastructure projects by: 1) Showing evidence of upfront or life-cycle cost savings when compared to alternatives for both public and private projects, 2) Providing direct financial incentives to property owners for green infrastructure installation, 3) Instituting laws, regulations, and local ordinances requiring implementation of green infrastructure on private property, or 4) Mandating that public projects incorporate green infrastructure to demonstrate viability and value (e.g., street tree planting, green modifications to roads, green-roofs on public buildings). The following are some comprehensive examples of green infrastructure investments in urban regions of the United States to illustrate how communities are combining the practices discussed above to achieve the greatest economic and environmental benefits. CHICAGO
Chicago’s Green Urban Design (GUD) Plan was launched as a partnership among City agencies, nonprofits, and the private sector to help to better manage flooding (and also heat impacts. Rainfall filtration and capture is a key goal using permeable pavements, rooftop and surface rain gardens, and green alleys. In 2007, 30 green alleys with permeable pavement and high-reflectivity concrete had been installed, along with over 200 catch-basins across the city. Green alley design also encouraged homeowner involvement in disconnecting of rain-gutter downspouts from the sewer system, addition of rain-barrels to capture rooftop runoff, and backup power supplies to sump pumps to prevent basement flooding. The goal is to slow the rate of storm-water runoff onsite to prevent localized flooding and to support the capacity of aging infrastructure to handle extreme precipitation events.
Additionally, over 775 miles of combined storm and sewer pipes were modeled to evaluate surface and basement flooding problem spots and to recommend cost effective solutions—
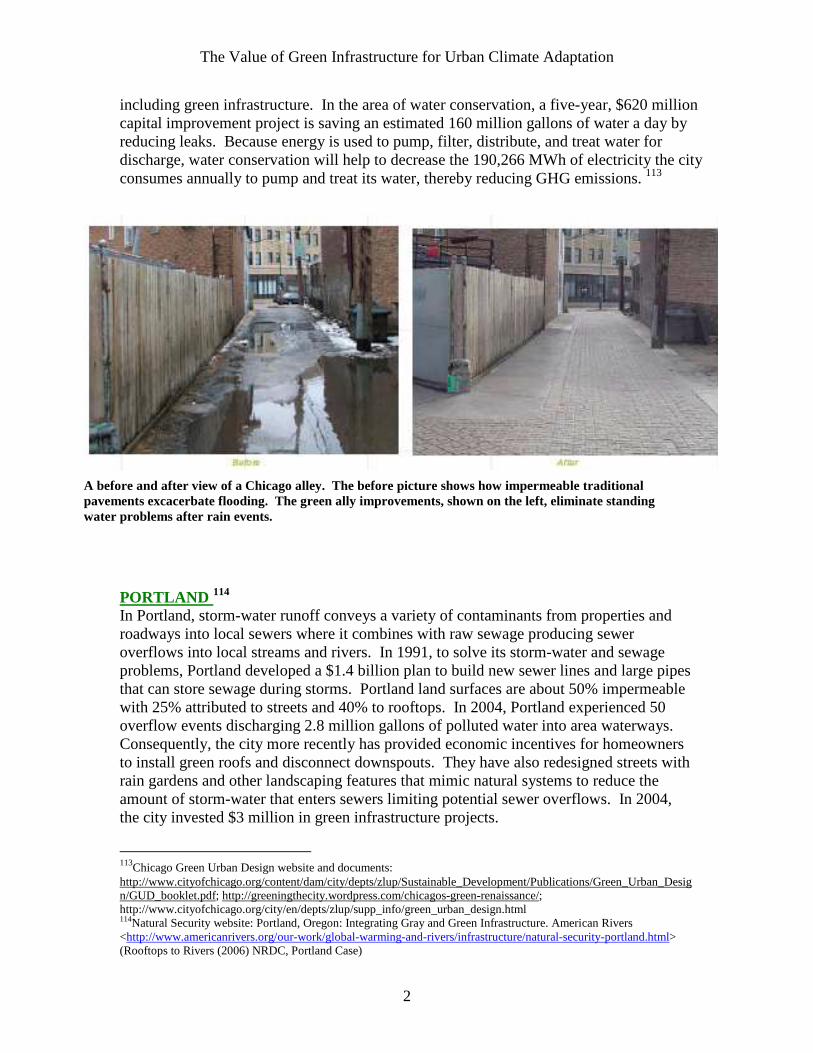
The Value of Green Infrastructure for Urban Climate Adaptation
2
including green infrastructure. In the area of water conservation, a five-year, $620 million capital improvement project is saving an estimated 160 million gallons of water a day by reducing leaks. Because energy is used to pump, filter, distribute, and treat water for discharge, water conservation will help to decrease the 190,266 MWh of electricity the city consumes annually to pump and treat its water, thereby reducing GHG emissions. 113
PORTLAND 114 In Portland, storm-water runoff conveys a variety of contaminants from properties and roadways into local sewers where it combines with raw sewage producing sewer overflows into local streams and rivers. In 1991, to solve its storm-water and sewage problems, Portland developed a $1.4 billion plan to build new sewer lines and large pipes that can store sewage during storms. Portland land surfaces are about 50% impermeable with 25% attributed to streets and 40% to rooftops. In 2004, Portland experienced 50 overflow events discharging 2.8 million gallons of polluted water into area waterways. Consequently, the city more recently has provided economic incentives for homeowners to install green roofs and disconnect downspouts. They have also redesigned streets with rain gardens and other landscaping features that mimic natural systems to reduce the amount of storm-water that enters sewers limiting potential sewer overflows. In 2004, the city invested $3 million in green infrastructure projects.
113Chicago Green Urban Design website and documents: http://www.cityofchicago.org/content/dam/city/depts/zlup/Sustainable_Development/Publications/Green_Urban_Design/GUD_booklet.pdf; http://greeningthecity.wordpress.com/chicagos-green-renaissance/; http://www.cityofchicago.org/city/en/depts/zlup/supp_info/green_urban_design.html 114Natural Security website: Portland, Oregon: Integrating Gray and Green Infrastructure. American Rivers <http://www.americanrivers.org/our-work/global-warming-and-rivers/infrastructure/natural-security-portland.html> (Rooftops to Rivers (2006) NRDC, Portland Case)
A before and after view of a Chicago alley. The before picture shows how impermeable traditional pavements excacerbate flooding. The green ally improvements, shown on the left, eliminate standing water problems after rain events.
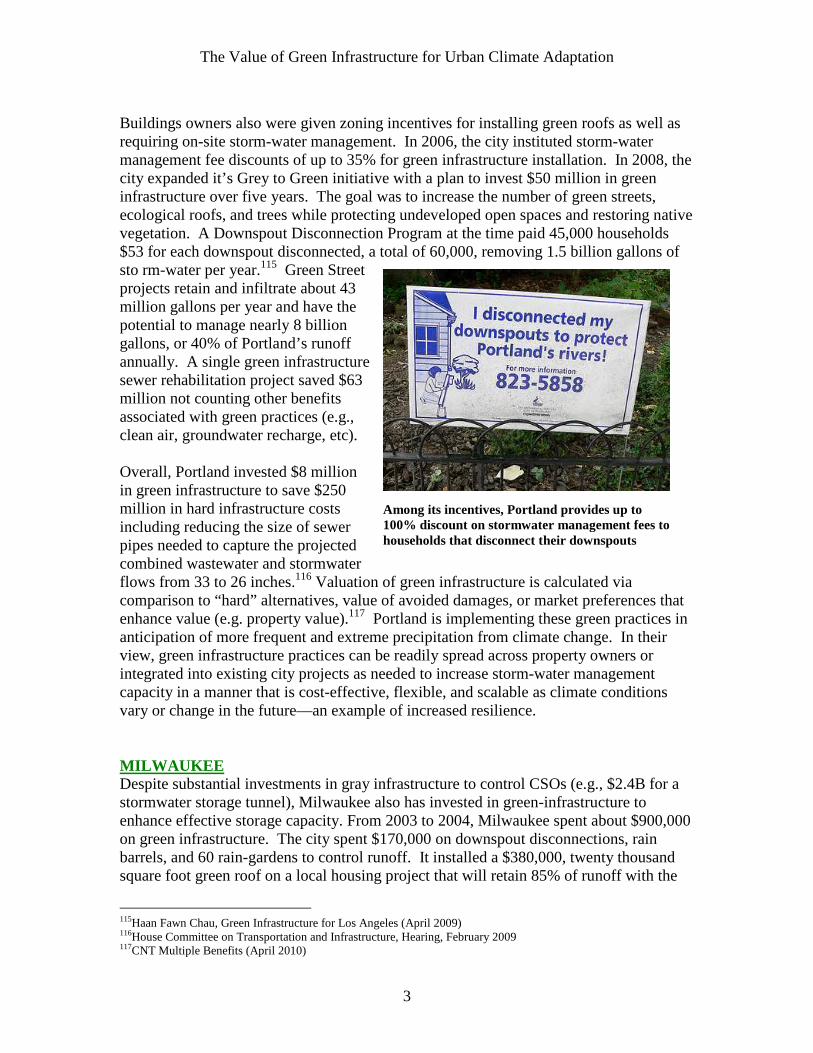
The Value of Green Infrastructure for Urban Climate Adaptation
3
Buildings owners also were given zoning incentives for installing green roofs as well as requiring on-site storm-water management. In 2006, the city instituted storm-water management fee discounts of up to 35% for green infrastructure installation. In 2008, the city expanded it’s Grey to Green initiative with a plan to invest $50 million in green infrastructure over five years. The goal was to increase the number of green streets, ecological roofs, and trees while protecting undeveloped open spaces and restoring native vegetation. A Downspout Disconnection Program at the time paid 45,000 households $53 for each downspout disconnected, a total of 60,000, removing 1.5 billion gallons of sto rm-water per year.115 Green Street projects retain and infiltrate about 43 million gallons per year and have the potential to manage nearly 8 billion gallons, or 40% of Portland’s runoff annually. A single green infrastructure sewer rehabilitation project saved $63 million not counting other benefits associated with green practices (e.g., clean air, groundwater recharge, etc). Overall, Portland invested $8 million in green infrastructure to save $250 million in hard infrastructure costs including reducing the size of sewer pipes needed to capture the projected combined wastewater and stormwater flows from 33 to 26 inches.116 Valuation of green infrastructure is calculated via comparison to “hard” alternatives, value of avoided damages, or market preferences that enhance value (e.g. property value).117 Portland is implementing these green practices in anticipation of more frequent and extreme precipitation from climate change. In their view, green infrastructure practices can be readily spread across property owners or integrated into existing city projects as needed to increase storm-water management capacity in a manner that is cost-effective, flexible, and scalable as climate conditions vary or change in the future—an example of increased resilience. MILWAUKEE Despite substantial investments in gray infrastructure to control CSOs (e.g., $2.4B for a stormwater storage tunnel), Milwaukee also has invested in green-infrastructure to enhance effective storage capacity. From 2003 to 2004, Milwaukee spent about $900,000 on green infrastructure. The city spent $170,000 on downspout disconnections, rain barrels, and 60 rain-gardens to control runoff. It installed a $380,000, twenty thousand square foot green roof on a local housing project that will retain 85% of runoff with the
115Haan Fawn Chau, Green Infrastructure for Los Angeles (April 2009) 116House Committee on Transportation and Infrastructure, Hearing, February 2009 117CNT Multiple Benefits (April 2010)
Among its incentives, Portland provides up to 100% discount on stormwater management fees to households that disconnect their downspouts
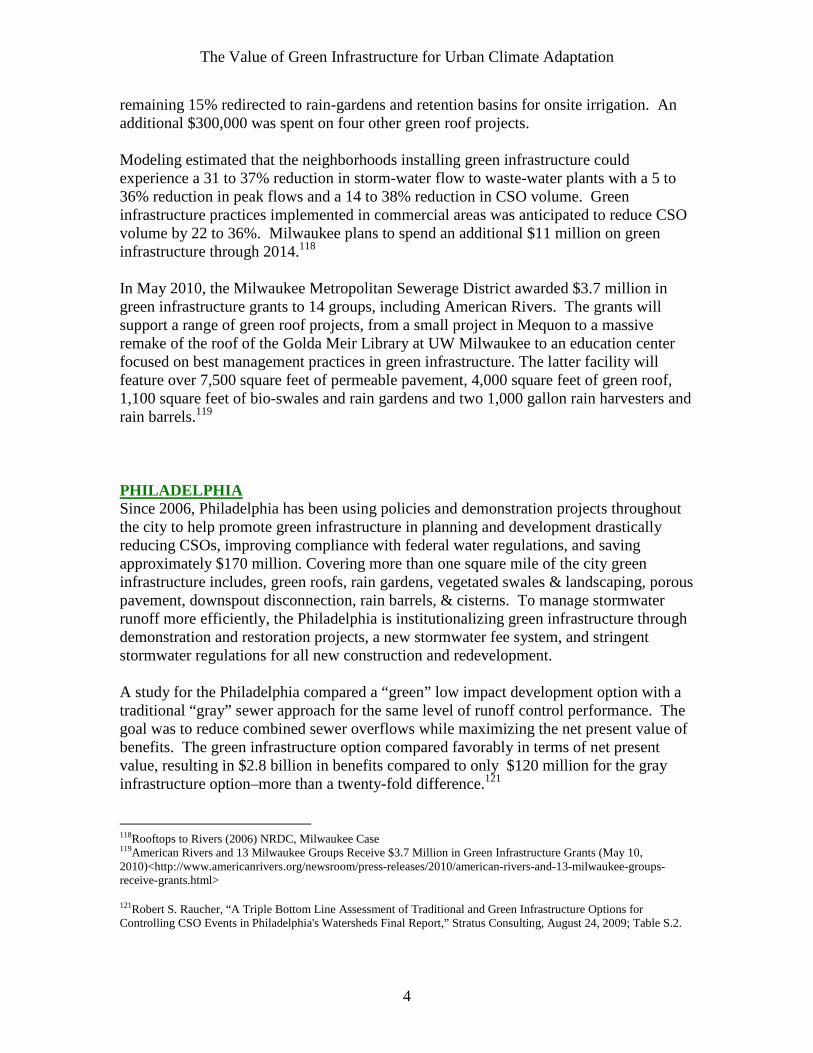
The Value of Green Infrastructure for Urban Climate Adaptation
4
remaining 15% redirected to rain-gardens and retention basins for onsite irrigation. An additional $300,000 was spent on four other green roof projects. Modeling estimated that the neighborhoods installing green infrastructure could experience a 31 to 37% reduction in storm-water flow to waste-water plants with a 5 to 36% reduction in peak flows and a 14 to 38% reduction in CSO volume. Green infrastructure practices implemented in commercial areas was anticipated to reduce CSO volume by 22 to 36%. Milwaukee plans to spend an additional $11 million on green infrastructure through 2014.118 In May 2010, the Milwaukee Metropolitan Sewerage District awarded $3.7 million in green infrastructure grants to 14 groups, including American Rivers. The grants will support a range of green roof projects, from a small project in Mequon to a massive remake of the roof of the Golda Meir Library at UW Milwaukee to an education center focused on best management practices in green infrastructure. The latter facility will feature over 7,500 square feet of permeable pavement, 4,000 square feet of green roof, 1,100 square feet of bio-swales and rain gardens and two 1,000 gallon rain harvesters and rain barrels.119 PHILADELPHIA Since 2006, Philadelphia has been using policies and demonstration projects throughout the city to help promote green infrastructure in planning and development drastically reducing CSOs, improving compliance with federal water regulations, and saving approximately $170 million. Covering more than one square mile of the city green infrastructure includes, green roofs, rain gardens, vegetated swales & landscaping, porous pavement, downspout disconnection, rain barrels, & cisterns. To manage stormwater runoff more efficiently, the Philadelphia is institutionalizing green infrastructure through demonstration and restoration projects, a new stormwater fee system, and stringent stormwater regulations for all new construction and redevelopment. A study for the Philadelphia compared a “green” low impact development option with a traditional “gray” sewer approach for the same level of runoff control performance. The goal was to reduce combined sewer overflows while maximizing the net present value of benefits. The green infrastructure option compared favorably in terms of net present value, resulting in $2.8 billion in benefits compared to only $120 million for the gray infrastructure option–more than a twenty-fold difference.121 118Rooftops to Rivers (2006) NRDC, Milwaukee Case 119American Rivers and 13 Milwaukee Groups Receive $3.7 Million in Green Infrastructure Grants (May 10, 2010)<http://www.americanrivers.org/newsroom/press-releases/2010/american-rivers-and-13-milwaukee-groups-receive-grants.html> 121Robert S. Raucher, “A Triple Bottom Line Assessment of Traditional and Green Infrastructure Options for Controlling CSO Events in Philadelphia's Watersheds Final Report,” Stratus Consulting, August 24, 2009; Table S.2.
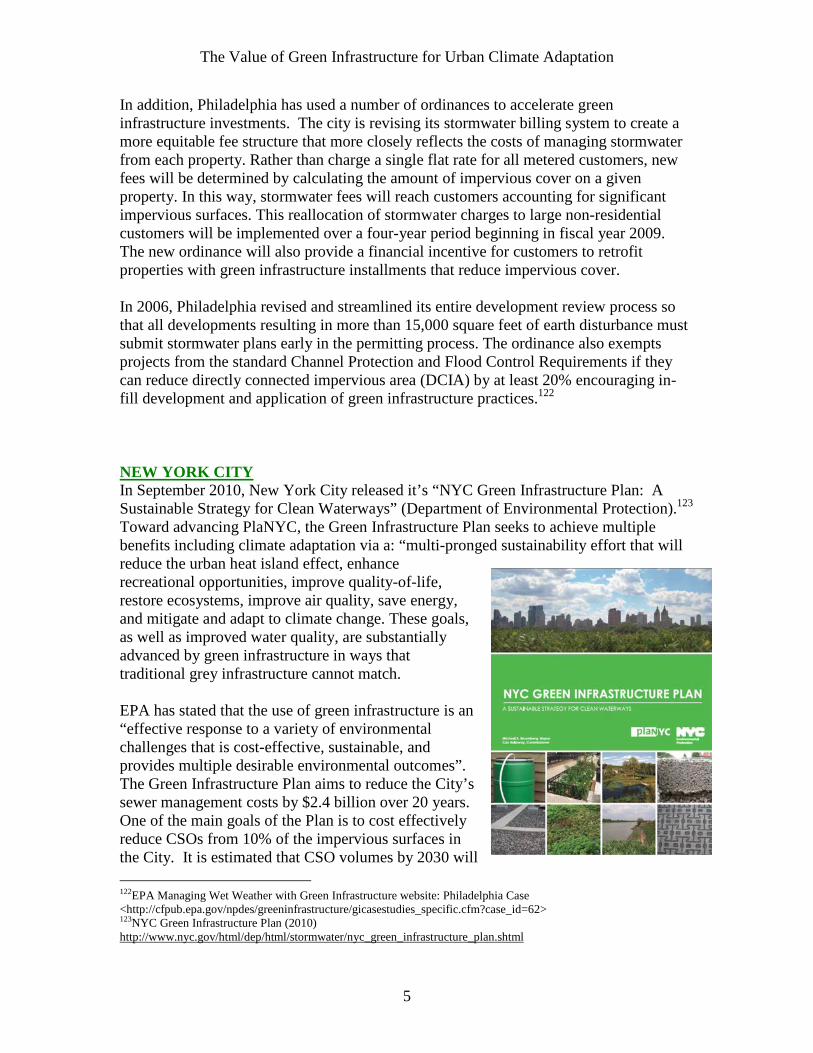
The Value of Green Infrastructure for Urban Climate Adaptation
5
In addition, Philadelphia has used a number of ordinances to accelerate green infrastructure investments. The city is revising its stormwater billing system to create a more equitable fee structure that more closely reflects the costs of managing stormwater from each property. Rather than charge a single flat rate for all metered customers, new fees will be determined by calculating the amount of impervious cover on a given property. In this way, stormwater fees will reach customers accounting for significant impervious surfaces. This reallocation of stormwater charges to large non-residential customers will be implemented over a four-year period beginning in fiscal year 2009. The new ordinance will also provide a financial incentive for customers to retrofit properties with green infrastructure installments that reduce impervious cover. In 2006, Philadelphia revised and streamlined its entire development review process so that all developments resulting in more than 15,000 square feet of earth disturbance must submit stormwater plans early in the permitting process. The ordinance also exempts projects from the standard Channel Protection and Flood Control Requirements if they can reduce directly connected impervious area (DCIA) by at least 20% encouraging in-fill development and application of green infrastructure practices.122 NEW YORK CITY In September 2010, New York City released it’s “NYC Green Infrastructure Plan: A Sustainable Strategy for Clean Waterways” (Department of Environmental Protection).123 Toward advancing PlaNYC, the Green Infrastructure Plan seeks to achieve multiple benefits including climate adaptation via a: “multi-pronged sustainability effort that will reduce the urban heat island effect, enhance recreational opportunities, improve quality-of-life, restore ecosystems, improve air quality, save energy, and mitigate and adapt to climate change. These goals, as well as improved water quality, are substantially advanced by green infrastructure in ways that traditional grey infrastructure cannot match. EPA has stated that the use of green infrastructure is an “effective response to a variety of environmental challenges that is cost-effective, sustainable, and provides multiple desirable environmental outcomes”. The Green Infrastructure Plan aims to reduce the City’s sewer management costs by $2.4 billion over 20 years. One of the main goals of the Plan is to cost effectively reduce CSOs from 10% of the impervious surfaces in the City. It is estimated that CSO volumes by 2030 will 122EPA Managing Wet Weather with Green Infrastructure website: Philadelphia Case <http://cfpub.epa.gov/npdes/greeninfrastructure/gicasestudies_specific.cfm?case_id=62> 123NYC Green Infrastructure Plan (2010) http://www.nyc.gov/html/dep/html/stormwater/nyc_green_infrastructure_plan.shtml
The Value of Green Infrastructure for Urban Climate Adaptation
6
be 2 billion gallons less using green practices than building grey infrastructure. The cost to implement the overall Plan is $1.5 billion less then grey, with green storm-water capture alone saving $1billion at a cost per gallon of about $.15 less. Sustainability benefits over the 20 year life of the project range from $139 - $418 million depending on measures implemented. The plan estimates that “every fully vegetated acre of green infrastructure would provide total annual benefits of $8,522 in reduced energy demand, $166 in reduced CO2 emissions, $1,044 in improved air quality, and $4,725 in increased property value.”

Center for Clean Air Policy 750 First Street, NE • Suite 940
Washington, DC 20002 Tel: 202.408.9260 • Fax: 202.408.8896
www.ccap.org
Related Documents


