Green Infrastructure and Air Quality October 27, 2016 Robyn DeYoung U.S. EPA 1

Welcome message from author
This document is posted to help you gain knowledge. Please leave a comment to let me know what you think about it! Share it to your friends and learn new things together.
Transcript
Green Infrastructure and
Air QualityOctober 27, 2016
Robyn DeYoung
U.S. EPA
1
Today’s Presentation
• What is green infrastructure?
• How can green infrastructure benefit your community?
• How does green infrastructure improve air quality and resiliency to climate change?
• Applications of green infrastructure and emission reductions• EPA’s Ozone and PM Advance participants
• Estimating benefits of green roofs in Kansas City, MO
• Green infrastructure resources for air quality regulators
2
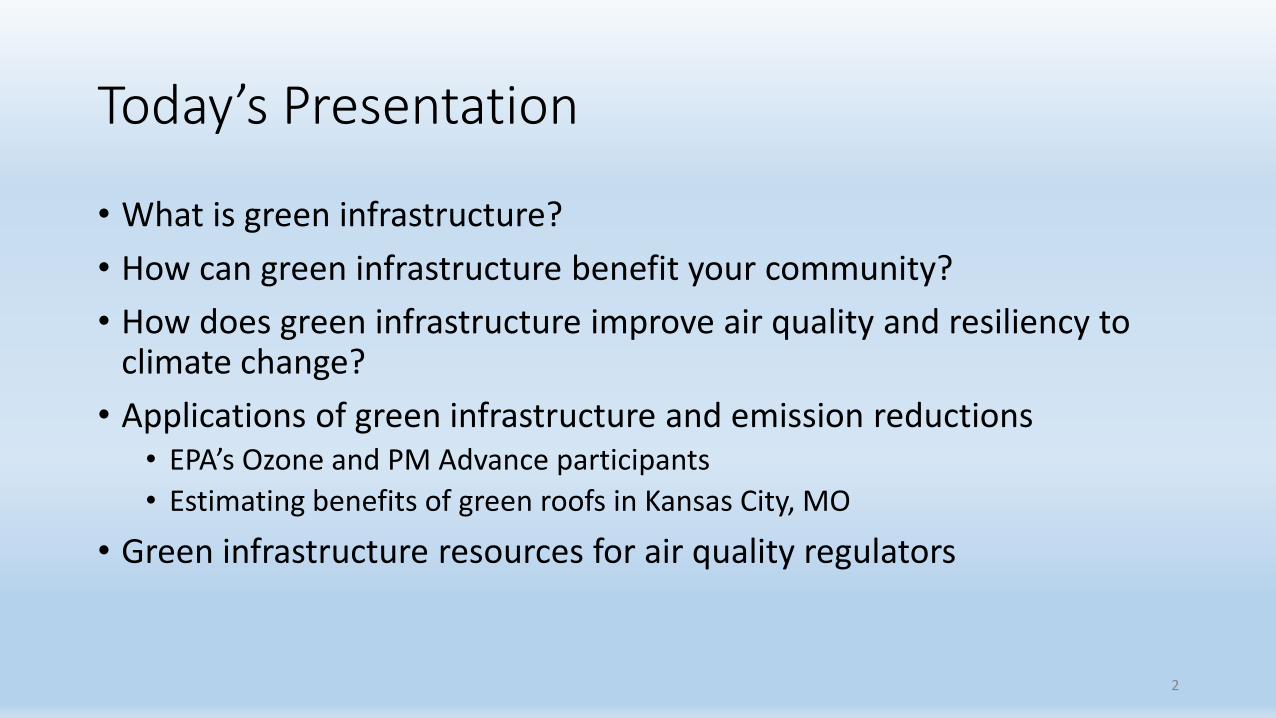
What is Green Infrastructure?
• Green infrastructure uses plants, soils and nature itself to manage stormwater and create healthier urban environments. Communities can create or preserve existing vegetated areas to protect their waterways and increase resiliency during heavy precipitation events.
• Green infrastructure practices are used to complement gray infrastructure – pipes, storage facilities and treatment systems.
3
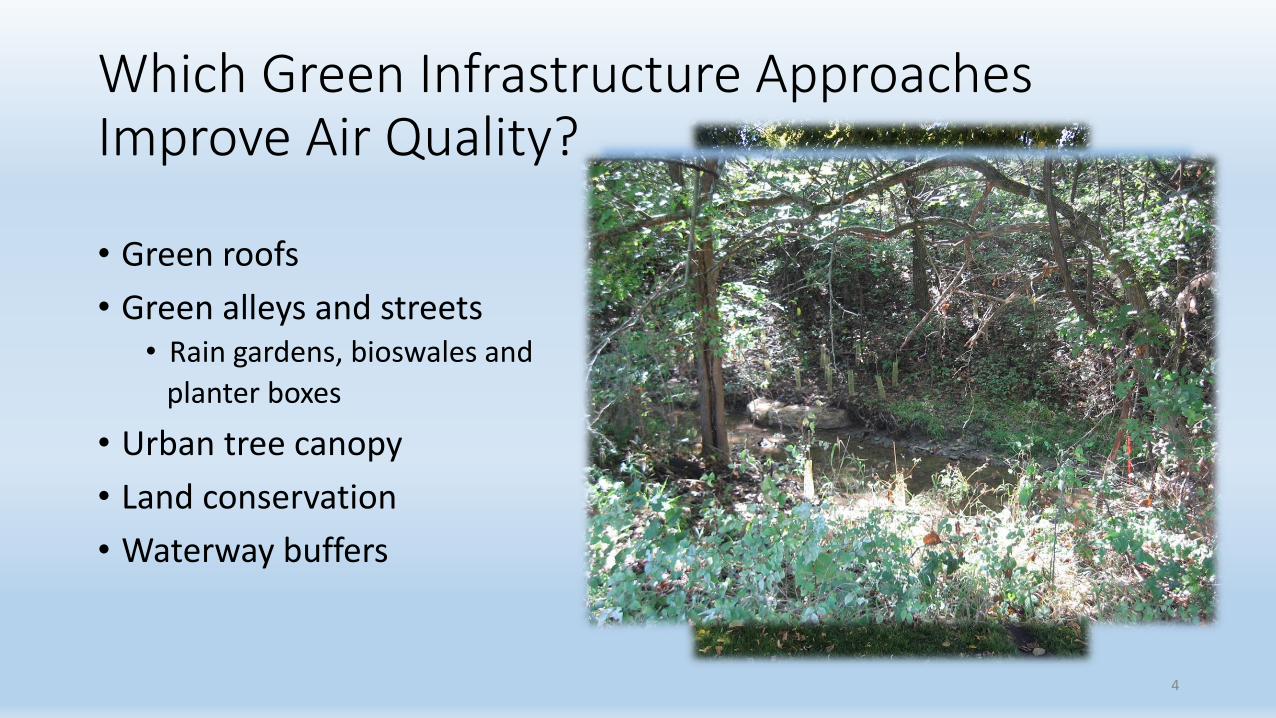
Which Green Infrastructure Approaches Improve Air Quality?
• Green roofs
• Green alleys and streets• Rain gardens, bioswales and
planter boxes
• Urban tree canopy
• Land conservation
• Waterway buffers
4
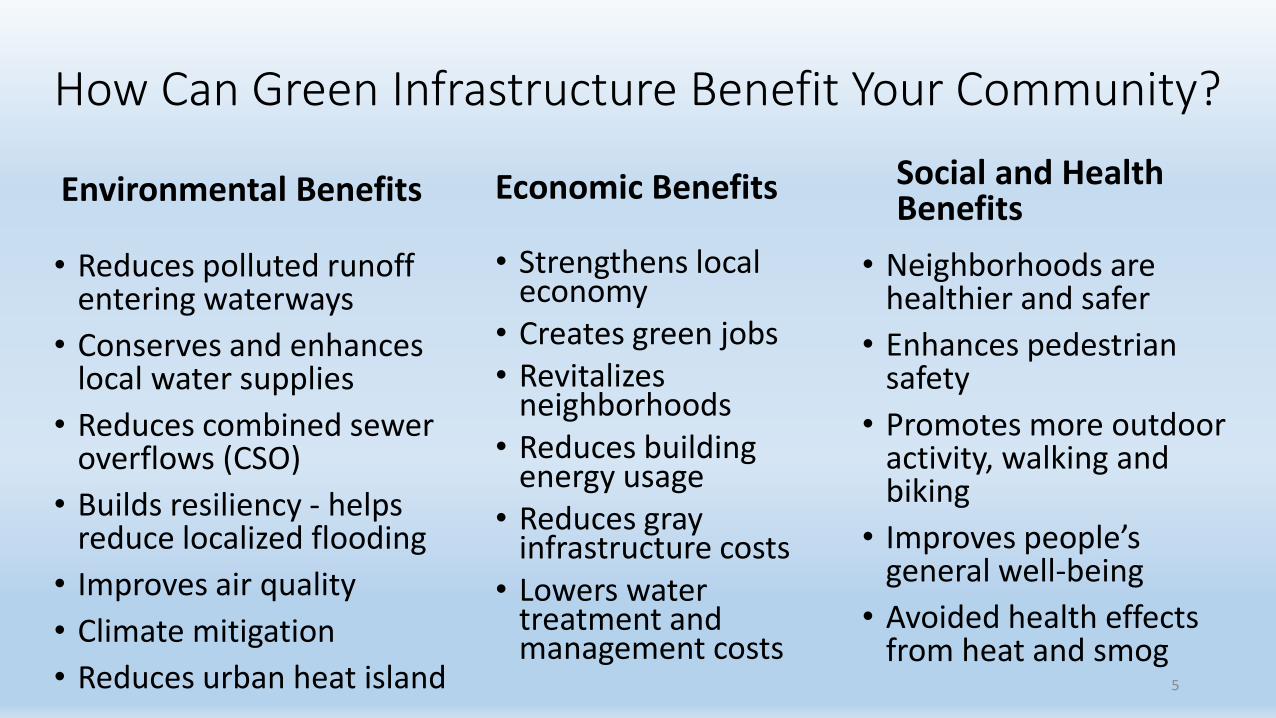
How Can Green Infrastructure Benefit Your Community?
Environmental Benefits
• Reduces polluted runoff entering waterways
• Conserves and enhances local water supplies
• Reduces combined sewer overflows (CSO)
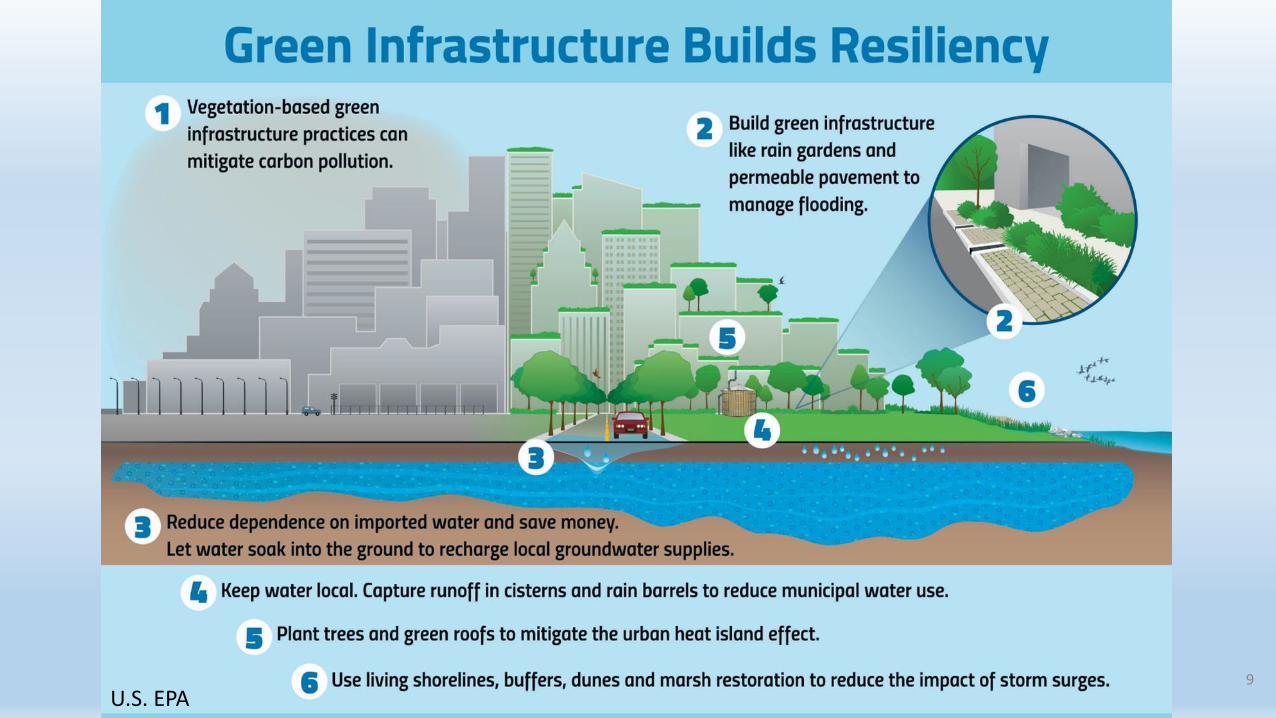
• Builds resiliency - helps reduce localized flooding
• Improves air quality
• Climate mitigation
• Reduces urban heat island
Economic Benefits
• Strengthens local economy
• Creates green jobs• Revitalizes
neighborhoods • Reduces building
energy usage• Reduces gray
infrastructure costs• Lowers water
treatment and management costs
5
Social and Health Benefits
• Neighborhoods are healthier and safer
• Enhances pedestrian safety
• Promotes more outdoor activity, walking and biking
• Improves people’s general well-being
• Avoided health effects from heat and smog
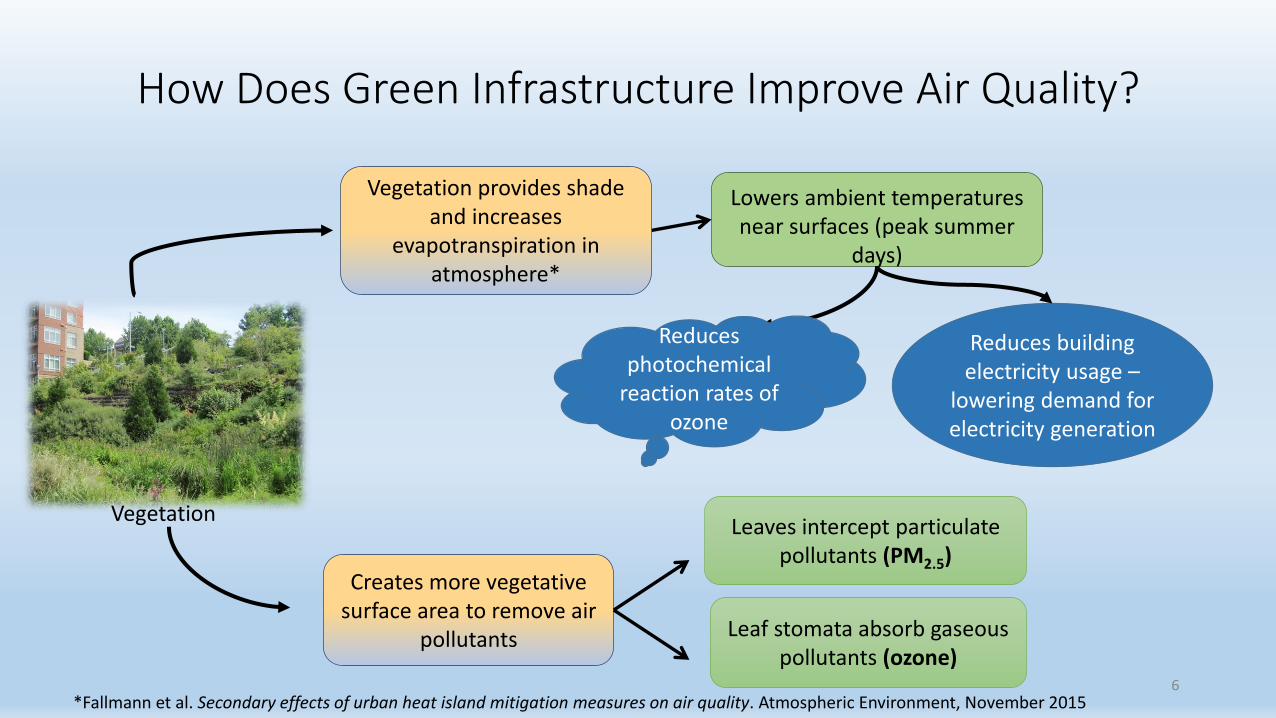
How Does Green Infrastructure Improve Air Quality?
6
Lowers ambient temperatures near surfaces (peak summer
days)
Creates more vegetative surface area to remove air
pollutants
Vegetation provides shade and increases
evapotranspiration in atmosphere*
Leaves intercept particulate pollutants (PM2.5)
Leaf stomata absorb gaseous pollutants (ozone)
Reduces photochemical
reaction rates of ozone
Reduces building electricity usage –
lowering demand for electricity generation
*Fallmann et al. Secondary effects of urban heat island mitigation measures on air quality. Atmospheric Environment, November 2015
Vegetation
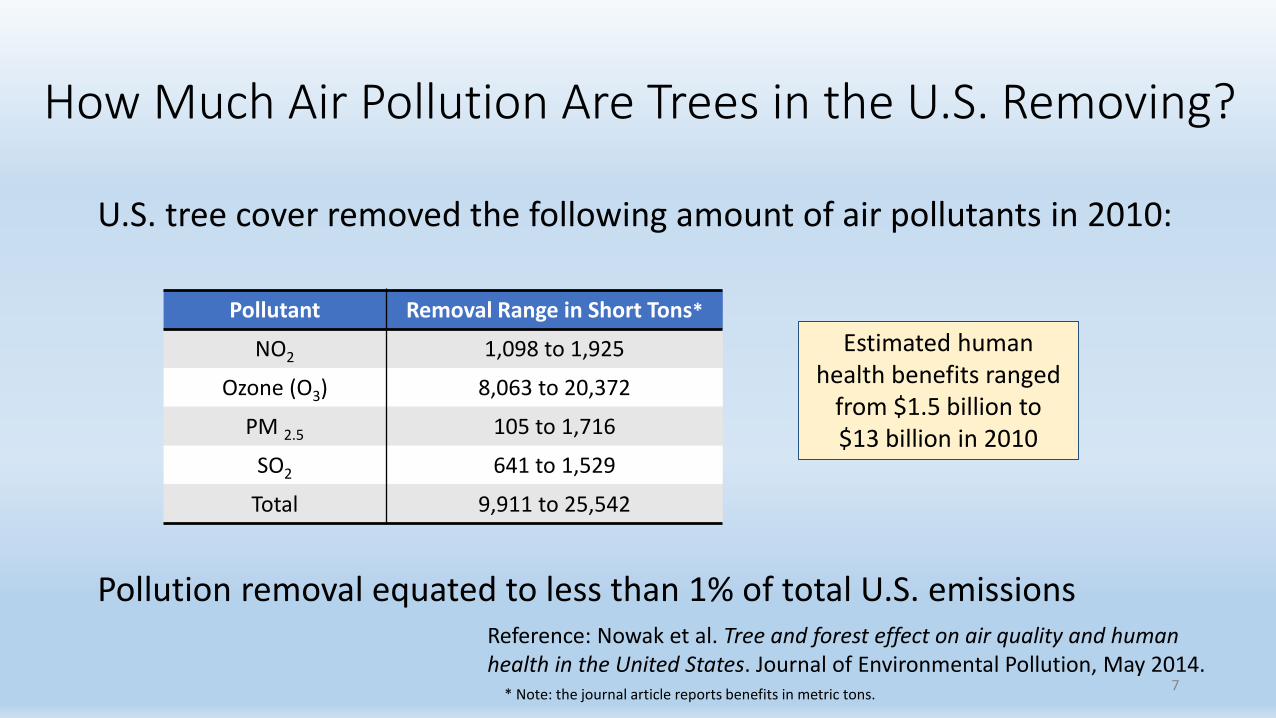
How Much Air Pollution Are Trees in the U.S. Removing?
U.S. tree cover removed the following amount of air pollutants in 2010:
Pollution removal equated to less than 1% of total U.S. emissions
7
Reference: Nowak et al. Tree and forest effect on air quality and human health in the United States. Journal of Environmental Pollution, May 2014.
Pollutant Removal Range in Short Tons*
NO2 1,098 to 1,925
Ozone (O3) 8,063 to 20,372
PM 2.5 105 to 1,716
SO2 641 to 1,529
Total 9,911 to 25,542
Estimated human health benefits ranged
from $1.5 billion to $13 billion in 2010
* Note: the journal article reports benefits in metric tons.
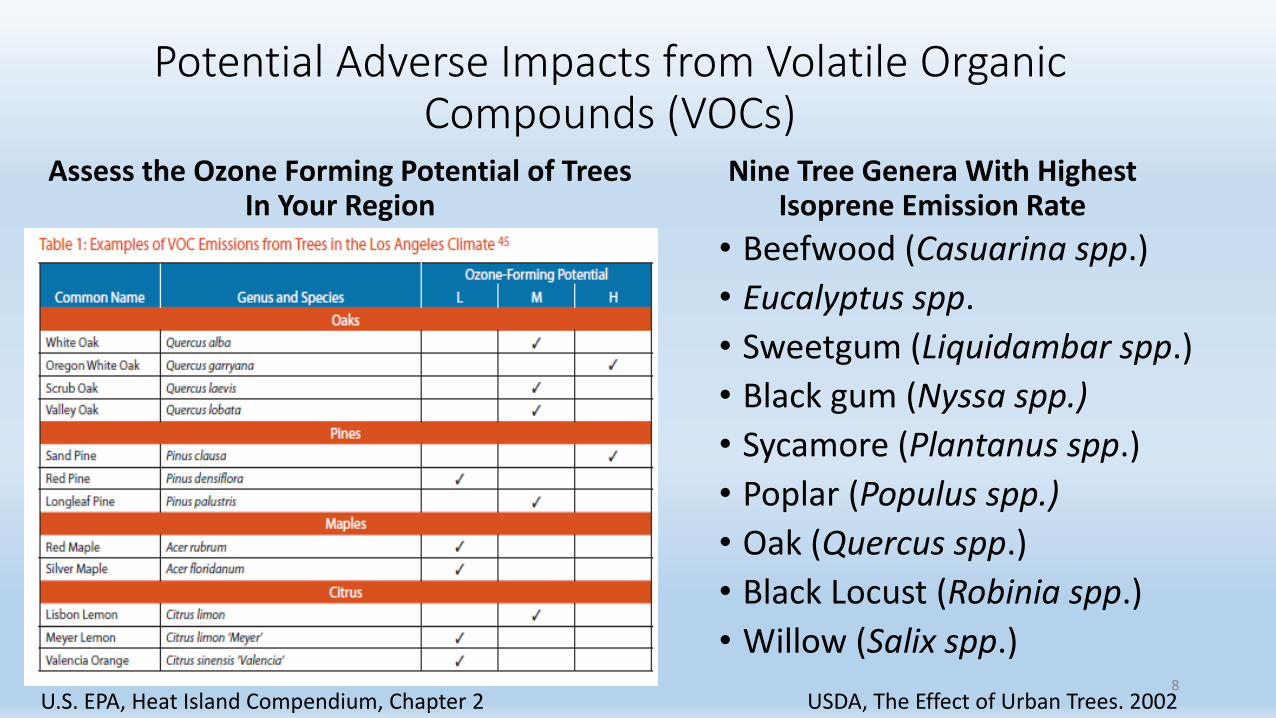
Potential Adverse Impacts from Volatile Organic Compounds (VOCs)
Assess the Ozone Forming Potential of Trees In Your Region
Nine Tree Genera With Highest Isoprene Emission Rate
• Beefwood (Casuarina spp.)
• Eucalyptus spp.
• Sweetgum (Liquidambar spp.)
• Black gum (Nyssa spp.)
• Sycamore (Plantanus spp.)
• Poplar (Populus spp.)
• Oak (Quercus spp.)
• Black Locust (Robinia spp.)
• Willow (Salix spp.)8
U.S. EPA, Heat Island Compendium, Chapter 2 USDA, The Effect of Urban Trees. 2002
9
U.S. EPA
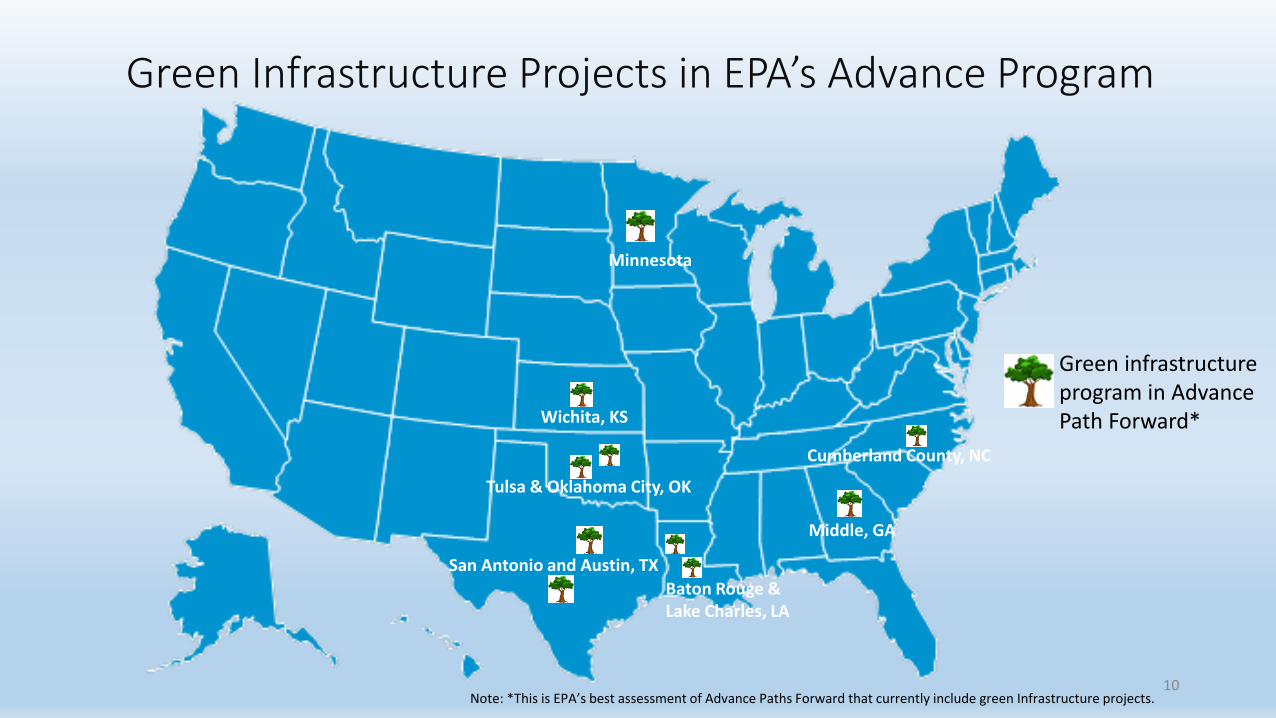
Green Infrastructure Projects in EPA’s Advance Program
10
Green infrastructure program in Advance Path Forward*
Middle, GA
Note: *This is EPA’s best assessment of Advance Paths Forward that currently include green Infrastructure projects.
Minnesota
Cumberland County, NC
Tulsa & Oklahoma City, OK
Wichita, KS
Baton Rouge & Lake Charles, LA
San Antonio and Austin, TX
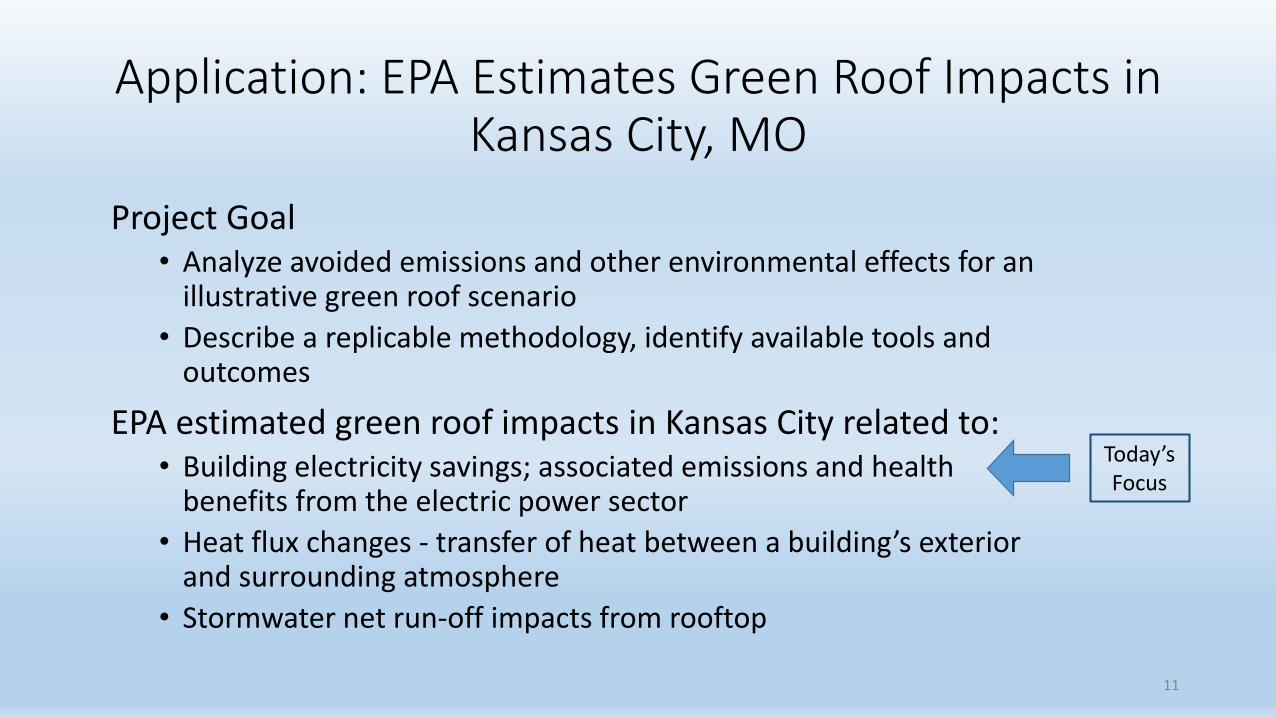
Application: EPA Estimates Green Roof Impacts in Kansas City, MO
Project Goal• Analyze avoided emissions and other environmental effects for an
illustrative green roof scenario
• Describe a replicable methodology, identify available tools and outcomes
EPA estimated green roof impacts in Kansas City related to: • Building electricity savings; associated emissions and health
benefits from the electric power sector
• Heat flux changes - transfer of heat between a building’s exterior and surrounding atmosphere
• Stormwater net run-off impacts from rooftop
11
Today’s Focus
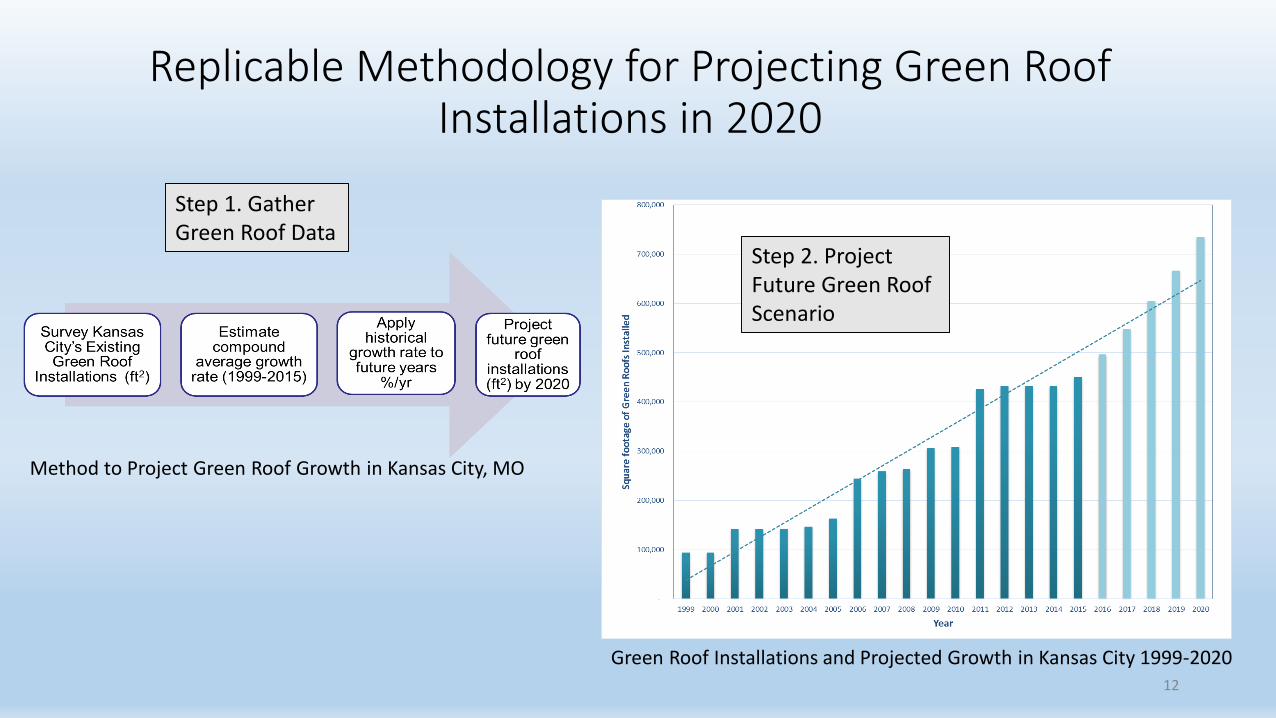
Replicable Methodology for Projecting Green Roof Installations in 2020
12
Green Roof Installations and Projected Growth in Kansas City 1999-2020
Method to Project Green Roof Growth in Kansas City, MO
Step 1. Gather Green Roof Data
Step 2. Project Future Green Roof Scenario
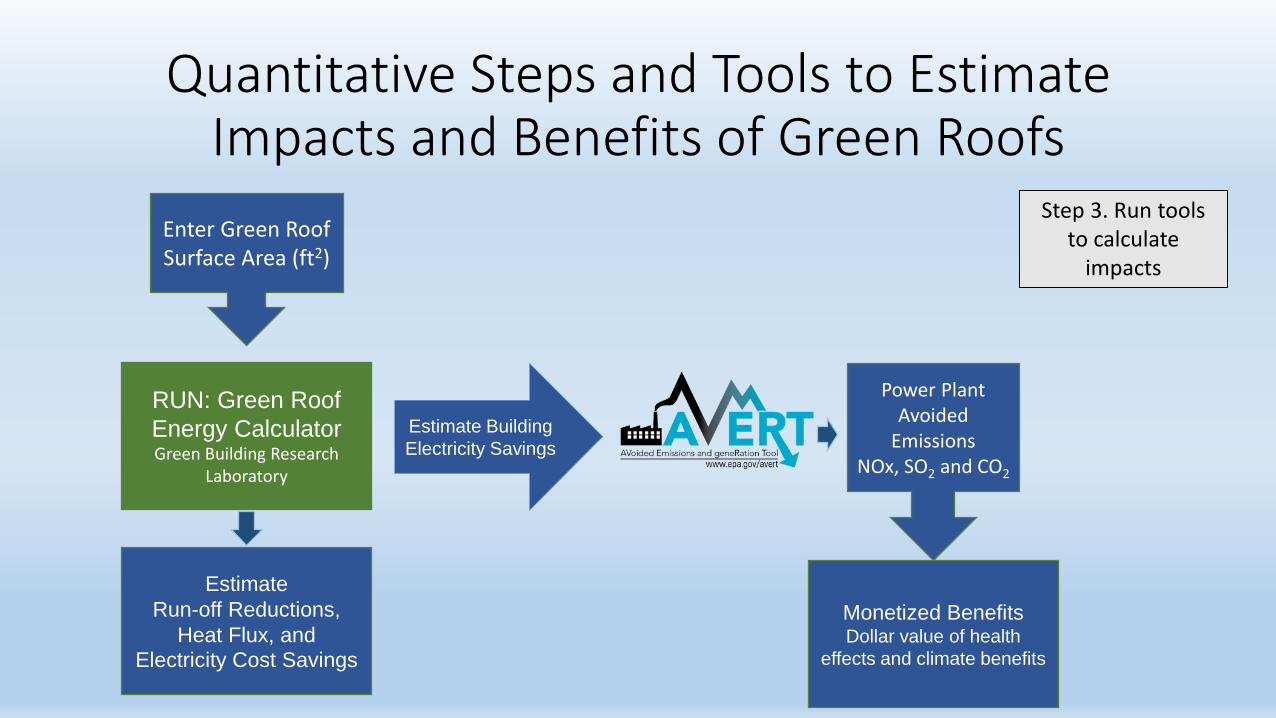
Quantitative Steps and Tools to Estimate Impacts and Benefits of Green Roofs
Estimate Building
Electricity Savings
RUN: Green Roof
Energy Calculator Green Building Research
Laboratory
Enter Green Roof Surface Area (ft2)
Power Plant Avoided
Emissions NOx, SO2 and CO2
Monetized BenefitsDollar value of health
effects and climate benefits
Estimate
Run-off Reductions,
Heat Flux, and
Electricity Cost Savings
Step 3. Run tools to calculate
impacts
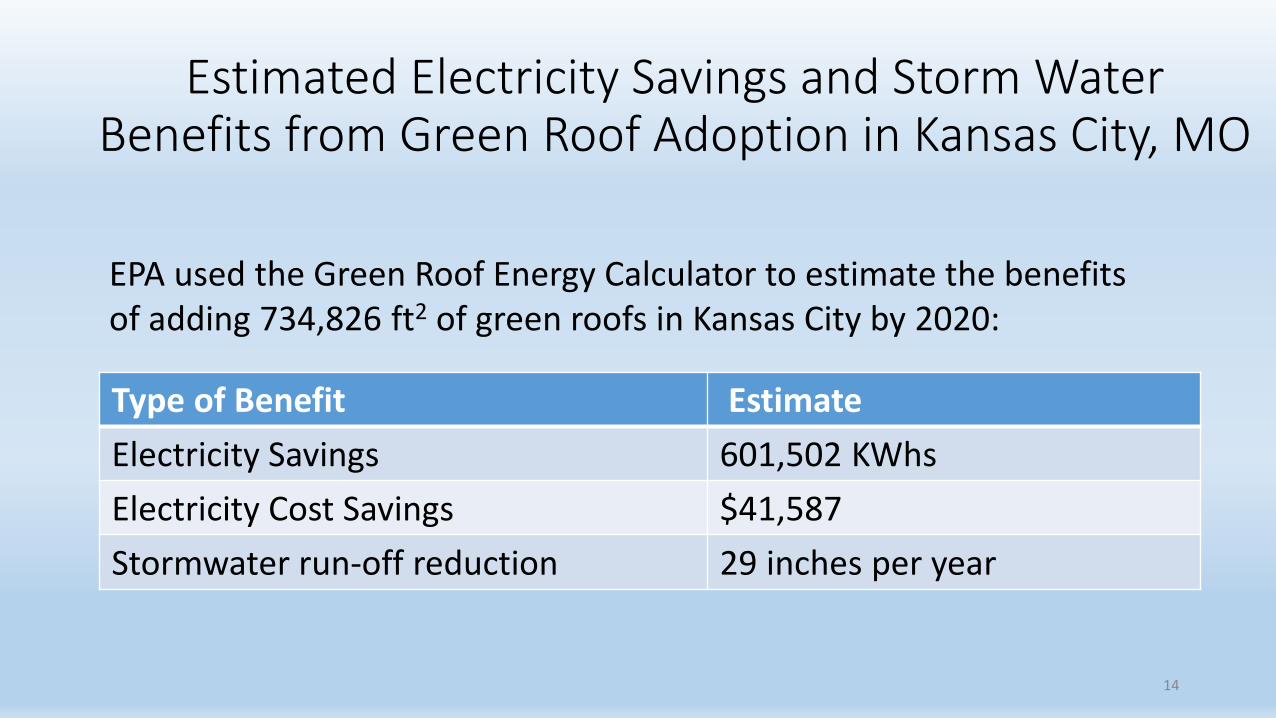
Estimated Electricity Savings and Storm Water Benefits from Green Roof Adoption in Kansas City, MO
Type of Benefit Estimate
Electricity Savings 601,502 KWhs
Electricity Cost Savings $41,587
Stormwater run-off reduction 29 inches per year
14
EPA used the Green Roof Energy Calculator to estimate the benefits of adding 734,826 ft2 of green roofs in Kansas City by 2020:
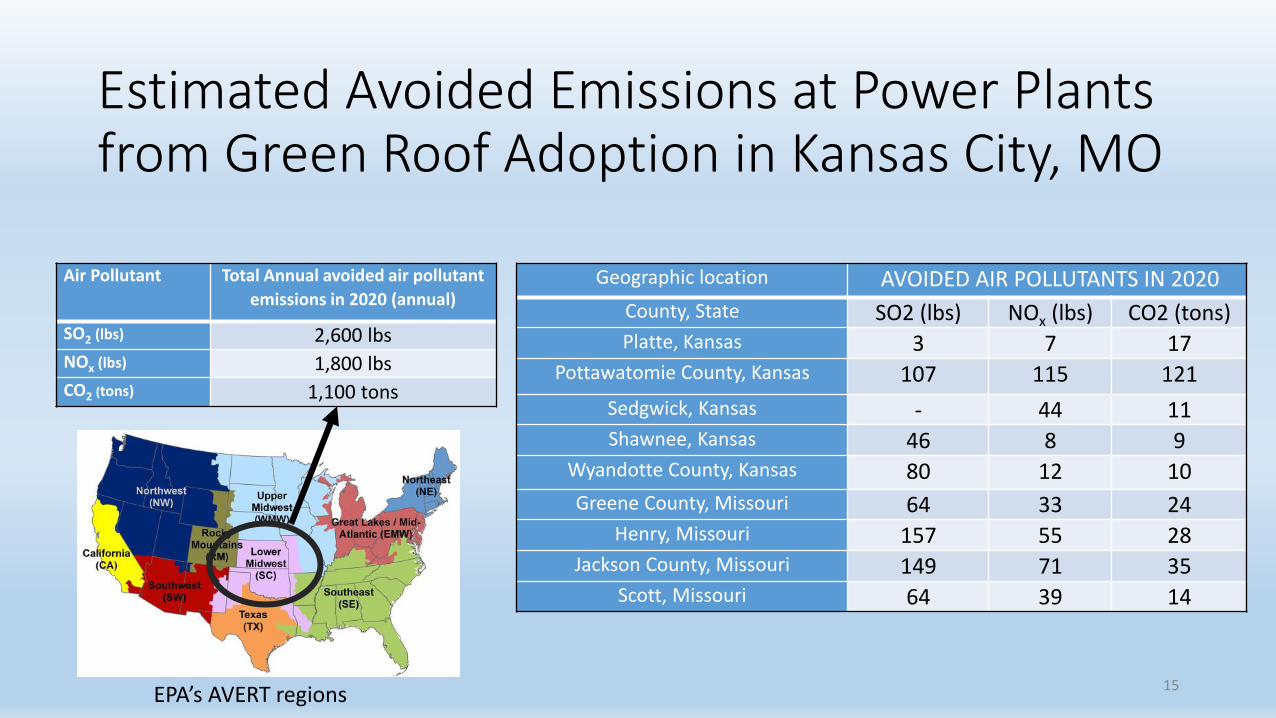
Estimated Avoided Emissions at Power Plants from Green Roof Adoption in Kansas City, MO
Geographic location AVOIDED AIR POLLUTANTS IN 2020
County, State SO2 (lbs) NOx (lbs) CO2 (tons)Platte, Kansas 3 7 17
Pottawatomie County, Kansas 107 115 121
Sedgwick, Kansas - 44 11Shawnee, Kansas 46 8 9
Wyandotte County, Kansas 80 12 10
Greene County, Missouri 64 33 24Henry, Missouri 157 55 28
Jackson County, Missouri 149 71 35Scott, Missouri 64 39 14
15
Air Pollutant Total Annual avoided air pollutant
emissions in 2020 (annual)
SO2 (lbs) 2,600 lbsNOx (lbs) 1,800 lbsCO2 (tons) 1,100 tons
EPA’s AVERT regions
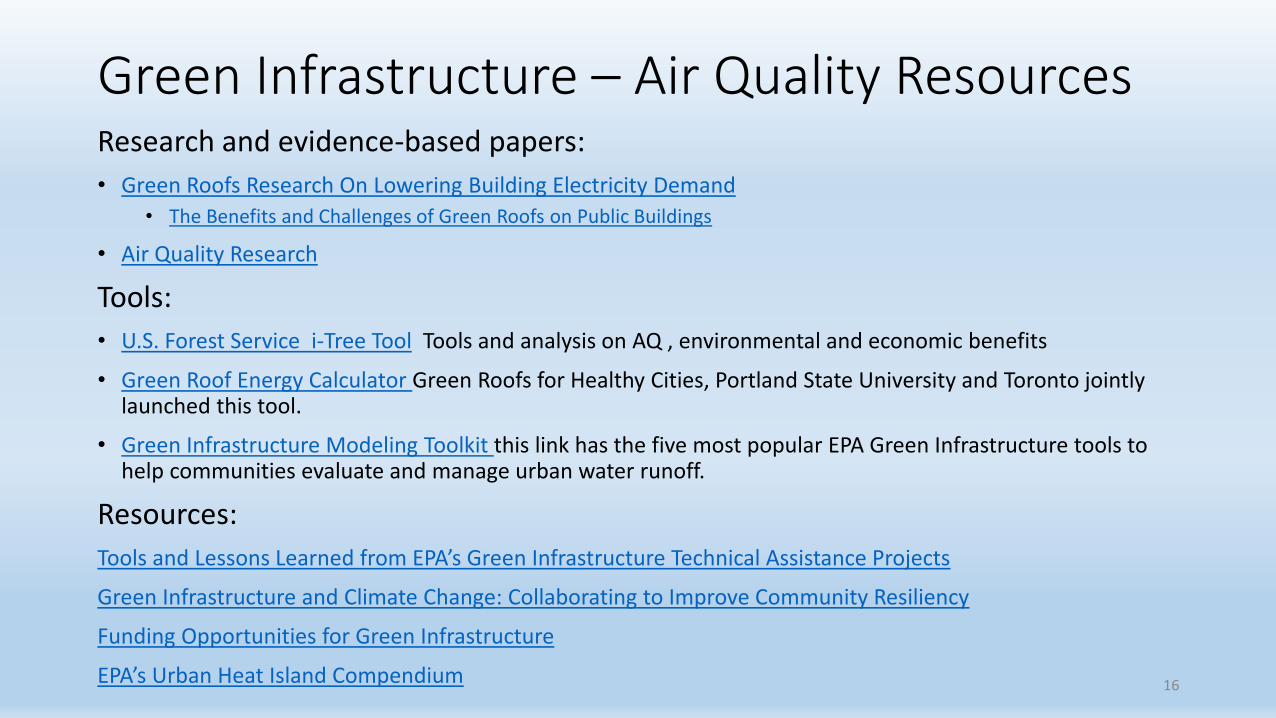
Green Infrastructure – Air Quality ResourcesResearch and evidence-based papers:
• Green Roofs Research On Lowering Building Electricity Demand
• The Benefits and Challenges of Green Roofs on Public Buildings
• Air Quality Research
Tools:
• U.S. Forest Service i-Tree Tool Tools and analysis on AQ , environmental and economic benefits
• Green Roof Energy Calculator Green Roofs for Healthy Cities, Portland State University and Toronto jointly launched this tool.
• Green Infrastructure Modeling Toolkit this link has the five most popular EPA Green Infrastructure tools to help communities evaluate and manage urban water runoff.
Resources:
Tools and Lessons Learned from EPA’s Green Infrastructure Technical Assistance Projects
Green Infrastructure and Climate Change: Collaborating to Improve Community Resiliency
Funding Opportunities for Green Infrastructure
EPA’s Urban Heat Island Compendium 16
Related Documents