Green Growth OECD – CANADA 50 YEARS 3 rd June 2011 Simon Upton, Director, Environment

Green Growth OECD – CANADA 50 YEARS 3 rd June 2011 Simon Upton, Director, Environment.
Dec 11, 2015
Welcome message from author
This document is posted to help you gain knowledge. Please leave a comment to let me know what you think about it! Share it to your friends and learn new things together.
Transcript

Green Growth OECD – CANADA 50 YEARS
3rd June 2011
Simon Upton, Director, Environment
Growth & development
Wealth and GDP (2005 US$ per capita, wealth on bottom axis)
0 100000 200000 300000 400000 500000 600000 700000 800000 900000 10000000
5,000
10,000
15,000
20,000
25,000
30,000
35,000
40,000
45,000 OECDHigh income, non-OECD
OECD average
Global average
$2 per day
Bubble size = popula-tion
Low income
Middle income
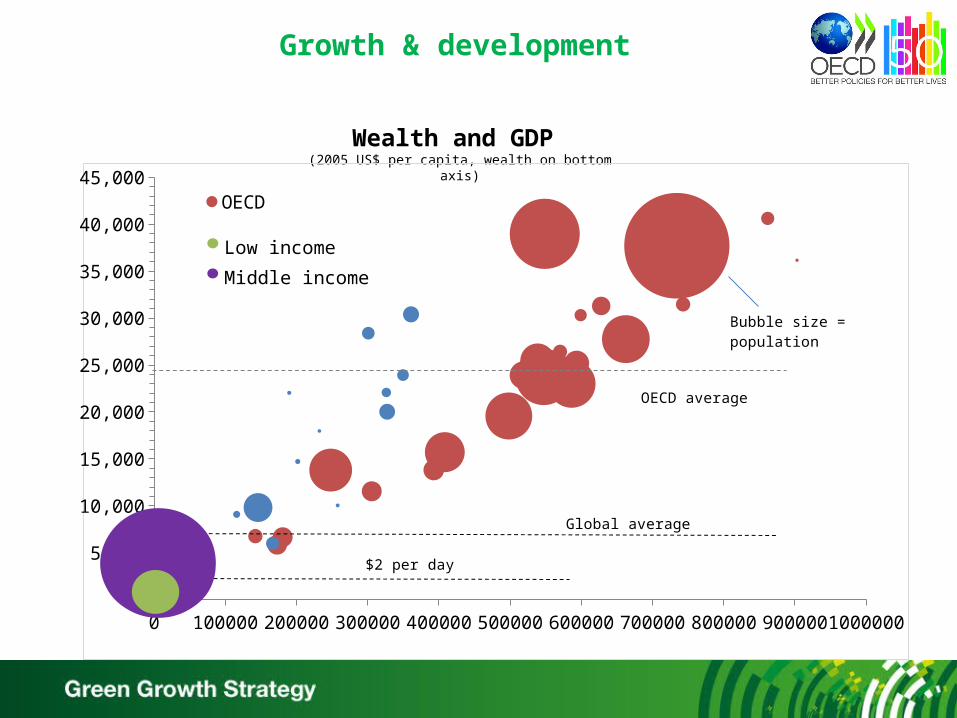
Growth – not just a developing country concern
1996 1998 2000 2002 2004 2006 2008 2010 2012-3.0
-2.0
-1.0
0.0
1.0
2.0
3.0
-20000000.0
-15000000.0
-10000000.0
-5000000.0
0.0
5000000.0
10000000.0
15000000.0
20000000.0To return to 2007 employment levels
Additional un-employed since 2007 (Right hand axis)
Employment growth (%)(Left hand axis)
Jobs
Belgium
New Zealand
Germany
Czech
Republic
Netherlands
Italy
Spain
France
Greece
Portugal
OECD
United Kingdom
United States
Ireland
0
2
4
6
8
10
12
14
16Per cent of GDP
Deficit improvement to achieve 60% debt to GDP by 2025
DebtDemographics
Australia
Belgium
Canada
France
Germany
Greece
Ireland
Japan
Netherlands
New ZealandSpain
Sweden
United Kingdom
United States
-1.0
0.0
1.0
2.0
3.0
4.0
5.0
6.0
7.0
PensionsLong term careHealth
Percent of GDP
Changes in age related public spending to 2025
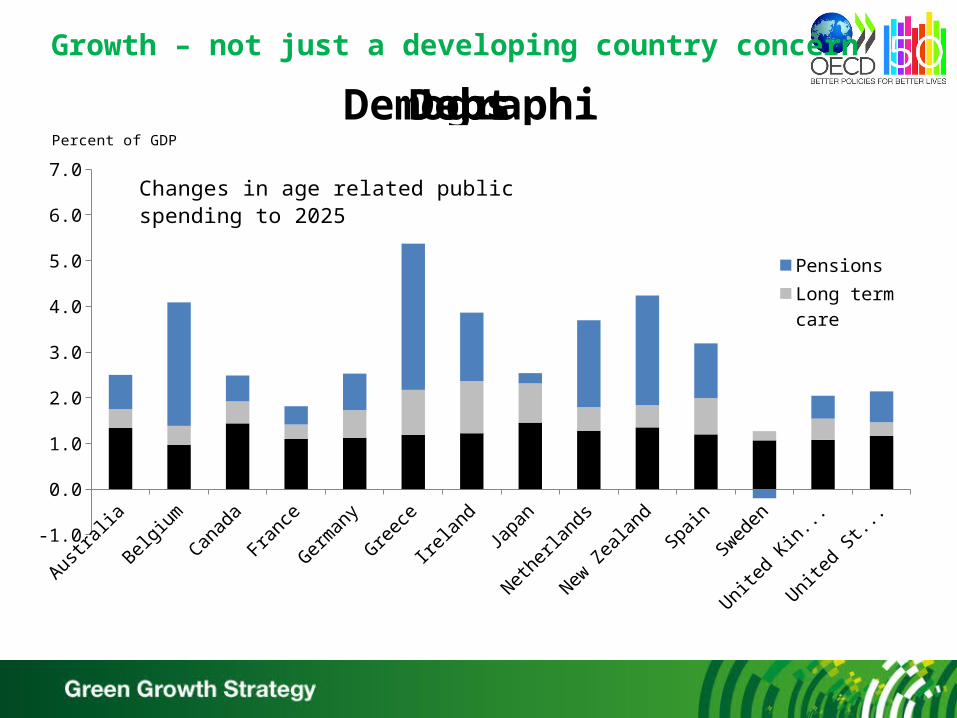
The need for green
0
0.5
1
1.5
2
2.5
3
3.5
4
Biocapacity(Hectares of biologically productive land per per-son)
2050
World GDP (2005, PPP)USD 300 trillion
2030
USD 150 trillion
2010USD 70 trillion
1990
Food + 35%
Energy + 37%
Resources + 70%
Source: OECD Source: Global Footprint Network
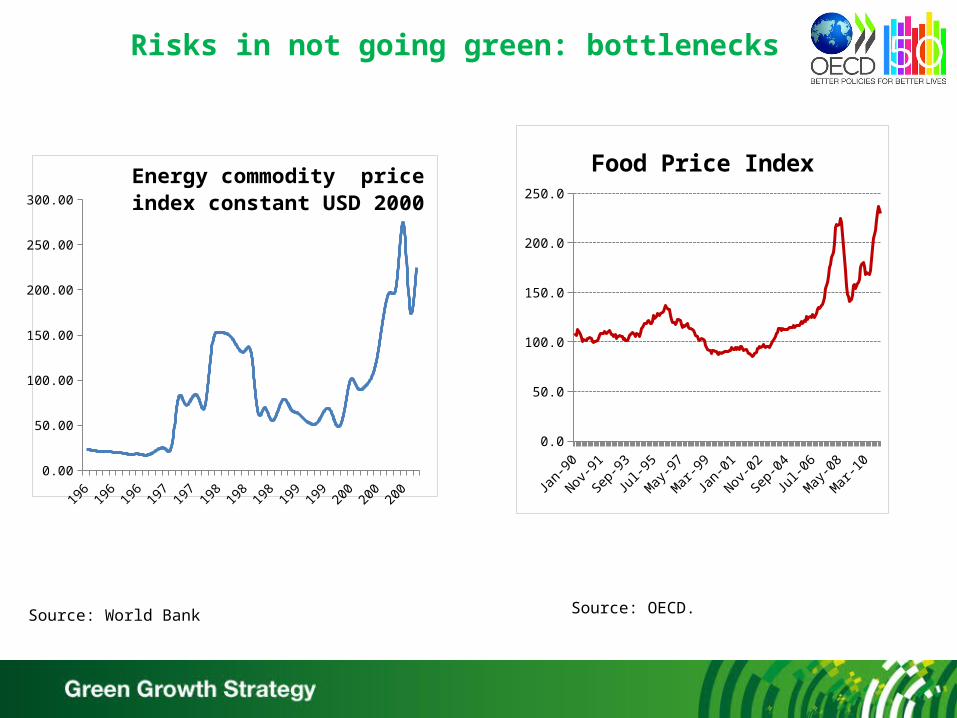
Risks in not going green: bottlenecks
1990 1993 1996 1999 2002 2005 2008 20110.0
50.0
100.0
150.0
200.0
250.0
Food Price Index
Source: World Bank Source: OECD.
0.00
50.00
100.00
150.00
200.00
250.00
300.00
Energy commodity price index constant USD 2000
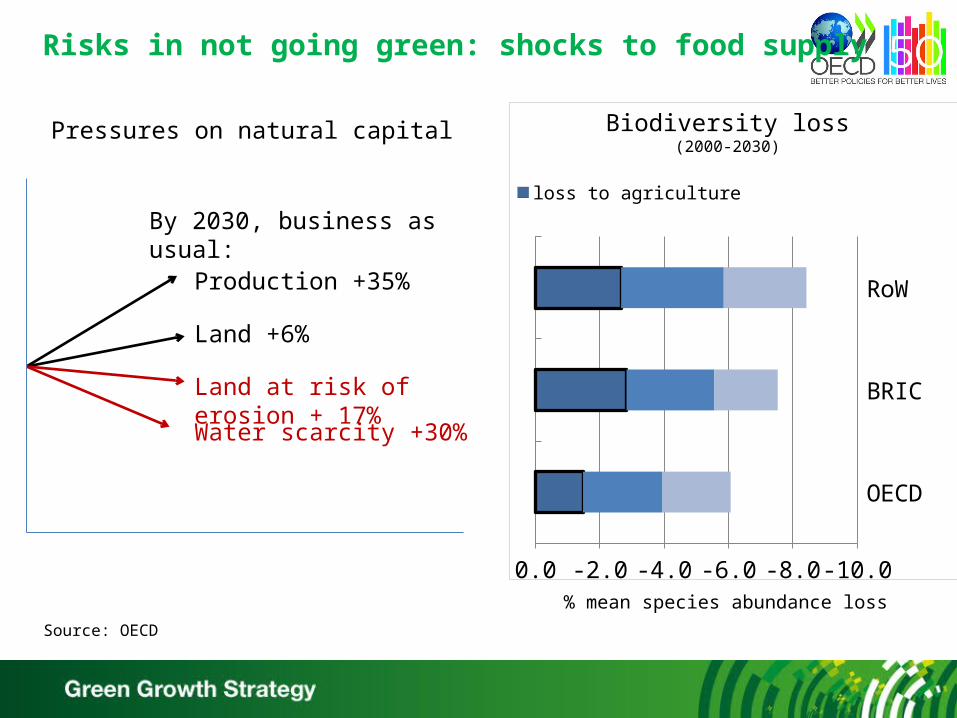
Risks in not going green: shocks to food supply
Production +35%
Land +6%
Land at risk of erosion + 17%
By 2030, business as usual:
OECD
BRIC
RoW
-10.0-8.0-6.0-4.0-2.00.0
loss to agricultureloss to infrastructureloss to other causes
Biodiversity loss(2000-2030)
Pressures on natural capital
Water scarcity +30%
% mean species abundance loss
Source: OECD
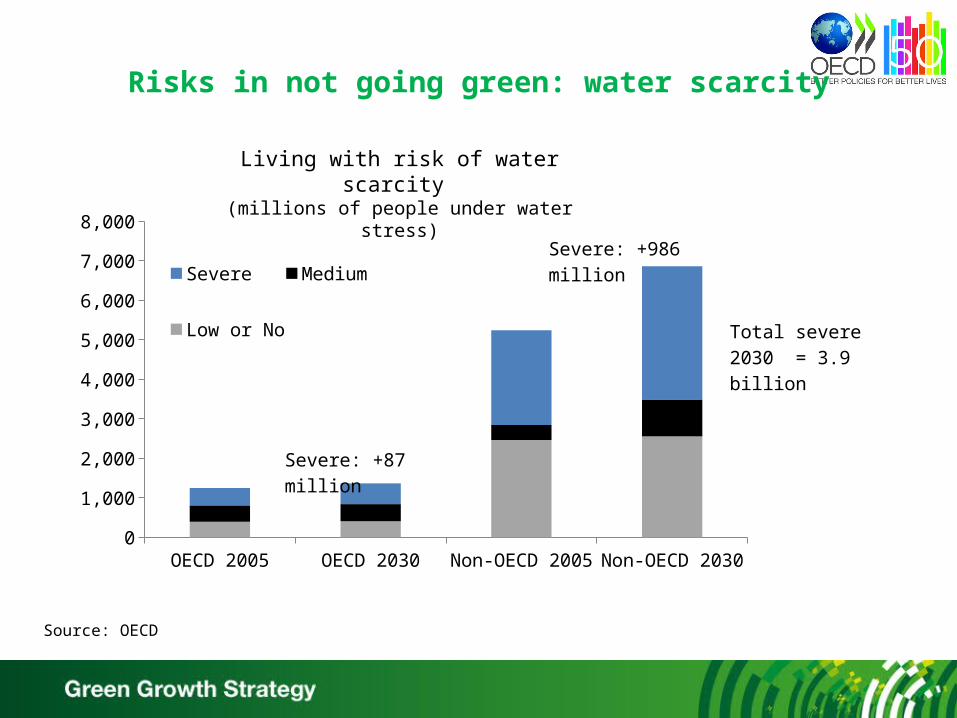
Risks in not going green: water scarcity
OECD 2005 OECD 2030 Non-OECD 2005 Non-OECD 20300
1,000
2,000
3,000
4,000
5,000
6,000
7,000
8,000
Severe Medium
Low or No
Severe: +87 mil-lion
Severe: +986 million
Total severe 2030 = 3.9 billion
Living with risk of water scarcity (millions of people under water stress)
Source: OECD

Risks in not going green: pollution and human health
Premature deaths from PM10 exposure(per million inhabitants)
Pacific
Europe
North America
Asia
Brazil
Russia
China
South Asia
Rest of World
0 100 200 300 400 500 600 700 800 900 1000
2000 2030
Source: OECD
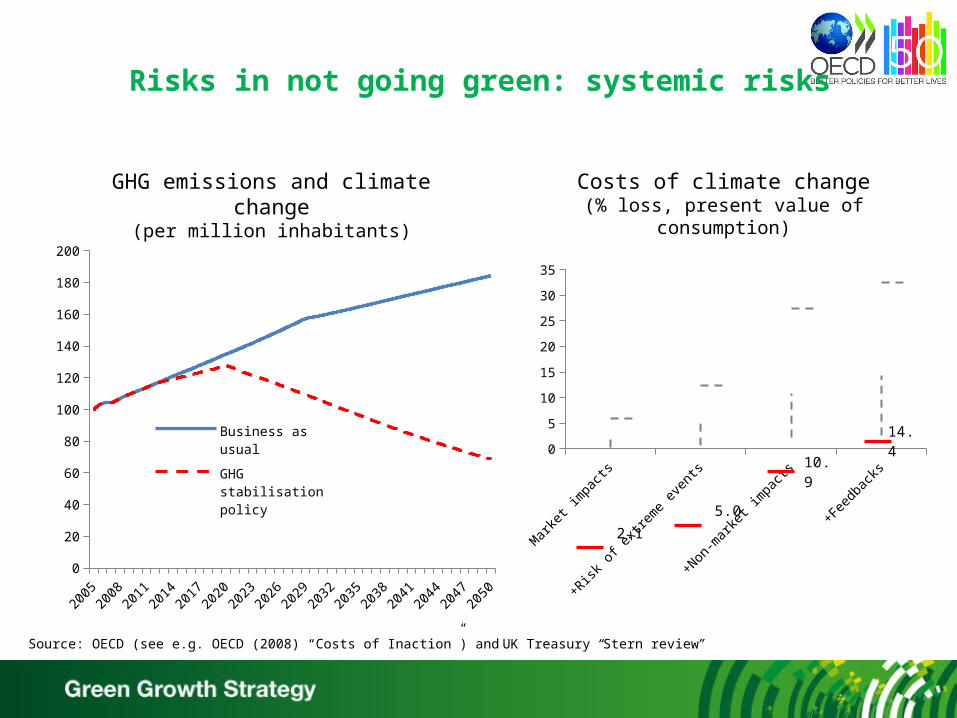
Risks in not going green: systemic risks
GHG emissions and climate change(per million inhabitants)
Costs of climate change(% loss, present value of consumption)
20052008
20112014
20172020
20232026
20292032
20352038
20412044
20472050
0
20
40
60
80
100
120
140
160
180
200
Business as usual
GHG stabilisation pol-icy
Market impacts +Risk of extreme events
+Non-market impacts
+Feedbacks0
5
10
15
20
25
30
35
2.1
5.0
10.9
14.4
Source: OECD (see e.g. OECD (2008) “Costs of Inaction”) and UK Treasury “Stern review”

Better measurement: the capital base of economies
US CHINA BRAZIL INDIA VENEZUELA0%
10%
20%
30%
40%
50%
60%
70%
80%
90%
100%
Reproducible Capital
Human Capital
Natural Capital
Source: Arrow et al (2009) in NBER WP 16599
Capital stock shares

Better measurement for better policy choices
Cost of GHG mitigation: GDP and GDP+
Source: OECD

Growth from green perspective
0
50
100
150
200
250
300
350
400
450
GDP - BAU
GDP- GHG stablisation
The gap in 2050 = 4%
Direct cost of GHG mitigation
Source: OECD
Structural reforms
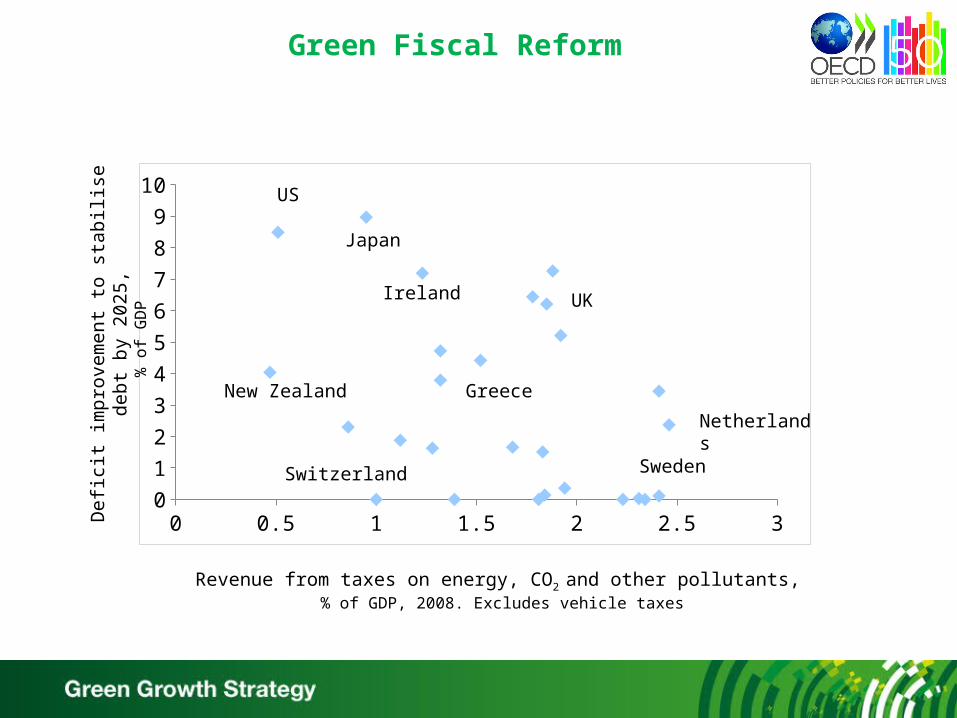
Green Fiscal Reform
0 0.5 1 1.5 2 2.5 30
1
2
3
4
5
6
7
8
9
10US
New Zealand
Japan
Ireland UK
Switzerland
Greece
Sweden
Netherlands
Revenue from taxes on energy, CO2 and other pollutants, % of GDP, 2008. Excludes vehicle taxes
Def
icit
imp
rove
me
nt t
o st
abili
se d
ebt
by 2
025
, %
of
GD
P

Current environmental taxes
0
1
2
3
4
5
6
0
5
10
15
20
25
30
35
40
45
50Other
Motor vehicles
Energy
Total revenue (right hand axis)
Tax revenue, % of GDP

Improving resource management
Source: “Sunken Billions”, FAO World Bank
Revenue, 2004
$78 billion
$50 billion
$10 bn+
Over-exploited(31%)
Fully-exploited(53%)
State of catch fisheries, 2008
Under-exploited(16%)
Operating deficit, $5 billion
Subsidies
Economic loss
Source: FAO
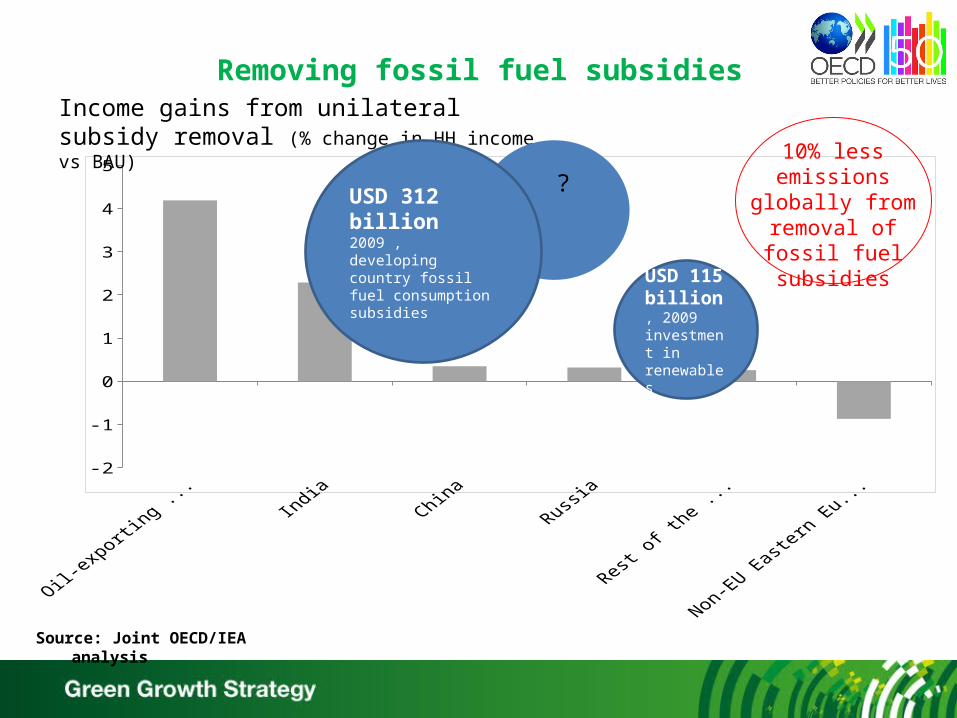
Source: Joint OECD/IEA analysis
Removing fossil fuel subsidies
Oil-exporting countries ¹
India China Russia Rest of the World
Non-EU Eastern European Countries²
-2
-1
0
1
2
3
4
5
Income gains from unilateral subsidy removal (% change in HH income vs BAU)
USD 115 billion, 2009 investment in renewables
10% less emissions globally
from removal of fossil fuel subsidies
USD 312 billion2009 , developing country fossil fuel consumption subsidies
?

Reframing environmental challenges
Regulation and diffusion of ICT
US
UK
Sweden
Germany
Belgium
France
Greece
Spain
Canada
ICT
inve
stm
ent
% o
f to
tal,
ave
rag
e 1
99
5-2
00
3
Regulation in ICT-using sectorsAverage1995-2003
Source: OECD

Overcoming inertia
Lifespan of capital investments
Pattern of transport links and urban developments
Building stock (residential and commercial)
Power stations
Electric transmissions and distributions, telecom, pipelines
Manufacturing equipement
Commercial heating and cooling equipement
Trucks, buses, trucks trailers, tractors
Cars
Residential space heating and cooling equipement
Residential water heating equipment
0 50 100 150 200 250 300
Rents embodied in
fossil fuel reserves
Sunk capital
USD 16 trillion
USD 6.7 trillion
World GDP

Costs of moving too slow
300GW retired early (loss > USD 70 billion)
Coal-fired generation capacity, IEA 450ppm scenario

Response to prices
-20
0
20
40
60
80
100
120
140
160
180
0 100 200 300 400 500 600 700 800 900
SE
K p
er k
g N
Ox
Emission intensity in kg NOx per GWh
1991 1992 1994 1996
Marginal Abatement Cost Curves of Taxed Emitters
NOx Tax in Sweden
Source: OECD
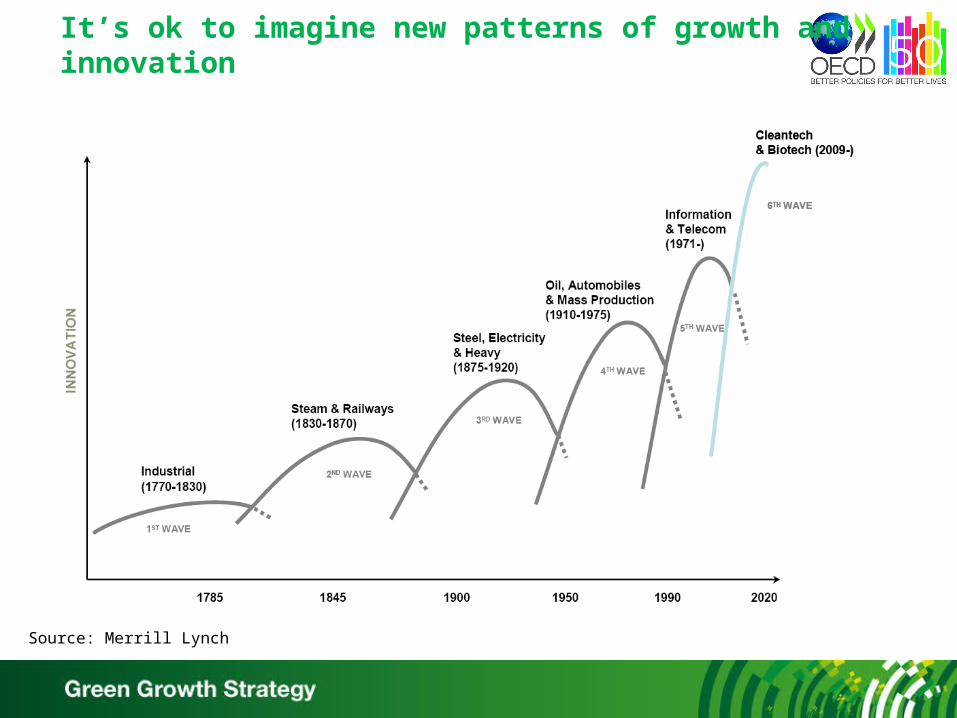
It’s ok to imagine new patterns of growth and innovation
Source: Merrill Lynch

Green Growth framework
•Balanced tax structures•R&D and innovation policy•Competition•Infrastructure investment•Openness to trade and FDI
Enabling conditions
•Pricing of pollution and resource use•Subsidy reform•Regulatory and policy predictability•Support to basic research and emerging technologies•Governance of natural assets
Key policy tools
• Water scarcity• Climate change• Health impacts of pollution• Biodiversity loss
Major environmental issues
• Skills and labour market adjustment• Distributional and competitiveness concerns• Science and technology cooperation • Development assistance• Management of global public goods
Promoting transition
• Productivity of resource use• Physical evolution of the natural asset base• Environmental quality of life• Opportunities arising from environmental considerations• Evolution of policy and social responses• Promoting efforts consistent with international standards
Measurement agenda
Related Documents