eco GREEN y nomy Pathways to Sustainable Development and Poverty Eradication A Synthesis for Policy Makers Towards a

Welcome message from author
This document is posted to help you gain knowledge. Please leave a comment to let me know what you think about it! Share it to your friends and learn new things together.
Transcript

8/7/2019 Green Economy Report - Synthesis Report
http://slidepdf.com/reader/full/green-economy-report-synthesis-report 1/52
ecoGREEN y nomy Pathways to Sustainable Developmentand Poverty Eradication
A Synthesis for Policy Makers
Towards a

8/7/2019 Green Economy Report - Synthesis Report
http://slidepdf.com/reader/full/green-economy-report-synthesis-report 2/52
UNEPpromotes environ-
mentally sound practicesglobally and in its own activities.
This publication is printed on 100%recycled paper, using vegetable -basedinks and other eco-friendly practices.Our distribution policy aims to reduce
UNEP’s carbon footprint.
Copyright © United Nations Environment Programme, 2011
This publication may be reproduced in whole or in part and in any orm or
educational or non-proft purposes without special permission rom the copyright
holder, provided acknowledgement o the source is made. UNEP would appreciate
receiving a copy o any publication that uses this publication as a source.
No use o this publication may be made or resale or or any other commercial
purpose whatsoever without prior permission in writing rom UNEP.
Citation
UNEP, 2011, Towards a Green Economy: Pathways to Sustainable Development and
Poverty Eradication - A Synthesis for Policy Makers, www.unep.org/greeneconomy
Disclaimer
The designations employed and the presentation o the material
in this publication do not imply the expression o any opinion
whatsoever on the part o the United Nations Environment
Programme concerning the legal status o any country,
territory, city or area or o its authorities, or concerning
delimitation o its rontiers or boundaries. Moreover,
the views expressed do not necessarily represent the
decision or the stated policy o the United Nations
Environment Programme, nor does citing o tradenames or commercial processes constitute
endorsement.
Layout and printing by:
100 Watt, St-Martin-Bellevue, France
Tel. +33 (0)4 50 57 42 17
Towards a Green Economy
8/7/2019 Green Economy Report - Synthesis Report
http://slidepdf.com/reader/full/green-economy-report-synthesis-report 3/52
i - ii
e c o
GRE E N
n om
y
C ont ent s
ContentsList of Figures..............................................................iii
Acknowledgements ...................................................iv
Foreword .....................................................................v
Introduction ............................................................. 01From Crisis to Opportunity ................................................................................................................................01
An Era o Capital Misallocation ..........................................................................................................................01
What is a Green Economy? ...............................................................................................................................02
How Far are we rom a Green Economy? ..........................................................................................................03
How to Measure Progress towards a Green Economy .......................................................................................05
Towards a Green Economy ...............................................................................................................................05
Key Findings ............................................................. 06 A Green Economy Recognizes the Value o, and Invests in, Natural Capital ............. ............. ............. .............. ...06
A Green Economy is Central to Poverty Alleviation .............................................................................................10
A Green Economy Creates Jobs and Enhances Social Equity ............................................................................13
A Green Economy Substitutes Renewable Energy and Low-carbon Technologies or Fossil Fuels ......................15
A Green Economy Promotes Enhanced Resource and Energy Efciency............................................................16
A Green Economy Delivers More Sustainable Urban Living and Low-carbon Mobility .........................................21
A Green Economy Grows Faster than a Brown Economy over Time, while Maintainingand Restoring Natural Capital ............................................................................................................................23
Enabling Conditions ................................................ 28Establish Sound Regulatory Frameworks ...........................................................................................................28
Prioritize Government Investment and Spending in Areas that Stimulate the Greening o Economic Sectors .......29
Limit Government Spending in Areas that Deplete Natural Capital ......................................................................30
Employ Taxes and Market-based Instruments to Promote Green Investment and Innovation ..............................31
Invest in Capacity Building, Training and Education ............ ............. ............. ............. ............. .............. ............. .33
Strengthen International Governance .................................................................................................................33
Financing the Green Economy Transition ................ 35
Conclusions ............................................................. 38
Annexes ................................................................... 40 Annex I: Annual Green Economy Investment (by sector).....................................................................................40
Annex II: The Threshold 21 (T21) Model ............. .............. ............. ............. ............. ............. ............. .............. ...42
Annex III: Impacts o Allocating an Additional 2% o GDP towards Greening the Global EconomyRelative to 2% in Business as usual ............. ............. ............. ............. ............. .............. ............. ............. .......... 43
8/7/2019 Green Economy Report - Synthesis Report
http://slidepdf.com/reader/full/green-economy-report-synthesis-report 4/52
List of Boxes,Tables and FiguresBOXES
Box 1. Towards a Green Economy:
Twin Challenge ...................................04
Box 2. Grameen Shakti Programme
in Bangladesh ............ ............. ............12
Box 3. Feed-in Taris:
An Example rom Kenya .....................16
Box 4. Resource Efciency and Waste:
Examples o Regulation and Pricing
Policies ..............................................19
Box 5. Recycling and Waste:
An Example rom Brazil ......................19
Box 6. Examples o Green Transport
Policies in Action ................................23
Box 7. Accounting or Inclusive Wealth ..........27
Box 8. Energy Subsidy Reorm: Some
Examples ...........................................31
Box 9. Eco-taxes: A Double Dividend or Jobs
and the Environment ..........................32
Box 10. An Example o Long-term Investing:
The Norwegian Pension Fund Global .... 36
TABLES
Table 1. Natural Capital: Underlying Components
and Illustrative Services and Values.....07
Table 2. Trends in Forest Cover
and Deorestation ...............................08
Table 3. Global Fisheries Subsidies ..................10
FIGURES
Figure 1. Projection o the global demand or
water ................................................09
Figure 2. Global progress towards Millennium
Development Goals target to reducethe number o people without access
to adequate sanitation services to 1.7
billion people by 2015 .......................11
Figure 3. Total employment in the energy sector
and its disaggregation into uel and
power, and energy efciency under a
2% green investment scenario ...........14
Figure 4. Investment in sustainable energy, 2004-
2009 (US$ billion) ..............................15
Figure 5.Global relative decoupling trends (1980-
2007) ................................................17
Figure 6. GDP per capita vs. municipal solid waste
per capita ............................................. 18
Figure 7. The make-up o total ood waste .......20
Figure 8. IPCC projections o CO2 mitigation
potential in 2030 ...............................22
Figure 9. Projected trends in annual GDP growth
rate ...................................................25
Figure 10. Impacts o the green investment
scenario relative to business as usual
or selected variables (per cent + / -) ....25
Figure 11. Energy-related CO2 emissions–
breakdown o reductions achieved
in a 2% green investment scenario
relative to baseline business as usual
projections ........................................26

8/7/2019 Green Economy Report - Synthesis Report
http://slidepdf.com/reader/full/green-economy-report-synthesis-report 5/52
Towards a Green Economy: Pathways to Sustainable Development and Poverty Eradication is based on the workingchapters o the Green Economy Report (GER), which were prepared by the ollowing coordinating authors: RobertAyres, Andrea Bassi, Paul Clements-Hunt, Holger Dalkmann, Derek Eaton, Maryanne Grieg-Gran, Hans Herren, CornisVan Der Lugt, Prasad Modak, Lawrence Pratt, Philipp Rode, Ko Sakamoto, Rashid Sumaila, Ton van Dril, Xander van
Tilburg, Peter Wooders, and Mike Young. Contributing authors and reviewers o the chapters are acknowledgedaccordingly in each chapter.
The synthesis report was led by Pavan Sukhdev, Special Adviser and Head, Green Economy Initiative, UNEP, andcoordinated by Steven Stone, Chie, Economics and Trade Branch, UNEP under the guidance o Sylvie Lemmet,Director, Division o Technology, Industry and Economics, UNEP. Substantive contributions were received romAnna Autio, Nicolas Bertrand, Derek Eaton, Fatma Ben Fadhl, Marenglen Gjonaj, Moustapha Kamal Gueye, Leigh-Ann Hurt, Ana Lucía Iturriza, Cornis Van Der Lugt, Desta Mebratu, Robert McGowan, Asad Naqvi, Sheng Fulai,Benjamin Simmons, Niclas Svenningsen and Vera Weick.
Thanks also go to Joe Alcamo, Aniket Ghai, Peter Gilruth, Sylviane Guillaumont, Mark Halle, Marek Harsdor, MoiraO’Brien-Malone, Nick Nuttall, Peter Poschen, Kees van der Ree, Kenneth Rung, and Mathis Wackernagel ortheir important review and comments. A special thanks o appreciation go to Edward Barbier or his review andsubstantive inputs. Any remaining errors and omissions are the responsibility o the authoring team alone.
The Green Economy Report was produced in close partnership with the International Labour Organization (ILO).
The tourism chapter was developed in partnership with the World Tourism Organization (UNWTO).
Also to be recognized are Annie Haakenstad, Kim Hyunsoo, Kim Juhern, Tilmann Liebert, François Macheras,Dominique Maingot, Dmitry Preobrazhensky, Alexandra Quandt, Pascal Rosset, and Dhanya Williams or theirresearch assistance, and Désirée Leon, Rahila Mughal, and Fatma Pandey or administrative support.
iii - iv
e c o
GRE E N
n om
y
A ck n owl e d g em ent s Acknowledgements
8/7/2019 Green Economy Report - Synthesis Report
http://slidepdf.com/reader/full/green-economy-report-synthesis-report 6/52
ForewordNearly 20 years ater the Earth Summit, nations are again on the Road to Rio, but in a world very dierent and very changedrom that o 1992.
Then we were just glimpsing some o the challenges emerging across the planet rom climate change and the loss o speciesto desertication and land degradation.
Today many o those seemingly ar o concerns are becoming a reality with sobering implications or not only achieving theUN’s Millennium Development Goals, but challenging the very opportunity or close to seven billion people − rising to ninebillion by 2050 − to be able to thrive, let alone survive.
Rio 1992 did not ail the world—ar rom it. It provided the vision and important pieces o the multilateral machinery toachieve a sustainable uture.
But this will only be possible i the environmental and social pillars o sustainable development are given equal ooting withthe economic one: where the oten invisible engines o sustainability, rom orests to reshwaters, are also given equal i notgreater weight in development and economic planning.
Towards a Green Economy is among UNEP’s key contributions to the Rio+20 process and the overall goal o addressingpoverty and delivering a sustainable 21st century.
The report makes a compelling economic and social case or investing two per cent o global GDP in greening ten centralsectors o the economy in order to shit development and unleash public and private capital fows onto a low-carbon,resource-ecient path.
Such a transition can catalyse economic activity o at least a comparable size to business as usual, but with a reduced risk o the crises and shocks increasingly inherent in the existing model.
New ideas are by their very nature disruptive, but ar less disruptive than a world running low on drinking water andproductive land, set against the backdrop o climate change, extreme weather events and rising natural resource scarcities.
A green economy does not avour one political perspective over another. It is relevant to all economies, be they state or moremarket-led. Neither is it a replacement or sustainable development. Rather, it is a way o realizing that development at thenational, regional and global levels and in ways that resonate with and ampliy the implementation o Agenda 21.
A transition to a green economy is already underway, a point underscored in the report and a growing wealth o companionstudies by international organizations, countries, corporations and civil society. But the challenge is clearly to build on thismomentum.
Rio+20 oers a real opportunity to scale-up and embed these “green shoots”. In doing so, this report oers not only aroadmap to Rio but beyond 2012, where a ar more intelligent management o the natural and human capital o this planetnally shapes the wealth creation and direction o this world.
Achim Steiner
UNEP Executive DirectorUnited Nations Under-Secretary General
Towards a Green Economy
8/7/2019 Green Economy Report - Synthesis Report
http://slidepdf.com/reader/full/green-economy-report-synthesis-report 7/52
v - vi
e c o
GRE E N
n om
y
F or ew or d
8/7/2019 Green Economy Report - Synthesis Report
http://slidepdf.com/reader/full/green-economy-report-synthesis-report 8/52
IntroductionFrom Crisis to Opportunity
The last two years have seen the idea o a “green economy”
foat out o its specialist moorings in environmental
economics and into the mainstream o policy discourse.
It is ound increasingly in the words o heads o state andnance ministers, in the text o G20 communiqués, and
discussed in the context o sustainable development and
poverty eradication.1
This recent traction or a green economy concept has no
doubt been aided by widespread disillusionment with
our prevailing economic paradigm, a sense o atigue
emanating rom the many concurrent crises and market
ailures experienced during the very rst decade o the
new millennium, including especially the nancial and
economic crisis o 2008. But at the same time, we have seen
increasing evidence o a way orward, a new economic
paradigm – one in which material wealth is not delivered
perorce at the expense o growing environmental risks,ecological scarcities and social disparities.
Mounting evidence also suggests that transitioning
to a green economy has sound economic and social
justication. There is a strong case emerging or a
redoubling o eorts by both governments as well
as the private sector to engage in such an economic
transormation. For governments, this would include
leveling the playing eld or greener products by
phasing out antiquated subsidies, reorming policies
and providing new incentives, strengthening market
inrastructure and market-based mechanisms, redirecting
public investment, and greening public procurement.For the private sector, this would involve understanding
and sizing the true opportunity represented by green
economy transitions across a number o key sectors, and
responding to policy reorms and price signals through
higher levels o nancing and investment.
We argue in UNEP’s orthcoming Green Economy Report,
and in this extracted Synthesis or Policy Makers, that the
rewards o greening the world’s economies are tangible
and considerable, that the means are at hand or both
governments and the private sector, and that the time to
engage the challenge is now.
An Era of Capital Misallocation
Several concurrent crises have either sprung up oraccelerated during the last decade: crises in climate,biodiversity, uel, ood, water, and o late in the nancialsystem and the economy as a whole. Acceleratingclimate-changing emissions indicate a mounting threato runaway climate change, with potentially disastroushuman consequences. The uel price shock o 2008, anda related fare up in ood and commodity prices, bothindicate structural weaknesses and risks which remainunresolved. Rising demand, orecast by the InternationalEnergy Agency (IEA) and others, suggests an ongoingdependence on oil and other ossil uels and much higherenergy prices as the world economy struggles to recoverand grow.
As regards to ood security, we are seeing neitherwidespread understanding o the nature o the problem,
nor globally collaborative solutions or how we shall eeda population o 9 billion by 2050. Freshwater scarcityis already a global problem, and orecasts suggest agrowing gap2 by 2030 between annual reshwaterdemand and renewable supply. The outlook or improvedsanitation still looks bleak or over 2.6 billion people; 884million people still lack access to clean drinking water.3 Collectively, these crises are severely impacting ourability to sustain prosperity worldwide and to achievethe Millennium Development Goals (MDGs) or reducingextreme poverty. They are compounding persistent socialproblems rom job losses, socio-economic insecurity andpoverty, and threatening social stability.
Although the causes o these crises vary, at a undamentallevel they all share a common eature: the grossmisallocation o capital. During the last two decades,much capital was poured into property, ossil uels andstructured nancial assets with embedded derivatives, butrelatively little in comparison was invested in renewableenergy, energy eciency, public transportation,sustainable agriculture, ecosystem and biodiversityprotection, and land and water conservation. Indeed,most economic development and growth strategiesencouraged rapid accumulation o physical, nancial andhuman capital, but at the expense o excessive depletionand degradation o natural capital, which includes ourendowment o natural resources and ecosystems. By
depleting the world’s stock o natural wealth – otenirreversibly – this pattern o development and growth has
1. The “Rio+20” agenda has adopted “green economy” as a key theme in the context o sustainable development and poverty eradication.
2. Charting our Water Future: Economic Frameworks to Inorm Decision Making. Munich: 2030 Water Resources Group. McKinsey and Company (2009), p. iv.3. Progress on Sanitation and Drinking Water: 2010 Update. WHO/UNICEF Joint Monitoring Programme or Water Supply and Sanitation. World Health Organization and UNICEF (2010), pp. 6-7.
Towards a Green Economy
8/7/2019 Green Economy Report - Synthesis Report
http://slidepdf.com/reader/full/green-economy-report-synthesis-report 9/52
had detrimental impacts on the well-being o current
generations and presents tremendous risks and
challenges or uture generations. The recent multiple
crises are symptomatic o this pattern.
Existing policies and market incentives have
contributed to this problem o capital misallocationbecause they allow businesses to run up signicant
social and environmental externalities, largely
unaccounted or and unchecked. “Unettered markets
are not meant to solve social problems”4 so there is
a need or better public policies, including pricing
and regulatory measures, to change the perverse
market incentives that drive this capital misallocation
and ignore social and environmental externalities.
Increasingly too, the role o appropriate regulations,
policies and public investments as enablers or
bringing about changes in the pattern o private
investment is being recognized and demonstrated
through success stories rom around the world,especially in developing countries.5
What is a Green Economy?
UNEP denes a green economy as one that results
in improved human well-being and social equity, while
signifcantly reducing environmental risks and ecological
scarcities. In its simplest expression, a green economy
can be thought o as one which is low carbon, resource
ecient and socially inclusive. In a green economy,
growth in income and employment should be driven
by public and private investments that reduce carbon
emissions and pollution, enhance energy and resource
eciency, and prevent the loss o biodiversity and
ecosystem services. These investments need to
be catalysed and supported by targeted public
expenditure, policy reorms and regulation changes.
The development path should maintain, enhance and,
where necessary, rebuild natural capital as a critical
economic asset and as a source o public benets,
especially or poor people whose livelihoods and
security depend on nature.
The concept o a “green economy” does not replace
sustainable development, but there is now a growing
recognition that achieving sustainability rests almostentirely on getting the economy right. Decades o
creating new wealth through a “brown economy”model have not substantially addressed social
marginalization and resource depletion, and we arestill ar rom delivering to the Millennium DevelopmentGoals. Sustainability is still a vital long-term goal, butwe must work on greening the economy to get us
there.
To make the transition to a green economy, specicenabling conditions will be required. These enabling
conditions consist o the backdrop o nationalregulations, policies, subsidies and incentives, andinternational market and legal inrastructure and tradeand aid protocols. At present, enabling conditions
are heavily weighted towards, and encourage, theprevailing brown economy, which, inter alia, dependsexcessively on ossil uel energy.
For example, price and production subsidies or ossiluels collectively exceeded US$ 650 billion in 2008,6 and this high level o subsidization can adverselyaect transition to the use o renewable energies. In
contrast, enabling conditions or a green economycan pave the way or the success o public and privateinvestment in greening the world’s economies. At anational level, examples o such enabling conditions
are: changes to scal policy, reorm and reductiono environmentally harmul subsidies; employingnew market-based instruments; targeting publicinvestments to “green” key sectors; greening publicprocurement; and improving environmental rules
and regulations as well as their enorcement. At aninternational level, there are also opportunities to add
to market inrastructure, improve trade and aid fows,and oster greater international cooperation.
UNEP’s Green Economy Report, entitled Towards a
Green Economy, aims to debunk several myths andmisconceptions about the economics o “greening”
the global economy, and provides timely and practicalguidance to policy makers on what reorms they needto unlock the productive and employment potential o a green economy.
Perhaps the most widespread myth is that there isan inescapable trade-o between environmentalsustainability and economic progress. There is now
substantial evidence that the “greening” o economiesneither inhibits wealth creation nor employment
01 - 02
e c o
GRE E N
n om
y
I nt r o d u ct i on
4. Yunus, Muhammad and Karl Weber. Creating a World without Poverty: Social Business and the Future o Capitalism. Public Aairs (2007), p. 5.5. Green Economy Developing Countries Success Stories. United Nations Environment Programme (2010), p. 6.
6. Analysis o the Scope o Energy Subsidies and Suggestions or the G20 Initiative. IEA, OPEC, OECD, and World Bank joint report prepared or submission to the G20 Summit Meeting, Toronto (Canada),26-27 June 2010, p. 4.
8/7/2019 Green Economy Report - Synthesis Report
http://slidepdf.com/reader/full/green-economy-report-synthesis-report 10/52
opportunities, and that there are many green sectors
which show signicant opportunities or investment and
related growth in wealth and jobs. A caveat, however, is
that there is a need to establish new enabling conditions
to promote the transition to a green economy, and this is
where urgent action is required o policy makers around
the world.
A second myth is that a green economy is a luxury only
wealthy countries can aord, or worse, a developed-world
imposition to restrain development and perpetuate
poverty in developing countries. Contrary to this
perception, we nd there are a plethora o examples o
greening transitions taking place in various sectors in the
developing world, which deserve to be emulated and
replicated elsewhere. Towards a Green Economy brings
some o these examples to light and highlights their
scope or wider application.
UNEP’s work on the green economy raised the visibilityo this concept in 2008, particularly through our call or a
Global Green New Deal (GGND). The GGND recommended
a package o public investments and complementary
policy and pricing reorms aimed at kick-starting a
transition to a green economy while reinvigorating
economies and jobs and addressing persistent poverty.7
Designed as a timely and appropriate policy response
to the economic crisis, the GGND proposal was an early
output rom the United Nations’ Green Economy Initiative.
This initiative, coordinated by UNEP, was one o the nine
Joint Crisis Initiatives undertaken by the Secretary-General
o the UN and his Chie Executives Board in response to
the 2008 economic and nancial crisis.
Towards a Green Economy – the main output o the Green
Economy Initiative – demonstrates that the greening o
economies is not generally a drag on growth but rather a
new engine o growth; that it is a net generator o decent
jobs, and that it is also a vital strategy or the elimination
o persistent poverty. The report also seeks to motivate
policy makers to create the enabling conditions or
increased investments in a transition to a green economy
in three ways.
Firstly, it makes an economic case or shiting investment,
both public and private, to transorm key sectors that are
critical to green the global economy. It illustrates through
examples how added employment through green jobs
osets job losses in the process o transitioning to a green
economy.
Secondly, it shows how a green economy can reduce
persistent poverty across a range o important sectors– agriculture, orestry, reshwater, sheries and energy.
Sustainable orestry and ecologically riendly arming
methods help conserve soil ertility and water resources
in general, and especially or subsistence arming, upon
which depend the livelihoods o almost 1.3 billion people.8
Lastly, it provides guidance on policies to achieve this
shit: by reducing or eliminating environmentally harmul
or perverse subsidies, by addressing market ailures
created by externalities or imperect inormation, through
market-based incentives, through appropriate regulatory
ramework and green public procurement, and through
stimulating investment.
How Far are we from aGreen Economy?
Over the last quarter o a century, the world economy has
quadrupled, beneting hundreds o millions o people.9
In contrast, however, 60% o the world’s major ecosystem
goods and services that underpin livelihoods have been
degraded or used unsustainably.10 Indeed, this is because
the economic growth o recent decades has been
accomplished mainly through drawing down natural
resources, without allowing stocks to regenerate, and
through allowing widespread ecosystem degradationand loss.
For instance, today only 20% o commercial sh stocks,
mostly o low priced species, are underexploited, 52%
are ully exploited with no urther room or expansion,
about 20% are overexploited and 8% are depleted.11
Water is becoming scarce and water stress is projected to
increase with water supply satisying only 60% o world
demand in 20 years;12 agriculture saw increasing yields
primarily due to the use o chemical ertilizers,13 which
have reduced soil quality14 and ailed to curb the growing
trend o deorestation – remaining at 13 million hectares
7. See Barbier, E.B. A Global Green New Deal: Rethinking the Economic Recovery. Cambridge University Press and UNEP (2010), Cambridge, UK.
8. Green Jobs: Towards Decent Work in a Sustainable, Low-carbon World. UNEP, ILO, IOE, ITUC. United Nations Environment Programme (2008), p. 11.
9. World Economic Outlook Database, IMF: Washington D.C. (September 2006), Available at: http://www.im.org/external/pubs/t/weo/2006/02/data/download.aspx.10. Ecosystem and Human Well-being: Synthesis. Millennium Ecosystem Assessment (2005). p. 1.
11. State o World Fisheries and Aquaculture 2008. UN Food and Agricultural Organization (2009), p. 30.12. Charting our Water Future: Economic Frameworks to Inorm Decision Making. Munich: 2030 Water Resources Group. McKinsey and Company (2009), p. 7.
13. FAOSTAT, 2009.14. Müller, Adrian and Joan S. Davis. Reducing Global Warming: The Potential o Organic Agriculture. Rodale Institute and FiBL (2009), p. 1.
Towards a Green Economy
8/7/2019 Green Economy Report - Synthesis Report
http://slidepdf.com/reader/full/green-economy-report-synthesis-report 11/52
o orest per year in 1990-2005.15 Ecological scarcitiesare thereore seriously aecting the entire gamut o economic sectors, which are the bedrock o human oodsupply (sheries, agriculture, reshwater, orestry) and acritical source o livelihoods or the poor. And ecologicalscarcity and social inequity are denitional signatures o
an economy which is very ar rom being “green”.
Meanwhile, or the rst time in history, more than hal o the world population lives in urban areas. Cities nowaccount or 75% o energy consumption16 and 75%o carbon emissions.17 Rising and related problems o congestion, pollution, and poorly provisioned servicesaect the productivity and health o all, but all particularlyhard on the urban poor. With approximately 50% o theglobal population now living in emerging economies18 that are rapidly urbanizing and will experience risingincome and purchasing power over the next years – anda tremendous expansion in urban inrastructure – theneed or smart city planning is paramount.
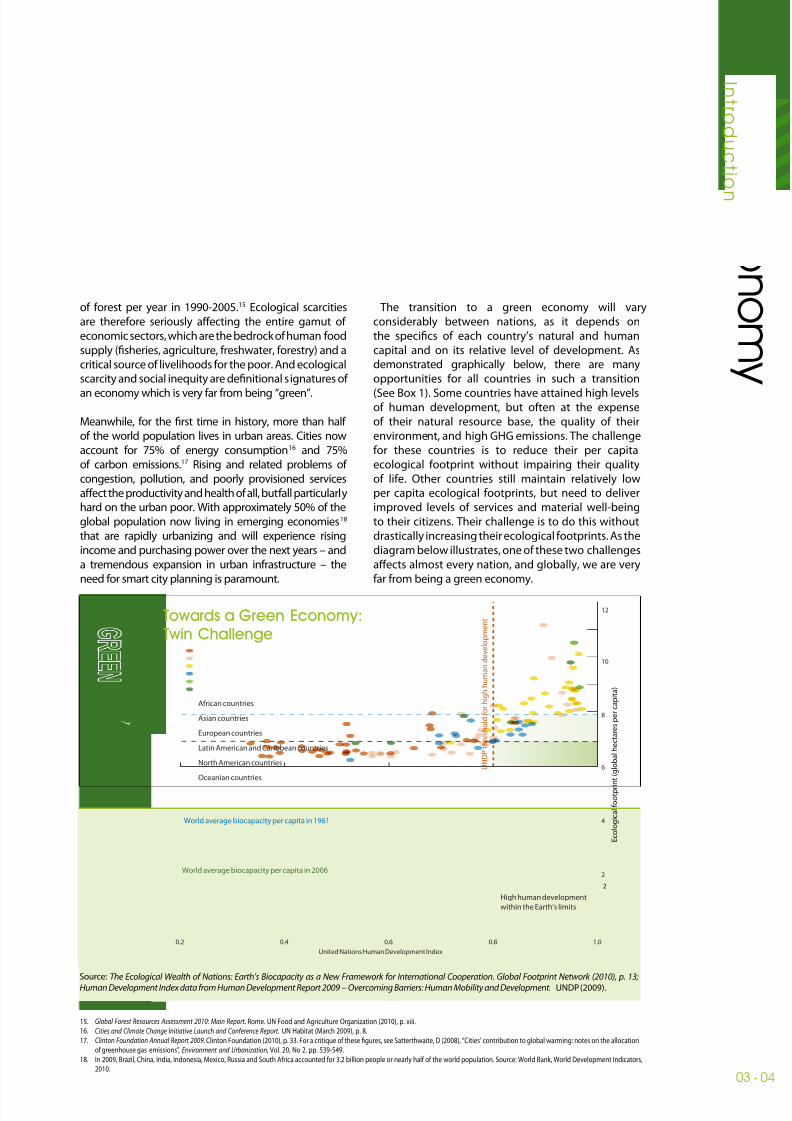
The transition to a green economy will varyconsiderably between nations, as it depends onthe specics o each country’s natural and humancapital and on its relative level o development. Asdemonstrated graphically below, there are manyopportunities or all countries in such a transition
(See Box 1). Some countries have attained high levelso human development, but oten at the expenseo their natural resource base, the quality o theirenvironment, and high GHG emissions. The challengeor these countries is to reduce their per capitaecological ootprint without impairing their qualityo lie. Other countries still maintain relatively lowper capita ecological ootprints, but need to deliverimproved levels o services and material well-beingto their citizens. Their challenge is to do this withoutdrastically increasing their ecological ootprints. As thediagram below illustrates, one o these two challengesaects almost every nation, and globally, we are veryar rom being a green economy.
03 - 04
e c o
GRE E N
n om
y
I nt r o d u ct i on
15. Global Forest Resources Assessment 2010: Main Report. Rome. UN Food and Agriculture Organization (2010), p. xiii.16. Cities and Climate Change Initiative Launch and Conerence Report. UN Habitat (March 2009), p. 8.
17. Clinton Foundation Annual Report 2009. Clinton Foundation (2010), p. 33. For a critique o these gures, see Satterthwaite, D (2008), “Cities’ contribution to global warming: notes on the allocationo greenhouse gas emissions”, Environment and Urbanization, Vol. 20, No 2. pp. 539-549.
18. In 2009, Brazil, China, India, Indonesia, Mexico, Russia and South Arica accounted or 3.2 billion people or nearly hal o the world population. Source: World Bank, World Development Indicators,2010.
Box 1. Towards a Green Economy:Twin Challenge
Source: The Ecological Wealth o Nations: Earth’s Biocapacity as a New Framework or International Cooperation. Global Footprint Network (2010), p. 13;Human Development Index data rom Human Development Report 2009 − Overcoming Barriers: Human Mobility and Development. UNDP (2009).
U N D P t h r e s h o l d f o r h i g h h u m a n d e v e l o p m e n t
Asian countries
European countries
African countries
Oceanian countries
North American countries
Latin American and Caribbean countries
High human development
within the Earth’s limits
World average biocapacity per capita in 2006
World average biocapacity per capita in 1961
2
2
4
6
8
10
12
0.2 0.4 0.6 0.8 1.0
United Nations Human Development Index
E c o l o g i c a l f o o t p r i n t ( g l o b a l h e c t a r e s p e r c a p i t a )
8/7/2019 Green Economy Report - Synthesis Report
http://slidepdf.com/reader/full/green-economy-report-synthesis-report 12/52
How to Measure Progresstowards a Green Economy
We cannot hope to manage what we do not even
measure. Thereore, we argue that notwithstanding the
complexity o an overall transition to a green economy,we must identiy and use appropriate indicators at both a
macroeconomic level and a sectoral level.
Conventional economic indicators, such as GDP, provide
a distorted lens or economic perormance particularly
since such measures ail to refect the extent to which
production and consumption activities may be drawing
down natural capital. By either depleting natural
resources, or degrading the ability o ecosystems to
deliver economic benets, in terms o provisioning,
regulating or cultural services, economic activity is oten
based on the depreciation o natural capital.
Ideally, changes in stocks o natural capital would
be evaluated in monetary terms and incorporated
into the national accounts, as is being pursued in the
ongoing development o the System o Environmental
and Economic Accounting (SEEA) by the UN Statistical
Division, and the adjusted net national savings methods
o the World Bank.19 The wider use o such measures
would provide a truer indication o the real level and
viability o growth in income and employment. Green
Accounting or Inclusive Wealth Accounting are available
rameworks which we expect will be adopted by a ew
nations20 initially and pave the way or measuring a green
economy transition at the macroeconomic plane.
In this report, we explored through a macroeconomic
model21 the impacts o investments in greening the
economy as against investments in “business as usual”
– measuring results not only in terms o traditional GDP
but also impacts on employment, resource intensity,
emissions and ecological impact. We estimated, based
on several studies (see Annex I), that the annual nancing
demand to green the global economy was in the range o
US$ 1.05-2.59 trillion. To place this demand in perspective,
it is less than one-tenth o the total global investment per
year (as measured by global Gross Capital Formation).
Taking an annual level o US$ 1.3 trillion (i.e. 2% o global
GDP) as a target reallocation rom “brown” investment to
“green” investment, our macroeconomic model suggests
that over time, investing in a green economy enhances
long-run economic perormance and can increase total
global wealth. Signicantly, it does so while enhancing
stocks o renewable resources, reducing environmental
risks, and rebuilding our capacity to generate uture
prosperity.
Towards a Green Economy
Our report, Towards a Green Economy, ocuses on 10
key economic sectors because we see these sectors as
driving the dening trends o the transition to a green
economy, including increasing human well-being and
social equity, and reducing environmental risks and
ecological scarcities. Across many o these sectors, we
have ound that greening the economy can generate
consistent and positive outcomes or increased wealth,
growth in economic output, decent employment, and
reduced poverty. These cross-cutting observations are
summarized as our “key ndings” in the next section.
We have also ound several sector-specic investment
opportunities and policy reorms to be o global
importance as they appear replicable and scalable in our
goal to transition to a green economy. These are largely
in renewable energy and resource eciency. Resource
eciency is a theme that has many dimensions as it cuts
across energy eciency in manuacture and habitation,
materials eciency in manuacture, and better waste
management.
Finally, to transition successully to a green economy
the importance o adequate and avourable enabling
conditions cannot be overemphasized. The latter includesappropriate domestic scal measures and policy reorms,international collaboration through trade, aid, market
inrastructure, and capacity-building support. These are
described and addressed, along with steps necessary to
mobilize nance or a green economy transition, in the
nal sections o this Synthesis or Policy Makers.
19. Where is the Wealth o Nations? Measuring Capital or the 21st Century. World Bank: Washington, D.C. (2006), p. 123.20. World Bank, together with UNEP and other partners, have recently (at Nagoya, CBD COP-10, October 2009) announced a global project on “Ecosystem Valuation and Wealth Accounting” which will enable
a group o developing and developed nations to test this ramework and evolve a set o pilot national accounts that are better able to refect and measure sustainability concerns.21. “T-21” model used in chapter on Enabling Conditions or a Green Economy.
Towards a Green Economy

8/7/2019 Green Economy Report - Synthesis Report
http://slidepdf.com/reader/full/green-economy-report-synthesis-report 13/52
05 - 06
e c o
GRE E N
n om
y
K e y F i n d i n
g s
22. Convention on Biological Diversity, Article 2, Use o Terms, http://www.cbd.int/convention/articles/?a=cbd-02
Key FindingsBeyond an exploration o sectoral success stories, which the Green Economy
Report documents in each o its chapters, there are three broad thematic
conclusions which we draw, and these are documented in this section.
The rst key nding is a prediction o our macroeconomic model o thetransition to a green economy; that greening not only generates increases in
wealth, in particular a gain in ecological commons or natural capital, but also
(over a period o six years) produces a higher rate o GDP growth – a classical
measure o economic perormance.
Our second key nding is the inextricable link between poverty eradication and
better maintenance and conservation o the ecological commons, arising rom
the benet fows rom natural capital that are received directly by the poor.
The third key nding is that in a transition to a green economy, new jobs
are created, which over time exceed the losses in “brown economy” jobs.
However, there is a period o job losses in transition, which requires investment
in re-skilling and re-educating the workorce. The role o natural capital and
especially “living” natural capital (the planet’s ecosystems and biodiversity)
cannot be overstated in the context o these key ndings. Thus, we begin with
some comments on natural capital and its benet fows, especially to poor
and vulnerable communities.
A Green Economy Recognizesthe Value of, and Invests in,Natural Capital
Biodiversity, the living abric o this planet, includes lie
at all levels: genes, species and ecosystems.22 At each
o these levels, biodiversity contributes to human well-
being and provides economies with valuable resource
inputs as well as regulating services towards a sae
operating environment. These so-called “ecosystem
services” (see Table 1) are mostly in the nature o publicgoods and services whose economic invisibility has
thus ar been a major cause o their undervaluation,
mismanagement and ultimately resulting loss.
Economic values can be estimated or these ecosystem
services, and the present value o these ecosystem
services is a undamental part o “natural capital.”
Natural assets such as orests, lakes, wetlands and river
basins are essential components o natural capital at an
ecosystem level. They are vital in ensuring the stability
o the water cycle and its benets to agriculture and
households, the carbon cycle and its role in climate
mitigation, soil ertility and its value to crop production,
local microclimates or sae habitats, sheries or
proteins, and so on, which are all crucial elements o a
green economy.
8/7/2019 Green Economy Report - Synthesis Report
http://slidepdf.com/reader/full/green-economy-report-synthesis-report 14/52
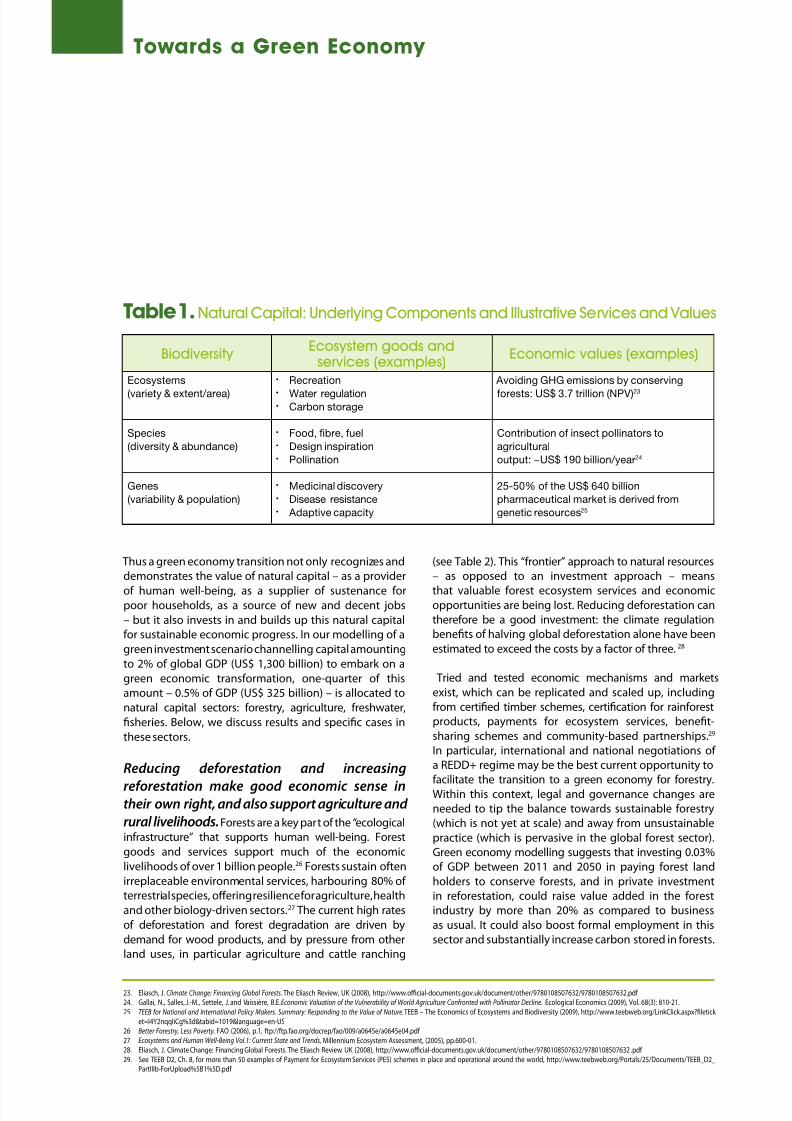
Thus a green economy transition not only recognizes and
demonstrates the value o natural capital – as a provider
o human well-being, as a supplier o sustenance orpoor households, as a source o new and decent jobs
– but it also invests in and builds up this natural capital
or sustainable economic progress. In our modelling o a
green investment scenario channelling capital amounting
to 2% o global GDP (US$ 1,300 billion) to embark on a
green economic transormation, one-quarter o this
amount – 0.5% o GDP (US$ 325 billion) – is allocated to
natural capital sectors: orestry, agriculture, reshwater,
sheries. Below, we discuss results and specic cases in
these sectors.
Reducing deorestation and increasing
reorestation make good economic sense intheir own right, and also support agriculture and
rural livelihoods.Forests are a key part o the “ecological
inrastructure” that supports human well-being. Forest
goods and services support much o the economic
livelihoods o over 1 billion people.26 Forests sustain oten
irreplaceable environmental services, harbouring 80% o
terrestrial species, oering resilience or agriculture, health
and other biology-driven sectors.27 The current high rates
o deorestation and orest degradation are driven by
demand or wood products, and by pressure rom other
land uses, in particular agriculture and cattle ranching
(see Table 2). This “rontier” approach to natural resources
– as opposed to an investment approach – means
that valuable orest ecosystem services and economicopportunities are being lost. Reducing deorestation can
thereore be a good investment: the climate regulation
benets o halving global deorestation alone have been
estimated to exceed the costs by a actor o three.28
Tried and tested economic mechanisms and markets
exist, which can be replicated and scaled up, including
rom certied timber schemes, certication or rainorest
products, payments or ecosystem services, benet-
sharing schemes and community-based partnerships.29
In particular, international and national negotiations o
a REDD+ regime may be the best current opportunity to
acilitate the transition to a green economy or orestry.Within this context, legal and governance changes are
needed to tip the balance towards sustainable orestry
(which is not yet at scale) and away rom unsustainable
practice (which is pervasive in the global orest sector).
Green economy modelling suggests that investing 0.03%
o GDP between 2011 and 2050 in paying orest land
holders to conserve orests, and in private investment
in reorestation, could raise value added in the orest
industry by more than 20% as compared to business
as usual. It could also boost ormal employment in this
sector and substantially increase carbon stored in orests.
23. Eliasch, J. Climate Change: Financing Global Forests. The Eliasch Review, UK (2008), http://www.ocial-documents.gov.uk/document/other/9780108507632/9780108507632.pd 24. Gallai, N., Salles, J.-M., Settele, J. and Vaissière, B.E. Economic Valuation o the Vulnerability o World Agriculture Conronted with Pollinator Decline. Ecological Economics (2009), Vol. 68(3): 810-21.
25. TEEB or National and International Policy Makers. Summary: Responding to the Value o Nature. TEEB – The Economics o Ecosystems and Biodiversity (2009), http://www.teebweb.org/LinkClick.aspx?letick
et=I4Y2nqqIiCg%3d&tabid=1019&language=en-US26. Better Forestry, Less Poverty. FAO (2006), p.1, tp://tp.ao.org/docrep/ao/009/a0645e/a0645e04.pd
27. Ecosystems and Human Well-Being Vol.1: Current State and Trends, Millennium Ecosystem Assessment, (2005), pp.600-01.28. Eliasch, J. Climate Change: Financing Global Forests. The Eliasch Review. UK (2008), http://www.ocial-documents.gov.uk/document/other/9780108507632/9780108507632 .pd
29. See TEEB D2, Ch. 8, or more than 50 examples o Payment or Ecosystem Services (PES) schemes in place and operational around the world, http://www.teebweb.org/Portals/25/Documents/TEEB_D2_PartIIIb-ForUpload%5B1%5D.pd
Table 1.Natural Capital: Underlying Components and Illustrative Services and Values
BiodiversityEcosystem goods and
services (examples)Economic values (examples)
Ecosystems
(variety & extent/area)
Species(diversity & abundance)
Genes(variability & population)
• Recreation•
Water regulation• Carbon storage
• Food, bre, uel• Design inspiration• Pollination
• Medicinal discovery• Disease resistance• Adaptive capacity
Avoiding GHG emissions by conserving
orests: US$ 3.7 trillion (NPV)23
Contribution o insect pollinators toagriculturaloutput: ~US$ 190 billion/year24
25-50% o the US$ 640 billionpharmaceutical market is derived romgenetic resources25
Towards a Green Economy
8/7/2019 Green Economy Report - Synthesis Report
http://slidepdf.com/reader/full/green-economy-report-synthesis-report 15/52
07 - 08
e c o
GRE E N
n om
y
K e y F i n d i n
g s
30. Securing the Food Supply, World Water Assessment Program. UNESCO, (2001), pp. 192-93, http://www.unesco.org/water/wwap/wwdr/pd/chap8.pd 31. Fourth Assessment Report o the Intergovernmental Panel on Climate Change. Working Group III Report: Mitigation o Climate Change. IPCC (2007), p. 499, http://www.ipcc.ch/pd/assessment-
report/ar4/wg3/ar4-wg3-chapter8.pd 32. Childhood Pesticide Poisoning, Inormation or Advocacy and Action. UNEP Chemicals (2004), p.7, http://www.chem.unep.ch/Publications/pd/pestpoisoning.pd
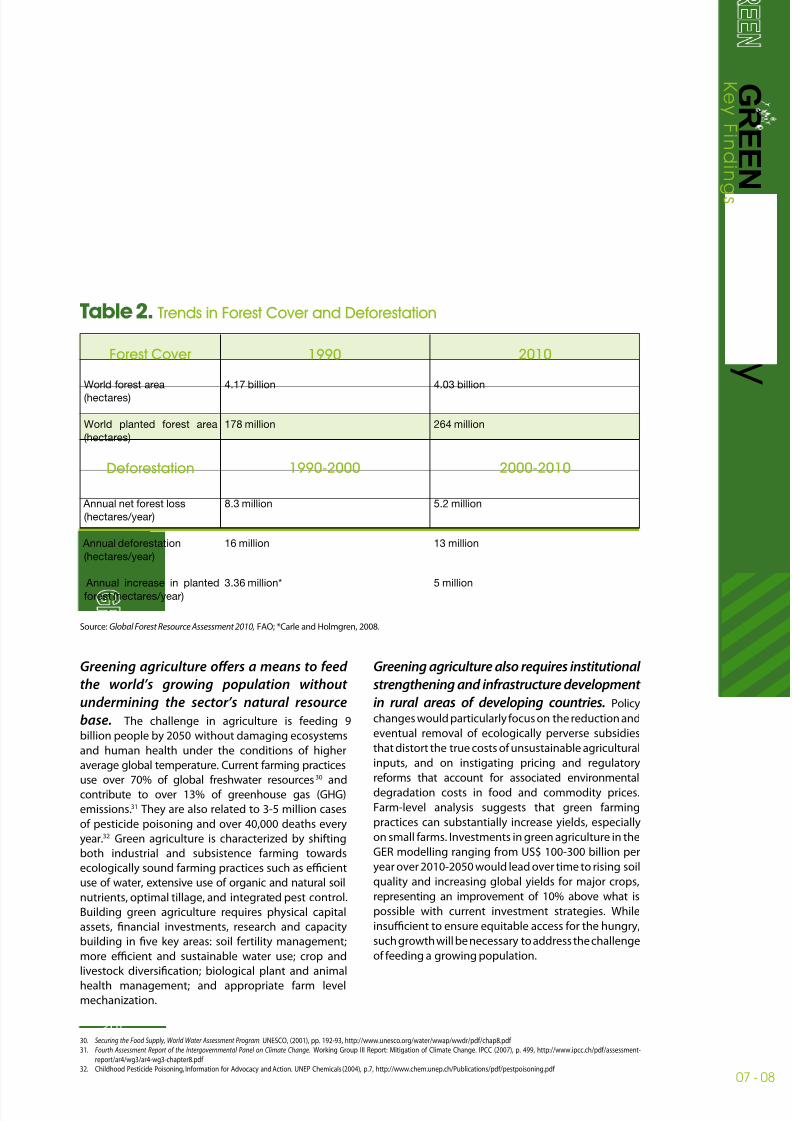
Table 2. Trends in Forest Cover and Deorestation
Source: Global Forest Resource Assessment 2010, FAO; *Carle and Holmgren, 2008.
Greening agriculture oers a means to eed
the world’s growing population without
undermining the sector’s natural resource
base. The challenge in agriculture is eeding 9
billion people by 2050 without damaging ecosystems
and human health under the conditions o higher
average global temperature. Current arming practices
use over 70% o global reshwater resources
30
andcontribute to over 13% o greenhouse gas (GHG)
emissions.31 They are also related to 3-5 million cases
o pesticide poisoning and over 40,000 deaths every
year.32 Green agriculture is characterized by shiting
both industrial and subsistence arming towards
ecologically sound arming practices such as ecient
use o water, extensive use o organic and natural soil
nutrients, optimal tillage, and integrated pest control.
Building green agriculture requires physical capital
assets, nancial investments, research and capacity
building in ve key areas: soil ertility management;
more ecient and sustainable water use; crop and
livestock diversication; biological plant and animal
health management; and appropriate arm levelmechanization.
Greening agriculture also requires institutional
strengthening and inrastructure development
in rural areas o developing countries. Policy
changes would particularly ocus on the reduction and
eventual removal o ecologically perverse subsidies
that distort the true costs o unsustainable agricultural
inputs, and on instigating pricing and regulatory
reorms that account or associated environmental
degradation costs in ood and commodity prices.
Farm-level analysis suggests that green arming
practices can substantially increase yields, especially
on small arms. Investments in green agriculture in the
GER modelling ranging rom US$ 100-300 billion per
year over 2010-2050 would lead over time to rising soil
quality and increasing global yields or major crops,
representing an improvement o 10% above what is
possible with current investment strategies. While
insucient to ensure equitable access or the hungry,
such growth will be necessary to address the challenge
o eeding a growing population.
World orest area(hectares)
World planted orest area(hectares)
Annual net orest loss(hectares/year)
Annual deorestation(hectares/year)
Annual increase in plantedorest (hectares/year)
4.17 billion
178 million
8.3 million
16 million
3.36 million*
4.03 billion
264 million
5.2 million
13 million
5 million
1990 2010Forest Cover
1990-2000 2000-2010Deorestation
8/7/2019 Green Economy Report - Synthesis Report
http://slidepdf.com/reader/full/green-economy-report-synthesis-report 16/52
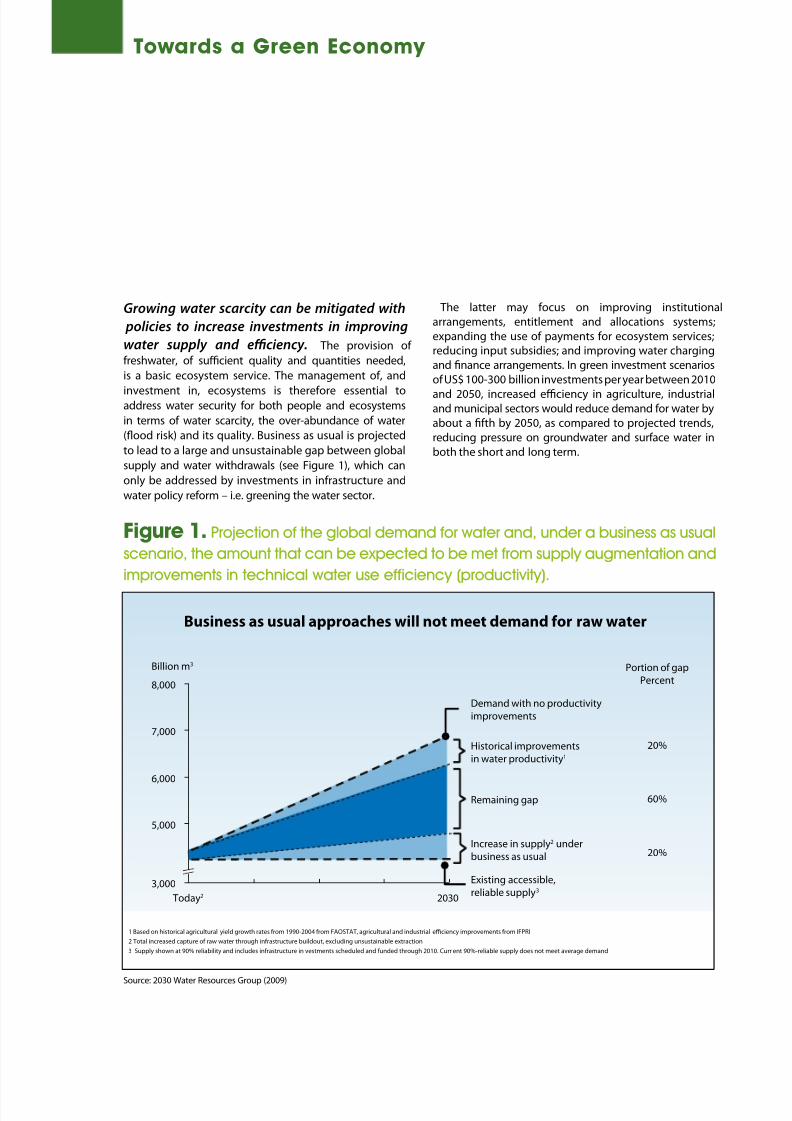
Growing water scarcity can be mitigated with
policies to increase investments in improving
water supply and eciency. The provision o
reshwater, o sucient quality and quantities needed,
is a basic ecosystem service. The management o, and
investment in, ecosystems is thereore essential toaddress water security or both people and ecosystems
in terms o water scarcity, the over-abundance o water
(food risk) and its quality. Business as usual is projected
to lead to a large and unsustainable gap between global
supply and water withdrawals (see Figure 1), which can
only be addressed by investments in inrastructure and
water policy reorm – i.e. greening the water sector.
The latter may ocus on improving institutional
arrangements, entitlement and allocations systems;
expanding the use o payments or ecosystem services;reducing input subsidies; and improving water charging
and nance arrangements. In green investment scenarios
o US$ 100-300 billion investments per year between 2010
and 2050, increased eciency in agriculture, industrialand municipal sectors would reduce demand or water by
about a th by 2050, as compared to projected trends,
reducing pressure on groundwater and surace water in
both the short and long term.
Business as usual approaches will not meet demand for raw water
Billion m3
Historical improvements
in water productivity1
Remaining gap
Increase in supply2 under
business as usual
Portion of gap
Percent
20%
60%
20%
Existing accessible,
reliable supply3
Demand with no productivity
improvements
Today2
6,000
5,000
3,000
8,000
7,000
2030
1 Based on historical agricultural yield growth rates from 1990-2004 from FAOSTAT, agricultural and industrial eciency improvements from IFPRI
2 Total increased capture of raw water through infrastructure buildout, excluding unsustainable extraction
3 Supply shown at 90% reliability and includes infrastructure in vestments scheduled and funded through 2010. Curr ent 90%-reliable supply does not meet average demand
Figure 1. Projection o the global demand or water and, under a business as usual
scenario, the amount that can be expected to be met rom supply augmentation and
improvements in technical water use eciency (productivity).
Source: 2030 Water Resources Group (2009)
Towards a Green Economy
8/7/2019 Green Economy Report - Synthesis Report
http://slidepdf.com/reader/full/green-economy-report-synthesis-report 17/52
09 - 10
e c o
GRE E N
n om
y
K e y F i n d i n
g s
33. Khan et al. (2006) classied subsidies into three categories labelled ‘good’, ‘bad’ and ‘ugly’, according to their potential impact o n the sustainability o the shery resource. ‘Good’ subsidies enhancethe conservation o sh stocks through time (or example subsidies that und eective sheries management or marine protected areas). ‘Bad’ subsidies are those that lead to overcapacity andoverexploitation, such as uel subsidies. ‘Ugly’ subsidies can lead to either the conservation or overshing o a given sh stock, such as buyback subsidies, which, i not properly designed, can
lead to overcapacity (Clark et al. 2005).
34. The Economics o Ecosystems and Biodiversity: An Interim Report. TEEB – The Economics o Ecosystems and Biodiversity (2008), European Commission, Brussels.35. Nagayets, O., Small arms: Current Status and Key Trends, Prepared or the Future o Small Farms Research Workshop, Wye College, 26–29 June 2005, p. 356, http://www.ipri.org/sites/deault/les/
publications/sproc.pd)36. Irz, X., L. Lin, C. Thirtle and S. Wiggins. Agricultural Growth and Poverty Alleviation. Development Policy Review 19 (4), (2001), pp. 449–466.
37. Pretty, J., Nobel, A.D., Bossio, D., Dixon, J., Hine, R.E., Penning De Vries, F.W.T., Morison, J.I.L. Resource Conserving Agriculture Increases Yields in Developing Countries. Environmental Science andTechnology, 40, (2006), p. 1114.
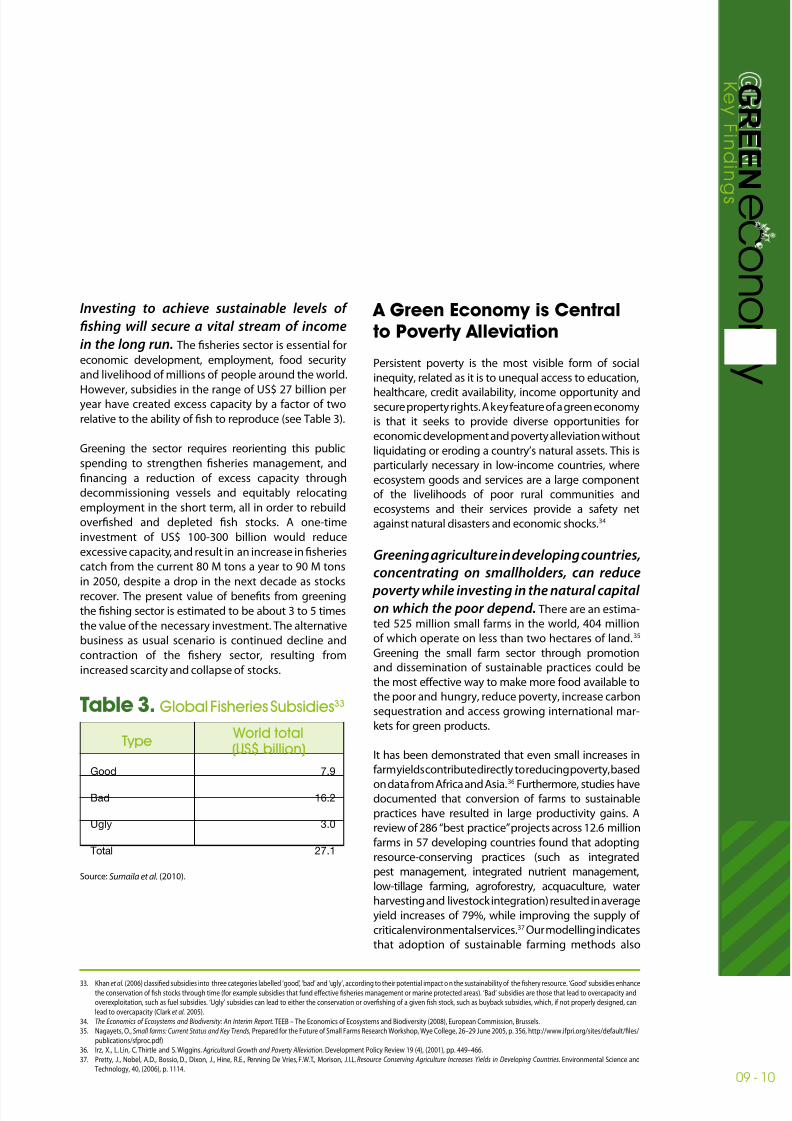
Investing to achieve sustainable levels o
shing will secure a vital stream o income
in the long run. The sheries sector is essential or
economic development, employment, ood security
and livelihood o millions o people around the world.
However, subsidies in the range o US$ 27 billion peryear have created excess capacity by a actor o two
relative to the ability o sh to reproduce (see Table 3).
Greening the sector requires reorienting this public
spending to strengthen sheries management, and
nancing a reduction o excess capacity through
decommissioning vessels and equitably relocating
employment in the short term, all in order to rebuild
overshed and depleted sh stocks. A one-time
investment o US$ 100-300 billion would reduce
excessive capacity, and result in an increase in sheries
catch rom the current 80 M tons a year to 90 M tons
in 2050, despite a drop in the next decade as stocks
recover. The present value o benets rom greening
the shing sector is estimated to be about 3 to 5 times
the value o the necessary investment. The alternative
business as usual scenario is continued decline and
contraction o the shery sector, resulting rom
increased scarcity and collapse o stocks.
A Green Economy is Centralto Poverty Alleviation
Persistent poverty is the most visible orm o social
inequity, related as it is to unequal access to education,
healthcare, credit availability, income opportunity andsecure property rights. A key eature o a green economy
is that it seeks to provide diverse opportunities or
economic development and poverty alleviation without
liquidating or eroding a country’s natural assets. This is
particularly necessary in low-income countries, where
ecosystem goods and services are a large component
o the livelihoods o poor rural communities and
ecosystems and their services provide a saety net
against natural disasters and economic shocks.34
Greening agriculture in developing countries,
concentrating on smallholders, can reduce
poverty while investing in the natural capital on which the poor depend. There are an estima-
ted 525 million small arms in the world, 404 million
o which operate on less than two hectares o land.35
Greening the small arm sector through promotion
and dissemination o sustainable practices could be
the most eective way to make more ood available to
the poor and hungry, reduce poverty, increase carbon
sequestration and access growing international mar-
kets or green products.
It has been demonstrated that even small increases in
arm yields contribute directly to reducing poverty, based
on data rom Arica and Asia.36
Furthermore, studies havedocumented that conversion o arms to sustainable
practices have resulted in large productivity gains. A
review o 286 “best practice” projects across 12.6 million
arms in 57 developing countries ound that adopting
resource-conserving practices (such as integrated
pest management, integrated nutrient management,
low-tillage arming, agroorestry, acquaculture, water
harvesting and livestock integration) resulted in average
yield increases o 79%, while improving the supply o
critical environmental services.37 Our modelling indicates
that adoption o sustainable arming methods also
Table 3. Global Fisheries Subsidies33
Source: Sumaila et al. (2010).
Type World total(US$ billion)
Good
Bad
Ugly
Total
7.9
16.2
3.0
27.1
8/7/2019 Green Economy Report - Synthesis Report
http://slidepdf.com/reader/full/green-economy-report-synthesis-report 18/52
has the potential to transorm agriculture rom a major
emitter o greenhouse gasses to one o net neutrality and
possibly a GHG sink, while reducing deorestation andreshwater use by 55% and 35% respectively.
By increasing investment in natural assets
that are used by the poor to earn their liveli-
hoods, the shit towards a green economy en-
hances livelihoods in many low-income areas. A good example o this comes rom India’s National Rural
Employment Guarantee Act 2006, a social protection
and livelihood security scheme or the rural poor that
invests in the preservation and restoration o natural
capital. It takes the orm o a public works programme
guaranteeing at least 100 days o paid work per year to
every household who wants to volunteer an adult mem-ber. The scheme has grown ourold since its inception
and investment last year amounted to over US$ 8 billion,
creating 3 billion workdays and beneting 59 million
households. About 84% o this investment goes into
water conservation, irrigation and land development.
While there are challenges with implementation, theprogramme is proving to be eective, replicable and
scalable.38
In many developing countries, one o the big-
gest opportunities to speed transition to a
green economy is to invest in the provision o
clean water and sanitation services to the poor. Water, a basic necessity or sustaining lie, goes undelive-red to many o the world’s poor. Over 884 million people
lack access to clean drinking water;39
2.6 billion do nothave access to adequate sanitation services;40 and 1.4
million children under the age o ve die every year as a
result o lack o access to clean water and adequate sani-
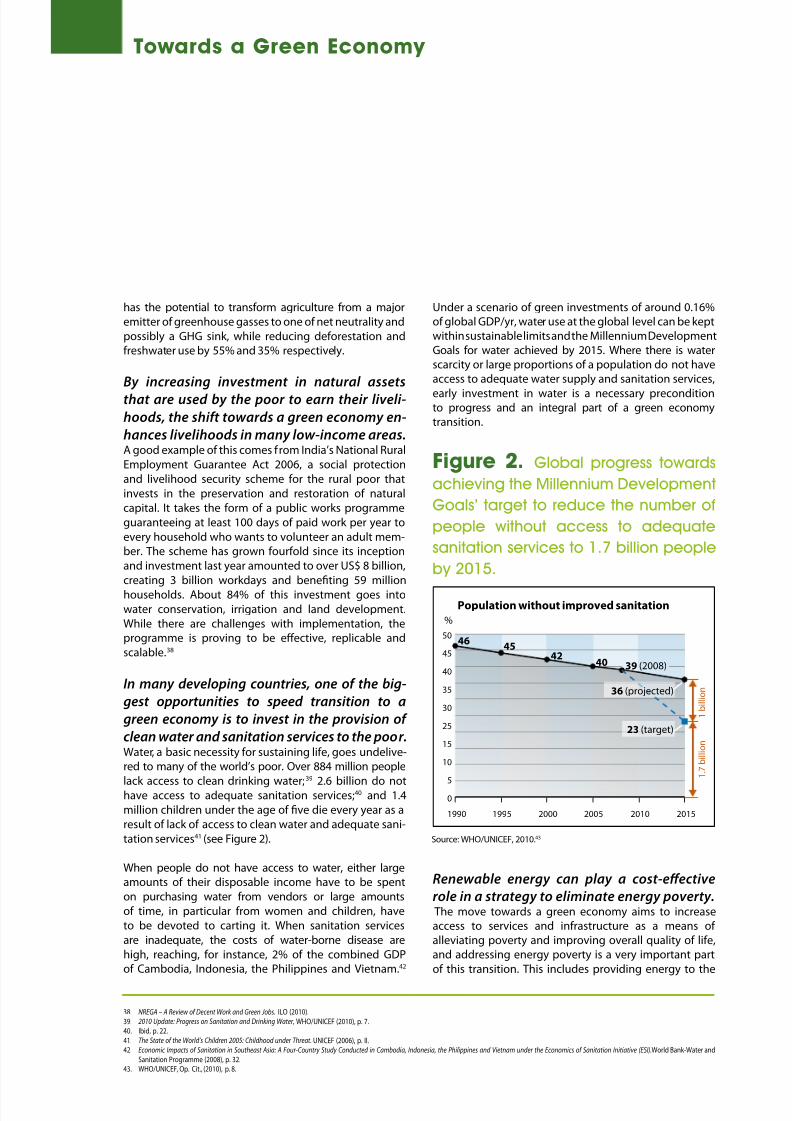
tation services41 (see Figure 2).
When people do not have access to water, either largeamounts o their disposable income have to be spent
on purchasing water rom vendors or large amounts
o time, in particular rom women and children, have
to be devoted to carting it. When sanitation services
are inadequate, the costs o water-borne disease are
high, reaching, or instance, 2% o the combined GDPo Cambodia, Indonesia, the Philippines and Vietnam.42
Under a scenario o green investments o around 0.16%o global GDP/yr, water use at the global level can be keptwithin sustainable limits and the Millennium DevelopmentGoals or water achieved by 2015. Where there is waterscarcity or large proportions o a population do not haveaccess to adequate water supply and sanitation services,
early investment in water is a necessary preconditionto progress and an integral part o a green economytransition.
Figure 2. Global progress towards
achieving the Millennium Development
Goals’ target to reduce the number o
people without access to adequate
sanitation services to 1.7 billion people
by 2015.
Renewable energy can play a cost-eective
role in a strategy to eliminate energy poverty. The move towards a green economy aims to increaseaccess to services and inrastructure as a means o alleviating poverty and improving overall quality o lie,and addressing energy poverty is a very important part
o this transition. This includes providing energy to the
Source: WHO/UNICEF, 2010.43
38. NREGA – A Review o Decent Work and Green Jobs. ILO (2010).
39. 2010 Update: Progress on Sanitation and Drinking Water, WHO/UNICEF (2010), p. 7.40. Ibid, p. 22.
41. The State o the World’s Children 2005: Childhood under Threat. UNICEF (2006), p. II.42. Economic Impacts o Sanitation in Southeast Asia: A Four-Country Study Conducted in Cambodia, Indonesia, the Philippines and Vietnam under the Economics o Sanitation Initiative (ESI). World Bank-Water and
Sanitation Programme (2008), p. 32.43. WHO/UNICEF, Op. Cit., (2010), p. 8.
50
45
40
35
30
25
15
10
5
0
4645
4240 39 (2008)
36 (projected)
23 (target)
Population without improved sanitation
%
1 . 7
b i l l i o n
1
b i l l i o n
1990 1995 2000 2005 2010 2015
Towards a Green Economy

8/7/2019 Green Economy Report - Synthesis Report
http://slidepdf.com/reader/full/green-economy-report-synthesis-report 19/52
11 - 12
e c o
GRE E N
n om
y
K e y F i n d i n
g s
44. World Development Report 2010: Development and Climate Change. World Bank (2009), p. 192.
45. Solar Lighting or the Base o the Pyramid: Overview o an Emerging Market. International Finance Corporation and the World Bank (2010), pp. 46-47; bottom o the pyramid households are denedas those having an income less than US $3,000 per year.
46. Energy Poverty: How to Make Modern Energy Access Universal? OECD/IEA (September 2010), p. 7
47. Ibid.
48. Ibid.49. Making Tourism More Sustainable: A Guide or Policy Makers. UNEP and World Tourism Organization (2005), p. 12.
50. The Economics o Ecosystems and Biodiversity or National and International Policy Makers – Summary: Responding to the Value o Nature, TEEB (2009), p. 24.51. Guide or Social Dialogue in the Tourism Industry. Sectoral Activities Programme. Working Paper 265 prepared by Dain Bolwell and Wolgang Weinz, ILO (2008), p. 1.
52. Human Resources Development, Employment and Globalization in the Hotel, Catering and Tourism Sector. ILO (2001), p. 118.53. Ibid, p. 63.
1.6 billion people who currently lack electricity.44 In
Arica, or example, the 110 million households – at the
lowest income level –spend more than US$ 4 billion
a year on kerosene-based lighting, which is costly,
inecient and a saety and health hazard.45 In addition
to being unsustainable, the current energy system is
also highly inequitable, leaving 2.7 billion dependent
on traditional biomass or cooking.46 Moreover, indoor
air pollution rom using traditional biomass and coal
is projected to cause more than 1.5 million premature
deaths each year by 2030.47 Ensuring access to
electricity or all requires US$ 756 billion – or US$ 36
billion per year – between 2010 and 2030, according to
estimates by the IEA, UNDP and UNIDO.48 Renewable
energy technologies and supportive energy policies
promise to make a signicant contribution to
improving living standards and health in low-income
areas, particularly in o-grid situations. Cost eective
solutions include clean biomass and o-grid solar
photovoltaics, with low operating costs and fexible,
small-scale deployment options (see Box 2).
Box 2. Grameen Shakti Programme in BangladeshGrameen Shakti (or Grameen Energy in English) was ounded in 1996 and is currently one o the astest growing rural-
based companies in the eld o renewable energy in the world. Capitalizing on the microcredit network and expe-
rience o the Grameen Bank, Grameen Shakti provides sot credits through dierent nancial packages to make solar
home systems (SHSs) available and aordable to rural populations. By the end o 2009 more than 320,000 SHSs had
been installed, in addition to biogas plants and improved cooking stoves. The improved cooking stoves and biogas
programmes contribute to the reduction o the use o biomass and in turn decrease indoor pollution, while biogas
technology urther helps with sustainable waste management. Grameen Shakti aims to install over 1 million SHS
by 2015, while also providing the necessary maintenance, thereby generating local employment. Grameen Shakti
demonstrates the potential that can be mobilized to reduce energy poverty eciently with innovative nancing and
business models that can deliver success with little or no external nancial support.
Finally, tourism development when well
designed can support the local economy
and reduce poverty. While the growth o tourism
has been accompanied by signicant challenges
– or instance, in terms o GHG emissions, waterconsumption, discharge o untreated water, waste
generation, damage to local terrestrial and marine
biodiversity, and threats to the survival o local cultures
and traditions49 – tourists are driving the greening
o the sector, as seen by the 20% annual growth rate
enjoyed by ecotourism; about six times the industry-
wide rate o growth.50
Travel and tourism are human-resource intensive,
employing 230 million people or 8% o the global
workorce51 and it is estimated that one job in the
core tourism industry creates about one and a hal
additional or indirect jobs in the tourism-related
economy.52 The greening o the sector is expected to
reinorce the employment potential o the sector with
increased local hiring and sourcing. In greening thetourism sector, increasing the involvement o local
community, especially the poor, in the tourism value
chain is essential to developing the local economy and
reducing poverty.53
8/7/2019 Green Economy Report - Synthesis Report
http://slidepdf.com/reader/full/green-economy-report-synthesis-report 20/52
A Green Economy Creates Jobsand Enhances Social Equity
As the world economy altered into a recession in 2008,
tripped up by the banking and credit crisis and earlier
price shocks, concern over job losses ratcheted up. There was already research and evidence on hand o the
employment opportunities in greening the economy
(UNEP/ILO/IOE/ITUC joint report on green jobs54, the US
Blue-Green Alliance” o labour unions and environmental
organizations55) and the recession added urgency to
this exploration. Several countries responded with
employment-ocused plans or scal stimulus with
signicant “green” components, such as the China and
Republic o Korea. Countries moving towards a green
economy are already seeing signicant employment
creation with existing policies, and the potential could
be expanded with urther investments into green sectors.
Policies targeting small and medium size enterprises
(SMEs) hold particular promise, as they account or a large
share o employment and employment growth in most
countries.
A shit to a green economy also means a shit
in employment which, at a minimum, will
create as many jobs as business as usual. The
global modelling o the economy and the labour market
undertaken or this report nds no signicant dierences
in overall employment between business as usual and
a green investment scenario. This is in line with earlier
studies suggesting no net changes or modest overall
gains in employment. In the short and medium term,and in the absence o additional measures, the net direct
employment under green investment scenarios may
decline somewhat due to the need to reduce excessive
resource extraction in sectors such as sheries. But
between 2030 and 2050, these green investments would
create employment gains to catch up with and likely
exceed business as usual, in which employment growth
will be urther constrained by resource and energy
scarcity.
Overall, however, the employment gains under
green investment scenarios could be much
higher. National studies show that green investmentstend to be more employment intensive at least in the
short to medium term. The estimates o job creation atthe global level in the greening scenarios in the reportare conservative, because a number o eects thathave been shown to stimulate the creation o jobs ina transition to a green economy could only be partiallymodelled, i at all. These include: indirect and induced job
creation, and the choice o policy instruments, which cansignicantly impact employment outcomes (eco-taxes,which raise the price o emissions and natural resourceuse while reducing the cost o labour have shown positiveemployment impacts even in carbon intensive sectors).Furthermore, negative eedback on employment romprobable consequences o business as usual such asthe impacts o climate-related disasters on agricultureor coastal establishments has not been included in thebusiness as usual scenarios.
In green investment scenarios, agriculture,
buildings, orestry, and transport sectors would
see job growth in the short, medium, and longterm exceeding their comparable business
as usual scenarios. Over the next decade, globalemployment in agriculture could increase by as muchas 4%. Investing in orest conservation and reorestationcould boost ormal employment alone in this sector by20% by 2050. As ar as transport is concerned, improvingenergy eciency across all transport modes and shitingrom private transport to public or non-motorizedtransport would urther increase employment by about
10% above business as usual. Finally, investments inimproved energy eciency in buildings could generatean additional 2-3.5 million jobs in Europe and the United
States alone. I the demand or new buildings (socialhousing, hospitals, schools, etc.) that exists in developingcountries is considered, the potential is much higher.
Allocating a minimum o 1% o global GDP to
raise energy eciency and expand the use o
renewable energy will create additional jobs,
while delivering competitive energy (see Figure3). Employment in the renewable energy sector hasbecome quite substantial with more than 2.3 millionpeople worldwide estimated to be working either directly
or indirectly in the sector in 2006.56 A small group o countries currently account or the majority o these jobs,
especially Brazil, China, Germany, Japan and the UnitedStates.57 There is considerable potential or urther growth
54. Green Jobs: Towards Decent Work in a Sustainable, Low-carbon World. UNEP/ILO/IOE/ITUC (September 2008).55. See: http://www.bluegreenalliance.org
56. UNEP/ILO/IOE/ITUC, Op. Cit. (September 2008), pp. 6-7.57. Ibid., p. 6.
Towards a Green Economy

8/7/2019 Green Economy Report - Synthesis Report
http://slidepdf.com/reader/full/green-economy-report-synthesis-report 21/52
13 - 14
e c o
GRE E N
n om
y
K e y F i n d i n
g s
58. Ibid., p. 18.59. Ibid, Op. Cit., (September 2008), p. 215.
in this sector as well as rom investments in energy
eciency, particularly i driven by supportive policies.
In the modelling or the GER, almost hal o the total
investments were directed towards energy eciency
and renewable energy (including the expansion o
second generation biouels), resulting in employment
that is 20% higher than business as usual by 2050,
while delivering robust economic growth and reduced
emissions.
Coal production
Oil production
Gas productionBiofuel
Thermal power
RE power
Energy eciency
1990 2000 2010 2020 2030 2040 2050
25
20
15
10
5
0
M i l l i o n p e r s o n s
Figure 3. Total employment in the energy sector and its disaggregation into
uel and power, and energy eciency under a 2% green investment scenario.
Note: Roughly hal o the investment is allocated to renewable energy and energy eciency. See Annex I or absolute values.
Jobs in waste management and recycling
will grow to handle increased waste
resulting rom population and incomegrowth, although challenges in terms o
decent work in this sector are considerable.Recycling in all its orms already employs 12 million
people in three countries alone (Brazil, China and the
United States).58 Sorting and processing recyclables
sustains 10 times more jobs than land lling or
incineration on a per metric tonne basis59. In green
investment scenarios, projected growth in jobs in the
waste sector rises by 10% compared to current trends.
However, even more important than the additional
employment potential in waste management, reuse
and recycling is the opportunity and, in act, the need
to upgrade jobs in the sector. To be truly green jobsthey also need to match the requirements o decent
work, including such aspects as a living wage, the
elimination o child labour, occupational health and
saety, social protection, and reedom o association.
Upgrading is thus desirable and necessary or social
and environmental reasons.
Employment rom greening the water
and sheries sectors would see temporal
adjustment necessitated by the need or
resource conservation. In the case o water, thanks to
eciency improvements and the consequent reduction
in total water consumption, jobs would be 20-25%
lower than projected growth under current excessive
water consumption trends in 2050 (although higher
than current level). These projections do not capture
new job opportunities in water eciency inrastructure,
such as water metering, and the projection o currenttrends is optimistic as excess water withdrawals would
lead to supply problems and job declines. In the case
o sheries, greening the sector would lead to a loss
8/7/2019 Green Economy Report - Synthesis Report
http://slidepdf.com/reader/full/green-economy-report-synthesis-report 22/52
60. Recommendations on Future Financing Options or Enhancing the Development, Deployment, Diusion and Transer o Technologies under the Convention. UNFCCC (2009), p. 33.61. Meeting Trade and Development Challenges in an Era o High and Volatile Energy Prices: Oil and Gas in LDCs and Arican Countries. UNCTAD (2006), p. 4.
62. Policy Brie: Achieving Energy Security in Developing Countries. GNESD (2010), p. 4.63. Global Trends in Sustainable Energy Investment 2010: Analysis o Trends and Issues in the Financing o Renewable Energy and Energy Efciency. UNEP/SEFI (Paris, 2010), p. 13.
64. Ibid., p. 5.
65. Ibid., p. 45.
o jobs in the short and medium term due to the need toreduce shing eort, but this can be done equitably by
ocusing job cuts on a small number o large-scale shers.Additionally, a substantial number o jobs would grow back by 2050 as sh stocks are recovered. During the downwardadjustments in the labour market, however, eective
policies and measures need to be designed in dialogueswith workers, employers, and communities to ensure a“just transition” – an issue discussed in more detail in the
“enabling conditions” section.
A Green Economy SubstitutesRenewable Energy and Low-carbonTechnologies for Fossil Fuels
Increasing energy supply rom renewable sources reduces
the risks rom rising and volatile prices or ossil uels in
addition to delivering mitigation benets. The currentossil uel-based energy system is at the root o climate
change. The energy sector is responsible or two-thirds o GHG emissions, and the costs o climate change in termso adaptation are estimated to reach US$ 50-170 billionby 2030, hal o which could be borne by developing
countries.60 Many o these countries, as net oil importers,are also challenged by rising and volatile prices or ossil
uels. For example, oil accounts or 10-15% o total importsor oil-importing Arican countries and absorbs over30% o their export revenue on average.61 Some Arican
countries, including Kenya and Senegal, devote morethan hal o their export earnings to energy imports, whileIndia spends 45%. Investing in renewable sources that
are available locally – in many cases abundantly – couldsignicantly enhance energy security – and by extension,economic and nancial security.62
Renewable energy presents major economic
opportunities. The greening o the energy sectorrequires substituting investments in carbon-intensiveenergy sources with investments in clean energy as well
as eciency improvements. Many opportunities orimproving energy eciency pay or themselves, whileinvestments in renewable energy technologies arealready growing in today’s market as they are becoming
increasingly competitive. From 2002 until mid-2009,
total investments into renewable energies exhibited
a compound annual growth rate o 33%.63 Despite theglobal recession, this sector is booming. For 2010, newinvestment in clean energy was expected to reach arecord high o US$ 180-200 billion, up rom US$ 162billion in 2009 and US$ 173 billion in 2008 (see Figure 4).64
The growth is increasingly driven by non-OECD countries,
whose share o global investment in renewables roserom 29% in 2007 to 40% in 2008, with Brazil, China, andIndia accounting or most o it.65 Renewable technologiesare even more competitive when the societal costs o ossil uel technologies, which are in part being delayeduntil the uture, are taken into account. In this regard, thesuccessul conclusion o a global agreement on carbonemissions and the resulting assurance that there will bea uture carbon market and pricing is strong incentive or
urther business investment in renewable energy.
0
50
100
150
200
200920082007200620052004
46
72
109
157
173
162
56% 52% 44% 10% -7%
U S D b
i l l i o n
Growth:
Figure 4. Investment in sustainable
energy, 2004-2009 (US$ billion).
Source: UNEP and Bloomberg New Energy Finance, 2010.
Towards a Green Economy

8/7/2019 Green Economy Report - Synthesis Report
http://slidepdf.com/reader/full/green-economy-report-synthesis-report 23/52
15 - 16
e c o
GRE E N
n om
y
K e y F i n d i n
g s
66. World Energy Outlook 2009: Executive Summary. International Energy Agency (2009), p. 5.67. Renewables 2010 Global Status Report. REN21 (2010), pp. 38-9.
68. Barbier, E. Scarcity & Frontiers: How Economies have Developed through Natural Resource Exploitation, Cambridge University Press (2010), p. 34.
69. Decoupling the Use o Natural Resources and Environmental Impacts rom Economic Activity: Scoping the Challenges. The International Resource Panel, UNEP (2011).
Government policy has an essential role to
play in enhancing incentives or investing
in renewable energy. Time-bound incentives,
notably eed-in taris, direct subsidies and tax credits
can make the risk/revenue prole o renewable energy
investments more attractive (see Box 3). Such incentivescan be enhanced with emissions trading schemes or
taxes that help capture the ull social costs o ossil uel
use. Various studies rom the IEA demonstrate how a
concerted package o policy-driven investments, in
the general range o 1-2% o global GDP, can shit the
global economy to a low-carbon growth path.66 To put
this gure in perspective, this additional investment is
comparable to the level o ossil uel subsidies, which
in 2008 was roughly equivalent to 1% o GDP. The
results o these studies are reinorced by modelling or
the GER, which nds that substituting investments in
carbon-intensive energy sources with investments in
clean energy would almost triple the penetration rate
o renewables in power generation rom 16% to 45%
by 2050. For the entire energy mix, renewables could
double to provide more than 25% o total supply.
Box 3. Feed-in Taris: An Example rom Kenya
Feed-in taris, much like preerential pricing, guarantee payment o a xed amount per unit o electricity produced
rom renewable sources, or a premium on top o market electricity prices. Feed-in taris have been implemented in
more than 30 developed countries and in 17 developing countries.67 Kenya, or example, introduced a eed-in tari on
electricity rom wind, biomass and small hydropower in 2008, and extended the policy in 2010 to include geothermal,
biogas and solar energy resource-generated electricity. This could stimulate an estimated 1300 MW o electricity
generation capacity in the coming years or nearly double installed capacity. As with any kind o positive support,
the design o eed-in taris is crucial or determining their success, depending on issues such as time periods or
support, graduated tari decreases over time, minimum or maximum capacity limits.
A Green Economy PromotesEnhanced Resource and Energy Efciency
The cost o using natural resources inecientlyhas generally not been a critical limiting actor orhuman civilization historically because an exploitative“rontier” mentality in a largely unpopulated worldallowed or the discovery o new resources.68 The habito stewardship has been hard to orm, and harder still toreconcile with prevailing business models. Thereore,in this sub-section, we explore the issue o resourcescarcities and externalized costs as constraints whichneed to be managed protably and or the benet o society as a whole. That takes us to the complex andvast arena o resource eciency and its economicbenets. Much o what we describe here relates to
resource eciency in production, however, we also
explore sustainable consumption as the demand sideo the equation, especially in so ar as it relates to ood.
A key concept or raming the challenges we ace in
making the transition to a more resource ecient
economy is decoupling. As global economic growth
bumps into planetary boundaries, decoupling the
creation o economic value rom natural resource use
and environmental impacts becomes more urgent.69
Recent trends indicate a moderate tendency o relativedecoupling over time as a response to scarcity and
rising input prices (see Figure 5). The central challenge,
however, as we transition to a resource and carbon-
constrained world, is to decouple growth absolutely
rom material and energy intensity. To do so, this
section looks at scope or eciency gains in the most
material parts o the economy.
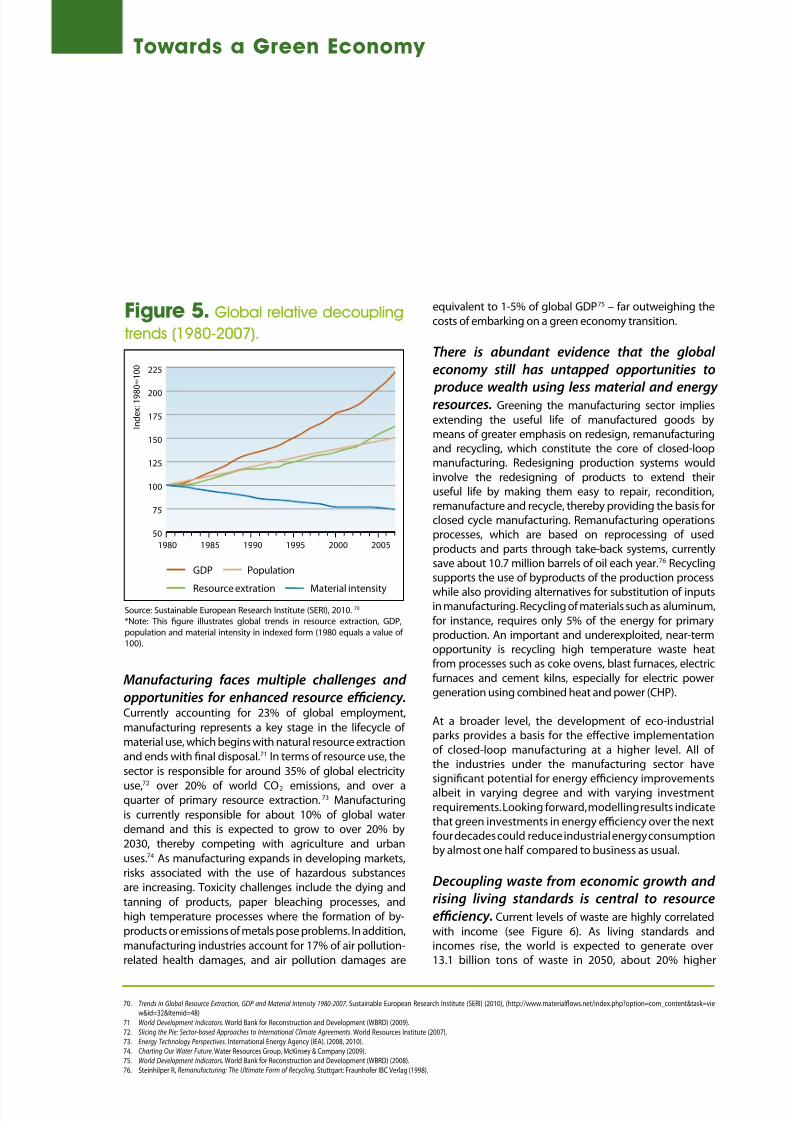
8/7/2019 Green Economy Report - Synthesis Report
http://slidepdf.com/reader/full/green-economy-report-synthesis-report 24/52
70. Trends in Global Resource Extraction, GDP and Material Intensity 1980-2007. Sustainable European Research Institute (SERI) (2010), (http://www.materialfows.net/index.php?option=com_content&task=view&id=32&Itemid=48)
71. World Development Indicators. World Bank or Reconstruction and Development (WBRD) (2009).
72. Slicing the Pie: Sector-based Approaches to International Climate Agreements. World Resources Institute (2007).73. Energy Technology Perspectives. International Energy Agency (IEA). (2008, 2010).
74. Charting Our Water Future. Water Resources Group, McKinsey & Company (2009).75. World Development Indicators. World Bank or Reconstruction and Development (WBRD) (2008).
76. Steinhilper R, Remanuacturing: The Ultimate Form o Recycling. Stuttgart: Fraunhoer IBC Verlag (1998).
1980 1985 1990 1995 2000 2005
225
200
175
150
125
100
75
50
I n d e x : 1 9 8
0 = 1 0 0
GDP
Resource extration
Population
Material intensity
Figure 5. Global relative decoupling
trends (1980-2007).
Source: Sustainable European Research Institute (SERI), 2010. 70 *Note: This gure illustrates global trends in resource extraction, GDP,
population and material intensity in indexed orm (1980 equals a value o 100).
Manuacturing aces multiple challenges and
opportunities or enhanced resource eciency. Currently accounting or 23% o global employment,
manuacturing represents a key stage in the liecycle o
material use, which begins with natural resource extraction
and ends with nal disposal.71 In terms o resource use, the
sector is responsible or around 35% o global electricity
use,72 over 20% o world CO2 emissions, and over aquarter o primary resource extraction.73 Manuacturing
is currently responsible or about 10% o global water
demand and this is expected to grow to over 20% by
2030, thereby competing with agriculture and urban
uses.74 As manuacturing expands in developing markets,
risks associated with the use o hazardous substances
are increasing. Toxicity challenges include the dying and
tanning o products, paper bleaching processes, and
high temperature processes where the ormation o by-
products or emissions o metals pose problems. In addition,
manuacturing industries account or 17% o air pollution-
related health damages, and air pollution damages are
equivalent to 1-5% o global GDP75 – ar outweighing the
costs o embarking on a green economy transition.
There is abundant evidence that the global
economy still has untapped opportunities to
produce wealth using less material and energy resources. Greening the manuacturing sector implies
extending the useul lie o manuactured goods bymeans o greater emphasis on redesign, remanuacturingand recycling, which constitute the core o closed-loopmanuacturing. Redesigning production systems would
involve the redesigning o products to extend theiruseul lie by making them easy to repair, recondition,remanuacture and recycle, thereby providing the basis orclosed cycle manuacturing. Remanuacturing operationsprocesses, which are based on reprocessing o used
products and parts through take-back systems, currentlysave about 10.7 million barrels o oil each year.76 Recyclingsupports the use o byproducts o the production process
while also providing alternatives or substitution o inputsin manuacturing. Recycling o materials such as aluminum,
or instance, requires only 5% o the energy or primaryproduction. An important and underexploited, near-termopportunity is recycling high temperature waste heatrom processes such as coke ovens, blast urnaces, electric
urnaces and cement kilns, especially or electric powergeneration using combined heat and power (CHP).
At a broader level, the development o eco-industrialparks provides a basis or the eective implementation
o closed-loop manuacturing at a higher level. All o the industries under the manuacturing sector havesignicant potential or energy eciency improvementsalbeit in varying degree and with varying investment
requirements. Looking orward, modelling results indicatethat green investments in energy eciency over the nextour decades could reduce industrial energy consumptionby almost one hal compared to business as usual.
Decoupling waste rom economic growth and
rising living standards is central to resource
eciency. Current levels o waste are highly correlated
with income (see Figure 6). As living standards andincomes rise, the world is expected to generate over13.1 billion tons o waste in 2050, about 20% higher
Towards a Green Economy
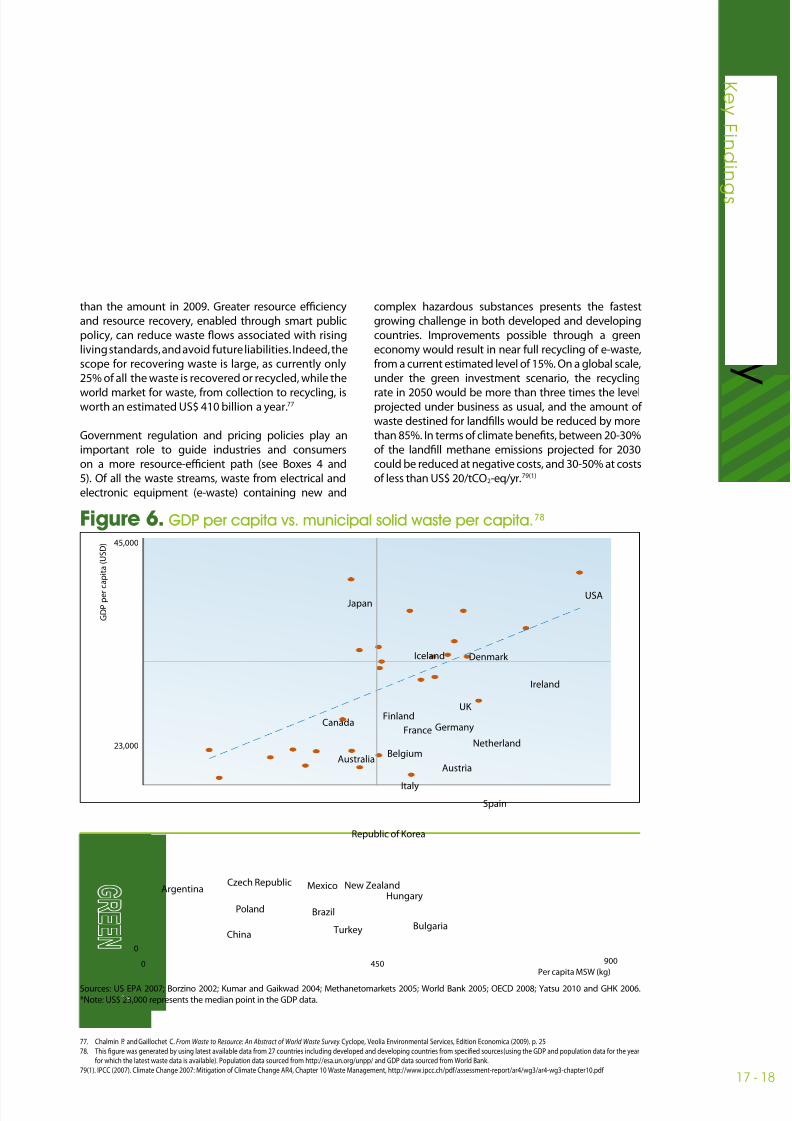
8/7/2019 Green Economy Report - Synthesis Report
http://slidepdf.com/reader/full/green-economy-report-synthesis-report 25/52
17 - 18
e c o
GRE E N
n om
y
K e y F i n d i n
g s
77. Chalmin P. and Gaillochet C. From Waste to Resource: An Abstract o World Waste Survey. Cyclope, Veolia Environmental Services, Edition Economica (2009). p. 25
78. This gure was generated by using latest available data rom 27 countries including developed and developing countries rom specied sources (using the GDP and population data or the yearor which the latest waste data is available). Population data sourced rom http://esa.un.org/unpp/ and GDP data sourced rom World Bank.
79(1). IPCC (2007). Climate Change 2007: Mitigation o Climate Change AR4, Chapter 10 Waste Management, http://www.ipcc.ch/pd/assessment-report/ar4/wg3/ar4-wg3-chapter10.pd
than the amount in 2009. Greater resource eciencyand resource recovery, enabled through smart publicpolicy, can reduce waste fows associated with risingliving standards, and avoid uture liabilities. Indeed, thescope or recovering waste is large, as currently only25% o all the waste is recovered or recycled, while the
world market or waste, rom collection to recycling, isworth an estimated US$ 410 billion a year.77
Government regulation and pricing policies play animportant role to guide industries and consumerson a more resource-ecient path (see Boxes 4 and5). O all the waste streams, waste rom electrical andelectronic equipment (e-waste) containing new and
complex hazardous substances presents the astestgrowing challenge in both developed and developingcountries. Improvements possible through a greeneconomy would result in near ull recycling o e-waste,rom a current estimated level o 15%. On a global scale,under the green investment scenario, the recycling
rate in 2050 would be more than three times the levelprojected under business as usual, and the amount o waste destined or landlls would be reduced by morethan 85%. In terms o climate benets, between 20-30%o the landll methane emissions projected or 2030could be reduced at negative costs, and 30-50% at costso less than US$ 20/tCO2-eq/yr.79(1)
JapanUSA
Iceland Denmark
Ireland
UK Finland
Canada
Italy
AustraliaAustria
Netherland
Spain
Republic of Korea
Hungary
Bulgaria Turkey
Brazil
Czech Republic Mexico New Zealand
Poland
France
Belgium
China
Argentina
Germany
45,000
23,000
0
0 450 900
G D P p e r c a p i t a ( U S D )
Per capita MSW (kg)
Figure 6. GDP per capita vs. municipal solid waste per capita.78
Sources: US EPA 2007; Borzino 2002; Kumar and Gaikwad 2004; Methanetomarkets 2005; World Bank 2005; OECD 2008; Yatsu 2010 and GHK 2006.
*Note: US$ 23,000 represents the median point in the GDP data.
8/7/2019 Green Economy Report - Synthesis Report
http://slidepdf.com/reader/full/green-economy-report-synthesis-report 26/52
79(2). Ministry o Environment, Republic o Korea, http://eng.me.go.kr/content.do?method=moveContent&menuCode=pol_rec_pol_rec_sys_responsibility
80. Nahma, Anton. Food Packaging in South Arica: Reducing, Re-using and Recycling. Government Digest (February 2010); Hasson, R., Leiman, A. and Visser. M. T he Economics o Plastic Bag Legislation in South
Arica. South Arican Journal o Economics (2007), Volume 75, Issue 1, pp. 66-83.
81. Green Jobs: Towards Decent Work in a Sustainable, Low-Carbon World, UNEP (2008), p. 214.82. Nascimento, Luis Felipe, Marcelo Trevisan, Paola Schmitt Figueiró, and Marilia Bonzanini Bossle. PET Bottle Recycling Chain: Opportunities or the Generation o Employment and Income. Greener Management
International Issue, 56, No. 56 (2010), p. 44.83. Oliveira, L., and L. Rosa. Brazilian Waste Potential: Energy, Environmental, Social and Economic Benets. Energy Policy 31, No. 14 (November, 2003), 1481-1491, p. 1486.
84. Ibid., p. 1490.85. National Solid Waste Policy – Now it’s the Law. Compromisso Empresarial para Reciclagem (CEMPRE) (2010).
86. Oliveira, L, and L Rosa. Brazilian Waste Potential: Energy, Environmental, Social and Economic Benets. Energy Policy 31, No. 14 (November 2003): 1481-1491, p. 1490.
87. Green Jobs: Towards Decent Work in a Sustainable, Low-Carbon World, UNEP (2008), p. 1788. Ibid. p. 215
89. Samson, Melanie. “Formal Integration into Municipal Waste Management Systems.” In Reusing to be Cast Aside: Waste Pickers Organising around the World. Cambridge, USA: Women in Inormal Employment:Globalizing and Organizing (WIEGO) (2009), p. 52.
90. Argus Research Company, Independent International Investment Research Plc and Pipal Research Group 2010.91. Nakamura T. Waste Agriculture Biomass Convention, IETC, The 6th Biomass Asia Workshop in Hiroshima, 18-20 November 2009, http://www.biomass-asia-workshop.jp/biomassws/06workshop/
presentation/25_Nakamura.pd
Box 4. Resource Eciency and Waste: Examples o Regulation andPricing Policies
In the Republic o Korea, a policy o Extended Producer Responsibility (EPR) has been enorced on packaging (paper,
glass, iron, aluminum and plastic) and specic products (battery, tire, lubricating oil and fuorescent lamp) since 2003. This
initiative resulted in recycling o 6 million metric tonnes o waste between 2003 and 2007, increasing the recycling rate by14% and creating an economic benet equivalent to US$ 1.6 billion.79(2)
In 2003, South Arica introduced a plastic bag levy to reduce unwanted litter. By 2009, in his budget review, the nance
minister announced an increase in the levy on plastic bags and the introduction o a levy on incandescent light bulbs at the
manuacturing level and on imports. The plastic bag levy was expected to generate US$ 2.2 million in budget revenue while
the incandescent light bulb levy was expected to generate an additional US$ 3 million. The South Arican policy is seen to
have inspired other countries such as Botswana to adopt similar regulations.80
Box 5. Recycling and Waste: An Example rom Brazil
Brazil has a tradition o recycling with recovery levels or many materials matching or exceeding those in industrialized
countries. Some 95% o all aluminum cans81
and 55% o all polyethylene bottles are recycled.82
About hal o all paper andglass is recovered. Recycling in Brazil generates a value o almost US$ 2 billion83 and avoids 10 million tons o greenhouse
gas emissions.84 In spite o this achievement recyclable material worth about US$ 5 billion goes to landll.85 Full recycling
would be worth 0.3% o GDP.86
Waste management and recycling employ well over 500,000 people in Brazil, mostly as individual waste pickers in inormal
jobs with low and very unstable incomes and poor working conditions.87 At the initiative o local governments, some 60,000
recycling workers have been organized into cooperatives or associations and work in ormal employment and service
contracts.88 Their income is more than two times higher than that o individual waste pickers, liting amilies out o poverty.89
The National Solid Waste Policy (PNRS) – established by law on 2 August 2010 – aims to build on this potential. It provides
or the collection, nal disposal and treatment o urban, hazardous and industrial waste in Brazil. The PNRS is the result
o a broad consensus based on social dialogue involving the government, the production sector, stakeholders in waste
management and academia.
Recycling and energy recovery rom waste
are becoming more protable and should
continue to do so as waste materials become
more valuable resources. Waste can be turned into
marketable products, as in the case o the waste-to-
energy (WtE) market, which was already estimated at US$
20 billion in 2008 and is projected to grow by 30% already
by 2014.90 Agricultural residue generated primarily in rural
areas amount to 140 billion metric tonnes globally and
have an energy potential equivalent to 50 billion metric
tonnes o oil.91 In a green economy scenario, by 2050 all
Towards a Green Economy

8/7/2019 Green Economy Report - Synthesis Report
http://slidepdf.com/reader/full/green-economy-report-synthesis-report 27/52
19 - 20
e c o
GRE E N
n om
y
K e y F i n d i n
g s
92. Adapted rom Chalmin P. and Gaillochet C. From Waste to Resource: An Abstract o World Waste Survey, Cyclope, Veolia Environmental Services, Edition Economica (2009).93. The Environmental Food Crisis. UNEP (2009), http://www.grida.no/_res/site/le/publications/FoodCrisis_lores.pd
94. Lundqvist, J., C. de Fraiture and D. Molden. Saving Water: From Field to Fork – Curbing Losses and Wastage in the Food Chain. SIWI Policy Brie. Stockholm International Water Institute (2008).95. The Environmental Food Crisis. UNEP (2009), http://www.grida.no/_res/site/le/publi cations/FoodCrisis_lores.pd, p. 30, based on: Lundqvist et al., Saving Water: From Field to Fork, (2008), p. 5.
Godray et al., Food Security: The Challenge o Feeding 9 Billion People (2010), Science, Vol. 327, No. 5967, pp. 812-818, based on: Cabinet Oce, Food Matters: Towards a Strategy or the 21st Century
(Cabinet Oce Strategy Unit, London, 2008); Waste and Resources Action Programme (WRAP), The Food We Waste (WRAP, Banbury, UK, 2008); T. Stuart, Uncovering the Global Food Scandal
(Penguin, London, 2009).
biomass waste would be composted or recovered or
energy.
Reducing waste and increasing eciency in
agricultural and ood systems can contribute
to securing global ood security now and in the uture. There is more than enough ood
produced to eed a healthy global population, but ood
losses translate the current production o 4,600 kcal
per person per day into the availability o 2,000 kcal
per person per day or consumption.92 In the United
States, or example, 40% o ood worth US$ 48.3 billion
is wasted every year, together with embedded 350
million barrels o oil and 40 trillion litres o water per
year.93 Low-income countries tend to suer signicant
losses rom a lack o storage acilities, on-arm pest
inestations, poor ood handling and inadequatetransportation inrastructure (see Figure 7).
An important and underemphasized strategy toconront the challenge o eeding a growing world
population without increasing the environmentalburden o production is reducing ood waste.
Researchers estimate that with the magnitude o
losses and the potential gains, a reduction by 50% o
losses and wastage in the entire ood chain – including
agricultural and post-harvest practices – is realistic.94
0
1 000
Field Household
2 000
3 000
4 000
Edible cropharvest
4600 kcal
Afterharvest
4000 kcal
Meatand dairy2800 kcal
Harvestlosses
Animalfeed Food
consumed2000 kcal
Distributionlosses and
waste
k c a l / c a p i t a / d a y
Figure 7. The make-up o total ood waste.95
*Note: Retail, ood service and home and municipal are aggregated or LICs.
0 20 40 60 80 100
Home & municipalFood service
Retail Transport & processingOn-farm
UK
USA
G77
%
8/7/2019 Green Economy Report - Synthesis Report
http://slidepdf.com/reader/full/green-economy-report-synthesis-report 28/52
A Green Economy Delivers MoreSustainable Urban Living andLow-carbon Mobility
Today’s urban areas are home to 50% o the world’spopulation96but account or 60-80% o energy consumption
and 75% o carbon emissions.97 Rapid urbanization is
exerting pressure on resh water supply, sewage systems
and public health, and oten results in poor inrastructuredelivery, declining environmental perormance and
signicant costs to public health. Against this backdrop,
unique opportunities exist or cities to increase energyeciency and productivity, reduce emissions in buildings
as well as waste, and promote access to key services
through innovative, low-carbon transportation modalities
– saving money while enhancing productivity and socialinclusion.
Promoting green cities raises eciency and
productivity. Eco-cities or green cities are typically
characterized by higher density o population, housing,employment, commerce, and entertainment acilities,
subject to thresholds to avoid congestion. Well connected
and designed neighbourhoods o 100 to 1,000 personsper hectare (up to 3,000, depending on culture and
geography) allow or eective provision o public
transport and are seen as a starting point or green cities.98 Doubling the employment density o an urban area – and
respecting decent work conditions – typically raises labour
productivity by around 6%.99 Inrastructure, includingstreets, railways, water and sewage systems as well as other
utilities comes at a considerably lower cost per person the
higher the urban density. A recent study o Tianjin in Chinaconcluded that inrastructure cost savings as a result o compact and densely clustered urban development reach
55% compared to a dispersed scenario.100 As such, there are
signicant opportunities to capture the potential synergiesand eciencies by integrating sustainability considerations
in urban planning processes. Such processes should
consider social coherence and urban health issues, whichmost oten are best addressed in the context o green
communities/neighbourhoods. To enable cities to capture
the green economy potential, it is also important that
they are assigned responsibility and develop capacity
as implementing agents or national legislation at local
levels, with the mandate to enorce stricter conditions than
required at national levels i needed.
Cities will see a rapid expansion and increasing investment
over the next decades, particularly in emergingeconomies. For example, India’s urban population grew
rom 290 million in 2001 to 340 million in 2008 and it
is projected to reach 590 million in 2030.101 As a result,
India will have to build 700-900 million square metres o
residential and commercial space a year to accommodate
this growth, requiring an investment US$1.2 trillion to
build 350-400 kilometres o subway and up to 25,000
kilometres o new roads per year. Similarly, China’s urban
population is expected to increase rom 636 million in
2010 to 905 million by 2030.102 It is predicted that by 2050
the country will need to invest 800-900 billion RMB per
year to improve its urban inrastructure, about one-tenth
o China’s total GDP in 2001.103 How this investment takes
place – in transportation networks, access to services,
buildings, water and energy systems – will make a
crucial dierence in avoiding or “locking in” high-carbon
inrastructure or the next generation.
As part o the eort to green cities, the impact o buildings
is key. The building sector is the single largest contributor
to global greenhouse gas emissions (8.6 billion tons
CO2 eqv.), mostly explained by the act that one-third o
global energy end use takes place within buildings.104 The
potential or signicant low-cost emission reductions with
existing technologies has been conrmed or this sector,
as was also refected in the IPCC AR4 report (see Figure
8). Further, the construction sector is responsible or morethan a third o global material resource consumption,
including 12% o all resh water use, and signicantly
contributes to the generation o solid waste (estimated at
40%). The IPCC high-growth scenario projects the climate
oot print o the buildings sector to almost double to 15.6
billion tones CO2 eqv by 2030 (approximately 30% o total
energy related CO2).105
96. Kamal-Chaoui, L. and Robert, A. Competitive Cities and Climate Change. OECD Regional Development Working Papers 2009/2. OECD, Public Governance and Territorial Development Directorate.
97. World Urbanisation Prospects: The 2005 Revision. Executive Summary, Fact Sheets, Data Tables. UN Department o Economic and Social Aairs, UN Population Division (2006).
98. Hasan, A., Sadiq, A. and Ahmed, S. Planning or High Density in Low-income Settlements: Four Case Studies rom Karachi. Human Settlements Working Paper Series. Urbanization and Emerging PopulationIssues 3. IIED and UNFPA (2010), p. 7.
99. Melo, P., Graham, D. and Noland, R.B. A Meta-Analysis o Estimates o Urban Agglomeration Economies. Regional Science and Urban Economics (2009), 39:3, pp. 332-342.100. Webster, D., Bertaud, A., Jianming, C. and Zhenshan, Y.Toward Efcient Urban Form in China . Working Paper No. 2010/97. World Institute or Development Economics Research (WIDER). UNU-WIDER (2010), p. 12.
101. India’s Urban Awakening: Building Inclusive Cities, Sustaining Economic Growth. McKinsey Global Institute (2010).102. World Urbanisation Prospects: The 2009 Revision. UN Population Division, UN Department o Economic and Social Aairs (2010).
103. Chen, H., Jia, B. and Lau, S.S.Y. Sustainable Urban Form or Chinese Compact Cities: Challenges o a Rapid Urbanized Economy. Habitat International (2008), 32, 1, pp. 28-40.104. Sustainable Building Construction Initiative. UNEP (2009), http://www.unep.org/sbci/pds/UNEPSBCI-GlobalCompactBrochure-Final.pd [accessed 11 January 2011], p. 1.
105. IPCC (2007). Climate change 2007: Mitigation o climate change. Contribution o Working Group III to the Fourth Assessment Report o the Intergovernmental Panel on Climate Change. Cambridge University Press,
Cambridge; New York.
Towards a Green Economy
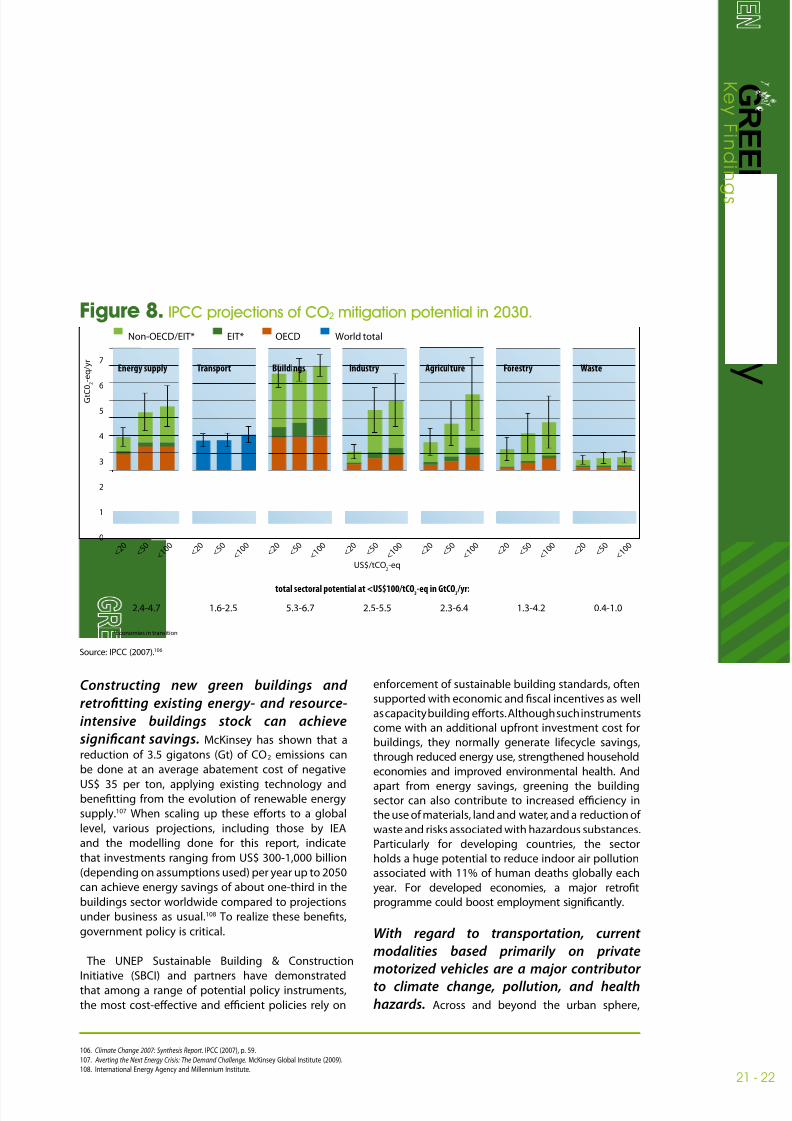
8/7/2019 Green Economy Report - Synthesis Report
http://slidepdf.com/reader/full/green-economy-report-synthesis-report 29/52
21 - 22
e c o
GRE E N
n om
y
K e y F i n d i n
g s
Source: IPCC (2007).106
G t C
0 2 - e q / y r 7
6
5
4
3
2
1
0
< 2 0
< 5 0
< 1 0
0 < 2 0
< 5 0
< 1 0
0 < 2 0
< 5 0
< 1 0
0 < 2 0
< 5 0
< 1 0
0 < 2 0
< 5 0
< 1 0
0 < 2 0
< 5 0
< 1 0
0 < 2 0
< 5 0
< 1 0
0
Energy supply Transport Buildings Industry Agriculture Forestry Waste
2.4-4.7 1.6-2.5 5.3-6.7 2.5-5.5 2.3-6.4 1.3-4.2 0.4-1.0
Non-OECD/EIT* EIT* OECD World total
total sectoral potential at <US$100/tCO2-eq in GtCO2 /yr:
US$/tCO2-eq
*Economies in transition
Figure 8. IPCC projections o CO2 mitigation potential in 2030.
106. Climate Change 2007: Synthesis Report. IPCC (2007), p. 59.
107. Averting the Next Energy Crisis: The Demand Challenge. McKinsey Global Institute (2009).108. International Energy Agency and Millennium Institute.
Constructing new green buildings and
retrotting existing energy- and resource-
intensive buildings stock can achieve
signicant savings. McKinsey has shown that a
reduction o 3.5 gigatons (Gt) o CO2 emissions can
be done at an average abatement cost o negative
US$ 35 per ton, applying existing technology andbenetting rom the evolution o renewable energy
supply.107 When scaling up these eorts to a global
level, various projections, including those by IEA
and the modelling done or this report, indicate
that investments ranging rom US$ 300-1,000 billion
(depending on assumptions used) per year up to 2050
can achieve energy savings o about one-third in the
buildings sector worldwide compared to projections
under business as usual.108 To realize these benets,
government policy is critical.
The UNEP Sustainable Building & Construction
Initiative (SBCI) and partners have demonstrated
that among a range o potential policy instruments,
the most cost-eective and ecient policies rely on
enorcement o sustainable building standards, oten
supported with economic and scal incentives as well
as capacity building eorts. Although such instruments
come with an additional upront investment cost or
buildings, they normally generate liecycle savings,
through reduced energy use, strengthened household
economies and improved environmental health. And
apart rom energy savings, greening the buildingsector can also contribute to increased eciency in
the use o materials, land and water, and a reduction o
waste and risks associated with hazardous substances.
Particularly or developing countries, the sector
holds a huge potential to reduce indoor air pollution
associated with 11% o human deaths globally each
year. For developed economies, a major retrot
programme could boost employment signicantly.
With regard to transportation, current
modalities based primarily on private
motorized vehicles are a major contributor
to climate change, pollution, and healthhazards. Across and beyond the urban sphere,
8/7/2019 Green Economy Report - Synthesis Report
http://slidepdf.com/reader/full/green-economy-report-synthesis-report 30/52
transport accounts or more than hal o the world’s
consumption o liquid ossil uels and nearly a quarter o
the global energy-related CO2 emissions. Studies indicate
that the environmental and social costs, in terms o local
air pollutants, trac accidents and congestion, can add
up to nearly or over 10% o a region or country’s GDP 109–
well beyond the amounts needed to jump start a greeneconomy transition. Policies or greening transport ollow
three interlinked principles: 1) avoiding or reducing
trips through integration o land use and transportation
planning, and localized production and consumption; 2)
shiting to more environmentally ecient modes such as
public and non-motorized transport or passengers and
to rail and water transport or reight; and 3) improving
vehicle and uel technology to reduce the negative
social and environmental eects rom each kilometre
travelled. Policies required include land-use planning to
promote compact or mass transit corridor-based cities,
the regulation o uel and vehicles, and the provision o inormation to aid decisions by consumers and industry.
Strong economic incentives such as taxes, charges and
subsidy reorm can also support an increase in cleaner
private vehicles as well as a shit to public and non-
motorized transport (see Box 6).
109. Creutzig F & He D. Climate Change Mitigation and Co-benets o Feasible Transport Demand Policies in Beijing. Transportation Research Part D: Transport and Environment. Volume 14, Issue 2 (March 2009),
pp. 120-131.110. Congestion Charging Central London: Impacts Monitoring. Second Annual Report. Transport or London (2004).
111. Beevers, S. and Carslaw, D. The Impact o Congestion Charging on Vehicle Emissions in London. Atmospheric Environment, 39 (2005), pp. 1-5.112. Goh, M. Congestion Management and Electronic Road Pricing in Singapore. Journal o Transport Geography, 10: 1 (2002), pp. 29-38.
113. Rogat, J., Hinostroza, M. and Ernest, K. Promoting Sustainable Transport in Latin America through Mass Transit Technologies. Colloque international Environnement et transports dans des contextes diérents,
Ghardaïa, Algerie, 16-18 February 2009. Actes, ENP ed., Alger, p. 83-92.114. EcoPlan (2000). The Famous Zurich U-Bahn. [online] (Updated 20 March 2000), http://www.ecoplan.org/politics/general/zurich.htm [accessed 10 December 2010].
115. Nobis, C. Car Sharing as Key Contribution to Multimodal and Sustainable Mobility Behavior: Carsharing in Germany. Transportation Research Record: Journal o the Transportation Research Board, 1986 (2006),pp. 89-97.
116. Geroliminis, N. and Daganzo, C. F. A Review o Green Logistics Schemes Used in Cities Around the World. UC Berkeley Center or Future Urban Transport: A Volvo Center o Excellence. Institute o TransportationStudies, UC Berkeley (2005).
117. Sub-Saharan Arica Renery Project – Final Report. ICF International (2009), http://www.unep.org/pcv/PDF/Final_Executive_Summary_6-08-09.pd
Box 6. Examples o Green Transport Policies in Action
Municipalities across the world have employed a range o instruments and policies to enhance the eciency o their trans-
portation systems and improve their quality o lie. In central London, a “congestion charge” reduced daily vehicle journeys by
70,000110 and CO2 emissions by 20%.111 Singapore’s Electronic Road Pricing and Vehicle Quota System slowed increasing
car use and motorization.112 Bogota’s bus rapid transit system (BRT) is contributing to a 14% drop in emissions per passen-
ger,113 and as a product o its success BRT has been replicated across the globe in Lagos, Ahmadabad, Guangzhou and
Johannesburg. In Europe, cities are ollowing Zurich’s example o investing in a tram system as the backbone o urban trans-
port in preerence to an expensive underground system.114 Emissions standards and car-sharing schemes have reduced car
dependency115 while low-emission zones and timed delivery permits have helped reduce congestion and pollution,116 bringing
enhanced productivity and well-being to urban dwellers.
Improving energy eciency in the transport
sector, adopting clean uel and shiting rom
private to public and non-motorized transport
can deliver signicant economic and health
benets. In Europe, analysis indicates that publictransport investments yield economic benets at the
regional level more than twice their cost. In Sub-SaharanArica (SSA), reducing the sulur content o uels used or
transport could save up to US$ 980 million per year in
health and related economic costs.117 The now well-known
example o Curitiba in Brazil, where or example, uel usage
is 30% lower than in the country’s other major cities, isinspiring many other city-level initiatives. Taking a global
perspective, modelling or the GER indicates that investing
0.34% o global GDP per year over 2010-2050 (starting at
about US$ 195 billion) in the transport sector can contribute
to reducing oil-based uel usage as much as 80% below
business as usual, while increasing employment by 10%.
A Green Economy Grows Fasterthan a Brown Economy overTime, while Maintaining andRestoring Natural Capital
One o the key questions in economics ocuses on
the apparent trade-o between development and
Towards a Green Economy
8/7/2019 Green Economy Report - Synthesis Report
http://slidepdf.com/reader/full/green-economy-report-synthesis-report 31/52
23 - 24
e c o
GRE E N
n om
y
K e y F i n d i n
g s
environmental quality. In this section, we look at theopportunities or investing in the transormation
o key sectors o the economy to decrease carbon
intensity and to improve resource eciency. It exploresthe alternatives or a new development pathway,
characterized by greater complementarities between,
physical, human and natural capital.
To examine the global eects o greening the world
economy, the modelling undertaken or the GERanalyses the potential macroeconomic impacts o
investing 2% o global GDP on an annual basis over
the coming decades into both business as usualand green economy scenarios. About hal o this
green investment is allocated to energy eciency,particularly buildings, industry and transport, as well
as the development o renewable energy sources,
given the large potential cost savings and refectingthe international policy priority given to addressing
climate change. The remainder is devoted to improved
waste management, public transport inrastructureand a range o natural capital-based sectors, such as
agriculture, sheries, orestry and water supply.
The green investment scenario amounts to about US$
1.3 trillion per year and the breakdown among sectors
is presented in detail in Annex I. This also shows howthe allocation is comparable to various assessments
o investment needs or achieving relevant policytargets, such as halving worldwide energy-related CO2 emissions by 2050, or reducing deorestation by 50%
by 2030.
This green investment scenario is compared tobusiness as usual projections using a global version o
the Threshold 21 (T21) simulation model. This model,generally applied at the national level to analyse national
development and poverty reduction strategies, directlyincorporates the dependence o economic production
on natural resources (See Annex II or more details). This
characteristic helps to illuminate the medium and long-term implications the stewardship o such resources has
or economic and social well-being, and the generation
o uture wealth and prosperity.
The ndings are as ollows:
A green investment scenario o 2% o global
GDP delivers long-term growth over 2011-
2050 that is at least as high as an optimistic
business as usual case, while avoidingconsiderable downside risks such as the
eects o climate change, greater water
scarcity, and the loss o ecosystem services.
Without taking into account the potential negative
impacts o climate change or major loss o ecosystem
services, global economic growth under business as
usual will nonetheless be constrained by increasing
scarcity o energy and natural resources. Even with
conservative assumptions, a green investment scenario
achieves higher annual growth rates within 5-10 years
(see Figure 9) and an increase in renewable resource
stocks that contribute to global wealth (see Figure 10
and Box 7). By promoting investment in key ecosystemservices and low-carbon development, this economic
growth is characterized by a signicant decoupling
rom environmental impacts, also illustrated by a
considerable decline in the global ecological ootprint
(see Figure 10 and Annex III). With respect to energy,
primary demand returns to current levels by 2050,
which is about 40% less than what is expected under
business as usual. The combination o demand and
supply side measures would reduce energy prices
below business as usual in the coming decades,
reducing the vulnerability o the global economy to
potential energy price shocks, and contributing to
stable economic growth. Savings on capital and uelcosts in power generation under the green economy
scenario are projected to average about US$ 760
billion per year between 2010 and 2050.
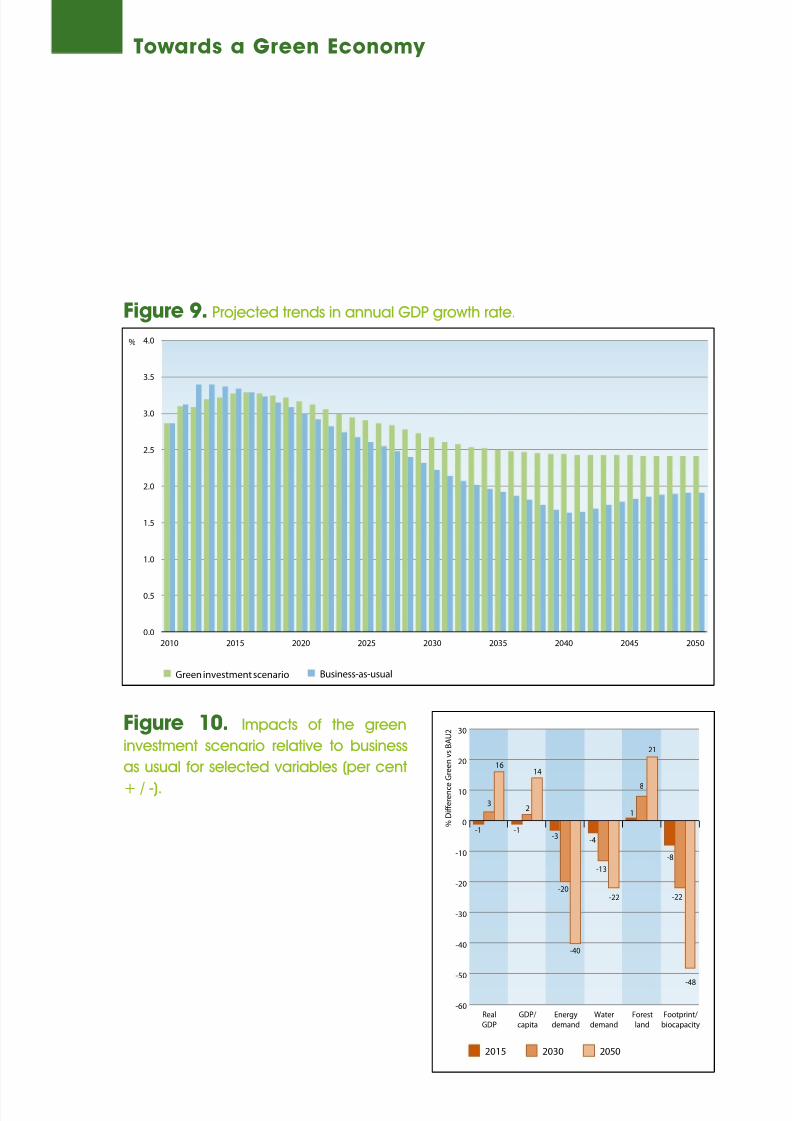
8/7/2019 Green Economy Report - Synthesis Report
http://slidepdf.com/reader/full/green-economy-report-synthesis-report 32/52
Green investment scenario Business-as-usual
4.0
3.5
3.0
2.5
2.0
1.5
1.0
0.5
0.0
2010 2015 2020 2025 2030 2035 2040 2045 2050
%
Figure 9. Projected trends in annual GDP growth rate.
-60
-50
-40
-30
-20
-10
0
10
20
30
205020302015
Footprint/
biocapacity
Forest
land
Water
demand
Energy
demand
GDP/
capita
Real
GDP
-1
2
-13
-20
-4
3
16
-1
14
-3
-22
-40
1
8
21
-8
-22
-48
% D
i e r e n c e
G r e e n v s B A U 2
Figure 10. Impacts o the green
investment scenario relative to business
as usual or selected variables (per cent
+ / -).
Towards a Green Economy
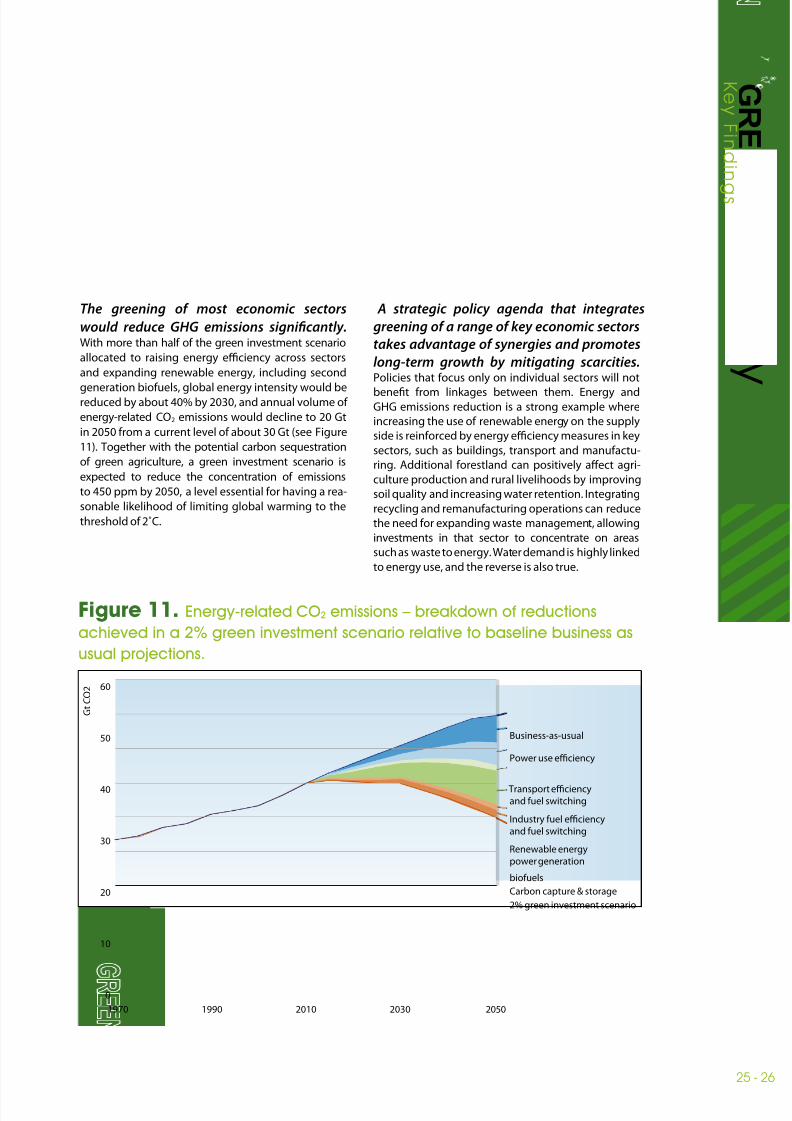
8/7/2019 Green Economy Report - Synthesis Report
http://slidepdf.com/reader/full/green-economy-report-synthesis-report 33/52
25 - 26
e c o
GRE E N
n om
y
K e y F i n d i n
g s
The greening o most economic sectors
would reduce GHG emissions signicantly.
With more than hal o the green investment scenario
allocated to raising energy eciency across sectors
and expanding renewable energy, including second
generation biouels, global energy intensity would bereduced by about 40% by 2030, and annual volume o
energy-related CO2 emissions would decline to 20 Gt
in 2050 rom a current level o about 30 Gt (see Figure
11). Together with the potential carbon sequestration
o green agriculture, a green investment scenario is
expected to reduce the concentration o emissions
to 450 ppm by 2050, a level essential or having a rea-
sonable likelihood o limiting global warming to the
threshold o 2˚C.
A strategic policy agenda that integrates
greening o a range o key economic sectors
takes advantage o synergies and promotes
long-term growth by mitigating scarcities. Policies that ocus only on individual sectors will not
benet rom linkages between them. Energy andGHG emissions reduction is a strong example where
increasing the use o renewable energy on the supply
side is reinorced by energy eciency measures in key
sectors, such as buildings, transport and manuactu-
ring. Additional orestland can positively aect agri-
culture production and rural livelihoods by improving
soil quality and increasing water retention. Integrating
recycling and remanuacturing operations can reduce
the need or expanding waste management, allowing
investments in that sector to concentrate on areas
such as waste to energy. Water demand is highly linked
to energy use, and the reverse is also true.
2050
G t C O 2 60
50
40
30
20
10
0
1970 1990 2010 2030
Business-as-usual
Power use eciency
Transport eciencyand fuel switching
Industry fuel eciency
and fuel switching
Renewable energy
power generation
biofuels
Carbon capture & storage
2% green investment scenario
Figure 11. Energy-related CO2 emissions – breakdown o reductions
achieved in a 2% green investment scenario relative to baseline business as
usual projections.
8/7/2019 Green Economy Report - Synthesis Report
http://slidepdf.com/reader/full/green-economy-report-synthesis-report 34/52
118. Where is the Wealth o Nations? Measuring Capital or the 21st Century, World Bank (2006).
Box 7. Accounting or Inclusive Wealth
The use o conventional economic indicators, such as GDP and other macroeconomic aggregates, can lead to a distorted
picture o economic perormance, particularly since such measures do not refect the extent to which production and
consumption activities may be drawing down natural capital. By either depleting natural resources, or degrading the ability
o ecosystems to deliver economic benets, in terms o provisioning, regulating or cultural services, economic activity
may be based on the depreciation o natural capital. Future growth may be compromised i alternative investments are
insucient, or i critical thresholds o natural capital are reached, undermining economically important or vital ecosystem
services.
Changes in stocks can be evaluated in monetary terms and incorporated into the national accounts, as being pursued in
the ongoing development o the System o Environmental and Economic Accounting (SEEA) by the UN Statistical Division,
and the adjusted net national savings methods o the World Bank. 118 The wider use o such complementary measures,
including net domestic product and genuine savings rates would provide a more accurate and realistic indication o the
level o economic output and total inclusive wealth, including stocks o physical, human and natural capital.
The green economy scenario is characterized by investment in and recovery o stocks o renewable natural capital stocks,
including sh, orests and soil. Stocks o non-renewable resources, in particular ossil uels, are drawn down at a slower
rate due to eciency improvements and the development o renewable substitutes, providing a basis or sustained income
gains over the medium to longer term. The GER modelling chapter makes some initial attempts to calculate the net genuinesavings rate, demonstrating how both stocks o natural capital grow as physical capital also increases under a green
investment scenario and breaking with past history.
Towards a Green Economy
8/7/2019 Green Economy Report - Synthesis Report
http://slidepdf.com/reader/full/green-economy-report-synthesis-report 35/52
27 - 28
e c o
GRE E N
n om
y
E n a b l i n g C on d i t i on s
EnablingConditionsThe preceding section outlined the key benets o moving towards a green
economy, in terms o wealth creation, employment, poverty eradication
and long-term economic prosperity. In many cases, concrete steps taken bycountries to achieve these results were outlined as examples that could be
replicated on a wider basis.
The ollowing section takes a broader perspective and suggests a ew powerul
ideas that have emerged rom a review o the policies and actions that have
proven successul in promoting a green economic transition. Although a green
economic transition will involve many actors, the ollowing points are made
with national governments and their policy makers specically in mind. These
key enabling conditions include:
• establishingsoundregulatoryframeworks;
• prioritizinggovernmentinvestmentandspendinginareasthatstimulate
the greening o economic sectors;
• limitingspendinginareasthatdepletenaturalcapital;
• employing taxes and market-based instruments to shift consumer
preerence and promote green investment and innovation;
• investingincapacitybuildingandtraining;and
• strengtheninginternationalgovernance.
The message rom these recommendations is clear: concrete policy options ortransitioning to a green economy not only exist, they are being implemented
by many countries throughout the world. The governments that act early
to establish green economy enabling conditions will not only support the
transition but will also ensure they are in the best place to take advantage o
it. The section closes with a special reerence to those policies and conditions
required to ensure a “just transition” or all.
Establish Sound Regulatory
Frameworks A well-designed regulatory ramework
can dene rights and create incentives
that drive green economic activity as well
as remove barriers to green investments.
A regulatory ramework can regulate the most
harmul orms o unsustainable behaviour, either by
creating minimum standards or prohibiting certainactivities entirely. Moreover, an adequate regulatory
ramework reduces regulatory and business risks, and
increases the condence o investors and markets. It
is oten better or businesses to work with clear and
eectively enorced standards, and not have to deal
with uncertainty or ace unair competition rom non-

8/7/2019 Green Economy Report - Synthesis Report
http://slidepdf.com/reader/full/green-economy-report-synthesis-report 36/52
119. The Contribution o Good Environmental Regulation to Competitiveness. Network o Heads o European Environment Protection Agencies, (November 2005), p. 2.120. Trade and Climate Change. WTO-UNEP (2009), p. 119.
121. Building Accountability and Transparency in Public Procurement. IISD (2008), p. 1.
122. Collection o Statistical Inormation on Green Public Procurement in the EU: Report on Data Collection Results. Pricewaterhouse Coopers, Signicant and Ecoys (2009), pp. 5-7.
compliance.119 Industry sel-regulation and voluntary
agreements between a government and a business can be
a useul complement to government rules and regulations
as they take away some o the burden o inormation and
administrative costs rom government authorities.
Command and control measures may oer thelowest-cost solution in some cases. While market-
based instruments have a well-deserved reputation or
eciency, in some situations command and control
measures may oer the lowest-cost solution. For
example, there may be no market instrument that can
eciently ensure the elimination o bottom-trawling in
sheries, and the cost-eectiveness o regulation may be
preerable where there are opportunities to regulate an
industry upstream – such as oil extraction and rening
– that can have knock-on eects throughout the supply
chain. Depending on the situation, command and control
measures can be administratively easier to implement
and may pose ewer political challenges. In the shortterm, or example, it may be easier to establish new
energy-eciency standards and remove obstacles in
the planning-permission process o renewable energy
projects than to establish a carbon market and eliminate
ossil-uel subsidies.
Standards can be eective tools or achieving
environmental objectives and enabling markets
in sustainable goods and services. Technical
standards (i.e. requirements on products and/or processes
and production methods) are mainly developed and
implemented at the national level, although or instance
standards that aim at enhancing energy eciency andthat set targets or emission reductions, such as those
associated with the Clean Development Mechanism under
the Kyoto Protocol, are also developed internationally.
The requirements may be based on the design or the
particular characteristics required, such as many biouel
standards, or they may be perormance-based, as is the
case with many energy eciency standards.120 Mandatory
standards in particular can be very eective in achieving a
desired outcome. However, it may be dicult to promote
action and improvements beyond what the standard
requires unlike many market-based instruments, which
can be designed to provide a continued incentive to
improve. The enorcement o standards can also be anissue i institutions are too weak.
Sustainable public procurement can help create
and strengthen markets in sustainable goods
and services. Government procurement represents
a large proportion o total public spending in both
developed and developing countries. In South Arica and
Brazil, or instance, the percentages are 35 and 47 o GDP,respectively.121 By using sustainable public procurement
practices, governments can create high-volume and long-
term demand or green goods and services. This sends
signals that allow rms to make longer term investments
in innovation and producers to realize economies o
scale, lowering costs. In turn, this can lead to the wider
commercialization o green goods and services, promoting
sustainable consumption. For example, sustainable public
procurement programmes in Austria, Denmark, Finland,
Germany, the Netherlands, Sweden and the United
Kingdom reduced the CO2 ootprint o procurement by
an average o 25%.122 Public procurement has also helped
launch markets in Europe or organic ood and drink, uel-
ecient vehicles and sustainable timber products.
Prioritize GovernmentInvestment and Spendingin Areas that Stimulate theGreening o Economic Sectors
Subsidies that have public-good characteristics
or positive externalities can be a powerul
enabler or a transition to a green economy.Green
subsidies, such as price support measures, tax incentives,
direct grants and loan support, may be used or a number
o reasons: (a) to act quickly in order to avoid locking in
unsustainable assets and systems, or o losing valuable
natural capital that people depend on or their livelihoods;
(b) to ensure the realization o green inrastructure and
technologies, especially those with substantial non-
nancial benets or nancial benets that are dicult or
private actors to capture; and (c) to oster green inant
industries, as part o a strategy to build comparative
advantage and drive long-term employment and growth.
Tax incentives can help promote investment
in a green economy and mobilize private
Towards a Green Economy
8/7/2019 Green Economy Report - Synthesis Report
http://slidepdf.com/reader/full/green-economy-report-synthesis-report 37/52
29 - 30
e c o
GRE E N
n om
y
E n a b l i n g C on d i t i on s
123. Annual Report 2009-10. Ministry o New and Renewable Energy o India, para. 5.17.124. Accelerated Depreciation or Environmental Investment (Depreciación acelerada para inversiones que reportan benecios ambientales). OECD-IEA, Climate Change Database.
125. Trade and Climate Change. WTO-UNEP (2009), p. 115.126. Victor, D. The Politics o Fossil-Fuel Subsidies. IISD and GSI (2009), p. 27.
127. Deploying Renewables: Principles or Eective Policies. OECD-IEA (2008), p. 23.128. Sumaila, U.R., Khan, A.S., Dy ck, A.J., Watson, R., Munro, G., Tyedmers, P., and Pauly, D. A Bottom-Up Re-estimation o Global Fisheries Subsidies. Journal o Bioeconomics 12: 201-225 (2010), pp. 213, 201-202.
129. The Sunken Billions – The Economic Justication or Fisheries Reorm. World Bank-FAO (2009), p. xvii.130. Analysis o the Scope o Energy Subsidies and Suggestions or the G20 Initiative. IEA, OPEC, OECD and World Bank (2001), p. 4.
131. Reorming Energy Subsidies: Opportunities to Contribute to the Climate Change Agenda. UNEP (2008), p. 32.; International Trade and Climate Change: Economic, Legal and Institutional Perspectives.
World Bank (2008), p. 12.; el Sobki, M, Wooders, P., & Sheri, Y. Clean Energy Investment in Developing Countries: Wind Power in Egypt. IISD (2009), p. 8.
inance. Such incentives can target either theconsumption or the production o goods or services.A number o municipalities in India, or instance,have established a rebate in the property tax orusers o solar water heaters. In some cases thisrebate is 6-10% o the property tax.123 Accelerated
depreciation, another type o tax reduction, isoten used to encourage the production o energyrom renewable sources. It allows an investor todepreciate the value o eligible ixed assets at ahigher rate, which reduces the investor’s taxableincome. In Mexico, investors in environmentallysound inrastructure have beneited romaccelerated depreciation since 2005.124
Price support measures and net metering
have been successully used to promote
renewable energy technologies. Price support,usually in the orm o a subsidy or price control,
guarantees the market price o a particular good orservice and provides the long-term security requiredby private sector investors. The most commonand high prole o these, as highlighted in the keyndings, is the use o eed-in taris to promote thedeployment and development o renewable energytechnologies. Many governments are also using“net metering” to provide incentives to small-scalerenewable power generation. Under a net meteringsystem, i the amount o power that a consumer’srenewable energy equipment supplies to the nationalelectricity grid is greater than the amount theconsumer takes rom the grid, the consumer receivesa credit or that amount on uture energy bills. Netmetering is common within the United States andhas also been adopted in Mexico and Thailand.125
Government spending should be time-
bound. Once they have been created, subsidiescan be dicult to remove as recipients have a vestedinterest to lobby or their continuation. In general,governments can try to keep expenses to a minimumby designing subsidies with cost control in mind. Forexample, depending on the support mechanism, thismight include regular programme reviews, with agreed
conditions or adjustment, as well as caps on totalspending and clear sunset mechanisms.126 IEA analysiso subsidies or renewable energy suggests that,
where countries aim to stimulate private investment ina sector, it is important that the support is stable andpredictable, gives certainty to investors, and is phased
out over time in order to motivate innovation.127
Limit Government Spending in Areas that Deplete Natural Capital
Many subsidies represent a signicant
economic and environmental cost to
countries. Articially lowering the price o goodsthrough subsidization encourages ineciency, wasteand over use, leading to the premature scarcityo valuable nite resources or the degradation o
renewable resources and ecosystems. For instance,global subsidies to sheries have been estimated atUS$ 27 billion annually,128 at least 60% o which havebeen identied as harmul, and are thought to be oneo the key actors driving over-shing. It is estimated
that depleted sheries result in lost economic benetin the order o US$ 50 billion per year, more than hal the value o global seaood trade.129
Subsidies reduce the protability o
green investments. When subsidization makesunsustainable activity articially cheap or low risk,it biases the market against investment in green
alternatives. Fossil uel consumption subsidies werean estimated US$ 557 billion worldwide in 2008 andproduction subsidies accounted or an additional US$100 billion.130 By articially lowering the cost o usingossil uels, such subsidies deter consumers and rmsrom adopting energy eciency measures that wouldotherwise be cost eective in the absence o any
subsidies. There is consensus that these subsidies posea signicant barrier to the development o renewableenergy technologies.131 It is estimated that phasing outall ossil uel consumption and production subsidiesby 2020 could result in a 5.8% reduction in global
8/7/2019 Green Economy Report - Synthesis Report
http://slidepdf.com/reader/full/green-economy-report-synthesis-report 38/52
132. Analysis o the Scope o Energy Subsidies and Suggestions or the G20 Initiative. IEA, OPEC, OECD and World Bank (2010), p. 4.133. Reorming Energy Subsidies: Opportunities to Contribute to the Climate Change Agenda. UNEP (2008), p. 17.
134. Fuel and Food Price Subsidies: Issues and Reorm Options. IMF (2008), p. 25.135. Ibid., p. 30.
136. Bacon, R. and Kojima, M. Coping with Higher Oil Prices, ESMAP (2006), p. 93.137. Ibid.
138. Lessons Learned rom Indonesia’s Attempts to Reorm Fossil-Fuel Subsidies. IISD (2010), p. 10.139. Ibid., p. 24.
140. Hutagalung, S., Ari, S., & Suharyo, W., Problems and Challenges or the Indonesian Conditional-Cash Transer Programme – Program Keluarga Harapan (PKH), (2009), p. 6.; Bloom, K., Conditional Cash Transers:
Lessons rom Indonesia’s Program Keluarga Harapan. Asian Development Bank presentation (2009), p. 8.
141. Fuel and Food Price Subsidies: Issues and Reorm Options. IMF (2008), p. 30.
142. Ibid.
Box 8. Energy Subsidy Reorm: Some Examples
Cash transers. When Indonesia reduced its energy subsidies and raised uel prices in October 2005, the government
established a year-long programme to transer unconditional quarterly payments o US$ 30 to 15.5 million poor house-
holds.136 Considering its quick implementation, the programme is considered to have operated well.137 The same move
was taken when uel prices were raised in May 2008, with US$ 1.52 billion being allocated to cash transers to low-income
households.138 The proxy means testing method that was used to identiy poor households when reorming subsidies was
subsequently used in the government’s design and trial o an ongoing conditional cash transer programme – the Hopeul
Family Program (Program Keluarga Harapan), intended to increase the education and health o poor communities.139 Pay-
ments are made to emale household heads through post oces on the condition that they meet requirements to use health
and education services.140
Microfnance. In Gabon, the impact o subsidy reorm was oset by using liberated revenue to help und microcredit pro-
grammes or disadvantaged women in rural areas.141
Basic services. When Ghana reormed its uel subsidies, ees or attending primary and junior secondary schools were
eliminated and the government made extra unds available or primary health care programmes concentrated in the poorest
areas (IMF, 2008).142
Employ Taxes and Market-basedInstruments to Promote
Green Investment and Innovation
Taxes and market-based instruments can be an ecient
means o stimulating investments. Signicant price dis-
tortion exists that can discourage green investments or
contribute to the ailure to scale up such investments. In
a number o economic sectors, such as transportation,
negative externalities such as pollution, health impactsor loss o productivity, are typically not refected in costs,thereby reducing the incentive to shit to more sustai-nable goods and services. The situation or waste is simi-lar, where the ull cost associated with the handling anddisposal o waste is usually not refected in the price o aproduct or waste disposal service. A solution to this pro-blem is to incorporate the cost o the externality in theprice o a good or service via a corrective tax, charge orlevy or, in some cases, by using other market-based instru-ments, such as tradable permit schemes (see Box 9).
primary energy demand and a 6.9% all in greenhouse
gas emissions.132
Subsidy reorm is possible i done with careul
attention to the poorest communities. Removing
subsidies is challenging given the vested interests in
their maintenance, but there are numerous examples
o countries that have undertaken reorm processes
(see Box 8). Subsidies are sometimes justied with the
argument that they benet low-income households, but
unless the aid is targeted, the majority o the spending
oten fows to higher-income households.133 That said,
subsidy reorm will oten lead to increases in the prices
o subsidized goods. Although low-income groups
typically benet rom only a small share o subsidies,
they spend a larger proportion o their income on basic
goods, including ood, water and energy, and can be
disproportionately aected i subsidies or these goods
are removed.134 Given this, a gradual reorm strategy with
short-term support measures is required. Such a reorm
strategy could include, among other things, the use o
targeted consumption subsidies to poor households or
the redirection o unds into high-priority areas or public
spending, such as health care or education.135
Towards a Green Economy

8/7/2019 Green Economy Report - Synthesis Report
http://slidepdf.com/reader/full/green-economy-report-synthesis-report 39/52
31 - 32
e c o
GRE E N
n om
y
E n a b l i n g C on d i t i on s
143. Taxation, Innovation and the Environment: Executive Summary. OECD (2010), p. 6.144. World o Work Report 2009: The Global Jobs Crisis and Beyond. ILO (2009), p. x.
145. Knigge, M. & Görlach, B. Eects o Germany’s Ecological Tax Reorms on the Environment, Employment and Technological Innovation. Ecologic Institute or International and European Environmental Policy, (2005), p. 5.146. Ibid., p. 8.
147. Kohlhaas, M., Gesamtwirtschatliche Eekte der ökologischen Steuerreorm. DIW Berlin (2005), pp. 13-14.148. Blustone, R., Environmental Taxes in Developing and Transition Economies. Public Finance and Management, 2 (1), 143-175, (2003), pp. 11-14.
149. State and Trends o the Carbon Market 2010. World Bank (2010), p. 1.
150. Global Green New Deal: Policy Brie. UNEP (2009), p. 24.
Box 9. Eco-taxes: A Double Dividend or Jobs and the Environment
Eco-taxes are designed to put a price on the pollution and the use o scarce natural resources and to stimulate em-
ployment creation by reducing the cost o labour in the orm o taxes and social security contributions. An ILO study
analysed the impact o an eco-tax on the global labour market. It ound that imposing a price on carbon emissions
and using the revenue to cut labour costs by lowering social security contributions would create 14.3 million net new
jobs over a period o ve years, which is equivalent to a 0.5% rise o world employment.144
In 1999, the German government increased taxes or engine uels, electricity, oil and gas in small oreseeable steps
up to 2003. The revenue was directly used to reduce non-wage labour costs by lowering the social partner’s contri-bution to the pension und. An impact study by the German Institute or Economic Research nds that i the mo-
dest eco-tax had not been introduced, the contribution to the pension und would be 1.7% higher.145 The eect o
reduced non-wage labour costs is estimated to have created an additional 250,000 ull time equivalent jobs146 and
reduced CO2 emissions by 3% in 2010.147
Opportunities oered by environmentally
related taxes are accessible to all countries.
Many developing countries are increasingly ocusing
on implementing levies on natural resource extraction,
including charges on orest resources, license-based
ees or sheries, and taxes on extracting mineral and
petroleum resources. Environmentally related taxation
on some level has been used successully by countriesaround the world since the 1970s and 1980s, including
China, Malaysia, the Philippines, Tanzania and Thailand.148
Market-based instruments, such as tradable
permits, are powerul tools or managing
the “economic invisibility o nature” and are
being increasingly used to address a range
o environmental issues. As opposed to taxes,
which x a price or pollution and then allow the
market to determine the level o pollution, tradable
permits schemes, including cap-and-trade systems,
rst establish an overall level o pollution allowed and
then let the open market determine the price. The
Kyoto Protocol, or instance, provides countries with the
ability o trading emissions reduction credits. In total,
8.7 billion tonnes o carbon was traded in 2009 with a
value o US$ 144 billion.149
Markets establishing “payments” or providing ecosystem services can infuence
land-use decisions by enabling landholders
to capture more o the value o these
environmental services. It has been estimated
that hundreds o millions o dollars are currently being
invested in payments or ecosystem services schemes
(PES) – such as carbon sequestration, watershed
protection, biodiversity benets and landscape
beauty – that range rom the local level to national
and even global schemes.150 As the contribution o
deorestation and orest degradation to greenhouse
Taxes oten provide clear incentives to reduce emissions,
use natural resources more eciently and stimulate
innovation. Environmentally related taxes can be broadly
broken down into two categories: “polluter pays” ocused
on charging producers or consumers at the point that
they are responsible or the creation o a pollutant; and
“user pays”, which ocuses on charging or the extractionor use o natural resources. Singapore, or instance,
introduced the world’s frst road charging scheme in the
1980s and is now in the oreront o using pricing tools
to deal with waste and water issues. Placing a price on
pollution has also been ound to stimulate innovation
and use o new technologies as frms seek out cleaner
alternatives. For instance, in Sweden the introduction o
a tax on NOx emissions led to a dramatic increase in the
adoption o existing abatement technology – rom 7%o the frms adopting the technology prior to the tax to
62% the ollowing year.143
8/7/2019 Green Economy Report - Synthesis Report
http://slidepdf.com/reader/full/green-economy-report-synthesis-report 40/52
151. See http://www.un-redd.org/AboutREDD/tabid/582/Deault.aspx and related links.
152. Green Economy Success Stories rom Developing Countries. UNEP (2010), p. 6.
gas emissions has become better understood, the
potential to create an international PES scheme related to
orests and carbon has become a key ocus o international
climate negotiations. The scheme, reerred to as REDD
(reducing emissions rom deorestation and degradation)
and more recently as REDD+, which adds conservation,
sustainable management o orests and enhancemento orest carbon stocks to the list o eligible activities,
represents a multi-layer PES scheme with transers o
nance between industrialized countries and developing
countries in exchange or emission reductions, and urther
transers rom the national level to orest landowners
and communities.151 Scaling up this nancing option is
explored urther in the ollowing section.
Invest in Capacity Building,Training and Education
The capacity to seize green economic
opportunities and implement supporting
policies varies rom one country to another,
and national circumstances oten infuence the
readiness and resilience o an economy and
population to cope with change. A shit towards
a green economy could require the strengthening o
government capacity to analyse challenges, identiy
opportunities, prioritize interventions, mobilize resources,
implement policies and evaluate progress. For instance,
environmentally related taxes have been used with success
by a number o developing countries. Nevertheless, the
implementation and administration o such taxes maypresent challenges, and enhancing the administrative
capacity o a country may be required. To sustain
the momentum o a green economy transormation,
governments also need to be able to measure the progress
being achieved. This would require the capacity to develop
indicators, collect data, and analyse and interpret results or
guiding policy development.
Training and skill enhancement programmes
are needed to prepare the workorce or a
green economy transition. A shit to a green
economy by denition entails some degree o economic
restructuring, and measures may be required to ensure
a just transition or aected workers. In some sectors,
support will be needed to shit workers to new jobs. In
the sheries sector, or example, shermen may need to
be trained or alternative livelihoods, which could include
participation in a rebuilding o sheries stocks. Investing
in the re-skilling o the workorce may also be necessary.
In Germany, or example, the renewable energy industry
has been experiencing a shortage o skilled workers. In
act, almost all energy sub-sectors lack skilled workerswith the most pronounced shortage ound in the hydro,
biogas and biomass sectors. The shortage is also pressing
or manuacturing in the renewable energy industry,
particularly or engineers, operation and maintenance
sta and site management.
Inter-governmental organizations, interna-
tional nancial institutions, non-governmen-
tal organizations, the private sector and the
international community as a whole can play
a critical role in providing technical and nan-
cial assistance in developing countries. Enablinga smooth transition to a green economy will require a
sustained international eort by a variety o actors. In
this regard, current levels o overseas development assis-
tance may be insucient and need to be re-evaluated in
light o the scale o transormation required. Additionally,
the United Nations and its partners will need to mobilize
around its long history o supporting national capacity
building and training activities, and utilize this expertise
to support national green economy eorts. South-South
cooperation is likely to be important: many developing
country experiences and successes in achieving a green
economy can provide valuable impetus, ideas and means
or other developing countries to address similar concerns
– particularly given the impressive gains and leadership
that have been demonstrated in practice.152 South-South
cooperation can thus increase the fow o inormation, ex-
pertise and technology at a reduced cost. More broadly,
as countries take steps towards a green economy, ormal
and inormal global exchanges o experiences and les-
sons learned can prove a valuable way to build capacity.
Strengthen InternationalGovernance
International environmental agreements canacilitate and stimulate a transition to a green
economy. For instance, multilateral environmental
Towards a Green Economy
8/7/2019 Green Economy Report - Synthesis Report
http://slidepdf.com/reader/full/green-economy-report-synthesis-report 41/52
33 - 34
e c o
GRE E N
n om
y
E n a b l i n g C on d i t i on s
153. A/RES/64/236, para. 20(a).154. Terms o Reerence or the Issue Management Group on a Green Economy. Environment Management Group, 12 February 2010, para. 6.
155. Warming Up to Trade: Harnessing International Trade to Support Climate Change Objectives. World Bank (2007), pp. 69, 94.
agreements (MEAs), which establish the legal and
institutional rameworks or addressing global
environmental challenges, can play a signicant role
promoting green economic activity. The Montreal
Protocol on the Substances that Deplete the Ozone
Layer, which is widely considered to be one o the
most successul MEAs, is a case in point. The Protocolled to the development o an entire industry ocused
on the replacement and phase out o ozone-depleting
substances. O course, the MEA with the most potential
to infuence the transition to a green economy is the
United Nations Framework Convention on Climate
Change (UNFCCC). The UNFCCC’s Kyoto Protocol has
already stimulated growth in a number o economic
sectors, such as renewable energy generation and
energy ecient technologies, in order to address
greenhouse gas emissions. At a global level, the
renewal o a post-Kyoto ramework or carbon will be
the single most signicant actor in determining the
speed and scale o the transition to a green economy.
An active role by governments in
international processes can promote
coherence and collaboration in the
transition to a green economy. The United
Nations Conerence on Sustainable Development
(Rio +20) summit in 2012 will provide an invaluable
opportunity or the international community to
promote green economy action given that one o
the two themes or the summit is “a green economy
in the context o sustainable development and
poverty eradication.”153 The commitment and action
by governments, business, international organizationsand other stakeholders over the next two years will
determine whether the summit provides the impetus
and direction required or driving the transition. In
preparation or accelerating national-level green
economy action, the United Nations Environmental
Management Group is coordinating with 32
international organizations to develop an inter-agency
assessment on how the expertise o the dierent UN
agencies, unds and programmes can contribute
directly to supporting countries in the transition to a
green low-carbon economy.154
The international trading system can have
signicant infuence on green economic
activity, enabling or obstructing the fow o
green goods, technologies and investments.I environmental resources are properly priced at
the national level, then the international tradingregime allows countries to sustainably exploit their
comparative advantage in natural resources that
benets both the exporting and importing country.
Water-scarce regions, or instance, can relieve
pressure on local supplies by importing water-
intensive products rom water-abundant regions. As
noted previously, trade-related measures, such as
standards, can also play an important role in driving
growth in a number o sectors in a green economy.
However, such measures could also be perceived by
countries as a challenge to market access or a orm
o trade protectionism. It is thereore crucial or
countries to combine and balance environmentalprotection with saeguarding market access.
The current World Trade Organization Doha
Round negotiations oer the opportunity
to promote a green economy. A successul
conclusion o these negotiations could contribute
to a green economic transition. For example,
negotiations are currently ocused on the removal o
sheries subsidies, which oten contribute directly to
overshing. Another opportunity exists with respect
to the current negotiations aimed at reducing tari
and non-tari barriers on environmental goodsand services. A World Bank study ound that trade
liberalization could result in a 7-13% increase in
trade volumes in these goods.155 Finally, the ongoing
negotiations to liberalize trade in agriculture are
expected to lead to a reduction in agricultural subsidies
in some developed countries that should stimulate
more ecient and sustainable agricultural production
in developing countries. It is essential, nonetheless,
that developing countries are supported through
capacity building to ully exploit the potential gains
rom trade liberalization, particularly in the context o
a transition to a green economy.

8/7/2019 Green Economy Report - Synthesis Report
http://slidepdf.com/reader/full/green-economy-report-synthesis-report 42/52
Financing the
Green EconomyTransition While the scale o nancing required or a green economy transition is substantial, itcan be mobilized by smart public policy and innovative nancing mechanisms. Therapid growth o capital markets, the growing green orientation o these markets, the
evolution o emerging market instruments such as carbon nance and micronance,and the green stimulus unds established in response to the economic slowdown orecent years, are opening up the space or large-scale nancing or a global greeneconomic transormation. But these fows are still small compared to total volumes,and urgently need to be scaled up i the transition to a green economy is to happenin the near term. Concentrated pools o assets, such as those controlled by long-term investors, such as public nancial institutions, development banks, sovereignwealth unds as well as some pension unds and insurance unds, whose liabilities arenot due or payment on a short-term basis, will be needed to transorm our economy.This nal section examines the most promising mechanisms or mobilizing nance at
scale to drive the green economy transition in the coming decades.There is no complete estimate o unds needed
to green the entire global economy, but the
amounts involved are substantial. Existingestimates ocus on what is needed or achieving CO2
emission reduction targets, such as the IEA’s Blue Map
scenario o halving worldwide energy-related CO2 emissions by 2050.156 It requires investments o US$
46 trillion higher than what is required in the baseline
scenario, or approximately US$ 750 billion per year rom
2010 to 2030 and US$ 1.6 trillion per year rom 2030 to2050. The World Economic Forum and Bloomberg New
Energy Finance, on the other hand, calculate that clean
energy investment needs to rise to US$ 500 billion per yearby 2020 to restrict global warming to less than 2°C, while
HSBC estimates that transition to a low-carbon energy
market will require US$ 10 trillion between 2010 and 2020.
These indicative amounts correspond, on
average, to the scenarios modelled or the
Green Economy Report. An assessment made by
the Green Economy team at UNEP, based on key sectoralinvestment requirements to achieve both the IEA’s Blue
Map scenario as well as the MDGs, came to a range US$
1.05 trillion to US$ 2.59 trillion annually at the outset(see Annex I). On average, these additional investments
amounted to 2% o global GDP per year over 2010-2050,
across a range o sectors to build capacity, adopt new
technologies and management techniques, and scale up
green inrastructure. For the sectors covered, the estimate
or the lower range o annual investment (2011-2050)
stands at US$ 1.3 trillion a year and rises as global GDP
increases. This additional investment is substantial, but
an order o magnitude smaller than global gross capital
ormation, which stood at 22% o global GDP in 2009.157
The nancial services and investment sectors
control trillions o dollars and are positioned
to provide the bulk o nancing or a green
economy transition. Long-term institutionalinvestors such as pension unds and insurance companies
are increasingly seeing the potential or minimizing
environmental, social and governance (ESG) risks by
building up “green” portolios (see Box 10) – a move that
can be supported by dening a regulatory ramework that
encourages long term investment as well as integrated
and sustainability reporting on progress in applying
ESG criteria.158 Similarly, commercial and retail banks are
increasingly bringing ESG considerations into lending
policies and in designing “green” nancial products. In the
renewable energy sub-sector, or example, around US$
627 billion o private capital had already been invested
between 2007 and mid-2010. This market saw a three-old
increase in investment rom US$ 46 billion in 2004 to US$
173 billion annually in 2008.159
156. The International Energy Agency’s Blue Map scenario is described in Energy Technology Perspectives 2010: Scenarios & Strategies to 2050.
157. World Development Indicators (2010), p. 256.
158. See: www.globalreporting.org and www.integratedreporting.org159. Global Trends in Sustainable Energy Investment 2010: Analysis o Trends and Issues in the Financing o Renewable Energy and Energy Efciency. UNEP/Bloomberg New Energy Finance (2010), p. 5.
Towards a Green Economy
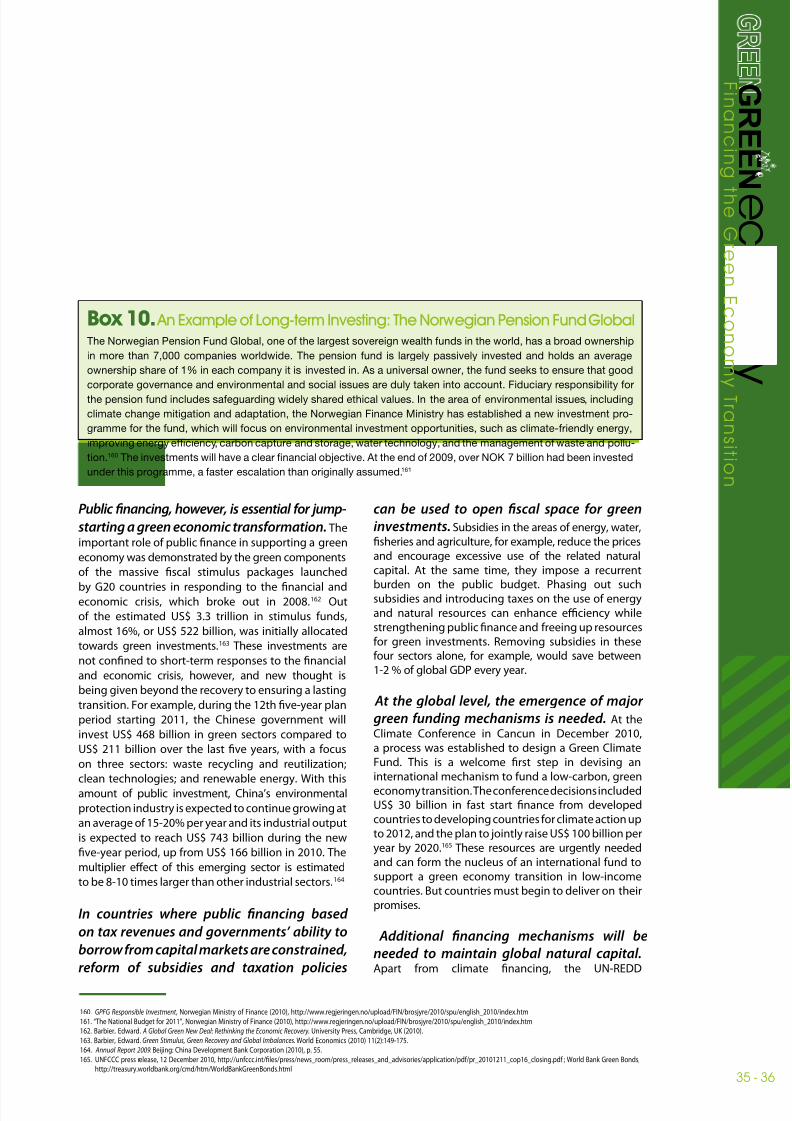
8/7/2019 Green Economy Report - Synthesis Report
http://slidepdf.com/reader/full/green-economy-report-synthesis-report 43/52
35 - 36
e c o
GRE E N
n om
y
F i n an ci n g
t h e Gr e enE c on om
y T r an s i t i on
Box 10. An Example o Long-term Investing: The Norwegian Pension Fund GlobalThe Norwegian Pension Fund Global, one o the largest sovereign wealth unds in the world, has a broad ownership
in more than 7,000 companies worldwide. The pension und is largely passively invested and holds an average
ownership share o 1% in each company it is invested in. As a universal owner, the und seeks to ensure that good
corporate governance and environmental and social issues are duly taken into account. Fiduciary responsibility or
the pension und includes saeguarding widely shared ethical values. In the area o environmental issues, including
climate change mitigation and adaptation, the Norwegian Finance Ministry has established a new investment pro-
gramme or the und, which will ocus on environmental investment opportunities, such as climate-riendly energy,
improving energy eciency, carbon capture and storage, water technology, and the management o waste and pollu-
tion.160 The investments will have a clear nancial objective. At the end o 2009, over NOK 7 billion had been invested
under this programme, a aster escalation than originally assumed.161
Public nancing, however, is essential or jump-
starting a green economic transormation. The
important role o public nance in supporting a green
economy was demonstrated by the green components
o the massive scal stimulus packages launched
by G20 countries in responding to the nancial andeconomic crisis, which broke out in 2008.162 Out
o the estimated US$ 3.3 trillion in stimulus unds,
almost 16%, or US$ 522 billion, was initially allocated
towards green investments.163 These investments are
not conned to short-term responses to the nancial
and economic crisis, however, and new thought is
being given beyond the recovery to ensuring a lasting
transition. For example, during the 12th ve-year plan
period starting 2011, the Chinese government will
invest US$ 468 billion in green sectors compared to
US$ 211 billion over the last ve years, with a ocus
on three sectors: waste recycling and reutilization;
clean technologies; and renewable energy. With this
amount o public investment, China’s environmental
protection industry is expected to continue growing at
an average o 15-20% per year and its industrial output
is expected to reach US$ 743 billion during the new
ve-year period, up rom US$ 166 billion in 2010. The
multiplier eect o this emerging sector is estimated
to be 8-10 times larger than other industrial sectors.164
In countries where public nancing based
on tax revenues and governments’ ability to
borrow rom capital markets are constrained,
reorm o subsidies and taxation policies
can be used to open scal space or green
investments. Subsidies in the areas o energy, water,sheries and agriculture, or example, reduce the pricesand encourage excessive use o the related naturalcapital. At the same time, they impose a recurrent
burden on the public budget. Phasing out suchsubsidies and introducing taxes on the use o energyand natural resources can enhance eciency whilestrengthening public nance and reeing up resourcesor green investments. Removing subsidies in theseour sectors alone, or example, would save between1-2 % o global GDP every year.
At the global level, the emergence o major
green unding mechanisms is needed. At theClimate Conerence in Cancun in December 2010,a process was established to design a Green ClimateFund. This is a welcome rst step in devising aninternational mechanism to und a low-carbon, greeneconomy transition. The conerence decisions includedUS$ 30 billion in ast start nance rom developedcountries to developing countries or climate action upto 2012, and the plan to jointly raise US$ 100 billion peryear by 2020.165 These resources are urgently neededand can orm the nucleus o an international und tosupport a green economy transition in low-incomecountries. But countries must begin to deliver on theirpromises.
Additional nancing mechanisms will be
needed to maintain global natural capital. Apart rom climate nancing, the UN-REDD
160. GPFG Responsible Investment , Norwegian Ministry o Finance (2010), http://www.regjeringen.no/upload/FIN/brosjyre/2010/spu/english_2010/index.htm
161. “The National Budget or 2011”, Norwegian Ministry o Finance (2010), http://www.regjeringen.no/upload/FIN/brosjyre/2010/spu/english_2010/index.htm162. Barbier, Edward. A Global Green New Deal: Rethinking the Economic Recovery. University Press, Cambridge, UK (2010).
163. Barbier, Edward. Green Stimulus, Green Recovery and Global Imbalances. World Economics (2010) 11(2):149-175.164. Annual Report 2009. Beijing: China Development Bank Corporation (2010), p. 55.
165. UNFCCC press release, 12 December 2010, http://unccc.int/les/press/news_room/press_releases_and_advisories/application/pd/pr_20101211_cop16_closing.pd ; World Bank Green Bonds,http://treasury.worldbank.org/cmd/htm/WorldBankGreenBonds.html
8/7/2019 Green Economy Report - Synthesis Report
http://slidepdf.com/reader/full/green-economy-report-synthesis-report 44/52
166. http://www.un-redd.org/NewsCentre/COP16_Press_Release_en/tabid/6595/Deault.aspx
167. Figures on multilateral unding are based on World Development Indicators 2010, World Bank; gures on bilateral unding are based the websites o the bilateral agencies covered. They include:http://www.ad.r/jahia/Jahia/site/ad/lang/en/pid/11118,
http://www.bndes.gov.br/SiteBNDES/bndes/bndes_en/Institucional/The_BNDES_in_Numbers/Annual_Report/,
http://www.caissedesdepots.r/en/the-group/who-are-we/key-gures.html,http://www.cdb.com.cn/english/Column.asp?ColumnId=91,
http://www.dbsa.org/(S(4ilhomm44linm35501iztz45))/InvestorRelations/Pages/deault.aspx,http://www.eib.org/about/publications/annual-report-2009-activity.htm,
http://www.halkbank.com.tr/channels/10.asp?id=385,http://www.jica.go.jp/english/publications/reports/annual/2009/index.html,
http://www.kw-entwicklungsbank.de/EN_Home/KW_Entwicklungsbank/Our_bank/Key_gures.jsp
Programme – an initiative launched in September 2008
by FAO, UNDP and UNEP in support o national eorts to
reduce deorestation and orest degradation and enhance
orest carbon stocks – will provide an important nancing
vehicle to drive the green economy transition. Donor
pledges currently amount to US$ 5 billion until 2012,166
as part o ongoing pilots, and there is considerableevidence that such “payment or environmental services”
hold wider promise not only or climate regulation and
biodiversity conservation services, but also to scale up
signicant resources to communities who are stewards
at the landscape level. The Global Environment Facility
(GEF) is another important nancing vehicle or the green
economy that needs to be scaled up and strengthened.
In addition to these mechanisms, development
nance institutions at international and
national levels will play a key role in supporting
the green economy. These institutions include
multilateral development banks such as the World Bank
and regional/sub-regional development banks, bilateral
development assistance agencies such as KFW o
Germany and Caisse des Depots and AFD o France, and
national development banks such as BNDES rom Brazil,
DBSA rom South Arica and CDB rom China. In 2009,
multilateral development nance institutions committed
US$ 168 billion in development assistance, whereas
national development banks and bilateral agencies
provided over US$ 350 billion in 2008.167
The role o these institutions in supporting
a green economy transormation could be
strengthened urther. They could, or instance, adopt
the goal o supporting green economy development and
link it to specic targets such as CO2 emissions reduction,
access to water and sanitation, biodiversity promotion,
on top o poverty alleviation. They could also measure
the net contribution o their activities to climate change,
biodiversity loss and the green economy at large. Policies
can be designed to improve the “green eciency” o
their portolio, examining or example the carbon and
ecological «ootprint» o their investments. In addition,
these institutions also infuence the nature o investments
and public nancing through loans agreements and duediligence in their lending procedures. They can jointly
dene protocols or green due diligence and standards
and goals or sectors in which they have major infuence
such as municipal nance, transport, and energy.
Domestic development banks can also play a major
role in developing and sharing new ways o addressing
the green role o municipalities as well as greening the
housing sector.
Finally, stable and resilient capital markets,
supported by productive processes o
investment and nancial intermediation, will
have a pivotal role in the provision o capital
at sucient scale or the delivery o a green
economy. It is clear that across banking, investment
and insurance – the core activities o the nancial system
– signicant changes in philosophy, culture, strategy
and approach, notably the overwhelming dominance
o short-termism, will be required i capital and nance
is to be reallocated to accelerate the emergence o
a green economy. At the same time, undamental
aspects o international accounting systems and capital
market disciplines, as well as our understanding o
duciary responsibility in investment policy-making and
investment decision-making, will need to evolve to ully
integrate a broader range o ESG actors than takes place
at present. Without these changes, the pricing signals and
incentives that would support the transition to a green
economy will remain weak.
Towards a Green Economy
8/7/2019 Green Economy Report - Synthesis Report
http://slidepdf.com/reader/full/green-economy-report-synthesis-report 45/52
37 - 38
e c o
GRE E N
n om
y
C on cl u s i o
n s
ConclusionsMoving towards a green economy has the potentialto achieve sustainable development and povertyeradication on a scale and at a speed not seen beore.
This potential derives, essentially, rom a changedplaying eld: our world, and the risks we ace, havematerially changed, and require a undamental
rethinking o our approach to the economy.
As this report has argued, a reallocation o public andprivate investments – spurred through appropriatepolicy reorms and enabling conditions – is neededto build up or enhance natural capital such as orests,water, soil and sh stocks, which are particularlyimportant or the rural poor. These “green” investmentswill also enhance new sectors and technologies thatwill be the main sources o economic development and
growth o the uture: renewable energy technologies,resource and energy ecient buildings and equipment,low-carbon public transport systems, inrastructureor uel ecient and clean energy vehicles, and waste
management and recycling acilities. Complementaryinvestments are required in human capital, includinggreening-related knowledge, management, andtechnical skills to ensure a smooth transition to a moresustainable development pathway.
One o the major ndings o this report is that a greeneconomy supports growth, income and jobs, and thatthe so-called “trade-o” between economic progressand environmental sustainability is a myth, especiallyi one measures wealth inclusive o natural assets,and not just narrowly as produced output. The resultso the report indicate that while in the short term
economic growth under a “green” scenario may be lessthan under business as usual, in the longer term (2020and beyond), moving towards a green economy would
outperorm business as usual by both traditionalmeasures and more holistic measures.
The report also nds that in a number o important sectors,such as agriculture, buildings, orestry and transport,a green economy delivers more jobs throughout theshort, medium, and long terms than business as usual.In sectors whose capital is severely depleted, such assheries, greening will necessitate the loss o income
and jobs in the short and medium term to replenishnatural stocks, but this is to prevent the permanent loss
o income and jobs in these same sectors. In such cases,transitional arrangements are needed to protect workersrom negative impacts on their livelihoods.
Although the bulk o the investments required orthe green transormation will come rom the privatesector, public policy will also have a leading role
to play in overcoming distortions introduced byperverse subsidies and externalized costs. And publicinvestment will be required to jump-start an eectivetransition to a green economy.
While private capital is many times more than the
nancial resources available rom the public sector,many developing countries have limited access to it. Alarge part o the unds needed or green investmentsat scale in the initial stages o the transition towardsa green economy, thereore, need to come rom newinnovative nancing mechanisms. In this regard, thenew Green Climate Fund and nascent REDD+ unding
mechanisms oer signicant hope or achieving thenance required at scale or an eective green economytransition. Where national budgetary conditions arelimited, multilateral development banks are ideallypositioned to oer nancial assistance to enable thesecountries to embark on a green development trajectory.
In summary, a green economy values and investsin natural capital. Ecosystem services are betterconserved, leading to improved saety nets and
household incomes or poor rural communities.Ecologically riendly arming methods improveyields signicantly or subsistence armers. Andimprovements in reshwater access and sanitation,and innovations or non-grid energy (solar electricity,biomass stoves, etc) add to the suite o green economystrategies, which can help alleviate poverty.
A green economy substitutes clean energy and low-carbon technologies or ossil uels, addressing climate
change but also creating decent jobs and reducingimport dependencies. New technologies promotingenergy and resource eciency provide growthopportunity in new directions, osetting “browneconomy” job losses. Resource eciency becomesa driving proposition – both energy and materialsuse – be it in better waste management, more publictransportation, green buildings or less waste along theood chain.
Regulations, standards and targets are important toprovide direction. However, developing countries mustbe allowed to move at their own speed, respectingtheir development objectives, circumstances and
constraints. Developed nations have a key role toplay in building skills and capacity in developingcountries, and in creating international market andlegal inrastructure or a green economy.
Enabling conditions have to be managed andadequate nance provided or successul transitioning

8/7/2019 Green Economy Report - Synthesis Report
http://slidepdf.com/reader/full/green-economy-report-synthesis-report 46/52
to a green economy, but both are eminently achievable.
Environmentally and socially harmul subsidies are a
deterrent, and they should be phased out. In select
circumstances and over dened periods however, rational
use o subsidies can acilitate the transition to a green
economy. Taxes and other market-based instruments
can be used to stimulate the necessary investment and
innovation or unding the transition. And while the scale o
nancing required or a green economy transition is large,
it can be mobilized by smart public policy and innovative
nancing mechanisms.
A green economy can generate as much growth and
employment as a brown economy, and outperorms
the latter in the medium and long run, while yielding
signicantly more environmental and social benets. O
course, there are many risks and challenges along the
way. Moving towards a green economy will require world
leaders, civil society and leading businesses to engage in
this transition collaboratively. It will require a sustained
eort on the part o policy makers and their constituents
to rethink and redene traditional measures o wealth,
prosperity and well-being. However, the biggest risk o all
may be remaining with the status quo.
Towards a Green Economy
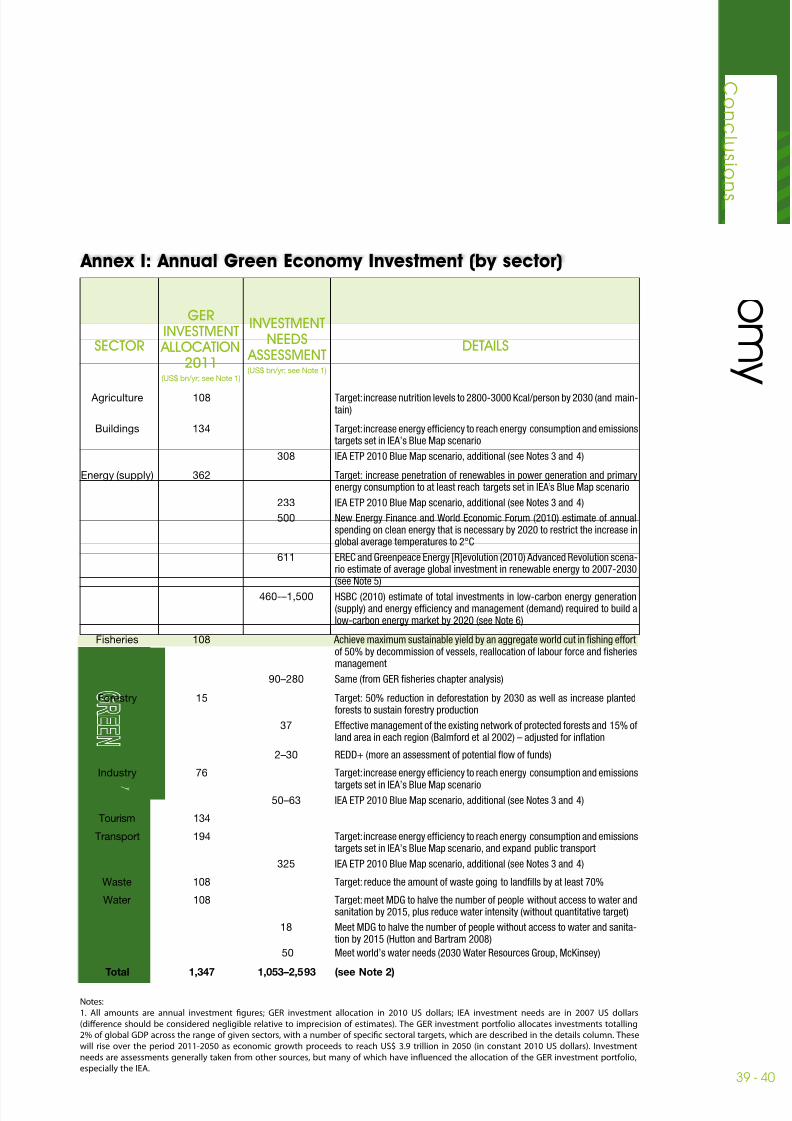
8/7/2019 Green Economy Report - Synthesis Report
http://slidepdf.com/reader/full/green-economy-report-synthesis-report 47/52
39 - 40
e c o
GRE E N
n om
y
C on cl u s i o
n s
Annex I: Annual Green Economy Investment (by sector)
SECTOR
GERINVESTMENT
ALLOCATION2011
(US$ bn/yr; see Note 1)
INVESTMENTNEEDS
ASSESSMENT(US$ bn/yr; see Note 1)
DETAILS
Agriculture 108
Buildings 134
308
Target: increase nutrition levels to 2800-3000 Kcal/person by 2030 (and main-tain)
Target: increase energy eciency to reach energy consumption and emissionstargets set in IEA’s Blue Map scenario
IEA ETP 2010 Blue Map scenario, additional (see Notes 3 and 4)
Energy (supply) 362 Target: increase penetration o renewables in power generation and primaryenergy consumption to at least reach targets set in IEA’s Blue Map scenario
233 IEA ETP 2010 Blue Map scenario, additional (see Notes 3 and 4)
500 New Energy Finance and World Economic Forum (2010) estimate o annualspending on clean energy that is necessary by 2020 to restrict the increase inglobal average temperatures to 2°C
611 EREC and Greenpeace Energy [R]evolution (2010) Advanced Revolution scena-rio estimate o average global investment in renewable energy to 2007-2030(see Note 5)
460-–1,500 HSBC (2010) estimate o total investments in low-carbon energy generation(supply) and energy eciency and management (demand) required to build alow-carbon energy market by 2020 (see Note 6)
Fisheries 108 Achieve maximum sustainable yield by an aggregate world cut in shing eorto 50% by decommission o vessels, reallocation o labour orce and sheriesmanagement
90–280 Same (rom GER sheries chapter analysis)
Forestry 15 Target: 50% reduction in deorestation by 2030 as well as increase plantedorests to sustain orestry production
37 Eective management o the existing network o protected orests and 15% oland area in each region (Balmord et al 2002) – adjusted or infation
2–30 REDD+ (more an assessment o potential fow o unds)
Industry 76 Target: increase energy eciency to reach energy consumption and emissions
targets set in IEA’s Blue Map scenario50–63 IEA ETP 2010 Blue Map scenario, additional (see Notes 3 and 4)
Tourism 134
Transport 194 Target: increase energy eciency to reach energy consumption and emissionstargets set in IEA’s Blue Map scenario, and expand public transport
325 IEA ETP 2010 Blue Map scenario, additional (see Notes 3 and 4)
Waste 108 Target: reduce the amount o waste going to landlls by at least 70%
Water 108 Target: meet MDG to halve the number o people without access to water andsanitation by 2015, plus reduce water intensity (without quantitative target)
18 Meet MDG to halve the number o people without access to water and sanita-tion by 2015 (Hutton and Bartram 2008)
50 Meet world’s water needs (2030 Water Resources Group, McKinsey)
Total 1,347 1,053–2,593 (see Note 2)
Notes:
1. All amounts are annual investment gures; GER investment allocation in 2010 US dollars; IEA investment needs are in 2007 US dollars
(dierence should be considered negligible relative to imprecision o estimates). The GER investment portolio allocates investments totalling2% o global GDP across the range o given sectors, with a number o specic sectoral targets, which are described in the details column. These
will rise over the period 2011-2050 as economic growth proceeds to reach US$ 3.9 trillion in 2050 (in constant 2010 US dollars). Investment
needs are assessments generally taken rom other sources, but many o which have infuenced the allocation o the GER investment portolio,especially the IEA.

8/7/2019 Green Economy Report - Synthesis Report
http://slidepdf.com/reader/full/green-economy-report-synthesis-report 48/52
2. For the investment assessment under the right-hand column, the range o total investments corresponds to the sums o low and high estimates per
sector.
3. Most IEA gures are simple average o estimated total investment over 2010-2050; it appears though that lower investments are projected or earlier
years, and higher gures or later years.
4. The gures or the IEA Energy Technology Perspectives (2010) Blue Map Scenario represent only the additional investment, totalling an average o
US$ 1.15 trillion per year, and do not include the projected investments or the reerence scenario, which involves investments to meet increased energydemand through a continuation o existing investment trends.
5. The European Renewable Energy Council and Greenpeace’s Advanced [R]evolution scenario has a key target or the reduction o CO 2 emissions down
to a level o around 10 Gt per year by 2050, and a second objective o phasing out o nuclear energy. The [R]evolution scenario has similar targets, but
assumes a technical lietime o 40 years or coal-red power plants, instead o 20 years; the estimated average global investment needed or this scenario
is US$ 450 billion.168
6. These estimates are or HSBC’s Conviction scenario, which projects «the most likely pathway to 2020».It sees the EU meeting renewable targets but not
energy eciency targets, limited growth in clean energy in the US, and China exceeding current clean energy targets. This scenario does not correspond
to any specic climate policy target. In addition to supply o low-carbon energy, this estimate also includes energy eciency investments that would be
undertaken in transport, buildings and industry sectors. In terms o the breakdown, HSBC estimates that US$ 2.9 trillion will be required between 2010
and 2020 in total or low-carbon energy supply and US$ 6.9 trillion or energy eciency and management.
168. Energy [R]evolution: A Sustainable World Energy Outlook, 3rd Edition, European Renewable Energy Council and Greenpeace (2010).
Towards a Green Economy
8/7/2019 Green Economy Report - Synthesis Report
http://slidepdf.com/reader/full/green-economy-report-synthesis-report 49/52
41 - 42
e c o
GRE E N
n om
y
C on cl u s i o
n s
Annex II: The Threshold 21 (T21) Model169
The T21 model was developed to analyse strategiesor medium to long-term development andpoverty reduction, most oten at the national level,complementing other tools or analysing short-termimpacts o policies and programmes. The model isparticularly suited to analysing the impacts o investment
plans, covering both public and private commitments. The global version o T21 used or purposes o the GERmodels the world economy as a whole to capture thekey relationships between production and key naturalresource stocks at an aggregate level.
The T21 model refects the dependence o economicproduction on the “traditional” inputs o labour andphysical capital, as well as stocks o natural capital in theorm o resources, such as energy, orest land, soil, sh
and water. Growth is thus driven by the accumulation o capital – whether physical, human or natural – throughinvestment, also taking into account depreciation ordepletion o capital stocks. The model is calibrated to
reproduce the past 40-year period o 1970-2010, andsimulations are conducted over the next 40-year period,2010-2050. Business as usual projections are veriedagainst standard projections rom other organizations,
such as the United Nations Population Division, WorldBank, OECD, IEA, and FAO.
The inclusion o natural resources as a actor o production distinguishes T21 rom essentially all otherglobal macroeconomic models.170 Examples o the direct
dependence o output (GDP) on natural resources arethe availability o sh and orest stocks or the sheriesand orestry sectors, as well as the availability o ossiluels to power the capital needed to catch sh andharvest timber, among others. Other natural resourcesand resource eciency actors aecting GDP includewater stress, waste recycle and reuse, and energy prices.
In purposely ignoring issues such as trade and sourceso investment nancing (public vs private, or domesticvs oreign), the analysis with T21 o the potential impactso a green investment scenario at a global level are notintended to represent the possibilities or any speciccountry or region. Instead, the simulations are meant
to stimulate urther consideration and more detailedanalysis by governments and other stakeholders o ashit to a green economy.
169. This section draws rom the modelling chapter authored by Andrea Bassi o the Millennium Institute.
170. A recent review o macroeconomic models by Cambridge Econometrics (2010) highlights this general deciency. Pollitt, et al. A Scoping Study on the Macroeconomic View o Sustainability. Finalreport or the European Commission, DG Environment, Cambridge Econometrics and Sustainable Europe Research Institute (July 2010), http://ec.europa.eu/environment/enveco/studies_
modelling/pd/sustainability_macroeconomic.pd.

8/7/2019 Green Economy Report - Synthesis Report
http://slidepdf.com/reader/full/green-economy-report-synthesis-report 50/52
Annex III: Impacts o Allocating an Additional 2% o GDP towardsGreening the Global Economy Relative to 2% in Business as usual
2011 2015 2020 2030 2050
GDP (US$, real)
GDP per capita
Total employment (millions)
Calories per capita
Forest land (Bn ha)
Water demand (km3/Yr)
Total landll (Bn tons)
Footprint/biocapacity ratio
Primary energydemand (Mtoe/Yr)
Renewable energy shareo primary demand (%)
69,344
9,992
3,187
2,787
3.94
4,864
7.88
1.51
12,549
13
79,306
10,959
3,419
2,857
3.92
5,275
8.40
1.60
13,674
13
-0.8
-0.8
0.6
0.3
1.4
-3.7
-4.9
-7.5
-3.1
15
92,583
12,205
3,722
2,946
3.89
5,792
9.02
1.68
15,086
13
-0.4
-0.4
-0.6
0.3
3.2
-7.2
-15.1
-12.5
-9.1
17
119,307
14,577
4,204
3,050
3.83
6,784
10.23
1.84
17,755
12
2.7
2.4
-1.5
1.4
7.9
-13.2
-38.3
-21.5
-19.6
19
172,049
19,476
4,836
3,273
3.71
8,434
12.29
2.23
21,687
12
15.7
13.9
0.6
3.4
21.0
-21.6
-87.2
-47.9
-39.8
27
BAU2Green
(%)BAU2
Green(%)
BAU2Green
(%)BAU2
Green(%)
Notes: All dollar gures are in constant 2010 US dollars. “Green” column represents the percent dierence (+/-) o the green investment scenario relative tobusiness as usual projections, in which an additional 2% o global GDP is allocated to extend existing investment trends, except or rows where the units are in
percentage terms. In this case the “green” column reers to the percentage value under the green investment scenario. For a ull explanation o the business asusual and green investment scenarios, see the GER modelling chapter.
Towards a Green Economy
8/7/2019 Green Economy Report - Synthesis Report
http://slidepdf.com/reader/full/green-economy-report-synthesis-report 51/52
43 - 44
e c o
GRE E N
n om
y
C on cl u s i o
n s
8/7/2019 Green Economy Report - Synthesis Report
http://slidepdf.com/reader/full/green-economy-report-synthesis-report 52/52
www.unep.orgUnited Nations Environment Programme
P.O. Box 30552 Nairobi, 00100 Kenya
Tel: (254 20) 7621234
Fax: (254 20) 7623927
E-mail: [email protected]
web: www.unep.org
Related Documents