Vivek Polshettiwar Nanocatalysis Laboratory, Department of Chemical Sciences, Tata Institute of Fundamental Research (TIFR), Mumbai, India. http://www.nanocat.co.in, Email: [email protected] Green Chemistry by Nanocatalysis Fibrous Nano-Silica (KCC-1) Based Catalysts 1

Welcome message from author
This document is posted to help you gain knowledge. Please leave a comment to let me know what you think about it! Share it to your friends and learn new things together.
Transcript

Vivek Polshettiwar
Nanocatalysis Laboratory, Department of Chemical Sciences,Tata Institute of Fundamental Research (TIFR), Mumbai, India.
http://www.nanocat.co.in, Email: [email protected]
Green Chemistry by Nanocatalysis
Fibrous Nano-Silica (KCC-1) Based Catalysts
1

Current Challenges
Catalysis for Energy:1. Improvement in catalytic processes that will increase resources and energy
utilization efficiencies.
2. Green and sustainable utilization of coal and bio-mass.
3. Efficient photocatalysis for water splitting.
4. Carbon dioxide capture, storage and conversion.
Catalysis for Environment:1. Cleaning up emissions, such as VOC, ozone, pesticides, air & water pollution.
2. Development of green catalytic processes, using alternative energy, water asa solvent etc .
Ways to go: Novel Catalytic Materials1. High selectivity (atom economy).
2. Use of cheap and abundant metals.2

3
J. Am. Chem. Soc. 2011, 133, 12881
Artificial Trees

Nano-Catalysts
4
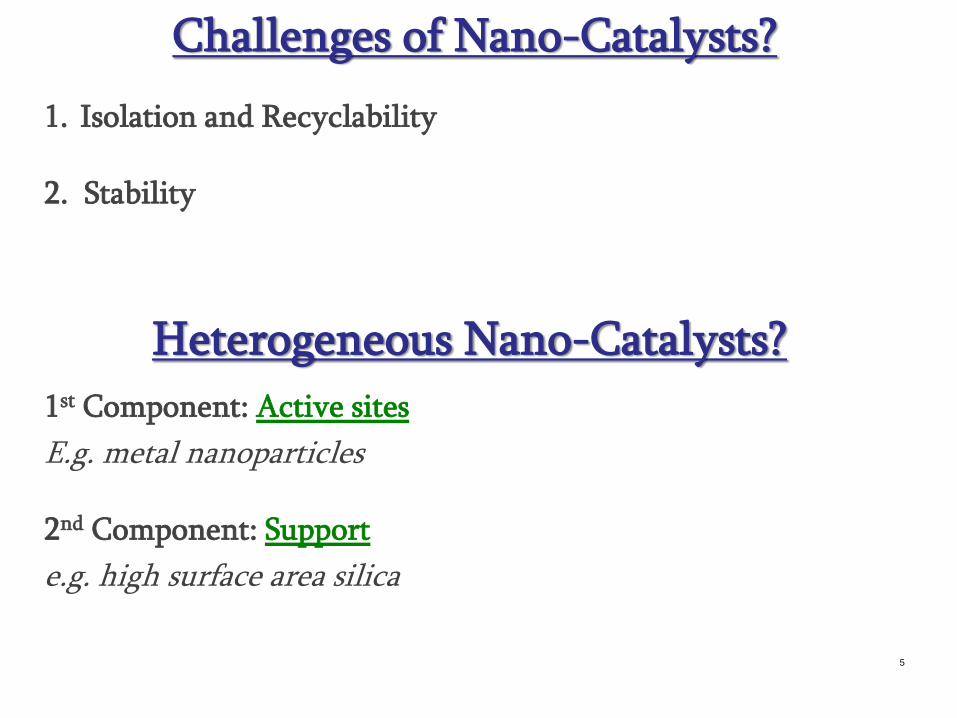
Challenges of Nano-Catalysts?
1st Component: Active sites
E.g. metal nanoparticles
2nd Component: Support
e.g. high surface area silica
Heterogeneous Nano-Catalysts?
1. Isolation and Recyclability
2. Stability
5

High Surface Area of Silica is mostly due to the Pores and therefore NOT always accessible.
Conventional Silica Fibrous Nano-Silica
6
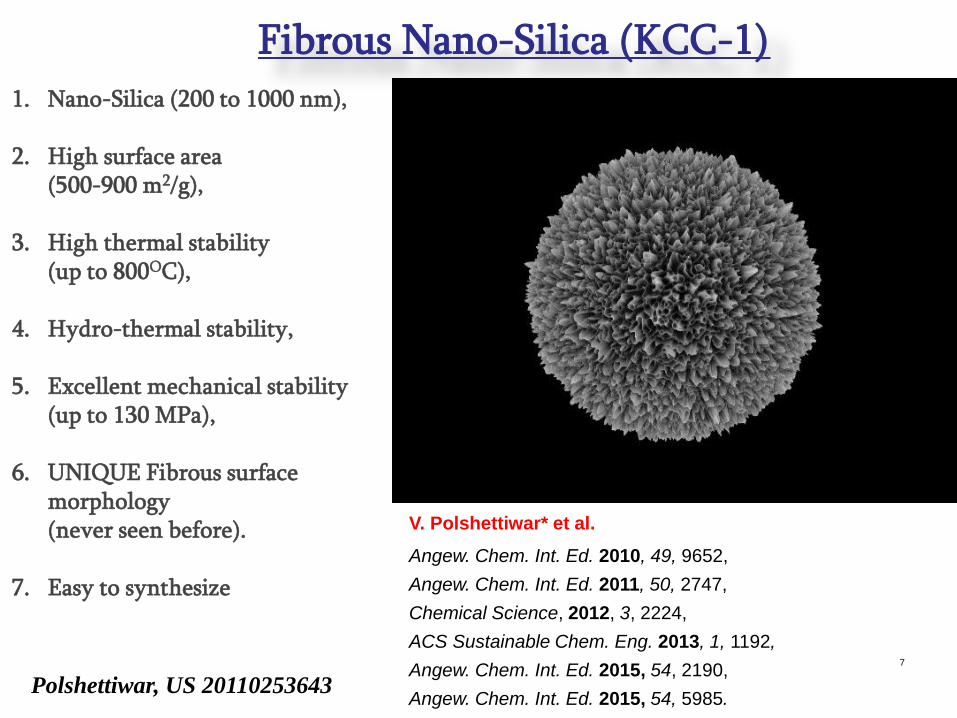
Fibrous Nano-Silica (KCC-1)
V. Polshettiwar* et al.
Angew. Chem. Int. Ed. 2010, 49, 9652,
Angew. Chem. Int. Ed. 2011, 50, 2747,
Chemical Science, 2012, 3, 2224,
ACS Sustainable Chem. Eng. 2013, 1, 1192,
Angew. Chem. Int. Ed. 2015, 54, 2190,
Angew. Chem. Int. Ed. 2015, 54, 5985.
7
1. Nano-Silica (200 to 1000 nm),
2. High surface area (500-900 m2/g),
3. High thermal stability (up to 800OC),
4. Hydro-thermal stability,
5. Excellent mechanical stability (up to 130 MPa),
6. UNIQUE Fibrous surface morphology (never seen before).
7. Easy to synthesize
Polshettiwar, US 20110253643

2 µm
SEM images of KCC-1
Polshettiwar et al. Angew. Chem. Int. Ed. 2010, 49, 9652.
300 nm
50 nm 8

TEM images of KCC-1
200 nm 100 nm
50 nm 20 nm
9

3D-Tomography of Silica Nanospheres
Polshettiwar et al. Angew. Chem. Int. Ed. 2010, 49, 9652.
10

Proposed Mechanism of KCC-1 Formation
11
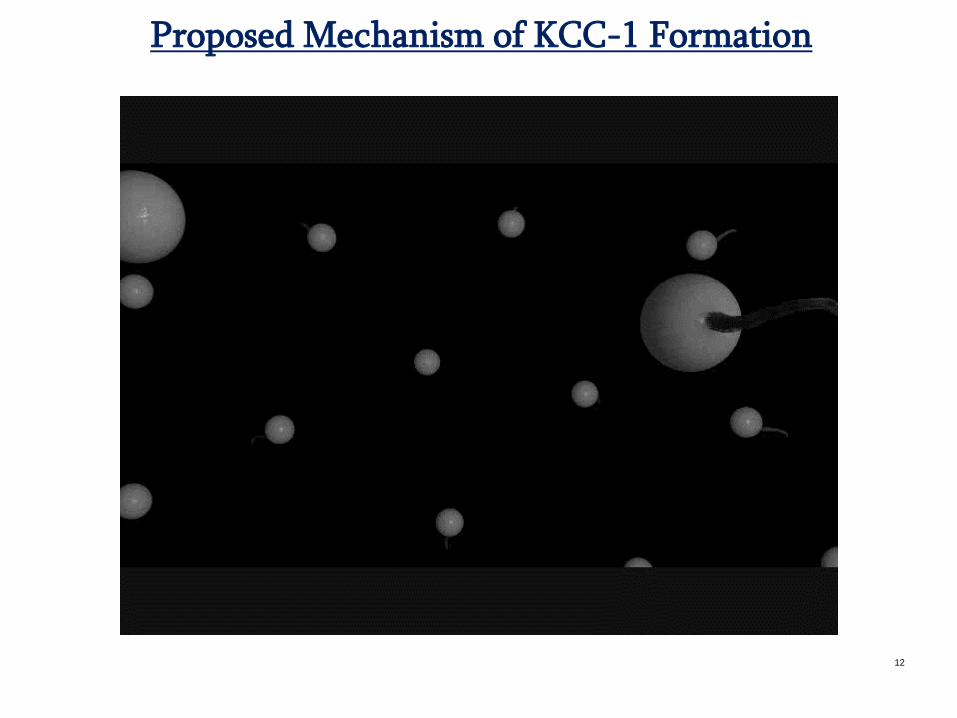
Proposed Mechanism of KCC-1 Formation
12

Size and Fiber Density Controlled KCC-1
13

CO2 Capture
Chromatography
Drug Delivery
Paints
Possible Applications of KCC-1
Cosmetics14
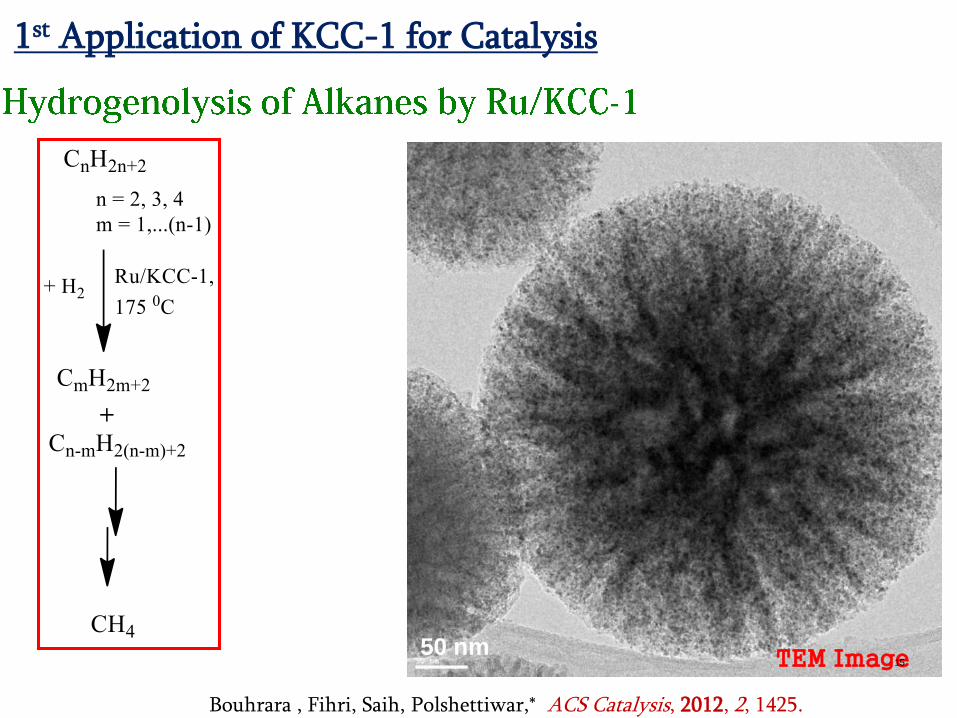
KAUST Catalysis Center (KCC)1st Application of KCC-1 for Catalysis
TEM Image
Bouhrara , Fihri, Saih, Polshettiwar,* ACS Catalysis, 2012, 2, 1425.
50 nm15

Synthesis of Ru/KCC-1:
5 nm
16

Hydrogenolysis of Propane:
“TON was greater than 13,000 and Even after 200 h, no change in
conversion or selectivity was observed, and the catalyst worked
as efficiently as like a fresh catalyst during this period”
Bouhrara , Fihri, Saih, Polshettiwar,* ACS Catalysis, 2012, 2, 1425.
17

Comparison ( )
“KCC-1/Ru has TON (11010), which is nearly double than SBA-
15/Ru (7210) and nearly triple than MCM-41 (3927). Also, it
showed better stability compare to SBA-15 or MCM-41 system.”
Catalysts Reaction
Temperature
Conversion
(%)
Selectivity
for CH4
Selectivity
for C2H6
TON after
7 days
KCC-1/Ru
175 ºC
84
73
27
11010
SBA-15/Ru
175 ºC
77
73
27
7210
MCM-41/Ru
175 ºC
25
86
14
3927
Bouhrara , Fihri, Saih, Polshettiwar,* ACS Catalysis, 2012, 2, 1425.
18
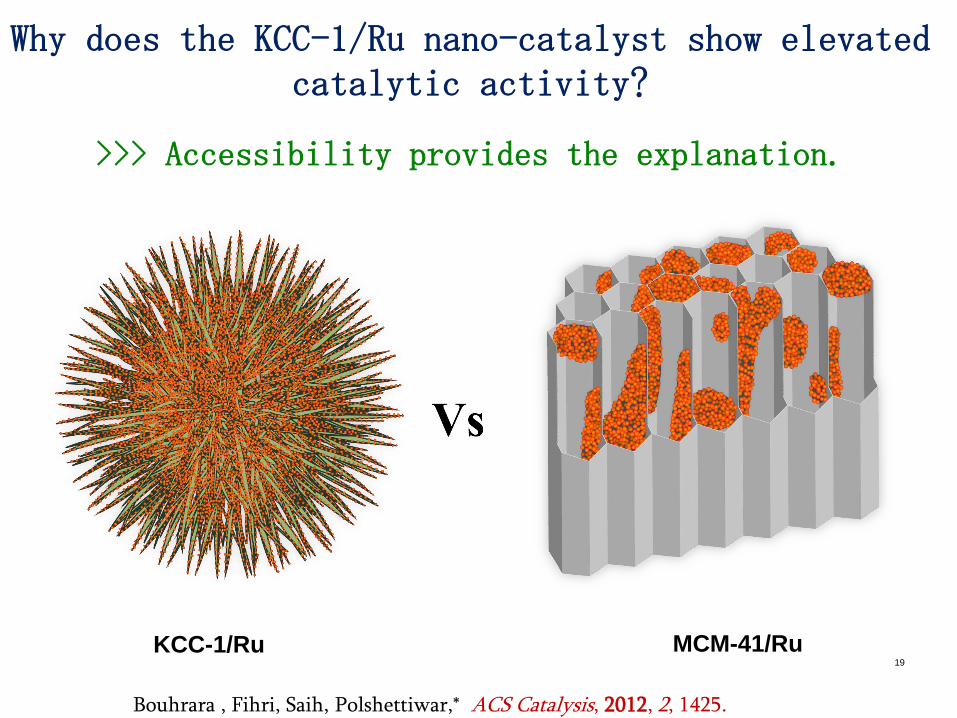
Why does the KCC-1/Ru nano-catalyst show elevated catalytic activity?
>>> Accessibility provides the explanation.
KCC-1/Ru MCM-41/Ru
Bouhrara , Fihri, Saih, Polshettiwar,* ACS Catalysis, 2012, 2, 1425.
19

Why does the KCC-1/Ru nano-catalyst show elevated catalytic activity?
>>> Nanoparticle shape provides the explanation.
“Hexagonal nanoparticles contain several corners and sharp edges and the metal atoms at these
sites possess the lowest coordination numbers. More reactive metal atoms at the edges and
corners enhances the activity”
20

Why the KCC-1/Ru nano-catalyst does not deactivate even after several reactions? >>> Restricted sintering provides the
explanation.
Before Reaction After Reaction
21
KAUST Catalysis Center (KCC)
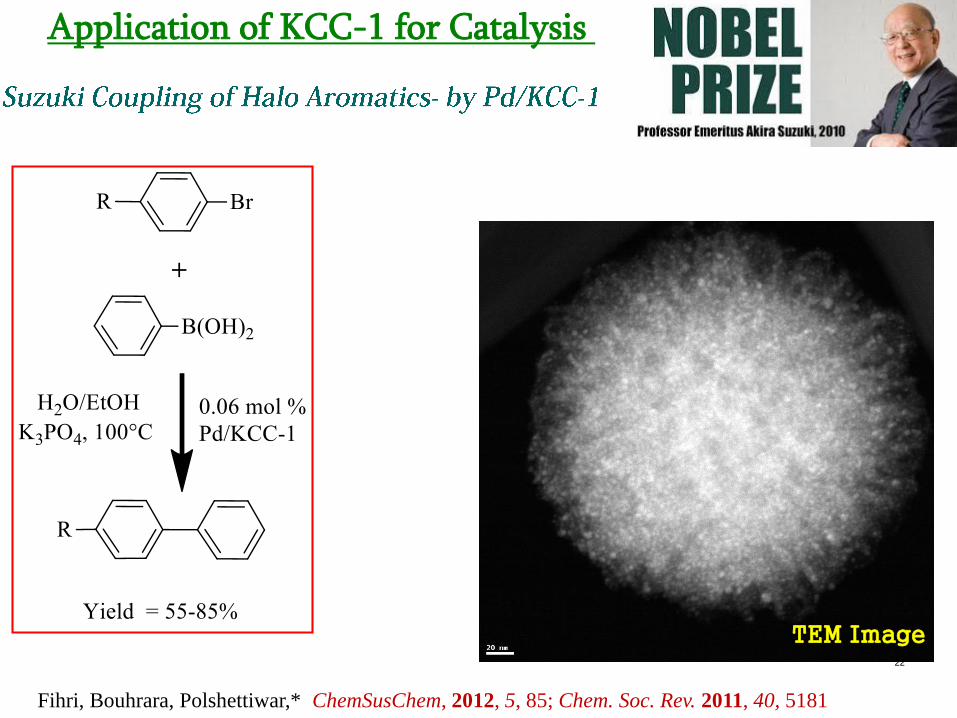
Fihri, Bouhrara, Polshettiwar,* ChemSusChem, 2012, 5, 85; Chem. Soc. Rev. 2011, 40, 5181
Application of KCC-1 for Catalysis
TEM Image22
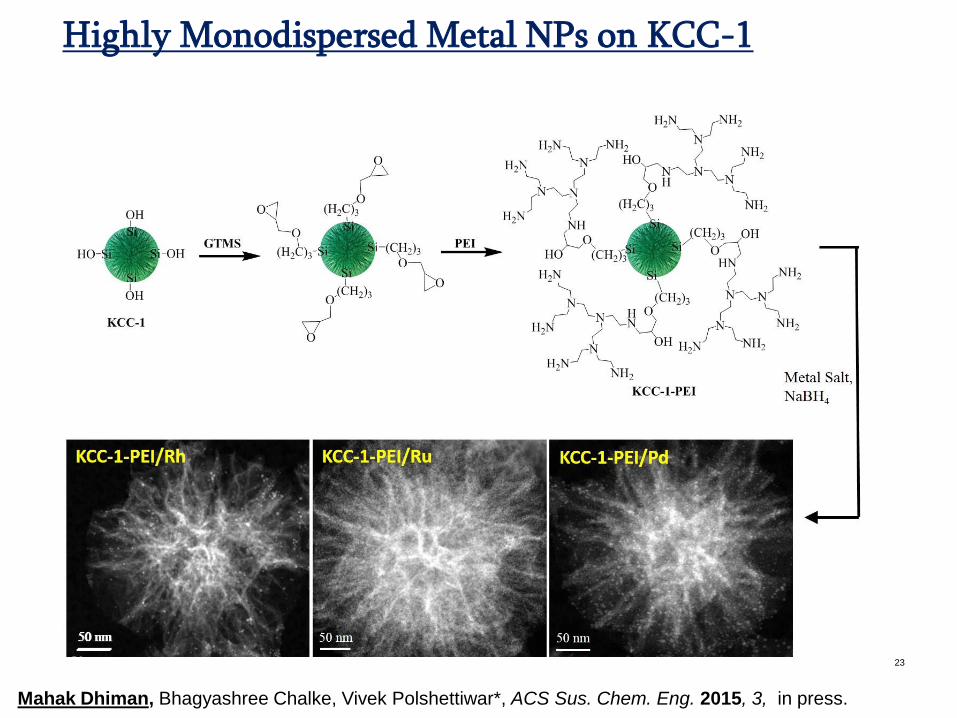
Highly Monodispersed Metal NPs on KCC-1
Polshettiwar et al. Angew. Chem. Int. Ed. 2010, 49, 9652.
23
Mahak Dhiman, Bhagyashree Chalke, Vivek Polshettiwar*, ACS Sus. Chem. Eng. 2015, 3, in press.
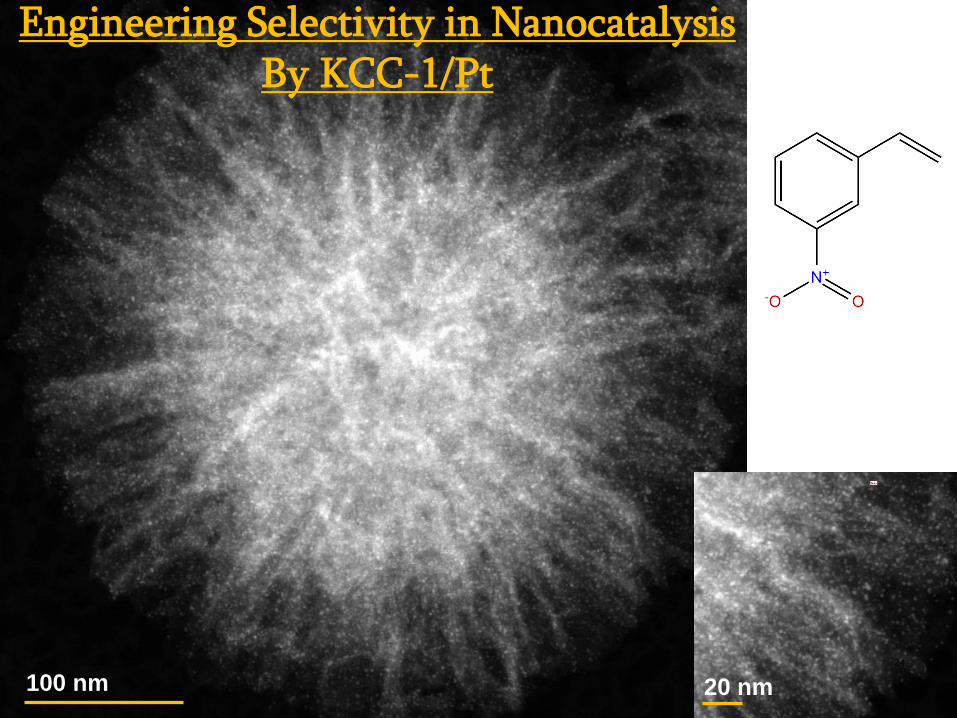
100 nm
Engineering Selectivity in NanocatalysisBy KCC-1/Pt
20 nm
24

100 nm
Pseudo Single Atom Catalysis by KCC-1/Au
20 nm
25
Acetalization
Reaction
with
TON of 40000

KAUST Catalysis Center (KCC)
V. Polshettiwar* et al
Angew. Chem. Int. Ed. 2011, 50, 2747.
TON 800 in 60hr
Application of KCC-1 for Catalysis - ORGANOMETALLIC
26
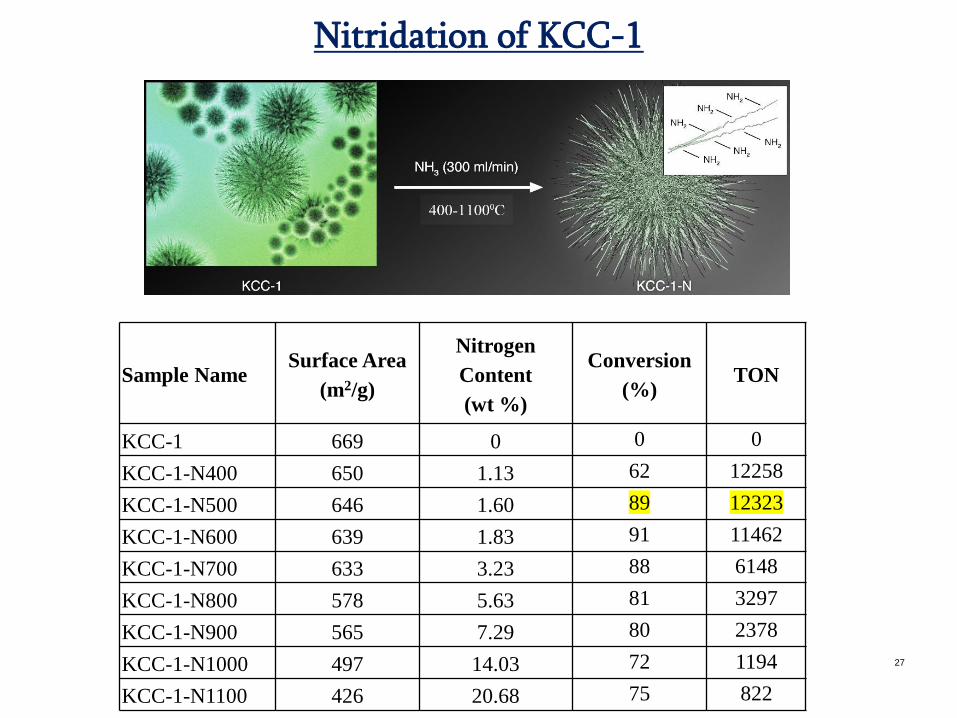
KAUST Catalysis Center (KCC)Nitridation of KCC-1
Sample NameSurface Area
(m2/g)
Nitrogen
Content
(wt %)
Conversion
(%)TON
KCC-1 669 0 0 0
KCC-1-N400 650 1.13 62 12258
KCC-1-N500 646 1.60 89 12323
KCC-1-N600 639 1.83 91 11462
KCC-1-N700 633 3.23 88 6148
KCC-1-N800 578 5.63 81 3297
KCC-1-N900 565 7.29 80 2378
KCC-1-N1000 497 14.03 72 1194
KCC-1-N1100 426 20.68 75 822
27

Dynamic Nuclear Polarization (DNP) Enhanced 15N NMR
Lafon,* Polshettiwar* et al Angew. Chem. Int. Ed. 2015, 54,2190.
1H→15N CP-MAS of KCC-1-N impregnated with
16 mM bis-TEMPO-bisketal in EtCl4 (KCC-1-N
is moisture sensitive) at 9.4 T and MAS 8 kHz
28
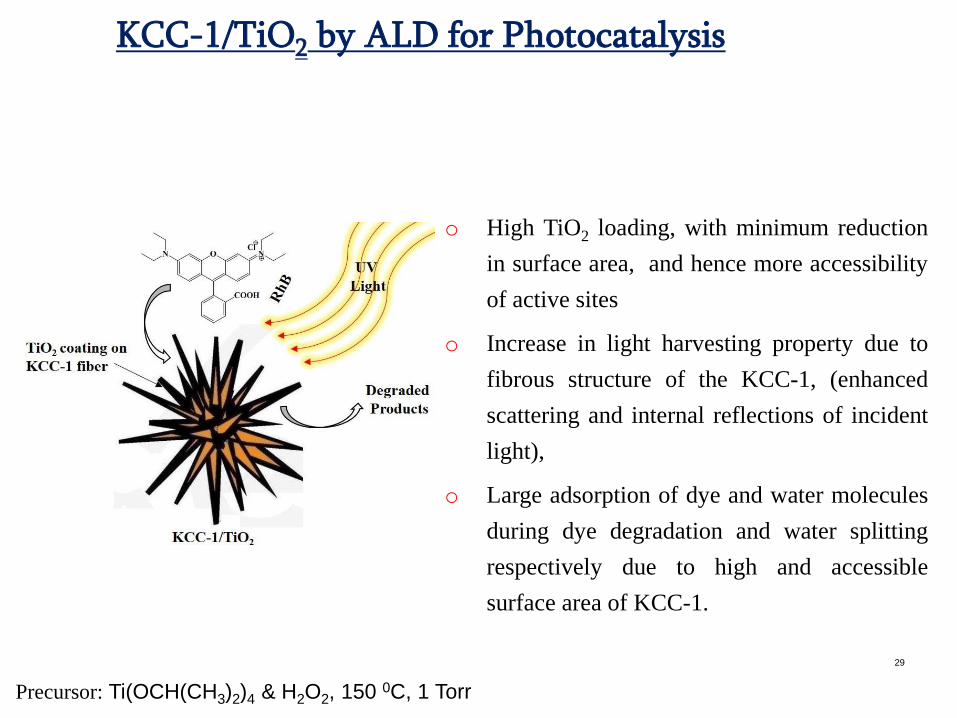
KCC-1/TiO2 by ALD for Photocatalysis
Polshettiwar et al. Angew. Chem. Int. Ed. 2010, 49, 9652.
29
o High TiO2 loading, with minimum reduction
in surface area, and hence more accessibility
of active sites
o Increase in light harvesting property due to
fibrous structure of the KCC-1, (enhanced
scattering and internal reflections of incident
light),
o Large adsorption of dye and water molecules
during dye degradation and water splitting
respectively due to high and accessible
surface area of KCC-1.
Precursor: Ti(OCH(CH3)2)4 & H2O2, 150 0C, 1 Torr

30
Formation mechanism
of TiO2 coated KCC-1
by atomic layer
deposition (ALD)
# 29Si CP-MAS three main
signals at δ = -96, -105 and -
115 ppm, attributed to Q2
[SiO2(OH)2], Q3 [SiO3OH],
and Q4 [SiO4] sites,
respectively.
# From C1 to C30, a decrease
in the ratio of Q3 to Q4
indicates that more Q4 sites
are forming, due to the
formation of more and more
Si-O-Ti bonds.
# 1H MAS-NMR spectrum
shows the signals at δ = 1.2
and 4.1 ppm for surface
silanols and tilanols
respectively
H2O = H2O/H2O2
(Collaborator: Prof. Hao Feng)

31
STEM and EDS mapping of
KCC-1/TiO2 series
Distribution of Ti species by
Energy-dispersive X-ray
spectroscopy (EDS) mapping.
Coating of TiO2 on fibrous
nano-silica KCC-1 was
homogeneous and uniform

TiO2 Loading
32
0 10 20 30 40 50 60
0
10
20
30
40
50
60
70
80
TiO
2 L
oa
din
g (
Wt
%)
No. of ALD cycles
KCC-1
MCM-41
SBA-15
0 10 20 30 40 50 60
0.00
0.02
0.04
0.06
0.08
0.10
0.12
TiO
2 L
oa
din
g/S
urf
ace
Are
a (
Wt
%)
No. of ALD cycles
KCC-1
MCM-41
SBA-15
Catalysts TiO2
loading at
C60 cycles
(Wt %)
BET Surface Area (m2/g)
(standard error ± 4 %)
Reduction
in Surface
Area
Before TiO2
loading
After C60-
TiO2 cycles
(m2/g)
KCC-1/TiO2-C60 57 ± 3 598 222 376
MCM-41/TiO2-C60 39 ± 2 962 421 541
SBA-15/TiO2-C60 63 ± 3 1391 182 1209

33
Bandgap Measurement
o Band gap value decreased from 3.53 eV to 3.28 eV for as-prepared samples from C1 to C60.
o When samples were heated at 700 0C, the band gap decreased as compared to its as-prepared
counterpart, indicating the transformation of amorphous TiO2 to crystalline TiO2.
o We also observed blue shift in the band gap within heated samples from C1 to C60.
Quantum confinement effect?
Nano-particle formation?
C60 to C1-ASP C60 to C1-700(Standard error ± 0.01)
Bandgap measurement using Kubelka-Munk function K = (1-R)2/2R , and Tauc plot (K*hv)1/2 = f(h*v)

34
Nanoparticles Formation after Heat
Treatment
# Heat treatment fragmented the amorphous TiO2
layers and crystalline NPs were formed.
# TiO2 NPs particle size increases with increase in
ALD cycles as well as with increase in heating
temperature.
# Since the particle sizes were very small and they
were highly dispersed, we did not see their
signature peaks in PXRD until C30 cycles

35
Catalysis by KCC-1/TiO2 series
Photocatalytic dye degradation of Rh-B under UV light

36
Catalyst Comparison: KCC-1 vs SBA-15 vs MCM-41
Photocatalytic dye degradation of Rh-B under UV light

37
Catalyst Comparison: KCC-1 vs SBA-15 vs MCM-41
S.No. Catalysts Rate Constant
(min-1)
Reference
1 KCC-1/TiO2-C60-700 0.0684 ± 0.0047 This MS
2 MCM-41/TiO2-C60-700 0.0254 ± 0.0010 This MS
3 SBA-15/TiO2-C60-700 0.0139 ± 0.0001 This MS
4 P25 nano-powder 0.0414 ± 0.0017 This MS
5 Titania films 0.01173J.Photochem. Photobio. A.
Chem 2004, 162, 171
6 SiO2@TiO2 0.00473 J.Photochem. Photobio. A.
Chem 2007, 185, 19
7 Diatomite@TiO2 0.034209App Catal. A Gen 2013, 458,
103
8 Opal@TiO2 0.010437App Catal. A Gen 2013, 458,
103
9 Porous Silica@TiO2 0.012529App Catal. A Gen 2013, 458,
103

38
TOF: KCC-1 vs SBA-15 vs MCM-41
0
100
200
300
400
500
P-2
5
SB
A-1
5/T
iO2-C
60-7
00
MC
M-4
1/T
iO2-C
60-7
00
KC
C-1
/TiO
2-C
60-7
00
TO
F (
min
-1)
x 1
0-7
Catalysts
39
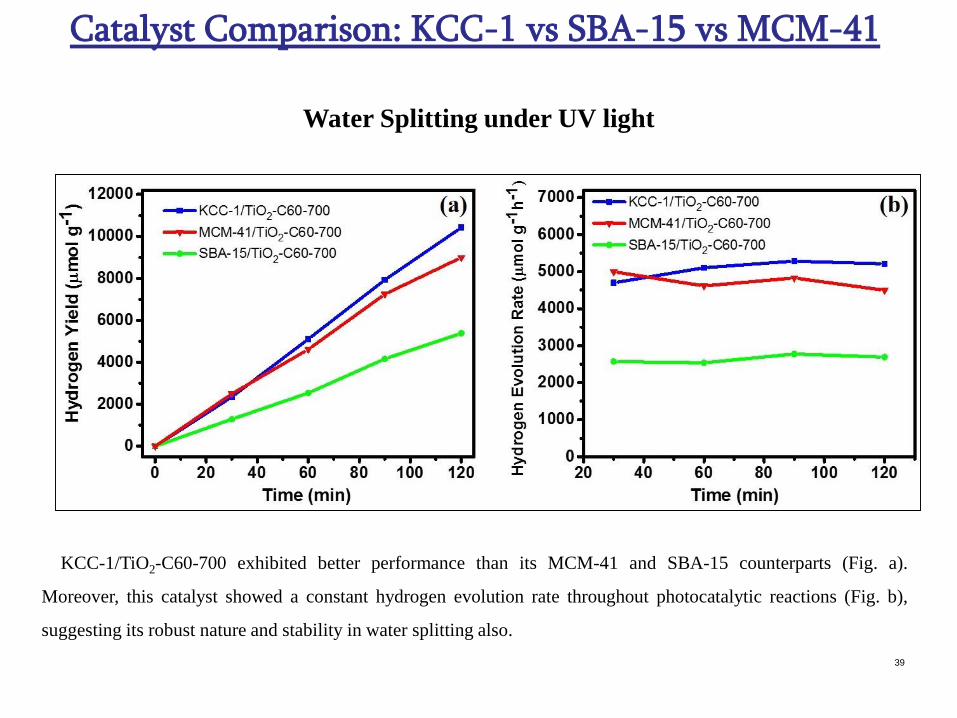
Catalyst Comparison: KCC-1 vs SBA-15 vs MCM-41
Water Splitting under UV light
KCC-1/TiO2-C60-700 exhibited better performance than its MCM-41 and SBA-15 counterparts (Fig. a).
Moreover, this catalyst showed a constant hydrogen evolution rate throughout photocatalytic reactions (Fig. b),
suggesting its robust nature and stability in water splitting also.

Nanomaterials for CO2 Capture
• Capture Good Amount of CO2
• At Moderate Temperature and Atmospheric Pressure
• Faster Kinetics
• Stable and Recyclable
• Selectivity
V. Polshettiwar, et al Chem. Sci., 2012, 3, 4222.
40

V. Polshettiwar, et al Chem. Sci., 2012, 3, 4222.
KCC-1- Silicon Oxynitrides for CO2 capture
Properties KCC1-N700 SBA15-N700 MCM41-N700
Surface Area
(m2 g-1)418 728 935
Pore Volume
(cm3 g-1)
0.65 1.05 0.87
N2 Contents
(%)6.8 7.89 8.38
CO2 Capture Capacity
(mmol g-1)
at 1 bar, 25 °C
1.86 2.22 2.72
% Wt. Loss
up to 800 °C2.90 1.95 3.53
41

1) Good CO2 capture capacity,
2) Faster kinetics,
3) Easy regeneration and efficient reuse,
4) Excellent mechanical strength,
5) High thermal stability,
* Unstable in presence of water/moisture.
V. Polshettiwar, et al Chem. Sci., 2012, 3, 4222.
42

“KCC-1 for DNA Adsorption & Gene Delivery”(Collaborator: Prof. Teddy Asefa, Rutgers, The State University of New Jeresey)
43
Due to their unique dendritic, fibrous, extensive large pore structures, the KCC-1-based
materials are generally found to have higher adsorption capacity for salmon DNA than the
corresponding MCM-41 materials.
KCC-1-based materials are also more effective in transporting and delivering genes in
cellular environments than their MCM-41 counterparts.
Polshettiwar, Asefa* et al. Langmuir, 2014, 30, 10886.
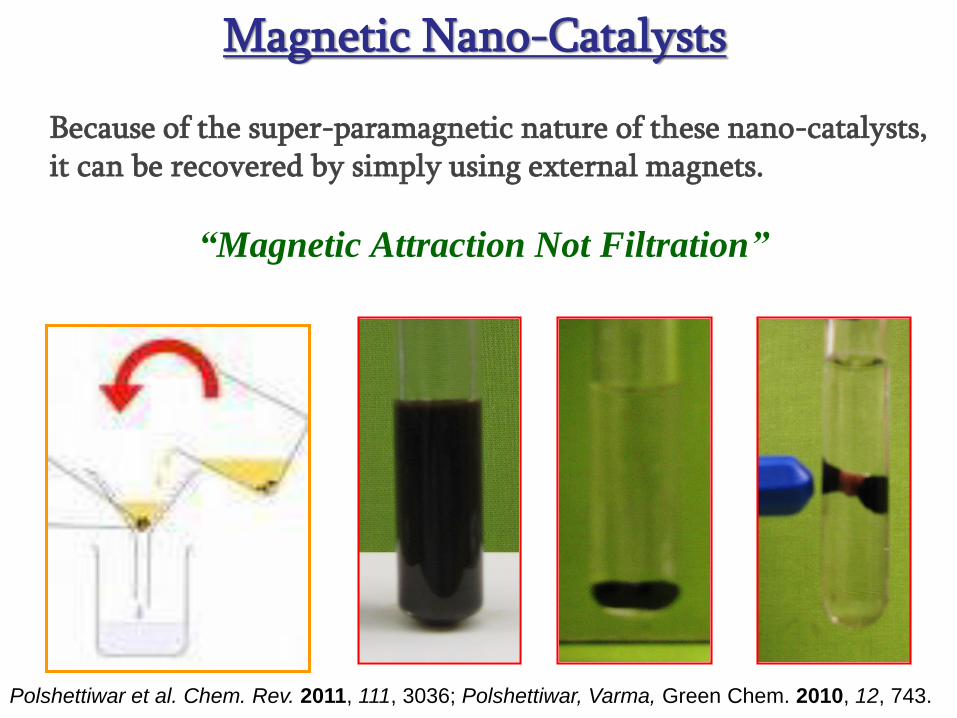
Magnetic Nano-Catalysts
44
Because of the super-paramagnetic nature of these nano-catalysts, it can be recovered by simply using external magnets.
“Magnetic Attraction Not Filtration”
Polshettiwar et al. Chem. Rev. 2011, 111, 3036; Polshettiwar, Varma, Green Chem. 2010, 12, 743.
Not only SIZEbut
SHAPE also makes the difference
45

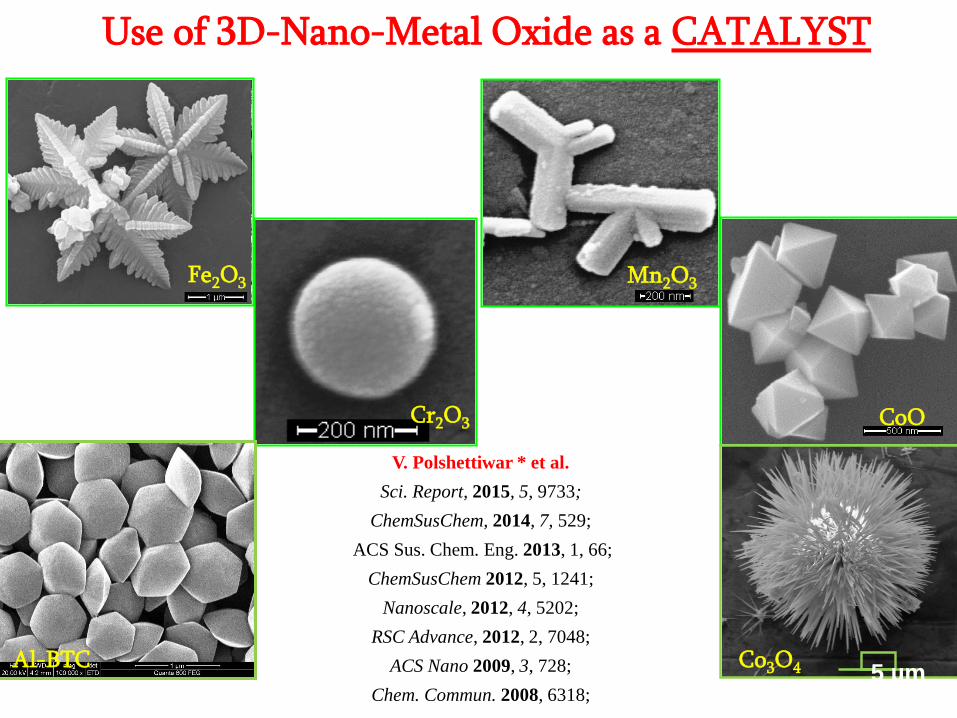
Use of 3D-Nano-Metal Oxide as a CATALYST
Fe2O3
CoO
Mn2O3
Cr2O3
V. Polshettiwar * et al.
Sci. Report, 2015, 5, 9733;
ChemSusChem, 2014, 7, 529;
ACS Sus. Chem. Eng. 2013, 1, 66;
ChemSusChem 2012, 5, 1241;
Nanoscale, 2012, 4, 5202;
RSC Advance, 2012, 2, 7048;
ACS Nano 2009, 3, 728;
Chem. Commun. 2008, 6318; 5 µm
Co3O4Al-BTC

Conclusions
Due to fibrous morphology of KCC-1, increase in the
accessibility of active sites and then the overall catalytic or
capture efficiency was observed.
48
Book on Nanocatalysis
by
WILEY
19 Chapters
by
Reputed Authors(Rossi, Najera, Scott, Ranu,
Cadierno, Kaneda, Shen,
Naraynan, Wang, Clark,
Chang, Kumar, Jagirdar) 49

Acknowledgements
Tata Institute of Fundamental Research and DAE
Dr. Nisha Bayal Mr. Rustam Singh Mr. Baljeet Singh Mr. Mahak Dhiman Mr. Ayan Maity
NanoCat Group Members:
5050
Related Documents