Greater Toronto & Hamilton Area School Travel Household Attitudinal Study

Greater Toronto & Hamilton Area School Travel Household Attitudinal Study.
Dec 30, 2015
Welcome message from author
This document is posted to help you gain knowledge. Please leave a comment to let me know what you think about it! Share it to your friends and learn new things together.
Transcript

Greater Toronto & Hamilton AreaSchool Travel Household Attitudinal Study

2
Methodology overview• A total of 1,001 English interviews were conducted with parents and guardians of the
Greater Toronto and Hamilton Area (GTHA)• Respondents were asked questions about school travel related to their ‘eldest child
attending elementary school’ (i.e. Kindergarten to Grade 8)• The survey was conducted over the course of three weeks, including pretest and
fieldwork (September-October)• Sample was drawn based on Census Division (CD). The table below displays weighted
and unweighted totals and margins of error, by CD
CD POP’N Unweighted TOTAL
Weighted TOTAL
Margin of Error
Hamilton 504,560 251 83 ±6.19
Halton 439,255 75 73 ±11.32
Peel 1,159,405 250 191 ±6.2
Toronto 2,503,285 250 413 ±6.2
York 892,710 100 147 ±9.8
Durham 561,260 75 93 ±11.32
TOTAL 6,060,475 1,001 1,001 ±3.1
• Oversampling was conducted in Hamilton and Peel to ensure adequate representation for analysis
• The final dataset is weighted by the child’s gender and grade, and by CD. Population totals were derived from the 2006 Census
3
GTHA School Travel Household Attitudinal Study Objectives
– Examine current school travel mode split, including: • By area, by grade, by distance• Compare to school versus home from school• Look at threshold distance for walking-driving• Determine main reasons for mode choice• Look at parent school travel mode vs child school travel mode
– Profile: Active Travel, Auto Travel, Carpool Travel– Identify school travel-related issues and concerns– Gauge awareness of school travel programs and infrastructure– Identify potential target market for a shift towards sustainable
and active school travel

4
Respondent ProfileOverall Hamilton Peel
AGE
18-34 19% 27% 25%
35-44 52% 49% 48%
45-54 22% 16% 20%
55 and over 4% 5% 4%
RELATION TO CHILDREN IN HOUSEHOLD
Parent 94% 94% 93%
Other relative 3% 4% 3%
Older sibling 1% - 3%
Step-parent 1% 1% 1%
EMPLOYMENT STATUS
Employed FT 61% 57% 59%
Employed PT 10% 14% 8%
Not Working 22% 24% 25%
Student 2% 3% 4%
HOUSEHOLD INCOME (CAD)
Less than 35 thousand 11% 13% 10%
35 to 65 thousand 19% 17% 24%
65 to 95 thousand 17% 23% 21%
95 to 125 thousand 14% 18% 10%
Over 125 thousand 17% 10% 13%
Overall Hamilton Peel
GENDER
Male 38% 31% 34%
Female 62% 69% 66%
LANGUAGE SPOKEN AT HOME
English 82% 94% 76%
French 4% 3% 4%
Chinese (Mand. or Canton.) 4% - 2%
Urdu 3% 1% 8%
Panjabi/Punjabi 2% - 10%
Other 21% 12% 24%
TIME SPENT WALKING DAILY
15 minutes or less 18% 15% 19%
16 to 30 minutes 35% 31% 39%
31 to 60 minutes 29% 26% 26%
More than 1 hour 12% 26% 14%
Mean (minutes) 48.8 72.8 51.8
# OF CHILDREN IN HOUSEHOLD ATTENDING ELEMENTARY SCHOOL
One 59% 60% 58%
Two 33% 31% 34%
Three or more 8% 8% 8%
Mean (children) 1.5 1.5 1.5

5
Transportation ProfileELDEST CHILD ATTENDING ELEMENTARY SCHOOL
6
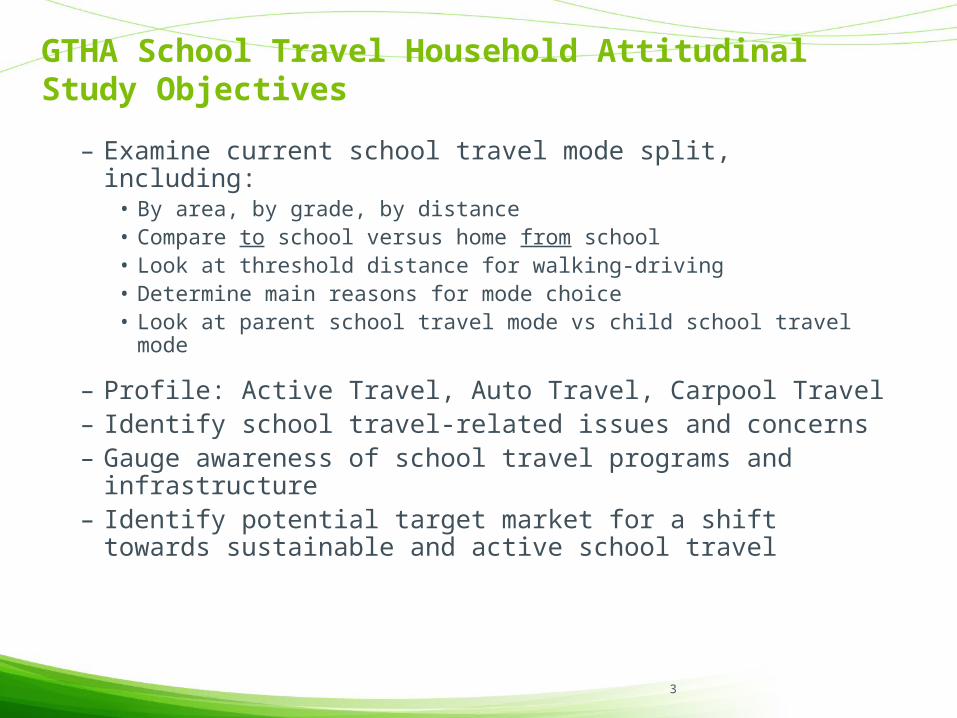
Q1E. How does your child usually travel to school?Q1F. How does your child usually travel home from school?
Q1E. Base: All respondents (N=1,001); Q1F. Base: All respondents (N=1,001)
Mode of travel to and from school
2% 3%1% 1%1% 1%
37%
21%
34%
2%4%
40%
21%
29%
0%
10%
20%
30%
40%
50%
Driven Carpool School Bus Public Transit Walking Cycling Other
To school Home from school
7
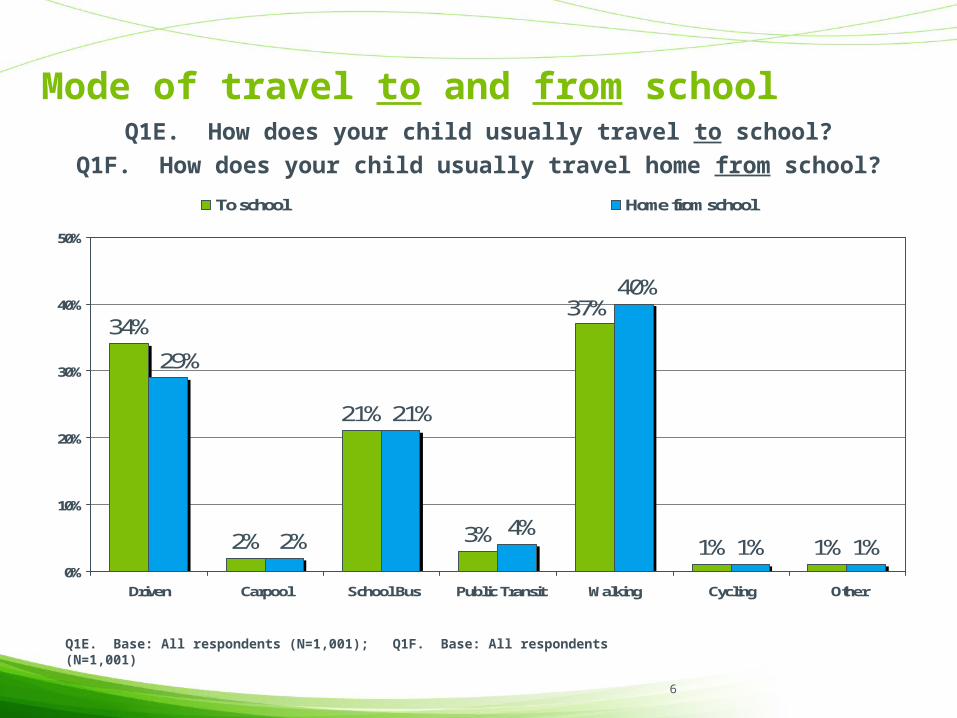
Q1E/Q1F. How does your child usually travel to and home from school?
Q1E. Base: All respondents (N=1,001), ~9% (N=87); Q1F. Base: All respondents (N=1,001), ~9% (N=87)
Differing modes of travel to and from school
• Nine percent of respondents’ children travelled to and from school by different modes. We find a few patterns within this group:
Modes of travel %
Driven to school, walk home 44.0%
Driven to school, ride school bus home 10.7%
Driven to school, ride public transit home 10.2%
Ride school bus to school, driven home 7.1%
Walk to school, driven home 6.1%
Other (collapsed due to sample size; e.g. school bus to school, walk home)
21.8%

8
Q1E. How does your child usually travel to school?
Q1E. Base: All respondents (N=1,001)
Mode of school travel – by grade
46%
28% 30%35%
44%33% 34%
23%
1%
1% 1%
4%1% 2%
5%
16%
34%20%
23%21%
25% 22%
18%
1%
2%
1% 1%
12%
35% 34%43%
36% 34%34% 37% 36%
4%2%
28%36%
2%
19%13%
9%
39%47%
1%1% 1%1% 2%
0%
20%
40%
60%
80%
100%
K4 K5 Grade 1 Grade 2 Grade 3 Grade 4 Grade 5 Grade 6 Grade 7 Grade 8
Driven Carpool School bus Public transit Walk Bike

9
Q1F. How does your child usually travel home from school?
Q1F. Base: All respondents (N=1,001)
Mode of travel home from school – by grade
39%
24% 23%
34% 38% 35%28%
19%
1%
2% 1%
4%
3%
3%
19%
32%
20%
21% 22% 25%24%
18%
1%
2%
4%
13%
40%33%
50%
39% 36% 34% 37%40%
4%2%
38%
16%
3%
12%
20%
13%
1%2%
45% 44%
2%1% 1%1%1%
0%
20%
40%
60%
80%
100%
K4 K5 Grade 1 Grade 2 Grade 3 Grade 4 Grade 5 Grade 6 Grade 7 Grade 8
Driven Carpool School bus Public transit Walk Bike

10
Q1E/Q1F. How does your child usually travel to and home from school?
Q1E/Q1F. Base: All respondents (N=1,001)
Mode of school travel – by distance to school
29%
21%
18%
43%
36%
40%
36%
2%
3%
2%
1%
21%
21%
19%
20%
41%
41%
3%
1%
2%
8%
10%
37%
40%
76%
78%
28%
32%
7%
9%
1%
1%
1%
3%
3%
34%
3%
2%
1%
1%
4%
1%To school
Home from school
To school
Home from school
To school
Home from school
To school
Home from school
Driven Carpool School bus Public transit Walk Bicycle
Overall
Live within 1 km of child’s school
Live between 1 and 2 km of child’s school
Live more than 2 km from child’s school

11
Q1E/Q1F. How does your child usually travel to and home from school?
Q1E/Q1F. Base: All respondents (N=1,001)
Walking to school – threshold distance
28%
76%
7%
9%
78%
32%
96%
63%
17%21%
40%43%
18%
36%36%
0%
20%
40%
60%
80%
100%
<1km 1-2km >2km
Walks to school Walks home from school Close enough to walk Driven to school Driven home from school

12
Q1E/Q1F. How does your child usually travel to and home from school?
Mode of school travel – by area
29%
30%
29%
35%
29%
2%
3%
3%
21%
21%
31%
31%
26%
27%
3%
4%
2%
3%
37%
40%
33%
33%
32%
35%
34% 2%
2%
2%
1%
1%
1%
1%1%
1%
1%
1%
1%
1%
To school
Home from school
To school
Home from school
To school
Home from school
Driven Carpool School bus Public transit Walk Bicycle Other
Q1E/Q1F. Base: All respondents (N=1,001)
Overall
Peel
Hamilton
13
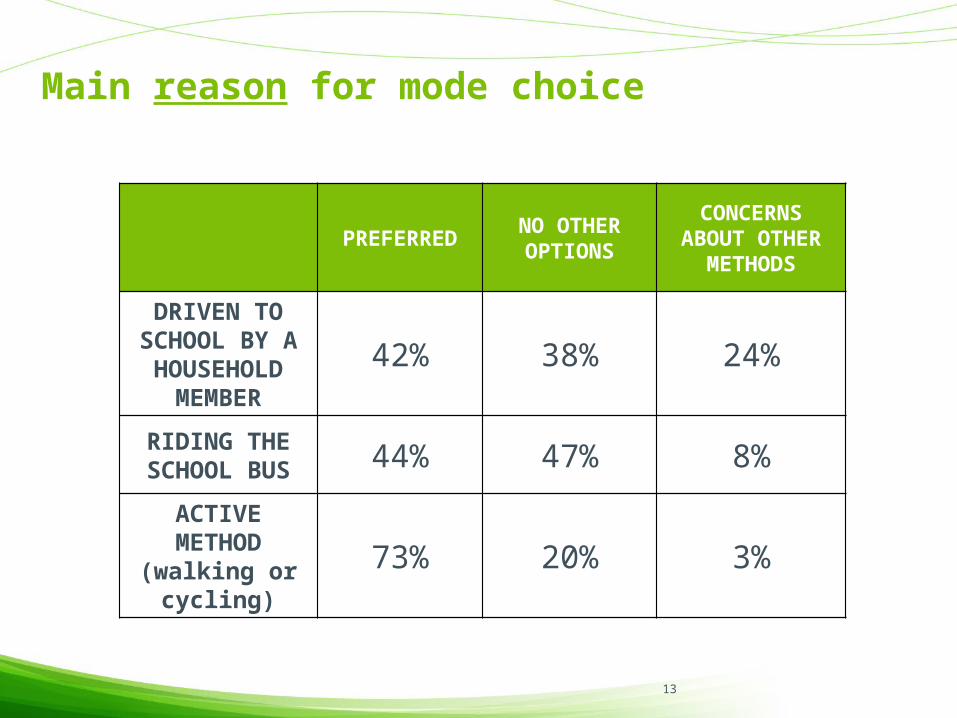
Main reason for mode choice
PREFERRED NO OTHER OPTIONS
CONCERNS ABOUT OTHER METHODS
DRIVEN TO SCHOOL BY A HOUSEHOLD
MEMBER
42% 38% 24%
RIDING THE SCHOOL BUS 44% 47% 8%
ACTIVE METHOD (walking or
cycling)73% 20% 3%

14
Correlation between parent’s mode of school travel and child’s mode of school travel
DRIVEN TO SCHOOL
RIDING THE SCHOOL BUS or PUBLIC TRANSIT
ACTIVE METHOD (walking or cycling)
DRIVEN TO SCHOOL 55% 28% 38%
RIDING THE SCHOOL BUS or PUBLIC
TRANSIT23% 37% 20%
ACTIVE METHOD (walking or cycling) 22% 35% 42%
Parent’s Mode
Child’sMode

15
Transportation Profile: ACTIVE MODESELDEST CHILD ATTENDING ELEMENTARY SCHOOL

16
Q1E3/Q1F3. Does your child travel to/ from school with other school-aged children?Q1E3A/Q1F3A. Is this as part of a group organized by the school or community?
Q1E3/Q1E3A. Base: Respondents whose child walks or bikes to school (N=384)Q1F3/Q1F3A. Base: Respondents whose child walks or bikes home from school (N=401)
Travel with other children
54%
62%
60%
53%
50%
7%
2%
3%
6%
7%
39%
38%
35%
36%
40%
41%
1%
1%
1%
53% 6%
1%
To school
Home from school
To school
Home from school
To school
Home from school
Yes - but not in an organized group Yes - in an organized group No Don't know/Refused
Overall
Peel
Hamilton

17
Q1E3. Does your child travel to school with other school-aged children?Q1E7. Is your child accompanied by an adult when they walk/bike to school?
Q1E3/Q1E7. Base: Respondents whose child walks or bikes to school (N=384)
Active travel with adults and children
49%
48%
20%
65%
48%
20%
6%
21%
4%
2%
27%
56%
6%
1%
5%
19%
31%
38% 35%Total
Kindergarten
Grades 1-3
Grades 4-6
Grades 7 & 8
With an adult and child(ren) With an adult but no children With child(ren) but no adult Neither

18
Profile: “Active Travellers”
OVERALL ACTIVE TRAVELLERS (N=417)
DISTANCE TO SCHOOL
<1KM 33% 63%
1-2KM 27% 23%
>2KM 32% 7%
DRIVERS & CARS IN HOUSEHOLD
None 2% 4%
One driver 16% 20%
Two+ drivers; one car 23% 23%
Two+ drivers & two+ cars 59% 53%
HOUSEHOLD INCOME
<$35K 11% 13%
$35K to $65K 19% 19%
$65K to $95K 17% 21%
$95K to $125K 14% 14%
>$125K 17% 14%
19
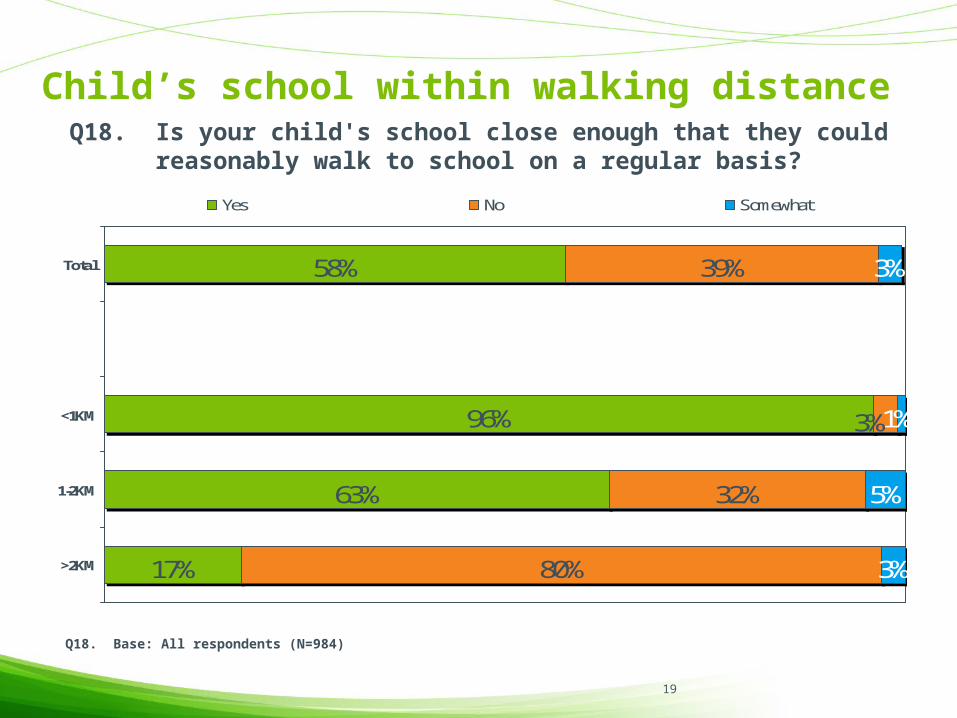
Q18. Is your child's school close enough that they could reasonably walk to school on a regular basis?
Child’s school within walking distance
63%
17%
32%
80%
3%
1%
5%
3%
96%
58%
3%
39%Total
<1KM
1-2KM
>2KM
Yes No Somewhat
Q18. Base: All respondents (N=984)

20
Q21A. There are safe bike routes or paths around the school.
Active and safe routes to school
65% 14%
2%
4%
15%
5%
24%
8%
3%
4%
27% 29%
Strongly agree Somewhat agree Neither agree nor disagree Somewhat disagree Strongly disagree Don't know
Q21A. Base: Respondents whose child’s school is close enough for them to reasonably walk or bike (N=680)
Q21D. I have discussed how to walk or bike to school safely with my child.
21
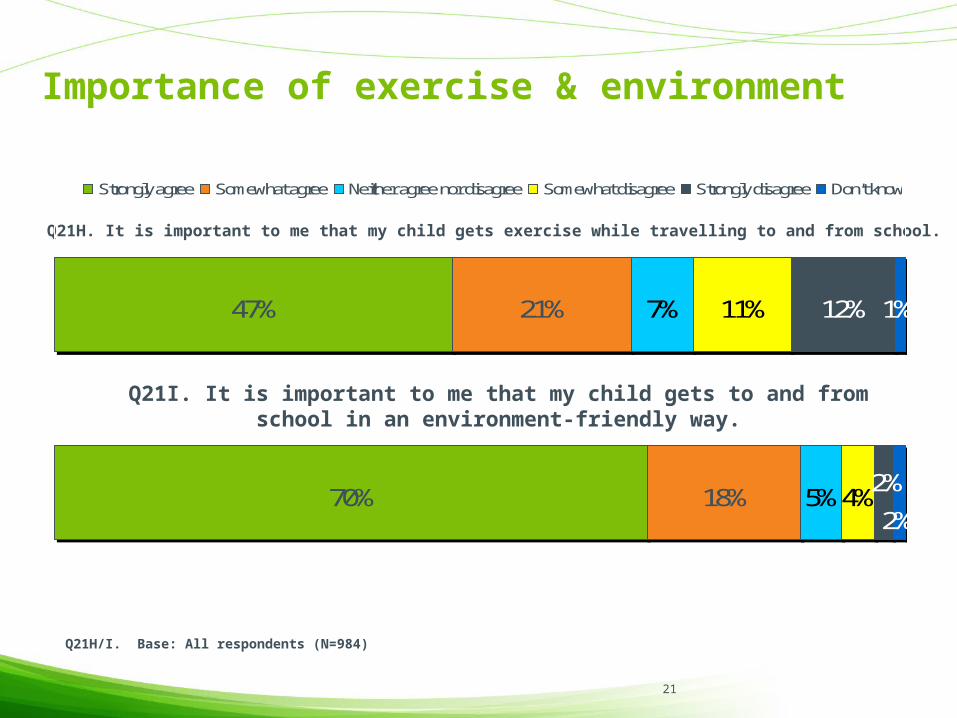
Q21H. It is important to me that my child gets exercise while travelling to and from school.
Importance of exercise & environment
70% 18%
7%
5%
11%
4%
12% 1%47% 21%
2%
2%
Strongly agree Somewhat agree Neither agree nor disagree Somewhat disagree Strongly disagree Don't know
Q21H/I. Base: All respondents (N=984)
Q21I. It is important to me that my child gets to and from school in an environment-friendly way.

22
Transportation Profile: DRIVENELDEST CHILD ATTENDING ELEMENTARY SCHOOL
23
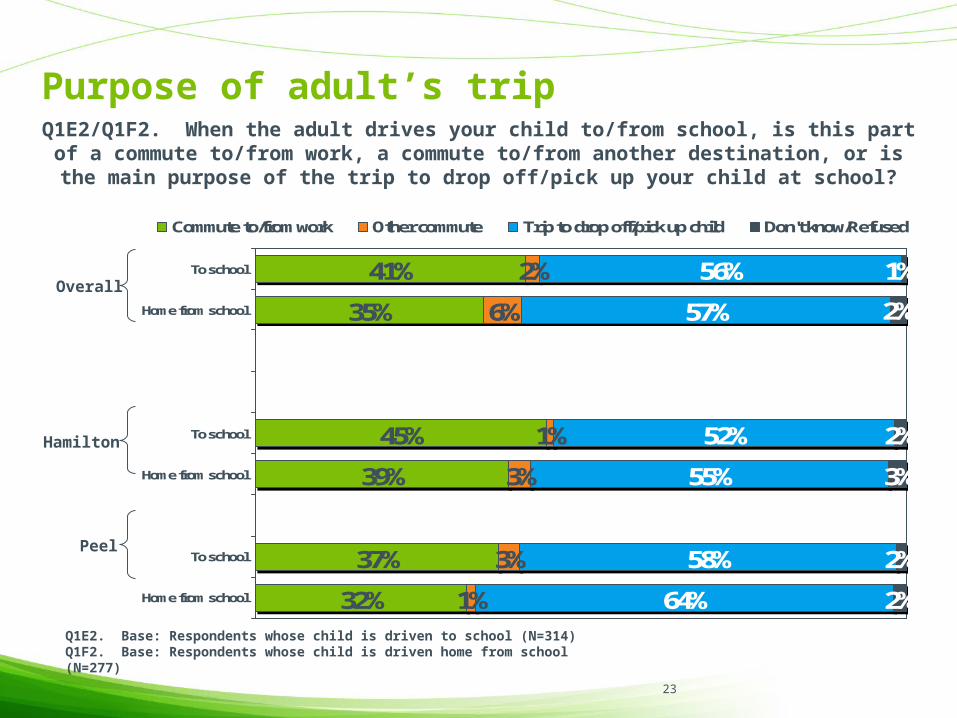
Q1E2/Q1F2. When the adult drives your child to/from school, is this part of a commute to/from work, a commute to/from another destination, or is the main purpose of the trip to drop off/pick up
your child at school?
Q1E2. Base: Respondents whose child is driven to school (N=314)Q1F2. Base: Respondents whose child is driven home from school (N=277)
Purpose of adult’s trip
35%
45%
39%
37%
32%
6%
1%
3%
3%
1%
56%
57%
52%
55%
58%
64%
1%
2%
3%
2%
2%
41% 2%
2%
To school
Home from school
To school
Home from school
To school
Home from school
Commute to/from work Other commute Trip to drop off/pick up child Don't know/Refused
Overall
Peel
Hamilton

24
Profile: “Auto Travellers”
OVERALL AUTO TRAVELLERS (N=329)
DISTANCE TO SCHOOL
<1KM 33% 20%
1-2KM 27% 33%
>2KM 32% 37%
DRIVERS & CARS IN HOUSEHOLD
None 2% 0%
One driver 16% 9%
Two or more drivers; one car 23% 19%
Two or more drivers & two or more cars 59% 71%
HOUSEHOLD INCOME
<$35K 11% 6%
$35K to $65K 19% 15%
$65K to $95K 17% 18%
$95K to $125K 14% 18%
>$125K 17% 22%

25
Transportation Profile: CARPOOLINGELDEST CHILD ATTENDING ELEMENTARY SCHOOL

26
Q14. Are there times that you participate in a carpool for school travel with neighbours or friends?
Participation in carpools
3%
14%
20%
79%
86%
77%
2% 19%Total
Hamilton
Peel
Yes - currently Yes - other times No
Q14. Base: All respondents (N=984)

27
Q21E. A list of nearby parents who would like to carpool would be useful to me.
Interest in a carpool list
28%
7%
5%
15%
10%
12%
7%
3%
2%48%
37% 25%Total
Respondents who considerCarpooling to be an appealing
alternate mode of travel (N=179)
Strongly agree Somewhat agree Neither agree nor disagreeSomewhat disagree Strongly disagree Don't know
Q21E. Base: Respondents whose child is driven to school by a member of their household, and would be comfortable with them participating in a carpool (N=244)
28
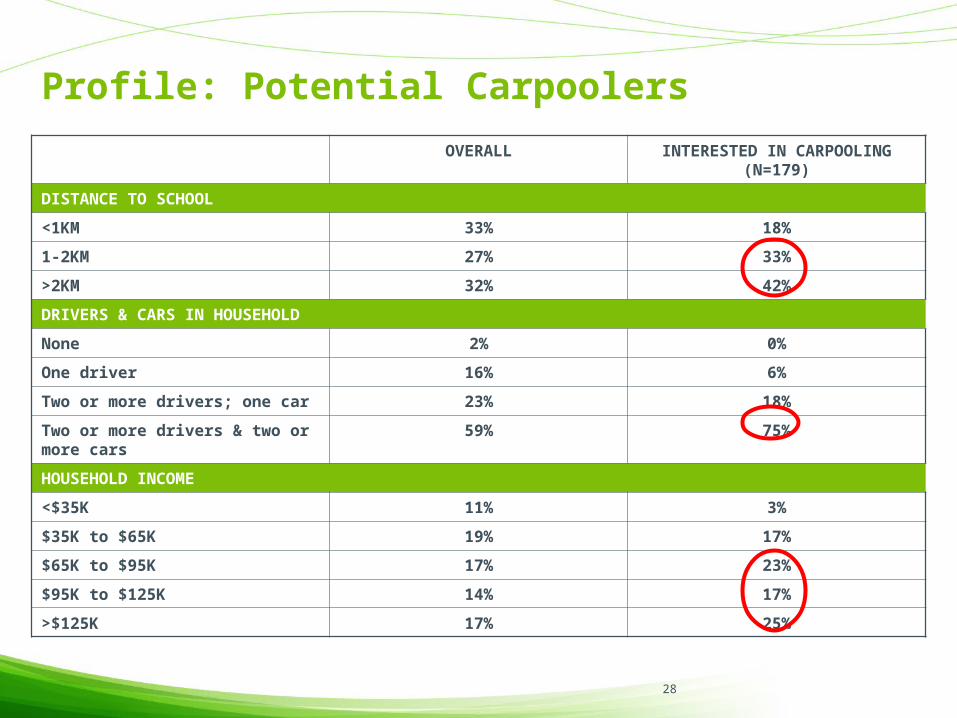
Profile: Potential Carpoolers
OVERALL INTERESTED IN CARPOOLING (N=179)
DISTANCE TO SCHOOL
<1KM 33% 18%
1-2KM 27% 33%
>2KM 32% 42%
DRIVERS & CARS IN HOUSEHOLD
None 2% 0%
One driver 16% 6%
Two or more drivers; one car 23% 18%
Two or more drivers & two or more cars 59% 75%
HOUSEHOLD INCOME
<$35K 11% 3%
$35K to $65K 19% 17%
$65K to $95K 17% 23%
$95K to $125K 14% 17%
>$125K 17% 25%

29
Interest in Alternative ModesELDEST CHILD ATTENDING ELEMENTARY SCHOOL

30
Q21G. I'm interested in considering alternatives to the way that my child currently travels.
Interest in considering alternatives
9%
16%
23%
15%
15%
7%
6%
8%
6%
16%
16%
18%
16%
41%
33%
47%
46%
3%
3%
2%
2%
19%
16% 17%Total
Drive
School Bus
Walk or Bike
Strongly agree Somewhat agree Neither agree nor disagreeSomewhat disagree Strongly disagree Don't know
Q21G. Base: All respondents (N=984)

31
School Travel Issues and ConcernsELDEST CHILD ATTENDING ELEMENTARY SCHOOL

32
Neighbourhood safety
55% 23%
3%
2%
17%
11%
23%
7%
1%20% 36%
2%
Strongly agree Somewhat agree Neither agree nor disagreeSomewhat disagree Strongly disagree Don't know
Q21A. Base: Respondents whose child’s school is close enough for them to reasonably walk or bike (N=680)
Q21B. People drive safely enough in my neighbourhood.
Q21C. I worry about strangers or bullies approaching my child if they travel alone.

33
Program AwarenessRESPONDENT/HOUSEHOLD
34
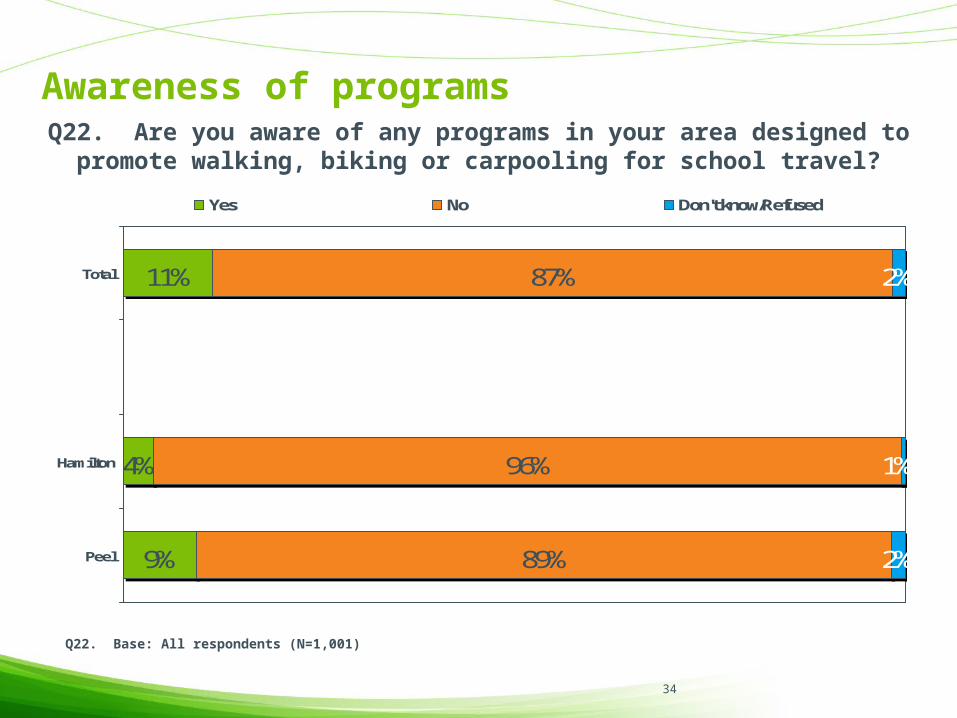
Q22. Are you aware of any programs in your area designed to promote walking, biking or carpooling for school travel?
Awareness of programs
9%
96%
89%
2%
1%
2%
4%
11% 87%Total
Hamilton
Peel
Yes No Don't know/Refused
Q22. Base: All respondents (N=1,001)
35
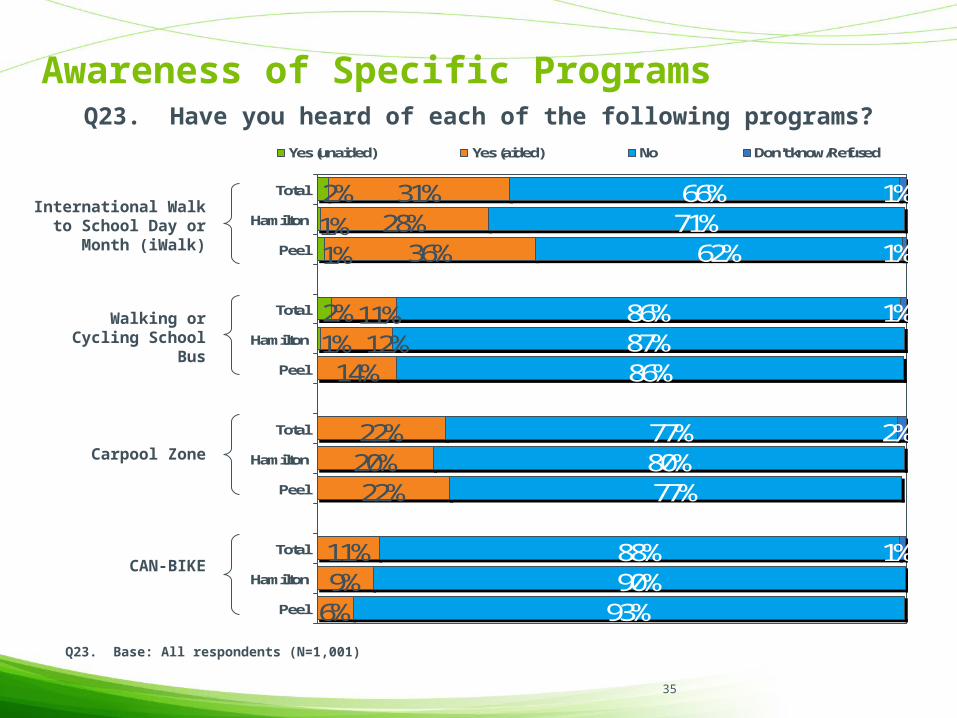
Q23. Have you heard of each of the following programs?
Awareness of Specific Programs
28%36%
14%
22%20%22%
11%9%
6%
66%71%
62%
86%87%86%
77%80%77%
88%90%
93%
1%
1%
1%
2%
1%
2%1%
1%1%
2%
11%12%
31%Total
Hamilton
Peel
Total
Hamilton
Peel
Total
Hamilton
Peel
Total
Hamilton
Peel
Yes (unaided) Yes (aided) No Don't know/Refused
Q23. Base: All respondents (N=1,001)
International Walk to School Day or Month (iWalk)
Walking or Cycling School Bus
Carpool Zone
CAN-BIKE

36
School Travel Infrastructure and ProgramsELDEST CHILD ATTENDING ELEMENTARY SCHOOL

37
Q24. Does your child's school offer…School Travel Infrastructure
86%
79%61%
91%
67%68%68%
57%52%55%
18%36%
27%28%27%
30%35%29%
2%1%1%
2%3%3%
6%4%5%
13%13%
16%
90%
88%
6%
9%13%10%Total
Hamilton
Peel
Total
Hamilton
Peel
Total
Hamilton
Peel
Total
Hamilton
Peel
Yes No Don't know/Refused
Q24. Base: All respondents (N=1,001)
Sidewalks leading to the school entrance
Crossing guards and marked crossings at the school
Bicycle parking
A student drop off area for automobiles
38
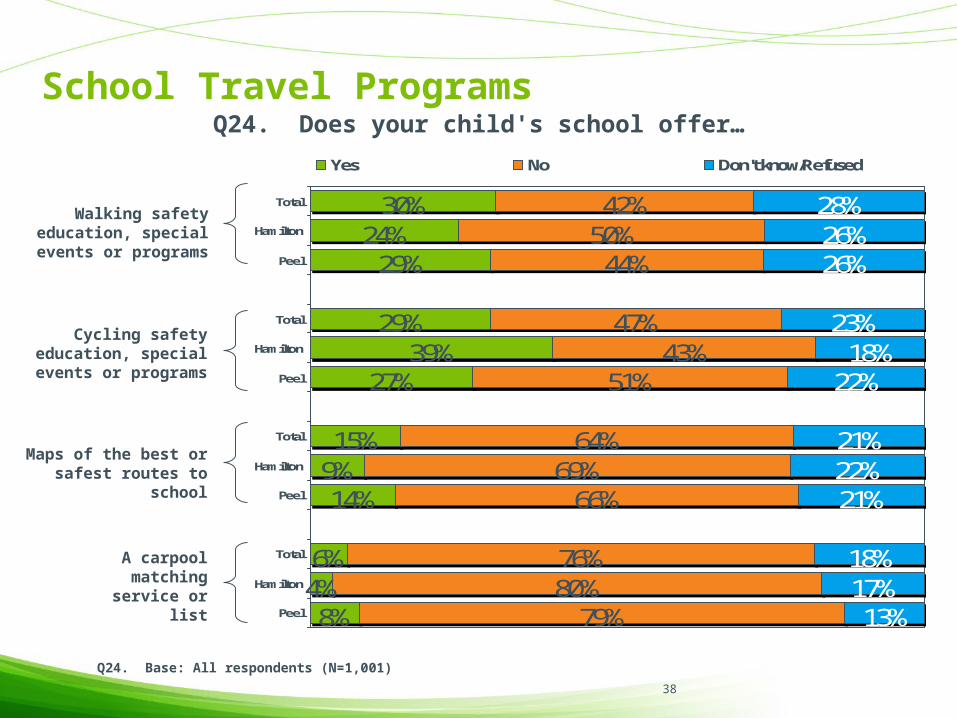
Q24. Does your child's school offer…School Travel Programs
24%
29%39%
27%
15%9%14%
6%4%8%
50%44%
47%43%
51%
64%69%
66%
76%80%
79%
28%26%26%
23%18%
22%
21%22%21%
18%17%13%
29%
30% 42%Total
Hamilton
Peel
Total
Hamilton
Peel
Total
Hamilton
Peel
Total
Hamilton
Peel
Yes No Don't know/Refused
Q24. Base: All respondents (N=1,001)
Walking safety education, special events or programs
Cycling safety education, special events or programs
Maps of the best or safest routes to school
A carpool matching service or list

39
Key target marketsELDEST CHILD ATTENDING ELEMENTARY SCHOOL

40
Profile: “Close Drivers”
OVERALL CLOSE DRIVERS (N=160)
DISTANCE TO SCHOOL
<1KM 33% 39%
1-2KM 27% 41%
>2KM 32% 14%
DRIVERS & CARS IN HOUSEHOLD
None 2% 0%
One driver 16% 10%
Two or more drivers; one car 23% 18%
Two or more drivers & two or more cars 59% 72%
HOUSEHOLD INCOME
<$35K 11% 8%
$35K to $65K 19% 16%
$65K to $95K 17% 20%
$95K to $125K 14% 17%
>$125K 17% 17%
41
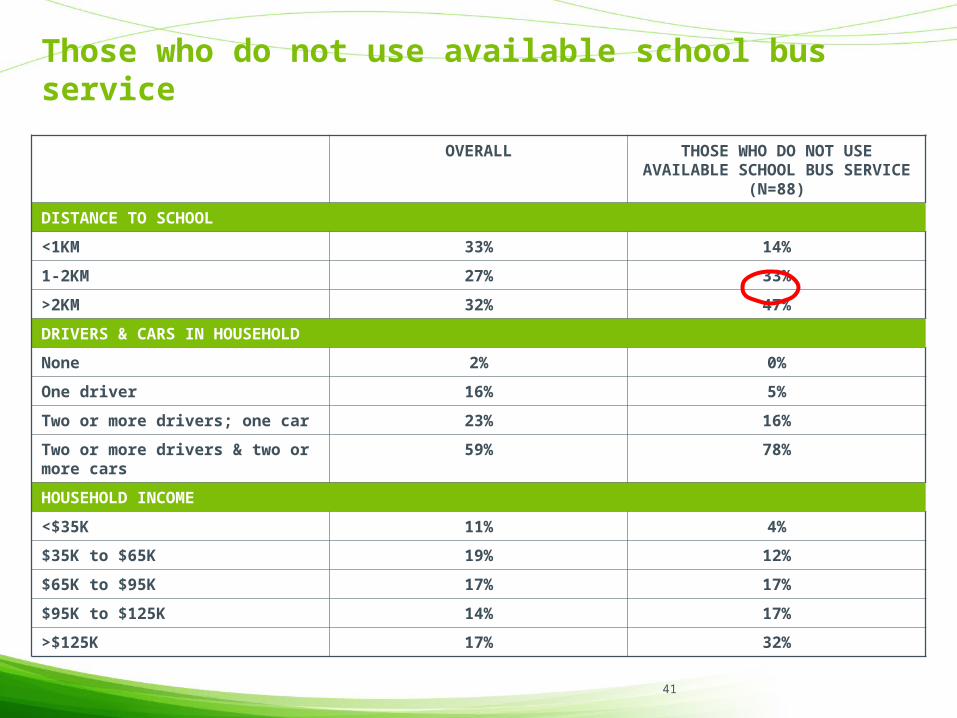
Those who do not use available school bus service
OVERALL THOSE WHO DO NOT USE AVAILABLE SCHOOL BUS SERVICE (N=88)
DISTANCE TO SCHOOL
<1KM 33% 14%
1-2KM 27% 33%
>2KM 32% 47%
DRIVERS & CARS IN HOUSEHOLD
None 2% 0%
One driver 16% 5%
Two or more drivers; one car 23% 16%
Two or more drivers & two or more cars 59% 78%
HOUSEHOLD INCOME
<$35K 11% 4%
$35K to $65K 19% 12%
$65K to $95K 17% 17%
$95K to $125K 14% 17%
>$125K 17% 32%

42
Convenience and Appeal of Alternate modes
CARPOOL SCHOOL BUS
PUBLIC TRANIST
WALK OR BIKE WITH
PARENT
WALK OR BIKE WITH
GROUP
WALK OR BIKE
ALONE
CONVENIENCE 66% 66% 24% 50% 78% 71%
APPEAL 73% 64% 26% 62% 76% 88%
CHILD’S INTEREST 69% 70% 25% 66% 64% 50%
CONVENENT AND APPEALING 59% 53% 16% 31% 55% 56%
COLUMN ‘N’ 239 70 117 131 131 37
Base: Respondents whose child is driven to or home from school & for whom the alternate method is available

43
Final Study Report to be available at: www.metrolinx.com/schooltravel
Jennifer LaySchool-based TDM Coordinator, Metrolinx
Related Documents