Greater Sage-Grouse (Centrocercus urophasianus) select nest sites and brood sites away from avian predators (Centrocercus urophasianus Selecciona Sitios de Anidación y de Cría Lejos de Aves Depredadoras) Author(s): Jonathan B. Dinkins, Michael R. Conover, Christopher P. Kirol and Jeffrey L. Beck Reviewed work(s): Source: The Auk, Vol. 129, No. 4 (October 2012), pp. 600-610 Published by: University of California Press on behalf of the American Ornithologists' Union Stable URL: http://www.jstor.org/stable/10.1525/auk.2012.12009 . Accessed: 09/11/2012 12:17 Your use of the JSTOR archive indicates your acceptance of the Terms & Conditions of Use, available at . http://www.jstor.org/page/info/about/policies/terms.jsp . JSTOR is a not-for-profit service that helps scholars, researchers, and students discover, use, and build upon a wide range of content in a trusted digital archive. We use information technology and tools to increase productivity and facilitate new forms of scholarship. For more information about JSTOR, please contact [email protected]. . University of California Press and American Ornithologists' Union are collaborating with JSTOR to digitize, preserve and extend access to The Auk. http://www.jstor.org

Welcome message from author
This document is posted to help you gain knowledge. Please leave a comment to let me know what you think about it! Share it to your friends and learn new things together.
Transcript
Greater Sage-Grouse (Centrocercus urophasianus) select nest sites and brood sites away fromavian predators (Centrocercus urophasianus Selecciona Sitios de Anidación y de Cría Lejos deAves Depredadoras)Author(s): Jonathan B. Dinkins, Michael R. Conover, Christopher P. Kirol and Jeffrey L. BeckReviewed work(s):Source: The Auk, Vol. 129, No. 4 (October 2012), pp. 600-610Published by: University of California Press on behalf of the American Ornithologists' UnionStable URL: http://www.jstor.org/stable/10.1525/auk.2012.12009 .Accessed: 09/11/2012 12:17
Your use of the JSTOR archive indicates your acceptance of the Terms & Conditions of Use, available at .http://www.jstor.org/page/info/about/policies/terms.jsp
.JSTOR is a not-for-profit service that helps scholars, researchers, and students discover, use, and build upon a wide range ofcontent in a trusted digital archive. We use information technology and tools to increase productivity and facilitate new formsof scholarship. For more information about JSTOR, please contact [email protected].
.
University of California Press and American Ornithologists' Union are collaborating with JSTOR to digitize,preserve and extend access to The Auk.
http://www.jstor.org
GREATER SAGE-GROUSE (CENTROCERCUS UROPHASIANUS) SELECT NEST SITES
AND BROOD SITES AWAY FROM AVIAN PREDATORS
Jonathan B. Dinkins,1,3 Michael R. conoveR,1 chRistopheR p. kiRol,2 anD JeffRey l. Beck2
1Department of Wildland Resources, Utah State University, Logan, Utah 84322, USA; and2Department of Ecosystem Science and Management, University of Wyoming, Laramie, Wyoming 82071, USA
Abstract.—Greater Sage-Grouse (Centrocercus urophasianus) have declined in distribution and abundance in western North America over the past century. Depredation of nests and predation of chicks can be two of the most influential factors limiting their productivity. Prey species utilize antipredation behaviors, such as predator avoidance, to reduce the risk of predation. Birds in general balance the dual necessity of selecting cover to hide from visual and olfactory predators to enhance prospects of survival and reproductive success, which may also be achieved by selecting habitat with relatively fewer predators. We compared avian predator densities at Greater Sage-Grouse nests and brood locations with those at random locations within available sage-grouse habitat in Wyoming. This comparison allowed us to assess the species’ ability to avoid avian predators during nesting and early brood rearing. During 2008–2010, we conducted 10-min point-count surveys at 218 nests, 249 brood locations from 83 broods, and 496 random locations. We found that random locations had higher densities of avian predators compared with nest and brood locations. Greater Sage-Grouse nested in areas where there were lower densities of Common Ravens (Corvus corax), Black-billed Magpies (Pica hudsonia), Golden Eagles (Aquila chrysaetos), and hawks (Buteo spp.) compared with random locations. Additionally, they selected brood-rearing locations with lower densities of those same avian predators and of American Kestrels (Falco sparverius), compared with random locations. By selecting nest and brood-rearing locations with lower avian predator densities, Greater Sage-Grouse may reduce the risk of nest depredation and predation on eggs, chicks, and hens. Received 24 May 2011, accepted 4 June 2012.
Key words: avian predator, brood-site selection, Centrocercus urophasianus, Greater Sage-Grouse, nest-site selection, predation risk, predator avoidance, spatial autocorrelation.
Centrocercus urophasianus Selecciona Sitios de Anidación y de Cría Lejos de Aves Depredadoras
Resumen.—El área de distribución y la abundancia de Centrocercus urophasianus han disminuido en el occidente de Norteamérica a lo largo del último siglo. La depredación de nidos y polluelos podría estar entre los factores que mayor influencia negativa han tenido sobre la productividad de la especie. Las presas presentan comportamientos antidepredatorios, como la evasión de los depredadores, para reducir el riesgo de depredación. Las aves en general compensan la necesidad de seleccionar un refugio para ocultarse de los depredadores visual y olfativamente con la necesidad de incrementar las probabilidades de supervivencia y éxito reproductivo, lo que también puede ser logrado seleccionando el hábitat con el menor número relativo de depredadores. Comparamos las densidades de depredadores alrededor de los nidos y sitios de cría de C. urophasianus con las densidades de depredadores de sitios escogidos al azar dentro del hábitat disponible para esta especie en Wyoming. Esta comparación nos permitió determinar la habilidad de la especie para evitar a sus depredadores durante la anidación y la cría temprana. Entre 2008 y 2010, hicimos censos durante 10 minutos en puntos de conteo en 218 nidos, 249 localidades de cría de 83 nidadas y 496 sitios escogidos al azar. Encontramos que las localidades aleatorias tienen mayores densidades de depredadores que las localidades de anidación y de cría. Las aves anidaron en áreas en las que había menor densidad Corvus corax, Pica hudsonia, Aquila chrysaetos y Buteo spp. que en localidades escogidas al azar. Además, las aves seleccionaron localidades de cría con menores densidades de los mismos depredadores y de Falco sparverius, comparadas con localidades aleatorias. Al seleccionar sitios de anidación y cría con menor densidad de depredadores, C. urophasianus podría reducir los riesgos de depredación de los nidos, huevos, polluelos y hembras anidantes.
— 600 —
The Auk 129(4):600−610, 2012 The American Ornithologists’ Union, 2012.Printed in USA.
The Auk, Vol. 129, Number 4, pages 600−610. ISSN 0004-8038, electronic ISSN 1938-4254. 2012 by The American Ornithologists’ Union. All rights reserved. Please direct all requests for permission to photocopy or reproduce article content through the University of California Press’s Rights and Permissions website, http://www.ucpressjournals.com/reprintInfo.asp. DOI: 10.1525/auk.2012.12009
3E-mail: [email protected]
Food and risk of predation are two factors widely thought to have important influences on the choice of breeding habi-tat by birds and other animals, and actual habitat choice has often been described as a tradeoff between access to resources
and risk of predation (Verdolin 2006). Thus, avian species may not select optimal nesting or brood-rearing habitat for foraging when the risk of predation is high. Prey species utilize antipreda-tion behaviors, such as predator avoidance (predator-avoidance

octoBeR 2012 — avian pReDatoRs anD GReateR saGe-GRouse — 601
or predator community composition. However, consistent place-ment of nests and broods in sites with greater visual cover, regard-less of differences in the structure of local habitats, suggests that vertical (e.g., grass and shrub height) and horizontal (e.g., grass and shrub canopy cover) cover influence nest-site and brood-site selection.
Current evidence (Conover et al. 2010) suggests that sage-grouse use nest locations that hide their nests from visual but not olfactory predators. Conover et al. (2010) found that sage-grouse placed nests in areas that had greater vertical and horizontal con-cealment, taller shrubs, but also fewer updrafts, lower turbulence, and slower wind speeds than random locations. Updrafts, high turbulence, and high wind speeds are weather conditions that make it difficult for mammalian predators to use olfaction to lo-cate nests (Conover 2007). These results are consistent with other research showing that sage-grouse preferred to nest in areas with greater visual cover. Further, locations that have good visual cover often have fewer updrafts, less atmospheric turbulence, and lower wind speeds. Thus, sage-grouse, and birds in general, often bal-ance the dual need to select cover to hide from visual and olfactory predators to improve chances of surviving to breed successfully. Selection of nest sites that conceal sage-grouse from visual preda-tors but not from olfactory predators suggests that the former are a greater threat to sage-grouse nests. On the other hand, it may be that sage-grouse cannot use olfactory cues to influence nest-choice decisions, and visual predators may be a greater threat because their numbers have increased in association with anthro-pogenic development.
Sage-grouse select nest sites on the basis of habitat charac-teristics at local (habitat directly around a nest) and landscape scales (Doherty et al. 2010). In accordance with the predator-avoidance hypothesis, we hypothesized that at the landscape scale, sage-grouse would avoid nesting or raising broods in areas of high densities of avian predators, specifically American Kes-trels (Falco sparverius; hereafter “kestrels”), Black-billed Mag-pies (Pica hudsonia; hereafter “magpies”), Golden Eagles (Aquila chrysaetos), hawks (Buteo spp.), Northern Harriers (Circus cya-neus; hereafter “harriers”), and ravens. Further, we hypothesized that adult survival would take precedence over nest or brood survival, and that sage-grouse habitat use would be shaped pri-marily by avoidance of avian predators that were a threat to adult hen survival, and secondarily by avoidance of avian predators that were a threat only to nests and broods. We tested these hy-potheses by comparing avian predator densities at sage-grouse nest and brood locations and at random locations within nesting and brood-rearing habitat.
Methods
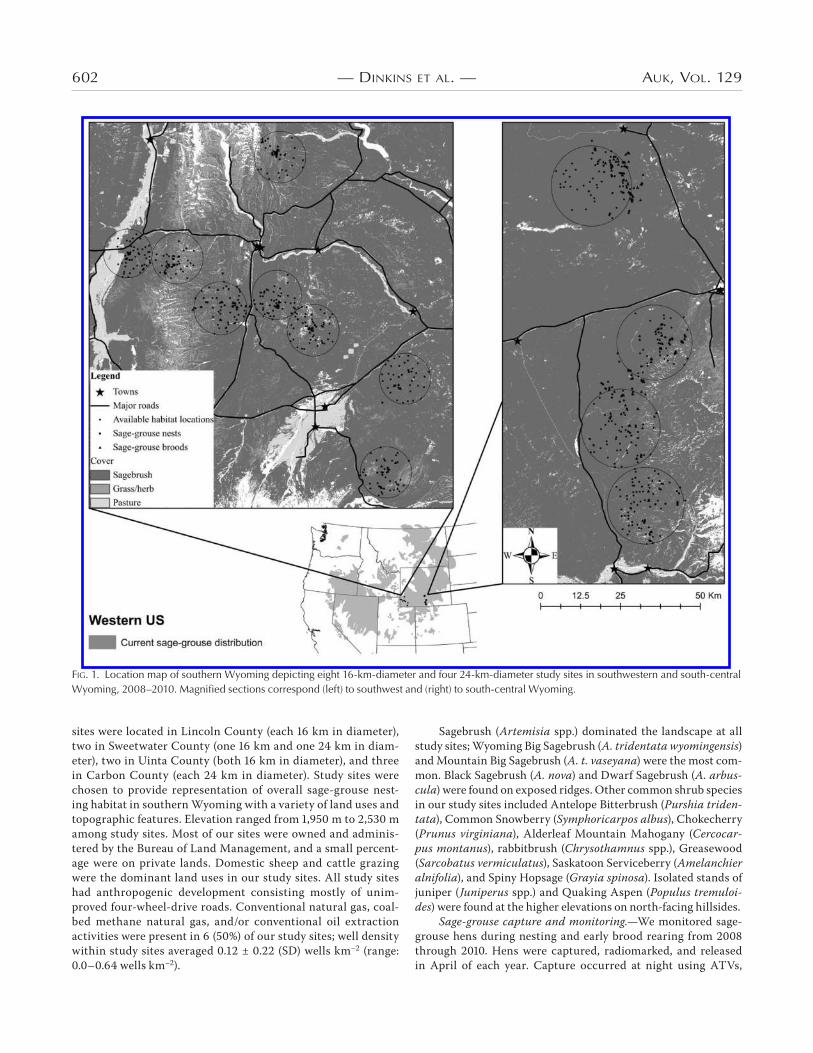
Study areas.—Our study was conducted in southwest and south-central Wyoming at 12 study sites that were either 16 km (n = 8) or 24 km (n = 4) in diameter (Fig. 1). Sage-grouse are lekking species, and Holloran and Anderson (2005) found that 384 of 415 (92.5%) sage-grouse nests were within 8.5 km of leks in cen-tral and southwest Wyoming. Thus, the study sites in southwest Wyoming were 16 km in diameter and approximately centered around leks where hens were captured. We used larger, 24-km-diameter sites in south-central Wyoming because sage-grouse were captured at several leks spread over a larger area. Five study
hypothesis), to reduce the risk of predation (Cresswell 2008, and references therein). Local predator densities can affect the productivity, parental behavior, and nest-site selection of ground-nesting birds such as prairie grouse species (Schroeder and Baydack 2001, Manzer and Hannon 2005, Coates and Dele-hanty 2010), farmland birds (Evans 2004), ducks (Sargeant et al. 1995), shorebirds (Smith et al. 2007), and passerines (Norrdahl and Korpimäki 1998, Roos and Pärt 2004, Thomson et al. 2006, Chalfoun and Martin 2009).
Declines in Greater Sage-Grouse (Centrocercus uropha-sianus; hereafter “sage-grouse”) abundance in western North America over the past century have been severe (Gregg et al. 1994, Johnsgard 2002, Connelly et al. 2004) and recently led the U.S. Fish and Wildlife Service (2010) to conclude that sage-grouse are warranted for protection under the Endangered Spe-cies Act of 1973. Many factors have contributed to this decline, including habitat loss, habitat fragmentation, habitat degrada-tion, and predation (Braun 1998, Schroeder et al. 2004). Despite the U.S. Fish and Wildlife Service’s assessment, listing was pre-cluded in favor of other species that are under more severe threat of extinction.
Direct effects of nest predation on nesting productivity of birds are widely recognized, and even in high-quality sage-grouse habi-tat, most sage-grouse nests are lost to predators (Gregg et al. 1994, Connelly et al. 2004, Coates et al. 2008). For example, Common Ra-ven (Corvus corax; hereafter “raven”) depredation of sage-grouse nests has been documented as a common occurrence in northeast-ern Nevada on the basis of infrared video cameras set up at nest sites (Coates et al. 2008). High mortality rates on chicks have also been attributed to predators, especially during early brood rearing (Al-dridge 2005, Gregg and Crawford 2009, Guttery 2011).
In addition to direct predator effects, perceived predation risk may have dramatic effects on nest success and chick sur-vival (Cresswell 2008, Martin and Briskie 2009), and prey’s per-ception of predation risk may have negative effects that are strong enough to affect population growth rates (Creel and Christianson 2008, Cresswell 2008, Zanette et al. 2011). For example, Zanette et al. (2011) manipulated perceived predation risk while exclud-ing predators from Song Sparrow (Melospiza melodia) nests. In the absence of direct predation, Zanette et al. (2011) found a 40% reduction in offspring production as a result of reductions in the number of eggs laid, proportion of eggs hatched, and proportion of nestlings fledged.
In response to predation risk to adults and their nests, sage-grouse and other birds hide nests from predators by placing them primarily in areas with greater visual obstruction (Connelly et al. 1994, 2004; Braun 1998; Kirol et al. 2012); hens and broods hide from avian predators through a combination of habitat selection and cryptic behavior (Gregg and Crawford 2009, Guttery 2011). Several studies have reported that sage-grouse select nest sites on the basis of greater sagebrush density (Wallestad and Pyrah 1974, Connelly et al. 2003), sagebrush cover (Doherty et al. 2010, Kirol et al. 2012), shrub height (Gregg et al. 1994), grass height (Gregg et al. 1994, Holloran et al. 2005), and grass cover (Kaczor 2008, Ki-rol et al. 2012). Kirol et al. (2012) and Aldridge and Brigham (2002) found that sage-grouse brood hens selected locations with greater percentages of sagebrush and grass cover compared with ran-dom locations. Variability in reported nest and brood-site habitat use among studies may indicate local differences in habitat and/
602 — Dinkins et al. — auk, vol. 129
sites were located in Lincoln County (each 16 km in diameter), two in Sweetwater County (one 16 km and one 24 km in diam-eter), two in Uinta County (both 16 km in diameter), and three in Carbon County (each 24 km in diameter). Study sites were chosen to provide representation of overall sage-grouse nest-ing habitat in southern Wyoming with a variety of land uses and topographic features. Elevation ranged from 1,950 m to 2,530 m among study sites. Most of our sites were owned and adminis-tered by the Bureau of Land Management, and a small percent-age were on private lands. Domestic sheep and cattle grazing were the dominant land uses in our study sites. All study sites had anthropogenic development consisting mostly of unim-proved four-wheel-drive roads. Conventional natural gas, coal-bed methane natural gas, and/or conventional oil extraction activities were present in 6 (50%) of our study sites; well density within study sites averaged 0.12 ± 0.22 (SD) wells km–2 (range: 0.0–0.64 wells km–2).
Sagebrush (Artemisia spp.) dominated the landscape at all study sites; Wyoming Big Sagebrush (A. tridentata wyomingensis) and Mountain Big Sagebrush (A. t. vaseyana) were the most com-mon. Black Sagebrush (A. nova) and Dwarf Sagebrush (A. arbus-cula) were found on exposed ridges. Other common shrub species in our study sites included Antelope Bitterbrush (Purshia triden-tata), Common Snowberry (Symphoricarpos albus), Chokecherry (Prunus virginiana), Alderleaf Mountain Mahogany (Cercocar-pus montanus), rabbitbrush (Chrysothamnus spp.), Greasewood (Sarcobatus vermiculatus), Saskatoon Serviceberry (Amelanchier alnifolia), and Spiny Hopsage (Grayia spinosa). Isolated stands of juniper (Juniperus spp.) and Quaking Aspen (Populus tremuloi-des) were found at the higher elevations on north-facing hillsides.
Sage-grouse capture and monitoring.—We monitored sage-grouse hens during nesting and early brood rearing from 2008 through 2010. Hens were captured, radiomarked, and released in April of each year. Capture occurred at night using ATVs,
fiG. 1. Location map of southern Wyoming depicting eight 16-km-diameter and four 24-km-diameter study sites in southwestern and south-central Wyoming, 2008–2010. Magnified sections correspond (left) to southwest and (right) to south-central Wyoming.

octoBeR 2012 — avian pReDatoRs anD GReateR saGe-GRouse — 603
spotlights, and hoop nets (Giesen et al. 1982, Wakkinen et al. 1992). Sage-grouse hens were fitted with 17.5-g or 22-g (<1.5% body mass) necklace radio collars (RI-2D, Holohil Systems, On-tario, Canada; or A4060, Advanced Telemetry Systems, Isanti, Minnesota).
We located hens weekly with Communications Specialists (Communications Specialists, R-1000, Orange, California) re-ceivers and 3-way Yagi antennas (Communications Specialists, Orange, California). Potential nests were identified by binocu-lars at a distance of ~15 m by circling a radiomarked hen until she was sighted under a shrub. Nests were verified by triangu-lating the hen under the same shrub from >50 m away or thor-oughly searching the area of the potential nest when the hen was absent. We continued monitoring nests weekly until they either hatched or failed. We assessed nest fate as successful or unsuc-cessful after a hen left its nest. A successful nest was defined as having evidence that at least one egg hatched, as determined by shell membrane condition (Wallestad and Pyrah 1974). We clas-sified unsuccessful nests as abandoned (eggs not depredated or hatched) or depredated (at least one egg with evidence of depre-dation and no eggs hatched).
We located the broods of radiomarked hens weekly with bin-oculars from a distance of ~15 m. Brood hens were identified by either visually detecting chicks or observing hen behavior that in-dicated the presence of a brood (e.g., hesitation to flush, feigning injury, or clucking). We classified a hen as a brood hen if there was at least 1 chick with her. Monitoring of broods continued for as long as possible, which was usually until the chicks were at least 3 weeks old, the hen lost her brood, the hen died, or the hen could no longer be located.
Avian predator monitoring.—Between May and August of each year (sage-grouse nesting and brood-rearing season), we conducted point-count surveys at sage-grouse nests, sage-grouse brood locations, and random locations (hereafter “nest,” “brood,” and “random” locations) within each study site to com-pare avian predator densities. Random locations were selected in habitat considered to be available to sage-grouse for nesting within each study site. To restrict random locations to available nesting habitat, we used ARCMAP, version 9.2 (ESRI, Redlands, California), to generate random locations only in sagebrush-dominated habitat, which was classified by the Northwest Gap Analysis Project landcover data from 2008. Random locations were ≥1,000 m apart, but in practice, random points in all years averaged >2,000 m apart (Table 1). We generated 12 random loca-tions in each 16-km-diameter study site and 18 random locations in each 24-km-diameter study site per year (total n = 504). A new set of random locations was generated each year to avoid spa-tial autocorrelation; thus, random locations between years were independent.
We used standard distance-sampling techniques (Buck-land et al. 1993, Ralph et al. 1995, Thomas et al. 2010) to count and record distance to all corvids and raptors observed dur-ing point counts. We recorded distance from the observer when standing at the center point to where predators were first located (Ralph et al. 1995, Thomas et al. 2010); this mini-mized possible bias associated with avian predators being at-tracted to or f lushed away from an observer. In the uncommon event that an avian predator was displaced from the center of
a point-count location as an observer approached (6% of de-tected birds), we recorded distance from that avian predator to the center of the point-count location while the observer ap-proached, as suggested by Ralph et al. (1995). A 1,500–m range-finder (RE-1500 m, American Technologies Network, San Francisco, California) was used in conjunction with a global positioning system unit to estimate distances directly or to val-idate visually estimated distances.
We conducted 10-min point-count surveys during daylight hours weekly at each study site. We visited each point-count loca-tion 1 to 8 times, with most locations visited ≥3 times. We did not survey during inclement weather (i.e., in rain or with wind speeds ≥25 km h–1; Ralph et al. 1995). Avian predators that could not be identified to species were not included in analyses (2% of detec-tions within truncated distances). Nest and brood point counts were performed after nests and broods were initially located; thus, nest point counts were conducted in May and June and brood point counts were conducted from mid-May to early August. We performed random point counts throughout the nesting and early brood-rearing season (May to early August).
We intermixed the sampling of nest, brood, and random point counts within each study site, and each week we changed the time of day and the observer that conducted individual point counts within a study site. The observers who conducted point counts within a particular study site changed each year, but all ob-servers were trained and tested in corvid and raptor identification before conducting point counts.
To avoid disturbing an incubating hen, nest point counts were conducted 100–200 m away from a sage-grouse nest but within a line-of-sight of that nest. We also performed brood point counts 100–200 m away from a brood hen—estimated by trian-gulation—immediately before verifying that a radiomarked brood hen was still with chicks. This was intended to record avian pred-ator densities before the observer disturbed any avian predators and to avoid flushing a brood hen when a predator was nearby. If the hen did not have chicks, the brood point count was discarded.
Analyses.—We used conventional distance sampling in DIS-TANCE, version 6.0 release 2 (Thomas et al. 2010), to estimate Ferruginous Hawk (Buteo regalis), Golden Eagle, harrier, kes-trel, magpie, raven, Red-tailed Hawk (B. jamaicensis), and Swain-son’s Hawk (B. swainsoni) densities for nest, brood, and random locations across all years and all study sites. Ferruginous Hawks
taBle 1. Summary of minimum, maximum, and mean distance (m) to nearest neighbor Greater Sage-Grouse by location type (brood, nest, or random), reported by year. Data were collected in southwestern and south-central Wyoming during 2008–2010.
Year Location type n Min Mean Max SD
2008 Brood 92 15.3 790.7 4,272.1 917.6Nest 54 240.6 2,302.0 11,811.8 2,356.3Random 160 1,000.0 2,011.9 7,215.6 1,305.1
2009 Brood 103 2.8 831.5 5718.8 1,120.3Nest 78 102.5 2,099.0 8,911.5 2,091.8Random 174 1,000.0 2,122.1 7,073.1 1,093.9
2010 Brood 54 61.8 1,128.4 9,675.9 1,707.8Nest 86 106.5 2,042.6 10,011.4 2,279.2Random 162 1,030.8 2,493.0 6,135.5 1,016.0
604 — Dinkins et al. — auk, vol. 129
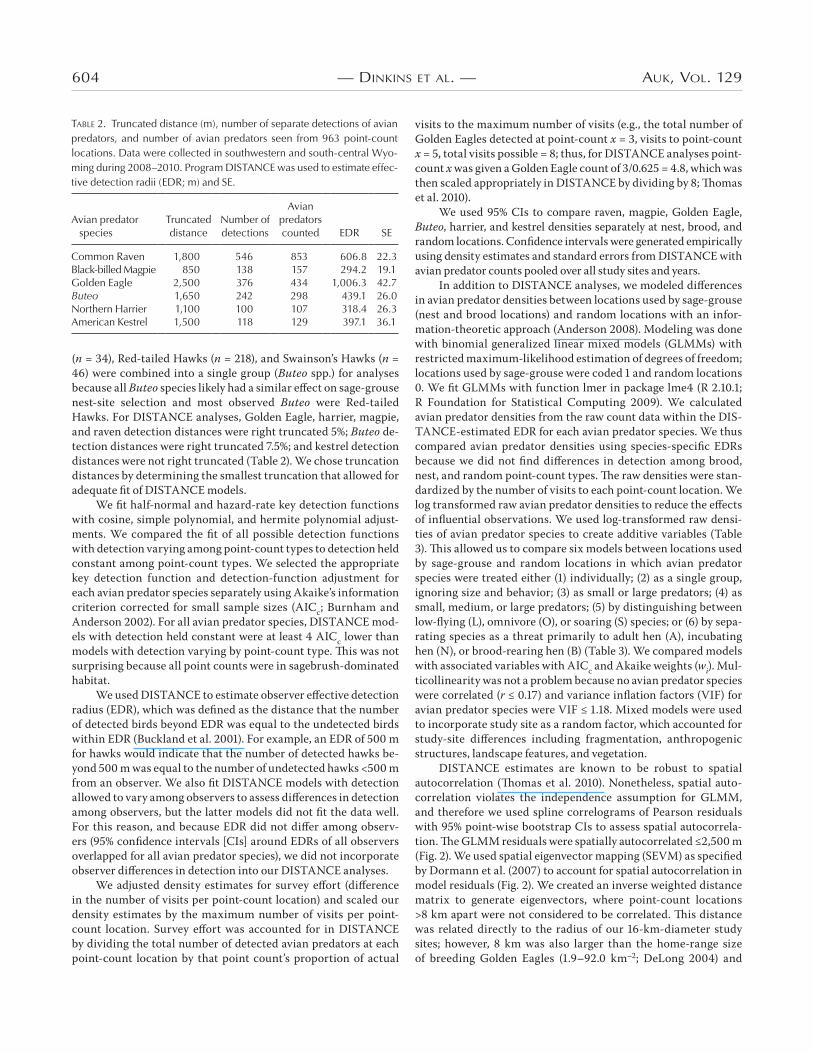
(n = 34), Red-tailed Hawks (n = 218), and Swainson’s Hawks (n = 46) were combined into a single group (Buteo spp.) for analyses because all Buteo species likely had a similar effect on sage-grouse nest-site selection and most observed Buteo were Red-tailed Hawks. For DISTANCE analyses, Golden Eagle, harrier, magpie, and raven detection distances were right truncated 5%; Buteo de-tection distances were right truncated 7.5%; and kestrel detection distances were not right truncated (Table 2). We chose truncation distances by determining the smallest truncation that allowed for adequate fit of DISTANCE models.
We fit half-normal and hazard-rate key detection functions with cosine, simple polynomial, and hermite polynomial adjust-ments. We compared the fit of all possible detection functions with detection varying among point-count types to detection held constant among point-count types. We selected the appropriate key detection function and detection-function adjustment for each avian predator species separately using Akaike’s information criterion corrected for small sample sizes (AICc; Burnham and Anderson 2002). For all avian predator species, DISTANCE mod-els with detection held constant were at least 4 AICc lower than models with detection varying by point-count type. This was not surprising because all point counts were in sagebrush-dominated habitat.
We used DISTANCE to estimate observer effective detection radius (EDR), which was defined as the distance that the number of detected birds beyond EDR was equal to the undetected birds within EDR (Buckland et al. 2001). For example, an EDR of 500 m for hawks would indicate that the number of detected hawks be-yond 500 m was equal to the number of undetected hawks <500 m from an observer. We also fit DISTANCE models with detection allowed to vary among observers to assess differences in detection among observers, but the latter models did not fit the data well. For this reason, and because EDR did not differ among observ-ers (95% confidence intervals [CIs] around EDRs of all observers overlapped for all avian predator species), we did not incorporate observer differences in detection into our DISTANCE analyses.
We adjusted density estimates for survey effort (difference in the number of visits per point-count location) and scaled our density estimates by the maximum number of visits per point-count location. Survey effort was accounted for in DISTANCE by dividing the total number of detected avian predators at each point-count location by that point count’s proportion of actual
visits to the maximum number of visits (e.g., the total number of Golden Eagles detected at point-count x = 3, visits to point-count x = 5, total visits possible = 8; thus, for DISTANCE analyses point-count x was given a Golden Eagle count of 3/0.625 = 4.8, which was then scaled appropriately in DISTANCE by dividing by 8; Thomas et al. 2010).
We used 95% CIs to compare raven, magpie, Golden Eagle, Buteo, harrier, and kestrel densities separately at nest, brood, and random locations. Confidence intervals were generated empirically using density estimates and standard errors from DISTANCE with avian predator counts pooled over all study sites and years.
In addition to DISTANCE analyses, we modeled differences in avian predator densities between locations used by sage-grouse (nest and brood locations) and random locations with an infor-mation-theoretic approach (Anderson 2008). Modeling was done with binomial generalized linear mixed models (GLMMs) with restricted maximum-likelihood estimation of degrees of freedom; locations used by sage-grouse were coded 1 and random locations 0. We fit GLMMs with function lmer in package lme4 (R 2.10.1; R Foundation for Statistical Computing 2009). We calculated avian predator densities from the raw count data within the DIS-TANCE-estimated EDR for each avian predator species. We thus compared avian predator densities using species-specific EDRs because we did not find differences in detection among brood, nest, and random point-count types. The raw densities were stan-dardized by the number of visits to each point-count location. We log transformed raw avian predator densities to reduce the effects of influential observations. We used log-transformed raw densi-ties of avian predator species to create additive variables (Table 3). This allowed us to compare six models between locations used by sage-grouse and random locations in which avian predator species were treated either (1) individually; (2) as a single group, ignoring size and behavior; (3) as small or large predators; (4) as small, medium, or large predators; (5) by distinguishing between low-flying (L), omnivore (O), or soaring (S) species; or (6) by sepa-rating species as a threat primarily to adult hen (A), incubating hen (N), or brood-rearing hen (B) (Table 3). We compared models with associated variables with AICc and Akaike weights (wi). Mul-ticollinearity was not a problem because no avian predator species were correlated (r ≤ 0.17) and variance inflation factors (VIF) for avian predator species were VIF ≤ 1.18. Mixed models were used to incorporate study site as a random factor, which accounted for study-site differences including fragmentation, anthropogenic structures, landscape features, and vegetation.
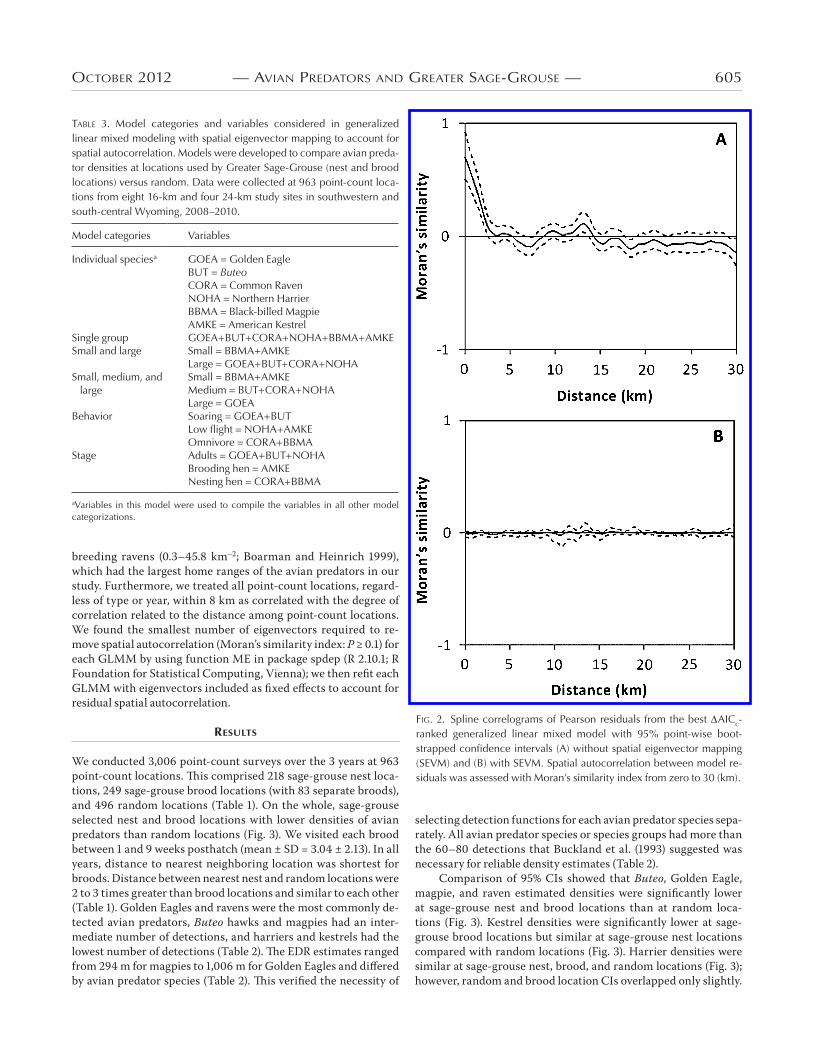
DISTANCE estimates are known to be robust to spatial autocorrelation (Thomas et al. 2010). Nonetheless, spatial auto-correlation violates the independence assumption for GLMM, and therefore we used spline correlograms of Pearson residuals with 95% point-wise bootstrap CIs to assess spatial autocorrela-tion. The GLMM residuals were spatially autocorrelated ≤2,500 m (Fig. 2). We used spatial eigenvector mapping (SEVM) as specified by Dormann et al. (2007) to account for spatial autocorrelation in model residuals (Fig. 2). We created an inverse weighted distance matrix to generate eigenvectors, where point-count locations >8 km apart were not considered to be correlated. This distance was related directly to the radius of our 16-km-diameter study sites; however, 8 km was also larger than the home-range size of breeding Golden Eagles (1.9–92.0 km–2; DeLong 2004) and
taBle 2. Truncated distance (m), number of separate detections of avian predators, and number of avian predators seen from 963 point-count locations. Data were collected in southwestern and south-central Wyo-ming during 2008–2010. Program DISTANCE was used to estimate effec-tive detection radii (EDR; m) and SE.
Avian predator species
Truncated distance
Number of detections
Avian predators counted EDR SE
Common Raven 1,800 546 853 606.8 22.3Black-billed Magpie 850 138 157 294.2 19.1Golden Eagle 2,500 376 434 1,006.3 42.7Buteo 1,650 242 298 439.1 26.0Northern Harrier 1,100 100 107 318.4 26.3American Kestrel 1,500 118 129 397.1 36.1
octoBeR 2012 — avian pReDatoRs anD GReateR saGe-GRouse — 605
breeding ravens (0.3–45.8 km–2; Boarman and Heinrich 1999), which had the largest home ranges of the avian predators in our study. Furthermore, we treated all point-count locations, regard-less of type or year, within 8 km as correlated with the degree of correlation related to the distance among point-count locations. We found the smallest number of eigenvectors required to re-move spatial autocorrelation (Moran’s similarity index: P ≥ 0.1) for each GLMM by using function ME in package spdep (R 2.10.1; R Foundation for Statistical Computing, Vienna); we then refit each GLMM with eigenvectors included as fixed effects to account for residual spatial autocorrelation.
Results
We conducted 3,006 point-count surveys over the 3 years at 963 point-count locations. This comprised 218 sage-grouse nest loca-tions, 249 sage-grouse brood locations (with 83 separate broods), and 496 random locations (Table 1). On the whole, sage-grouse selected nest and brood locations with lower densities of avian predators than random locations (Fig. 3). We visited each brood between 1 and 9 weeks posthatch (mean ± SD = 3.04 ± 2.13). In all years, distance to nearest neighboring location was shortest for broods. Distance between nearest nest and random locations were 2 to 3 times greater than brood locations and similar to each other (Table 1). Golden Eagles and ravens were the most commonly de-tected avian predators, Buteo hawks and magpies had an inter-mediate number of detections, and harriers and kestrels had the lowest number of detections (Table 2). The EDR estimates ranged from 294 m for magpies to 1,006 m for Golden Eagles and differed by avian predator species (Table 2). This verified the necessity of
selecting detection functions for each avian predator species sepa-rately. All avian predator species or species groups had more than the 60–80 detections that Buckland et al. (1993) suggested was necessary for reliable density estimates (Table 2).
Comparison of 95% CIs showed that Buteo, Golden Eagle, magpie, and raven estimated densities were significantly lower at sage-grouse nest and brood locations than at random loca-tions (Fig. 3). Kestrel densities were significantly lower at sage-grouse brood locations but similar at sage-grouse nest locations compared with random locations (Fig. 3). Harrier densities were similar at sage-grouse nest, brood, and random locations (Fig. 3); however, random and brood location CIs overlapped only slightly.
taBle 3. Model categories and variables considered in generalized linear mixed modeling with spatial eigenvector mapping to account for spatial autocorrelation. Models were developed to compare avian preda-tor densities at locations used by Greater Sage-Grouse (nest and brood locations) versus random. Data were collected at 963 point-count loca-tions from eight 16-km and four 24-km study sites in southwestern and south-central Wyoming, 2008–2010.
Model categories Variables
Individual speciesa GOEA = Golden EagleBUT = ButeoCORA = Common RavenNOHA = Northern HarrierBBMA = Black-billed MagpieAMKE = American Kestrel
Single group GOEA+BUT+CORA+NOHA+BBMA+AMKESmall and large Small = BBMA+AMKE
Large = GOEA+BUT+CORA+NOHASmall, medium, and
largeSmall = BBMA+AMKEMedium = BUT+CORA+NOHALarge = GOEA
Behavior Soaring = GOEA+BUTLow flight = NOHA+AMKEOmnivore = CORA+BBMA
Stage Adults = GOEA+BUT+NOHABrooding hen = AMKENesting hen = CORA+BBMA
aVariables in this model were used to compile the variables in all other model categorizations.
fiG. 2. Spline correlograms of Pearson residuals from the best ΔAICc-ranked generalized linear mixed model with 95% point-wise boot-strapped confidence intervals (A) without spatial eigenvector mapping (SEVM) and (B) with SEVM. Spatial autocorrelation between model re-siduals was assessed with Moran’s similarity index from zero to 30 (km).

606 — Dinkins et al. — auk, vol. 129
The spline correlogram of Pearson residuals from the top AICc ranked GLMM showed that SEVM with 34 eigenvectors accounted for spatial autocorrelation (Fig. 2). The top AICc ranked GLMM model with SEVM was that which recognized and distin-guished among small, medium, and large predator species (Table 4); coefficients for all three size classes were negative and did not overlap zero (Table 5). Negative coefficients indicated lower small, medium, and large avian predator densities at locations used by
fiG. 3. Comparison of raven, magpie, Golden Eagle, Buteo, harrier, and kestrel densities (per km2) among sage-grouse nests, sage-grouse brood locations, and random locations. Data from 3,006 point-count surveys at 963 total point-count locations—218 sage-grouse nest locations, 249 sage-grouse brood locations (with 83 separate broods), and 496 random locations—in southwestern and south-central Wyoming, 2008–2010. Densities were generated using radial point-count surveys and DIS-TANCE at sage-grouse nests, sage-grouse brood locations, and random locations. Error bars are 95% confidence intervals.
taBle 5. Parameter estimates with P values and 95% confidence intervals (CI) from top AICc-selected generalized linear mixed model with spatial eigenvector mapping (SEVM). The top model compared log-transformed avian predator densities between locations used by Greater Sage-Grouse and random locations on the basis of three size classes (small = magpie + kestrel, medium = raven + Buteo + harrier, and large = Golden Eagle). SEVM was used to correct for spatial autocorrelation. Data were col-lected at 963 point-count locations from eight 16-km and four 24-km study sites in southwestern and south-central Wyoming, 2008–2010.
Variablea Estimate SE Z P
95% CI
Lower Upper
Small –0.19 0.05 –3.65 <0.001 –0.30 –0.09Medium –0.23 0.04 –5.91 <0.001 –0.31 –0.15Large –0.31 0.08 –3.98 <0.001 –0.47 –0.16
aModel included 34 SEVM variables.
sage-grouse compared with random locations. Sage-grouse nest and brood locations had lower densities of all three size classes of avian predators (Table 5).
discussion
We found that sage-grouse selected habitat with lower densities of avian predators at nests and brood locations as predicted by the predator-avoidance hypothesis. By selecting habitat with lower densities of avian predators, sage-grouse lower their exposure to avian predation and their risk of reproductive failure. Our three-size-class model had wi = 0.91 (Table 4), which suggests that sage-grouse avoided avian predators at nest and brood locations on the basis of the size of avian predators rather than individual species identity, equivalence of all species, foraging behavior of predators, or presumed threat to sage-grouse reproductive stage.
Although we estimated avian predator densities across all years, we did not expect the pattern of sage-grouse avoidance of avian predators to differ among years. The inclusion of SEVM in our GLMM analyses dealt with spatial autocorrelation and bias associated with nest-site fidelity between years, weekly move-ments of broods, and similarities in habitat within and among study sites. DISTANCE estimates are known to be robust to lack of independence of observation locations because distance sam-pling is set up to be a snapshot in time (Thomas et al. 2010). Our sampling was designed to attempt to count the greatest propor-tion of avian predators within a study site each week, as sug-gested by Thomas et al. (2010) and Ralph et al. (1995). Conducting all point counts within a study site in one day reduced the possi-bility of double-counting individual avian predators during that week’s visit. Counting the same individual during different weeks, regardless of the particular point-count location, was properly scaled by accounting for survey effort. Replication of point counts by sampling multiple weeks was done to increase the proportion of avian predators detected, as suggested by Thomas et al. (2010).
We found that raven abundances at sage-grouse nest and brood locations were lower than at random locations in available sagebrush habitat. In western Wyoming, Bui et al. (2010) claimed that raven density around sage-grouse nesting and brood-rearing areas (1.0 ± 0.2 [SE] ravens km–2) was marginally higher than raven
taBle 4. Generalized linear mixed models comparing avian preda-tor densities between locations used by Greater Sage-Grouse (nest and brood sites) and random locations. Avian predator models with associated variables were compared with Akaike’s information crite-rion (adjusted for small sample sizes; AICc) and Akaike weights (wi). All compared models include parameters generated with spatial eigenvec-tor mapping (SEVM) to correct for spatial autocorrelation. Data were collected at 963 point-count locations from eight 16-km and four 24-km study sites in southwestern and south-central Wyoming, 2008–2010. Species abbreviations are defined in Table 3.
Models k AICc ΔAICc wi
Small, medium, and largea 39 675.01 0.00 0.91Small and largea 36 679.71 4.69 0.09GOEA+CORA+BBMA 37 690.39 15.38 0GOEA+BUT+CORA+NOHA+BBMA
+AMKEa 39 691.65 16.64 0GOEA+BUT+CORA+NOHA+BBMA 38 692.25 17.24 0Alla 34 695.57 20.56 0Medium and large 36 698.17 23.15 0Small 35 698.67 23.66 0GOEA+BUT+CORA+BBMA+AMKE 38 699.46 24.45 0Adult+brood hen+nesting hena 36 704.95 29.94 0Intercept-only model = 1,259.13
aDenotes models with all species of avian predators incorporated into the model.
octoBeR 2012 — avian pReDatoRs anD GReateR saGe-GRouse — 607
densities in available sagebrush habitat (0.7 ± 0.2 ravens km–2), even though estimated densities did not differ significantly. The discrepancy between our results and those of Bui et al. (2010) may be a function of greater anthropogenic development and human activity in their study areas or of raven behavioral adaptations re-lated to available resources. Regardless, we agree with Bui et al. (2010) that as avian predators, especially ravens, increase in abun-dance in sage-grouse habitat, high-quality nesting and brood-rearing habitat will become more limited. This is consistent with predation-risk tradeoffs and nonlethal predator effects, such as avoidance of risky habitats or habitats occupied by predators (Evans 2004, Verdolin 2006, Cresswell 2008).
To our knowledge, our study is the first to show that raven densities potentially affect sage-grouse nest-site selection. How-ever, our finding is not surprising, given that raven densities af-fect the nest success of prairie grouse species (Gregg et al. 1994, Manzer and Hannon 2005, Coates and Delehanty 2010). In south-ern Alberta, nest success of Sharp-tailed Grouse (Tympanuchus phasianellus) was 8× higher in landscapes with <3 corvids km–2 compared with landscapes with ≥3 corvids km–2 (Manzer and Hannon 2005). Sage-grouse nest success in northeastern Nevada was related to the number of ravens per 10-km transect, with the odds of a nest failure increasing 7.4% with every additional raven (Coates and Delehanty 2010). Around Jackson and Pinedale, Wyo-ming, Bui et al. (2010) found that higher occupancy rates of ravens were correlated with failed sage-grouse nests.
Magpies depredate sage-grouse nests (Holloran and Ander-son 2003), and they are capable of consuming animals as large as sage-grouse chicks (Trost 1999). Magpies are known to be as-sociated with riparian areas but also forage in sagebrush habi-tats (Trost 1999). Thus, sage-grouse avoidance of magpies during nesting may be related to sage-grouse avoidance of riparian areas within or adjacent to sagebrush habitat; however, sage-grouse are known to utilize riparian areas for foraging chicks (Connelly et al. 2004, Crawford et al. 2004). Our results indicate that sage-grouse select habitat for brood rearing with lower abundances of magpies, even while balancing the need to utilize habitats, such as riparian habitats, that provide forage to meet the energetic requirements of chicks. Sage-grouse hens typically move broods to riparian areas after early brood rearing (Crawford et al. 2004, Gregg and Craw-ford 2009), which may correspond with chicks being more mobile and less susceptible to predation by magpies.
Golden Eagles are the primary predator of adult sage-grouse (Schroeder et al. 1999, Schroeder and Baydack 2001, Mezquida et al. 2006). In southwestern Wyoming, MacLaren et al. (1988) found that birds comprised ~9% of the diet of nesting Golden Eagles, and sage-grouse was their primary avian prey. In Utah, 55% of radiomarked sage-grouse were killed by raptors, which Danvir (2002) attributed mainly to Golden Eagles. Hence, we were not surprised that sage-grouse pay particular attention to them in locating where to nest and raise their brood. Ferruginous Hawks, Red-tailed Hawks, and Swainson’s Hawks take some adult sage-grouse but probably not substantial numbers (MacLaren et al. 1988); harriers have been seen to hunt sage-grouse adults and chicks (Schroeder et al. 1999, Schroeder and Baydack 2001, Fletcher et al. 2003). Our GLMM analysis indicated that sage-grouse did not differentiate among all Buteo, harriers, and ravens, and instead treated them as a group to be avoided on the basis of body size.
Our GLMM results showed that sage-grouse were able to avoid small, medium, and large avian predators. This suggests that sage-grouse are not subject to predator facilitation by avian predators. Predator facilitation predicts that antipredation behav-iors that protect prey species from one type of predator may ex-pose them to predation from other types of predators (Kotler et al. 1992, Korpimäki et al. 1996). For example, the risk of predation by Eurasian Eagle Owls (Bubo bubo) resulted in gerbils (Gerbillus allenbyi and G. pyramidum) selecting habitat that increased their exposure to predation by Greater Sand Vipers (Cerastes cerastes; Kotler et al. 1992). By hiding from and avoiding avian predators, sage-grouse may reduce their risk of predation from avian pred-ators of multiple sizes, while potentially exposing themselves to olfactory (mammalian) predation. However, the possible effects of predator facilitation between predators that hunt by primarily visual or olfactory means are beyond the scope of this study and warrant further research.
Sage-grouse preferentially select cover that offers greater vi-sual concealment for nesting to hide themselves and their nests from visual predators (Conover et al. 2010), and the probability of raven depredation of a sage-grouse nest has been found to be greater at nests with relatively less canopy cover (Coates and Dele-hanty 2010). Selection for hiding from and avoiding visually hunt-ing predators through indirect means (i.e., habitat features and anthropogenic structures) and, possibly, direct means entails se-lection at multiple scales. At the local scale, sage-grouse appear to prefer sites where they are visually concealed from avian preda-tors (Connelly et al. 2004, Doherty et al. 2010, Kirol et al. 2012). At landscape scales, they may prefer areas where avian predators are less abundant. Sage-grouse selection of habitat at multiple scales achieves the same thing—reduced risk from avian predators.
Predator avoidance behavior is a common consequence of predation risk (Cresswell 2008). Sage-grouse avoidance of preda-tors has been addressed in the context of using cover to hide from predators; however, nesting and brood-rearing sage-grouse may also directly avoid avian predators. Previous research has not examined the possibility that sage-grouse directly avoid preda-tors, but studies on other avian species have demonstrated di-rect avoidance of avian predators. For example, large numbers of Western Sandpipers (Calidris mauri) avoided migration stopover areas where Peregrine Falcons (Falco peregrinus) were present (Ydenberg et al. 2002); they also shortened migratory stopover du-ration at locations, possibly to avoid migrating Peregrine Falcons (Ydenberg et al. 2004). Boreal Owls (Aegolius funereus) nested away from Ural Owl (Strix uralensis) nests (Hakkarainen and Korpimäki 1996), and Black Kite (Milvus migrans) nests were lo-cated away from nesting Eurasian Eagle Owls (Sergio et al. 2003). Among passerines, Sky Larks (Alauda arvensi) and Yellowham-mers (Emberiza citrinella) avoided nesting close to European Kestrel (F. tinnunculus) nests (Norrdahl and Korpimäki 1998), Red-backed Shrikes (Lanius collurio) avoided nesting near mag-pie and Hooded Crow (Corvus corone cornix) breeding territories (Roos and Pärt 2004), and nesting Pied Flycatchers (Ficedula hy-poleuca) avoided Eurasian Sparrowhawk (Accipiter nisus) nests (Thomson et al. 2006).
Increases in avian predator densities are likely to result in higher depredation rates on sage-grouse nests and reduced chick survival (Evans 2004, Cresswell 2008). Sage-grouse hens

608 — Dinkins et al. — auk, vol. 129
likely avoid avian predators to enhance their own prospects of survival, but also to reduce depredation rates on their nests and chicks. Thus, the presence of greater abundances of avian predators, specifically corvids and raptors, may induce changes in sage-grouse behavior associated with habitat use. Sage-grouse reduce time off of their nests when they inhabit areas near high abundances of ravens (Coates and Delehanty 2008); thus, in addition to using indirect mechanisms, sage-grouse may use avian predator abundance directly to evaluate predation risk while nest-ing. Habitat that has high-quality cover and forage may become functionally unavailable to sage-grouse when avian predator den-sities are at high levels. Cresswell’s (2008) review of nonlethal effects of predator avoidance showed that several studies on birds indicated that the presence of a predator had dramatic effects on habitat use by prey species, and that the effects were as great as or greater than the effects of direct predation. Regardless of the mechanisms behind sage-grouse hens’ selection of habitat with fewer avian predators, our results illustrate that sage-grouse were capable of avoiding areas with relatively higher densities of small, medium, and large avian predators—specifically, Buteo species, Golden Eagles, kestrels, magpies, and ravens—compared with available sagebrush habitat.
AcknowledgMents
Research funding was provided by the Anadarko Petroleum Cor-poration, Jack H. Berryman Institute, Lincoln County Predator Management Board, Predatory Animal District of Sweetwater County, School of Energy Resources at the University of Wyo-ming, South Central Wyoming Local Sage-Grouse Work Group, Uinta County Predator Management Board, Utah Agricultural Experiment Station (publication number 8434), Wyoming Ani-mal Damage Management Board, and Wyoming Game and Fish Department. We greatly appreciate the logistical support pro-vided by F. Blomquist, T. Christiansen, T. Clayson, R. Etzelmiller, M. Holloran, N. Hymas, D. Oles, L. Oles, L. McCarthy, C. Morton, M. Murry, C. Powell, N. Tratnik, M. Zornes, and many others. We thank our many field technicians, G. Bowman, J. Boyd, V. Burd, S. Etschmaier, M. Evans, E. Haug, H. Jones, J. Julien, K. Kelson, R. Laymon, C. Polfus, C. Potter, Z. Primeau, R. Pyles, S. Rowbottom, N. Schmitz, K. Smith, N. Schwertner, R. Watson, and D. White, and thank the editorial help provided by P. Coates, N. Lecomte, K. Schmidt, and others. We also give a special thanks to the coop-eration of the many landowners throughout southwest and south-central Wyoming for allowing access to private lands.
liteRAtuRe cited
Aldridge, C. L. 2005. Identifying habitats for persistence of Greater Sage-Grouse (Centrocercus urophasianus) in Alberta, Canada. Ph.D. dissertation. University of Alberta, Edmonton.
Aldridge, C. L., and R. M. Brigham. 2002. Sage-grouse nesting and brood habitat use in southern Canada. Journal of Wildlife Management 66:433–444.
Anderson, D. R. 2008. Model Based Inference in the Life Sciences: A Primer on Evidence. Springer Science, New York.
Boarman, W. I., and B. Heinrich. 1999. Common Raven (Cor-vus corax). In The Birds of North America, no. 476 (A. Poole and
F. Gill, Eds.). Academy of Natural Sciences, Philadelphia, and American Ornithologists’ Union, Washington, D.C.
Braun, C. E. 1998. Sage grouse declines in western North America: What are the problems? Proceedings of the Western Association of Fish and Wildlife Agencies 78:139−156.
Buckland, S. T., D. R. Anderson, K. P. Burnham, and J. L. Laake. 1993. Distance Sampling: Estimating Abundance of Bio-logical Populations. Chapman and Hall, New York.
Buckland, S. T., D. R. Anderson, K. P. Burnham, J. L. Laake, D. L. Borchers, and L. Thomas. 2001. Introduction to Dis-tance Sampling: Estimating Abundance of Biological Popula-tions. Oxford University Press, New York.
Bui, T. D., J. M. Marzluff, and B. Bedrosian. 2010. Common Raven activity in relation to land use in western Wyoming: Impli-cations for Greater Sage-Grouse reproductive success. Condor 112:65−78.
Burnham, K. P., and D. R. Anderson. 2002. Model Selection and Multimodel Inference: A Practical Information–Theoretic Approach, 2nd ed. Springer-Verlag, New York.
Chalfoun, A. D., and T. E. Martin. 2009. Habitat structure mediates predation risk for sedentary prey: Experimental tests of alternative hypotheses. Journal of Animal Ecology 78:497−503.
Coates, P. S., J. W. Connelly, and D. J. Delehanty. 2008. Preda-tors of Greater Sage-Grouse nests identified by video monitoring. Journal of Field Ornithology 79:421−428.
Coates, P. S., and D. J. Delehanty. 2008. Effects of environ-mental factors on incubation patterns of Greater Sage-Grouse. Condor 110:627−638.
Coates, P. S., and D. J. Delehanty. 2010. Nest predation of Greater Sage-Grouse in relation to microhabitat factors and pred-ators. Journal of Wildlife Management 74:240–248.
Connelly, J. W., S. T. Knick, M. A. Schroeder, and S. J. Stiver. 2004. Conservation assessment of Greater Sage-Grouse and sage-brush habitats. Western Association of Fish and Wildlife Agen-cies, Cheyenne, Wyoming. [Online.] Available at www.ndow.org/wild/conservation/sg/resources/greate_sg_cons_assessment.pdf.
Connelly, J. W., K. P. Reese, and M. A. Schroeder. 2003. Moni-toring of Greater Sage-Grouse habitats and populations. College of Natural Resources Experiment Station Bulletin 80. University of Idaho, Moscow.
Connelly, J. W., K. P. Reese, W. L. Wakkinen, M. D. Robert-son, and R. A. Fischer. 1994. Sage grouse ecology report. Job Completion Report W-160-R-19. Idaho Department of Fish and Game, Boise.
Conover, M. R. 2007. Predator−Prey Dynamics: The Use of Olfac-tion. Taylor and Francis, Boca Raton, Florida.
Conover, M. R., J. S. Borgo, R. E. Dritz, J. B. Dinkins, and D. K. Dahlgren. 2010. Greater Sage-Grouse select nest sites to avoid visual predators but not olfactory predators. Condor 112:331−336.
Crawford, J. A., R. A. Olson, N. E. West, J. C Mosley, M. A. Schroeder, T. D. Whitson, R. F. Miller, M. A. Gregg, and C. S. Boyd. 2004. Ecology and management of sage-grouse and sage-grouse habitat. Journal of Range Management 57:2−19.
Creel, S., and D. Christianson. 2008. Relationships between direct predation and risk effects. Trends in Ecology & Evolution 23:194−201.
Cresswell, W. 2008. Non-lethal effects of predation in birds. Ibis 150:3−17.

octoBeR 2012 — avian pReDatoRs anD GReateR saGe-GRouse — 609
Danvir, R. E. 2002. Sage grouse ecology and management in north-ern Utah sagebrush-steppe. Deseret Land and Livestock Wildlife Research Report. Deseret Land and Livestock Ranch and the Utah Foundation for Quality Resource Management, Woodruff.
DeLong, J. P. 2004. Effects of management practices on grassland birds: Golden Eagle. Northern Prairie Wildlife Research Center, Jamestown, North Dakota. [Online.] Available at www.npwrc.usgs.gov/resource/literatr/grasbird/goea/goea.htm.
Doherty, K. E., D. E. Naugle, and B. L. Walker. 2010. Greater Sage-Grouse nesting habitat: The importance of managing at multiple scales. Journal of Wildlife Management 74:1544–1553.
Dormann, C. F., J. M. McPherson, M. B. Araújo, R. Bivand, J. Bolliger, G. Carl, R. G. Davies, A. Hirzel, W. Jetz, W. D. Kissling, and others. 2007. Methods to account for spa-tial autocorrelation in the analysis of species distributional data: A review. Ecography 30:609–628.
Evans, K. L. 2004. The potential for interactions between preda-tion and habitat change to cause population declines of farmland birds. Ibis 146:1–13.
Fletcher, Q. E., C. W. Dockrill, D. J. Saher, and C. L. Aldridge. 2003. Northern Harrier, Circus cyaneaus, attacks on Greater Sage-Grouse, Centrocercus urophasianus, in southern Alberta. Canadian Field-Naturalist 117:479–480.
Giesen, K. M., T. J. Schoenberg, and C. E. Braun. 1982. Methods for trapping sage grouse in Colorado. Wildlife Society Bulletin 10:224–231.
Gregg, M. A., and J. A. Crawford. 2009. Survival of Greater Sage-Grouse chicks and broods in the northern Great Basin. Journal of Wildlife Management 73:904–913.
Gregg, M. A., J. A. Crawford, M. S. Drut, and A. K. DeLong. 1994. Vegetational cover and predation of sage-grouse nests in Oregon. Journal of Wildlife Management 58:162–166.
Guttery, M. R. 2011. Ecology and management of a high elevation southern range Greater Sage-Grouse population: Vegetations manipulation, early chick survival, and hunter motivations. Ph.D. dissertation, Utah State University, Logan.
Hakkarainen, H., and E. Korpimäki. 1996. Competitive and predatory interactions among raptors: An observational and experimental study. Ecology 77:1134–1142.
Holloran, M. J., and S. H. Anderson. 2003. Direct identification of northern sage-grouse, Centrocercus urophasianus, nest pred-ators using remote sensing cameras. Canadian Field-Naturalist 117:308–310.
Holloran, M. J., and S. H. Anderson. 2005. Spatial distribution of Greater Sage-Grouse nests in relatively contiguous sagebrush habitats. Condor 107:742–752.
Holloran, M. J., B. J. Heath, A. G. Lyon, S. J. Slater, J. L. Kuipers, and S. H. Anderson. 2005. Greater Sage-Grouse nesting habitat selection and success in Wyoming. Journal of Wildlife Management 69:638–649.
Johnsgard, P. A. 2002. Grassland Grouse and Their Conservation. Smithsonian Institution Press, Washington, D.C.
Kaczor, N. W. 2008. Nesting and brood-rearing success and resource selection of Greater Sage-Grouse in northwestern South Dakota. M.S. thesis, South Dakota State University, Brookings.
Kirol, C. P., J. L. Beck, J. B. Dinkins, and M. R. Conover. 2012. Greater Sage-Grouse nesting and brood-rearing microhabitat selection in xeric big sagebrush. Condor 114:75–89.
Korpimäki, E., V. Koivunen, and H. Hakkarainen. 1996. Microhabitat use and behavior of voles under weasel and rap-tor predation risk: Predator facilitation? Behavioral Ecology 7:30–34.
Kotler, B. P., L. Blaustein, and J. S. Brown. 1992. Predator facil-itation: The combined effect of snakes and owls on the foraging behavior of gerbils. Annales Zoologici Fennici 29:199–206.
MacLaren, P. A., S. H. Anderson, and D. E. Runde. 1988. Food habits and nest characteristics of breeding raptors in southwest-ern Wyoming. Great Basin Naturalist 48:548–553.
Manzer, D. L., and S. J. Hannon. 2005. Relating grouse nest suc-cess and corvid density to habitat: A multi-scale approach. Jour-nal of Wildlife Management 69:110–123.
Martin, T. E., and J. V. Briskie. 2009. Predation on dependent off-spring: A review of the consequences for mean expression and phenotypic plasticity in avian life history traits. Annals of the New York Academy of Sciences 1168:201–217.
Mezquida, E. T., S. J. Slater, and C. W. Benkman. 2006. Sage-grouse and indirect interactions: Potential implications of coyote control on sage-grouse populations. Condor 108:747–759.
Norrdahl, K., and E. Korpimäki. 1998. Fear in farmlands: How much does predator avoidance affect bird community structure? Journal of Avian Biology 29:79–85.
Ralph, C. J., S. Droege, and J. R. Sauer, Eds. 1995. Managing and monitoring birds using point counts: Standards and applications. U.S. Department of Agriculture, Forest Service General Techni-cal Report PSW-GTR-149.
Roos, S., and T. Pärt. 2004. Nest predators affect spatial dynamics of breeding Red-backed Shrikes (Lanius collurio). Journal of Ani-mal Ecology 73:117–127.
Sargeant, A. B., M. A. Sovada, and T. L. Shaffer. 1995. Seasonal predator removal relative to hatch rate of duck nests in Waterfowl Production Areas. Wildlife Society Bulletin 23:507–513.
Schroeder, M. A., C. L. Aldridge, A. D. Apa, J. R. Bohne, C. E. Braun, S. D. Bunnell, J. W. Connelly, P. A. Deibert, S. C. Gardner, M. A. Hilliard, and others. 2004. Distribution of sage-grouse in North America. Condor 106:363–376.
Schroeder, M. A., and R. K. Baydack. 2001. Predation and the management of prairie grouse. Wildlife Society Bulletin 29: 24–32.
Schroeder, M. A., J. R. Young, and C. E. Braun. 1999. Sage grouse (Centrocercus urophasianus). In The Birds of North America, no. 425 (A. Poole and F. Gill, Eds.). Academy of Natu-ral Sciences, Philadelphia, and American Ornithologists’ Union, Washington, D.C.
Sergio, F., L. Marchesi, and P. Pedrini. 2003. Spatial refugia and the coexistence of a diurnal raptor with its intraguild owl preda-tor. Journal of Animal Ecology 72:232–245.
Smith, P. A., H. G. Gilchrist, and J. N. M. Smith. 2007. Effects of nest habitat, food, and parental behavior on shorebird nest suc-cess. Condor 109:15–31.
Thomas, L., S. T. Buckland, E. A. Rexstad, J. L. Laake, S. Strindberg, S. L. Hedley, J. R. B. Bishop, R. A. Marques, and K. P. Burnham. 2010. DISTANCE software: Design and analysis of distance sampling surveys for estimating population size. Journal of Applied Ecology 47:5–14.
Thomson, R. L., J. T. Forsman, F. Sardà-Palomera, and M. Mönkkönen. 2006. Fear factor: Prey habitat selection and
610 — Dinkins et al. — auk, vol. 129
its consequences in a predation risk landscape. Ecography 29: 507–514.
Trost, C. H. 1999. Black-billed Magpie (Pica hudsonia). In The Birds of North America, no. 389 (A. Poole and F. Gill, Eds.). Academy of Natural Sciences, Philadelphia, and American Ornithologists’ Union, Washington, D.C.
U.S. Fish and Wildlife Service. 2010. Endangered and Threat-ened Wildlife and Plants; 12-month findings for petitions to list the Greater Sage-Grouse (Centrocercus urophasianus) as threat-ened or endangered. Federal Register 75:13909–14014.
Verdolin, J. L. 2006. Meta-analysis of foraging and predation risk trade-offs in terrestrial systems. Behavioral Ecology and Socio-biology 60:457–464.
Wakkinen, W. L., K. P. Reese, J. W. Connelly, and R. A. Fischer. 1992. An improved spotlighting technique for captur-ing sage grouse. Wildlife Society Bulletin 20:425–426.
Wallestad, R. O., and D. B. Pyrah. 1974. Movement and nest-ing of sage grouse hens in central Montana. Journal of Wildlife Management 38:630–633.
Ydenberg, R. C., R. W. Butler, D. B. Lank, C. G. Guglielmo, M. Lemon, and N. Wolf. 2002. Trade-offs, condition depen-dence and stopover site selection by migrating sandpipers. Jour-nal of Avian Biology 33:47–55.
Ydenberg, R. C., R. W. Butler, D. B. Lank, B. D. Smith, and J. Ireland. 2004. Western Sandpipers have altered migration tactics as Peregrine Falcon populations have recovered. Proceed-ings of the Royal Society of London, Series B 271:1263–1269.
Zanette, L. Y., A. F. White, M. C. Allen, and M. Clinchy. 2011. Perceived predation risk reduces the number of offspring song-birds produce per year. Science 334:1398–1401.
Associate Editor: K. Schmidt
Related Documents


![The Institute for Bird Populations – Home Page · Chad B. Bell] and T. Luke George2 success of Greater Sage-Crouse (Centrocercus urophasianus) is generally measured by documenting](https://static.cupdf.com/doc/110x72/5f83aa5a05907f424d707924/the-institute-for-bird-populations-a-home-page-chad-b-bell-and-t-luke-george2.jpg)

