Deutsche Bank Markets Research Asia China Consumer Industry Greater China Sporting Goods Date 21 February 2017 Recommendation Change FY16 preview: Time to buy US- exporting ODMs; upgrading YY to Buy Buy Eclat, YY, FT & PS; stay cautious into Anta’s 2H16 results ________________________________________________________________________________________________________________ Deutsche Bank AG/Hong Kong Deutsche Bank does and seeks to do business with companies covered in its research reports. Thus, investors should be aware that the firm may have a conflict of interest that could affect the objectivity of this report. Investors should consider this report as only a single factor in making their investment decision. DISCLOSURES AND ANALYST CERTIFICATIONS ARE LOCATED IN APPENDIX 1. MCI (P) 057/04/2016. John Chou Research Analyst (+852 ) 2203 6196 [email protected] Anne Ling Research Analyst (+852 ) 2203 6177 [email protected] Key Changes Company Target Price Rating 0551.HK 35.00 to 38.00(HKD) Hold to Buy 1476.TW 435.00 to 430.00(TWD) - 2313.HK 62.00 to 56.00(HKD) - 9910.TW 170.00 to 156.00(TWD) - 2020.HK 24.00 to 26.50(HKD) Buy to Hold 2331.HK 6.20 to 5.90(HKD) - Source: Deutsche Bank Top picks Yue Yuen (0551.HK),HKD26.95 Buy Eclat Textile (1476.TW),TWD309.00 Buy Feng Tay (9910.TW),TWD130.00 Buy Pou Sheng (3813.HK),HKD1.94 Buy Source: Deutsche Bank The upcoming earnings could be mixed for the sporting goods space, with YY (Yue Yuen) likely delivering a more meaningful beat. Having said that, we believe the results and management comments will improve the sentiment for US-exporting ODMs. We thus recommend buying Eclat, FT (Feng Tay) and we upgrade YY to Buy. PS’s 2017 growth may surprise to the upside, but its 4Q16 results may miss. Any weakness post results should be a buying opportunity. We expect the market to digest emerging uncertainties on SZ (Shenzhou) and LN (Li Ning). We view Anta’s multi-brand strength as priced-in, with growing uncertainties on the Anta Adult orderbook. We thus downgrade it to Hold. Upcoming results: be selective; US recovery is our best theme For ODMs: YY’s 4Q16 earnings may beat market expectations, while Eclat and FT could be mixed. Nevertheless, we expect the US-driven exporters to deliver positive comments regarding a US market recovery. SZ’s 2H16 results should be in line, but we anticipate more investor questions on its 2017 growth outlook. For domestic sportswear companies: Anta’s 2H16 earnings are likely to beat consensus, thanks to heavier inventory build by wholesalers during 2H16. We lack conviction on LN’s 2H16 earnings but expect positives including off-line and e-commerce sell-through growth. PS’s 4Q16 earnings may miss due to unsuccessful discount in November (highlighted previously). Incremental to our view: higher conviction on US-exporting ODMs Eclat will likely add a new e-commerce private label client in 3Q17. Our recent conversations with Eclat’s private competitors show the strong demand for jacquard fabric and Eclat’s dominant position. YY will likely benefit from Adidas’s order shift from Apache. Our profit analysis uncovers YY’s significant non-recurring loss in 2016 and potential to recover. FT’s anchor basketball shoes have finally entered mass production. This, along with better demand for the Kobe Bryant series, will likely boost FT’s shares. PS should demonstrate stronger-than-expected momentum in 2017. We also detected the first breakeven of PS’s e-commerce business in 2016. Some issues the markets need to digest SZ: 2017 gross margin pressure and a slowdown in Flyknit upper orders may lead to uncertainties. But we argue the negatives are temporary by nature. LN’s 2017 expenses outlook may be higher than some investors’ expectation. But we view the expenses as necessary investments to optimize its channels. Also, LN’s profitable e-commerce business shouldn’t be ignored by investors. Anta: we estimate a slight rise in inventory levels. Although the current level (5-6 months) is far from the crisis level (over 10 months), we anticipate Anta’s wholesalers to reduce orders from the 4Q17 sales fair, to take a breather. Valuation and risks to our positive industry view We value the sporting goods sector using DCF, as we expect investors to focus on the sector’s long-term value creation. For WACC, we follow DB’s view on RFR and ERP while assigning a beta of 0.9 to 1.3 and terminal growth of 1-2%. Downside risks: weaker cyclical recovery, weaker innovation, sports segmentation ad e-commerce failing to drive sector growth. Upside risks (Anta): faster destocking by wholesalers, stronger performance by new brands. Distributed on: 20/02/2017 22:57:48 GMT

Welcome message from author
This document is posted to help you gain knowledge. Please leave a comment to let me know what you think about it! Share it to your friends and learn new things together.
Transcript

Deutsche Bank Markets Research
Asia
China
Consumer
Industry
Greater China Sporting Goods
Date
21 February 2017
Recommendation Change
FY16 preview: Time to buy US-exporting ODMs; upgrading YY to Buy Buy Eclat, YY, FT & PS; stay cautious into Anta’s 2H16 results
________________________________________________________________________________________________________________
Deutsche Bank AG/Hong Kong
Deutsche Bank does and seeks to do business with companies covered in its research reports. Thus, investors should be aware that the firm may have a conflict of interest that could affect the objectivity of this report. Investors should consider this report as only a single factor in making their investment decision. DISCLOSURES AND ANALYST CERTIFICATIONS ARE LOCATED IN APPENDIX 1. MCI (P) 057/04/2016.
John Chou
Research Analyst
(+852 ) 2203 6196
Anne Ling
Research Analyst
(+852 ) 2203 6177
Key Changes
Company Target Price Rating
0551.HK 35.00 to 38.00(HKD)
Hold to Buy
1476.TW 435.00 to 430.00(TWD)
-
2313.HK 62.00 to 56.00(HKD)
-
9910.TW 170.00 to 156.00(TWD)
-
2020.HK 24.00 to 26.50(HKD)
Buy to Hold
2331.HK 6.20 to 5.90(HKD) -
Source: Deutsche Bank
Top picks
Yue Yuen (0551.HK),HKD26.95 Buy
Eclat Textile (1476.TW),TWD309.00 Buy
Feng Tay (9910.TW),TWD130.00 Buy
Pou Sheng (3813.HK),HKD1.94 Buy
Source: Deutsche Bank
The upcoming earnings could be mixed for the sporting goods space, with YY (Yue Yuen) likely delivering a more meaningful beat. Having said that, we believe the results and management comments will improve the sentiment for US-exporting ODMs. We thus recommend buying Eclat, FT (Feng Tay) and we upgrade YY to Buy. PS’s 2017 growth may surprise to the upside, but its 4Q16 results may miss. Any weakness post results should be a buying opportunity. We expect the market to digest emerging uncertainties on SZ (Shenzhou) and LN (Li Ning). We view Anta’s multi-brand strength as priced-in, with growing uncertainties on the Anta Adult orderbook. We thus downgrade it to Hold.
Upcoming results: be selective; US recovery is our best theme For ODMs: YY’s 4Q16 earnings may beat market expectations, while Eclat and FT could be mixed. Nevertheless, we expect the US-driven exporters to deliver positive comments regarding a US market recovery. SZ’s 2H16 results should be in line, but we anticipate more investor questions on its 2017 growth outlook. For domestic sportswear companies: Anta’s 2H16 earnings are likely to beat consensus, thanks to heavier inventory build by wholesalers during 2H16. We lack conviction on LN’s 2H16 earnings but expect positives including off-line and e-commerce sell-through growth. PS’s 4Q16 earnings may miss due to unsuccessful discount in November (highlighted previously).
Incremental to our view: higher conviction on US-exporting ODMs Eclat will likely add a new e-commerce private label client in 3Q17. Our recent conversations with Eclat’s private competitors show the strong demand for jacquard fabric and Eclat’s dominant position. YY will likely benefit from Adidas’s order shift from Apache. Our profit analysis uncovers YY’s significant non-recurring loss in 2016 and potential to recover. FT’s anchor basketball shoes have finally entered mass production. This, along with better demand for the Kobe Bryant series, will likely boost FT’s shares. PS should demonstrate stronger-than-expected momentum in 2017. We also detected the first breakeven of PS’s e-commerce business in 2016.
Some issues the markets need to digest SZ: 2017 gross margin pressure and a slowdown in Flyknit upper orders may lead to uncertainties. But we argue the negatives are temporary by nature. LN’s 2017 expenses outlook may be higher than some investors’ expectation. But we view the expenses as necessary investments to optimize its channels. Also, LN’s profitable e-commerce business shouldn’t be ignored by investors. Anta: we estimate a slight rise in inventory levels. Although the current level (5-6 months) is far from the crisis level (over 10 months), we anticipate Anta’s wholesalers to reduce orders from the 4Q17 sales fair, to take a breather.
Valuation and risks to our positive industry view We value the sporting goods sector using DCF, as we expect investors to focus on the sector’s long-term value creation. For WACC, we follow DB’s view on RFR and ERP while assigning a beta of 0.9 to 1.3 and terminal growth of 1-2%. Downside risks: weaker cyclical recovery, weaker innovation, sports segmentation ad e-commerce failing to drive sector growth. Upside risks (Anta): faster destocking by wholesalers, stronger performance by new brands.
Distributed on: 20/02/2017 22:57:48 GMT

21 February 2017
Consumer
Greater China Sporting Goods
Page 2 Deutsche Bank AG/Hong Kong
2H16 /4Q16 preview
Our best ideas and what’s likely to drive the share price
Idea 1: Buy Eclat now New clients: likely including a private activewear label by a major e-
commerce operator (Figure 17).
New products in robust demand: private competitors’ interviews unveil the strong potential of jacquard (Figure 18).
Idea 2: Buy Yue Yuen now; upgrading it to Buy Painful plant shift finally done: The China plants profit analysis points
to significant room for improvement (Figure 31).
Adidas order shift boosts revenue: Apache’s order loss (Figure 39).
Idea 3: Buy Feng Tay now Lebron James Signature has started mass production and Kobe Bryant
line is surprisingly strong (Figure 50).
Nike’s recovery (Figure 52).
Idea 4: Buy Pou Sheng, any weakness post results should be seen as buying
opportunity 2017 revenue growth to outpace market expectation (Figure 65).
In-house e-commerce likely turned profitable in 2016 (Figure 66).
Concerns on accounting mistreatment soon removed.
Shenzhou: non-recurring negatives to drive Buy opportunities Gross margin pressure from once-every-three-year wage hike (Figure
80).
Flyknit order slowdown temporary (Figure 82).
Li Ning: constructively increasing 2017 expenses Investment in channels (Figure 93).
Profitable e-commerce business (Figure 96).
Anta: market may need to digest Anta Adult orderbook; downgrading to Hold Anta Adult wholesalers may need to destock (Figure 103).
Multi-brand strategy performing well (Figure 109).
Figure 1: Top picks – US-exporting ODMs (Eclat, Yue Yuen, Feng Tay), also Pou Sheng
Name Ticker Rating Mkt Cap Close PX Target PX Upside Methodology Revenue mix (2015) 17E PER 17E EPS Dividend
(USDbn) (local) (local) YoY Yield
Eclat 1476 HK Buy 2.5 309 430 39% DCF (25x PER*) Major sports brands (30%)
Private label (30%)
18 23% 3%
Yue Yuen 551 HK Buy 5.7 26.95 38 41% DCF (15x PER*) ODM: NKE (27%), ADS (23%) 11 9% 6%
Feng Tay 9910 TT Buy 2.3 130 156 20% DCF (19x PER*) NKE (81%, basketball shoes) 16 15% 4%
Pou Sheng 3813 HK Buy 1.3 1.94 3.1 60% DCF (14x PER*) Retail (80%), Wholesale (20%) 9 36% 2%
Shenzhou 2313 HK Buy 8.6 47.7
56 17% DCF (21x PER*) Uniqlo (30%), NKE (30%)
ADS (22%)
19 13% 3%
Li Ning 2331 HK Buy 1.5 5.15 5.9 15% DCF (21x PER*) Wholesale (55%), Retail (34%) 17 73% 2%
Anta 2020 HK Hold 8.1 25 26.5 6% DCF (21x PER*) Anta brand (83%), Fila (17%) 19 21% 3%
Source: Deutsche Bank estimates, Bloomberg Finance LP, Company data *2017 PER, Using closing price as of 20 February 2017
21 February 2017
Consumer
Greater China Sporting Goods
Deutsche Bank AG/Hong Kong Page 3
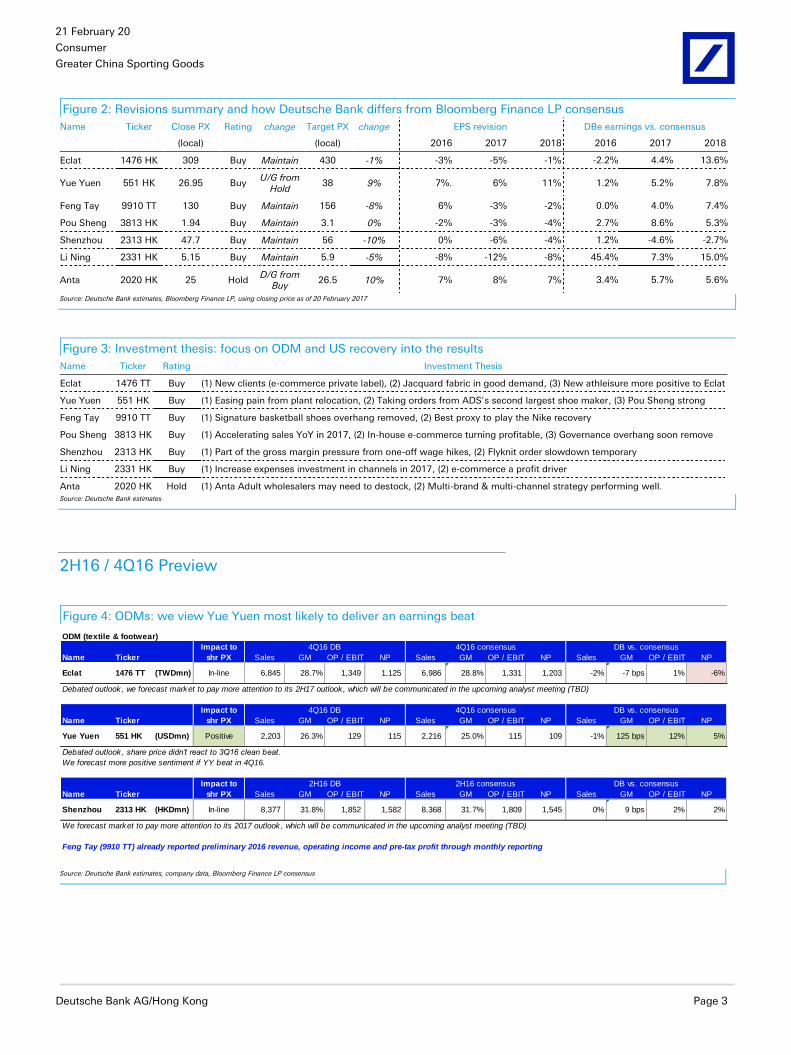
Figure 2: Revisions summary and how Deutsche Bank differs from Bloomberg Finance LP consensus
Name Ticker Close PX Rating change Target PX change EPS revision DBe earnings vs. consensus
(local) (local) 2016 2017 2018 2016 2017 2018
Eclat 1476 HK 309 Buy Maintain 430 -1% -3% -5% -1% -2.2% 4.4% 13.6%
Yue Yuen 551 HK 26.95 Buy U/G from
Hold 38 9% 7%. 6% 11% 1.2% 5.2% 7.8%
Feng Tay 9910 TT 130 Buy Maintain 156 -8% 6% -3% -2% 0.0% 4.0% 7.4%
Pou Sheng 3813 HK 1.94 Buy Maintain 3.1 0% -2% -3% -4% 2.7% 8.6% 5.3%
Shenzhou 2313 HK 47.7 Buy Maintain 56 -10% 0% -6% -4% 1.2% -4.6% -2.7%
Li Ning 2331 HK 5.15 Buy Maintain 5.9 -5% -8% -12% -8% 45.4% 7.3% 15.0%
Anta 2020 HK 25 Hold D/G from
Buy 26.5 10% 7% 8% 7% 3.4% 5.7% 5.6%
Source: Deutsche Bank estimates, Bloomberg Finance LP, using closing price as of 20 February 2017
Figure 3: Investment thesis: focus on ODM and US recovery into the results
Name Ticker Rating Investment Thesis
Eclat 1476 TT Buy (1) New clients (e-commerce private label), (2) Jacquard fabric in good demand, (3) New athleisure more positive to Eclat
Yue Yuen 551 HK Buy (1) Easing pain from plant relocation, (2) Taking orders from ADS’s second largest shoe maker, (3) Pou Sheng strong
Feng Tay 9910 TT Buy (1) Signature basketball shoes overhang removed, (2) Best proxy to play the Nike recovery
Pou Sheng 3813 HK Buy (1) Accelerating sales YoY in 2017, (2) In-house e-commerce turning profitable, (3) Governance overhang soon remove
Shenzhou 2313 HK Buy (1) Part of the gross margin pressure from one-off wage hikes, (2) Flyknit order slowdown temporary
Li Ning 2331 HK Buy (1) Increase expenses investment in channels in 2017, (2) e-commerce a profit driver
Anta 2020 HK Hold (1) Anta Adult wholesalers may need to destock, (2) Multi-brand & multi-channel strategy performing well. Source: Deutsche Bank estimates
2H16 / 4Q16 Preview
Figure 4: ODMs: we view Yue Yuen most likely to deliver an earnings beat
ODM (textile & footwear)
Impact to
Name Ticker shr PX Sales GM OP / EBIT NP Sales GM OP / EBIT NP Sales GM OP / EBIT NP
Eclat 1476 TT (TWDmn) In-line 6,845 28.7% 1,349 1,125 6,986 28.8% 1,331 1,203 -2% -7 bps 1% -6%
Debated outlook, we forecast market to pay more attention to its 2H17 outlook, which will be communicated in the upcoming analyst meeting (TBD)
Impact to
Name Ticker shr PX Sales GM OP / EBIT NP Sales GM OP / EBIT NP Sales GM OP / EBIT NP
Yue Yuen 551 HK (USDmn) Positive 2,203 26.3% 129 115 2,216 25.0% 115 109 -1% 125 bps 12% 5%
Debated outlook, share price didn’t react to 3Q16 clean beat.
We forecast more positive sentiment if YY beat in 4Q16.
Impact to
Name Ticker shr PX Sales GM OP / EBIT NP Sales GM OP / EBIT NP Sales GM OP / EBIT NP
Shenzhou 2313 HK (HKDmn) In-line 8,377 31.8% 1,852 1,582 8,368 31.7% 1,809 1,545 0% 9 bps 2% 2%
We forecast market to pay more attention to its 2017 outlook, which will be communicated in the upcoming analyst meeting (TBD)
Feng Tay (9910 TT) already reported preliminary 2016 revenue, operating income and pre-tax profit through monthly reporting
4Q16 DB 4Q16 consensus DB vs. consensus
4Q16 DB 4Q16 consensus DB vs. consensus
2H16 DB 2H16 consensus DB vs. consensus
Source: Deutsche Bank estimates, company data, Bloomberg Finance LP consensus

21 February 2017
Consumer
Greater China Sporting Goods
Page 4 Deutsche Bank AG/Hong Kong
Figure 5: Sportswear: we expect solid earnings and operation data from Anta, but 2017 orderbook outlook may see
risks. We forecast positive operation data from Li Ning
Sportswear (domestic brands & distributors)
Impact to
Name Ticker shr PX Sales GM OP / EBIT NP Sales GM OP / EBIT NP Sales GM OP / EBIT NP
Anta 2020 HK (CNYmn) Positive 7,637 47.5% 1,785 1,339 7,204 47.8% 1,645 1,257 6% -27 bps 9% 7%
Strong earnings growth in 2H16 likely well-communicated with investors.
Impact to
shr PX +ve / -ve DB Consen. Previous +ve / -ve DB Consen. Previous +ve / -ve DB Consen. Previous*
Anta 2020 HK OP data Mixed +ve +HSD~LDD +HSD +LDD =ve +LSD~MSD +LSD~MSD +MSD -ve Guide dow n No change +MSD~HSD
We see more downside to 4Q17 orderbook YoY
*meaning previous target
Impact to
Name Ticker shr PX Sales GM OP / EBIT NP Sales GM OP / EBIT NP Sales GM OP / EBIT NP
Li Ning 2331 HK (CNYmn)Positive (lack of
conviction)4,496 47.0% 291 415 4,461 45.6% 253 250 1% 138 bps 15% 66%*
We don't have conviction on the 2H16 earnings (due to the vast moving parts), but we remain confident in the turnaround trend
*our forecasts include DHS disposal & revaluation gains
Impact to
shr PX +ve / -ve DB Consen. Prev. +ve / -ve DB Consen. Prev. +ve / -ve DB Consen. Prev.*
Li Ning 2331 HK OP data Positive +ve +HSD~LDD +MSD~HSD +HSD +ve +HSD +MSD +HSD =ve no change n.a. +L-M teen
We expect acceleration in sellthrough driven by (1) off-line and (2) e-commerce
*meaning previous target
Impact to
Name Ticker shr PX Sales GM OP / EBIT NP Sales GM OP / EBIT NP Sales GM OP / EBIT NP
Pou Sheng 3813 HK (CNYmn) Negative 4,114 34.7% 133 215 4,341 36.3% 146 195 -5% -162 bps -9% 10%
2017 consensus forecasts may be somewhat stall:
PS's reported 4Q16 revenue resulted lower than the headline consensus, but actually beat market's latest expectation (evidenced by share price rally).
2H16 DB 2H16 consensus DB vs. consensus
4Q16 DB 4Q16 consensus DB vs. consensus
4Q16 Sellthrough YoY 3Q17 Orderbook YoY 2017 Orderbook YoY
2H16 DB 2H16 consensus DB vs. consensus
4Q16 SSSg 3Q17 Orderbook YoY 2017 Orderbook YoY
Source: Deutsche Bank estimates, company data, Bloomberg Finance LP consensus
Valuation tools
Figure 6: Valuation comps: textile and footwear ODMs
Name Ticker PX_Last Market Cap DB rating
(local cur.) (US$mn) FY16 FY17 FY16 FY17 FY16 FY17 FY16 FY17 FY16 FY17
Textile
Shenzhou 2313 HK 47.7 8,598 Buy 21.0 18.6 25% 13% 4.1 3.8 22.2% 24.3% 3.4% 3.3%
Eclat 1476 TT 309 2,699 Buy 22.8 18.4 -10% 23% 5.5 4.8 26.3% 29.3% 3.4% 3.0%
Texwinca 321 HK 5.15 917 Hold 10.1 13.3 36% -39% 1.9 1.4 18.5% 11.3% 8.1% 7.5%
Best Pacific 2111 HK 6.1 809 NR 14.2 12.0 28% 18% 3.1 2.7 23.1% 23.7% 2.8% 3.2%
Makalot 1477 TT 123 826 NR 13.3 16.1 -12% -17% 2.9 2.7 18.1% 17.5% 6.2% 5.0%
FENC 1402 TT 27.25 4,736 NR 24.3 19.2 -30% 27% 0.8 0.7 3.1% 3.9% 3.3% 3.8%
Formosa Taffeta 1434 TT 31.2 1,707 NR 15.3 13.5 22% 13% 1.0 1.0 6.3% 7.1% 4.6% 5.3%
Youngone 111770 KS 30100 1,163 NR 10.2 9.8 1% 4% 1.1 1.0 10.7% 10.2% 0.7% 0.7%
Hansae 105630 KS 25100 876 NR 14.3 13.2 -23% 8% 2.1 1.8 15.4% 15.0% 1.1% 1.2%
Pacific 1382 HK 8.75 1,631 NR 12.7 12.3 -7% 3% 3.8 3.8 30.0% 31.0% 8.2% 8.2%
Luthai 200726 CH 9.26 1,435 NR 9.7 8.6 13% 13% 1.0 0.9 10.6% 11.0% 6.9% 7.7%
Texhong 2678 HK 11.84 1,396 NR 8.3 7.6 89% 9% 2.0 1.7 25.7% 21.1% 3.6% 3.9%
Average 18.1 15.8 9% 12% 2.8 2.6 17.3% 18.0% 4.0% 4.1%
Footweaer ODM
Feng Tay 9910 TT 130 2,819 Buy 17.5 16.1 8% 8% 5.9 5.3 34.9% 37.8% 3.8% 4.0%
Yue Yuen 551 HK 26.95 5,726 Buy 11.6 10.6 20% 9% 1.2 1.2 10.1% 10.7% 5.2% 5.7%
Stella 1836 HK 10.78 1,103 NR 13.5 11.8 -33% 15% 1.1 1.1 8.1% 9.3% 7.4% 7.6%
Average 13.5 12.3 10% 10% 2.6 2.4 17.1% 18.5% 5.1% 5.4%
PE EPS YoY PB ROE Div. Yield
Source: Deutsche Bank estimates, Bloomberg Finance LP Note: companies under Deutsche Bank coverage use Deutsche Bank estimates; other companies use Bloomberg Finance LP consensus. To determine which companies are under Deutsche Bank coverage, please refer to column “DB rating.” Using closing price as of 17 February 2017.

21 February 2017
Consumer
Greater China Sporting Goods
Deutsche Bank AG/Hong Kong Page 5
Figure 7: Valuation comps: sportswear brands and distributors
Name Ticker PX_Last Market Cap DB rating
(local cur.) (US$mn) FY16 FY17 FY16 FY17 FY16 FY17 FY16 FY17 FY16 FY17
China Sportswear Brands & Distributors
Anta 2020 HK 25 8,061 Hold 22.5 18.5 21% 21% 5.9 5.4 25.2% 27.8% 2.7% 3.2%
Li Ning 2331 HK 5.15 1,443 Buy 21.2 17.4 >100% 73% 1.5 2.1 17.1% 19.0% 2.0% 2.5%
Belle 1880 HK 5.1 5,542 Buy 8.9 10.1 -10% -12% 1.7 1.6 17.2% 14.6% 4.9% 5.9%
Pou Sheng 3813 HK 1.94 1,334 Buy 11.9 8.8 66% 36% 1.5 1.3 13.3% 16.3% 0.0% 2.2%
XTEP 1368 HK 3.58 1,024 NR 10.0 9.0 9% 11% 1.4 1.3 14.1% 14.6% 5.8% 6.5%
CNDX 3818 HK 1.49 1,063 NR 8.6 10.5 5% -18% 0.7 0.7 8.7% 7.2% 6.8% 5.8%
361 Degrees 1361 HK 3.08 821 NR 10.9 9.5 0% 15% 1.0 0.9 9.0% 9.9% 5.8% 4.8%
Average 15.8 14.0 11% 14% 3.3 3.1 19.3% 19.9% 3.6% 4.3%
Global SPA
Inditex ITX SQ 31.245 103,427 Hold 33.8 30.3 15% 12% 8.5 7.8 26.3% 26.8% 2.2% 2.5%
H&M HMB SS 244 45,329 Sell 21.7 19.6 -11% 10% 6.6 6.1 31.2% 32.4% 4.5% 4.5%
Fast Retailing 9983 JP 34990 32,825 Hold 71.2 28.1 -56% 154% 6.0 5.2 7.0% 18.9% 1.1% 1.3%
Average 37.6 27.2 -4% 37% 7.6 6.9 24.0% 26.8% 2.6% 2.8%
Global Sports Brands
Lululemon LULU US 66.73 9,147 Hold 35.8 31.3 -1% 14% 9.1 6.8 24.8% 24.7% 0.0% 0.0%
Under Armour UA US 19.75 9,082 Hold 34.0 n.a. 10% n.a. 4.3 3.9 14.0% 8.7% 0.0% 0.0%
Adidas ADS GR 148.9 33,087 Buy 32.0 25.3 31% 26% 5.0 4.8 17.8% 19.6% 1.4% 1.6%
Amer Sports AMEAS FH 22.4 2,820 Buy 19.0 16.2 9% 17% 2.6 2.4 13.0% 14.8% 3.1% 3.0%
Puma PUM GY 299.75 4,802 Buy 71.9 35.9 68% 100% 2.6 2.5 3.8% 7.1% 0.3% 0.6%
Skechers SKX US 26.28 4,167 NR 16.7 14.9 5% 13% 2.6 2.2 16.6% 15.5% 0.0% 0.0%
VF VFC US 52.68 21,794 NR 16.8 n.a. 3% n.a. 4.3 4.4 25.1% 28.5% 3.1% 3.1%
Columbia COLM US 56.81 3,965 NR 20.9 20.2 11% 3% 2.5 2.3 13.0% 12.0% 1.4% 1.5%
Nike NKE US 56.75 93,892 Buy 26.3 24.2 17% 9% 8.1 7.9 30.1% 32.5% 1.2% 1.3%
Average 27.0 24.8 16% 13% 6.7 6.5 25.6% 27.3% 1.3% 1.4%
Global Apparel Brands
RL RL US 78.39 6,445 NR 12.3 n.a. -19% n.a. 1.8 1.8 13.8% 8.8% 2.8% 2.9%
GAP GPS US 24.47 9,761 Hold 10.1 12.1 -14% -17% 4.0 3.3 33.3% 23.7% 4.2% 4.2%
A&F ANF US 12.2 826 Sell 10.9 n.a. -27% n.a. 0.7 0.7 5.8% -0.9% 7.3% 7.4%
Guess GES US 13.02 1,098 NR 26.2 19.8 -50% 32% 1.1 1.1 5.4% 6.3% 7.8% 8.0%
Average 11.9 12.9 -19% -12% 2.9 2.5 23.4% 16.2% 4.1% 4.1%
Average 32.0 25.8 3% 27% 7.0 6.5 24.5% 26.3% 2.2% 2.4%
PB ROE Div. YieldPER EPS YoY
Source: Deutsche Bank estimates, Bloomberg Finance LP Note: companies under Deutsche Bank coverage use Deutsche Bank estimates; other companies use Bloomberg Finance LP consensus. To determine which companies are under Deutsche Bank coverage, please refer to column “DB rating.” Using closing price as of 17 February 2017.
Figure 8: Eclat: consensus PER (12-month forward) Figure 9: Yue Yuen: consensus PER (12-month forward)
0
5
10
15
20
25
30
35
40
2007 2008 2009 2010 2011 2012 2013 2014 2015 2016 2017
DB PER
Mean +
2Std dev
Mean +
1Std dev
2Y Mean
Mean - 1Std
dev
Mean - 2Std
dev
(x)
8
9
10
11
12
13
14
15
2013 2014 2015 2016 2017
DB PER
Mean +
2Std dev
Mean +
1Std dev
2Y Mean
Mean - 1Std
dev
Mean - 2Std
dev
(x)
Source: Deutsche Bank, Bloomberg Finance LP
Source: Deutsche Bank, Bloomberg Finance LP

21 February 2017
Consumer
Greater China Sporting Goods
Page 6 Deutsche Bank AG/Hong Kong
Figure 10: Feng Tay: consensus PER (12-month forward)
Figure 11: Pou Sheng: consensus PER (12-month
forward)
0
5
10
15
20
25
30
2007 2008 2009 2010 2011 2012 2013 2014 2015 2016 2017
DB PER
Mean +
2Std dev
Mean +
1Std dev
2Y Mean
Mean - 1Std
dev
Mean - 2Std
dev
(x)
0
2
4
6
8
10
12
14
16
18 DB PER
Mean +
2Std dev
Mean +
1Std dev
1Y Mean
Mean - 1Std
dev
Mean - 2Std
dev
(x)
Source: Deutsche Bank, Bloomberg Finance LP
Source: Deutsche Bank, Bloomberg Finance LP
Figure 12: Shenzhou: consensus PER (12-month forward) Figure 13: Li Ning: consensus PER (12-month forward)
0
5
10
15
20
25
2007 2008 2009 2010 2011 2012 2013 2014 2015 2016 2017
DB PER
Mean +
2Std dev
Mean +
1Std dev
2Y Mean
Mean - 1Std
dev
Mean - 2Std
dev
(x)
0
5
10
15
20
25
30
2008 2009 2010 2011 2012 2013 2014 2015 2016 2017
Li Ning PER
Mean +
2Std dev
Mean +
1Std dev
Mean
Mean -
1Std dev
Mean -
2Std dev
(x)
Source: Deutsche Bank, Bloomberg Finance LP
Source: Deutsche Bank, Bloomberg Finance LP
Figure 14: Anta: consensus PER (12-month forward)
0
5
10
15
20
25
30
2008 2009 2010 2011 2012 2013 2014 2015 2016 2017
Anta PER
Mean +
2Std dev
Mean +
1Std dev
1Y Mean
Mean -
1Std dev
Mean -
2Std dev
(x)
Source: Deutsche Bank, Bloomberg Finance LP
21 February 2017
Consumer
Greater China Sporting Goods
Deutsche Bank AG/Hong Kong Page 7
Eclat (1476 TT): All about product cycles; Buy
Stock drivers
1. Changing athleisure/functional sports product cycle will be even more
positive for Eclat We don’t think the athleisure trend is fading, but growth is shifting from
penetration to differentiation. Low-end athleisure “copy cats” will likely suffer, but high-end innovative players should benefit. Evidence:
(1) Checks suggest global Lycra (high-end elastic fiber) demand will grow by 8-10% in 2017 (vs. 10%/8% in 2015/2016).
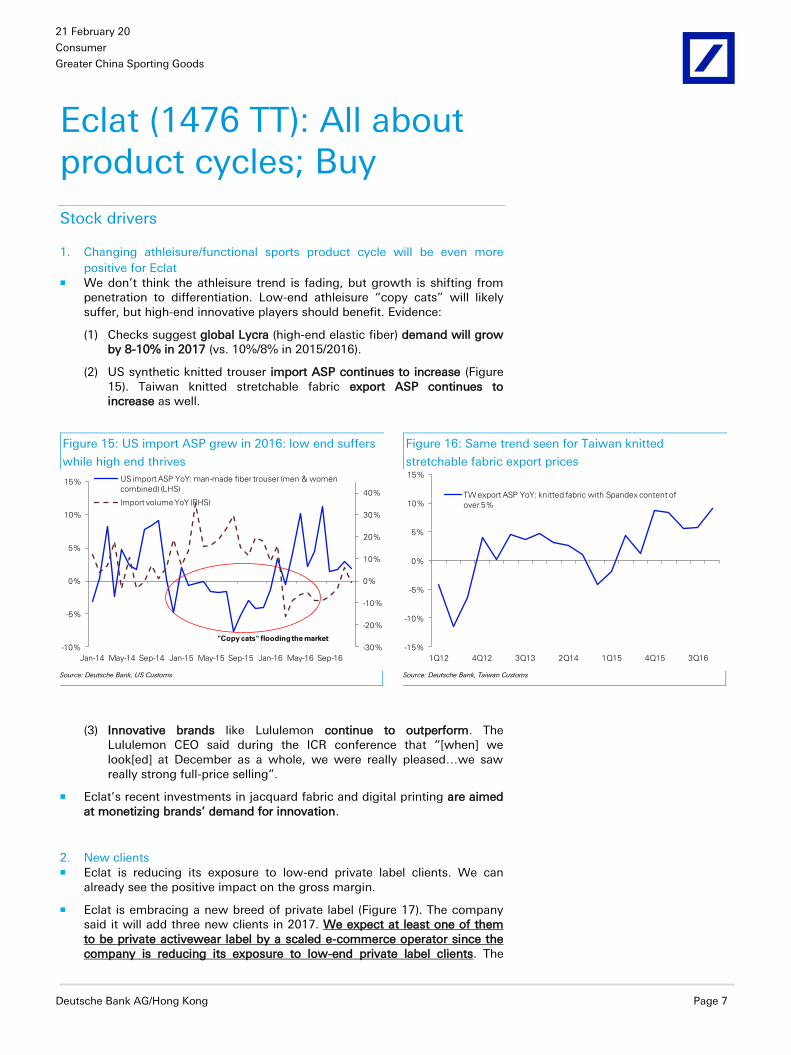
(2) US synthetic knitted trouser import ASP continues to increase (Figure 15). Taiwan knitted stretchable fabric export ASP continues to increase as well.
Figure 15: US import ASP grew in 2016: low end suffers
while high end thrives
Figure 16: Same trend seen for Taiwan knitted
stretchable fabric export prices
-30%
-20%
-10%
0%
10%
20%
30%
40%
-10%
-5%
0%
5%
10%
15%
Jan-14 May-14 Sep-14 Jan-15 May-15 Sep-15 Jan-16 May-16 Sep-16
US import ASP YoY: man-made fiber trouser (men & women
combined) (LHS)
Import volume YoY (RHS)
"Copy cats" flooding the market
-15%
-10%
-5%
0%
5%
10%
15%
1Q12 4Q12 3Q13 2Q14 1Q15 4Q15 3Q16
TW export ASP YoY: knitted fabric with Spandex content of
over 5%
Source: Deutsche Bank, US Customs Source: Deutsche Bank, Taiwan Customs
(3) Innovative brands like Lululemon continue to outperform. The Lululemon CEO said during the ICR conference that “[when] we look[ed] at December as a whole, we were really pleased…we saw really strong full-price selling”.
Eclat’s recent investments in jacquard fabric and digital printing are aimed at monetizing brands’ demand for innovation.
2. New clients Eclat is reducing its exposure to low-end private label clients. We can
already see the positive impact on the gross margin.
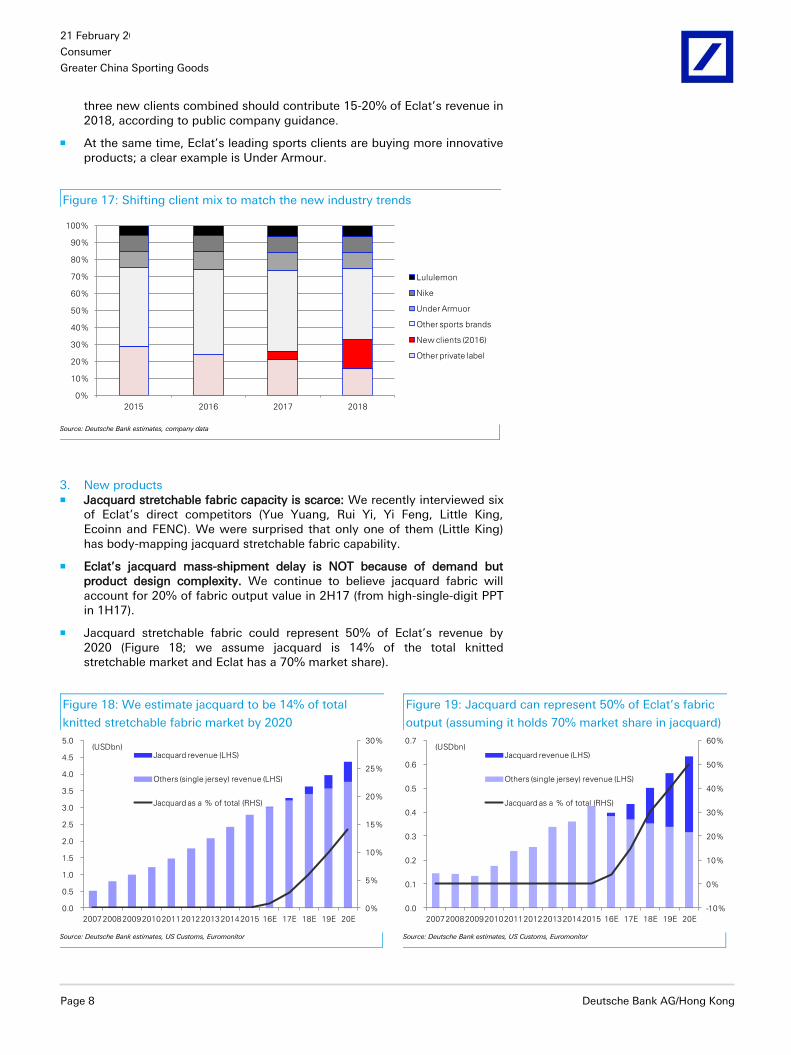
Eclat is embracing a new breed of private label (Figure 17). The company said it will add three new clients in 2017. We expect at least one of them to be private activewear label by a scaled e-commerce operator since the company is reducing its exposure to low-end private label clients. The
21 February 2017
Consumer
Greater China Sporting Goods
Page 8 Deutsche Bank AG/Hong Kong
three new clients combined should contribute 15-20% of Eclat’s revenue in 2018, according to public company guidance.
At the same time, Eclat’s leading sports clients are buying more innovative products; a clear example is Under Armour.
Figure 17: Shifting client mix to match the new industry trends
0%
10%
20%
30%
40%
50%
60%
70%
80%
90%
100%
2015 2016 2017 2018
Lululemon
Nike
Under Armuor
Other sports brands
New clients (2016)
Other private label
Source: Deutsche Bank estimates, company data
3. New products Jacquard stretchable fabric capacity is scarce: We recently interviewed six
of Eclat’s direct competitors (Yue Yuang, Rui Yi, Yi Feng, Little King, Ecoinn and FENC). We were surprised that only one of them (Little King) has body-mapping jacquard stretchable fabric capability.
Eclat’s jacquard mass-shipment delay is NOT because of demand but product design complexity. We continue to believe jacquard fabric will account for 20% of fabric output value in 2H17 (from high-single-digit PPT in 1H17).
Jacquard stretchable fabric could represent 50% of Eclat’s revenue by 2020 (Figure 18; we assume jacquard is 14% of the total knitted stretchable market and Eclat has a 70% market share).
Figure 18: We estimate jacquard to be 14% of total
knitted stretchable fabric market by 2020
Figure 19: Jacquard can represent 50% of Eclat’s fabric
output (assuming it holds 70% market share in jacquard)
0%
5%
10%
15%
20%
25%
30%
0.0
0.5
1.0
1.5
2.0
2.5
3.0
3.5
4.0
4.5
5.0
200720082009201020112012201320142015 16E 17E 18E 19E 20E
Jacquard revenue (LHS)
Others (single jersey) revenue (LHS)
Jacquard as a % of total (RHS)
(USDbn)
-10%
0%
10%
20%
30%
40%
50%
60%
0.0
0.1
0.2
0.3
0.4
0.5
0.6
0.7
200720082009201020112012201320142015 16E 17E 18E 19E 20E
Jacquard revenue (LHS)
Others (single jersey) revenue (LHS)
Jacquard as a % of total (RHS)
(USDbn)
Source: Deutsche Bank estimates, US Customs, Euromonitor Source: Deutsche Bank estimates, US Customs, Euromonitor
21 February 2017
Consumer
Greater China Sporting Goods
Deutsche Bank AG/Hong Kong Page 9
Line of Thinking
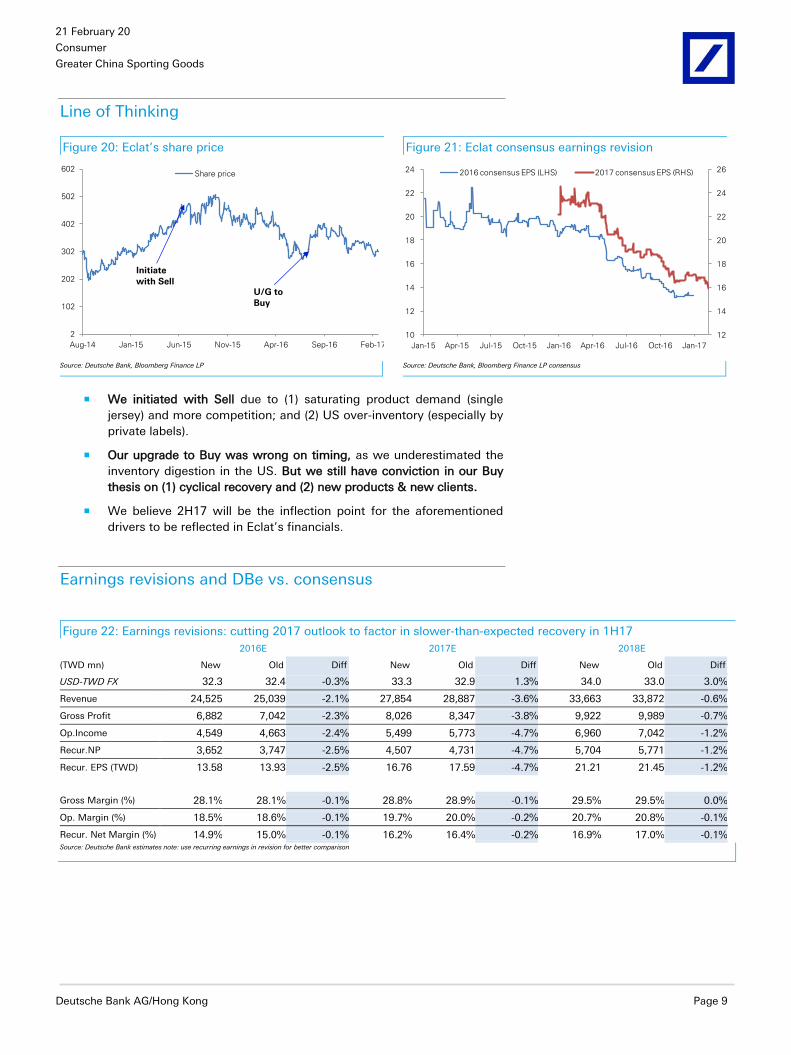
Figure 20: Eclat’s share price Figure 21: Eclat consensus earnings revision
2
102
202
302
402
502
602
Aug-14 Jan-15 Jun-15 Nov-15 Apr-16 Sep-16 Feb-17
Share price
U/G to
Buy
Initiate
with Sell
12
14
16
18
20
22
24
26
10
12
14
16
18
20
22
24
Jan-15 Apr-15 Jul-15 Oct-15 Jan-16 Apr-16 Jul-16 Oct-16 Jan-17
2016 consensus EPS (LHS) 2017 consensus EPS (RHS)
Source: Deutsche Bank, Bloomberg Finance LP
Source: Deutsche Bank, Bloomberg Finance LP consensus
We initiated with Sell due to (1) saturating product demand (single
jersey) and more competition; and (2) US over-inventory (especially by
private labels).
Our upgrade to Buy was wrong on timing, as we underestimated the
inventory digestion in the US. But we still have conviction in our Buy
thesis on (1) cyclical recovery and (2) new products & new clients.
We believe 2H17 will be the inflection point for the aforementioned
drivers to be reflected in Eclat’s financials.
Earnings revisions and DBe vs. consensus
Figure 22: Earnings revisions: cutting 2017 outlook to factor in slower-than-expected recovery in 1H17
2016E 2017E 2018E
(TWD mn) New Old Diff New Old Diff New Old Diff
USD-TWD FX 32.3 32.4 -0.3% 33.3 32.9 1.3% 34.0 33.0 3.0%
Revenue 24,525 25,039 -2.1% 27,854 28,887 -3.6% 33,663 33,872 -0.6%
Gross Profit 6,882 7,042 -2.3% 8,026 8,347 -3.8% 9,922 9,989 -0.7%
Op.Income 4,549 4,663 -2.4% 5,499 5,773 -4.7% 6,960 7,042 -1.2%
Recur.NP 3,652 3,747 -2.5% 4,507 4,731 -4.7% 5,704 5,771 -1.2%
Recur. EPS (TWD) 13.58 13.93 -2.5% 16.76 17.59 -4.7% 21.21 21.45 -1.2%
Gross Margin (%) 28.1% 28.1% -0.1% 28.8% 28.9% -0.1% 29.5% 29.5% 0.0%
Op. Margin (%) 18.5% 18.6% -0.1% 19.7% 20.0% -0.2% 20.7% 20.8% -0.1%
Recur. Net Margin (%) 14.9% 15.0% -0.1% 16.2% 16.4% -0.2% 16.9% 17.0% -0.1% Source: Deutsche Bank estimates note: use recurring earnings in revision for better comparison

21 February 2017
Consumer
Greater China Sporting Goods
Page 10 Deutsche Bank AG/Hong Kong
Figure 23: DBe vs. consensus: we are significantly more positive on 2H17 and 2018
2016E 2017E 2018E
(TWD mn) DBe Consensus Diff DBe Consensus Diff DBe Consensus Diff
Revenue 24,525 24,666 -0.6% 27,854 27,257 2.2% 33,663 30,815 9.2%
Gross Profit 6,882 6,931 -0.7% 8,026 7,795 3.0% 9,922 8,927 11.1%
Op.Income 4,549 4,531 0.4% 5,499 5,278 4.2% 6,960 6,218 11.9%
Net Income 3,425 3,504 -2.2% 4,507 4,319 4.4% 5,704 5,020 13.6%
EPS (TWD) 12.73 13.03 -2.2% 16.76 16.06 4.4% 21.21 18.66 13.6%
Gross Margin (%) 28.1% 28.1% 0.0% 28.8% 28.6% 0.2% 29.5% 29.0% 0.5%
Op. Margin (%) 18.5% 18.4% 0.2% 19.7% 19.4% 0.4% 20.7% 20.2% 0.5%
Net Margin (%) 14.0% 14.2% -0.2% 16.2% 15.8% 0.3% 16.9% 16.3% 0.7% Source: Deutsche Bank estimates, Bloomberg Finance LP
Valuation, risks and financial summary
Cutting target price by 1%, in line with earnings revisions on 2018E
We have trimmed our DCF-based target price to TWD430 to reflect downward
earnings revisions to 2018E. We use the discounted cash flow (DCF) method
as our primary approach to value Eclat’s shares. We adopt DCF as we expect
investors to focus more on Eclat’s long-term innovations. In our DCF model,
we apply a WACC of 6.61% with a cost of equity of 7.08% (risk-free
rate=1.8%, beta=0.94, market risk premium=5.6%) and a cost of debt of
2.43%.
We increased our assumed long-term growth rate to 1%. This is still at the low
end of the 1-2% assumptions we use for other ODMs under our coverage. We
view Eclat’s innovator business model as highly reliant on the new product
cycle. In the past we were skeptical on whether Eclat could innovate beyond
its single jersey category. But with its new jacquard fabric, we are more
positive on Eclat’s ability to sustain its innovation pipeline. We thus increase
the assumption to 1%. Terminal value now represents 45% of Eclat’s total
value.
Figure 24: DCF sales, margin assumptions and sensitivity Figure 25: Free cash flow to equity profile
Two-stage DCF:
1. FCF forecasts from model 2018-2020
2. Explicit forecast period 2021-2030
2018~2021 2022~2025 2026~2030 2018~2030
Revenue CAGR: 20.9% 3.8% 1.0% 6.1%
Average EBIT margin: 21.2% 21.0% 20.1% 20.7%
FCF CAGR: 12.6% 2.1% -0.4% 3.3%
Source: Deutsche Bank estimates
Source: Deutsche Bank estimates, Note: representing free cash flow for equity (in line with Deutsche Bank RTN)
430 7.6% 7.1% 6.6% 6.1% 5.6%
-1.00% 331 351 374 401 431
0.00% 347 371 398 430 467
1.00% 368 397 430 470 519
2.00% 397 433 476 530 599
3.00% 438 486 548 628 740
WACC
Terminal
Growth-40%
-30%
-20%
-10%
0%
10%
20%
30%
40%
50%
-
1,000
2,000
3,000
4,000
5,000
6,000
7,000
8,000
2012 2015 2018 2021 2024 2027 2030
Free Cashflow (LHS)
YoY (RHS)(NT$mn)

21 February 2017
Consumer
Greater China Sporting Goods
Deutsche Bank AG/Hong Kong Page 11
Figure 26: Discounted cash flow valuation – key assumptions
Share & Market Information Note
Valuation date 12 month forward
Current Stock Price 309
Issued Shares (million) 269 Weighted average shares
DCF Target Price 430
Implied Upside (Downside) 39%
Valuation metrics
FY16 PER (recurring) 31.7
FY17 PER (recurring) 25.7
FY16 PBR 7.8
FY17 PBR 6.8
Cost of Equity 7.08%
Risk Free Rate (%) 1.80% Deutsche Bank assumption for Taiwan
Beta 0.94 Bloomberg 1-year beta
Market Risk Premium (%) 5.60% Deutsche Bank assumption for Taiwan
Cost of Debt (after tax) 2.43%
Cost of Debt 3.00% Company long-term borrowing rate
Tax Rate 19.00% Long-term tax rate
Target Debt / (Debt + Equity) 10%
WACC 6.61%
DCF Model LT growth 1.0% We are more positive on Eclat’s ability to sustain innovations.
Source: Deutsche Bank estimates, company data
PE valuation supports our DCF target price; we now shift target multiple to 2-
year mean
Our target price of TWD430 represents c.25x of 2017E recurring EPS. The
multiple is in line with Eclat’s two-year mean forward DB PER. We didn’t
change this implied multiple.
Figure 27: Eclat: consensus PER (12 month forward) Figure 28: Consensus PER vs. earnings growth
0
5
10
15
20
25
30
35
40
2007 2008 2009 2010 2011 2012 2013 2014 2015 2016 2017
DB PER
Mean +
2Std dev
Mean +
1Std dev
2Y Mean
Mean - 1Std
dev
Mean - 2Std
dev
(x)
-60%
-10%
40%
90%
140%
-20
-10
0
10
20
30
40
50
2007 2008 2009 2010 2011 2012 2013 2014 2015 2016 2017
DB PER (LHS) 2Y Mean (LHS) Earnings growth(x)
Source: Deutsche Bank estimates, Bloomberg Finance LP
Source: Deutsche Bank estimates, Bloomberg Finance LP
21 February 2017
Consumer
Greater China Sporting Goods
Page 12 Deutsche Bank AG/Hong Kong
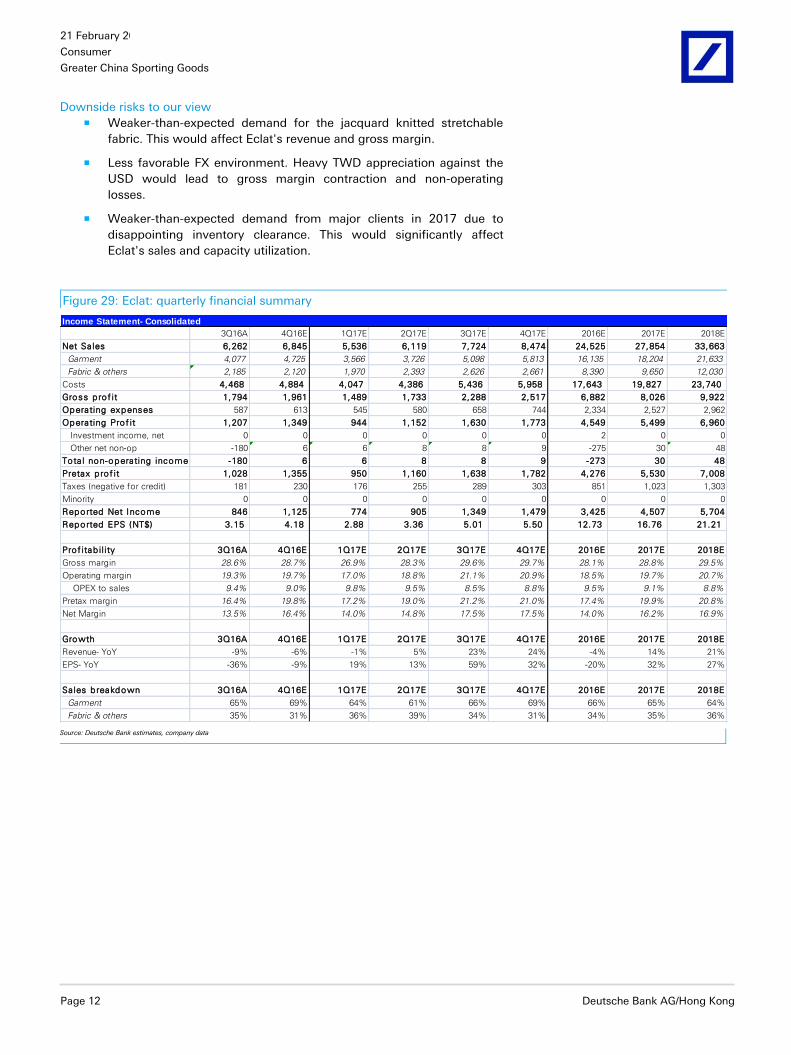
Downside risks to our view Weaker-than-expected demand for the jacquard knitted stretchable
fabric. This would affect Eclat's revenue and gross margin.
Less favorable FX environment. Heavy TWD appreciation against the
USD would lead to gross margin contraction and non-operating
losses.
Weaker-than-expected demand from major clients in 2017 due to
disappointing inventory clearance. This would significantly affect
Eclat's sales and capacity utilization.
Figure 29: Eclat: quarterly financial summary
Income Statement- Consolidated
3Q16A 4Q16E 1Q17E 2Q17E 3Q17E 4Q17E 2016E 2017E 2018E
Net Sa les 6,262 6,845 5,536 6,119 7,724 8,474 24,525 27,854 33,663
Garment 4,077 4,725 3,566 3,726 5,098 5,813 16,135 18,204 21,633
Fabric & others 2,185 2,120 1,970 2,393 2,626 2,661 8,390 9,650 12,030
Costs 4,468 4,884 4,047 4,386 5,436 5,958 17,643 19,827 23,740
Gross prof it 1,794 1,961 1,489 1,733 2,288 2,517 6,882 8,026 9,922
Operating expenses 587 613 545 580 658 744 2,334 2,527 2,962
Operating Prof it 1,207 1,349 944 1,152 1,630 1,773 4,549 5,499 6,960
Investment income, net 0 0 0 0 0 0 2 0 0
Other net non-op -180 6 6 8 8 9 -275 30 48
Tota l non-operating income -180 6 6 8 8 9 -273 30 48
Pretax prof it 1,028 1,355 950 1,160 1,638 1,782 4,276 5,530 7,008
Taxes (negative for credit) 181 230 176 255 289 303 851 1,023 1,303
Minority 0 0 0 0 0 0 0 0 0
Reported Net Income 846 1,125 774 905 1,349 1,479 3,425 4,507 5,704
Reported EPS (NT$) 3.15 4.18 2.88 3.36 5.01 5.50 12.73 16.76 21.21
Prof itab il ity 3Q16A 4Q16E 1Q17E 2Q17E 3Q17E 4Q17E 2016E 2017E 2018E
Gross margin 28.6% 28.7% 26.9% 28.3% 29.6% 29.7% 28.1% 28.8% 29.5%
Operating margin 19.3% 19.7% 17.0% 18.8% 21.1% 20.9% 18.5% 19.7% 20.7%
OPEX to sales 9.4% 9.0% 9.8% 9.5% 8.5% 8.8% 9.5% 9.1% 8.8%
Pretax margin 16.4% 19.8% 17.2% 19.0% 21.2% 21.0% 17.4% 19.9% 20.8%
Net Margin 13.5% 16.4% 14.0% 14.8% 17.5% 17.5% 14.0% 16.2% 16.9%
Growth 3Q16A 4Q16E 1Q17E 2Q17E 3Q17E 4Q17E 2016E 2017E 2018E
Revenue- YoY -9% -6% -1% 5% 23% 24% -4% 14% 21%
EPS- YoY -36% -9% 19% 13% 59% 32% -20% 32% 27%
Sales breakdown 3Q16A 4Q16E 1Q17E 2Q17E 3Q17E 4Q17E 2016E 2017E 2018E
Garment 65% 69% 64% 61% 66% 69% 66% 65% 64%
Fabric & others 35% 31% 36% 39% 34% 31% 34% 35% 36% Source: Deutsche Bank estimates, company data
21 February 2017
Consumer
Greater China Sporting Goods
Deutsche Bank AG/Hong Kong Page 13
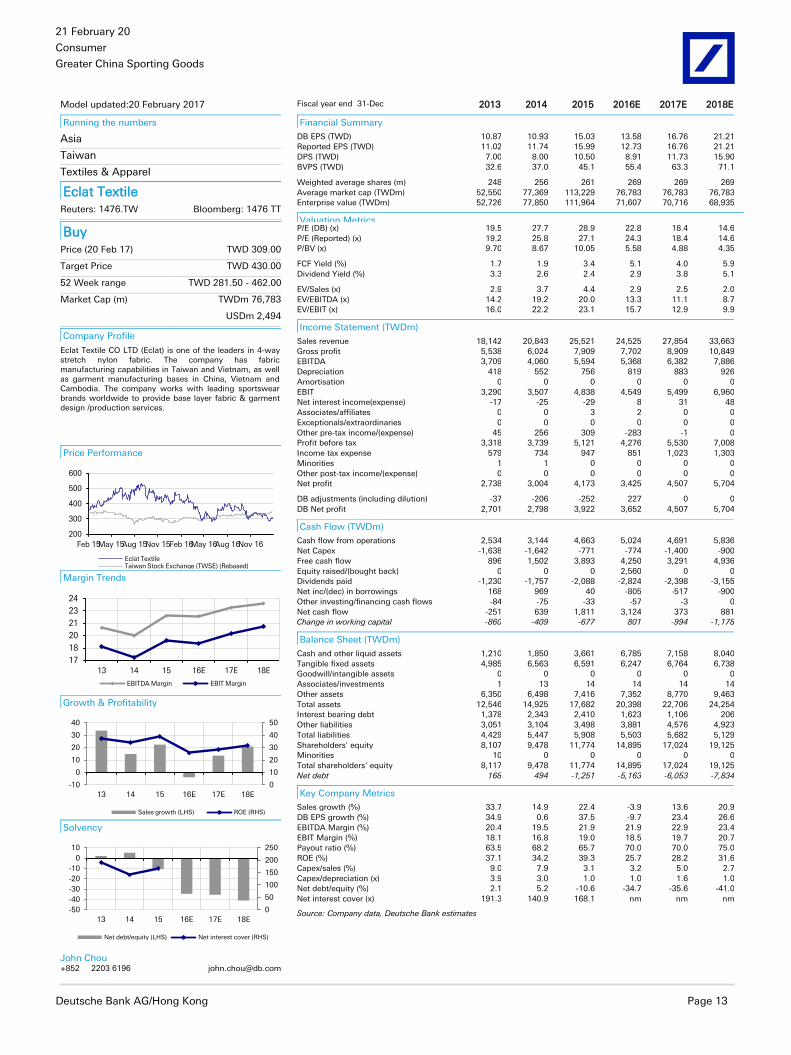
Model updated:20 February 2017
Running the numbers
Asia
Taiwan
Textiles & Apparel
Eclat Textile Reuters: 1476.TW Bloomberg: 1476 TT
Buy Price (20 Feb 17) TWD 309.00
Target Price TWD 430.00
52 Week range TWD 281.50 - 462.00
Market Cap (m) TWDm 76,783
USDm 2,494
Company Profile
Eclat Textile CO LTD (Eclat) is one of the leaders in 4-way stretch nylon fabric. The company has fabric manufacturing capabilities in Taiwan and Vietnam, as well as garment manufacturing bases in China, Vietnam and Cambodia. The company works with leading sportswear brands worldwide to provide base layer fabric & garment design /production services.
Price Performance
200
300
400
500
600
Feb 15May 15Aug 15Nov 15Feb 16May 16Aug 16Nov 16
Eclat TextileTaiwan Stock Exchange (TWSE) (Rebased)
Margin Trends
17
18
20
21
23
24
13 14 15 16E 17E 18E
EBITDA Margin EBIT Margin
Growth & Profitability
0
10
20
30
40
50
-10
0
10
20
30
40
13 14 15 16E 17E 18E
Sales growth (LHS) ROE (RHS)
Solvency
0
50
100
150
200
250
-50
-40
-30
-20
-10
0
10
13 14 15 16E 17E 18E
Net debt/equity (LHS) Net interest cover (RHS)
John Chou
+852 2203 6196 [email protected]
Fiscal year end 31-Dec 2013 2014 2015 2016E 2017E 2018E
Financial Summary
DB EPS (TWD) 10.87 10.93 15.03 13.58 16.76 21.21
Reported EPS (TWD) 11.02 11.74 15.99 12.73 16.76 21.21
DPS (TWD) 7.00 8.00 10.50 8.91 11.73 15.90
BVPS (TWD) 32.6 37.0 45.1 55.4 63.3 71.1
Weighted average shares (m) 248 256 261 269 269 269
Average market cap (TWDm) 52,550 77,369 113,229 76,783 76,783 76,783
Enterprise value (TWDm) 52,726 77,850 111,964 71,607 70,716 68,935
Valuation Metrics P/E (DB) (x) 19.5 27.7 28.9 22.8 18.4 14.6
P/E (Reported) (x) 19.2 25.8 27.1 24.3 18.4 14.6
P/BV (x) 9.70 8.67 10.05 5.58 4.88 4.35
FCF Yield (%) 1.7 1.9 3.4 5.1 4.0 5.9
Dividend Yield (%) 3.3 2.6 2.4 2.9 3.8 5.1
EV/Sales (x) 2.9 3.7 4.4 2.9 2.5 2.0
EV/EBITDA (x) 14.2 19.2 20.0 13.3 11.1 8.7
EV/EBIT (x) 16.0 22.2 23.1 15.7 12.9 9.9
Income Statement (TWDm)
Sales revenue 18,142 20,843 25,521 24,525 27,854 33,663
Gross profit 5,538 6,024 7,909 7,702 8,909 10,849
EBITDA 3,709 4,060 5,594 5,368 6,382 7,886
Depreciation 418 552 756 819 883 926
Amortisation 0 0 0 0 0 0
EBIT 3,290 3,507 4,838 4,549 5,499 6,960
Net interest income(expense) -17 -25 -29 8 31 48
Associates/affiliates 0 0 3 2 0 0
Exceptionals/extraordinaries 0 0 0 0 0 0
Other pre-tax income/(expense) 45 256 309 -283 -1 0
Profit before tax 3,318 3,739 5,121 4,276 5,530 7,008
Income tax expense 579 734 947 851 1,023 1,303
Minorities 1 1 0 0 0 0
Other post-tax income/(expense) 0 0 0 0 0 0
Net profit 2,738 3,004 4,173 3,425 4,507 5,704
DB adjustments (including dilution) -37 -206 -252 227 0 0
DB Net profit 2,701 2,798 3,922 3,652 4,507 5,704
Cash Flow (TWDm)
Cash flow from operations 2,534 3,144 4,663 5,024 4,691 5,836
Net Capex -1,638 -1,642 -771 -774 -1,400 -900
Free cash flow 896 1,502 3,893 4,250 3,291 4,936
Equity raised/(bought back) 0 0 0 2,560 0 0
Dividends paid -1,230 -1,757 -2,088 -2,824 -2,398 -3,155
Net inc/(dec) in borrowings 168 969 40 -805 -517 -900
Other investing/financing cash flows -84 -75 -33 -57 -3 0
Net cash flow -251 639 1,811 3,124 373 881
Change in working capital -860 -409 -677 801 -994 -1,178
Balance Sheet (TWDm)
Cash and other liquid assets 1,210 1,850 3,661 6,785 7,158 8,040
Tangible fixed assets 4,985 6,563 6,591 6,247 6,764 6,738
Goodwill/intangible assets 0 0 0 0 0 0
Associates/investments 1 13 14 14 14 14
Other assets 6,350 6,498 7,416 7,352 8,770 9,463
Total assets 12,546 14,925 17,682 20,398 22,706 24,254
Interest bearing debt 1,378 2,343 2,410 1,623 1,106 206
Other liabilities 3,051 3,104 3,498 3,881 4,576 4,923
Total liabilities 4,429 5,447 5,908 5,503 5,682 5,129
Shareholders' equity 8,107 9,478 11,774 14,895 17,024 19,125
Minorities 10 0 0 0 0 0
Total shareholders' equity 8,117 9,478 11,774 14,895 17,024 19,125
Net debt 168 494 -1,251 -5,163 -6,053 -7,834
Key Company Metrics
Sales growth (%) 33.7 14.9 22.4 -3.9 13.6 20.9
DB EPS growth (%) 34.9 0.6 37.5 -9.7 23.4 26.6
EBITDA Margin (%) 20.4 19.5 21.9 21.9 22.9 23.4
EBIT Margin (%) 18.1 16.8 19.0 18.5 19.7 20.7
Payout ratio (%) 63.5 68.2 65.7 70.0 70.0 75.0
ROE (%) 37.1 34.2 39.3 25.7 28.2 31.6
Capex/sales (%) 9.0 7.9 3.1 3.2 5.0 2.7
Capex/depreciation (x) 3.9 3.0 1.0 1.0 1.6 1.0
Net debt/equity (%) 2.1 5.2 -10.6 -34.7 -35.6 -41.0
Net interest cover (x) 191.3 140.9 168.1 nm nm nm
Source: Company data, Deutsche Bank estimates

21 February 2017
Consumer
Greater China Sporting Goods
Page 14 Deutsche Bank AG/Hong Kong
Yue Yuen (551 HK): Seeing the end to five-year down-cycle; upgrading to Buy
Stock drivers
1. Painful plant shift largely done By early Feb-2017, we estimate that YY had largely completed the
plant relocations of its Guangdong plants.
We adopt a three-step analysis to understand the impact from YY’s
Guangdong plant shutdown and model for the future. We conclude
that there should be a stronger-than-expected profitability recovery for
YY’s ODM operation. We forecast YY’s ODM EBIT margin to deliver a
steady recovery to 7.2%/7.6%/8.4% in 16E/17E/18E, vs. consensus
forecasts of 6.4%/6.0%/6.4%, respectively (Figure 30).
Step 1: obtaining the recurring profit: we adopt the public subsidiary
profit information reported by YY. There has been a surge in losses in
YY’s Guangdong production cluster in YT3Q16 (Figure 31). We
estimate a majority of the additional losses are extraordinary in nature.
Figure 31: Profit (losses) from YY’s China plants
(USDmn) 2010 2011 2012 2013 2014 2015 YT3Q15 YT3Q16
Guangdong 12 16 15 (11) (6) (6) (5) (48)
Hunan (1) 1 1 (2) (4) (9) (9) (2)
Hubei (0) (6) 1 0 (2) (7) (7) (2)
Anhui & Jiangsu 16 9 13 (28) (17) (5) (4) (14)
Jiangxi (10) (17) (8) (15) (2) 3 (1) (5)
Prof it ( loss) 17 3 22 (56) (32) (24) (26) (71)
% of ODM profit 5% 1% n.a. -13% -10% -7% -11% -23%
% of consolidated profit 5% 1% n.a. -13% -10% -6% -8% -17% Source: Deutsche Bank estimates, company data
We can then break down YY’s profit into the below three segments to
simplify our analysis (Figure 32):
(1) China recurring profit
(2) Non-China recurring profit
(3) Extraordinary (non-recurring): USD90m/over USD30m provisions made
in 2014/2015 to compensate employees in the China plants.
Figure 30: Consensus seeing flattish
EBIT margin trend for YY ODM
(YT3Q16= 6.8%, up 1.7 ppt YoY)
4.0%
4.5%
5.0%
5.5%
6.0%
6.5%
7.0%
7.5%
8.0%
8.5%
2014 2015 16E 17E 18E
DB Consensus implied
YY: ODM EBIT margin
Source: Deutsche Bank estimates, Bloomberg Finance LP

21 February 2017
Consumer
Greater China Sporting Goods
Deutsche Bank AG/Hong Kong Page 15
Figure 32: YY: ODM operating profit breakdown
(200)
(100)
-
100
200
300
400
500
600
2010 2011 2012* 2013 2014 2015 YT3Q16
Extraordinary (non-recurring)
Non-China: recurring
China: recurring
(USDmn)
Source: Deutsche Bank estimates, company data *no available disclosure
Step 2: sanity checks of our profit breakdown exercise: We view the
profit estimates as reasonable. Figure 33 suggests YY’s poor
profitability (measured by operating profit per pair) in China due to
plant migrations since 2010. The profitability of YY’s non-China plants
also took a hit as they absorbed production capacity relocated from
China. Nevertheless, we saw a profitability recovery for YY’s non-
China plants in YT3Q16. Figure 34 suggests YY’s non-China plants are
operating at good efficiency (similar to Feng Tay’s plants), while YY’s
China operation remains a profit drag.
Figure 33: The time series is reasonable from an
operating profit per pair perspective
Figure 34: YY’s profit per pair vs. Feng Tay’s
(1.0)
(0.5)
-
0.5
1.0
1.5
2.0
2.5
3.0
2010 2011 2012* 2013 2014 2015 YT3Q16
China
Non China
(USD per pair)
1. Plant migration
started
2. Overseas plants
suffer from inefficiency
3. Overseas plants
regaining efficiency
(1.0)
(0.5)
-
0.5
1.0
1.5
2.0
2.5
3.0
2010 2011 2012* 2013 2014 2015 YT3Q16
YY: China YY: Non China Feng Tay: consolidated
(USD per pair)
Source: Deutsche Bank estimates, company data *No available data for YY
Source: Deutsche Bank estimates, company data *No available data for YY
Step 3: model for the future: We estimate YY’s ODM operating profit
to grow by 11%/12% in 2017/2018, respectively. This implies YY’s
operating profit per pair will increase by 6%/10% in 2017/2018. We
view our assumptions as conservative, considering that we estimate
YY’s profit per pair to increase to USD1.59 by 2020 vs. USD1.96 at
Feng Tay during 2015 (Figure 35). Feng Tay’s historical plant
profitability (Figure 36) points to a significant profitability recovery
(toward 8% operating margin) as plant operations stabilize.
Blue-sky scenario: if YY’s consolidated operating profit per pair
increases to USD1.96 (Feng Tay’s 2015level) in 2017, YY’s ODM
operating profit will reach USD657mn (37% higher than our base case).
Such leads to 28% upside to DB’s consolidated earnings forecasts.
21 February 2017
Consumer
Greater China Sporting Goods
Page 16 Deutsche Bank AG/Hong Kong
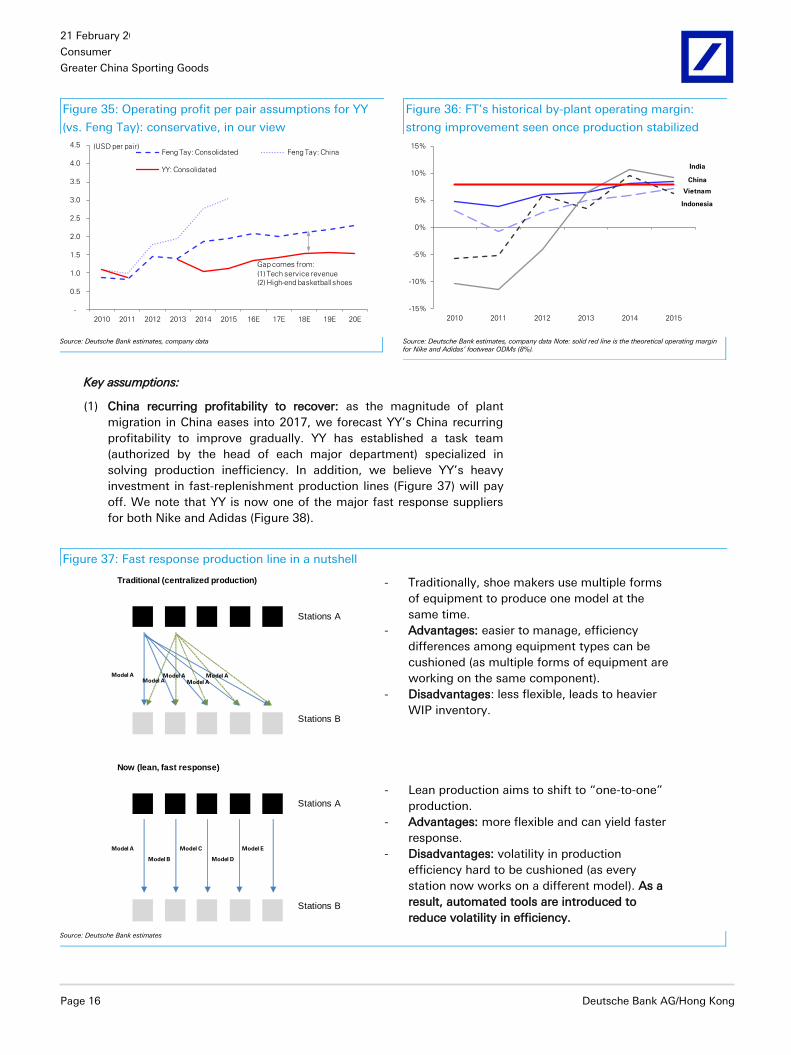
Figure 35: Operating profit per pair assumptions for YY
(vs. Feng Tay): conservative, in our view
Figure 36: FT’s historical by-plant operating margin:
strong improvement seen once production stabilized
-
0.5
1.0
1.5
2.0
2.5
3.0
3.5
4.0
4.5
2010 2011 2012 2013 2014 2015 16E 17E 18E 19E 20E
Feng Tay: Consolidated Feng Tay: China
YY: Consolidated
(USD per pair)
Gap comes from:
(1) Tech service revenue
(2) High-end basketball shoes
-15%
-10%
-5%
0%
5%
10%
15%
2010 2011 2012 2013 2014 2015
India
Indonesia
Vietnam
China
Source: Deutsche Bank estimates, company data
Source: Deutsche Bank estimates, company data Note: solid red line is the theoretical operating margin for Nike and Adidas’ footwear ODMs (8%).
Key assumptions:
(1) China recurring profitability to recover: as the magnitude of plant
migration in China eases into 2017, we forecast YY’s China recurring
profitability to improve gradually. YY has established a task team
(authorized by the head of each major department) specialized in
solving production inefficiency. In addition, we believe YY’s heavy
investment in fast-replenishment production lines (Figure 37) will pay
off. We note that YY is now one of the major fast response suppliers
for both Nike and Adidas (Figure 38).
Figure 37: Fast response production line in a nutshell
Traditional (centralized production)
Stations A
Stations B
Now (lean, fast response)
Stations A
Stations B
Model AModel A
Model AModel A
Model A
Model A
Model B
Model C
Model D
Model E
- Traditionally, shoe makers use multiple forms
of equipment to produce one model at the
same time.
- Advantages: easier to manage, efficiency
differences among equipment types can be
cushioned (as multiple forms of equipment are
working on the same component).
- Disadvantages: less flexible, leads to heavier
WIP inventory.
- Lean production aims to shift to “one-to-one”
production.
- Advantages: more flexible and can yield faster
response.
- Disadvantages: volatility in production
efficiency hard to be cushioned (as every
station now works on a different model). As a
result, automated tools are introduced to
reduce volatility in efficiency.
Source: Deutsche Bank estimates

21 February 2017
Consumer
Greater China Sporting Goods
Deutsche Bank AG/Hong Kong Page 17
(2) Non-China recurring profit still has room for improvement: we
witnessed YY’s efforts to further strengthen its raw material supply in
Vietnam. Also, we believe the production in Vietnam has been
stabilizing following the reduced capacity reallocation from China.
(3) Extraordinary (non-recurring) items to reduce: we view YY as still
adjusting its capacity in China, but the amount of extraordinary items
should drop significantly going forward.
2. Adidas order shift to boost revenue According to Ching Luh, (a private competitor of Apache's), Apache (
萬邦鞋業 ) one of Adidas’ major footwear manufacturers, was
reported to have violated its labor welfare compliance protocols in
2016. We forecast Adidas will gradually shift its orders to YY and
Ching Luh.
We conservatively estimate that the shift can boost YY’s 2017 volume
by 1-3% (Figure 39).
YY’s ability to take on additional orders from Adidas also cements its
relationship with the brand, in our view.
Figure 39: Scale comparison among Adidas’ major shoe manufacturers
-
5.0
10.0
15.0
20.0
25.0
30.0
YY Ching Luh Apache
Other brands Adidas
(mn pairs per month)
Source: Deutsche Bank estimates, company data
Figure 38: Major fast response
sports shoes manufacturers
0%
5%
10%
15%
20%
25%
Yue Yuen Feng Tay Ching Luh
Fast replenishment order % of
total orders
Source: Deutsche Bank estimates, company data

21 February 2017
Consumer
Greater China Sporting Goods
Page 18 Deutsche Bank AG/Hong Kong
3. Easing price pressure YY faced heavier pricing pressure in 2016 − partly reflecting the FX
pressure experienced by Adidas, in our view. Nevertheless, with the
USD strengthening against the EUR, we forecast less pricing pressure
from Adidas.
In addition, YY has been strengthening its cooperation with Adidas
through:
(a) Taking on additional footwear orders from Apache,
(b) Preparing knitted upper production for Adidas,
(c) Expanding the “Boost” midsole production in Vietnam, and
(d) Helping Adidas execute growth in China through the retail
operation (Pou Sheng).
We view our ASP growth forecasts as conservative, considering the
rising raw material prices and the “cost-plus” pricing model.
4. Beneficiary of the “modern retro” style A major comeback has been seen for retro sneakers in the production
pipeline: namely, the Nike Air Max series, Air Force 1, etc.
Modern technology with authentic design means better profitability
for ODMs: these retro shoes have been continuously produced by
ODMs, so factory workers are very familiar with the production
process. We estimate the profitability for retro shoes to be higher than
for other shoes, thanks to more advanced production technology and
material science.
Flyknit order cut partly reflects the come-back of retro shoes: we
believe traditional shoe makers will see easing pressure from knitted
uppers in 2017.
Line of Thinking
Figure 41: YY’s share price Figure 42: YY consensus earnings revisions
22.0
24.0
26.0
28.0
30.0
32.0
34.0
36.0
38.0
Aug-14 Jan-15 Jun-15 Nov-15 Apr-16 Sep-16 Feb-17
Share price
Initiate
with Hold U/G to Buy
450
470
490
510
530
550
570
590
610
450
470
490
510
530
550
570
590
Jan-15 Apr-15 Jul-15 Oct-15 Jan-16 Apr-16 Jul-16 Oct-16 Jan-17
2016 consensus earnings (LHS) 2017 consensus earnings (RHS)
Source: Deutsche Bank, Bloomberg Finance LP
Source: Deutsche Bank, Bloomberg Finance LP consensus
We initiated with Hold as we expected continued challenges with YY’s
ODM business, despite strong growth from the retail business (Pou
Sheng).
We upgraded to Buy as we were more positive on the ODM profit
recovery, as well as incremental positives including order shifts from
Apache.
Figure 40: Our (conservative) ASP
forecasts
-4%
-2%
0%
2%
4%
6%
8%
10%
2010 2012 2014 16E 18E 20E
Blended ASP YoY
Source: Deutsche Bank estimates, company data
21 February 2017
Consumer
Greater China Sporting Goods
Deutsche Bank AG/Hong Kong Page 19
Earnings revisions and DBe vs. consensus
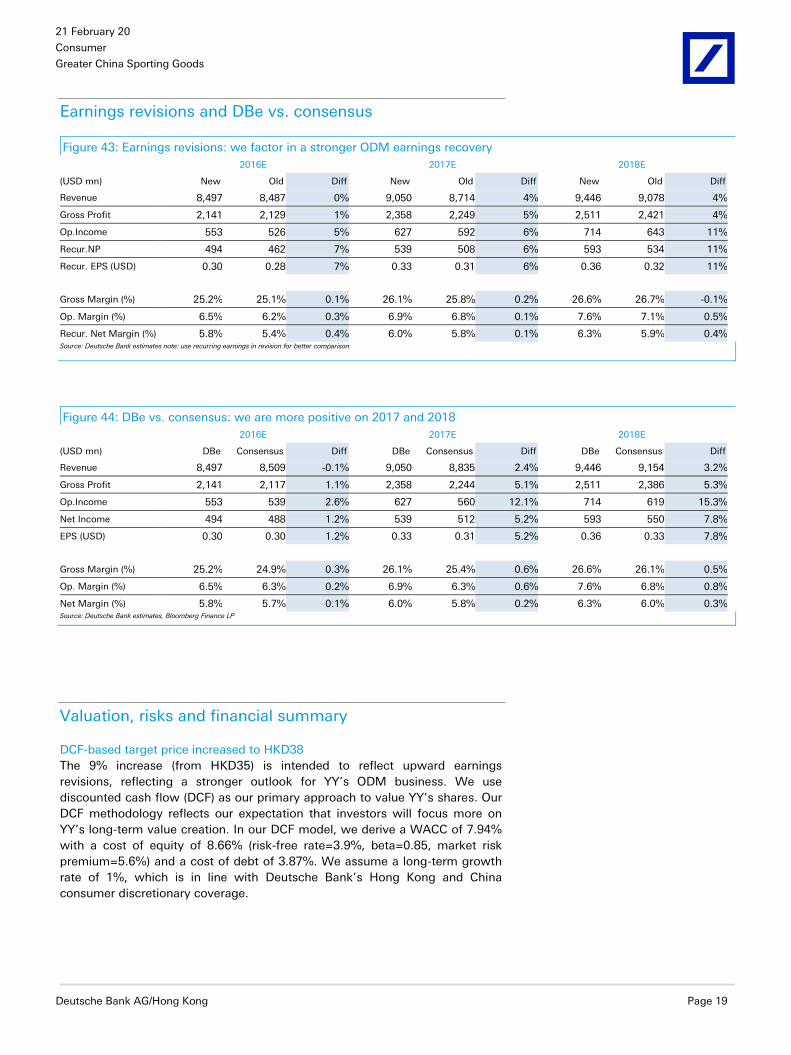
Figure 43: Earnings revisions: we factor in a stronger ODM earnings recovery
2016E 2017E 2018E
(USD mn) New Old Diff New Old Diff New Old Diff
Revenue 8,497 8,487 0% 9,050 8,714 4% 9,446 9,078 4%
Gross Profit 2,141 2,129 1% 2,358 2,249 5% 2,511 2,421 4%
Op.Income 553 526 5% 627 592 6% 714 643 11%
Recur.NP 494 462 7% 539 508 6% 593 534 11%
Recur. EPS (USD) 0.30 0.28 7% 0.33 0.31 6% 0.36 0.32 11%
Gross Margin (%) 25.2% 25.1% 0.1% 26.1% 25.8% 0.2% 26.6% 26.7% -0.1%
Op. Margin (%) 6.5% 6.2% 0.3% 6.9% 6.8% 0.1% 7.6% 7.1% 0.5%
Recur. Net Margin (%) 5.8% 5.4% 0.4% 6.0% 5.8% 0.1% 6.3% 5.9% 0.4% Source: Deutsche Bank estimates note: use recurring earnings in revision for better comparison
Figure 44: DBe vs. consensus: we are more positive on 2017 and 2018
2016E 2017E 2018E
(USD mn) DBe Consensus Diff DBe Consensus Diff DBe Consensus Diff
Revenue 8,497 8,509 -0.1% 9,050 8,835 2.4% 9,446 9,154 3.2%
Gross Profit 2,141 2,117 1.1% 2,358 2,244 5.1% 2,511 2,386 5.3%
Op.Income 553 539 2.6% 627 560 12.1% 714 619 15.3%
Net Income 494 488 1.2% 539 512 5.2% 593 550 7.8%
EPS (USD) 0.30 0.30 1.2% 0.33 0.31 5.2% 0.36 0.33 7.8%
Gross Margin (%) 25.2% 24.9% 0.3% 26.1% 25.4% 0.6% 26.6% 26.1% 0.5%
Op. Margin (%) 6.5% 6.3% 0.2% 6.9% 6.3% 0.6% 7.6% 6.8% 0.8%
Net Margin (%) 5.8% 5.7% 0.1% 6.0% 5.8% 0.2% 6.3% 6.0% 0.3% Source: Deutsche Bank estimates, Bloomberg Finance LP
Valuation, risks and financial summary
DCF-based target price increased to HKD38
The 9% increase (from HKD35) is intended to reflect upward earnings
revisions, reflecting a stronger outlook for YY’s ODM business. We use
discounted cash flow (DCF) as our primary approach to value YY’s shares. Our
DCF methodology reflects our expectation that investors will focus more on
YY’s long-term value creation. In our DCF model, we derive a WACC of 7.94%
with a cost of equity of 8.66% (risk-free rate=3.9%, beta=0.85, market risk
premium=5.6%) and a cost of debt of 3.87%. We assume a long-term growth
rate of 1%, which is in line with Deutsche Bank’s Hong Kong and China
consumer discretionary coverage.

21 February 2017
Consumer
Greater China Sporting Goods
Page 20 Deutsche Bank AG/Hong Kong
Figure 45: DCF sales, margin assumptions and sensitivity Figure 46: Free cash flow to equity profile
Two-stage DCF:
1. FCF forecasts from model 2018-2020
2. Explicit forecast period 2021-2030
2018~2021 2022~2025 2026~2030 2018~2030
Revenue CAGR: 6.6% 4.1% 2.3% 3.7%
Average EBIT margin: 7.5% 7.1% 6.7% 7.1%
FCF CAGR: 17.3% 3.1% 0.8% 5.0%
-70%
-50%
-30%
-10%
10%
30%
50%
-
100
200
300
400
500
600
700
2012 2015 2018 2021 2024 2027 2030
Free Cashflow to Equity (LHS)
YoY (RHS)(USDmn)
Source: Deutsche Bank estimates
Source: Deutsche Bank estimates, Note: representing free cash flow for equity (in line with Deutsche Bank RTN)
Figure 47: Discounted cash flow valuation – key assumptions
Share & Market Information Note
Valuation date 12 month forward
Current Stock Price 26.95
Issued Shares (million) 1,646 Weighted average shares
DCF Target Price 38
Implied Upside (Downside) 41%
Valuation metrics
FY16 PER (recurring) 16.6
FY17 PER (recurring) 14.9
FY16 PBR 1.7
FY17 PBR 1.6
Cost of Equity 8.66%
Risk Free Rate (%) 3.9% Deutsche Bank assumption for China
Beta 0.85 Bloomberg 1-year beta
Market Risk Premium (%) 5.60% Deutsche Bank assumption for China
Cost of Debt (after tax) 3.87%
Cost of Debt 4.50% Company long-term borrowing rate
Tax Rate 14.00% Long-term tax rate
Target Debt / (Debt + Equity) 15%
WACC 7.94%
DCF Model LT growth 1.0% In-line with DB consumer discretionary coverage space
Source: Deutsche Bank estimates, company data
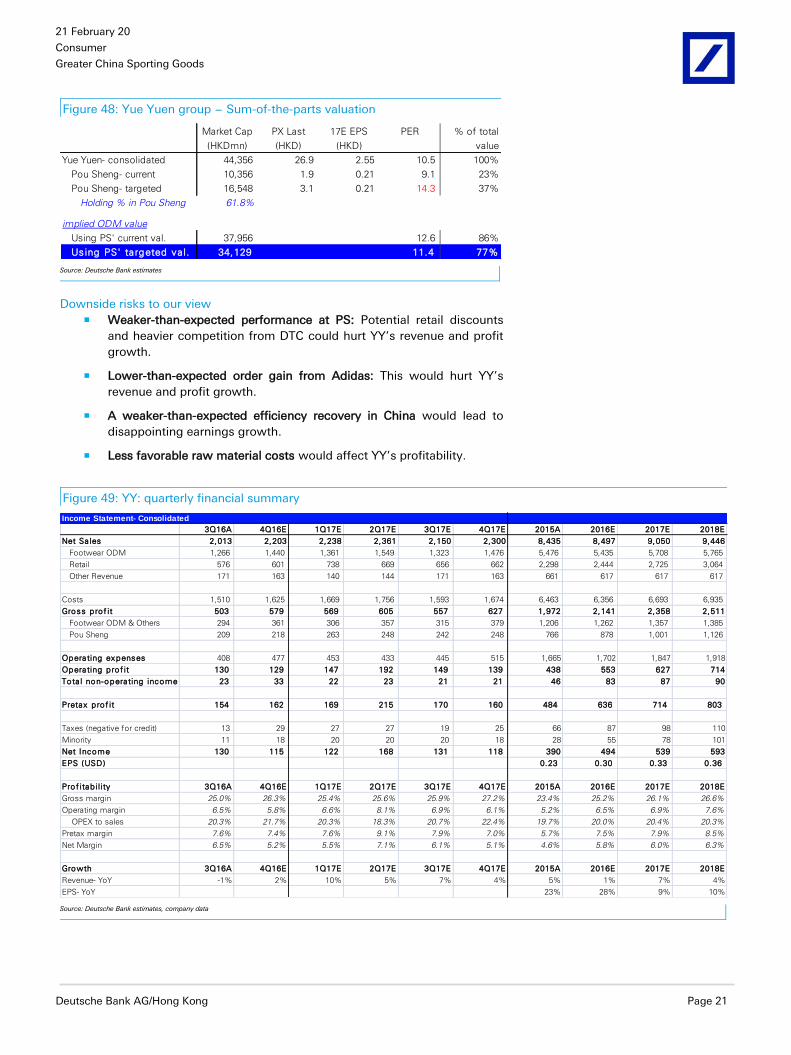
SoTP analysis suggests ODM values not fully priced in
We support our valuation using a sum-of-the-parts (SoTP) analysis. If we derive
YY’s ODM value using the current value of Pou Sheng (the group’s retail
operation), YY’s ODM value is implied at HKD38bn, or 12.6x ODM earnings. If
we assign Pou Sheng’s value using our targeted corporate value (derived from
the target price), ODM business is trading at 11.4x.
38 8.9% 8.4% 7.9% 7.4% 6.9%
-1.00% 30 32 34 36 38
0.00% 31 33 36 38 41
1.00% 33 35 38 41 44
2.00% 35 37 41 44 49
3.00% 37 41 45 49 56
WACC
Terminal
Growth
21 February 2017
Consumer
Greater China Sporting Goods
Deutsche Bank AG/Hong Kong Page 21
Figure 48: Yue Yuen group − Sum-of-the-parts valuation
Market Cap PX Last 17E EPS PER % of total
(HKDmn) (HKD) (HKD) value
Yue Yuen- consolidated 44,356 26.9 2.55 10.5 100%
Pou Sheng- current 10,356 1.9 0.21 9.1 23%
Pou Sheng- targeted 16,548 3.1 0.21 14.3 37%
Holding % in Pou Sheng 61.8%
implied ODM value
Using PS' current val. 37,956 12.6 86%
Using PS' targeted va l. 34,129 11.4 77% Source: Deutsche Bank estimates
Downside risks to our view Weaker-than-expected performance at PS: Potential retail discounts
and heavier competition from DTC could hurt YY’s revenue and profit
growth.
Lower-than-expected order gain from Adidas: This would hurt YY’s
revenue and profit growth.
A weaker-than-expected efficiency recovery in China would lead to
disappointing earnings growth.
Less favorable raw material costs would affect YY’s profitability.
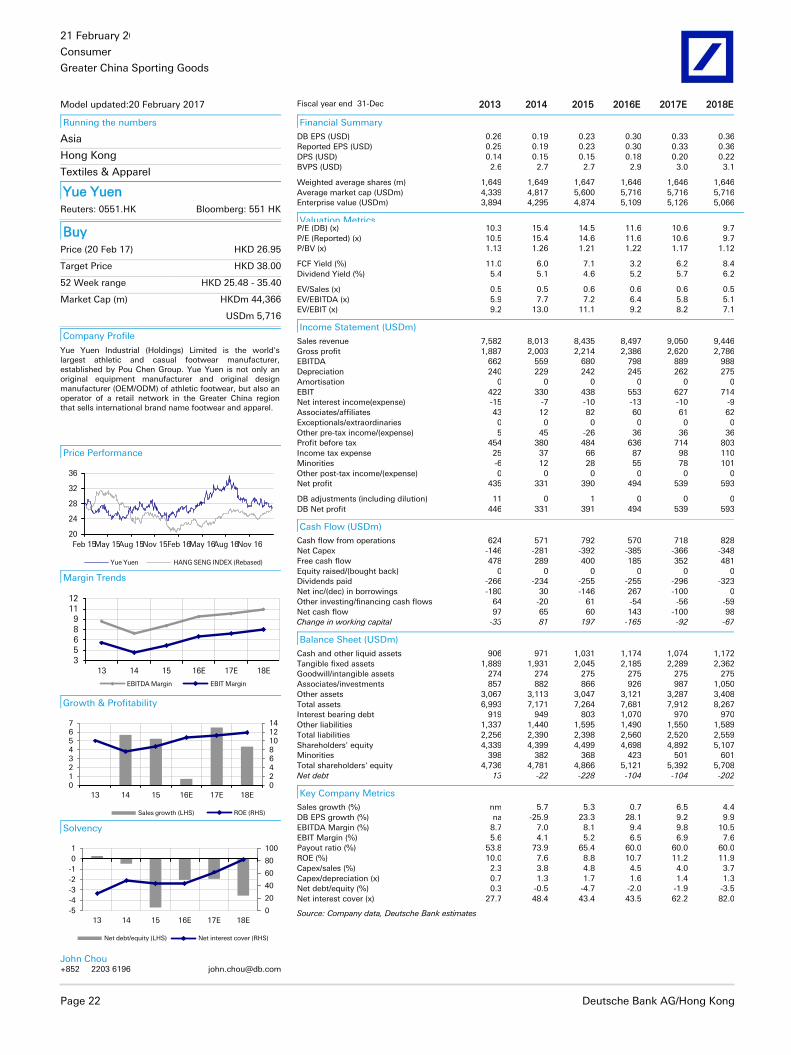
Figure 49: YY: quarterly financial summary
Income Statement- Consolidated
3Q16A 4Q16E 1Q17E 2Q17E 3Q17E 4Q17E 2015A 2016E 2017E 2018E
Net Sa les 2,013 2,203 2,238 2,361 2,150 2,300 8,435 8,497 9,050 9,446
Footwear ODM 1,266 1,440 1,361 1,549 1,323 1,476 5,476 5,435 5,708 5,765
Retail 576 601 738 669 656 662 2,298 2,444 2,725 3,064
Other Revenue 171 163 140 144 171 163 661 617 617 617
Costs 1,510 1,625 1,669 1,756 1,593 1,674 6,463 6,356 6,693 6,935
Gross prof it 503 579 569 605 557 627 1,972 2,141 2,358 2,511
Footwear ODM & Others 294 361 306 357 315 379 1,206 1,262 1,357 1,385
Pou Sheng 209 218 263 248 242 248 766 878 1,001 1,126
Operating expenses 408 477 453 433 445 515 1,665 1,702 1,847 1,918
Operating prof it 130 129 147 192 149 139 438 553 627 714
Tota l non-operating income 23 33 22 23 21 21 46 83 87 90
Pretax prof it 154 162 169 215 170 160 484 636 714 803
Taxes (negative for credit) 13 29 27 27 19 25 66 87 98 110
Minority 11 18 20 20 20 18 28 55 78 101
Net Income 130 115 122 168 131 118 390 494 539 593
EPS (USD) 0.23 0.30 0.33 0.36
Prof itab il ity 3Q16A 4Q16E 1Q17E 2Q17E 3Q17E 4Q17E 2015A 2016E 2017E 2018E
Gross margin 25.0% 26.3% 25.4% 25.6% 25.9% 27.2% 23.4% 25.2% 26.1% 26.6%
Operating margin 6.5% 5.8% 6.6% 8.1% 6.9% 6.1% 5.2% 6.5% 6.9% 7.6%
OPEX to sales 20.3% 21.7% 20.3% 18.3% 20.7% 22.4% 19.7% 20.0% 20.4% 20.3%
Pretax margin 7.6% 7.4% 7.6% 9.1% 7.9% 7.0% 5.7% 7.5% 7.9% 8.5%
Net Margin 6.5% 5.2% 5.5% 7.1% 6.1% 5.1% 4.6% 5.8% 6.0% 6.3%
Growth 3Q16A 4Q16E 1Q17E 2Q17E 3Q17E 4Q17E 2015A 2016E 2017E 2018E
Revenue- YoY -1% 2% 10% 5% 7% 4% 5% 1% 7% 4%
EPS- YoY 23% 28% 9% 10% Source: Deutsche Bank estimates, company data
21 February 2017
Consumer
Greater China Sporting Goods
Page 22 Deutsche Bank AG/Hong Kong
Model updated:20 February 2017
Running the numbers
Asia
Hong Kong
Textiles & Apparel
Yue Yuen Reuters: 0551.HK Bloomberg: 551 HK
Buy Price (20 Feb 17) HKD 26.95
Target Price HKD 38.00
52 Week range HKD 25.48 - 35.40
Market Cap (m) HKDm 44,366
USDm 5,716
Company Profile
Yue Yuen Industrial (Holdings) Limited is the world's largest athletic and casual footwear manufacturer, established by Pou Chen Group. Yue Yuen is not only an original equipment manufacturer and original design manufacturer (OEM/ODM) of athletic footwear, but also an operator of a retail network in the Greater China region that sells international brand name footwear and apparel.
Price Performance
20
24
28
32
36
Feb 15May 15Aug 15Nov 15Feb 16May 16Aug 16Nov 16
Yue Yuen HANG SENG INDEX (Rebased)
Margin Trends
35689
1112
13 14 15 16E 17E 18E
EBITDA Margin EBIT Margin
Growth & Profitability
02468101214
01234567
13 14 15 16E 17E 18E
Sales growth (LHS) ROE (RHS)
Solvency
0
20
40
60
80
100
-5
-4
-3
-2
-1
0
1
13 14 15 16E 17E 18E
Net debt/equity (LHS) Net interest cover (RHS)
John Chou
+852 2203 6196 [email protected]
Fiscal year end 31-Dec 2013 2014 2015 2016E 2017E 2018E
Financial Summary
DB EPS (USD) 0.26 0.19 0.23 0.30 0.33 0.36
Reported EPS (USD) 0.25 0.19 0.23 0.30 0.33 0.36
DPS (USD) 0.14 0.15 0.15 0.18 0.20 0.22
BVPS (USD) 2.6 2.7 2.7 2.9 3.0 3.1
Weighted average shares (m) 1,649 1,649 1,647 1,646 1,646 1,646
Average market cap (USDm) 4,339 4,817 5,600 5,716 5,716 5,716
Enterprise value (USDm) 3,894 4,295 4,874 5,109 5,126 5,066
Valuation Metrics P/E (DB) (x) 10.3 15.4 14.5 11.6 10.6 9.7
P/E (Reported) (x) 10.5 15.4 14.6 11.6 10.6 9.7
P/BV (x) 1.13 1.26 1.21 1.22 1.17 1.12
FCF Yield (%) 11.0 6.0 7.1 3.2 6.2 8.4
Dividend Yield (%) 5.4 5.1 4.6 5.2 5.7 6.2
EV/Sales (x) 0.5 0.5 0.6 0.6 0.6 0.5
EV/EBITDA (x) 5.9 7.7 7.2 6.4 5.8 5.1
EV/EBIT (x) 9.2 13.0 11.1 9.2 8.2 7.1
Income Statement (USDm)
Sales revenue 7,582 8,013 8,435 8,497 9,050 9,446
Gross profit 1,887 2,003 2,214 2,386 2,620 2,786
EBITDA 662 559 680 798 889 988
Depreciation 240 229 242 245 262 275
Amortisation 0 0 0 0 0 0
EBIT 422 330 438 553 627 714
Net interest income(expense) -15 -7 -10 -13 -10 -9
Associates/affiliates 43 12 82 60 61 62
Exceptionals/extraordinaries 0 0 0 0 0 0
Other pre-tax income/(expense) 5 45 -26 36 36 36
Profit before tax 454 380 484 636 714 803
Income tax expense 25 37 66 87 98 110
Minorities -6 12 28 55 78 101
Other post-tax income/(expense) 0 0 0 0 0 0
Net profit 435 331 390 494 539 593
DB adjustments (including dilution) 11 0 1 0 0 0
DB Net profit 446 331 391 494 539 593
Cash Flow (USDm)
Cash flow from operations 624 571 792 570 718 828
Net Capex -146 -281 -392 -385 -366 -348
Free cash flow 478 289 400 185 352 481
Equity raised/(bought back) 0 0 0 0 0 0
Dividends paid -266 -234 -255 -255 -296 -323
Net inc/(dec) in borrowings -180 30 -146 267 -100 0
Other investing/financing cash flows 64 -20 61 -54 -56 -59
Net cash flow 97 65 60 143 -100 98
Change in working capital -33 81 197 -165 -92 -67
Balance Sheet (USDm)
Cash and other liquid assets 906 971 1,031 1,174 1,074 1,172
Tangible fixed assets 1,889 1,931 2,045 2,185 2,289 2,362
Goodwill/intangible assets 274 274 275 275 275 275
Associates/investments 857 882 866 926 987 1,050
Other assets 3,067 3,113 3,047 3,121 3,287 3,408
Total assets 6,993 7,171 7,264 7,681 7,912 8,267
Interest bearing debt 919 949 803 1,070 970 970
Other liabilities 1,337 1,440 1,595 1,490 1,550 1,589
Total liabilities 2,256 2,390 2,398 2,560 2,520 2,559
Shareholders' equity 4,339 4,399 4,499 4,698 4,892 5,107
Minorities 398 382 368 423 501 601
Total shareholders' equity 4,736 4,781 4,866 5,121 5,392 5,708
Net debt 13 -22 -228 -104 -104 -202
Key Company Metrics
Sales growth (%) nm 5.7 5.3 0.7 6.5 4.4
DB EPS growth (%) na -25.9 23.3 28.1 9.2 9.9
EBITDA Margin (%) 8.7 7.0 8.1 9.4 9.8 10.5
EBIT Margin (%) 5.6 4.1 5.2 6.5 6.9 7.6
Payout ratio (%) 53.8 73.9 65.4 60.0 60.0 60.0
ROE (%) 10.0 7.6 8.8 10.7 11.2 11.9
Capex/sales (%) 2.3 3.8 4.8 4.5 4.0 3.7
Capex/depreciation (x) 0.7 1.3 1.7 1.6 1.4 1.3
Net debt/equity (%) 0.3 -0.5 -4.7 -2.0 -1.9 -3.5
Net interest cover (x) 27.7 48.4 43.4 43.5 62.2 82.0
Source: Company data, Deutsche Bank estimates
21 February 2017
Consumer
Greater China Sporting Goods
Deutsche Bank AG/Hong Kong Page 23
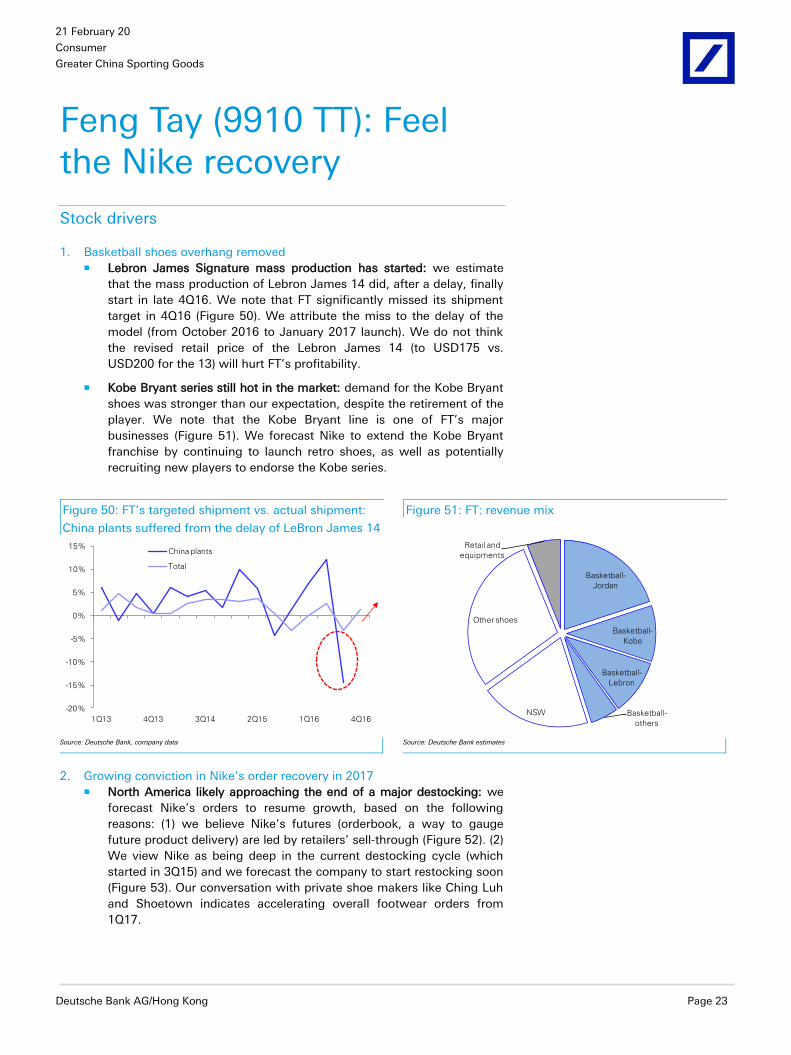
Feng Tay (9910 TT): Feel the Nike recovery
Stock drivers
1. Basketball shoes overhang removed Lebron James Signature mass production has started: we estimate
that the mass production of Lebron James 14 did, after a delay, finally
start in late 4Q16. We note that FT significantly missed its shipment
target in 4Q16 (Figure 50). We attribute the miss to the delay of the
model (from October 2016 to January 2017 launch). We do not think
the revised retail price of the Lebron James 14 (to USD175 vs.
USD200 for the 13) will hurt FT’s profitability.
Kobe Bryant series still hot in the market: demand for the Kobe Bryant
shoes was stronger than our expectation, despite the retirement of the
player. We note that the Kobe Bryant line is one of FT’s major
businesses (Figure 51). We forecast Nike to extend the Kobe Bryant
franchise by continuing to launch retro shoes, as well as potentially
recruiting new players to endorse the Kobe series.
Figure 50: FT’s targeted shipment vs. actual shipment:
China plants suffered from the delay of LeBron James 14
Figure 51: FT: revenue mix
-20%
-15%
-10%
-5%
0%
5%
10%
15%
1Q13 4Q13 3Q14 2Q15 1Q16 4Q16
China plants
Total
Basketball-
Jordan
Basketball-
Kobe
Basketball-
Lebron
Basketball-
others
NSW
Other shoes
Retail and
equipments
Source: Deutsche Bank, company data
Source: Deutsche Bank estimates
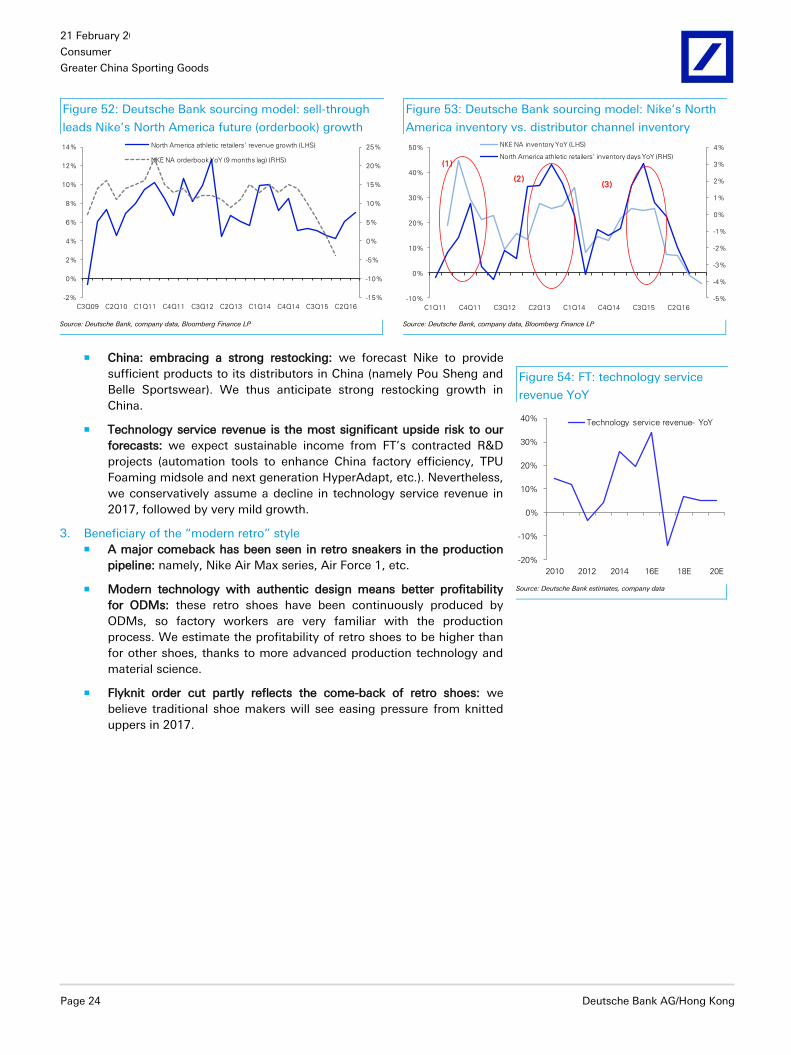
2. Growing conviction in Nike’s order recovery in 2017 North America likely approaching the end of a major destocking: we
forecast Nike’s orders to resume growth, based on the following
reasons: (1) we believe Nike’s futures (orderbook, a way to gauge
future product delivery) are led by retailers’ sell-through (Figure 52). (2)
We view Nike as being deep in the current destocking cycle (which
started in 3Q15) and we forecast the company to start restocking soon
(Figure 53). Our conversation with private shoe makers like Ching Luh
and Shoetown indicates accelerating overall footwear orders from
1Q17.
21 February 2017
Consumer
Greater China Sporting Goods
Page 24 Deutsche Bank AG/Hong Kong
Figure 52: Deutsche Bank sourcing model: sell-through
leads Nike’s North America future (orderbook) growth
Figure 53: Deutsche Bank sourcing model: Nike’s North
America inventory vs. distributor channel inventory
-15%
-10%
-5%
0%
5%
10%
15%
20%
25%
-2%
0%
2%
4%
6%
8%
10%
12%
14%
C3Q09 C2Q10 C1Q11 C4Q11 C3Q12 C2Q13 C1Q14 C4Q14 C3Q15 C2Q16
North America athletic retailers' revenue growth (LHS)
NKE NA orderbook YoY (9 months lag) (RHS)
-5%
-4%
-3%
-2%
-1%
0%
1%
2%
3%
4%
-10%
0%
10%
20%
30%
40%
50%
C1Q11 C4Q11 C3Q12 C2Q13 C1Q14 C4Q14 C3Q15 C2Q16
NKE NA inventory YoY (LHS)
North America athletic retailers' inventory days YoY (RHS)(1 )
(2 )(3 )
Source: Deutsche Bank, company data, Bloomberg Finance LP
Source: Deutsche Bank, company data, Bloomberg Finance LP
China: embracing a strong restocking: we forecast Nike to provide
sufficient products to its distributors in China (namely Pou Sheng and
Belle Sportswear). We thus anticipate strong restocking growth in
China.
Technology service revenue is the most significant upside risk to our
forecasts: we expect sustainable income from FT’s contracted R&D
projects (automation tools to enhance China factory efficiency, TPU
Foaming midsole and next generation HyperAdapt, etc.). Nevertheless,
we conservatively assume a decline in technology service revenue in
2017, followed by very mild growth.
3. Beneficiary of the “modern retro” style A major comeback has been seen in retro sneakers in the production
pipeline: namely, Nike Air Max series, Air Force 1, etc.
Modern technology with authentic design means better profitability
for ODMs: these retro shoes have been continuously produced by
ODMs, so factory workers are very familiar with the production
process. We estimate the profitability of retro shoes to be higher than
for other shoes, thanks to more advanced production technology and
material science.
Flyknit order cut partly reflects the come-back of retro shoes: we
believe traditional shoe makers will see easing pressure from knitted
uppers in 2017.
Figure 54: FT: technology service
revenue YoY
-20%
-10%
0%
10%
20%
30%
40%
2010 2012 2014 16E 18E 20E
Technology service revenue- YoY
Source: Deutsche Bank estimates, company data
21 February 2017
Consumer
Greater China Sporting Goods
Deutsche Bank AG/Hong Kong Page 25
Line of Thinking
Figure 55: FT’s share price Figure 56: FT consensus earnings revisions
60
80
100
120
140
160
180
200
220
Aug-14 Jan-15 Jun-15 Nov-15 Apr-16 Sep-16 Feb-17
Share price
Initiate
with Buy
4400
4600
4800
5000
5200
5400
5600
5800
6000
6200
3,000
3,500
4,000
4,500
5,000
5,500
6,000
Jan-15 Apr-15 Jul-15 Oct-15 Jan-16 Apr-16 Jul-16 Oct-16 Jan-17
2016 consensus earnings (LHS) 2017 consensus earnings (RHS)
Source: Deutsche Bank, Bloomberg Finance LP
Source: Deutsche Bank, Bloomberg Finance LP consensus
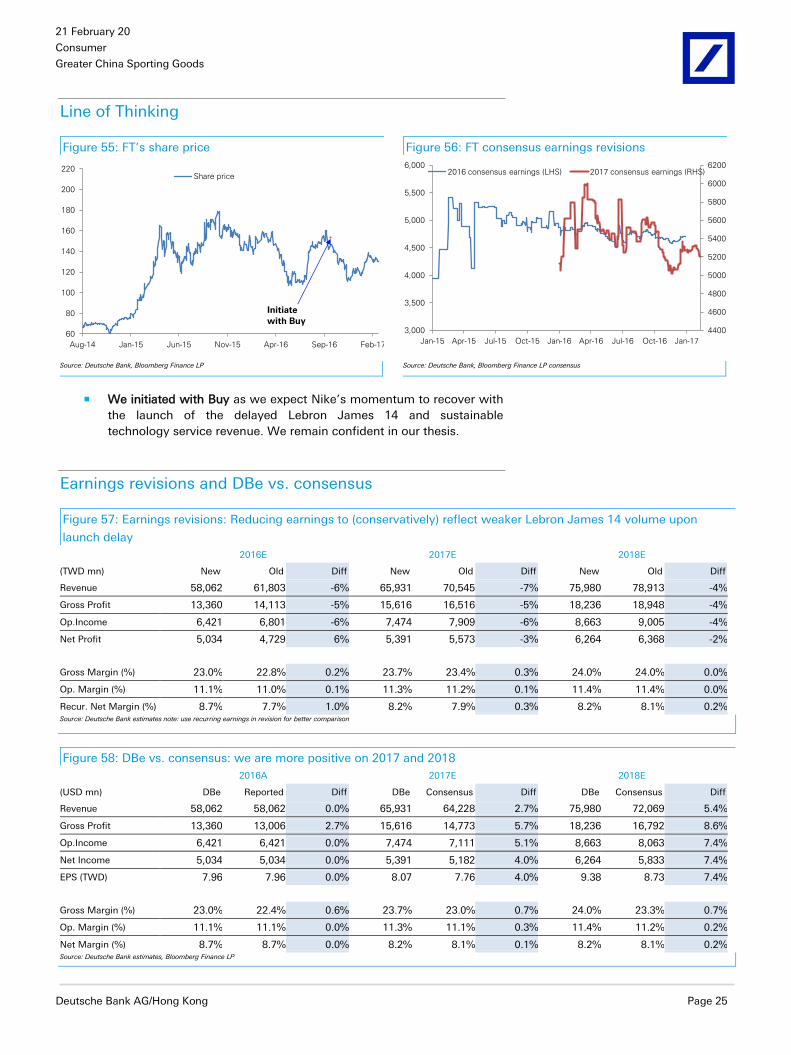
We initiated with Buy as we expect Nike’s momentum to recover with
the launch of the delayed Lebron James 14 and sustainable
technology service revenue. We remain confident in our thesis.
Earnings revisions and DBe vs. consensus
Figure 57: Earnings revisions: Reducing earnings to (conservatively) reflect weaker Lebron James 14 volume upon
launch delay
2016E 2017E 2018E
(TWD mn) New Old Diff New Old Diff New Old Diff
Revenue 58,062 61,803 -6% 65,931 70,545 -7% 75,980 78,913 -4%
Gross Profit 13,360 14,113 -5% 15,616 16,516 -5% 18,236 18,948 -4%
Op.Income 6,421 6,801 -6% 7,474 7,909 -6% 8,663 9,005 -4%
Net Profit 5,034 4,729 6% 5,391 5,573 -3% 6,264 6,368 -2%
Gross Margin (%) 23.0% 22.8% 0.2% 23.7% 23.4% 0.3% 24.0% 24.0% 0.0%
Op. Margin (%) 11.1% 11.0% 0.1% 11.3% 11.2% 0.1% 11.4% 11.4% 0.0%
Recur. Net Margin (%) 8.7% 7.7% 1.0% 8.2% 7.9% 0.3% 8.2% 8.1% 0.2% Source: Deutsche Bank estimates note: use recurring earnings in revision for better comparison
Figure 58: DBe vs. consensus: we are more positive on 2017 and 2018
2016A 2017E 2018E
(USD mn) DBe Reported Diff DBe Consensus Diff DBe Consensus Diff
Revenue 58,062 58,062 0.0% 65,931 64,228 2.7% 75,980 72,069 5.4%
Gross Profit 13,360 13,006 2.7% 15,616 14,773 5.7% 18,236 16,792 8.6%
Op.Income 6,421 6,421 0.0% 7,474 7,111 5.1% 8,663 8,063 7.4%
Net Income 5,034 5,034 0.0% 5,391 5,182 4.0% 6,264 5,833 7.4%
EPS (TWD) 7.96 7.96 0.0% 8.07 7.76 4.0% 9.38 8.73 7.4%
Gross Margin (%) 23.0% 22.4% 0.6% 23.7% 23.0% 0.7% 24.0% 23.3% 0.7%
Op. Margin (%) 11.1% 11.1% 0.0% 11.3% 11.1% 0.3% 11.4% 11.2% 0.2%
Net Margin (%) 8.7% 8.7% 0.0% 8.2% 8.1% 0.1% 8.2% 8.1% 0.2% Source: Deutsche Bank estimates, Bloomberg Finance LP
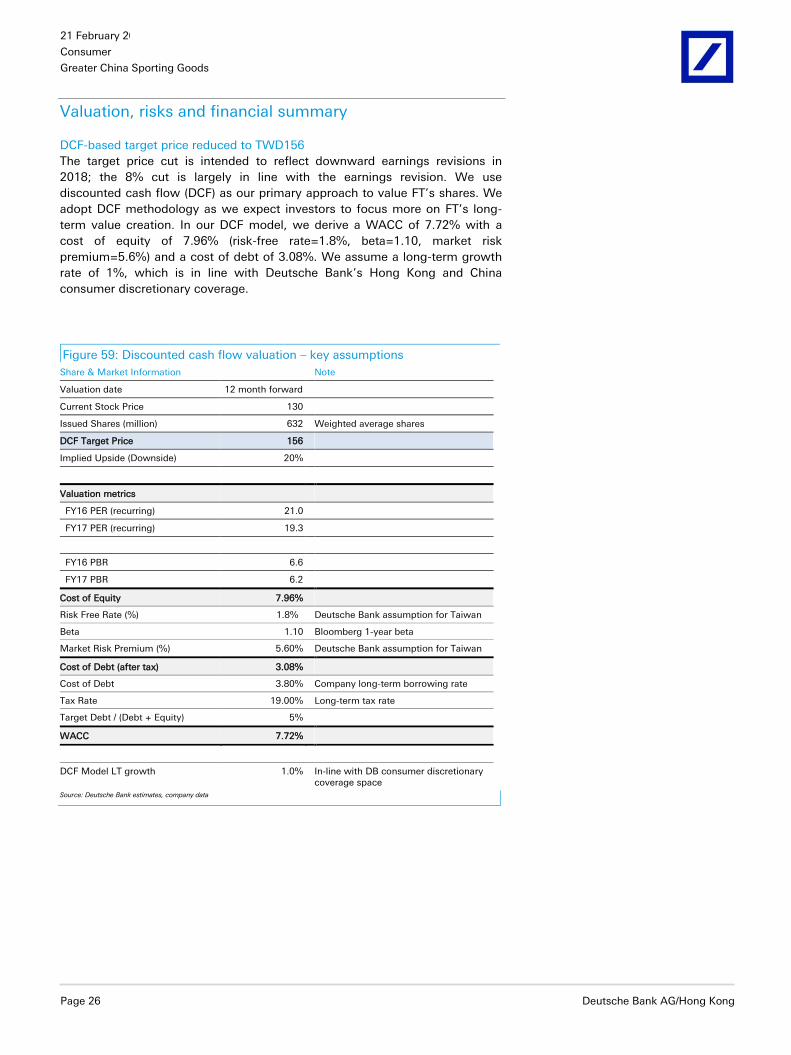
21 February 2017
Consumer
Greater China Sporting Goods
Page 26 Deutsche Bank AG/Hong Kong
Valuation, risks and financial summary
DCF-based target price reduced to TWD156
The target price cut is intended to reflect downward earnings revisions in
2018; the 8% cut is largely in line with the earnings revision. We use
discounted cash flow (DCF) as our primary approach to value FT’s shares. We
adopt DCF methodology as we expect investors to focus more on FT’s long-
term value creation. In our DCF model, we derive a WACC of 7.72% with a
cost of equity of 7.96% (risk-free rate=1.8%, beta=1.10, market risk
premium=5.6%) and a cost of debt of 3.08%. We assume a long-term growth
rate of 1%, which is in line with Deutsche Bank’s Hong Kong and China
consumer discretionary coverage.
Figure 59: Discounted cash flow valuation – key assumptions
Share & Market Information Note
Valuation date 12 month forward
Current Stock Price 130
Issued Shares (million) 632 Weighted average shares
DCF Target Price 156
Implied Upside (Downside) 20%
Valuation metrics
FY16 PER (recurring) 21.0
FY17 PER (recurring) 19.3
FY16 PBR 6.6
FY17 PBR 6.2
Cost of Equity 7.96%
Risk Free Rate (%) 1.8% Deutsche Bank assumption for Taiwan
Beta 1.10 Bloomberg 1-year beta
Market Risk Premium (%) 5.60% Deutsche Bank assumption for Taiwan
Cost of Debt (after tax) 3.08%
Cost of Debt 3.80% Company long-term borrowing rate
Tax Rate 19.00% Long-term tax rate
Target Debt / (Debt + Equity) 5%
WACC 7.72%
DCF Model LT growth 1.0% In-line with DB consumer discretionary coverage space
Source: Deutsche Bank estimates, company data
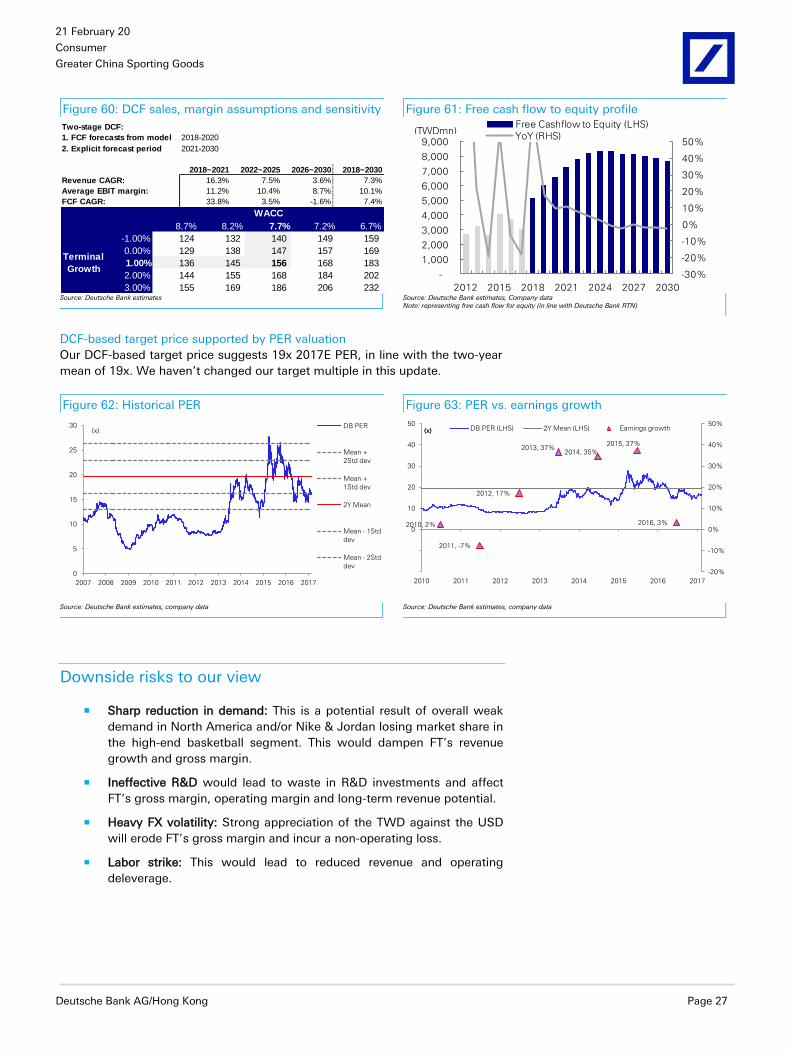
21 February 2017
Consumer
Greater China Sporting Goods
Deutsche Bank AG/Hong Kong Page 27
Figure 60: DCF sales, margin assumptions and sensitivity Figure 61: Free cash flow to equity profile
Two-stage DCF:
1. FCF forecasts from model 2018-2020
2. Explicit forecast period 2021-2030
2018~2021 2022~2025 2026~2030 2018~2030
Revenue CAGR: 16.3% 7.5% 3.6% 7.3%
Average EBIT margin: 11.2% 10.4% 8.7% 10.1%
FCF CAGR: 33.8% 3.5% -1.6% 7.4%
Source: Deutsche Bank estimates
Source: Deutsche Bank estimates, Company data Note: representing free cash flow for equity (in line with Deutsche Bank RTN)
DCF-based target price supported by PER valuation
Our DCF-based target price suggests 19x 2017E PER, in line with the two-year
mean of 19x. We haven’t changed our target multiple in this update.
Figure 62: Historical PER Figure 63: PER vs. earnings growth
0
5
10
15
20
25
30
2007 2008 2009 2010 2011 2012 2013 2014 2015 2016 2017
DB PER
Mean +
2Std dev
Mean +
1Std dev
2Y Mean
Mean - 1Std
dev
Mean - 2Std
dev
(x)
2010, 2%
2011, -7%
2012, 17%
2013, 37%2014, 35%
2015, 37%
2016, 3%
-20%
-10%
0%
10%
20%
30%
40%
50%
-20
-10
0
10
20
30
40
50
2010 2011 2012 2013 2014 2015 2016 2017
DB PER (LHS) 2Y Mean (LHS) Earnings growth(x)(x)
Source: Deutsche Bank estimates, company data
Source: Deutsche Bank estimates, company data
Downside risks to our view
Sharp reduction in demand: This is a potential result of overall weak
demand in North America and/or Nike & Jordan losing market share in
the high-end basketball segment. This would dampen FT’s revenue
growth and gross margin.
Ineffective R&D would lead to waste in R&D investments and affect
FT’s gross margin, operating margin and long-term revenue potential.
Heavy FX volatility: Strong appreciation of the TWD against the USD
will erode FT’s gross margin and incur a non-operating loss.
Labor strike: This would lead to reduced revenue and operating
deleverage.
156 8.7% 8.2% 7.7% 7.2% 6.7%
-1.00% 124 132 140 149 159
0.00% 129 138 147 157 169
1.00% 136 145 156 168 183
2.00% 144 155 168 184 202
3.00% 155 169 186 206 232
WACC
Terminal
Growth-30%
-20%
-10%
0%
10%
20%
30%
40%
50%
-
1,000
2,000
3,000
4,000
5,000
6,000
7,000
8,000
9,000
2012 2015 2018 2021 2024 2027 2030
Free Cashflow to Equity (LHS)
YoY (RHS)(TWDmn)

21 February 2017
Consumer
Greater China Sporting Goods
Page 28 Deutsche Bank AG/Hong Kong
Figure 64: FT: quarterly financial summary
Income Statement- Consolidated
3Q16A 4Q16E 1Q17E 2Q17E 3Q17E 4Q17E 2015A 2016E 2017E 2018E
Net Sa les 14,100 14,387 14,968 17,106 16,297 17,560 55,804 58,062 65,931 75,980
Shipment (mn units) 89 95 104 118
ASP (USD) 17.7 17.8 18.1 18.2
Costs 10,742 11,084 11,677 12,965 12,291 13,382 44,038 44,702 50,315 57,744
Gross prof it 3,358 3,303 3,291 4,141 4,006 4,177 11,766 13,360 15,616 18,236
Operating expenses 1,759 1,675 1,841 2,207 2,005 2,090 6,244 6,939 8,142 9,573
Operating Prof it 1,599 1,628 1,450 1,934 2,001 2,088 5,522 6,421 7,474 8,663
Investment income, net 25 0 0 0 0 0 72 23 0 0
Other net non-op 98 252 128 127 127 127 664 608 509 566
Tota l non-operating income 123 252 128 127 127 127 736 632 509 566
Pretax prof it 1,723 1,880 1,578 2,062 2,129 2,215 6,259 7,053 7,983 9,228
Taxes (negative for credit) 418 226 442 474 553 576 1,597 1,521 2,045 2,362
Minority 139 97 122 165 153 107 424 497 547 602
Net Income 1,165 1,557 1,015 1,422 1,422 1,532 4,238 5,034 5,391 6,264
DB EPS (TWD) 1.74 2.33 1.52 2.13 2.13 2.29 6.90 7.44 8.07 9.38
Prof itab il ity 3Q16A 4Q16E 1Q17E 2Q17E 3Q17E 4Q17E 2015A 2016E 2017E 2018E
Gross margin 23.8% 23.0% 22.0% 24.2% 24.6% 23.8% 21.1% 23.0% 23.7% 24.0%
Operating margin 11.3% 11.3% 9.7% 11.3% 12.3% 11.9% 9.9% 11.1% 11.3% 11.4%
OPEX to sales 12.5% 11.6% 12.3% 12.9% 12.3% 11.9% 11.2% 12.0% 12.3% 12.6%
Pretax margin 12.2% 13.1% 10.5% 12.1% 13.1% 12.6% 11.2% 12.1% 12.1% 12.1%
Net Margin 8.3% 10.8% 6.8% 8.3% 8.7% 8.7% 7.6% 8.7% 8.2% 8.2%
Growth 3Q16A 4Q16E 1Q17E 2Q17E 3Q17E 4Q17E 2015A 2016E 2017E 2018E
Revenue- YoY -5% -3% 6% 11% 16% 22% 17% 4% 14% 15%
EPS- YoY -17% 19% -1% -9% 22% -2% 30% 8% 8% 16%
Source: Deutsche Bank estimates, company data

21 February 2017
Consumer
Greater China Sporting Goods
Deutsche Bank AG/Hong Kong Page 29
Model updated:20 February 2017
Running the numbers
Asia
Taiwan
Textiles & Apparel
Feng Tay Reuters: 9910.TW Bloomberg: 9910 TT
Buy Price (20 Feb 17) TWD 130.00
Target Price TWD 156.00
52 Week range TWD 106.97 - 160.00
Market Cap (m) TWDm 70,984
USDm 2,306
Company Profile
Feng Tay Enterprises Co., Ltd. is a major sports shoes manufacturer in Taiwan. The company offers products including sports shoes, casual shoes, sandals and slippers, rollerblades, skate shoes, etc. Feng Tay distributes products within domestic market as well as to overseas markets, including America, Europe and Asia.
Price Performance
80
100
120
140
160
180
Feb 15May 15Aug 15Nov 15Feb 16May 16Aug 16Nov 16
Feng TayTaiwan Stock Exchange (TWSE) (Rebased)
Margin Trends
8
9
11
12
14
15
13 14 15 16E 17E 18E
EBITDA Margin EBIT Margin
Growth & Profitability
0
10
20
30
40
0
5
10
15
20
25
30
13 14 15 16E 17E 18E
Sales growth (LHS) ROE (RHS)
Solvency
0
200
400
600
800
-30
-20
-10
0
10
20
13 14 15 16E 17E 18E
Net debt/equity (LHS) Net interest cover (RHS)
John Chou
+852 2203 6196 [email protected]
Fiscal year end 31-Dec 2013 2014 2015 2016E 2017E 2018E
Financial Summary
DB EPS (TWD) 4.13 5.31 6.90 7.44 8.07 9.38
Reported EPS (TWD) 4.20 5.44 7.21 7.96 8.07 9.38
DPS (TWD) 3.30 3.70 5.00 5.57 5.65 7.03
BVPS (TWD) 17.8 19.1 22.3 23.8 25.1 28.1
Weighted average shares (m) 546 568 588 632 668 668
Average market cap (TWDm) 22,831 36,955 82,483 70,984 70,984 70,984
Enterprise value (TWDm) 25,258 39,317 83,559 70,214 69,480 68,248
Valuation Metrics P/E (DB) (x) 10.1 12.3 20.3 17.5 16.1 13.9
P/E (Reported) (x) 10.0 12.0 19.5 16.3 16.1 13.9
P/BV (x) 3.06 4.16 6.53 5.47 5.18 4.63
FCF Yield (%) 14.2 7.0 4.9 6.7 5.8 6.2
Dividend Yield (%) 7.9 5.7 3.6 4.3 4.3 5.4
EV/Sales (x) 0.7 0.8 1.5 1.2 1.1 0.9
EV/EBITDA (x) 6.1 6.8 11.9 8.7 7.5 6.5
EV/EBIT (x) 8.7 8.7 15.1 10.9 9.3 7.9
Income Statement (TWDm)
Sales revenue 38,148 47,654 55,804 58,062 65,931 75,980
Gross profit 8,673 11,087 13,236 15,053 17,423 20,054
EBITDA 4,138 5,820 6,993 8,114 9,281 10,481
Depreciation 1,233 1,319 1,470 1,693 1,807 1,818
Amortisation 0 0 0 0 0 0
EBIT 2,905 4,501 5,522 6,421 7,474 8,663
Net interest income(expense) -3 -40 -36 -18 -11 10
Associates/affiliates 34 62 72 23 0 0
Exceptionals/extraordinaries 0 0 0 0 0 0
Other pre-tax income/(expense) 457 531 700 626 519 556
Profit before tax 3,393 5,055 6,259 7,053 7,983 9,228
Income tax expense 769 1,613 1,597 1,521 2,045 2,362
Minorities 330 355 424 497 547 602
Other post-tax income/(expense) 0 0 0 0 0 0
Net profit 2,294 3,087 4,238 5,034 5,391 6,264
DB adjustments (including dilution) -40 -73 -185 -328 0 0
DB Net profit 2,254 3,014 4,053 4,706 5,391 6,264
Cash Flow (TWDm)
Cash flow from operations 3,885 4,562 6,864 8,513 8,047 7,350
Net Capex -645 -1,972 -2,859 -3,036 -3,000 -2,000
Free cash flow 3,240 2,590 4,005 5,478 5,047 5,350
Equity raised/(bought back) 0 0 0 0 0 0
Dividends paid -1,178 -1,837 -2,142 -2,982 -3,723 -3,773
Net inc/(dec) in borrowings -1,136 597 -620 -633 -85 -1,100
Other investing/financing cash flows -1,152 -1,041 -760 -376 -42 -43
Net cash flow -225 308 483 1,487 1,197 434
Change in working capital -490 -1,313 52 239 -1,203 -1,018
Balance Sheet (TWDm)
Cash and other liquid assets 1,583 1,891 2,374 3,861 5,058 5,492
Tangible fixed assets 10,254 11,480 13,273 13,934 15,127 15,309
Goodwill/intangible assets 0 0 0 0 0 0
Associates/investments 675 655 896 852 852 1,152
Other assets 8,985 11,370 12,154 11,867 14,036 15,712
Total assets 21,497 25,397 28,697 30,514 35,073 37,664
Interest bearing debt 3,159 3,338 2,569 2,085 2,000 900
Other liabilities 7,067 9,636 11,255 11,541 13,911 15,021
Total liabilities 10,226 12,973 13,824 13,626 15,912 15,921
Shareholders' equity 9,745 10,853 13,096 15,029 16,756 18,736
Minorities 1,526 1,571 1,777 1,858 2,405 3,007
Total shareholders' equity 11,271 12,424 14,873 16,888 19,161 21,743
Net debt 1,576 1,446 195 -1,776 -3,058 -4,591
Key Company Metrics
Sales growth (%) nm 24.9 17.1 4.0 13.6 15.2
DB EPS growth (%) na 28.6 29.9 7.9 8.4 16.2
EBITDA Margin (%) 10.8 12.2 12.5 14.0 14.1 13.8
EBIT Margin (%) 7.6 9.4 9.9 11.1 11.3 11.4
Payout ratio (%) 78.5 68.1 69.3 70.0 70.0 75.0
ROE (%) 23.5 30.0 35.4 35.8 33.9 35.3
Capex/sales (%) 2.7 4.3 5.3 5.3 4.6 2.6
Capex/depreciation (x) 0.8 1.6 2.0 1.8 1.7 1.1
Net debt/equity (%) 14.0 11.6 1.3 -10.5 -16.0 -21.1
Net interest cover (x) nm 113.3 155.0 359.2 705.7 nm
Source: Company data, Deutsche Bank estimates
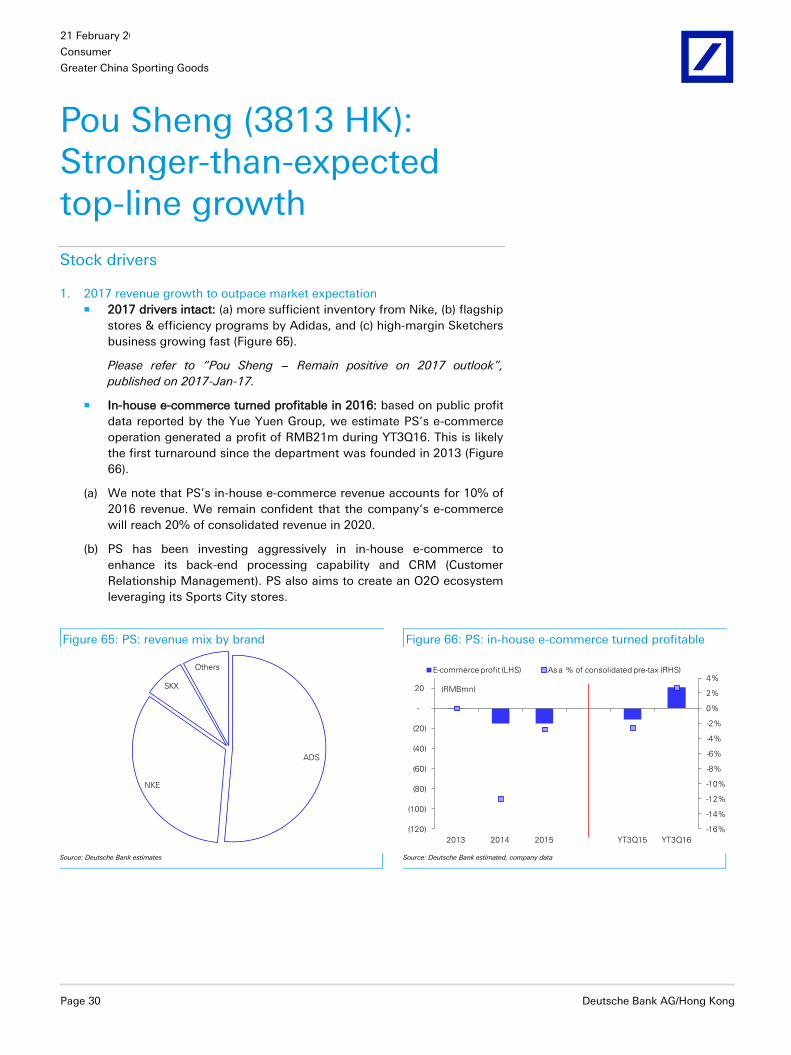
21 February 2017
Consumer
Greater China Sporting Goods
Page 30 Deutsche Bank AG/Hong Kong
Pou Sheng (3813 HK): Stronger-than-expected top-line growth
Stock drivers
1. 2017 revenue growth to outpace market expectation 2017 drivers intact: (a) more sufficient inventory from Nike, (b) flagship
stores & efficiency programs by Adidas, and (c) high-margin Sketchers
business growing fast (Figure 65).
Please refer to “Pou Sheng − Remain positive on 2017 outlook”,
published on 2017-Jan-17.
In-house e-commerce turned profitable in 2016: based on public profit
data reported by the Yue Yuen Group, we estimate PS’s e-commerce
operation generated a profit of RMB21m during YT3Q16. This is likely
the first turnaround since the department was founded in 2013 (Figure
66).
(a) We note that PS’s in-house e-commerce revenue accounts for 10% of
2016 revenue. We remain confident that the company‘s e-commerce
will reach 20% of consolidated revenue in 2020.
(b) PS has been investing aggressively in in-house e-commerce to
enhance its back-end processing capability and CRM (Customer
Relationship Management). PS also aims to create an O2O ecosystem
leveraging its Sports City stores.
Figure 65: PS: revenue mix by brand Figure 66: PS: in-house e-commerce turned profitable
ADS
NKE
SKX
Others
-16%
-14%
-12%
-10%
-8%
-6%
-4%
-2%
0%
2%
4%
(120)
(100)
(80)
(60)
(40)
(20)
-
20
2013 2014 2015 YT3Q15 YT3Q16
E-commerce profit (LHS) As a % of consolidated pre-tax (RHS)
(RMBmn)
Source: Deutsche Bank estimates
Source: Deutsche Bank estimated, company data

21 February 2017
Consumer
Greater China Sporting Goods
Deutsche Bank AG/Hong Kong Page 31
Monitor retail discount: one of the most important research focus
points for PS in 2017 is the level of the retail discount (given that both
PS and Belle Sportswear hold sufficient Nike products). Based on our
January channel observations, we see limited retail discounts ahead.
Our gross margin forecasts imply a normal retail discount level of c.
15%-off in 2016 and beyond.
Please refer to “China Sportswear − CNY channel observations”,
published on 2017-Feb-9.
2. Concerns about accounting mistreatment may soon ease We reiterate our view that PS will report minimum-to-none accounting
restatements when releasing the audit report in March. The potential
effects on future fundamentals from the incident are as follows:
(a) A debate surrounding resale business: PS may decide to close down
the resale business, which represents 5% of PS’s revenue. It will be
positive to PS’s in-house e-commerce business if it decides to close
the resale business, as this will effectively reduce the product supply
to selected competing e-commerce operators.
(b) No changes to corporate strategy: despite the rather heavy
management reshuffle, we expect PS to maintain its strategy. We note
that PS is pivotal to executing the 2020 strategies for both Nike and
Adidas.
Line of Thinking
Figure 68: PS’s share price Figure 69: PS’s consensus earnings revisions
0.0
0.5
1.0
1.5
2.0
2.5
3.0
Aug-14 Jan-15 Jun-15 Nov-15 Apr-16 Sep-16 Feb-17
Share price
Initiate
with Buy
0
20
40
60
80
100
120
140
160
180
50
70
90
110
130
150
Sep-15 Dec-15 Mar-16 Jun-16 Sep-16 Dec-16
2016 consensus earnings (LHS) 2017 consensus earnings (RHS)
Source: Deutsche Bank, Bloomberg Finance LP
Source: Deutsche Bank, Bloomberg Finance LP consensus
We initiated with Buy: we didn’t detect heavier-than-expected
promotions in November and the accounting misstatement incident.
But we believe the fundamental positives are still intact.
Please refer to “Pou Sheng − Remain positive on 2017 outlook”,
published on 2017-Jan-17.
Figure 67: Underlying retail discount
assumptions
0.0%
5.0%
10.0%
15.0%
20.0%
25.0%
2010 2012 2014 16E 18E 20E
Retail discount (%-off, implied by
gross margin)
Positive to
margins
Negative to
margins
Source: Deutsche Bank estimates, company data

21 February 2017
Consumer
Greater China Sporting Goods
Page 32 Deutsche Bank AG/Hong Kong
Earnings revisions and DBe vs. consensus
Figure 70: Earnings revisions: we forecast higher revenue growth but conservatively model more retail discount
2016E 2017E 2018E
(CNY mn) New Old Diff New Old Diff New Old Diff
Revenue 16,279 16,279 0% 19,445 18,782 4% 22,673 21,371 6%
Gross Profit 5,781 5,868 -1% 7,146 7,104 1% 8,332 8,117 3%
Op.Income 940 963 -2% 1,283 1,324 -3% 1,583 1,664 -5%
Recur.NP 761 778 -2% 1,044 1,076 -3% 1,262 1,321 -4%
Recur. EPS (HKD) 0.17 0.17 -2% 0.22 0.22 -3% 0.25 0.27 -4%
Gross Margin (%) 35.5% 36.0% -0.5% 36.7% 37.8% -1.1% 36.7% 38.0% -1.2%
Op. Margin (%) 5.8% 5.9% -0.1% 6.6% 7.0% -0.4% 7.0% 7.8% -0.8%
Recur. Net Margin (%) 4.7% 4.8% -0.1% 5.4% 5.7% -0.4% 5.6% 6.2% -0.6% Source: Deutsche Bank estimates note: use recurring earnings in revision for better comparison
Figure 71: DBe vs. consensus: we are more positive on 2017 and 2018
2016E 2017E 2018E
(USD mn) DBe Consensus Diff DBe Consensus Diff DBe Consensus Diff
Revenue 2,446 2,391 2.3% 2,723 2,574 5.8% 3,064 2,894 5.9%
Gross Profit 869 851 2.0% 1,001 934 7.1% 1,126 1,049 7.3%
Op.Income 141 143 -1.2% 180 185 -2.6% 214 220 -2.7%
Net Income 114 111 2.7% 146 135 8.6% 171 162 5.3%
EPS (USD) 0.02 0.02 2.7% 0.03 0.03 8.6% 0.03 0.03 5.3%
Gross Margin (%) 35.5% 35.6% -0.1% 36.7% 36.3% 0.4% 36.7% 36.3% 0.5%
Op. Margin (%) 5.8% 6.0% -0.2% 6.6% 7.2% -0.6% 7.0% 7.6% -0.6%
Net Margin (%) 4.7% 4.7% 0.0% 5.4% 5.2% 0.1% 5.6% 5.6% 0.0% Source: Deutsche Bank estimates, Bloomberg Finance LP Note: we use USD financials to better compare with consensus
Valuation, risks and financial summary
DCF-based target price maintained at HKD3.1
We use discounted cash flow (DCF) as our primary approach to value PS’s
shares. We adopt DCF methodology as we expect investors to focus more on
PS’s long-term value creation. In our DCF model, we derive a WACC of 10.18%
with a cost of equity of 10.34% (risk-free rate=3.9%, beta=1.15, market risk
premium=5.6%) and a cost of debt of 7.2%. We assume a long-term growth
rate of 2%, which is in line with Deutsche Bank’s Hong Kong and China
consumer discretionary coverage.

21 February 2017
Consumer
Greater China Sporting Goods
Deutsche Bank AG/Hong Kong Page 33
Figure 72: Discounted cash flow valuation – key assumptions
Share & Market Information Note
Valuation date 12 month forward
Current Stock Price 1.94
Issued Shares (million) 5,233 Weighted average shares
DCF Target Price 3.1
Implied Upside (Downside) 60%
Valuation metrics
FY16 PER (recurring) 18.0
FY17 PER (recurring) 14.3
FY16 PBR 2.4
FY17 PBR 2.1
Cost of Equity 10.34%
Risk Free Rate (%) 3.9% Deutsche Bank assumption for China
Beta 1.15 Bloomberg Finance LP 1-year beta
Market Risk Premium (%) 5.60% Deutsche Bank assumption for China
Cost of Debt (after tax) 7.20%
Cost of Debt 10.00% Company long-term borrowing rate
Tax Rate 28.00% Long-term tax rate
Target Debt / (Debt + Equity) 5%
WACC 10.18%
DCF Model LT growth 2.0% In line with Deutsche Bank consumer discretionary coverage space
Source: Deutsche Bank estimates, Company data, Bloomberg Finance LP
Figure 73: DCF sales, margin assumptions and sensitivity Figure 74: Free cash flow to equity profile
Two-stage DCF:
1. FCF forecasts from model 2018-2020
2. Explicit forecast period 2021-2030
2018~2021 2022~2025 2026~2030 2018~2030
Revenue CAGR: 19.0% 8.8% 4.2% 8.5%
Average EBIT margin: 7.3% 7.2% 6.3% 6.9%
FCF CAGR: 186.6% 11.7% 2.4% 33.1%
-130%
-110%
-90%
-70%
-50%
-30%
-10%
10%
30%
50%
(1,500)
(1,000)
(500)
-
500
1,000
1,500
2,000
2012 2015 2018 2021 2024 2027 2030
Free Cashflow to Equity (LHS)
YoY (RHS)(RMBmn)
Source: Deutsche Bank estimates
Source: Deutsche Bank estimates, Note: representing free cash flow for equity (in line with Deutsche Bank RTN)
DCF-based target price supported by PER valuation
Our DCF-based target price suggests 14x 2017E PER, in line with PS’s one-
year mean plus one standard deviation (15x). The target multiple is not
changed.
3 11.2% 10.7% 10.2% 9.7% 9.2%
0.00% 2.5 2.7 2.8 3.0 3.2
1.00% 2.6 2.8 3.0 3.2 3.4
2.00% 2.7 2.9 3.1 3.3 3.6
3.00% 2.9 3.1 3.3 3.6 3.9
4.00% 3.0 3.3 3.6 3.9 4.3
WACC
Terminal
Growth
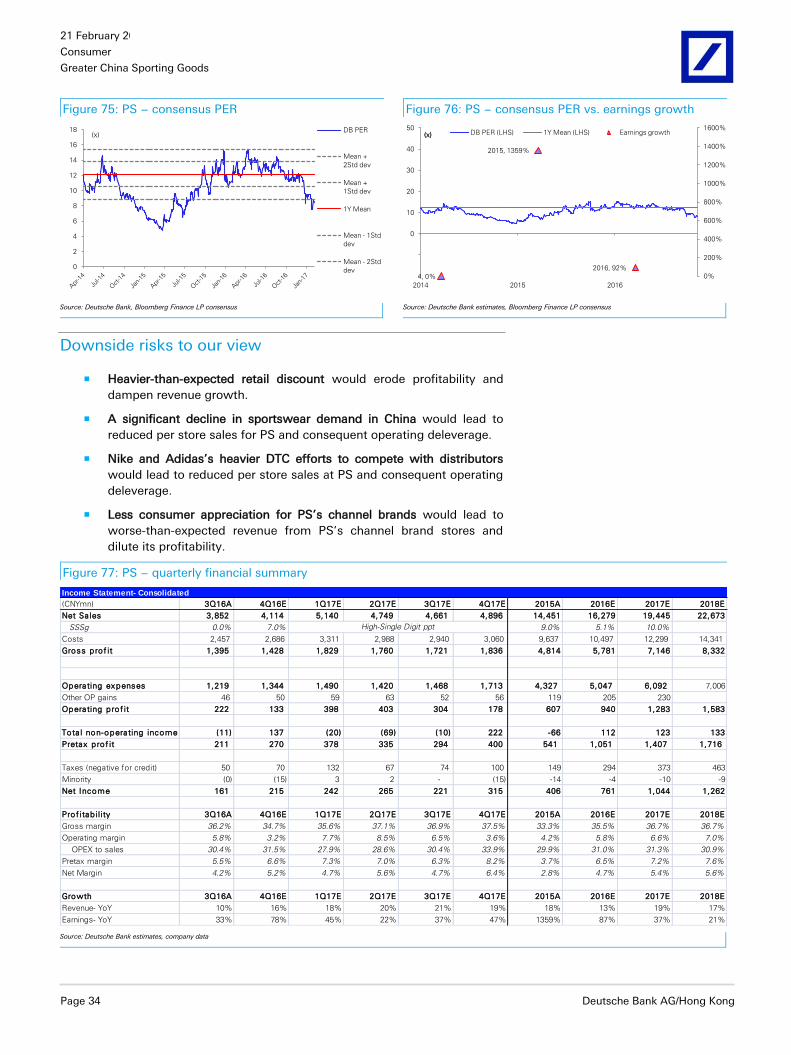
21 February 2017
Consumer
Greater China Sporting Goods
Page 34 Deutsche Bank AG/Hong Kong
Figure 75: PS − consensus PER Figure 76: PS − consensus PER vs. earnings growth
0
2
4
6
8
10
12
14
16
18 DB PER
Mean +
2Std dev
Mean +
1Std dev
1Y Mean
Mean - 1Std
dev
Mean - 2Std
dev
(x)
2014, 0%
2015, 1359%
2016, 92%
0%
200%
400%
600%
800%
1000%
1200%
1400%
1600%
-20
-10
0
10
20
30
40
50
2014 2015 2016
DB PER (LHS) 1Y Mean (LHS) Earnings growth(x)(x)
Source: Deutsche Bank, Bloomberg Finance LP consensus
Source: Deutsche Bank estimates, Bloomberg Finance LP consensus
Downside risks to our view
Heavier-than-expected retail discount would erode profitability and
dampen revenue growth.
A significant decline in sportswear demand in China would lead to
reduced per store sales for PS and consequent operating deleverage.
Nike and Adidas’s heavier DTC efforts to compete with distributors
would lead to reduced per store sales at PS and consequent operating
deleverage.
Less consumer appreciation for PS’s channel brands would lead to
worse-than-expected revenue from PS’s channel brand stores and
dilute its profitability.
Figure 77: PS − quarterly financial summary
Income Statement- Consolidated
(CNYmn) 3Q16A 4Q16E 1Q17E 2Q17E 3Q17E 4Q17E 2015A 2016E 2017E 2018E
Net Sa les 3,852 4,114 5,140 4,749 4,661 4,896 14,451 16,279 19,445 22,673
SSSg 0.0% 7.0% 9.0% 5.1% 10.0%
Costs 2,457 2,686 3,311 2,988 2,940 3,060 9,637 10,497 12,299 14,341
Gross prof it 1,395 1,428 1,829 1,760 1,721 1,836 4,814 5,781 7,146 8,332
Operating expenses 1,219 1,344 1,490 1,420 1,468 1,713 4,327 5,047 6,092 7,006
Other OP gains 46 50 59 63 52 56 119 205 230
Operating prof it 222 133 398 403 304 178 607 940 1,283 1,583
Tota l non-operating income (11) 137 (20) (69) (10) 222 -66 112 123 133
Pretax prof it 211 270 378 335 294 400 541 1,051 1,407 1,716
Taxes (negative for credit) 50 70 132 67 74 100 149 294 373 463
Minority (0) (15) 3 2 - (15) -14 -4 -10 -9
Net Income 161 215 242 265 221 315 406 761 1,044 1,262
Prof itab il ity 3Q16A 4Q16E 1Q17E 2Q17E 3Q17E 4Q17E 2015A 2016E 2017E 2018E
Gross margin 36.2% 34.7% 35.6% 37.1% 36.9% 37.5% 33.3% 35.5% 36.7% 36.7%
Operating margin 5.8% 3.2% 7.7% 8.5% 6.5% 3.6% 4.2% 5.8% 6.6% 7.0%
OPEX to sales 30.4% 31.5% 27.9% 28.6% 30.4% 33.9% 29.9% 31.0% 31.3% 30.9%
Pretax margin 5.5% 6.6% 7.3% 7.0% 6.3% 8.2% 3.7% 6.5% 7.2% 7.6%
Net Margin 4.2% 5.2% 4.7% 5.6% 4.7% 6.4% 2.8% 4.7% 5.4% 5.6%
Growth 3Q16A 4Q16E 1Q17E 2Q17E 3Q17E 4Q17E 2015A 2016E 2017E 2018E
Revenue- YoY 10% 16% 18% 20% 21% 19% 18% 13% 19% 17%
Earnings- YoY 33% 78% 45% 22% 37% 47% 1359% 87% 37% 21%
High-Single Digit ppt
Source: Deutsche Bank estimates, company data
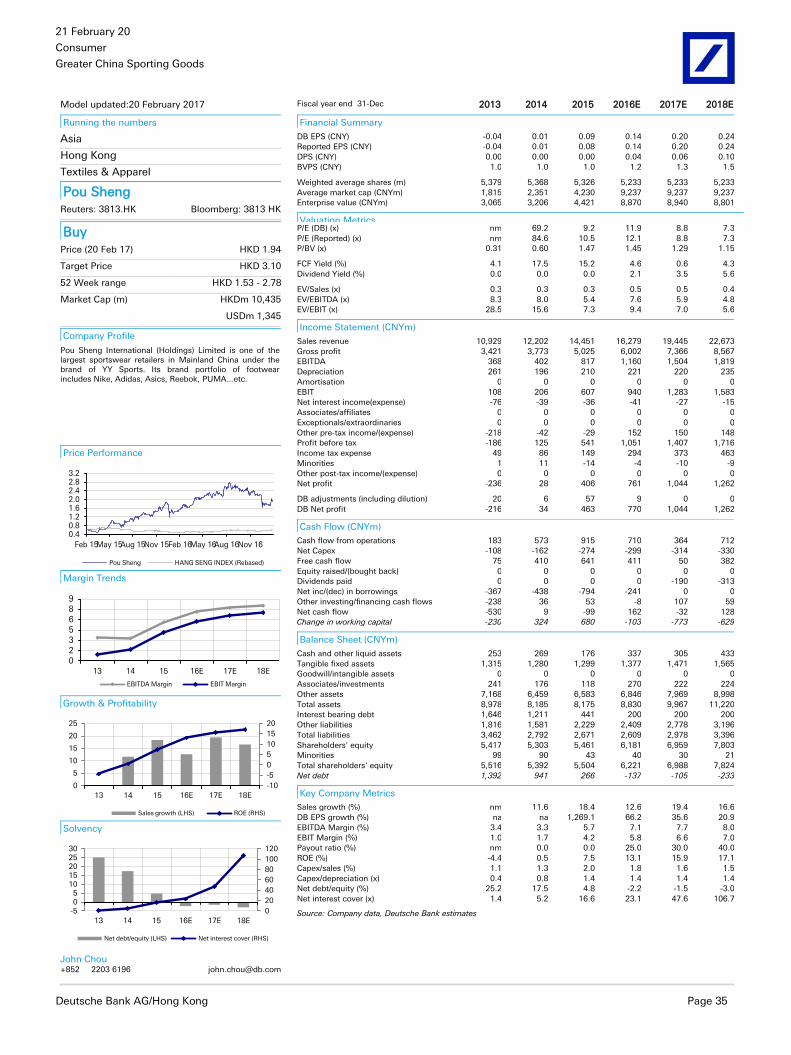
21 February 2017
Consumer
Greater China Sporting Goods
Deutsche Bank AG/Hong Kong Page 35
Model updated:20 February 2017
Running the numbers
Asia
Hong Kong
Textiles & Apparel
Pou Sheng Reuters: 3813.HK Bloomberg: 3813 HK
Buy Price (20 Feb 17) HKD 1.94
Target Price HKD 3.10
52 Week range HKD 1.53 - 2.78
Market Cap (m) HKDm 10,435
USDm 1,345
Company Profile
Pou Sheng International (Holdings) Limited is one of the largest sportswear retailers in Mainland China under the brand of YY Sports. Its brand portfolio of footwear includes Nike, Adidas, Asics, Reebok, PUMA...etc.
Price Performance
0.40.81.21.62.02.42.83.2
Feb 15May 15Aug 15Nov 15Feb 16May 16Aug 16Nov 16
Pou Sheng HANG SENG INDEX (Rebased)
Margin Trends
0235689
13 14 15 16E 17E 18E
EBITDA Margin EBIT Margin
Growth & Profitability
-10
-5
0
5
10
15
20
0
5
10
15
20
25
13 14 15 16E 17E 18E
Sales growth (LHS) ROE (RHS)
Solvency
0
20
40
60
80
100
120
-505
1015202530
13 14 15 16E 17E 18E
Net debt/equity (LHS) Net interest cover (RHS)
John Chou
+852 2203 6196 [email protected]
Fiscal year end 31-Dec 2013 2014 2015 2016E 2017E 2018E
Financial Summary
DB EPS (CNY) -0.04 0.01 0.09 0.14 0.20 0.24
Reported EPS (CNY) -0.04 0.01 0.08 0.14 0.20 0.24
DPS (CNY) 0.00 0.00 0.00 0.04 0.06 0.10
BVPS (CNY) 1.0 1.0 1.0 1.2 1.3 1.5
Weighted average shares (m) 5,379 5,368 5,326 5,233 5,233 5,233
Average market cap (CNYm) 1,815 2,351 4,230 9,237 9,237 9,237
Enterprise value (CNYm) 3,065 3,206 4,421 8,870 8,940 8,801
Valuation Metrics P/E (DB) (x) nm 69.2 9.2 11.9 8.8 7.3
P/E (Reported) (x) nm 84.6 10.5 12.1 8.8 7.3
P/BV (x) 0.31 0.60 1.47 1.45 1.29 1.15
FCF Yield (%) 4.1 17.5 15.2 4.6 0.6 4.3
Dividend Yield (%) 0.0 0.0 0.0 2.1 3.5 5.6
EV/Sales (x) 0.3 0.3 0.3 0.5 0.5 0.4
EV/EBITDA (x) 8.3 8.0 5.4 7.6 5.9 4.8
EV/EBIT (x) 28.5 15.6 7.3 9.4 7.0 5.6
Income Statement (CNYm)
Sales revenue 10,929 12,202 14,451 16,279 19,445 22,673
Gross profit 3,421 3,773 5,025 6,002 7,366 8,567
EBITDA 368 402 817 1,160 1,504 1,819
Depreciation 261 196 210 221 220 235
Amortisation 0 0 0 0 0 0
EBIT 108 206 607 940 1,283 1,583
Net interest income(expense) -76 -39 -36 -41 -27 -15
Associates/affiliates 0 0 0 0 0 0
Exceptionals/extraordinaries 0 0 0 0 0 0
Other pre-tax income/(expense) -218 -42 -29 152 150 148
Profit before tax -186 125 541 1,051 1,407 1,716
Income tax expense 49 86 149 294 373 463
Minorities 1 11 -14 -4 -10 -9
Other post-tax income/(expense) 0 0 0 0 0 0
Net profit -236 28 406 761 1,044 1,262
DB adjustments (including dilution) 20 6 57 9 0 0
DB Net profit -216 34 463 770 1,044 1,262
Cash Flow (CNYm)
Cash flow from operations 183 573 915 710 364 712
Net Capex -108 -162 -274 -299 -314 -330
Free cash flow 75 410 641 411 50 382
Equity raised/(bought back) 0 0 0 0 0 0
Dividends paid 0 0 0 0 -190 -313
Net inc/(dec) in borrowings -367 -438 -794 -241 0 0
Other investing/financing cash flows -238 36 53 -8 107 59
Net cash flow -530 9 -99 162 -32 128
Change in working capital -230 324 680 -103 -773 -629
Balance Sheet (CNYm)
Cash and other liquid assets 253 269 176 337 305 433
Tangible fixed assets 1,315 1,280 1,299 1,377 1,471 1,565
Goodwill/intangible assets 0 0 0 0 0 0
Associates/investments 241 176 118 270 222 224
Other assets 7,168 6,459 6,583 6,846 7,969 8,998
Total assets 8,978 8,185 8,175 8,830 9,967 11,220
Interest bearing debt 1,646 1,211 441 200 200 200
Other liabilities 1,816 1,581 2,229 2,409 2,778 3,196
Total liabilities 3,462 2,792 2,671 2,609 2,978 3,396
Shareholders' equity 5,417 5,303 5,461 6,181 6,959 7,803
Minorities 99 90 43 40 30 21
Total shareholders' equity 5,516 5,392 5,504 6,221 6,988 7,824
Net debt 1,392 941 266 -137 -105 -233
Key Company Metrics
Sales growth (%) nm 11.6 18.4 12.6 19.4 16.6
DB EPS growth (%) na na 1,269.1 66.2 35.6 20.9
EBITDA Margin (%) 3.4 3.3 5.7 7.1 7.7 8.0
EBIT Margin (%) 1.0 1.7 4.2 5.8 6.6 7.0
Payout ratio (%) nm 0.0 0.0 25.0 30.0 40.0
ROE (%) -4.4 0.5 7.5 13.1 15.9 17.1
Capex/sales (%) 1.1 1.3 2.0 1.8 1.6 1.5
Capex/depreciation (x) 0.4 0.8 1.4 1.4 1.4 1.4
Net debt/equity (%) 25.2 17.5 4.8 -2.2 -1.5 -3.0
Net interest cover (x) 1.4 5.2 16.6 23.1 47.6 106.7
Source: Company data, Deutsche Bank estimates
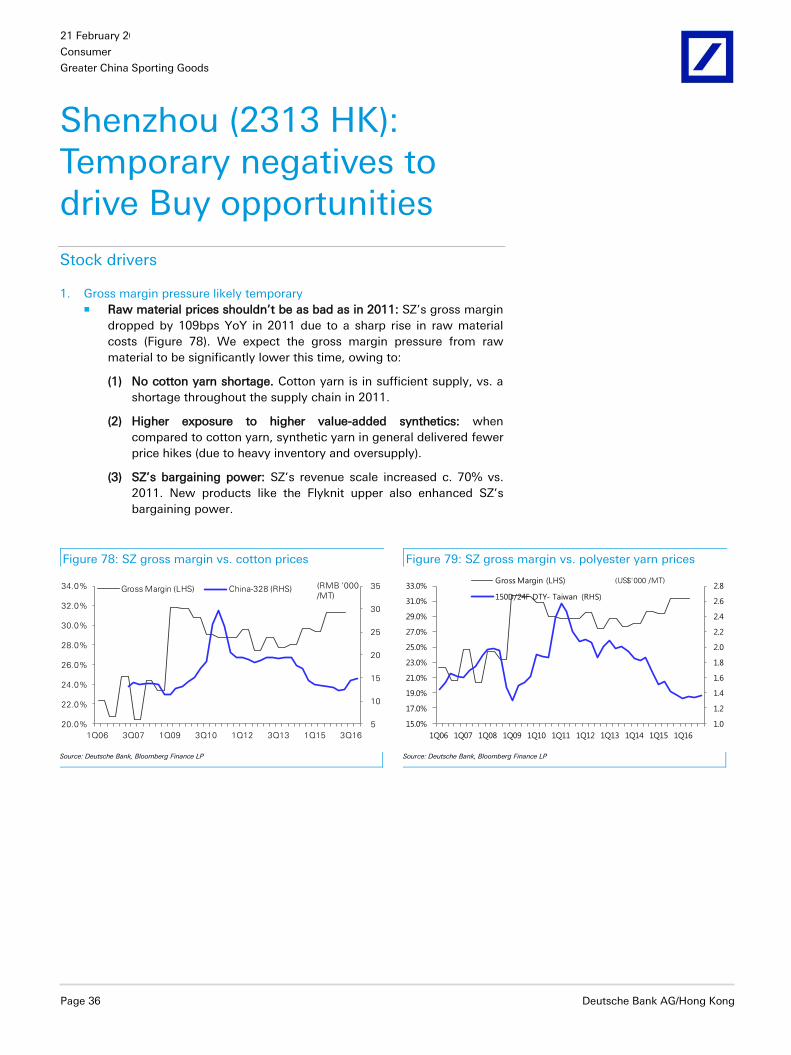
21 February 2017
Consumer
Greater China Sporting Goods
Page 36 Deutsche Bank AG/Hong Kong
Shenzhou (2313 HK): Temporary negatives to drive Buy opportunities
Stock drivers
1. Gross margin pressure likely temporary Raw material prices shouldn’t be as bad as in 2011: SZ’s gross margin
dropped by 109bps YoY in 2011 due to a sharp rise in raw material
costs (Figure 78). We expect the gross margin pressure from raw
material to be significantly lower this time, owing to:
(1) No cotton yarn shortage. Cotton yarn is in sufficient supply, vs. a
shortage throughout the supply chain in 2011.
(2) Higher exposure to higher value-added synthetics: when
compared to cotton yarn, synthetic yarn in general delivered fewer
price hikes (due to heavy inventory and oversupply).
(3) SZ’s bargaining power: SZ’s revenue scale increased c. 70% vs.
2011. New products like the Flyknit upper also enhanced SZ’s
bargaining power.
Figure 78: SZ gross margin vs. cotton prices Figure 79: SZ gross margin vs. polyester yarn prices
5
10
15
20
25
30
35
20.0%
22.0%
24.0%
26.0%
28.0%
30.0%
32.0%
34.0%
1Q06 3Q07 1Q09 3Q10 1Q12 3Q13 1Q15 3Q16
Gross Margin (LHS) China-328 (RHS) (RMB '000
/MT)
1.0
1.2
1.4
1.6
1.8
2.0
2.2
2.4
2.6
2.8
15.0%
17.0%
19.0%
21.0%
23.0%
25.0%
27.0%
29.0%
31.0%
33.0%
1Q06 1Q07 1Q08 1Q09 1Q10 1Q11 1Q12 1Q13 1Q14 1Q15 1Q16
Gross Margin (LHS)
150D/24F DTY- Taiwan (RHS)
(US$'000 /MT)
Source: Deutsche Bank, Bloomberg Finance LP
Source: Deutsche Bank, Bloomberg Finance LP
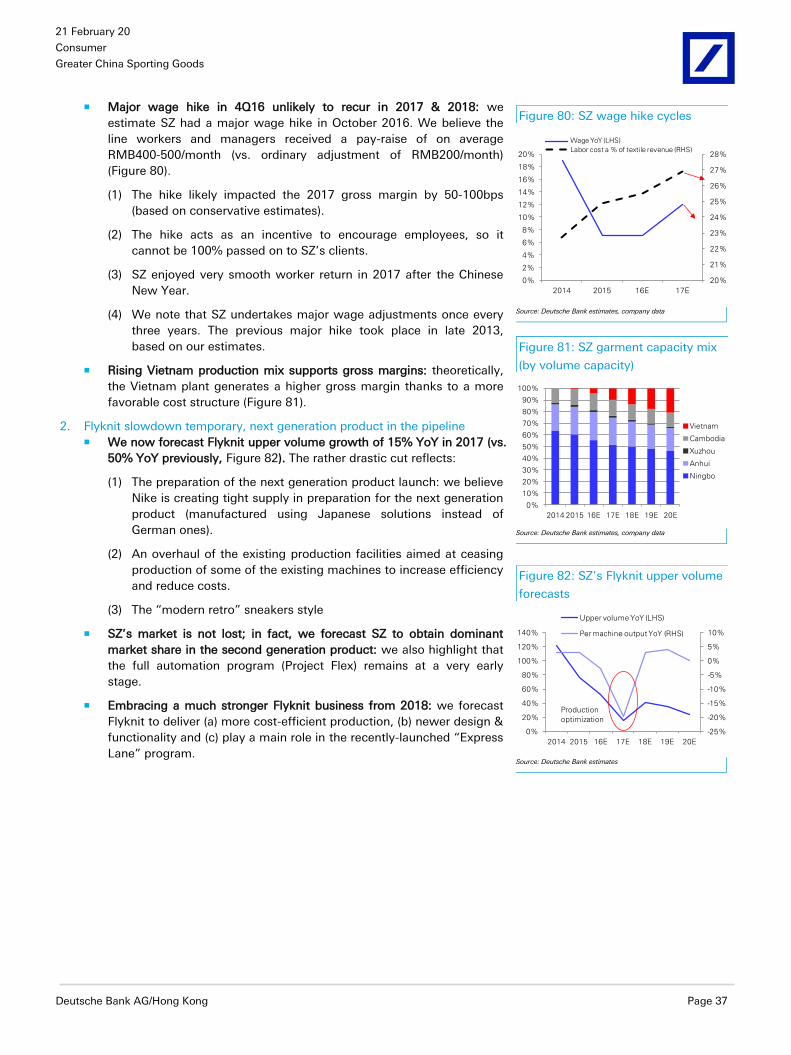
21 February 2017
Consumer
Greater China Sporting Goods
Deutsche Bank AG/Hong Kong Page 37
Major wage hike in 4Q16 unlikely to recur in 2017 & 2018: we
estimate SZ had a major wage hike in October 2016. We believe the
line workers and managers received a pay-raise of on average
RMB400-500/month (vs. ordinary adjustment of RMB200/month)
(Figure 80).
(1) The hike likely impacted the 2017 gross margin by 50-100bps
(based on conservative estimates).
(2) The hike acts as an incentive to encourage employees, so it
cannot be 100% passed on to SZ’s clients.
(3) SZ enjoyed very smooth worker return in 2017 after the Chinese
New Year.
(4) We note that SZ undertakes major wage adjustments once every
three years. The previous major hike took place in late 2013,
based on our estimates.
Rising Vietnam production mix supports gross margins: theoretically,
the Vietnam plant generates a higher gross margin thanks to a more
favorable cost structure (Figure 81).
2. Flyknit slowdown temporary, next generation product in the pipeline We now forecast Flyknit upper volume growth of 15% YoY in 2017 (vs.
50% YoY previously, Figure 82). The rather drastic cut reflects:
(1) The preparation of the next generation product launch: we believe
Nike is creating tight supply in preparation for the next generation
product (manufactured using Japanese solutions instead of
German ones).
(2) An overhaul of the existing production facilities aimed at ceasing
production of some of the existing machines to increase efficiency
and reduce costs.
(3) The “modern retro” sneakers style
SZ’s market is not lost; in fact, we forecast SZ to obtain dominant
market share in the second generation product: we also highlight that
the full automation program (Project Flex) remains at a very early
stage.
Embracing a much stronger Flyknit business from 2018: we forecast
Flyknit to deliver (a) more cost-efficient production, (b) newer design &
functionality and (c) play a main role in the recently-launched “Express
Lane” program.
Figure 80: SZ wage hike cycles
20%
21%
22%
23%
24%
25%
26%
27%
28%
0%
2%
4%
6%
8%
10%
12%
14%
16%
18%
20%
2014 2015 16E 17E
Wage YoY (LHS)
Labor cost a % of textile revenue (RHS)
Source: Deutsche Bank estimates, company data
Figure 81: SZ garment capacity mix
(by volume capacity)
0%
10%
20%
30%
40%
50%
60%
70%
80%
90%
100%
2014 2015 16E 17E 18E 19E 20E
Vietnam
Cambodia
Xuzhou
Anhui
Ningbo
Source: Deutsche Bank estimates, company data
Figure 82: SZ’s Flyknit upper volume
forecasts
-25%
-20%
-15%
-10%
-5%
0%
5%
10%
0%
20%
40%
60%
80%
100%
120%
140%
2014 2015 16E 17E 18E 19E 20E
Upper volume YoY (LHS)
Per machine output YoY (RHS)
Production
optimization
Source: Deutsche Bank estimates
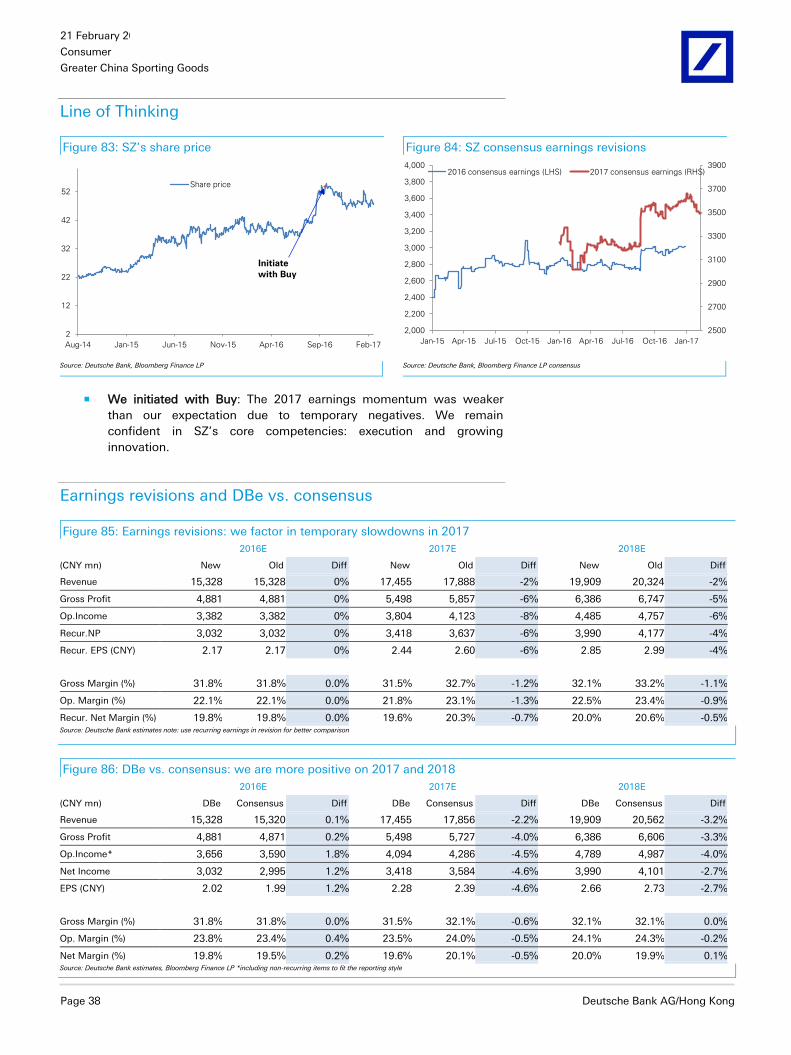
21 February 2017
Consumer
Greater China Sporting Goods
Page 38 Deutsche Bank AG/Hong Kong
Line of Thinking
Figure 83: SZ’s share price Figure 84: SZ consensus earnings revisions
2
12
22
32
42
52
Aug-14 Jan-15 Jun-15 Nov-15 Apr-16 Sep-16 Feb-17
Share price
Initiate
with Buy
2500
2700
2900
3100
3300
3500
3700
3900
2,000
2,200
2,400
2,600
2,800
3,000
3,200
3,400
3,600
3,800
4,000
Jan-15 Apr-15 Jul-15 Oct-15 Jan-16 Apr-16 Jul-16 Oct-16 Jan-17
2016 consensus earnings (LHS) 2017 consensus earnings (RHS)
Source: Deutsche Bank, Bloomberg Finance LP
Source: Deutsche Bank, Bloomberg Finance LP consensus
We initiated with Buy: The 2017 earnings momentum was weaker
than our expectation due to temporary negatives. We remain
confident in SZ’s core competencies: execution and growing
innovation.
Earnings revisions and DBe vs. consensus
Figure 85: Earnings revisions: we factor in temporary slowdowns in 2017
2016E 2017E 2018E
(CNY mn) New Old Diff New Old Diff New Old Diff
Revenue 15,328 15,328 0% 17,455 17,888 -2% 19,909 20,324 -2%
Gross Profit 4,881 4,881 0% 5,498 5,857 -6% 6,386 6,747 -5%
Op.Income 3,382 3,382 0% 3,804 4,123 -8% 4,485 4,757 -6%
Recur.NP 3,032 3,032 0% 3,418 3,637 -6% 3,990 4,177 -4%
Recur. EPS (CNY) 2.17 2.17 0% 2.44 2.60 -6% 2.85 2.99 -4%
Gross Margin (%) 31.8% 31.8% 0.0% 31.5% 32.7% -1.2% 32.1% 33.2% -1.1%
Op. Margin (%) 22.1% 22.1% 0.0% 21.8% 23.1% -1.3% 22.5% 23.4% -0.9%
Recur. Net Margin (%) 19.8% 19.8% 0.0% 19.6% 20.3% -0.7% 20.0% 20.6% -0.5% Source: Deutsche Bank estimates note: use recurring earnings in revision for better comparison
Figure 86: DBe vs. consensus: we are more positive on 2017 and 2018
2016E 2017E 2018E
(CNY mn) DBe Consensus Diff DBe Consensus Diff DBe Consensus Diff
Revenue 15,328 15,320 0.1% 17,455 17,856 -2.2% 19,909 20,562 -3.2%
Gross Profit 4,881 4,871 0.2% 5,498 5,727 -4.0% 6,386 6,606 -3.3%
Op.Income* 3,656 3,590 1.8% 4,094 4,286 -4.5% 4,789 4,987 -4.0%
Net Income 3,032 2,995 1.2% 3,418 3,584 -4.6% 3,990 4,101 -2.7%
EPS (CNY) 2.02 1.99 1.2% 2.28 2.39 -4.6% 2.66 2.73 -2.7%
Gross Margin (%) 31.8% 31.8% 0.0% 31.5% 32.1% -0.6% 32.1% 32.1% 0.0%
Op. Margin (%) 23.8% 23.4% 0.4% 23.5% 24.0% -0.5% 24.1% 24.3% -0.2%
Net Margin (%) 19.8% 19.5% 0.2% 19.6% 20.1% -0.5% 20.0% 19.9% 0.1% Source: Deutsche Bank estimates, Bloomberg Finance LP *including non-recurring items to fit the reporting style

21 February 2017
Consumer
Greater China Sporting Goods
Deutsche Bank AG/Hong Kong Page 39
Valuation, risks and financial summary
DCF-based target price of HKD56
We cut our DCF-based target price by 10% to HKD56, mainly to reflect
downward earnings revisions. We use discounted cash flow (DCF) as our
primary approach to value SZ’s shares. We adopt DCF methodology as we
expect investors to focus more on SZ’s long-term value creation. In our DCF
model, we derive a WACC of 8.35% with a cost of equity of 8.94% (risk-free
rate=3.9%, beta=0.9, market risk premium=5.6%) and a cost of debt of 4.0%.
We assume a long-term growth rate of 2%, which is in line with DB’s Hong
Kong and China consumer discretionary coverage.
Figure 87: Discounted cash flow valuation – Key assumptions
Share & Market Information Note
Valuation date 12 month forward
Current Stock Price 47.7
Issued Shares (million) 1,399 Weighted average shares
DCF Target Price 56
Implied Upside (Downside) 17%
Valuation metrics
FY16 PER (recurring) 22.1
FY17 PER (recurring) 21.3
FY16 PBR 5.5
FY17 PBR 5.1
Cost of Equity 8.94%
Risk Free Rate (%) 3.90% Deutsche Bank assumption for China
Beta 0.9 Bloomberg 1-year beta
Market Risk Premium (%) 5.60% Deutsche Bank assumption for China
Cost of Debt (after tax) 4.00%
Cost of Debt 5.00% Company long-term borrowing rate
Tax Rate 20.00% Long-term tax rate
Target Debt / (Debt + Equity) 12%
WACC 8.35%
DCF long-term growth 2.0% In-line with DB consumer discretionary coverage space
Source: Deutsche Bank estimates, company data

21 February 2017
Consumer
Greater China Sporting Goods
Page 40 Deutsche Bank AG/Hong Kong
Figure 88: DCF sales, margin assumptions and sensitivity Figure 89: Free cash flow to equity profile
Two-stage DCF:
1. FCF forecasts from model 2018-2020
2. Explicit forecast period 2021-2030
2018~2021 2022~2025 2026~2030 2018~2030
Revenue CAGR: 15.9% 7.6% 5.1% 7.9%
Average EBIT margin: 23.2% 23.2% 22.2% 22.8%
FCF CAGR: 40.2% 6.6% 3.9% 11.9%
-90%
-70%
-50%
-30%
-10%
10%
30%
50%
-
1,000
2,000
3,000
4,000
5,000
6,000
7,000
2012 2015 2018 2021 2024 2027 2030
Free Cashflow to Equity (LHS)
YoY (RHS)(RMBmn)
Source: Deutsche Bank estimates
Source: Deutsche Bank estimates, Note: representing free cash flow for equity (in line with Deutsche Bank RTN)
DCF-based target price supported by PER valuation
Our DCF-based target price suggests 21x 2017E PER, in line with SZ’s one-
year mean plus one standard deviation (21x). The target multiple is not
changed.
Figure 90: SZ consensus PER Figure 91: SZ consensus PER vs. earnings growth
0
5
10
15
20
25
2007 2008 2009 2010 2011 2012 2013 2014 2015 2016 2017
DB PER
Mean +
2Std dev
Mean +
1Std dev
2Y Mean
Mean - 1Std
dev
Mean - 2Std
dev
(x)
2010, 2%
2011, 34%
2012, -5%
2013, 11%
2014, 15% 2015, 14%
2016, 29%
-10%
0%
10%
20%
30%
40%
50%
-20
-10
0
10
20
30
40
50
2010 2011 2012 2013 2014 2015 2016 2017
DB PER (LHS) 2Y Mean (LHS) Earnings growth(x)(x)
Source: Deutsche Bank, Bloomberg Finance LP consensus
Source: Deutsche Bank estimates, Bloomberg Finance LP consensus
Downside risks to our view
Significant competition would lead to price erosion and operating
deleverage.
Heavy volatility in raw material prices would lead to greater volatility in
SZ’s gross margin and affect its clients’ ability to place orders
smoothly.
A yield rate issue with new textile capacity would affect SZ’s
profitability and may lead to order loss.
Sharp reduction in Flyknit demand would affect SZ’s growth
momentum and lead to operating deleverage.
56 9.3% 8.8% 8.3% 7.8% 7.3%
0.00% 43 45 49 52 57
1.00% 45 48 52 56 61
2.00% 48 52 56 61 68
3.00% 51 56 62 69 77
4.00% 57 63 70 80 92
WACC
Terminal
Growth
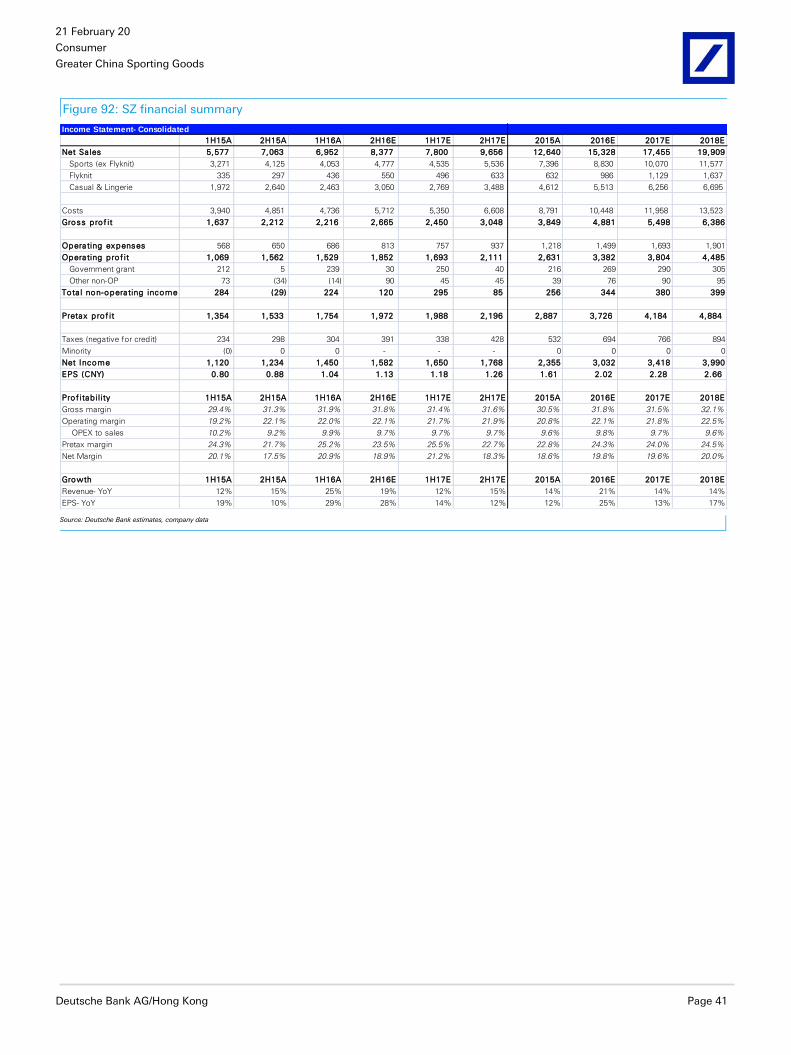
21 February 2017
Consumer
Greater China Sporting Goods
Deutsche Bank AG/Hong Kong Page 41
Figure 92: SZ financial summary
Income Statement- Consolidated
1H15A 2H15A 1H16A 2H16E 1H17E 2H17E 2015A 2016E 2017E 2018E
Net Sa les 5,577 7,063 6,952 8,377 7,800 9,656 12,640 15,328 17,455 19,909
Sports (ex Flyknit) 3,271 4,125 4,053 4,777 4,535 5,536 7,396 8,830 10,070 11,577
Flyknit 335 297 436 550 496 633 632 986 1,129 1,637
Casual & Lingerie 1,972 2,640 2,463 3,050 2,769 3,488 4,612 5,513 6,256 6,695
Costs 3,940 4,851 4,736 5,712 5,350 6,608 8,791 10,448 11,958 13,523
Gross prof it 1,637 2,212 2,216 2,665 2,450 3,048 3,849 4,881 5,498 6,386
Operating expenses 568 650 686 813 757 937 1,218 1,499 1,693 1,901
Operating prof it 1,069 1,562 1,529 1,852 1,693 2,111 2,631 3,382 3,804 4,485
Government grant 212 5 239 30 250 40 216 269 290 305
Other non-OP 73 (34) (14) 90 45 45 39 76 90 95
Tota l non-operating income 284 (29) 224 120 295 85 256 344 380 399
Pretax prof it 1,354 1,533 1,754 1,972 1,988 2,196 2,887 3,726 4,184 4,884
Taxes (negative for credit) 234 298 304 391 338 428 532 694 766 894
Minority (0) 0 0 - - - 0 0 0 0
Net Income 1,120 1,234 1,450 1,582 1,650 1,768 2,355 3,032 3,418 3,990
EPS (CNY) 0.80 0.88 1.04 1.13 1.18 1.26 1.61 2.02 2.28 2.66
Prof itab il ity 1H15A 2H15A 1H16A 2H16E 1H17E 2H17E 2015A 2016E 2017E 2018E
Gross margin 29.4% 31.3% 31.9% 31.8% 31.4% 31.6% 30.5% 31.8% 31.5% 32.1%
Operating margin 19.2% 22.1% 22.0% 22.1% 21.7% 21.9% 20.8% 22.1% 21.8% 22.5%
OPEX to sales 10.2% 9.2% 9.9% 9.7% 9.7% 9.7% 9.6% 9.8% 9.7% 9.6%
Pretax margin 24.3% 21.7% 25.2% 23.5% 25.5% 22.7% 22.8% 24.3% 24.0% 24.5%
Net Margin 20.1% 17.5% 20.9% 18.9% 21.2% 18.3% 18.6% 19.8% 19.6% 20.0%
Growth 1H15A 2H15A 1H16A 2H16E 1H17E 2H17E 2015A 2016E 2017E 2018E
Revenue- YoY 12% 15% 25% 19% 12% 15% 14% 21% 14% 14%
EPS- YoY 19% 10% 29% 28% 14% 12% 12% 25% 13% 17% Source: Deutsche Bank estimates, company data

21 February 2017
Consumer
Greater China Sporting Goods
Page 42 Deutsche Bank AG/Hong Kong
Model updated:20 February 2017
Running the numbers
Asia
China
Textiles & Apparel
Shenzhou Reuters: 2313.HK Bloomberg: 2313 HK
Buy Price (20 Feb 17) HKD 47.70
Target Price HKD 56.00
52 Week range HKD 35.69 - 55.05
Market Cap (m) HKDm 66,732
USDm 8,598
Company Profile
Shenzhou International Group Holdings Limited is the largest vertically integrated manufacturer of knitwear and the largest exporter in China. The company engages in manufacturing, processing, and selling knitwear products on an OEM basis. Shenzhou focuses on producing sports product, casual wear and lingerie wear.
Price Performance
20
30
40
50
60
Feb 15May 15Aug 15Nov 15Feb 16May 16Aug 16Nov 16
Shenzhou HANG SENG INDEX (Rebased)
Margin Trends
20
21
23
24
26
27
13 14 15 16E 17E 18E
EBITDA Margin EBIT Margin
Growth & Profitability
0
5
10
15
20
25
30
0
5
10
15
20
25
13 14 15 16E 17E 18E
Sales growth (LHS) ROE (RHS)
Solvency
-30
-20
-10
0
10
20
13 14 15 16E 17E 18E
Net debt/equity (LHS) Net interest cover (RHS)
John Chou
+852 2203 6196 [email protected]
Fiscal year end 31-Dec 2013 2014 2015 2016E 2017E 2018E
Financial Summary
DB EPS (CNY) 1.35 1.45 1.61 2.02 2.28 2.66
Reported EPS (CNY) 1.32 1.45 1.57 2.02 2.28 2.66
DPS (CNY) 0.95 1.35 1.42 1.39 1.44 1.65
BVPS (CNY) 7.7 8.4 9.3 10.2 11.0 12.2
Weighted average shares (m) 1,347 1,399 1,399 1,399 1,399 1,399
Average market cap (CNYm) 22,985 26,980 39,678 59,072 59,072 59,072
Enterprise value (CNYm) 20,160 24,460 37,733 57,860 58,067 57,650
Valuation Metrics P/E (DB) (x) 12.7 13.3 17.6 20.9 18.5 15.9
P/E (Reported) (x) 12.9 13.3 18.1 20.9 18.5 15.9
P/BV (x) 2.77 2.28 3.76 4.14 3.83 3.46
FCF Yield (%) 4.0 2.9 0.6 1.5 3.1 4.2
Dividend Yield (%) 5.6 7.0 5.0 3.3 3.4 3.9
EV/Sales (x) 2.0 2.2 3.0 3.8 3.3 2.9
EV/EBITDA (x) 8.5 9.3 12.0 14.5 13.1 11.2
EV/EBIT (x) 10.2 11.2 14.3 17.1 15.3 12.9
Income Statement (CNYm)
Sales revenue 10,047 11,132 12,640 15,328 17,455 19,909
Gross profit 3,246 3,669 4,371 5,481 6,122 7,068
EBITDA 2,384 2,628 3,154 3,983 4,429 5,167
Depreciation 407 443 522 601 624 683
Amortisation 0 0 0 0 0 0
EBIT 1,978 2,186 2,631 3,382 3,804 4,485
Net interest income(expense) 23 79 124 70 90 95
Associates/affiliates 0 0 0 0 0 0
Exceptionals/extraordinaries 0 0 0 0 0 0
Other pre-tax income/(expense) 200 279 132 274 290 305
Profit before tax 2,201 2,543 2,887 3,726 4,184 4,884
Income tax expense 397 477 532 694 766 894
Minorities 1 1 0 0 0 0
Other post-tax income/(expense) 0 0 0 0 0 0
Net profit 1,803 2,066 2,355 3,032 3,418 3,990
DB adjustments (including dilution) 34 -4 69 -4 0 0
DB Net profit 1,837 2,062 2,424 3,027 3,418 3,990
Cash Flow (CNYm)
Cash flow from operations 1,709 1,918 2,259 2,641 3,186 3,655
Net Capex -789 -1,128 -2,033 -1,764 -1,350 -1,150
Free cash flow 920 791 226 876 1,836 2,505
Equity raised/(bought back) 1,217 0 0 0 0 0
Dividends paid -755 -825 -1,104 -1,610 -1,948 -2,020
Net inc/(dec) in borrowings -786 2,911 862 181 -61 -210
Other investing/financing cash flows -131 -4,058 403 321 66 -197
Net cash flow 465 -1,181 388 -232 -107 79
Change in working capital -483 -374 -774 -901 -766 -841
Balance Sheet (CNYm)
Cash and other liquid assets 2,609 1,428 1,816 1,584 1,476 1,555
Tangible fixed assets 4,317 5,061 6,590 7,754 8,480 8,947
Goodwill/intangible assets 0 0 0 0 0 0
Associates/investments 231 4,019 3,919 3,598 3,438 3,566
Other assets 4,160 5,436 6,036 6,951 7,751 8,656
Total assets 11,317 15,943 18,362 19,887 21,145 22,724
Interest bearing debt 0 2,911 3,774 3,955 3,894 3,684
Other liabilities 986 1,220 1,498 1,657 1,808 1,969
Total liabilities 986 4,132 5,272 5,611 5,702 5,653
Shareholders' equity 10,316 11,796 13,074 14,261 15,427 17,056
Minorities 15 16 16 16 16 16
Total shareholders' equity 10,332 11,811 13,090 14,276 15,443 17,072
Net debt -2,609 1,483 1,958 2,371 2,417 2,128
Key Company Metrics
Sales growth (%) nm 10.8 13.5 21.3 13.9 14.1
DB EPS growth (%) na 7.4 11.7 24.9 12.9 16.7
EBITDA Margin (%) 23.7 23.6 25.0 26.0 25.4 26.0
EBIT Margin (%) 19.7 19.6 20.8 22.1 21.8 22.5
Payout ratio (%) 71.0 91.4 84.4 64.3 59.1 58.0
ROE (%) 17.5 18.7 18.9 22.2 23.0 24.6
Capex/sales (%) 7.9 10.2 16.1 11.5 7.7 5.8
Capex/depreciation (x) 1.9 2.6 3.9 2.9 2.2 1.7
Net debt/equity (%) -25.3 12.6 15.0 16.6 15.7 12.5
Net interest cover (x) nm nm nm nm nm nm
Source: Company data, Deutsche Bank estimates
21 February 2017
Consumer
Greater China Sporting Goods
Deutsche Bank AG/Hong Kong Page 43
Li Ning (2331 HK): Take the offensive (look beyond expenses); Buy
Market may need to digest its 2017 expenses outlook
Investment in channels and sales team We believe the additional expenses will be invested more in channels
than in expanding the Danskin brand. We expect LN to invest in:
(1) Direct operated outlets: LN delivered very strong destocking with its
retail network in 2016. However, the destocking at its wholesalers was
likely below management’s expectation (Figure 93). This is driven by
the existence of less cooperative wholesalers. We expect LN to install
more direct-operated outlets from 2017 as it aims to collect inventory
from the wholesalers to help them destock.
(2) Better communication with franchisees: in the past, franchisees were
managed by LN’s first-tier wholesalers. We expect LN to launch a
program to interact directly with franchisees in terms of product flow
and cash flow.
(3) Consignment stores in Southern China: we expect LN to install some
consignment stores in regions where its presence is weaker. This is
aimed at incentivizing local wholesalers to open new stores (given that
under a consignment model the inventory risks shift from wholesalers
to LN).
Better service wholesalers: LN is likely recruiting more salespeople to
better service its wholesalers. The newly-recruited employees include
product and retail specialists that can add more value to its
wholesalers than generalist sales workers, in our view.
A grand goal for the channels: through the aforementioned points, we
anticipate LN to sustain a mid-to-high single-digit SSSg for its off-line
channels (Figure 94).

21 February 2017
Consumer
Greater China Sporting Goods
Page 44 Deutsche Bank AG/Hong Kong
Figure 93: LN channel inventory trend Figure 94: LN per store sales YoY
2.0
4.0
6.0
8.0
10.0
12.0
14.0
2011 2012 2013 2014 2015 16E 17E
Average Retail Wholesale & e-commerce
(months of sales equivalent)
Channel reform:
inventory buyback
Helping wholesalers destock
is a must
-30%
-20%
-10%
0%
10%
20%
30%
2010 2011 2012 2013 2014 1H15 15E 16E 17E
Consolidated Wholesale
Retail
Focusing on driving sellthrough
(even with smaller stores)
Source: Deutsche Bank estimates, company
Source: Deutsche Bank estimates, company
LN’s e-commerce business emerging to become a major profit driver A clear outperformer in 2017: we expect LN’s e-commerce revenue
grew over 80% in 2017 (surpassing the company’s target).
A profitable business: we estimate LN’s e-commerce business to carry
over its 15% EBIT margin, making it one of LN’s most profitable
businesses. We note that LN management targets a normalized e-
commerce EBIT margin of 30%, while we anticipate Anta’s e-
commerce to deliver a c. 30% EBIT margin in 2016.
Figure 95: LN revenue mix by channel Figure 96: LN profit mix by channel
95% 92%85% 81% 77%
72% 68%
5% 8%15% 19% 23%
28% 32%
0%
10%
20%
30%
40%
50%
60%
70%
80%
90%
100%
2014 2015 16E 17E 18E 19E 20E
e-commerce Physical channels
(1,000)
(500)
-
500
1,000
1,500
2,000
2,500
2014 2015 16E 17E 18E 19E 20E
e-commerce Physical channels(RMBmn)
Source: Deutsche Bank estimates, company data
Source: Deutsche Bank estimates, company data
A series of reforms on management structure and production
We also witnessed drastic efforts by the company to streamline its
management structure, including trimming the sales team structure to two
major districts (vs. seven in the past) as well as increasing the importance of
the channel department.
On the other hand, we expect the company to further enhance its production
capability.

21 February 2017
Consumer
Greater China Sporting Goods
Deutsche Bank AG/Hong Kong Page 45
Line of Thinking
Figure 97: LN share price Figure 98: LN consensus earnings revisions
2
2.5
3
3.5
4
4.5
5
5.5
6
6.5
Aug-14 Jan-15 Jun-15 Nov-15 Apr-16 Sep-16 Feb-17
Share price
U/G to
Hold (1)U/G to
Buy (2)
Buy (3)
Buy (4)
300
350
400
450
500
550
600
650
700
200
250
300
350
400
450
500
550
600
650
Jan-15 Apr-15 Jul-15 Oct-15 Jan-16 Apr-16 Jul-16 Oct-16 Jan-17
2016 consensus earnings (LHS) 2017 consensus earnings (RHS)
Source: Deutsche Bank, Bloomberg Finance LP
Source: Deutsche Bank, Bloomberg Finance LP consensus
Buy (3): we suggest buying into 1H16 results due to a likely
turnaround in LN’s retail business.
Buy (4): we argue there was a stronger-than-expected earnings
recovery from the multi-channel strategy.
Latest view: We believe LN may incur more expenses in 2017 due to
channel investments, but this is a must to sustain long-term growth.
Earnings revisions and DBe vs. consensus
Figure 99: Earnings revisions: we factor in heavier investments in channel in 2017
2016E 2017E 2018E 2016E 2017E 2018E 2016E 2017E 2018E
Revenue 8,092 9,270 10,625 8,079 9,121 10,404 0.2% 1.6% 2.1%
Gross profit 3,828 4,509 5,319 3,822 4,450 5,209 0.2% 1.3% 2.1%
EBIT 476 777 1,237 538 889 1,353 -11.5% -12.6% -8.6%
Headline NP 528 642 1,020 577 729 1,111 -8.4% -11.9% -8.1%
Profitability
Gross margin 47.3% 48.6% 50.1% 47.3% 48.8% 50.1% 0.0% -0.1% 0.0%
EBIT margin 5.9% 8.4% 11.6% 6.7% 9.7% 13.0% -0.8% -1.4% -1.4%
Net margin 6.5% 6.9% 9.6% 7.1% 8.0% 10.7% -0.6% -1.1% -1.1%
RMBm YE DecNew forecast New vs. Old forecastOld forecast
Source: Deutsche Bank estimates

21 February 2017
Consumer
Greater China Sporting Goods
Page 46 Deutsche Bank AG/Hong Kong
Figure 100: DBe vs. consensus: we are more positive on 2017 and 2018 (note DBe earnings are higher in 2016, partly
as we factored in the Double Happiness disposal & revaluation gains).
2016E 2017E 2018E 2016E 2017E 2018E 2016E 2017E 2018E
Revenue 8,092 9,270 10,625 8,057 9,073 10,112 0.4% 2.2% 5.1%
Gross profit 3,828 4,509 5,319 3,749 4,322 4,899 2.1% 4.3% 8.6%
EBIT 476 777 1,237 438 718 1,099 8.7% 8.3% 12.5%
Headline NP 528 642 1,020 363 598 887 45.4% 7.3% 15.0%
Profitability
Gross margin 47.3% 48.6% 50.1% 46.5% 47.6% 48.4% 0.8% 1.0% 1.6%
EBIT margin 5.9% 8.4% 11.6% 5.4% 7.9% 10.9% 0.4% 0.5% 0.8%
Net margin 6.5% 6.9% 9.6% 4.5% 6.6% 8.8% 2.0% 0.3% 0.8%
Market consensus New vs. Market forecastRMBm YE Dec
New forecast
Source: Deutsche Bank estimates, Bloomberg Finance LP
Valuation, risks and financial summary
DCF-based target price reduced to HKD5.9
We cut our DCF-based target price to HKD5.9 (from HKD6.1 previously). The c.
3% cut is intended to reflect the earnings downward revision as well as our
growing conviction in LN’s long-term growth potential.
We value LN using DCF methodology as we expect investors to focus on the
company’s long-term growth profile. The cost of equity of 11.2% entails a risk-
free rate of 3.9% (Deutsche Bank assumption), equity risk premium of 5.6%
(Deutsche Bank assumption), and beta of 1.3. We assume a perpetual growth
rate of 1%, in line with the Hong Kong and China consumer discretionary
space’s rate of 1-2%.
Figure 101: DCF sensitivity for LN
DCF Sensit iv ity Analys is (HK$) DCF Sensit iv ity Analys is on FY17E PE (x)
WACC -2.0% -0.5% 1.0% 2.5% 4.0% WACC -2.0% -0.5% 1.0% 2.5% 4.0%
9.2% 6.3 6.6 7.1 7.9 9.0 9.2% 22.3 28.7 30.9 34.0 39.0
10.2% 5.8 6.1 6.4 7.0 7.7 10.2% 25.0 26.3 27.9 30.1 33.4
11.2% 5.4 5.6 5.9 6.3 6.8 11.2% 23.3 24.2 20.9 27.1 29.4
12.2% 5.0 5.2 5.4 5.7 6.1 12.2% 21.7 22.5 23.4 24.7 26.4
13.2% 4.7 4.9 5.0 5.3 5.6 13.2% 20.4 21.0 21.8 22.7 24.0
Long run growth Long run growth
Source: Deutsche Bank estimates
Downside risks to our view
Execution: Our conversations with experts continue to suggest that the company is still in a relatively weak position in terms of systematic management. This may lead to poorer execution. We continue to believe LN needs a more comprehensive management system to enhance efficiency and sustainability.
Transitional volatility in gross margin: A weaker-than-expected improvement in gross margin is the most significant downside risk to our thesis. This may stem from disappointing retail discounts for the retail
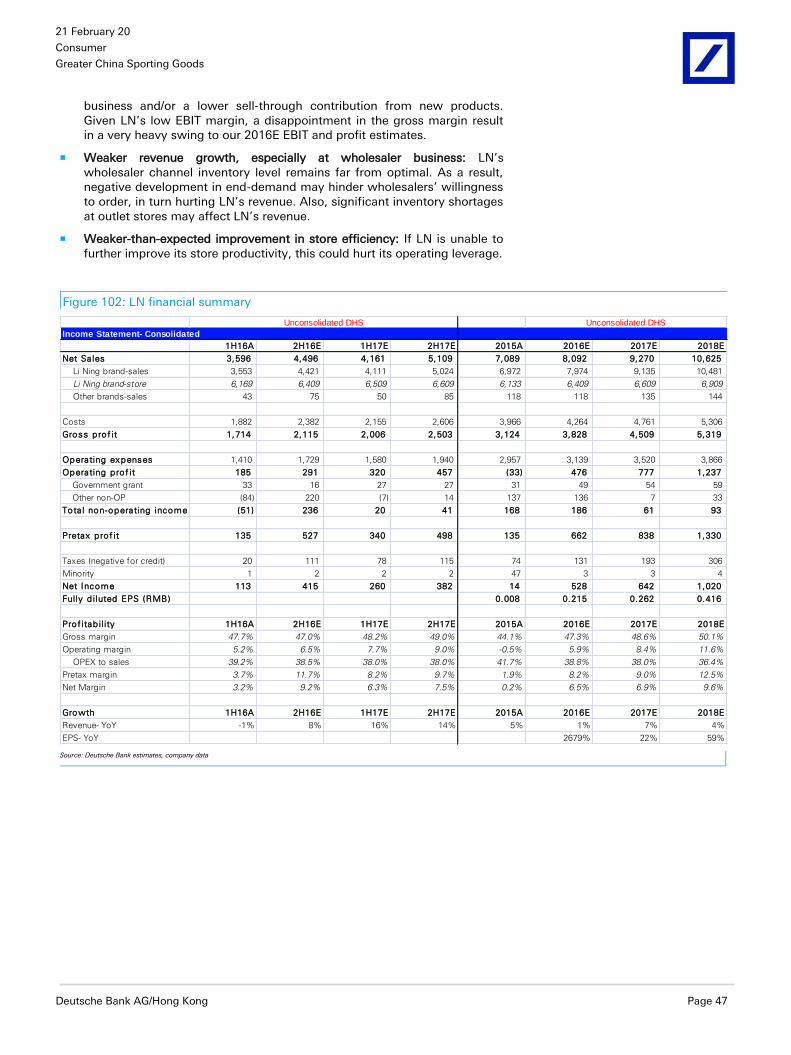
21 February 2017
Consumer
Greater China Sporting Goods
Deutsche Bank AG/Hong Kong Page 47
business and/or a lower sell-through contribution from new products. Given LN’s low EBIT margin, a disappointment in the gross margin result in a very heavy swing to our 2016E EBIT and profit estimates.
Weaker revenue growth, especially at wholesaler business: LN’s wholesaler channel inventory level remains far from optimal. As a result, negative development in end-demand may hinder wholesalers’ willingness to order, in turn hurting LN’s revenue. Also, significant inventory shortages at outlet stores may affect LN’s revenue.
Weaker-than-expected improvement in store efficiency: If LN is unable to further improve its store productivity, this could hurt its operating leverage.
Figure 102: LN financial summary
Income Statement- Consolidated
1H16A 2H16E 1H17E 2H17E 2015A 2016E 2017E 2018E
Net Sa les 3,596 4,496 4,161 5,109 7,089 8,092 9,270 10,625
Li Ning brand-sales 3,553 4,421 4,111 5,024 6,972 7,974 9,135 10,481
Li Ning brand-store 6,169 6,409 6,509 6,609 6,133 6,409 6,609 6,909
Other brands-sales 43 75 50 85 118 118 135 144
Costs 1,882 2,382 2,155 2,606 3,966 4,264 4,761 5,306
Gross prof it 1,714 2,115 2,006 2,503 3,124 3,828 4,509 5,319
Operating expenses 1,410 1,729 1,580 1,940 2,957 3,139 3,520 3,866
Operating prof it 185 291 320 457 (33) 476 777 1,237
Government grant 33 16 27 27 31 49 54 59
Other non-OP (84) 220 (7) 14 137 136 7 33
Tota l non-operating income (51) 236 20 41 168 186 61 93
Pretax prof it 135 527 340 498 135 662 838 1,330
Taxes (negative for credit) 20 111 78 115 74 131 193 306
Minority 1 2 2 2 47 3 3 4
Net Income 113 415 260 382 14 528 642 1,020
Fully d iluted EPS (RMB) 0.008 0.215 0.262 0.416
Prof itab il ity 1H16A 2H16E 1H17E 2H17E 2015A 2016E 2017E 2018E
Gross margin 47.7% 47.0% 48.2% 49.0% 44.1% 47.3% 48.6% 50.1%
Operating margin 5.2% 6.5% 7.7% 9.0% -0.5% 5.9% 8.4% 11.6%
OPEX to sales 39.2% 38.5% 38.0% 38.0% 41.7% 38.8% 38.0% 36.4%
Pretax margin 3.7% 11.7% 8.2% 9.7% 1.9% 8.2% 9.0% 12.5%
Net Margin 3.2% 9.2% 6.3% 7.5% 0.2% 6.5% 6.9% 9.6%
Growth 1H16A 2H16E 1H17E 2H17E 2015A 2016E 2017E 2018E
Revenue- YoY -1% 8% 16% 14% 5% 1% 7% 4%
EPS- YoY 2679% 22% 59%
Unconsolidated DHS Unconsolidated DHS
Source: Deutsche Bank estimates, company data

21 February 2017
Consumer
Greater China Sporting Goods
Page 48 Deutsche Bank AG/Hong Kong
Model updated:20 February 2017
Running the numbers
Asia
China
Textiles & Apparel
Li Ning Co Ltd Reuters: 2331.HK Bloomberg: 2331 HK
Buy Price (20 Feb 17) HKD 5.15
Target Price HKD 5.90
52 Week range HKD 3.12 - 5.89
Market Cap (m) HKDm 9,709
USDm 1,251
Company Profile
Li Ning is a leading PRC sports brand, specializing in the design and the distribution of footwear and accessories under the brand name Li Ning.
Price Performance
2.0
3.0
4.0
5.0
6.0
Feb 15May 15Aug 15Nov 15Feb 16May 16Aug 16Nov 16
Li Ning Co Ltd HANG SENG INDEX (Rebased)
Margin Trends
-20
-10
0
10
20
13 14 15 16E 17E 18E
EBITDA Margin EBIT Margin
Growth & Profitability
-40-30-20-100102030
-15-10-505
101520
13 14 15 16E 17E 18E
Sales growth (LHS) ROE (RHS)
Solvency
0
5
10
15
20
25
-50-40-30-20-10
0102030
13 14 15 16E 17E 18E
Net debt/equity (LHS) Net interest cover (RHS)
John Chou
+852 2203 6196 [email protected]
Fiscal year end 31-Dec 2013 2014 2015 2016E 2017E 2018E
Financial Summary
DB EPS (CNY) -0.65 -0.52 -0.05 0.16 0.28 0.42
Reported EPS (CNY) -0.25 -0.48 0.01 0.22 0.26 0.42
DPS (CNY) 0.00 0.00 0.00 0.08 0.10 0.22
BVPS (CNY) 2.0 1.4 1.7 1.9 2.1 2.4
Weighted average shares (m) 1,545 1,625 1,847 1,885 1,885 1,885
Average market cap (CNYm) 6,566 6,514 5,708 8,594 8,594 8,594
Enterprise value (CNYm) 6,329 7,006 5,171 7,615 7,278 6,674
Valuation Metrics P/E (DB) (x) nm nm nm 28.1 16.3 11.0
P/E (Reported) (x) nm nm 398.9 21.2 17.4 11.0
P/BV (x) 2.47 2.21 2.02 2.42 2.15 1.86
FCF Yield (%) nm nm nm 4.0 5.9 10.4
Dividend Yield (%) 0.0 0.0 0.0 1.8 2.2 4.7
EV/Sales (x) 1.1 1.0 0.7 0.9 0.8 0.6
EV/EBITDA (x) nm nm 14.4 10.3 7.0 4.4
EV/EBIT (x) nm nm 49.1 16.0 9.4 5.4
Income Statement (CNYm)
Sales revenue 5,824 6,728 7,812 8,092 9,270 10,625
Gross profit 2,390 2,886 3,443 3,828 4,509 5,319
EBITDA -517 -439 359 738 1,043 1,513
Depreciation 193 198 254 262 265 276
Amortisation 0 0 0 0 0 0
EBIT -710 -638 105 476 777 1,237
Net interest income(expense) -150 -143 -134 -104 -76 -61
Associates/affiliates 2 7 7 122 137 154
Exceptionals/extraordinaries 541 109 190 167 0 0
Other pre-tax income/(expense) 0 0 0 0 0 0
Profit before tax -317 -665 168 662 838 1,330
Income tax expense 42 79 100 131 193 306
Minorities 32 38 53 3 3 4
Other post-tax income/(expense) 0 0 0 0 0 0
Net profit -392 -781 14 528 642 1,020
DB adjustments (including dilution) -613 -57 -116 -130 45 0
DB Net profit -1,005 -838 -102 398 688 1,020
Cash Flow (CNYm)
Cash flow from operations -97 -629 179 752 789 1,212
Net Capex -286 -327 -327 -405 -278 -319
Free cash flow -382 -956 -148 347 511 893
Equity raised/(bought back) 1,480 0 1,172 0 0 0
Dividends paid 0 0 0 -71 -174 -290
Net inc/(dec) in borrowings -1,053 480 -249 -200 -298 0
Other investing/financing cash flows -17 227 4 200 0 0
Net cash flow 28 -249 779 276 39 603
Change in working capital 566 -1 -1 121 -46 -34
Balance Sheet (CNYm)
Cash and other liquid assets 1,283 1,034 1,813 2,056 2,095 2,698
Tangible fixed assets 1,344 1,500 906 1,049 1,062 1,105
Goodwill/intangible assets 0 0 0 0 0 0
Associates/investments 193 200 207 1,291 1,429 1,582
Other assets 3,197 3,305 3,971 2,963 3,326 3,738
Total assets 6,017 6,040 6,897 7,360 7,912 9,124
Interest bearing debt 1,046 1,525 1,277 1,077 778 778
Other liabilities 2,079 2,345 2,210 2,500 2,898 3,494
Total liabilities 3,125 3,870 3,487 3,577 3,676 4,272
Shareholders' equity 2,684 1,952 3,180 3,550 3,999 4,611
Minorities 208 218 231 234 237 240
Total shareholders' equity 2,892 2,169 3,411 3,783 4,236 4,852
Net debt -237 491 -537 -979 -1,317 -1,920
Key Company Metrics
Sales growth (%) -12.8 15.5 16.1 3.6 14.6 14.6
DB EPS growth (%) -100.1 20.6 89.3 na 72.9 48.4
EBITDA Margin (%) -8.9 -6.5 4.6 9.1 11.2 14.2
EBIT Margin (%) -12.2 -9.5 1.3 5.9 8.4 11.6
Payout ratio (%) nm nm 0.0 30.0 30.0 40.0
ROE (%) -18.2 -33.7 0.6 15.7 17.0 23.7
Capex/sales (%) 4.9 4.9 4.2 5.0 3.0 3.0
Capex/depreciation (x) 1.5 1.6 1.3 1.5 1.0 1.2
Net debt/equity (%) -8.2 22.7 -15.7 -25.9 -31.1 -39.6
Net interest cover (x) nm nm 0.8 4.6 10.2 20.4
Source: Company data, Deutsche Bank estimates
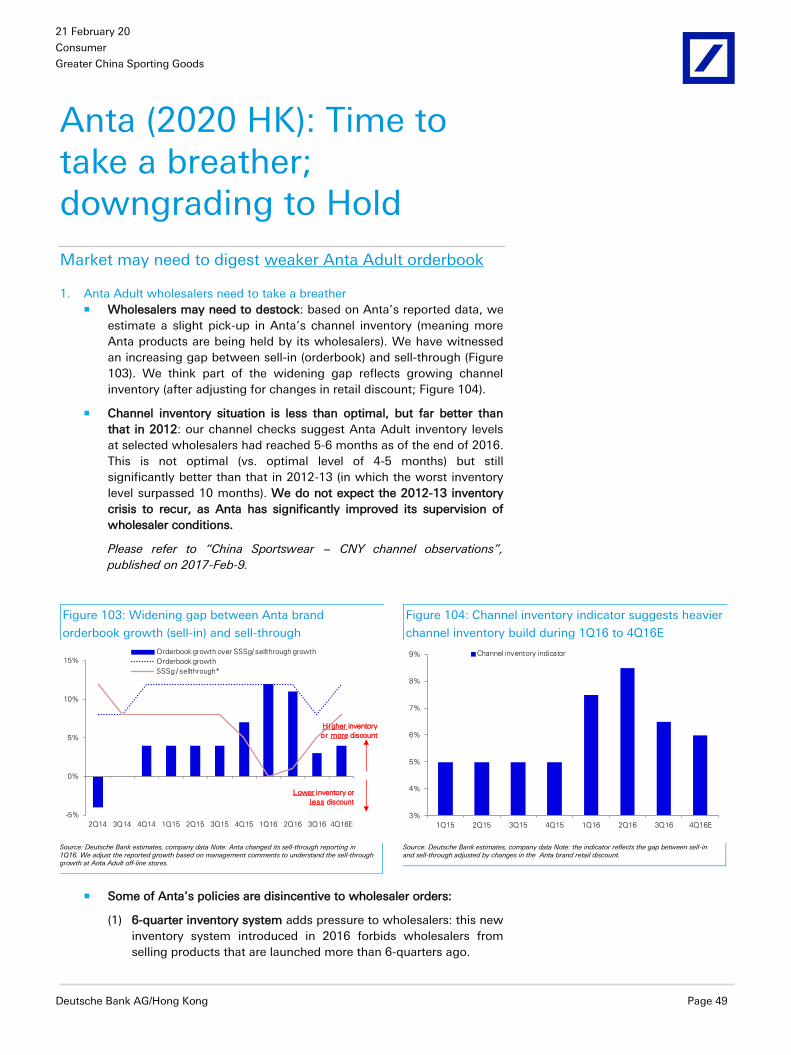
21 February 2017
Consumer
Greater China Sporting Goods
Deutsche Bank AG/Hong Kong Page 49
Anta (2020 HK): Time to take a breather; downgrading to Hold
Market may need to digest weaker Anta Adult orderbook
1. Anta Adult wholesalers need to take a breather Wholesalers may need to destock: based on Anta’s reported data, we
estimate a slight pick-up in Anta’s channel inventory (meaning more
Anta products are being held by its wholesalers). We have witnessed
an increasing gap between sell-in (orderbook) and sell-through (Figure
103). We think part of the widening gap reflects growing channel
inventory (after adjusting for changes in retail discount; Figure 104).
Channel inventory situation is less than optimal, but far better than
that in 2012: our channel checks suggest Anta Adult inventory levels
at selected wholesalers had reached 5-6 months as of the end of 2016.
This is not optimal (vs. optimal level of 4-5 months) but still
significantly better than that in 2012-13 (in which the worst inventory
level surpassed 10 months). We do not expect the 2012-13 inventory
crisis to recur, as Anta has significantly improved its supervision of
wholesaler conditions.
Please refer to “China Sportswear − CNY channel observations”,
published on 2017-Feb-9.
Figure 103: Widening gap between Anta brand
orderbook growth (sell-in) and sell-through
Figure 104: Channel inventory indicator suggests heavier
channel inventory build during 1Q16 to 4Q16E
-5%
0%
5%
10%
15%
2Q14 3Q14 4Q14 1Q15 2Q15 3Q15 4Q15 1Q16 2Q16 3Q16 4Q16E
Orderbook growth over SSSg/ sellthrough growth
Orderbook growth
SSSg / sellthrough*
Hi gher inventory
or more discount
Lower inventory or
less discount
3%
4%
5%
6%
7%
8%
9%
1Q15 2Q15 3Q15 4Q15 1Q16 2Q16 3Q16 4Q16E
Channel inventory indicator
Source: Deutsche Bank estimates, company data Note: Anta changed its sell-through reporting in 1Q16. We adjust the reported growth based on management comments to understand the sell-through growth at Anta Adult off-line stores.
Source: Deutsche Bank estimates, company data Note: the indicator reflects the gap between sell-in and sell-through adjusted by changes in the Anta brand retail discount.
Some of Anta’s policies are disincentive to wholesaler orders:
(1) 6-quarter inventory system adds pressure to wholesalers: this new
inventory system introduced in 2016 forbids wholesalers from
selling products that are launched more than 6-quarters ago.

21 February 2017
Consumer
Greater China Sporting Goods
Page 50 Deutsche Bank AG/Hong Kong
(2) Anta’s DTC e-commerce strategy also exerts pressure on
wholesalers: Anta has been cracking down on wholesaler resale e-
commerce using its DTC (direct-to-consumer) e-commerce. But in
the process of shutting down wholesaler e-commerce, excessive
inventory is being created.
Anta’s orderbook growth was likely supported by the addition of new
wholesalers: our checks suggest Anta recruited a group of wholesalers
from XDLong (which declared bankruptcy in 2016) and Peak. We thus
forecast Anta to deliver 3Q17 orderbook growth of low-to-mid-single
digit ppt YoY (Figure 105).
Anta has been preparing fast-replenishment facilities. But wholesalers
may need to digest inventory first in order to leverage the new
facilities.
2. Multi-brand strategy still performing well
As our core investment thesis, we remain positive toward Anta’s multi-brand &
multi-channel strategy. Our upward earnings revision in this report also reflects
the increasingly positive aspects of Anta’s operations (beyond the Anta Adult
off-line business).
Figure 106: Revenue mix by channel Figure 107: Earnings (EBIT) mix by channel
95% 93% 88% 83% 78% 75% 72%
5% 8% 12% 17% 22% 25% 28%
0%
10%
20%
30%
40%
50%
60%
70%
80%
90%
100%
2014 2015 16E 17E 18E 19E 20E
e-commerce (Anta brand) Physical channels
94% 91%83% 76%
69% 65% 62%
6% 9%17% 24%
31% 35% 38%
0%
10%
20%
30%
40%
50%
60%
70%
80%
90%
100%
2014 2015 16E 17E 18E 19E 20E
e-commerce (Anta brand) Physical channels
Source: Deutsche Bank estimates, company data
Source: Deutsche Bank estimates, company data
Figure 108: Revenue mix by brand Figure 109: Earnings (EBIT) mix by brand
86% 83% 80% 78% 76% 74% 73%
14% 17% 20% 21% 21% 21% 20%
1% 3% 6%7%
0%
10%
20%
30%
40%
50%
60%
70%
80%
90%
100%
2014 2015 16E 17E 18E 19E 20E
Descente Fila Anta Brand (Adult, Kids, e-commerce)
90% 86% 81% 82% 81% 79% 79%
10% 14% 19% 20% 20% 20% 20%
-2% -2%
1% 2%
-20%
0%
20%
40%
60%
80%
100%
2014 2015 16E 17E 18E 19E 20E
Descente Fila Anta Brand (Adult, Kids, e-commerce)
Source: Deutsche Bank estimates, company data
Source: Deutsche Bank estimates, company data
Figure 105: DB expectations of the
upcoming orderbook data
+ve / -ve DB Consen. Previous
=ve +LSD~MSD +LSD~MSD +MSD
3Q17 Orderbook YoY
Source: Deutsche Bank estimates, company data *meaning previously conveyed target
+ve / -ve DB Consen. Previous*
-ve Guide dow n No change +MSD~HSD
2017 Orderbook YoY

21 February 2017
Consumer
Greater China Sporting Goods
Deutsche Bank AG/Hong Kong Page 51
Line of Thinking
Figure 110: Anta share price Figure 111: Anta consensus earnings revisions
10
12
14
16
18
20
22
24
26
Aug-14 Jan-15 Jun-15 Nov-15 Apr-16 Sep-16 Feb-17
Share price
Buy (1)
Buy (2)
Buy (3)
Buy (4)
D/G to
Hold
2,400
2,450
2,500
2,550
2,600
2,650
2,700
2,750
2,800
2,850
2,900
2,000
2,100
2,200
2,300
2,400
2,500
2,600
Jan-15 Jun-15 Nov-15 Apr-16 Sep-16 Feb-17
2016 consensus earnings (LHS) 2017 consensus earnings (RHS)
Source: Deutsche Bank, Bloomberg Finance LP
Source: Deutsche Bank, Bloomberg Finance LP consensus
Buy (2) & (3): growth concerns on Anta Adult are hedged by
management’s 2017 orderbook guidance of “up mid-to-high single-
digit YoY”. We believe Anta pushed some inventory into its channel to
achieve this target.
Buy (4): we argue that the multi-brand strategy is a major long-term
growth driver. The market has shifted its focus to Fila, Anta e-
commerce, and Anta Kids (from Anta Adult).
Latest view: we highlight the potentially weaker Anta Adult revenue in
2H17 due to a slightly rising inventory level. Multi-brand strength is
likely already in the price, so we downgrade Anta’s shares to Hold.
Earnings revisions and DBe vs. consensus
Figure 112: Earnings revisions: raising earnings on Anta’s multi-brand and multi-channel strength
2016E 2017E 2018E 2016E 2017E 2018E 2016E 2017E 2018E
Revenue 13,779 15,998 18,539 13,276 15,176 17,749 3.8% 5.4% 4.4%
Gross profit 6,569 7,777 9,121 6,287 7,224 8,484 4.5% 7.6% 7.5%
EBIT 3,273 3,919 4,522 3,037 3,593 4,211 7.8% 9.0% 7.4%
Headline NP 2,468 2,981 3,462 2,307 2,763 3,237 7.0% 7.9% 7.0%
Profitability
Gross margin 47.7% 48.6% 49.2% 47.4% 47.6% 47.8% 0.3% 1.0% 1.4%
EBIT margin 23.8% 24.5% 24.4% 22.9% 23.7% 23.7% 0.9% 0.8% 0.7%
Net margin 17.9% 18.6% 18.7% 17.4% 18.2% 18.2% 0.5% 0.4% 0.4%
RMBm YE DecNew forecast Old forecast New vs. Old forecast
Source: Deutsche Bank estimates
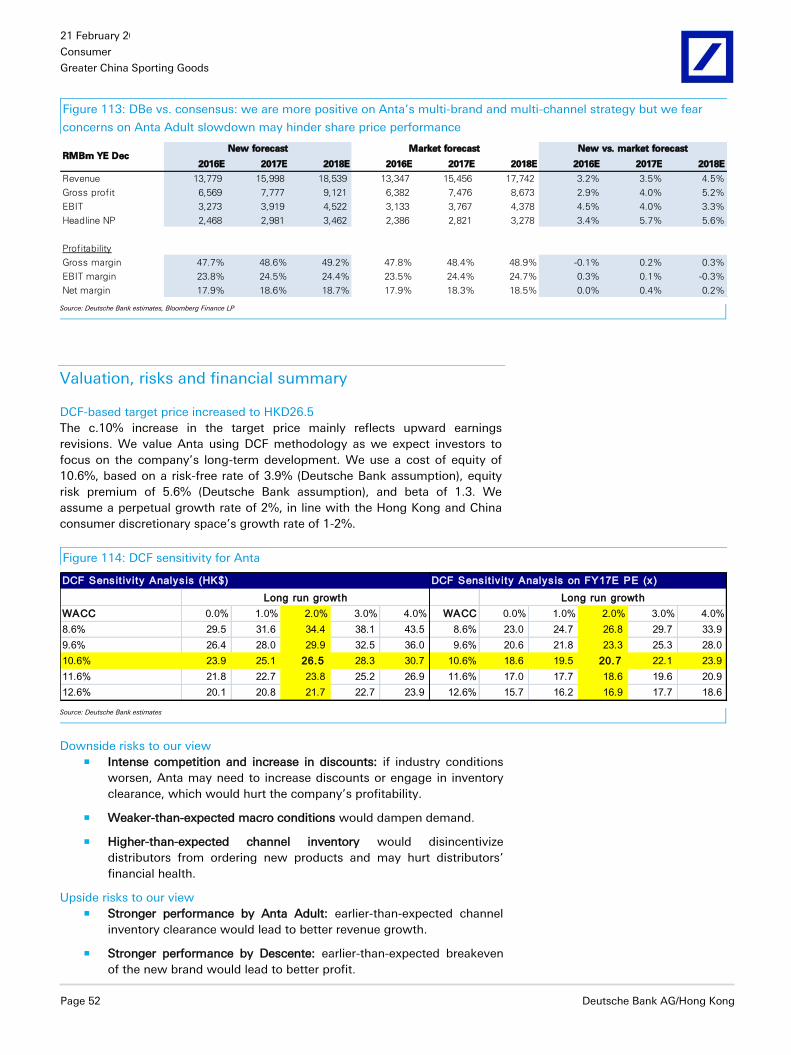
21 February 2017
Consumer
Greater China Sporting Goods
Page 52 Deutsche Bank AG/Hong Kong
Figure 113: DBe vs. consensus: we are more positive on Anta’s multi-brand and multi-channel strategy but we fear
concerns on Anta Adult slowdown may hinder share price performance
2016E 2017E 2018E 2016E 2017E 2018E 2016E 2017E 2018E
Revenue 13,779 15,998 18,539 13,347 15,456 17,742 3.2% 3.5% 4.5%
Gross profit 6,569 7,777 9,121 6,382 7,476 8,673 2.9% 4.0% 5.2%
EBIT 3,273 3,919 4,522 3,133 3,767 4,378 4.5% 4.0% 3.3%
Headline NP 2,468 2,981 3,462 2,386 2,821 3,278 3.4% 5.7% 5.6%
Profitability
Gross margin 47.7% 48.6% 49.2% 47.8% 48.4% 48.9% -0.1% 0.2% 0.3%
EBIT margin 23.8% 24.5% 24.4% 23.5% 24.4% 24.7% 0.3% 0.1% -0.3%
Net margin 17.9% 18.6% 18.7% 17.9% 18.3% 18.5% 0.0% 0.4% 0.2%
Market forecast New vs. market forecastRMBm YE Dec
New forecast
Source: Deutsche Bank estimates, Bloomberg Finance LP
Valuation, risks and financial summary
DCF-based target price increased to HKD26.5
The c.10% increase in the target price mainly reflects upward earnings
revisions. We value Anta using DCF methodology as we expect investors to
focus on the company’s long-term development. We use a cost of equity of
10.6%, based on a risk-free rate of 3.9% (Deutsche Bank assumption), equity
risk premium of 5.6% (Deutsche Bank assumption), and beta of 1.3. We
assume a perpetual growth rate of 2%, in line with the Hong Kong and China
consumer discretionary space’s growth rate of 1-2%.
Figure 114: DCF sensitivity for Anta
DCF Sensit iv ity Analys is (HK$) DCF Sensit iv ity Analys is on FY17E PE (x)
WACC 0.0% 1.0% 2.0% 3.0% 4.0% WACC 0.0% 1.0% 2.0% 3.0% 4.0%
8.6% 29.5 31.6 34.4 38.1 43.5 8.6% 23.0 24.7 26.8 29.7 33.9
9.6% 26.4 28.0 29.9 32.5 36.0 9.6% 20.6 21.8 23.3 25.3 28.0
10.6% 23.9 25.1 26.5 28.3 30.7 10.6% 18.6 19.5 20.7 22.1 23.9
11.6% 21.8 22.7 23.8 25.2 26.9 11.6% 17.0 17.7 18.6 19.6 20.9
12.6% 20.1 20.8 21.7 22.7 23.9 12.6% 15.7 16.2 16.9 17.7 18.6
Long run growth Long run growth
Source: Deutsche Bank estimates
Downside risks to our view Intense competition and increase in discounts: if industry conditions
worsen, Anta may need to increase discounts or engage in inventory
clearance, which would hurt the company’s profitability.
Weaker-than-expected macro conditions would dampen demand.
Higher-than-expected channel inventory would disincentivize
distributors from ordering new products and may hurt distributors’
financial health.
Upside risks to our view Stronger performance by Anta Adult: earlier-than-expected channel
inventory clearance would lead to better revenue growth.
Stronger performance by Descente: earlier-than-expected breakeven
of the new brand would lead to better profit.

21 February 2017
Consumer
Greater China Sporting Goods
Deutsche Bank AG/Hong Kong Page 53
Figure 115: Anta financial summary
Income Statement- Consolidated
1H16A 2H16E 1H17E 2H17E 2015A 2016E 2017E 2018E
Net Sa les 6,143 7,637 7,153 8,845 11,126 13,779 15,998 18,539
Anta brand-sales 3,784 4,268 3,827 4,141 7,541 8,052 7,968 7,704
Anta brand-store 7,000 7,000 7,050 7,100 7,031 7,000 7,100 7,100
Other brands-sales 2,359 3,368 3,326 4,703 3,585 5,727 8,029 10,835
Costs 3,202 4,009 3,684 4,537 5,940 7,211 8,221 9,418
Gross prof it 2,941 3,627 3,469 4,307 5,185 6,569 7,777 9,121
Operating expenses 1,453 1,837 1,740 2,098 2,528 3,290 3,837 4,541
Operating prof it 1,488 1,785 1,707 2,212 2,697 3,273 3,919 4,522
Tota l non-operating income 88 72 100 100 133 161 200 228
Pretax prof it 1,577 1,857 1,807 2,311 2,829 3,434 4,118 4,750
Taxes (negative for credit) 415 488 479 589 741 903 1,068 1,211
Minority 33 30 36 33 48 63 69 76
Net Income 1,129 1,339 1,292 1,689 2,041 2,468 2,981 3,462
Prof itab il ity 1H16A 2H16E 1H17E 2H17E 2015A 2016E 2017E 2018E
Gross margin 47.9% 47.5% 48.5% 48.7% 46.6% 47.7% 48.6% 49.2%
Operating margin 24.2% 23.4% 23.9% 25.0% 24.2% 23.8% 24.5% 24.4%
OPEX to sales 23.7% 24.1% 24.3% 23.7% 22.7% 23.9% 24.0% 24.5%
Pretax margin 25.7% 24.3% 25.3% 26.1% 25.4% 24.9% 25.7% 25.6%
Net Margin 18.4% 17.5% 18.1% 19.1% 18.3% 17.9% 18.6% 18.7%
Growth 1H16A 2H16E 1H17E 2H17E 2015A 2016E 2017E 2018E
Revenue- YoY 20% 27% 16% 16% 25% 24% 16% 16% Source: Deutsche Bank estimates, company data

21 February 2017
Consumer
Greater China Sporting Goods
Page 54 Deutsche Bank AG/Hong Kong
Model updated:20 February 2017
Running the numbers
Asia
China
Textiles & Apparel
Anta Reuters: 2020.HK Bloomberg: 2020 HK
Hold Price (20 Feb 17) HKD 25.00
Target Price HKD 26.50
52 Week range HKD 14.24 - 25.15
Market Cap (m) HKDm 62,528
USDm 8,056
Company Profile
Anta Sports Products Limited designs, develops, manufactures, and markets sportswear, including sports footwear and apparel for professionals and the general public.
Price Performance
8
12
16
20
24
28
Feb 15May 15Aug 15Nov 15Feb 16May 16Aug 16Nov 16
Anta HANG SENG INDEX (Rebased)
Margin Trends
21.022.023.024.025.026.027.0
13 14 15 16E 17E 18E
EBITDA Margin EBIT Margin
Growth & Profitability
05101520253035
-10-505
1015202530
13 14 15 16E 17E 18E
Sales growth (LHS) ROE (RHS)
Solvency
-75
-70
-65
-60
-55
13 14 15 16E 17E 18E
Net debt/equity (LHS) Net interest cover (RHS)
John Chou
+852 2203 6196 [email protected]
Fiscal year end 31-Dec 2013 2014 2015 2016E 2017E 2018E
Financial Summary
DB EPS (CNY) 0.53 0.68 0.81 0.99 1.19 1.39
Reported EPS (CNY) 0.53 0.68 0.81 0.99 1.19 1.39
DPS (CNY) 0.38 0.48 0.57 0.64 0.78 0.90
BVPS (CNY) 2.9 3.1 3.4 3.8 4.2 4.7
Weighted average shares (m) 2,494 2,495 2,499 2,495 2,495 2,495
Average market cap (CNYm) 16,887 26,010 36,961 55,350 55,350 55,350
Enterprise value (CNYm) 11,813 20,579 31,358 48,379 47,486 46,514
Valuation Metrics P/E (DB) (x) 12.8 15.3 18.2 22.4 18.5 15.9
P/E (Reported) (x) 12.8 15.3 18.2 22.4 18.5 15.9
P/BV (x) 2.65 3.49 5.03 5.86 5.28 4.73
FCF Yield (%) 5.3 5.5 4.8 5.1 5.1 5.8
Dividend Yield (%) 5.6 4.6 3.9 2.9 3.5 4.1
EV/Sales (x) 1.6 2.3 2.8 3.5 3.0 2.5
EV/EBITDA (x) 7.0 9.4 10.9 13.8 11.3 9.6
EV/EBIT (x) 7.5 10.2 11.6 14.8 12.1 10.3
Income Statement (CNYm)
Sales revenue 7,281 8,923 11,126 13,779 15,998 18,539
Gross profit 3,039 4,027 5,185 6,569 7,777 9,121
EBITDA 1,696 2,178 2,885 3,516 4,204 4,855
Depreciation 130 159 188 242 286 333
Amortisation 0 0 0 0 0 0
EBIT 1,566 2,019 2,697 3,273 3,919 4,522
Net interest income(expense) 187 224 133 161 200 228
Associates/affiliates 0 0 0 0 0 0
Exceptionals/extraordinaries 0 0 0 0 0 0
Other pre-tax income/(expense) 0 0 0 0 0 0
Profit before tax 1,753 2,243 2,829 3,434 4,118 4,750
Income tax expense 423 510 741 903 1,068 1,211
Minorities 15 32 48 63 69 76
Other post-tax income/(expense) 0 0 0 0 0 0
Net profit 1,315 1,700 2,041 2,468 2,981 3,462
DB adjustments (including dilution) 0 0 0 0 0 0
DB Net profit 1,315 1,700 2,041 2,468 2,981 3,462
Cash Flow (CNYm)
Cash flow from operations 1,096 1,615 2,228 3,384 3,462 3,963
Net Capex -196 -196 -463 -573 -665 -771
Free cash flow 900 1,419 1,766 2,811 2,797 3,192
Equity raised/(bought back) 0 0 0 0 0 0
Dividends paid -878 -878 -1,428 -1,444 -1,904 -2,219
Net inc/(dec) in borrowings -506 858 -18 -500 0 0
Other investing/financing cash flows 7 -184 -166 0 0 0
Net cash flow -478 1,214 154 868 893 972
Change in working capital -421 -421 -106 -57 -39 -52
Balance Sheet (CNYm)
Cash and other liquid assets 5,565 6,779 6,933 7,801 8,694 9,666
Tangible fixed assets 1,782 1,887 2,214 2,544 2,924 3,362
Goodwill/intangible assets 0 0 0 0 0 0
Associates/investments 0 0 0 0 0 0
Other assets 2,771 2,717 3,355 3,898 4,344 4,861
Total assets 10,118 11,384 12,502 14,244 15,961 17,889
Interest bearing debt 490 1,348 1,330 830 830 830
Other liabilities 2,279 2,031 2,358 3,673 4,278 4,917
Total liabilities 2,769 3,379 3,688 4,503 5,108 5,747
Shareholders' equity 7,154 7,795 8,580 9,443 10,487 11,699
Minorities 195 209 235 298 367 443
Total shareholders' equity 7,349 8,005 8,814 9,741 10,854 12,142
Net debt -5,074 -5,431 -5,603 -6,971 -7,864 -8,836
Key Company Metrics
Sales growth (%) -4.5 22.5 24.7 23.8 16.1 15.9
DB EPS growth (%) -3.2 29.3 19.5 21.1 21.2 16.2
EBITDA Margin (%) 23.3 24.4 25.9 25.5 26.3 26.2
EBIT Margin (%) 21.5 22.6 24.2 23.8 24.5 24.4
Payout ratio (%) 72.4 71.0 70.1 65.0 65.0 65.0
ROE (%) 18.9 22.7 24.9 27.4 29.9 31.2
Capex/sales (%) 2.7 2.2 4.2 4.2 4.2 4.2
Capex/depreciation (x) 1.5 1.2 2.5 2.4 2.3 2.3
Net debt/equity (%) -69.0 -67.8 -63.6 -71.6 -72.5 -72.8
Net interest cover (x) nm nm nm nm nm nm
Source: Company data, Deutsche Bank estimates

21 February 2017
Consumer
Greater China Sporting Goods
Deutsche Bank AG/Hong Kong Page 55
The author of this report wishes to acknowledge the contributions made by Julia
Xu, employee of Evalueserve, a third-party provider to Deutsche Bank of
offshore research support services.

21 February 2017
Consumer
Greater China Sporting Goods
Page 56 Deutsche Bank AG/Hong Kong
Appendix 1 Important Disclosures
*Other information available upon request Prices are current as of the end of the previous trading session unless otherwise indicated and are sourced from local exchanges via Reuters, Bloomberg and other vendors . Other information is sourced from Deutsche Bank, subject companies, and other sources. For disclosures pertaining to recommendations or estimates made on securities other than the primary subject of this research, please see the most recently published company report or visit our global disclosure look-up page on our website at http://gm.db.com/ger/disclosure/DisclosureDirectory.eqsr. Aside from within this report, important conflict disclosures can also be found at https://gm.db.com/equities under the "Disclosures Lookup" and "Legal" tabs. Investors are strongly encouraged to review this information before investing.
Analyst Certification
The views expressed in this report accurately reflect the personal views of the undersigned lead analyst about the subject issuers and the securities of those issuers. In addition, the undersigned lead analyst has not and will not receive any compensation for providing a specific recommendation or view in this report. John Chou
Equity rating key Equity rating dispersion and banking relationships
Buy: Based on a current 12- month view of total share-holder return (TSR = percentage change in share price from current price to projected target price plus pro-jected dividend yield ) , we recommend that investors buy the stock.
Sell: Based on a current 12-month view of total share-holder return, we recommend that investors sell the stock
Hold: We take a neutral view on the stock 12-months out and, based on this time horizon, do not recommend either a Buy or Sell.
Newly issued research recommendations and target prices supersede previously published research.
53 %
37 %
10 %18 % 17 % 19 %
050
100150200250300350400450500
Buy Hold Sell
Asia-Pacific Universe
Companies Covered Cos. w/ Banking Relationship
21 February 2017
Consumer
Greater China Sporting Goods
Deutsche Bank AG/Hong Kong Page 57
Additional Information
The information and opinions in this report were prepared by Deutsche Bank AG or one of its affiliates (collectively
"Deutsche Bank"). Though the information herein is believed to be reliable and has been obtained from public sources
believed to be reliable, Deutsche Bank makes no representation as to its accuracy or completeness.
If you use the services of Deutsche Bank in connection with a purchase or sale of a security that is discussed in this
report, or is included or discussed in another communication (oral or written) from a Deutsche Bank analyst, Deutsche
Bank may act as principal for its own account or as agent for another person.
Deutsche Bank may consider this report in deciding to trade as principal. It may also engage in transactions, for its own
account or with customers, in a manner inconsistent with the views taken in this research report. Others within
Deutsche Bank, including strategists, sales staff and other analysts, may take views that are inconsistent with those
taken in this research report. Deutsche Bank issues a variety of research products, including fundamental analysis,
equity-linked analysis, quantitative analysis and trade ideas. Recommendations contained in one type of communication
may differ from recommendations contained in others, whether as a result of differing time horizons, methodologies or
otherwise. Deutsche Bank and/or its affiliates may also be holding debt or equity securities of the issuers it writes on.
Analysts are paid in part based on the profitability of Deutsche Bank AG and its affiliates, which includes investment
banking, trading and principal trading revenues.
Opinions, estimates and projections constitute the current judgment of the author as of the date of this report. They do
not necessarily reflect the opinions of Deutsche Bank and are subject to change without notice. Deutsche Bank provides
liquidity for buyers and sellers of securities issued by the companies it covers. Deutsche Bank research analysts
sometimes have shorter-term trade ideas that are consistent or inconsistent with Deutsche Bank's existing longer term
ratings. Trade ideas for equities can be found at the SOLAR link at http://gm.db.com. A SOLAR idea represents a high
conviction belief by an analyst that a stock will outperform or underperform the market and/or sector delineated over a
time frame of no less than two weeks. In addition to SOLAR ideas, the analysts named in this report may from time to
time discuss with our clients, Deutsche Bank salespersons and Deutsche Bank traders, trading strategies or ideas that
reference catalysts or events that may have a near-term or medium-term impact on the market price of the securities
discussed in this report, which impact may be directionally counter to the analysts' current 12-month view of total return
or investment return as described herein. Deutsche Bank has no obligation to update, modify or amend this report or to
otherwise notify a recipient thereof if any opinion, forecast or estimate contained herein changes or subsequently
becomes inaccurate. Coverage and the frequency of changes in market conditions and in both general and company
specific economic prospects make it difficult to update research at defined intervals. Updates are at the sole discretion
of the coverage analyst concerned or of the Research Department Management and as such the majority of reports are
published at irregular intervals. This report is provided for informational purposes only and does not take into account
the particular investment objectives, financial situations, or needs of individual clients. It is not an offer or a solicitation
of an offer to buy or sell any financial instruments or to participate in any particular trading strategy. Target prices are
inherently imprecise and a product of the analyst’s judgment. The financial instruments discussed in this report may not
be suitable for all investors and investors must make their own informed investment decisions. Prices and availability of
financial instruments are subject to change without notice and investment transactions can lead to losses as a result of
price fluctuations and other factors. If a financial instrument is denominated in a currency other than an investor's
currency, a change in exchange rates may adversely affect the investment. Past performance is not necessarily
indicative of future results. Unless otherwise indicated, prices are current as of the end of the previous trading session,
and are sourced from local exchanges via Reuters, Bloomberg and other vendors. Data is sourced from Deutsche Bank,
subject companies, and in some cases, other parties.
The Deutsche Bank Research Department is independent of other business areas divisions of the Bank. Details regarding
our organizational arrangements and information barriers we have to prevent and avoid conflicts of interest with respect
to our research is available on our website under Disclaimer found on the Legal tab.
Macroeconomic fluctuations often account for most of the risks associated with exposures to instruments that promise
to pay fixed or variable interest rates. For an investor who is long fixed rate instruments (thus receiving these cash

21 February 2017
Consumer
Greater China Sporting Goods
Page 58 Deutsche Bank AG/Hong Kong
flows), increases in interest rates naturally lift the discount factors applied to the expected cash flows and thus cause a
loss. The longer the maturity of a certain cash flow and the higher the move in the discount factor, the higher will be the
loss. Upside surprises in inflation, fiscal funding needs, and FX depreciation rates are among the most common adverse
macroeconomic shocks to receivers. But counterparty exposure, issuer creditworthiness, client segmentation, regulation
(including changes in assets holding limits for different types of investors), changes in tax policies, currency
convertibility (which may constrain currency conversion, repatriation of profits and/or the liquidation of positions), and
settlement issues related to local clearing houses are also important risk factors to be considered. The sensitivity of fixed
income instruments to macroeconomic shocks may be mitigated by indexing the contracted cash flows to inflation, to
FX depreciation, or to specified interest rates – these are common in emerging markets. It is important to note that the
index fixings may -- by construction -- lag or mis-measure the actual move in the underlying variables they are intended
to track. The choice of the proper fixing (or metric) is particularly important in swaps markets, where floating coupon
rates (i.e., coupons indexed to a typically short-dated interest rate reference index) are exchanged for fixed coupons. It is
also important to acknowledge that funding in a currency that differs from the currency in which coupons are
denominated carries FX risk. Naturally, options on swaps (swaptions) also bear the risks typical to options in addition to
the risks related to rates movements.
Derivative transactions involve numerous risks including, among others, market, counterparty default and illiquidity risk.
The appropriateness or otherwise of these products for use by investors is dependent on the investors' own
circumstances including their tax position, their regulatory environment and the nature of their other assets and
liabilities, and as such, investors should take expert legal and financial advice before entering into any transaction similar
to or inspired by the contents of this publication. The risk of loss in futures trading and options, foreign or domestic, can
be substantial. As a result of the high degree of leverage obtainable in futures and options trading, losses may be
incurred that are greater than the amount of funds initially deposited. Trading in options involves risk and is not suitable
for all investors. Prior to buying or selling an option investors must review the "Characteristics and Risks of Standardized
Options”, at http://www.optionsclearing.com/about/publications/character-risks.jsp. If you are unable to access the
website please contact your Deutsche Bank representative for a copy of this important document.
Participants in foreign exchange transactions may incur risks arising from several factors, including the following: ( i)
exchange rates can be volatile and are subject to large fluctuations; ( ii) the value of currencies may be affected by
numerous market factors, including world and national economic, political and regulatory events, events in equity and
debt markets and changes in interest rates; and (iii) currencies may be subject to devaluation or government imposed
exchange controls which could affect the value of the currency. Investors in securities such as ADRs, whose values are
affected by the currency of an underlying security, effectively assume currency risk.
Unless governing law provides otherwise, all transactions should be executed through the Deutsche Bank entity in the
investor's home jurisdiction. Aside from within this report, important conflict disclosures can also be found at
https://gm.db.com/equities under the "Disclosures Lookup" and "Legal" tabs. Investors are strongly encouraged to
review this information before investing.
United States: Approved and/or distributed by Deutsche Bank Securities Incorporated, a member of FINRA, NFA and
SIPC. Analysts located outside of the United States are employed by non-US affiliates that are not subject to FINRA
regulations.
Germany: Approved and/or distributed by Deutsche Bank AG, a joint stock corporation with limited liability incorporated
in the Federal Republic of Germany with its principal office in Frankfurt am Main. Deutsche Bank AG is authorized under
German Banking Law and is subject to supervision by the European Central Bank and by BaFin, Germany’s Federal
Financial Supervisory Authority.
United Kingdom: Approved and/or distributed by Deutsche Bank AG acting through its London Branch at Winchester
House, 1 Great Winchester Street, London EC2N 2DB. Deutsche Bank AG in the United Kingdom is authorised by the
Prudential Regulation Authority and is subject to limited regulation by the Prudential Regulation Authority and Financial
Conduct Authority. Details about the extent of our authorisation and regulation are available on request.
Hong Kong: Distributed by Deutsche Bank AG, Hong Kong Branch.

21 February 2017
Consumer
Greater China Sporting Goods
Deutsche Bank AG/Hong Kong Page 59
India: Prepared by Deutsche Equities India Pvt Ltd, which is registered by the Securities and Exchange Board of India
(SEBI) as a stock broker. Research Analyst SEBI Registration Number is INH000001741. DEIPL may have received
administrative warnings from the SEBI for breaches of Indian regulations.
Japan: Approved and/or distributed by Deutsche Securities Inc.(DSI). Registration number - Registered as a financial
instruments dealer by the Head of the Kanto Local Finance Bureau (Kinsho) No. 117. Member of associations: JSDA,
Type II Financial Instruments Firms Association and The Financial Futures Association of Japan. Commissions and risks
involved in stock transactions - for stock transactions, we charge stock commissions and consumption tax by
multiplying the transaction amount by the commission rate agreed with each customer. Stock transactions can lead to
losses as a result of share price fluctuations and other factors. Transactions in foreign stocks can lead to additional
losses stemming from foreign exchange fluctuations. We may also charge commissions and fees for certain categories
of investment advice, products and services. Recommended investment strategies, products and services carry the risk
of losses to principal and other losses as a result of changes in market and/or economic trends, and/or fluctuations in
market value. Before deciding on the purchase of financial products and/or services, customers should carefully read the
relevant disclosures, prospectuses and other documentation. "Moody's", "Standard & Poor's", and "Fitch" mentioned in
this report are not registered credit rating agencies in Japan unless Japan or "Nippon" is specifically designated in the
name of the entity. Reports on Japanese listed companies not written by analysts of DSI are written by Deutsche Bank
Group's analysts with the coverage companies specified by DSI. Some of the foreign securities stated on this report are
not disclosed according to the Financial Instruments and Exchange Law of Japan. Target prices set by Deutsche Bank's
equity analysts are based on a 12-month forecast period.
Korea: Distributed by Deutsche Securities Korea Co.
South Africa: Deutsche Bank AG Johannesburg is incorporated in the Federal Republic of Germany (Branch Register
Number in South Africa: 1998/003298/10).
Singapore: by Deutsche Bank AG, Singapore Branch or Deutsche Securities Asia Limited, Singapore Branch (One Raffles
Quay #18-00 South Tower Singapore 048583, +65 6423 8001), which may be contacted in respect of any matters
arising from, or in connection with, this report. Where this report is issued or promulgated in Singapore to a person who
is not an accredited investor, expert investor or institutional investor (as defined in the applicable Singapore laws and
regulations), they accept legal responsibility to such person for its contents.
Taiwan: Information on securities/investments that trade in Taiwan is for your reference only. Readers should
independently evaluate investment risks and are solely responsible for their investment decisions. Deutsche Bank
research may not be distributed to the Taiwan public media or quoted or used by the Taiwan public media without
written consent. Information on securities/instruments that do not trade in Taiwan is for informational purposes only and
is not to be construed as a recommendation to trade in such securities/instruments. Deutsche Securities Asia Limited,
Taipei Branch may not execute transactions for clients in these securities/instruments.
Qatar: Deutsche Bank AG in the Qatar Financial Centre (registered no. 00032) is regulated by the Qatar Financial Centre
Regulatory Authority. Deutsche Bank AG - QFC Branch may only undertake the financial services activities that fall
within the scope of its existing QFCRA license. Principal place of business in the QFC: Qatar Financial Centre, Tower,
West Bay, Level 5, PO Box 14928, Doha, Qatar. This information has been distributed by Deutsche Bank AG. Related
financial products or services are only available to Business Customers, as defined by the Qatar Financial Centre
Regulatory Authority.
Russia: This information, interpretation and opinions submitted herein are not in the context of, and do not constitute,
any appraisal or evaluation activity requiring a license in the Russian Federation.
Kingdom of Saudi Arabia: Deutsche Securities Saudi Arabia LLC Company, (registered no. 07073-37) is regulated by the
Capital Market Authority. Deutsche Securities Saudi Arabia may only undertake the financial services activities that fall
within the scope of its existing CMA license. Principal place of business in Saudi Arabia: King Fahad Road, Al Olaya
District, P.O. Box 301809, Faisaliah Tower - 17th Floor, 11372 Riyadh, Saudi Arabia.
United Arab Emirates: Deutsche Bank AG in the Dubai International Financial Centre (registered no. 00045) is regulated

21 February 2017
Consumer
Greater China Sporting Goods
Page 60 Deutsche Bank AG/Hong Kong
by the Dubai Financial Services Authority. Deutsche Bank AG - DIFC Branch may only undertake the financial services
activities that fall within the scope of its existing DFSA license. Principal place of business in the DIFC: Dubai
International Financial Centre, The Gate Village, Building 5, PO Box 504902, Dubai, U.A.E. This information has been
distributed by Deutsche Bank AG. Related financial products or services are only available to Professional Clients, as
defined by the Dubai Financial Services Authority.
Australia: Retail clients should obtain a copy of a Product Disclosure Statement (PDS) relating to any financial product
referred to in this report and consider the PDS before making any decision about whether to acquire the product. Please
refer to Australian specific research disclosures and related information at
https://australia.db.com/australia/content/research-information.html
Australia and New Zealand: This research is intended only for "wholesale clients" within the meaning of the Australian
Corporations Act and New Zealand Financial Advisors Act respectively.
Additional information relative to securities, other financial products or issuers discussed in this report is available upon
request. This report may not be reproduced, distributed or published without Deutsche Bank's prior written consent.
Copyright © 2017 Deutsche Bank AG
GRCM2017PROD036391
David Folkerts-Landau Group Chief Economist and Global Head of Research
Raj Hindocha Global Chief Operating Officer
Research
Michael Spencer Head of APAC Research
Global Head of Economics
Steve Pollard Head of Americas Research
Global Head of Equity Research
Anthony Klarman Global Head of Debt Research
Paul Reynolds Head of EMEA
Equity Research
Dave Clark Head of APAC
Equity Research
Pam Finelli Global Head of
Equity Derivatives Research
Andreas Neubauer Head of Research - Germany
Stuart Kirk Head of Thematic Research
International locations
Deutsche Bank AG
Deutsche Bank Place
Level 16
Corner of Hunter & Phillip Streets
Sydney, NSW 2000
Australia
Tel: (61) 2 8258 1234
Deutsche Bank AG
Große Gallusstraße 10-14
60272 Frankfurt am Main
Germany
Tel: (49) 69 910 00
Deutsche Bank AG
Filiale Hongkong
International Commerce Centre,
1 Austin Road West,Kowloon,
Hong Kong
Tel: (852) 2203 8888
Deutsche Securities Inc.
2-11-1 Nagatacho
Sanno Park Tower
Chiyoda-ku, Tokyo 100-6171
Japan
Tel: (81) 3 5156 6770
Deutsche Bank AG London
1 Great Winchester Street
London EC2N 2EQ
United Kingdom
Tel: (44) 20 7545 8000
Deutsche Bank Securities Inc.
60 Wall Street
New York, NY 10005
United States of America
Tel: (1) 212 250 2500
Related Documents