PLANNING/PADDOCK PREPARATION PRE-PLANTING PLANTING PLANT GROWTH AND PHYSIOLOGY NUTRITION AND FERTILISER WEED CONTROL INSECT CONTROL NEMATODE MANAGEMENT DISEASES PLANT GROWTH REGULATORS AND CANOPY MANAGEMENT CROP DESICCATION AND SPRAY OUT HARVEST STORAGE ENVIRONMENTAL ISSUES MARKETING CURRENT AND PAST RESEARCH NORTHERN CANOLA MARCH 2017 GROW NOTES ™

Welcome message from author
This document is posted to help you gain knowledge. Please leave a comment to let me know what you think about it! Share it to your friends and learn new things together.
Transcript
PLANNING/PADDOCK PREPARATION
PRE-PLANTING
PLANTING
PLANT GROWTH AND PHYSIOLOGY
NUTRITION AND FERTILISER
WEED CONTROL
INSECT CONTROL
NEMATODE MANAGEMENT
DISEASES
PLANT GROWTH REGULATORS AND CANOPY MANAGEMENT
CROP DESICCATION AND SPRAY OUT
HARVEST
STORAGE
ENVIRONMENTAL ISSUES
MARKETING
CURRENT AND PAST RESEARCH
NORTHERN
CANOLA
March 2017
GROWNOTES™

DISCLAIMER:Any recommendations, suggestions or opinions contained in this publication do not necessarily represent the policy or views of the Grains Research and Development Corporation (GRDC). No person should act on the basis of the contents of this publication without first obtaining specific, independent professional advice.
The Grains Research and Development Corporation may identify products by proprietary or trade names to help readers identify particular types of products. We do not endorse or recommend the products of any manufacturer referred to. Other products may perform as well as or better than those specifically referred to. The GRDC will not be liable for any loss, damage, cost or expense incurred or arising by reason of any person using or relying on the information in this publication.
caution: research on Unregistered agricultural chemical Use
Any research with unregistered agricultural chemicals or of unregistered products reported in this document does not constitute a recommendation for that particular use by the authors or the author’s organisations. All agricultural chemical applications must accord with the currently registered label for that particular pesticide, crop, pest and region.
Copyright ©Grains Research and Development Corporation, March 2017. All material published in this GrowNote™ is copyright protected and may not be reproduced in any form without written permission from the GRDC.
ISBN: 978–1-921779–14-5
iii
What’s NeW CANOLA
NORTHERNMarch 2017
What’s NewThe GRDC GrowNotes are dynamic documents that are updated according to user feedback and newly available information.
This version of the GRDC Canola GrowNotes (updated March 2017) contains the following updates on original content published in August 2015:
Section a
Page xxiii• Research paper: Greijdanus A, Kragt M. (2014). The grains industry: An
overview of the Australian broad-acre cropping: http://ageconsearch.umn.edu/bitstream/164256/2/WP1400002.pdf
• New information: Canola insights will guide tactical agronomy: https://grdc.com.au/Media-Centre/Ground-Cover-Supplements/Ground-Cover-Issue-117-Optimising-canola-profitability/Canola-insights-will-guide-tactical-agronomy
Page xxvi• New podcast: Future of OP canola hinges on grower support: https://grdc.com.
au/Media-Centre/GRDC-Podcasts/Ground-Cover-Radio/2016/02/Ground-Cover-Radio-121-Future-of-OP-canola-hinges-on-grower-support
Page xxvii• New table: Canola production in NSW, Victoria, South Australia and
Western Australia
Section 1
Page 1.2• New information: High performance crop sequences for Southern Queensland:
https://grdc.com.au/Research-and-Development/GRDC-Update-Papers/2016/06/High-performance-crop-sequences-for-Southern-Queensland
• New information: Right crop sequence critical for farm sustainability: https://grdc.com.au/Media-Centre/GRDC-E-Newsletters/Paddock-Practices/Right-crop-sequence-critical-for-farm-sustainability
Page 1.3• New information: Sorghum following canola – Is there an issue?: https://grdc.
com.au/Research-and-Development/GRDC-Update-Papers/2016/07/Is-there-an-issue-with-sorghum-following-canola
• New information: Crown rot an update on latest research: https://grdc.com.au/Research-and-Development/GRDC-Update-Papers/2015/07/Crown-rot-an-update-on-latest-research
• New link: Likely fit of summer and winter forage crop options in Central West farming systems: https://grdc.com.au/Research-and-Development/GRDC-Update-Papers/2015/07/Likely-fit-of-summer-and-winter-forage-crop-options-in-Central-West-farming-systems
• New podcast: Rutherglen bug: https://grdc.com.au/Media-Centre/GRDC-Podcasts/Northern-Weekly-Update/2015/11/106-north
• New information: Impact of crop rotations on profit, nitrogen and ryegrass seed bank in crop sequences in southern NSW: https://grdc.com.au/Research-and-

iv
What’s NeW CANOLA
NORTHERNMarch 2017
Development/GRDC-Update-Papers/2015/07/Impact-of-crop-rotations-on-profit-nitrogen-and-ryegrass-seed-bank-in-crop-sequences-in-southern-NSW
Page 1.4• New information: High performance crop sequences for Southern Queensland:
https://grdc.com.au/Research-and-Development/GRDC-Update-Papers/2016/06/High-performance-crop-sequences-for-Southern-Queensland
• New information: Right crop sequence critical for farm sustainability: https://grdc.com.au/Media-Centre/GRDC-E-Newsletters/Paddock-Practices/Right-crop-sequence-critical-for-farm-sustainability
• New link: Herbicide residues in soils – are they an issue? (Northern): https://grdc.com.au/Research-and-Development/GRDC-Update-Papers/2016/02/Herbicide-residues-in-soils-Are-they-an-issue-Northern
Page 1.12• New podcast: Pre-emergent herbicides for Feathertop Rhodes grass: https://
grdc.com.au/Media-Centre/GRDC-Podcasts/Ground-Cover-Radio/2016/05/Ground-Cover-Radio-122-Northern-region-extension
Page 1.13• Updated link: Weed control in winter crops 2016: http://www.dpi.nsw.gov.au/
agriculture/broadacre-crops/winter-crops/general-disorders-of-crops/weed-control-winter-crops
Page 1.14• New link: SoilWaterApp – a new tool to measure and monitor soil water: https://
grdc.com.au/Research-and-Development/GRDC-Update-Papers/2016/02/SoilWaterApp-a-new-tool-to-measure-and-monitor-soil-water
• New link: Commonly asked questions about soil water and soil management: https://grdc.com.au/Research-and-Development/GRDC-Update-Papers/2016/02/Commonly-asked-questions-about-soil-water-and-soil-management
Page 1.15• New link: How spring planted canola can work in a graze and grain system:
https://grdc.com.au/Media-Centre/GRDC-E-Newsletters/Paddock-Practices/How-spring-planted-canola-can-work-in-a-graze-and-grain-system
Page 1.16• New podcast: In-crop canola management: https://grdc.com.au/Media-Centre/
GRDC-Podcasts/Ground-Cover-Radio/2015/06/Ground-Cover-Radio-Supplement• New podcast: Future of OP canola hinges on grower support: https://grdc.com.
au/Media-Centre/GRDC-Podcasts/Ground-Cover-Radio/2016/02/Ground-Cover-Radio-121-Future-of-OP-canola-hinges-on-grower-support
• New link: Irrigation cropping - can we afford the water?: https://grdc.com.au/Research-and-Development/GRDC-Update-Papers/2015/07/Irrigation-cropping-can-we-afford-the-water
• New link: Irrigated cropping project results: https://grdc.com.au/Research-and-Development/GRDC-Update-Papers/2015/07/Irrigated-cropping-project-results
• New link: The irrigated cereal and canola project update: https://grdc.com.au/Research-and-Development/GRDC-Update-Papers/2016/07/The-irrigated-cereal-and-canola-project-update
• New link: Achieving 10 t ha of irrigated wheat and 4 t ha of irrigated canola in the Murrumbidgee Valley region: https://grdc.com.au/Research-and-Development/GRDC-Update-Papers/2016/07/Achieving-10 t-ha-of-irrigated-wheat-and-4 t-ha-of-irrigated-canola
Page 1.17• New information: Improving fallow efficiency: https://grdc.com.au/Research-and-
Development/GRDC-Update-Papers/2016/02/Improving-fallow-efficiency

v
What’s NeW CANOLA
NORTHERNMarch 2017
• New link: Understanding & managing N loss pathways: https://grdc.com.au/Research-and-Development/GRDC-Update-Papers/2016/02/Understanding-and-managing-N-loss-pathways
• New information: Lost nitrogen and what you can do: https://grdc.com.au/Media-Centre/Ground-Cover/Ground-Cover-Issue-123-JulyAugust-2016/Lost-nitrogen-and-what-you-can-do
Section 2
Page 2.1• Updated variety information: Winter crop variety sowing guide 2016: http://www.
dpi.nsw.gov.au/__data/assets/pdf_file/0011/272945/winter-crop-variety-sowing-guide-2016.pdf
• Updated link: Winter crop variety sowing guide 2016: http://www.dpi.nsw.gov.au/agriculture/broadacre-crops/guides/winter-crop-variety-sowing-guide
Page 2.2• Updated variety maturity table: Winter crop variety sowing guide 2016: http://
www.dpi.nsw.gov.au/__data/assets/pdf_file/0011/272945/winter-crop-variety-sowing-guide-2016.pdf
Page 2.3• Updated yielding ability tables: Winter crop variety sowing guide 2016: http://
www.dpi.nsw.gov.au/__data/assets/pdf_file/0011/272945/winter-crop-variety-sowing-guide-2016.pdf
Page 2.6• Updated varieties for NSW: Winter crop variety sowing guide 2016: http://www.
dpi.nsw.gov.au/__data/assets/pdf_file/0011/272945/winter-crop-variety-sowing-guide-2016.pdf
Section 3
Page 3.1• Updated link: Winter crop variety sowing guide 2016: http://www.dpi.nsw.gov.au/
agriculture/broadacre-crops/guides/winter-crop-variety-sowing-guide
Page 3.4• New information: Methods and tools to characterise soils for plant available
water capacity (North Star): https://grdc.com.au/Research-and-Development/GRDC-Update-Papers/2016/03/Methods-and-tools-to-characterise-soils-for-plant-available-water-capacity-North-Star
• New information: Drivers of fallow efficiency: Effect of soil properties and rainfall patterns on evaporation and the effectiveness of stubble cover: https://grdc.com.au/Research-and-Development/GRDC-Update-Papers/2016/02/Drivers-of-fallow-efficiency
Section 4
Page 4.3• New link: Optimising grain yield and grazing potential of dual-purpose crops:
https://grdc.com.au/Research-and-Development/GRDC-Update-Papers/2015/08/Optimising-grain-yield-and-grazing-potential-of-dual-purpose-crops
• New link: Managing dual purpose crops to optimise profit from grazing and grain yield: https://grdc.com.au/Research-and-Development/GRDC-Update-Papers/2016/02/Managing-dual-purpose-crops-to-optimise-profit-from-grazing-and-grain-yield
https://grdc.com.au/Research-and-Development/GRDC-Update-Papers/2016/02/Drivers-of-fallow-efficiency
https://grdc.com.au/Research-and-Development/GRDC-Update-Papers/2016/02/Drivers-of-fallow-efficiency
vi
What’s NeW CANOLA
NORTHERNMarch 2017
• New link: Dual-purpose crops: https://grdc.com.au/Resources/Factsheets/2009/07/DualPurpose-Crops-Fact-Sheet
• New link: Canola in the grazing mix is food for thought: https://grdc.com.au/Media-Centre/Ground-Cover-Supplements/Ground-Cover-Issue-117-Optimising-canola-profitability/Canola-in-the-grazing-mix-is-food-for-thought
• New link: Dual purpose crops do they have a fit in your system and how can they be managed to optimise forage and grain production: https://grdc.com.au/Research-and-Development/GRDC-Update-Papers/2016/07/Do-dual-purpose-crops-have-a-fit-in-your-system
• New link: The effect of grazing and burning stubbles on grain yield and quality in no till and zero till controlled traffic farming systems in SNSW: https://grdc.com.au/Research-and-Development/GRDC-Update-Papers/2016/02/The-effect-of-grazing-and-burning-stubbles-on-grain-yield
• New information, new table: Canola in the grazing mix is food for thought: https://grdc.com.au/Media-Centre/Ground-Cover-Supplements/Ground-Cover-Issue-117-Optimising-canola-profitability/Canola-in-the-grazing-mix-is-food-for-thought
Page 4.4• New information: Role and fit for dual-purpose crops for mitigating risk and
optimising profit in low rainfall western grain growing regions: https://grdc.com.au/Research-and-Development/GRDC-Update-Papers/2016/02/Role-and-fit-for-dual-purpose-crops-for-mitigating-risk-and-optimising-profit
• New information: Winter canola for grazing and grain production: https://grdc.com.au/Research-and-Development/GRDC-Update-Papers/2016/07/Winter-canola-for-grazing-and-grain-production
Page 4.7• New information: Accessing and using day degrees in field crops as a tool to
assist crop management: https://grdc.com.au/Research-and-Development/GRDC-Update-Papers/2016/02/Accessing-and-using-day-degrees-in-field-crops-as-a-tool-to-assist-crop-management
Section 5
Page 5.1• New Section: Declining soil fertility
Page 5.7• New link: Harnessing the benefit of crop residues and tillage to enhance
the supply of nitrogen phosphorus and sulfur in the soil: https://grdc.com.au/Research-and-Development/GRDC-Update-Papers/2016/07/Harnessing-the-benefit-of-crop-residues-and-tillage
Page 5.8• New link: The what where and why of soil testing in the northern region: https://
grdc.com.au/Research-and-Development/GRDC-Update-Papers/2015/07/The-what-where-and-why-of-soil-testing-in-the-northern-region
Page 5.9• New link: Budgeting crop nitrogen supply better estimation better decisions:
https://grdc.com.au/Research-and-Development/GRDC-Update-Papers/2016/02/Budgeting-crop-nitrogen-N-supply-better-estimation-better-decisions
Page 5.17• New link: Improving fertiliser decisions for P on the Western Downs: https://grdc.
com.au/Research-and-Development/GRDC-Update-Papers/2015/07/Improving-fertiliser-decisions-for-P-on-the-Western-Downs
• New link: Phosphorus and potassium nutrition: https://grdc.com.au/Research-and-Development/GRDC-Update-Papers/2016/02/Phosphorus-and-potassium-nutrition
vii
What’s NeW CANOLA
NORTHERNMarch 2017
Page 5.20• New information, new table: Phosphorus – are we going to hit the wall and how
much P in 2015?: https://grdc.com.au/Research-and-Development/GRDC-Update-Papers/2015/07/Phosphorus
• New information: Review of sulfur strategy to improve profitability in canola in the central west of NSW: https://grdc.com.au/Research-and-Development/GRDC-Update-Papers/2013/02/Sulfur-strategy-to-improve-profitability-in-canola-in-the-central-west-of-NSW
Page 5.21• New information: Canola nutrition and sulfur: https://grdc.com.au/Resources/
Factsheets/2016/04/Canola-nutrition-and-sulfur
Page 5.22• New table: Canola nutrition and sulfur: https://grdc.com.au/Resources/
Factsheets/2016/04/Canola-nutrition-and-sulfur
Page 5.23• New information: Nitrogen versus sulfur canola trials: https://grdc.com.au/Media-
Centre/Ground-Cover/Ground-Cover-Issue-123-JulyAugust-2016/Nitrogen-versus-sulfur-canola-trials
Section 6
Page 6.1• Updated link: Weed control in winter crops 2016: http://www.dpi.nsw.gov.au/
agriculture/broadacre-crops/winter-crops/general-disorders-of-crops/weed-control-winter-crops
• New podcast: Torch test on tramline weeds: https://grdc.com.au/Media-Centre/GRDC-Podcasts/Ground-Cover-Radio/2015/09/Ground-Cover-Radio-118-Torch-test-on-tramline-weeds
Page 6.3• New podcast: Ryegrass integrated management: https://grdc.com.au/Media-
Centre/GRDC-Podcasts/Driving-Agronomy-Podcasts/2015/06/Ryegrass-control-with-RIM
• New podcast: Haloxyfop residue: https://grdc.com.au/Media-Centre/GRDC-Podcasts/Northern-Weekly-Update/2015/06/86-north
• New link: Herbicide resistance management, a local, in-field perspective: https://grdc.com.au/Research-and-Development/GRDC-Update-Papers/2015/07/Herbicide-resistance-management-a-local-infield-perspective
Page 6.4• New link: AHRI insight # 60: Canola’s a better crop plant than a weed: https://
grdc.com.au/Media-Centre/GRDC-E-Newsletters/AHRI-Newsletter/AHRI-insight-60-Canolas-a-better-crop-plant-than-a-weed
Page 6.6• New information: Microwave technology for weed management: https://grdc.
com.au/Research-and-Development/GRDC-Update-Papers/2016/03/Microwave-technology-for-weed-management
Page 6.7• New link: Managing resistant ryegrass in break crops and new herbicides for
resistant ryegrass: https://grdc.com.au/Research-and-Development/GRDC-Update-Papers/2015/07/Managing-resistant-ryegrass-in-break-crops-and-new-herbicides-for-resistant-ryegrass
• New information: Crop stage critical when using Clethodim in canola: https://grdc.com.au/Media-Centre/GRDC-E-Newsletters/Paddock-Practices/Crop-stage-critical-when-using-Clethodim-in-canola

viii
What’s NeW CANOLA
NORTHERNMarch 2017
Page 6.8• New information, new table: Coupling pre emergent herbicides and crop
competition for big reductions in weed escapes: https://grdc.com.au/Research-and-Development/GRDC-Update-Papers/2016/02/Coupling-pre-emergent-herbicides-and-crop-competition-for-big-reductions-in-weed-escapes
Page 6.10• New information, new figure: Coupling pre emergent herbicides and crop
competition for big reductions in weed escapes: https://grdc.com.au/Research-and-Development/GRDC-Update-Papers/2016/02/Coupling-pre-emergent-herbicides-and-crop-competition-for-big-reductions-in-weed-escapes
Section 7
Page 7.1• New podcast: Rutherglen bug: https://grdc.com.au/Media-Centre/GRDC-
Podcasts/Northern-Weekly-Update/2015/11/106-north
Page 7.9• New podcast: Aphids in canola it pays to wait: https://grdc.com.au/Media-Centre/
GRDC-Podcasts/Ground-Cover-Radio/2015/05/Ground-Cover-Radio-116-Aphids-in-canola-it-pays-to-wait
• New podcast: Aphid control: https://grdc.com.au/Media-Centre/GRDC-Podcasts/Northern-Weekly-Update/2015/06/84-north
Page 7.16• New information: Weekly trap catch data for H. punctigera and H. armigera from
locations across all states: https://jamesmaino.shinyapps.io/MothTrapVis/
Page 7.19• New information: Recent insect pest management research findings and
the application of results in the field: https://grdc.com.au/Research-and-Development/GRDC-Update-Papers/2016/02/Recent-insect-pest-management-research-findings-and-the-application-of-results-in-the-field
Page 7.20• New information, new tables: Recent insect pest management research findings
and the application of results in the field: https://grdc.com.au/Research-and-Development/GRDC-Update-Papers/2016/02/Recent-insect-pest-management-research-findings-and-the-application-of-results-in-the-field
Page 7.21• New information: Pest wrap up 2015 establishment pests, aphids, caterpillars
and beneficials: https://grdc.com.au/Research-and-Development/GRDC-Update-Papers/2016/02/Pest-wrap-up-2015-establishment-pests-aphids-caterpillars-and-beneficials
• New information: Winter crop variety sowing guide 2016. NSW DPI Management Guide: http://www.dpi.nsw.gov.au/__data/assets/pdf_file/0011/272945/winter-crop-variety-sowing-guide-2016.pdf
Section 8
Page 8.4• New podcast: Analysis underlines value of Predicta B for cropping decisions:
https://grdc.com.au/Media-Centre/GRDC-Podcasts/Ground-Cover-Radio/2016/02/Ground-Cover-Radio-121-Analysis-underlines-value-of-Predicta-B-for-cropping-decisions
• New link: Summer cropping options to manage root lesion nematodes: https://grdc.com.au/Research-and-Development/GRDC-Update-Papers/2016/07/Summer-cropping-options-to-manage-root-lesion-nematodes

ix
What’s NeW CANOLA
NORTHERNMarch 2017
Page 8.6• New information: Managing grain crops in nematode infested fields to minimise
loss and optimise profit: https://grdc.com.au/Research-and-Development/GRDC-Update-Papers/2016/03/Managing-grain-crops-in-nematode-infested-fields-to-minimise-loss-and-optimise-profit
Section 9
Page 9.1• New podcast: Biosecurity lesson in northern disease outbreaks: https://grdc.com.
au/Media-Centre/GRDC-Podcasts/Ground-Cover-Radio/2015/09/Ground-Cover-Radio-118-Biosecurity-lesson-in-northern-disease-outbreaks
• New podcast: Early action the essence of canola protection: https://grdc.com.au/Media-Centre/GRDC-Podcasts/Ground-Cover-Radio/2015/05/Ground-Cover-Radio-116-Early-action-the-essence-of-canola-protection
Page 9.2• Updated link: Canola disease update: https://grdc.com.au/Research-and-
Development/GRDC-Update-Papers/2017/02/Canola-disease-update
Page 9.3• New podcast: New advice for ascochyta blight and blackleg management:
https://grdc.com.au/Media-Centre/GRDC-Podcasts/Northern-Weekly-Update/2016/05/118-north
• New podcast: Blackleg management in canola: https://grdc.com.au/Media-Centre/GRDC-Podcasts/Northern-Weekly-Update/2016/05/118-north
• New information: Canola diseases - the 'watch outs' for 2016: https://grdc.com.au/Research-and-Development/GRDC-Update-Papers/2016/02/Canola-diseases-the-watch-outs-for-2016
• Updated link: 2016 Spring Blackleg management guide: http://www.grdc.com.au/GRDC-FS-BlacklegManagementGuide
Page 9.4• New information: 2016 Spring Blackleg management guide: http://www.grdc.com.
au/GRDC-FS-BlacklegManagementGuide
Page 9.8• Updated link: 2016 Spring Blackleg management guide: http://www.grdc.com.au/
GRDC-FS-BlacklegManagementGuide• New information: Canola diseases - the 'watch outs' for 2016: https://grdc.com.
au/Research-and-Development/GRDC-Update-Papers/2016/02/Canola-diseases-the-watch-outs-for-2016
Page 9.9• New information, new figures: Sclerotinia tops canola watch list: https://grdc.com.
au/Media-Centre/Media-News/North/2016/06/Sclerotinia-tops-canola-watch-list
Page 9.10• New information: Canola diseases - the 'watch outs' for 2016: https://grdc.com.
au/Research-and-Development/GRDC-Update-Papers/2016/02/Canola-diseases-the-watch-outs-for-2016
• New link: Stop the rot – early intervention key to disease control: https://grdc.com.au/Media-Centre/Ground-Cover/Ground-Cover-Issue-122-May-Jun-2016/Stop-the-rot-early-intervention-key-to-disease-control
• New podcast: Sclerotinia stem rot: https://grdc.com.au/Media-Centre/GRDC-Podcasts/Ground-Cover-Radio/2016/05/Ground-Cover-Radio-122-Northern-region-extension
x
What’s NeW CANOLA
NORTHERNMarch 2017
Section 11
Page 11.1• GOA investigates Canola desiccation and direct heading and PodGuard canola:
https://grdc.com.au/Research-and-Development/GRDC-Update-Papers/2016/07/GOA-investigates-Canola-desiccation-and-direct-heading-and-PodGuard-canola
Section 12
Page 12.1• New information: GOA investigates Canola desiccation and direct heading
and PodGuard canola: https://grdc.com.au/Research-and-Development/GRDC-Update-Papers/2016/07/GOA-investigates-Canola-desiccation-and-direct-heading-and-PodGuard-canola
• New information: Canola harvest: is direct heading a serious option: http://www.grdc.com.au/Research-and-Development/GRDC-Update-Papers/2013/02/Canola-harvest-Is-direct-heading-a-serious-option
Page 12.4• New link: “To windrow or not to windrow in 2016?” This is the question, “but if
so, when?”: https://grdc.com.au/Research-and-Development/GRDC-Update-Papers/2016/03/Windrowing-in-2016
• A snapshot of results from year 1 trials of canola harvest management in northern NSW: https://grdc.com.au/Research-and-Development/GRDC-Update-Papers/2016/07/A-snapshot-of-results-from-year-1-trials-of-canola-harvest-management-in-northern-NSW
Page 12.5• New information: “To windrow or not to windrow in 2016?” This is the question,
“but if so, when?”: https://grdc.com.au/Research-and-Development/GRDC-Update-Papers/2016/03/Windrowing-in-2016
Page 12.7• Updated link: The nuts and bolts of efficient and effective windrow burning:
https://grdc.com.au/Research-and-Development/GRDC-Update-Papers/2015/07/The-nuts-and-bolts-of-efficient-and-effective-windrow-burning
Page 12.10• New information: GOA investigates Canola desiccation and direct heading
and PodGuard canola: https://grdc.com.au/Research-and-Development/GRDC-Update-Papers/2016/07/GOA-investigates-Canola-desiccation-and-direct-heading-and-PodGuard-canola
Page 12.11• Updated link: Quality standards, technical Information & typical analysis:
http://www.graintrade.org.au/sites/default/files/201617_AOF_Standards_V15-August_1_2016-FINAL.pdf
Section 13
Page 13.1• New information: Part I Achieving great aeration results and Part II Silo
recirculation as an aid to fumigation: https://grdc.com.au/Research-and-Development/GRDC-Update-Papers/2016/07/Part-I-Achieving-great-aeration-results-and-Part-II-Silo-recirculation-as-an-aid-to-fumigation
Page 13.2 • New podcast: Storage strategy: https://grdc.com.au/Media-Centre/GRDC-
Podcasts/Northern-Weekly-Update/2015/11/106-north
xi
What’s NeW CANOLA
NORTHERNMarch 2017
• New link: Stored Grain Information Hub: http://storedgrain.com.au/• New link: Grain storage facilities: Planning for efficiency and quality. Stored Grain
Information Hub: http://storedgrain.com.au/grain-storage-facilities/• New link: Storing oilseeds. Stored Grain Information Hub: http://storedgrain.com.
au/storing-oilseeds/• New link: Vigilant monitoring protects grain assets. Stored Grain Information Hub:
http://storedgrain.com.au/monitoring-protects-grain/
Page 13.3• Pressure testing sealable silos. Stored Grain Information Hub: http://storedgrain.
com.au/pressure-testing/
Page 13.4• Hygiene & structural treatments for grain storage. Stored Grain Information Hub:
http://storedgrain.com.au/hygiene-structural-treatments/
Page 13.5• New link: Aerating stored grain, cooling or drying for quality control. Stored Grain
Information Hub: http://storedgrain.com.au/aerating-stored-grain/• New link: Performance testing aeration systems. Stored Grain Information Hub:
http://storedgrain.com.au/testing-aeration/• New information: Part I Achieving great aeration results and Part II Silo
recirculation as an aid to fumigation: https://grdc.com.au/Research-and-Development/GRDC-Update-Papers/2016/07/Part-I-Achieving-great-aeration-results-and-Part-II-Silo-recirculation-as-an-aid-to-fumigation
Page 13.8• Northern and Southern Regions. Stored grain pests—identification. Stored Grain
Information Hub: http://storedgrain.com.au/stored-grain-pests-id-ns/• Fumigating with phosphine, other fumigants and controlled atmospheres.
Stored Grain Information Hub: https://grdc.com.au/uploads/documents/GRDC-Fumigating-with-Phosphine-other-fumigants-and-controlled-atmospheres.pdf
• Finding storage pests early: https://grdc.com.au/Research-and-Development/GRDC-Update-Papers/2016/06/Finding-storage-pests-early
• Practical management of high level phosphine resistance in Rusty grain beetle: https://grdc.com.au/Research-and-Development/GRDC-Update-Papers/2015/07/Practical-management-of-high-level-phosphine-resistance-in-Rusty-grain-beetle
Page 13.9• New information: Killing storage pests without mercy Narrabri: https://grdc.com.
au/Research-and-Development/GRDC-Update-Papers/2016/07/Killing-storage-pests-without-mercy-Narrabri
Section 14
Page 14.3• New information: Managing frost risk. Northern, Southern and Western Regions.
GRDC Tips and Tactics: http://www.grdc.com.au/ManagingFrostRisk
Page 14.4• New information: An analysis of frost impact plus guidelines to reduce frost risk
and assess frost damage: https://grdc.com.au/Research-and-Development/GRDC-Update-Papers/2016/07/An-analysis-of-frost-impact-plus-guidelines-to-reduce-frost-risk-and-assess-frost-damage
• New information: Managing frost risk. Northern, Southern and Western Regions. GRDC Tips and Tactics: http://www.grdc.com.au/ManagingFrostRisk

xii
What’s NeW CANOLA
NORTHERNMarch 2017
Section 15
Page 15.1• New text, tables and figures: Profarmer Australia • New podcast: Quest to put health back into canola oil: https://grdc.com.au/
Media-Centre/GRDC-Podcasts/Ground-Cover-Radio/2015/06/Ground-Cover-Radio-Track-13
• New podcast: Consumer preferences: https://grdc.com.au/Media-Centre/GRDC-Podcasts/Driving-Agronomy-Podcasts/2015/06/Canola-the-Good-Oil
• Grain marketing – irrigated crops: https://grdc.com.au/Research-and-Development/GRDC-Update-Papers/2015/07/Grain-marketing-irrigated-crops
https://grdc.com.au/Media-Centre/GRDC-Podcasts/Driving-Agronomy-Podcasts/2015/06/Canola-the-Good-Oil
xiii
NORTHERNMarch 2017
CANOLA
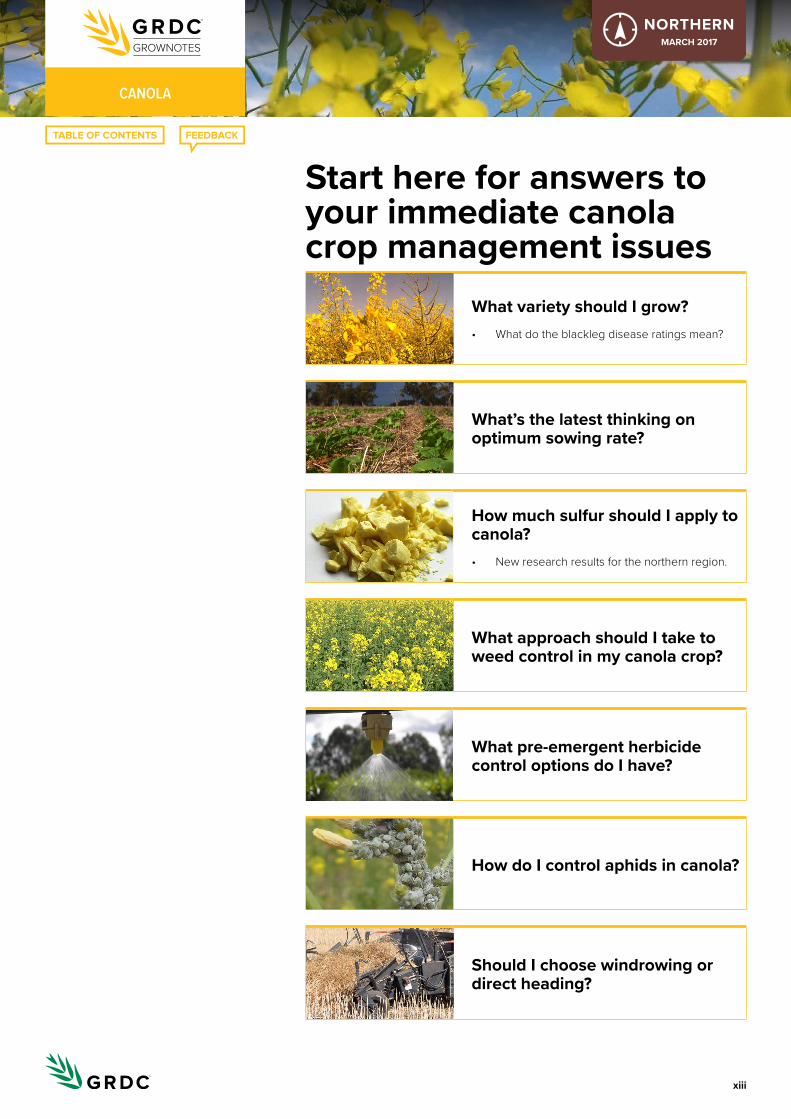
Start here for answers to your immediate canola crop management issues
What variety should I grow? • What do the blackleg disease ratings mean?
What’s the latest thinking on optimum sowing rate?
how much sulfur should I apply to canola? • New research results for the northern region.
What approach should I take to weed control in my canola crop?
What pre-emergent herbicide control options do I have?
how do I control aphids in canola?
Should I choose windrowing or direct heading?

1020
3040
5060
7080
9010
0
1020
3040
5060
7080
NO TILLUse no-tillage as
it stores more soil moisture
than conventional fallows
Ensure heavy stubble does not cover the plant line as it will impede
canola establishment
Phosphate nutrition for
canola is very important. Canola can respond to phosphorus on soils where wheat does not
P
Always sow on
100cmof wet soil
Suited to earlymaturing varieties
which can beachieved by sowing
2–4 kg of seed/ha
Use similar rates of nitrogen on canola as you would for high protein wheat in the same soil
N
WESTERN EASTERNSuited to
mid seasontypes
Always sow on
80cm of wet soil
HERBICIDETOLERANTVARIETIES
Consider e.g. triazine tolerant (TT) RoundupReady® or Clearfield® where weeds are a problem
Grow several varieties to spread harvest timing and the risk of unfavourable events e.g. moisture stress and frost
SOWEARLY
MAY
Mid season varieties
MIDMAY
Early varieties
to minimise frost risk
Monitor crops for insect pests during the critical times. Take account of beneficial insect numbers when making decisions on control options
ESTABLISHMENT FLOWERING PODDING
Canola is best followed with a WINTER CEREAL, as disease levels (e.g. crown rot) should be reduced and AM* (Arbuscular Mycorrhiza, previously known as VAM) is not a high requirement with these crops
Recent seasons have seen high levels of aphids in spring, monitor aphid levels in autumn and spring to reduce the impact of virus transmission and crop stress from feeding.
APHIDS
If choosing to windrow prior to harvest this should start when
40-60%of seeds have changed colour to red, brown or black.
Windrowed crops should be ready to harvest
5-14 DAYS after windrowing depending on the weather.
WINDROWINGThe moisture content of the grain should be
8% or less.
Aim to establish
30–50plants per square metre,
xiv
NORTHERNMarch 2017
CANOLA
Key Management Issues for canola in the Northern region
Canola can have an important role in northern NSW cropping systems, particularly in the higher rainfall areas of the region. It generally yields 40 to 60% of wheat grown under similar conditions and in normal years, average yields of around 1.5 t/ha should be possible with good management.
xv
NORTHERNMarch 2017
coNteNtS
CoNteNts CANOLA
What’s New
IntroductionA.1 Crop overview ..........................................................................................................xxii
A.1.1 History of canola .................................................................................................... xxii
A.1.2 Canola in Australia ................................................................................................ xxiii
A.1.3 Canola in the northern region ........................................................................... xxiv
A.1.4 Hybrids ...................................................................................................................... xxv
A.1.5 Domestic production ............................................................................................. xxv
1 Planning/Paddock preparation1.1 Paddock selection ....................................................................................................... 1
1.1.1 Soil types .....................................................................................................................2Hardpans .............................................................................................................................................2
Crusting soils ......................................................................................................................................2
Acid soils ..............................................................................................................................................2
Sodic subsoils ......................................................................................................................................2
1.2 Paddock rotations and history ................................................................................. 2
1.2.1 Canola as a break crop ............................................................................................3
1.3 Fallow weed control ................................................................................................... 4Double-knock strategies .................................................................................................................5
Important weeds in northern cropping systems ......................................................................5
Awnless barnyard grass ..................................................................................................................6
Flaxleaf fleabane ...............................................................................................................................8
Feathertop Rhodes grass .............................................................................................................. 10
Windmill grass .................................................................................................................................... 11
1.4 Herbicide plant-back periods ..................................................................................12
1.5 Seedbed requirements .............................................................................................13
1.6 Soil moisture...............................................................................................................14
1.6.1 Moisture stress during rosette formation and elongation ............................ 15
1.7 Yield and targets .......................................................................................................16
1.7.1 Seasonal outlook ..................................................................................................... 16
1.7.2 Fallow moisture efficiency ..................................................................................... 16
1.7.3 Nitrogen- and Water Use Efficiency .....................................................................17
1.7.4 Estimating maximum yield per unit water use by location and nitrogen ...17Step 1 .....................................................................................................................................................17
Step 2 ................................................................................................................................................... 18
contents
xvi
NORTHERNMarch 2017
coNteNtS
CoNteNts CANOLA
Step 3 ................................................................................................................................................... 18
1.8 Potential disease problems ....................................................................................19
1.9 Nematode status of paddock .................................................................................20
2 Pre-planting2.1 Varietal performance and ratings yield ................................................................... 1
2.1.1 Maturity .......................................................................................................................... 1
2.1.2 Yielding ability .............................................................................................................2
2.1.3 Oil ...................................................................................................................................5
2.1.4 Seed meal ...................................................................................................................6
2.2 Varieties for NSW ....................................................................................................... 6
2.2.1 Conventional varieties .............................................................................................6
2.2.2 Triazine-tolerant varieties ........................................................................................6
2.2.3 Clearfield® (imidazolinone-tolerant) varieties .....................................................8
2.2.4 Roundup Ready® varieties .......................................................................................9
2.2.5 Roundup Ready®–triazine-tolerant varieties .................................................... 10
2.2.6 Juncea canola (Brassica juncea) ......................................................................... 11
2.3 Planting seed quality .................................................................................................11
2.3.1 Seed size ..................................................................................................................... 11
2.3.2 Seed germination and vigour ............................................................................... 12Harvest timing .................................................................................................................................. 13
Seed chlorophyll .............................................................................................................................. 13
Seed handling .................................................................................................................................. 13
2.3.3 Seed storage ..............................................................................................................13
2.3.4 Safe rates of fertiliser sown with the seed .........................................................14
3 Planting3.1 Seed treatments .......................................................................................................... 1
3.1.1 Insecticide treatments ............................................................................................... 1
3.1.2 Fungicide treatments ................................................................................................. 1
3.2 Time of sowing ........................................................................................................... 1
3.2.1 Northern NSW .............................................................................................................5
3.2.2 Central and southern NSW ......................................................................................5
3.2.3 Southern NSW irrigation areas ...............................................................................5
3.3 NSW DPI research. Improving canola profit in central NSW: effect of time of sowing and variety choice ......................................................... 6
3.4 Targeted plant population .......................................................................................13
3.4.1 Calculating seed requirements .............................................................................14
3.4.2 Row spacing ...............................................................................................................14
3.5 Sowing depth .............................................................................................................15
3.6 Sowing equipment ....................................................................................................19
3.6.1 Alternate sowing techniques ............................................................................... 20
xvii
NORTHERNMarch 2017
coNteNtS
CoNteNts CANOLA
4 Plant growth and physiology4.1 Canola types ................................................................................................................ 1
4.1.1 Conventional ............................................................................................................... 1
4.1.2 Triazine-tolerant canola ............................................................................................ 1
4.1.3 Hybrids ........................................................................................................................... 1
4.1.4 Specialty canola – high oleic/low linolenic (HOLL) ...........................................2
4.1.5 IMI-tolerant canola ....................................................................................................2
4.1.6 Condiment (Indian) mustard ....................................................................................2
4.1.7 Junecea canola – Brassica juncea ......................................................................2
4.1.8 Roundup Ready® ........................................................................................................3
4.1.9 Industrial mustard .....................................................................................................3
4.1.10 Winter types for grazing (dual-purpose canola) .................................................3
4.2 Why know about canola development? ................................................................. 5
4.3 Plant physiology and the stages of plant growth ................................................. 6
4.3.1 Vernalisation ................................................................................................................ 7
4.4 Plant growth stages ................................................................................................... 8
4.4.1 Germination and emergence (stage 0 [0.0–0.8]) ..............................................8
4.4.2 Leaf production (stage 1 [1.00–1.20]) .....................................................................8
4.4.3 Stem elongation (stage 2 [2.00–2.20]) ...............................................................8
4.4.4 Flower bud development (stage 3 [3.0–3.9]) .....................................................9
4.4.5 Flowering (stage 4 [4.1–4.9]) ....................................................................................9
4.4.6 Pod development (stage 5 [5.1–5.9])................................................................... 10
4.4.7 Seed development (stage 6 [6.1–6.9]) ................................................................ 10
4.4.8 Environmental stresses impacting yield and oil content ...............................13
5 Nutrition and fertiliser5.1 Declining soil fertility .................................................................................................. 1
5.1.1 Soil organic matter ...................................................................................................... 1
5.1.2 Current situation .........................................................................................................4
5.1.3 Options for reversing the decline in soil organic matter .................................5Impact of fertiliser N inputs on soil ...............................................................................................7
5.2 New nutrition thinking for the northern region ...................................................7
5.3 Crop removal rates .................................................................................................... 8
5.4 Soil testing ................................................................................................................... 8
5.5 Nitrogen ...................................................................................................................... 9
5.5.1 Estimating nitrogen requirements ........................................................................ 11Example ................................................................................................................................................ 11
5.5.3 Diagnosing nitrogen deficiency in canola ......................................................... 15What to look for ................................................................................................................................ 16
What else could it be? .................................................................................................................... 16
Where does it occur? ...................................................................................................................... 16
Management strategies ................................................................................................................. 16
xviii
NORTHERNMarch 2017
coNteNtS
CoNteNts CANOLA
How can it be monitored? ..............................................................................................................17
5.6 Phosphorus................................................................................................................. 17
5.6.1 Role and deficiency symptoms............................................................................. 18Fertiliser placement ......................................................................................................................... 19
Phosphorus requirements ............................................................................................................. 19
5.7 Sulfur ..........................................................................................................................20
5.7.1 A new paradigm in sulfur thinking ....................................................................... 21Reducing rates of sulfur fertiliser ................................................................................................22
5.7.2 Nitrogen versus sulfur canola trials .................................................................... 23
5.8 Potassium ..................................................................................................................33
5.9 Micronutrients ...........................................................................................................34
5.9.1 Zinc ..............................................................................................................................34Deficiency symptoms ..................................................................................................................... 34
Fertiliser strategies ......................................................................................................................... 34
5.9.2 Molybdenum............................................................................................................. 35Role and deficiency symptoms ................................................................................................... 35
Fertiliser requirements ................................................................................................................... 35
5.9.3 Magnesium ............................................................................................................... 35
5.9.4 Calcium ...................................................................................................................... 36
5.10 Toxicity ........................................................................................................................36
5.11 Nutrition effects on following crop ....................................................................... 37
6 Weed control6.1 General weed management ...................................................................................... 1
6.1.1 Weed spectrum and herbicide resistance ...........................................................2
6.1.2 Herbicide resistance in Australian weeds ...........................................................3
6.1.3 Weed management in differing scenarios ..........................................................4Canola in a continuous cropping sequence .............................................................................4
Triazine Tolerant (TT) canola ..........................................................................................................5
Imidazolinone Tolerant (IT) canola ................................................................................................5
Liberty Link® canola ..........................................................................................................................5
Roundup Ready® canola .................................................................................................................5
6.1.4 Future directions ........................................................................................................6Microwave technology for weed management .......................................................................6
6.2 Clethodim damage ......................................................................................................7
6.3 Clethodim resistance in annual ryegrass................................................................7
6.3.1 Hybrid canola and pre-emergent herbicides for grass weed control in wheat ..........................................................................................................8
7 Insect control7.1 Integrated pest management ................................................................................... 1
7.1.1 Area-wide management ..........................................................................................2
7.1.2 Biological control ......................................................................................................2Types of biological control .............................................................................................................3

xix
NORTHERNMarch 2017
coNteNtS
CoNteNts CANOLA
Trichogramma wasps ......................................................................................................................4
Nuclear polyhedrosis virus (NPV) ................................................................................................4
Bacillus thuringiensis .........................................................................................................................4
7.2 Earth mites ................................................................................................................... 5Feeding ..................................................................................................................................................6
7.2.1 Redlegged earth mite ............................................................................................... 7Description ..........................................................................................................................................7
Seasonal development ...................................................................................................................7
TIMERITE® for management of redlegged earth mite ..........................................................7
7.2.2 Blue oat mite .............................................................................................................. 7Description ..........................................................................................................................................8
Seasonal development ...................................................................................................................8
7.3 Lucerne flea ................................................................................................................ 8
7.4 Slugs ............................................................................................................................ 8
7.5 Diamondback moth ................................................................................................... 8
7.6 Aphids ......................................................................................................................... 9
7.7 Rutherglen bug ..........................................................................................................15
7.8 Helicoverpa ................................................................................................................15Seasonal biology ............................................................................................................................ 16
Scout crops regularly ..................................................................................................................... 16
Spray eggs and very small caterpillars, particularly of the corn earworm ...................17
7.8.1 Corn earworm ...........................................................................................................17
7.8.2 Native budworm .......................................................................................................17
7.8.3 Descriptions of corn earworm and native budworm eggs and caterpillars .........................................................................................................17Eggs ......................................................................................................................................................17
Caterpillars .........................................................................................................................................17
Egg laying ...........................................................................................................................................17
7.8.4 Resistance-management strategy ...................................................................... 18
7.8.5 Preliminary threshold for Helicoverpa in canola ............................................. 19
7.9 Other soil pests ........................................................................................................20
8 Nematode management8.1 Background .................................................................................................................. 1
8.2 Impact of crop varieties on RLN multiplication .................................................... 2
8.3 Management of RLN .................................................................................................. 4Resistance differences between winter crops .........................................................................4
9 Diseases9.1 Major canola diseases ................................................................................................ 1
9.2 Blackleg ........................................................................................................................ 3
9.2.1 Steps to beating blackleg .......................................................................................5Step 1. Determine your farm’s risk.................................................................................................5
Step 2. Determine each crop’s blackleg severity in spring .................................................5
Step 3. Management practices can reduce the risk of blackleg infection .....................6

xx
NORTHERNMarch 2017
coNteNtS
CoNteNts CANOLA
Step 4. Blackleg resistance groups .............................................................................................7
9.2.2 Blackleg rating ............................................................................................................8
9.3 Sclerotinia stem rot .................................................................................................... 8
9.4 Viruses ..........................................................................................................................11
10 Plant growth regulators and canopy management
11 crop desiccation/spray out
12 harvest12.1 Windrowing ................................................................................................................. 1
Timing .....................................................................................................................................................4
12.1.1 When to windrow .......................................................................................................4
12.2 Direct heading ............................................................................................................ 6Timing .....................................................................................................................................................6
12.3 Desiccation followed by direct heading ................................................................. 9Timing .....................................................................................................................................................9
12.3.1 Canola desiccation and direct heading and PodGuard canola ................... 10
12.4 Wet harvest issues and management ...................................................................10
12.5 Receival standards ....................................................................................................10
13 Storage13.1 Canola storage at a glance ........................................................................................ 1
13.2 Storing oilseeds ......................................................................................................... 2
13.3 Seed quality and moisture content at storage .................................................... 2
13.4 Types of storage ......................................................................................................... 3
13.5 Hygiene—structural treatment ................................................................................ 4
13.6 Aeration ....................................................................................................................... 5
13.6.1 Aeration cooling ........................................................................................................5
13.6.2 Automatic controllers ................................................................................................6
13.6.3 Operation of aeration fans .......................................................................................6
13.6.4 Aeration drying ...........................................................................................................6
13.6.5 Heated air drying ...................................................................................................... 7
13.6.6 Fire risk ........................................................................................................................ 7
13.7 Insect pest control ..................................................................................................... 8
13.7.1 Phosphine fumigation in large silos .....................................................................9
14 environmental issues14.1 Frost .............................................................................................................................. 1
14.1.1 Risk management for frost ......................................................................................3
14.1.2 The changing nature of frost in Australia ...........................................................4
14.1.3 Issues that can be confused with frost damage ................................................4
14.2 Waterlogging and flooding ...................................................................................... 6
14.2.1 Symptoms of waterlogging .....................................................................................6
xxi
NORTHERNMarch 2017
coNteNtS
CoNteNts CANOLA
14.2.2 Effect on yield .............................................................................................................6
14.2.3 Germination ................................................................................................................. 7
14.2.4 Seedfill .......................................................................................................................... 7
15 Marketing15.1 Selling principles ........................................................................................................ 2
15.1.1 Be prepared.................................................................................................................2When to sell ..........................................................................................................................................2
How to sell ............................................................................................................................................2
15.1.2 Establish the business risk profile .........................................................................3Production risk profile of the farm ................................................................................................4
Establishing a target price ..............................................................................................................5
Income requirements ........................................................................................................................6
15.1.3 Managing your price ................................................................................................. 7Methods of price management .....................................................................................................8
15.1.4 Ensuring access to markets .................................................................................. 10Storage and logistics ....................................................................................................................... 11
Cost of holding grain ....................................................................................................................... 12
15.1.5 Converting tonnes into cash ..................................................................................14Set up the toolbox ............................................................................................................................ 14
How to sell for cash ......................................................................................................................... 14
Counterparty risk ...............................................................................................................................17
Relative values ...................................................................................................................................17
Read market signals ........................................................................................................................ 19
15.2 Northern canola: market dynamics and execution .............................................19
15.2.1 Price determinants for northern canola ............................................................. 19
15.2.2 Ensuring market access for northern canola .................................................... 21
15.2.3 Converting tonnes into cash for northern canola ........................................... 22
15.2.4 Risk management tools available for northern canola.................................. 23
16 current and past research
17 references
xxiiINtroDUctIoN
seCtioN a CANOLA
NORTHERNMarch 2017
Introductiona.1 crop overview
Canola is the most important oilseed and broadleaf rotation crop in Australia and the third-largest grain crop overall, worth $2 billion in 2013–14. It can be highly profitable in its own right but also provides important rotational benefits for the control of cereal diseases and weeds. 1
a.1.1 history of canolaCanola refers to the seed and oil that is produced by several cultivars of the rape plant, generally cultivars of either rapeseed (Brassica napus L.) or field mustard/turnip rape (Brassica rapa subsp. oleifera, syn. B. campestris L.). 2
Rapeseed oil was produced in the 19th Century as a source of a lubricant for steam engines; however, it was less useful as food for animals or humans because of high levels of erucic acid and glucosinolates, chemical compounds that significantly lower the nutritional value of rapeseed for animal feed.
Canola was developed in Canada in the early 1970s by traditional plant-breeding techniques to reduce significantly the levels of erucic acid and glucosinolates that were found in the parent rapeseed plant. The name ‘canola’ is a contraction of ‘Can(adian)’ O(il) L(ow) A(cid). 3
In the 1970s, intensive breeding programs in several countries including Australia produced high-quality varieties that were significantly lower in the two toxicants. Varieties termed ‘canola’ must meet specific standards on the levels of erucic acid and glucosinolates. They must yield oil low in erucic acid (<2%) and meal low in glucosinolates (total glucosinolates 30 µmol/g toasted oil-free meal) (CODEX International Food Standards 1999), and are often referred to as ‘double low’ or ‘double zero’ varieties. 4
Australian canola typically contains <10 µmol/g of glucosinolates, 43–45% oil, and 38–40% protein in oil-free meal. 5
Canola now dominates the consumption markets for oil and meal (Figure 1). Production of high erucic acid rapeseed is confined to production under contract for specific industrial uses, including environmentally friendly lubricants. 6
In addition to varieties from the traditional B. napus and B. rapa species, cross-breeding of multiple lines of B. juncea has enabled this mustard variety to be classified as a canola-type variety by lowering both erucic acid and glucosinolates to the market standards. 7
1 J Kirkegaard (2015) Canola insights will guide tactical agronomy. Ground Cover Supplements, Ground Cover Issue 117—Optimising canola profitability, 29 June 2015, https://grdc.com.au/Media-Centre/Ground-Cover-Supplements/Ground-Cover-Issue-117-Optimising-canola-profitability/Canola-insights-will-guide-tactical-agronomy
2 Canola. Wikipedia, http://en.wikipedia.or g/wiki/Canola
3 CanolaInfo (2015) Where does canola come from? CanolaInfo, http://www.canolainfo.org/canola/where.php
4 OGTR (2002) The biology and ecology of canola (Brassica napus). Office of the Gene Technology Regulator, http://www.ogtr.gov.au/internet/ogtr/publishing.nsf/content/canola-3/$FILE/brassica.pdf
5 AEGIC. Australian grain note: canola. Australian Export Grains Innovation Centre, http://www.australianoilseeds.com/oilseeds_industry/quality_of_australian_canola
6 CanolaInfo (2015) Where does canola come from? http://www.canolainfo.org/canola/where.php
7 Canola. Wikipedia, http://en.wikipedia.org/wiki/Canola
i MORE INFORMATION
a general summary of the australian grain growing regions is available at Greijdanus a, Kragt M. (2014). the grains industry: an overview of the australian broad-acre cropping
xxiiiINtroDUctIoN
seCtioN a CANOLA
NORTHERNMarch 2017
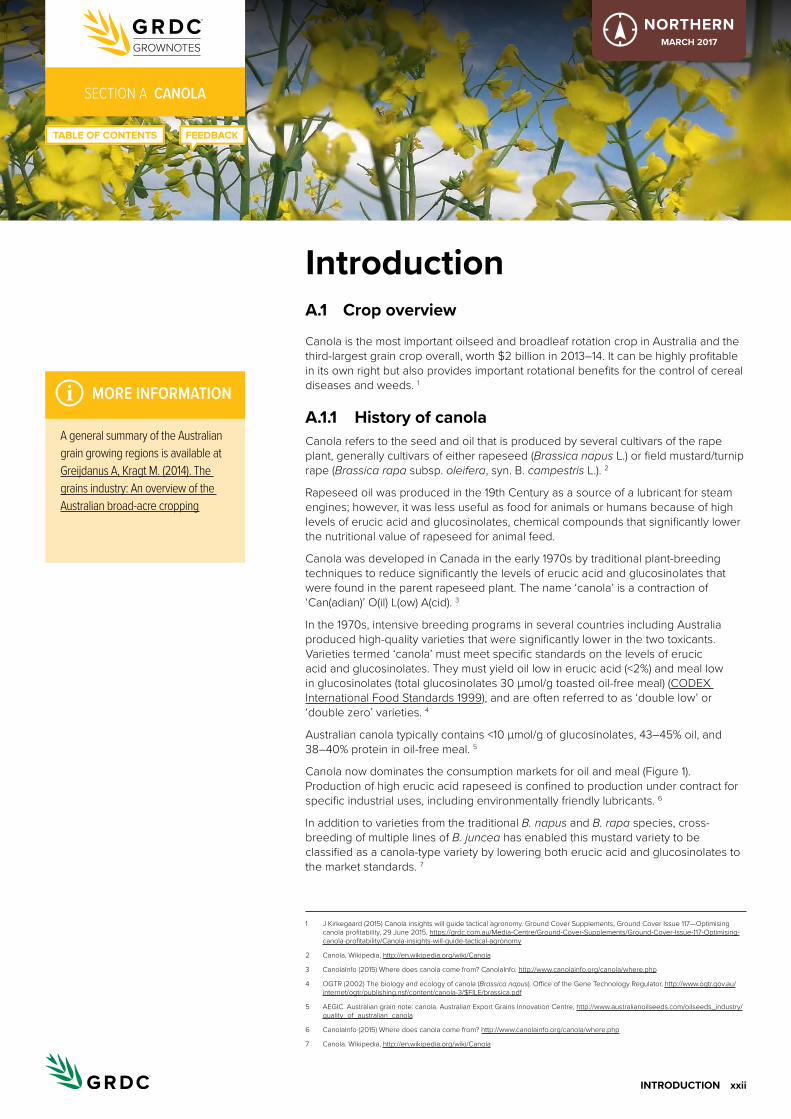
Figure 1: Canola is now a major oilseed industry, providing national economic benefits in employment, processing, manufacturing and exports.
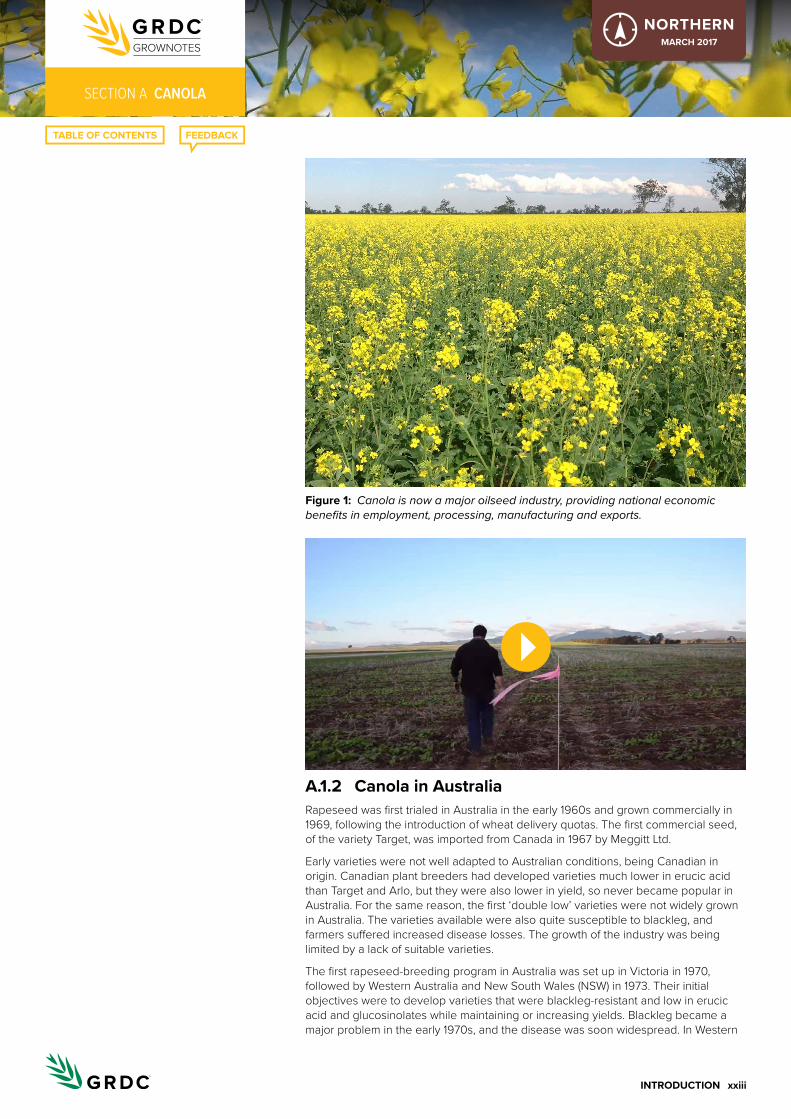
a.1.2 canola in australiaRapeseed was first trialed in Australia in the early 1960s and grown commercially in 1969, following the introduction of wheat delivery quotas. The first commercial seed, of the variety Target, was imported from Canada in 1967 by Meggitt Ltd.
Early varieties were not well adapted to Australian conditions, being Canadian in origin. Canadian plant breeders had developed varieties much lower in erucic acid than Target and Arlo, but they were also lower in yield, so never became popular in Australia. For the same reason, the first ‘double low’ varieties were not widely grown in Australia. The varieties available were also quite susceptible to blackleg, and farmers suffered increased disease losses. The growth of the industry was being limited by a lack of suitable varieties.
The first rapeseed-breeding program in Australia was set up in Victoria in 1970, followed by Western Australia and New South Wales (NSW) in 1973. Their initial objectives were to develop varieties that were blackleg-resistant and low in erucic acid and glucosinolates while maintaining or increasing yields. Blackleg became a major problem in the early 1970s, and the disease was soon widespread. In Western

xxivINtroDUctIoN
seCtioN a CANOLA
NORTHERNMarch 2017
Australia, where the disease was most severe, yield losses of up to 80% resulted in plantings crashing from 49,000 ha in 1972 to 3,200 ha in 1974.
Although resistant varieties were developed, the Western Australian industry did not produce significant quantities of canola again until the early–mid 1990s. The first Australian varieties were Wesreo (released 1978) and Wesway (released 1979), which were low-erucic-acid, blackleg-resistant varieties from Western Australia. In Australia, canola is used to denote varieties with erucic acid level <2% and total glucosinolates <40 µmol/g. The first canola-quality B. napus varieties to be released were Wesroona, in Western Australia in 1980, and Marnoo, from Victoria in 1980. Marnoo was higher yielding and had much lower glucosinolate levels than earlier varieties and so became a popular variety, particularly in Victoria.
However, Marnoo’s limited blackleg resistance was a handicap in NSW. Growers there had been growing mainly Span, and quickly adopted Jumbuck (B. rapa variety, released 1982) because of its better yield, quality and disease resistance. In 1987, with the release of Maluka and Shiralee (both B. napus) from NSW, high-quality canola varieties became available. These were the first varieties to combine canola quality with blackleg resistance and high yields. They also resulted in a trend back to B. napus varieties.
The first hybrid canola, Hyola 30, was released by Pacific Seeds in 1988, followed by Hyola 42 in 1991. Triazine-tolerant (TT) canola was first commercialised with the release of the variety Siren in 1993. Siren was late maturing with low yield and oil content but was useful where crucifer weeds reduced the chances of success with canola. New TT varieties rapidly followed, both early (Karoo and Drum) and midseason (Clancy and Pinnacle) maturity. This led to the rapid adoption of TT canola across Australia, especially in Western Australia, where TT canola now comprises ~90% of the total crop.
The TT varieties continue to have a yield disadvantage of 10–15%, and about 3–5% lower oil content than conventional varieties, but they are accepted by farmers because they allow canola to be grown where it could not previously.
Since the early 1990s, canola production has extended into lower rainfall areas in all states, even where rainfall is as low as 325 mm/year. This expansion has caused plant breeders to select earlier maturing varieties, with the release of Monty in 1998 and Mystic in 1999. Early-maturing varieties currently have lower oil contents than midseason types and often have slightly lower resistance to blackleg; however, further work is being conducted to improve these types. 8
The first imidazolinone-tolerant (Clearfield®) variety was released in 1999, further expanding weed-control options. Genetically modified glyphosate-tolerant varieties, incorporating the Roundup Ready® trait, were grown commercially for the first time in 2008 in NSW and Victoria. High oleic, low linolenic acid varieties were grown commercially for the first time in 1999. These varieties differ from conventional canola in the fatty acid profile of the oil, which increases its uses, especially for deep frying. 9
a.1.3 canola in the northern regionSignificant areas of canola were grown in the early 1990s, but the crop suffered from frost damage, a series of drought years and the consequences of not forming arbuscular mycorrhizal associations (J. Slatter, pers. comm.), and so the area dropped away. Yield and oil content were variable and often disappointing. Problems with crop production were often cited as being due to variable climatic conditions, poorly adapted cultivars, poor establishment and inadequate nutrition.
Frost at the early stages of pod filling devastated several commercial crops, which led to the perception that canola was poorly adapted to northern climatic conditions. In addition, in areas with significant summer cropping, it was noted that
8 B. Colton, T. Potter. History. Australian Oilseeds Federation, http://www.australianoilseeds.com/__data/assets/pdf_file/0010/2701/Chapter_1_-_History.pdf
9 D McCaffrey (2009) Introduction. In Canola best practice management guide for south-eastern Australia. (Eds D McCaffrey, T Potter, S Marcroft, F Pritchard) GRDC, http://www.grdc.com.au/uploads/documents/GRDC_Canola_Guide_All_1308091.pdf
xxvINtroDUctIoN
seCtioN a CANOLA
NORTHERNMarch 2017
canola suppressed establishment and growth of subsequent sorghum and other summer crops. 10
The production area of canola in northern NSW has increased in recent years, with canola becoming a more important and stable part of the farming system. Canola best management recommendations from the southern region are a useful starting point; however, they need to be fine-tuned and adapted for conditions and soil types in the northern region (NSW and Queensland). 11
a.1.4 hybridsA hybrid is a plant created by cross-pollinating male and female parents of different inbred lines. A hybrid has the benefit of heterosis (hybrid vigour). Hybrid canola generally has higher yield potential than traditional, inbred, open-pollinated varieties. This improved yield is achieved through a combination of superior traits such as larger seeds, leading to early vigour, and better stress tolerance. However, hybrid seed should never be retained for sowing because it will not produce true copies of the original hybrid plant. 12
Although the first canola hybrid was released in 1988, only recently have hybrids been grown on a large scale. Canola breeding of the future will focus more on hybrids.
The major global canola producers are China, the European Union, Canada and India. Canada is the major exporter and Japan and the European Union are the major importers. Australian canola competes with Canadian product in the international marketplace. Canola is the third most important winter grain crop in Australia, behind wheat and barley. 13
a.1.5 Domestic productionAustralian canola production has averaged ~1.4 Mt/year, ranging from 512,000 t to 2.46 Mt. The total Australian oilseed crush capacity is ~1.1 Mt, with much of this in the eastern states. Some 550,000–650,000 t of canola is crushed annually, with the main export markets for surplus seed being Japan, Pakistan, Bangladesh, China and the European Union.
The vast majority of canola oil is used in the food industry: about one-third in spreads and cooking oil, and two-thirds in the commercial food-service sector (Figure 2). About 20–25% of Australian canola oil is exported. Canola meal, the main byproduct of crushed canola, is used as a high-protein feed for intensive livestock, mainly in the pig, poultry and dairy industries.
10 JF Holland et al. Canola in the northern region: where are we up to? Australian Oilseeds Federation, http://www.australianoilseeds.com/__data/assets/pdf_file/0018/4446/CANOLA_IN_THE_NORTHERN_REGION_WHERE_ARE_WE_UP_TO.pdf
11 GRDC (2004) Canola nutrition in the northern region. GRDC Media Centre, Hot Topics, 28 April 2004, http://www.grdc.com.au/Media-Centre/Hot-Topics/Canola-nutrition-in-the-northern-region
12 GRDC (2010) Growing hybrid canola. GRDC Canola Fact Sheet, August 2010, https://www.grdc.com.au/~/media/D4B939DB8790453FB2D6CBD04CA11B78.pdf
13 D McCaffrey (2009) Introduction. In Canola best practice management guide for south-eastern Australia. (Eds D McCaffrey, T Potter, S Marcroft, F Pritchard) GRDC, http://www.grdc.com.au/uploads/documents/GRDC_Canola_Guide_All_1308091.pdf
i MORE INFORMATION
Ground Cover Radio 121: Future of oP canola hinges on grower support
xxviINtroDUctIoN
seCtioN a CANOLA
NORTHERNMarch 2017
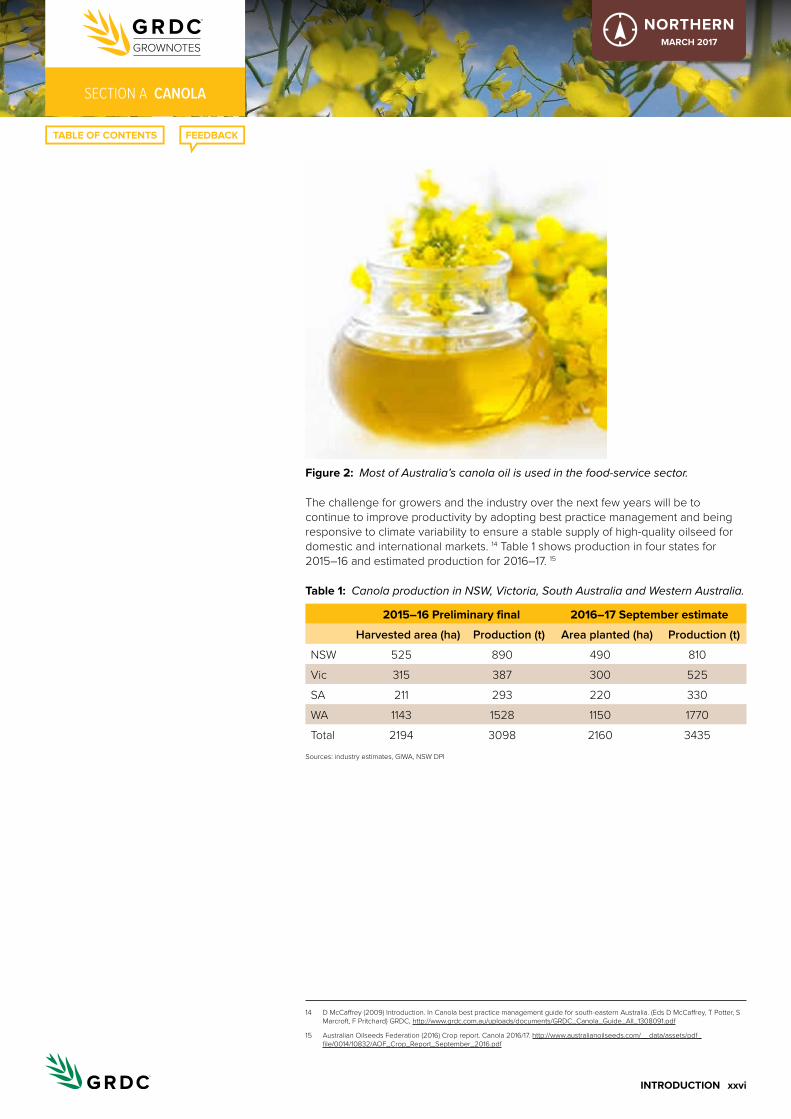
Figure 2: Most of Australia’s canola oil is used in the food-service sector.
The challenge for growers and the industry over the next few years will be to continue to improve productivity by adopting best practice management and being responsive to climate variability to ensure a stable supply of high-quality oilseed for domestic and international markets. 14 Table 1 shows production in four states for 2015–16 and estimated production for 2016–17. 15
table 1: Canola production in NSW, Victoria, South Australia and Western Australia.
2015–16 Preliminary final 2016–17 September estimate
Harvested area (ha) Production (t) Area planted (ha) Production (t)
NSW 525 890 490 810
Vic 315 387 300 525
SA 211 293 220 330
WA 1143 1528 1150 1770
Total 2194 3098 2160 3435Sources: industry estimates, GIWA, NSW DPI
14 D McCaffrey (2009) Introduction. In Canola best practice management guide for south-eastern Australia. (Eds D McCaffrey, T Potter, S Marcroft, F Pritchard) GRDC, http://www.grdc.com.au/uploads/documents/GRDC_Canola_Guide_All_1308091.pdf
15 Australian Oilseeds Federation (2016) Crop report. Canola 2016/17. http://www.australianoilseeds.com/__data/assets/pdf_file/0014/10832/AOF_Crop_Report_September_2016.pdf
1PlaNNINg/PaDDocK PreParatIoN
seCtioN 1 CANOLA
NORTHERNMarch 2017
Planning/Paddock preparation1.1 Paddock selection
In addition to early preparation and good crop management, success with canola cropping depends on careful paddock selection. The major considerations when selecting a paddock to grow canola in rotation with other crops are: • soil type• potential disease problems• previous herbicide use• broadleaf weeds.
Choosing more reliable and weed-free paddocks is the best option (Figure 1). It is desirable to soil test prior to sowing the crop and to continue to manage broadleaf and grass weeds prior to sowing. In the northern region growers need to soil test later the previous winter as nitrogen readings will change due to summer microbial breakdown and leaching.
When considering the rotation using crops such as wheat or barley prior to sowing canola will allow for increased broadleaf control through more herbicide options and increased crop competition. If a pulse is the prior crop, consider the use of herbicide-resistant varieties to manage broadleaf weeds. Well thought out weed control can have significant benefits, especially where problem weeds are difficult to control in canola. 1
Many growers are now growing canola to actually control weeds not able to be controlled in wheat. This is through use of Round Up ready or TT varieties.
Figure 1: Choosing more reliable and weed-free paddocks is the best option for canola.
1 P Parker (2009) Crop rotation and paddock selection. Ch. 4. In Canola best practice management guide for south-eastern Australia. (Eds D McCaffrey, T Potter, S Marcroft, F Pritchard) GRDC, http://www.grdc.com.au/uploads/documents/GRDC_Canola_Guide_All_1308091.pdf
2PlaNNINg/PaDDocK PreParatIoN
seCtioN 1 CANOLA
NORTHERNMarch 2017
1.1.1 Soil types Canola is adapted to a wide range of soil types. Whilst sandy soils can grow canola successfully particularly in areas with winter dominant rainfall, canola is best adapted to red-brown earths and clay soils. These soils generally have higher organic matter and inherent fertility. Canola has a high requirement for Nitrogen that will need to be met by fertiliser application in soils of lower fertility. Canola will perform best on neutral to alkaline soils, with good tilth. Paddocks with a uniform soil type will permit more even sowing depth and seedling emergence and more even crop ripening.
Avoid growing canola where the following problems occur.
Hardpans Although canola is a tap-rooted plant, it is not strong enough to penetrate some tight hardpans and can still suffer from ‘J’ rooting problems. Paddocks should be checked 12 months in advance by using a soil probe or by digging a small pit to visually assess a suspected problem and determine the depth of working or ripping that may be required to break up any hardpan.
Crusting soils The surface of a soil can crust after rainfall and reduce plant establishment if it is poorly structured with low organic matter levels, or a sodic clay that disperses after wetting. The use of gypsum and/or stubble retention on hardsetting sodic clay soils may improve seedling emergence and early growth.
Acid soils Canola is more susceptible to low pH and aluminium (Al) toxicity than most other crops. If you expect the pHCaCl2 to be <5.0, have the prospective canola paddock soil-tested in the previous winter. If acidic subsoil is suspected, take split samples of soil depths 0–10 and 10–20 cm. Where a pHCaCl2 <4.7 is combined with exchangeable Al level of ≥3%, do not grow canola before obtaining specific advice. Other indicators of acidity problems are poor growth in barley and lucerne, or if oats and triticale grow better than wheat. Consider using lime when the topsoil pHCaCl2 drops to <5.0.
Sodic subsoilsSoils with a sodic clay subsoil of low permeability become waterlogged when rainfall exceeds their infiltration capacity. A sodic subsoil problem can be identified by a simple soil testing procedure (dispersion test) backed up by laboratory chemical analysis. Avoid these soils unless they have a good depth of well-drained topsoil, which allows for adequate root growth even after heavy rainfall. Use of raised beds has been a successful strategy for reducing the impact of waterlogging in high-rainfall areas of south-western Victoria and Western Australia. 2
1.2 Paddock rotations and history
Optimising crop sequence is critical to maximising system efficiency and sustainability however there is no ‘one crop sequence’ fits all when it comes to profitable farming. 3 4
2 P Parker (2009) Crop rotation and paddock selection. Ch. 4. In Canola best practice management guide for south-eastern Australia. (Eds D McCaffrey, T Potter, S Marcroft, F Pritchard) GRDC, http://www.grdc.com.au/uploads/documents/GRDC_Canola_Guide_All_1308091.pdf
3 L Bell, J Whish, A Zull, P DeVoil, D Thornby (2016) High performance crop sequences for Southern Queensland. GRDC Update Papers 22 June 2016, https://grdc.com.au/Research-and-Development/GRDC-Update-Papers/2016/06/High-performance-crop-sequences-for-Southern-Queensland
4 T Somes (2016) Right crop sequence critical for farm sustainability. GRDC E-Newsletter 27 July 2016, https://grdc.com.au/Media-Centre/GRDC-E-Newsletters/Paddock-Practices/Right-crop-sequence-critical-for-farm-sustainability
i MORE INFORMATION
Climate and soils
i MORE INFORMATION
Canola best practice management guide for south-eastern australia
3PlaNNINg/PaDDocK PreParatIoN
seCtioN 1 CANOLA
NORTHERNMarch 2017
Canola can reduce but not eliminate the incidence of some cereal root and crown diseases, such as crown rot and take-all. Research has shown canola to be the most effective winter crop for reducing levels of crown rot in subsequent wheat crops. 5
Canola and lupins are two species that are not dependent on arbuscular mycorrhizal fungi (AMF) but also do not host the fungi. As a consequence, AMF levels after canola may be low and be of similar impact as a long fallow. 6 This may disadvantage subsequent crops that are highly dependent on AMF, particularly if environmental conditions and progressive fallows have also reduced AMF levels. Crops with a reliance on AMF include all commonly grown summer crops (sorghum, cotton, maize, sunflowers and the summer pulses) as well as faba beans and chickpeas.
Wheat, barley and oats have a lower dependence on AMF, and any reduction can be counteracted through additional phosphate fertiliser application. Because canola reduces AMF levels the same way as long fallows, it should be grown with short (about 6 months) fallows before and after.
Research has shown that wheat yield increases of ~0.6–1.0 t/ha can be expected when following canola compared with following wheat.
No-tillage, which retains more stubble, is increasing the carryover of many of the main cereal diseases, such as crown rot, in NSW. Canola fits well into this system by allowing an additional season for cereal stubble breakdown to occur, therefore reducing the carryover of disease.
Trials in the northern region have indicated that faba beans and canola are better break crops for crown rot than chickpeas. 7
Canola should not be included in the rotation more frequently than one in every four years. This reduces the potential for canola disease build-up and also allows for rotation of herbicide and weed control tactics. The use of triazine-tolerant (TT), imadozoline-tolerant (IT) and roundup ready (RR) canola systems can also be used strategically for hard to control weeds.
When planning cropping systems on the farm consider placement of future crops in relation to potential insect pest host crops. Rutherglen bugs may be present in large numbers on canola stubble around harvest time. These can readily move into neighbouring summer crops or crops planted directly into the canola stubble, causing serious damage. 8
Crop choice, more than crop sequence, remains a key element when evaluating how growers reduce their risk of root lesion nematode numbers in the paddock. Resistant winter crops, such as canola, are required to reduce risks in winter-dominated sequences. 9 10
1.2.1 canola as a break cropResults from experimentation undertaken in southern NSW between 2011 and 2013 have shown that canola and legume break crops can frequently be as profitable, and in a number of instances considerably more profitable, than wheat. Canola was consistently the most profitable break crop. However, legumes provide additional rotational benefits for subsequent crops by increasing soil N supply.
5 L Serafin, J Holland, R Bambach, D McCaffery (2005) Canola: northern NSW planting guide. NSW Department of Primary Industries, http://www.dpi.nsw.gov.au/__data/assets/pdf_file/0016/148300/canola-northern-NSW-planting-guide.pdf
6 A Mitchell, B Burton, R Daniel (2016) Sorghum following canola – Is there an issue? GRDC Update Papers 21 July 2016, https://grdc.com.au/Research-and-Development/GRDC-Update-Papers/2016/07/Is-there-an-issue-with-sorghum-following-canola
7 S Simpfendorfer (2016) Crown rot an update on latest research. GRDC Update Papers 24 July 2015, https://grdc.com.au/Research-and-Development/GRDC-Update-Papers/2015/07/Crown-rot-an-update-on-latest-research
8 L Serafin, J Holland, R Bambach, D McCaffery (2005) Canola: northern NSW planting guide. NSW Department of Primary Industries, http://www.dpi.nsw.gov.au/__data/assets/pdf_file/0016/148300/canola-northern-NSW-planting-guide.pdf
9 L Bell, J Whish, A Zull, P DeVoil, D Thornby (2016) High performance crop sequences for Southern Queensland. GRDC Update Papers 22 June 2016, https://grdc.com.au/Research-and-Development/GRDC-Update-Papers/2016/06/High-performance-crop-sequences-for-Southern-Queensland
10 T Somes (2016) Right crop sequence critical for farm sustainability. GRDC E-Newsletter 27 July 2016, https://grdc.com.au/Media-Centre/GRDC-E-Newsletters/Paddock-Practices/Right-crop-sequence-critical-for-farm-sustainability
i MORE INFORMATION
GRDC Update Paper: Likely fit of summer and winter forage crop options in Central West farming systems
i MORE INFORMATION
Choosing rotation crops—north
Canola—northern NsW planting guide
over the bar with better canola agronomy
Canola best practice management guide for south-eastern australia
Crown rot in winter cereals
i MORE INFORMATION
Melina Miles QDaF discusses Rutherglen bug. GRDC Radio (Northern Update) 106: safe seed storage strategy
4PlaNNINg/PaDDocK PreParatIoN
seCtioN 1 CANOLA
NORTHERNMarch 2017
Wheat following break crops was consistently more profitable than wheat on wheat. Sequences with canola were largely profitable due to the high returns from canola itself. Crop sequences involving legumes can be profitable due to increased wheat yields and lower costs of production. 11
1.3 Fallow weed control
Fallow management is important in all parts of NSW and Queensland. Whether winter- or summer-dominant rainfall the management of weeds throughout the summer has been found to directly add value to the next crop. This is achieved through the storage of moisture, particularly in soils with some clay content, but also by avoiding situations where weeds are tying up nutrients, hosting insect pests, or providing a green bridge for disease.
Weeds can affect crop yield either through direct competition or possibly as hosts for pathogens such as Sclerotinia. In particular, for canola, a number of Brassica weeds can cause significant problems.
Growers should be aware of the following important Brassica weeds when selecting a paddock for canola:• charlock (Sinapis arvensis)• wild radish (Raphanus raphanistrum)• wild or Mediterranean turnip (Brassica tournefortii)• wild cabbage or hare’s ear (Conringia orientalis).
Each of these weeds has a seed size similar to canola and they cannot be easily removed from canola grain samples. Because they contain ~50 times more erucic acid in the oil and ~10 times more glucosinolates in the seed than found in canola, any contamination could result in the crop being rejected at delivery because of the impact on oil and meal quality.
Other problem Brassica weeds have smaller seed than canola and they are usually removed during harvesting. These include shepherd’s purse (Capsella bursa-pastoris), turnip weed (Rapistrum rugosum), musk weed (Myagrum perfoliatum) and the mustards (Sisymbrium spp.). These weeds reduce yield through competition; for example, shepherd’s purse may be a problem weed of canola grown after a pasture phase.
If sowing canola into paddocks where any of these Brassica weeds are present, select an appropriate, herbicide-resistant variety. Growing TT, Clearfield® or Roundup Ready® canola allows problem broadleaf weeds to be managed. However, eradicating problem weeds or reducing their seed populations prior to sowing is preferable. 12
Paddocks usually have multiple weed species present at one time, making weed-control decisions more difficult and often involving a compromise after assessment of the prevalence of key weed species. Knowledge of your paddock and controlling weeds as early as possible are important for good control of fallow weeds. Information is included for the most common problem weeds; however, for advice on individual paddocks, contact your agronomist.
Benefits of fallow weed control are significant:• Conservation of summer rain and fallow moisture, which can include moisture
stored from last winter or the summer before in a long fallow, is integral to winter cropping in the northern region, particularly as the climate moves towards summer-dominant rainfall.
The GRDC funded Northern Grower Alliance (NGA) is trialing methods to control summer grasses. Key findings include:
11 T Swan, L Goward, J Hunt & M Peoples, T Pratt (2015) Impact of crop rotations on profit, nitrogen and ryegrass seed bank in crop sequences in southern NSW. GRDC Update Papers 28 July 2015, https://grdc.com.au/Research-and-Development/GRDC-Update-Papers/2015/07/Impact-of-crop-rotations-on-profit-nitrogen-and-ryegrass-seed-bank-in-crop-sequences-in-southern-NSW
12 P Parker (2009) Crop rotation and paddock selection. Ch. 4. In Canola best practice management guide for south-eastern Australia. (Eds D McCaffrey, T Potter, S Marcroft, F Pritchard) GRDC, http://www.grdc.com.au/uploads/documents/GRDC_Canola_Guide_All_1308091.pdf
i MORE INFORMATION
GRDC Update Paper: herbicide residues in soils – are they an issue? (Northern)
i MORE INFORMATION
Canola volunteer control guide
i MORE INFORMATION
GRDC integrated Weed Management Manual
summer fallow spraying

5PlaNNINg/PaDDocK PreParatIoN
seCtioN 1 CANOLA
NORTHERNMarch 2017
1. Glyphosate-resistant and -tolerant weeds are a major threat to reduced tillage cropping systems.
2. Although residual herbicides will limit re-cropping options and will not provide complete control, they are a key part of successful fallow management.
3. Double-knock herbicide strategies (sequential application of two different weed-control tactics) are useful but the herbicide choices and optimal timings will vary with weed species.
4. Other weed-management tactics can be incorporated, for example crop competition, to assist herbicide control.
5. Cultivation may need to be considered as a salvage option to avoid seedbank salvage.
Double-knock strategiesDouble-knock refers to the sequential application of two different weed-control tactics applied in such a way that the second tactic controls any survivors of the first. Most commonly used for pre-sowing weed control, this concept can also be applied in-crop. 13
Consider the species present, interval timing and water rate. For information on double-knock tactics, download the GRDC Herbicide Application Fact Sheet: Effective double knock herbicide applications northern region.
Double-knock herbicide strategies are useful for managing difficult-to-control weeds but there is no ‘one size fits all’ treatment.
The interval between double-knock applications is a major management issue for growers and contractors. Shorter intervals can be consistently used for weeds where herbicides appear to be translocated rapidly (e.g. awnless barnyard grass, ABYG) or when growing conditions are very favourable. Longer intervals are needed for weeds where translocation appears slower (e.g. fleabane, feathertop Rhodes grass and windmill grass).
Critical factors for successful double-knock approaches are for the first application to be on small weeds and to ensure good coverage and adequate water volumes, particularly when using products containing paraquat. Double-knock strategies are not fail-proof and rarely effective for salvage weed-control situations unless environmental conditions are exceptionally favourable.
Important weeds in northern cropping systemsWeed management, particularly in reduced tillage fallows, has become an increasingly complex and expensive part of cropping in the northern grains region. Heavy reliance on glyphosate has selected for species that were naturally more glyphosate-tolerant or has selected for glyphosate-resistant populations.
13 C Borger, V Stewart, A Storrie. Double knockdown or ‘double knock’. Department of Agriculture and Food Western Australia.
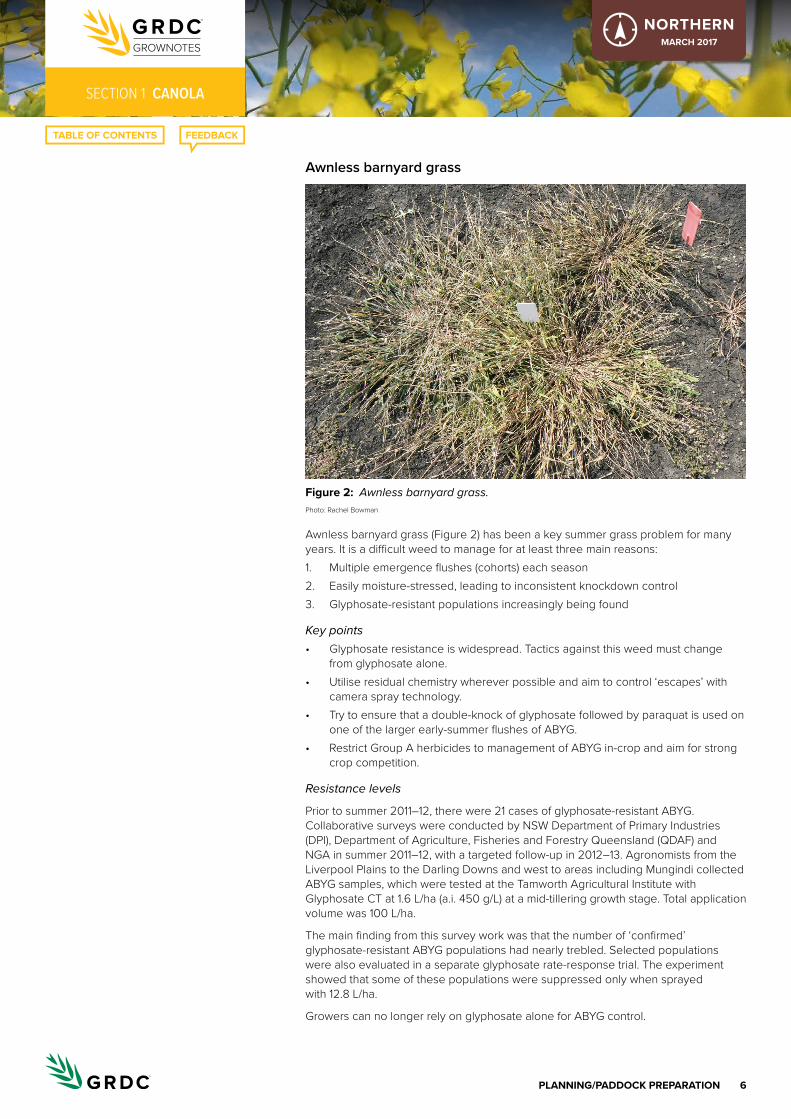
6PlaNNINg/PaDDocK PreParatIoN
seCtioN 1 CANOLA
NORTHERNMarch 2017
Awnless barnyard grass
Figure 2: Awnless barnyard grass. Photo: Rachel Bowman
Awnless barnyard grass (Figure 2) has been a key summer grass problem for many years. It is a difficult weed to manage for at least three main reasons:1. Multiple emergence flushes (cohorts) each season2. Easily moisture-stressed, leading to inconsistent knockdown control3. Glyphosate-resistant populations increasingly being found
Key points• Glyphosate resistance is widespread. Tactics against this weed must change
from glyphosate alone.• Utilise residual chemistry wherever possible and aim to control ‘escapes’ with
camera spray technology.• Try to ensure that a double-knock of glyphosate followed by paraquat is used on
one of the larger early-summer flushes of ABYG.• Restrict Group A herbicides to management of ABYG in-crop and aim for strong
crop competition.
Resistance levels
Prior to summer 2011–12, there were 21 cases of glyphosate-resistant ABYG. Collaborative surveys were conducted by NSW Department of Primary Industries (DPI), Department of Agriculture, Fisheries and Forestry Queensland (QDAF) and NGA in summer 2011–12, with a targeted follow-up in 2012–13. Agronomists from the Liverpool Plains to the Darling Downs and west to areas including Mungindi collected ABYG samples, which were tested at the Tamworth Agricultural Institute with Glyphosate CT at 1.6 L/ha (a.i. 450 g/L) at a mid-tillering growth stage. Total application volume was 100 L/ha.
The main finding from this survey work was that the number of ‘confirmed’ glyphosate-resistant ABYG populations had nearly trebled. Selected populations were also evaluated in a separate glyphosate rate-response trial. The experiment showed that some of these populations were suppressed only when sprayed with 12.8 L/ha.
Growers can no longer rely on glyphosate alone for ABYG control.
7PlaNNINg/PaDDocK PreParatIoN
seCtioN 1 CANOLA
NORTHERNMarch 2017
Residual herbicides (fallow and in-crop)
Several active ingredients are registered for use in summer crops, e.g. metolachlor (e.g. Dual Gold®) and atrazine, or fallow, e.g. imazapic (e.g. Flame®), and these provide useful management of ABYG. The new fallow registration of isoxaflutole (Balance®) can provide useful suppression of ABYG, but this herbicide has stronger activity against other problem weed species. Few (if any) residuals give consistent, complete control. However, they are important tools that need to be considered to reduce the weed population exposed to knockdown herbicides, as well as to alternate the herbicide chemistry being employed. Use of residuals together with camera spray technology (for escapes) can be a very effective strategy in fallow.
Double-knock control
This approach uses two different tactics applied sequentially. In reduced-tillage situations, it is frequently glyphosate applied first, followed by a paraquat-based spray as the second application or ‘knock’. Trials to date have shown that glyphosate followed by paraquat gives effective control, even on glyphosate-resistant ABYG. Note that the most effective results will be achieved from paraquat-based sprays by using higher total application volumes (100 L/ha) and finer spray quality and by targeting seedling weeds.
Several Group A herbicides, e.g. Verdict® and Select®, are effective on ABYG but should be used in registered summer crops such as mungbeans. Even on glyphosate-resistant ABYG, a double-knock of glyphosate followed by paraquat is an effective tool. In the same situations, there has been little benefit from a Group A followed by paraquat application. Note that Group A herbicides appear more sensitive to ABYG moisture stress. Application on larger, mature weeds can result in very poor efficacy.
Timing of the paraquat application for ABYG control has generally proven flexible. The most consistent control is obtained from a delay of ~3–5 days, when lower rates of paraquat can also be used. Longer delays may be warranted when ABYG is still emerging at the first application timing; shorter intervals are generally required when weed size is larger or moisture-stress conditions are expected. High levels of control can still be obtained with larger weeds but paraquat rates will need to be increased to 2.0 or 2.4 L/ha.

8PlaNNINg/PaDDocK PreParatIoN
seCtioN 1 CANOLA
NORTHERNMarch 2017
Flaxleaf fleabane
Figure 3: Flaxleaf fleabane. Photo: QDAF
There are three main species of fleabane in Australia: Conyza bonariensis (flaxleaf fleabane; Figure 3), C. canadensis (Canadian fleabane) and C. albida (tall fleabane). There are two varieties of C. canadensis: var. canadensis and var. pusilla. Of the three species, flaxleaf fleabane is the most common across Australia. 14
For more than a decade, flaxleaf fleabane has been the major weed-management issue in the northern cropping region, particularly in reduced-tillage systems. Fleabane is a wind-borne, surface-germinating weed that thrives in situations of low competition. Germination flushes typically occur in autumn and spring when surface-soil moisture levels stay high for a few days. However, emergence can occur at nearly all times of the year.
An important issue with fleabane is that knockdown control of large plants in the summer fallow is variable and can be expensive due to reduced control rates.
Key points • Utilise residual chemistry wherever possible and aim to control ‘escapes’ with
camera spray technology.• This weed thrives in situations of low competition; avoid wide row cropping
unless effective residual herbicides are included.• 2,4-D is a crucial tool for consistent double-knock control.• Successful growers have increased their focus on fleabane management
in winter (crop or fallow) to avoid expensive and variable salvage control in the summer.
Resistance levels
Glyphosate resistance has been confirmed in fleabane. There is great variability in the response of fleabane to glyphosate with many samples from non-cropping areas still well controlled by glyphosate, whereas fleabane from reduced-tillage cropping situations shows increased levels of resistance. The most recent survey has focused on non-cropping situations, with a large number of resistant populations found on
14 M Widderick, H Wu. Fleabane. Department of Agriculture and Food Western Australia.
9PlaNNINg/PaDDocK PreParatIoN
seCtioN 1 CANOLA
NORTHERNMarch 2017
roadsides and railway lines where glyphosate alone has been the principal weed-management tool employed.
Residual herbicides (fallow and in-crop)
One of the most effective strategies to manage fleabane is the use of residual herbicides during fallow or in-crop. Trials have consistently shown good efficacy from a range of residual herbicides commonly used in sorghum, cotton, chickpeas and winter cereals. There are now at least two registrations for residual fleabane management in fallow.
Additional product registrations for in-crop knockdown and residual herbicide use, particularly in winter cereals, are being sought. A range of commonly used winter cereal herbicides exists with useful knockdown and residual fleabane activity. Trials to date have indicated that increasing water volumes from 50 to 100 L/ha may improve the consistency of residual control, with application timing to ensure good herbicide–soil contact also important.
Knockdown herbicides (fallow and in-crop)
Group I herbicides have been the major products for fallow management of fleabane, with 2,4-D amine the most consistent herbicide evaluated. Despite glyphosate alone generally giving poor control of fleabane, trials have consistently shown a benefit from tank mixing 2,4-D amine and glyphosate in the first application. Amicide® Advance at 0.65–1.1 L/ha mixed with Roundup® Attack at a minimum of 1.15 L/ha and then followed by Nuquat® at 1.6–2.0 L/ha is a registered option for fleabane knockdown in fallow. Sharpen® is a product with Group G mode of action. It is registered for fallow control when mixed with Roundup® Attack at a minimum of 1.15 L/ha but only on fleabane up to a maximum stage of six leaves.
For more information on label rates, visit: Australian Pesticides and Veterinary Medicines Authority.
Double-knock control
The most consistent and effective double-knock control of fleabane has included 2,4-D in the first application followed by paraquat as the second. Glyphosate alone followed by paraquat will result in high levels of leaf desiccation but plants will nearly always recover.
Timing of the second application in fleabane is generally aimed at ~7–14 days after the first application. However, the interval to the second knock appears quite flexible. Increased efficacy is obtained when fleabane is actively growing or if rosette stages can be targeted. Although complete control can be obtained in some situations (e.g. summer 2012–13), control levels will frequently reach only ~70–80%, particularly when targeting large, flowering fleabane under moisture-stressed conditions. The high cost of fallow double-knock approaches and inconsistency in control level of large, mature plants are good reasons to focus on proactive fleabane management at other growth stages.
i MORE INFORMATION
australian glyphosate resistance register: summary
i MORE INFORMATION
Flaxleaf fleabane—a weed best management guide
integrated Weed Management of Feathertop Rhodes Grass 2014

10PlaNNINg/PaDDocK PreParatIoN
seCtioN 1 CANOLA
NORTHERNMarch 2017
Feathertop Rhodes grass
Figure 4: Feathertop Rhodes grass. Photo: Rachel Bowman
Feathertop Rhodes grass (Figure 4) has emerged as an important weed-management issue in southern Queensland and northern NSW since ~2008. This is another small-seeded weed species that germinates on, or close to, the soil surface. It has rapid early growth rates and can become moisture-stressed quickly. Although FTR is well established in central Queensland, it remains largely an ‘emerging’ threat further south. Patches should be aggressively treated to avoid whole-of-paddock blowouts.
Key points• Glyphosate alone or glyphosate followed by paraquat has generally
poor efficacy.• Utilise residual chemistry wherever possible and aim to control ‘escapes’ with
camera spray technology.• A double-knock of Verdict® followed by paraquat can be used in Queensland
prior to planting mungbeans where large spring flushes of FTR occur.• Treat patches aggressively, even with cultivation, to avoid paddock blowouts.
Residual herbicides (fallow and in-crop)
This weed is generally poorly controlled by glyphosate alone, even when sprayed under favourable conditions at the seedling stage. Trials have shown that residual herbicides generally provide the most effective control, a similar pattern to that seen with fleabane. Currently registered residual herbicides are being screened and offer promise for both fallow and in-crop situations. The only product currently registered for FTR control is Balance® (isoxaflutole) at 100 g/ha for fallow use.
Double-knock control
Although a double-knock of glyphosate followed by paraquat is an effective strategy on ABYG, the same approach is variable and generally disappointing for FTR management. By contrast, a small number of Group A herbicides (all members of the ‘fop’ class) can be effective against FTR but need to be managed within a number of constraints:• Although they can provide high levels of efficacy on fresh and seedling FTR, they
need to be followed by a paraquat double-knock to get consistent, high levels of final control.
• Group A herbicides have a high risk of resistance selection, again requiring follow-up with paraquat.
• Many Group A herbicides have plant-back restrictions to cereal crops.

11PlaNNINg/PaDDocK PreParatIoN
seCtioN 1 CANOLA
NORTHERNMarch 2017
• Group A herbicides are generally successful at a narrower range of weed growth stages than herbicides such as glyphosate; that is, Group A herbicides will generally give unsatisfactory results on flowering and/or moisture-stressed FTR.
• Not all Group A herbicides are effective on FTR.
For information on a permit (PER12941) issued for Queensland only for the control of FTR in summer fallow situations prior to planting mungbeans, see: Australian Pesticides and Veterinary Medicines Authority.
Timing of the second application for FTR is still being refined, but application at ~7–14 days generally provides the most consistent control. Application of paraquat at shorter intervals can be successful, when the Group A herbicide is translocated rapidly through the plant, but has resulted in more variable control in field trials. Good control can often be obtained up to 21 days after the initial application.
Windmill grass
Figure 5: Windmill grass. Photo: Maurie Street
Whereas FTR has been a grass-weed threat coming from Queensland and moving south, windmill grass is more of a problem in central NSW but is spreading north. Windmill grass (Figure 5) is a perennial, native species found throughout northern NSW and southern Queensland. The main cropping threat appears to be from the selection of glyphosate-resistant populations, with control of the tussock stage providing greatest management challenges.
Key points• Glyphosate alone or glyphosate followed by paraquat has generally
poor efficacy.• Preliminary data suggest that residual chemistry may provide some benefit.• A double-knock of quizalofop-p-ethyl (e.g. Targa®) followed by paraquat can be
used in NSW.
Resistance levels
Glyphosate resistance has been confirmed in windmill grass with three documented cases in NSW, all located west of Dubbo. Glyphosate-resistant populations of windmill grass in other states have all been collected from roadsides, but in Central West NSW, two were from fallow paddock situations.
12PlaNNINg/PaDDocK PreParatIoN
seCtioN 1 CANOLA
NORTHERNMarch 2017
Residual herbicides (fallow and in-crop)
Preliminary trials have shown a range of residual herbicides with useful levels of efficacy against windmill grass. These herbicides have potential for both fallow and in-crop situations. Currently, there are no products registered for residual control of windmill grass.
Double-knock control
Similar to FTR, a double-knock of a Group A herbicide followed by paraquat has provided clear benefits compared with the disappointing results usually achieved by glyphosate followed by paraquat. Constraints apply to double-knock for windmill grass control similar to those for FTR.
For information on a permit for NSW only for the control of windmill grass in summer fallow situations, visit: Australian Pesticides and Veterinary Medicines Authority.
Timing of the second application for windmill grass is still being refined, but application at ~7–14 days generally provides the most consistent control. Application of paraquat at shorter intervals can be successful, when the Group A herbicide is translocated rapidly through the plant, but has resulted in more variable control in field trials and has been clearly antagonistic when the interval is ≤1 day. Good control can often be obtained up to 21 days after the initial application. 15
1.4 herbicide plant-back periods
Canola is particularly susceptible to a range of residual herbicides. Under dry seasonal conditions or in alkaline soils, residues from a herbicide applied to a previous pulse or cereal crop can persist into the next cropping season. For example, the sulfonylurea group (e.g. chlorsulfuron, sulfosulfuron) used in cereal crops have a canola plant-back period of 24–30 months. Similarly, some herbicides registered in pulse crops can have plant-back periods ranging from 9 months (simazine) to 24 months (flumetsulam) to 34 months (imazethapyr). The use of these herbicides can therefore restrict crop options and prevent the sowing of canola for up to 3 years. The use of various herbicide-tolerant (TT or Clearfield®) canola varieties coupled with their companion herbicides (triazines or Group B herbicides) can restrict crop-selection options in the following year. Plant-back periods are provided on herbicide labels for sensitive crops under these conditions. 16
Plant-back periods do not begin until there has been a significant rainfall event.
Plant-back periods are the obligatory times between the herbicide spraying date and safe planting date of a subsequent crop.
Soil behaviour of pre-emergent herbicides in Australian farming systems: a reference manual for agronomic advisers
Some herbicides have a long residual. The residual is not the same as the half-life. Although the amount of chemical in the soil may break down rapidly to half the original amount, what remains can persist for long periods, as is the case for sulfonylureas (chlorsulfuron) (see Table 1). Herbicides with long residuals can affect subsequent crops, especially if they are effective at low levels of active ingredient, such as the sulfonylureas. On labels, this will be shown by plant-back periods, which are usually listed under a separate heading or under ‘Protection of crops etc.’ in the ‘General Instructions’ section of the label. 17
15 R Daniel (2013) Weeds and resistance—considerations for awnless barnyard grass, Chloris spp. and fleabane management. Northern Grower Alliance, http://www.nga.org.au/module/documents/download/225
16 P Parker (2009) Crop rotation and paddock selection. Ch. 4. In Canola best practice management guide for south-eastern Australia. (Eds D McCaffrey, T Potter, S Marcroft, F Pritchard) GRDC, http://www.grdc.com.au/uploads/documents/GRDC_Canola_Guide_All_1308091.pdf
17 B Haskins (2012) Using pre-emergent herbicides in conservation farming systems. NSW Department of Primary Industries, http://www.dpi.nsw.gov.au/__data/assets/pdf_file/0003/431247/Using-pre-emergent-herbicides-in-conservation-farming-systems.pdf
i MORE INFORMATION
herbicide resistance in summer grasses
i MORE INFORMATION
Ground Cover Radio 122: Northern region extension
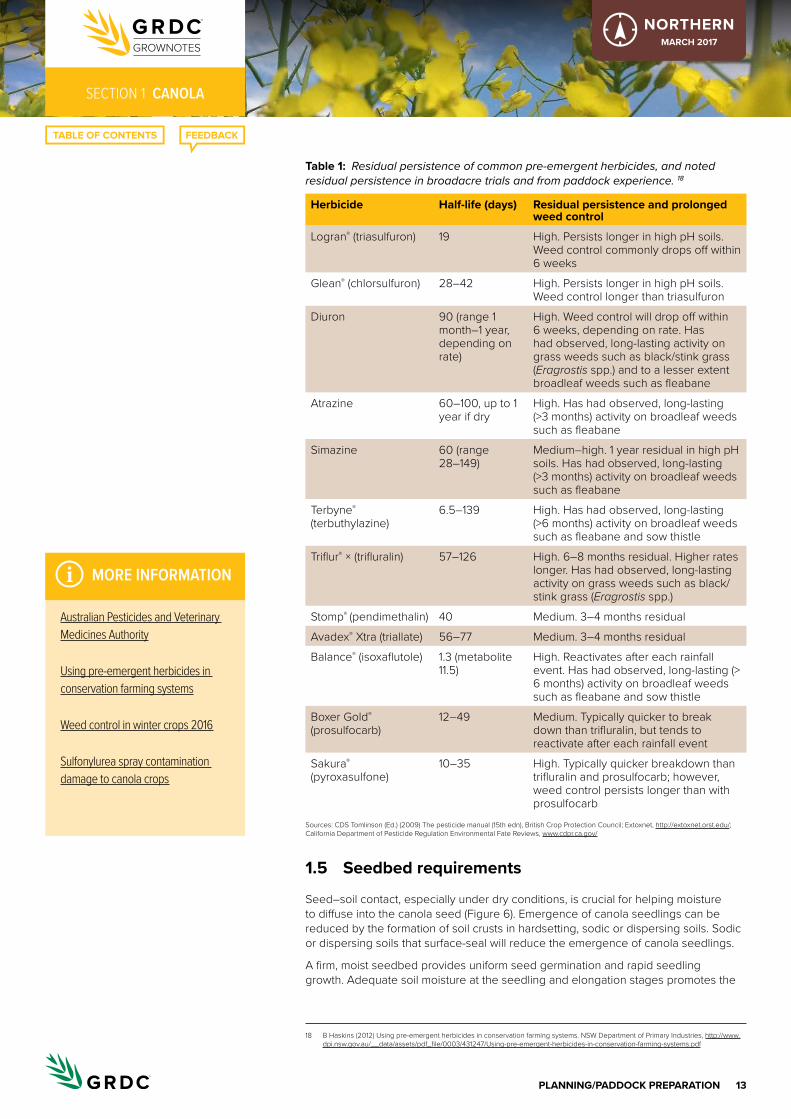
13PlaNNINg/PaDDocK PreParatIoN
seCtioN 1 CANOLA
NORTHERNMarch 2017
table 1: Residual persistence of common pre-emergent herbicides, and noted residual persistence in broadacre trials and from paddock experience. 18
herbicide half-life (days) residual persistence and prolonged weed control
Logran® (triasulfuron) 19 High. Persists longer in high pH soils. Weed control commonly drops off within 6 weeks
Glean® (chlorsulfuron) 28–42 High. Persists longer in high pH soils. Weed control longer than triasulfuron
Diuron 90 (range 1 month–1 year, depending on rate)
High. Weed control will drop off within 6 weeks, depending on rate. Has had observed, long-lasting activity on grass weeds such as black/stink grass (Eragrostis spp.) and to a lesser extent broadleaf weeds such as fleabane
Atrazine 60–100, up to 1 year if dry
High. Has had observed, long-lasting (>3 months) activity on broadleaf weeds such as fleabane
Simazine 60 (range 28–149)
Medium–high. 1 year residual in high pH soils. Has had observed, long-lasting (>3 months) activity on broadleaf weeds such as fleabane
Terbyne® (terbuthylazine)
6.5–139 High. Has had observed, long-lasting (>6 months) activity on broadleaf weeds such as fleabane and sow thistle
Triflur® × (trifluralin) 57–126 High. 6–8 months residual. Higher rates longer. Has had observed, long-lasting activity on grass weeds such as black/stink grass (Eragrostis spp.)
Stomp® (pendimethalin) 40 Medium. 3–4 months residual
Avadex® Xtra (triallate) 56–77 Medium. 3–4 months residual
Balance® (isoxaflutole) 1.3 (metabolite 11.5)
High. Reactivates after each rainfall event. Has had observed, long-lasting (> 6 months) activity on broadleaf weeds such as fleabane and sow thistle
Boxer Gold® (prosulfocarb)
12–49 Medium. Typically quicker to break down than trifluralin, but tends to reactivate after each rainfall event
Sakura® (pyroxasulfone)
10–35 High. Typically quicker breakdown than trifluralin and prosulfocarb; however, weed control persists longer than with prosulfocarb
Sources: CDS Tomlinson (Ed.) (2009) The pesticide manual (15th edn), British Crop Protection Council; Extoxnet, http://extoxnet.orst.edu/; California Department of Pesticide Regulation Environmental Fate Reviews, www.cdpr.ca.gov/
1.5 Seedbed requirements
Seed–soil contact, especially under dry conditions, is crucial for helping moisture to diffuse into the canola seed (Figure 6). Emergence of canola seedlings can be reduced by the formation of soil crusts in hardsetting, sodic or dispersing soils. Sodic or dispersing soils that surface-seal will reduce the emergence of canola seedlings.
A firm, moist seedbed provides uniform seed germination and rapid seedling growth. Adequate soil moisture at the seedling and elongation stages promotes the
18 B Haskins (2012) Using pre-emergent herbicides in conservation farming systems. NSW Department of Primary Industries, http://www.dpi.nsw.gov.au/__data/assets/pdf_file/0003/431247/Using-pre-emergent-herbicides-in-conservation-farming-systems.pdf
i MORE INFORMATION
australian Pesticides and Veterinary Medicines authority
Using pre-emergent herbicides in conservation farming systems
Weed control in winter crops 2016
sulfonylurea spray contamination damage to canola crops

14PlaNNINg/PaDDocK PreParatIoN
seCtioN 1 CANOLA
NORTHERNMarch 2017
development of a strong, healthy plant less prone to lodging and with maximum leaf growth by the end of July. 19
Figure 6: The hard canola seed needs good seed–soil contact to germinate.
1.6 Soil moisture
Soil moisture is vital for both germination and emergence. Canola must absorb a high percentage of its weight in water before germination begins. It will germinate when the seed moisture content has risen to approximately 24%.
Water absorption is a passive process. The ability of seeds to absorb water depends on the difference in water potential between the seed and the surrounding soil. Seeds can absorb water even at very low soil-water potentials, but low water potentials may induce secondary dormancy.
Seed size influences the rate of water absorption. Small seeds have a high surface-to-volume ratio, which means that less time is required to absorb adequate moisture for germination.
In soils with a low moisture content, the germination rate will be lower and emergence slower (Table 2).
table 2: Effect of soil moisture content on final emergence percentage and days to 50% emergence.
total soil water content (% weight)
Final emergence percentage
Days to 50% emergence
18 82 9
15 59 12
13 45 13
11 4 –Source: Modified from Canola Council of Canada (2003)
The trial was established in a growth chamber at constant day–night temperatures of 8.5°C–10°C. In summary:• The higher the total soil water content, the higher the final germination
percentage. • The higher the soil water content, the quicker the time to 50% seedling
emergence. 20
19 J Edwards, K Hertel (2011) Canola growth and development. PROCROP Series. NSW Department of Primary Industries, http://www.dpi.nsw.gov.au/__data/assets/pdf_file/0004/516181/Procrop-canola-growth-and-development.pdf
20 J Edwards, K Hertel (2011) Canola growth and development. PROCROP Series. NSW Department of Primary Industries, http://www.dpi.nsw.gov.au/__data/assets/pdf_file/0004/516181/Procrop-canola-growth-and-development.pdf
i MORE INFORMATION
Canola best practice management guide for south-eastern australia
Lifting productivity in retained stubble systems
i MORE INFORMATION
soilWaterapp – a new tool to measure and monitor soil water
GRDC Update Paper: Commonly asked questions about soil water and soil management

15PlaNNINg/PaDDocK PreParatIoN
seCtioN 1 CANOLA
NORTHERNMarch 2017
Water is essential for plant growth. Adequate soil moisture: • promotes root growth • promotes a large, abundant leaf area • helps plants to retain their leaves longer • lengthens the flowering period • increases the numbers of branches per plant, flowers forming pods and
seeds per pod• increases seed weight and seed yield.
Moisture stress is more important during podfill than at the vegetative stage. However, too much or too little water at any growth stage reduces yield potential. Factors that may limit yield include: • the amount of moisture stored in the soil over summer• the rate and duration and timing of rainfall during the growing season • the ability of the soil to absorb water, store it, and make it available for plants.
Modifying some of these factors can improve moisture availability and efficiency of water use.
When soil water and nutrients are abundant, the balance of root to stem and leaf growth typically shifts in favour of stem growth at the expense of roots. When water is limited, the opposite usually occurs. Roots account for ~25% of plant dry matter at stem elongation in moisture-stressed canola, compared with ~20% in unstressed plants.
1.6.1 Moisture stress during rosette formation and elongation Canola has limited ability to withstand severe drought. To avoid dehydration, the plant closes its stomata and rapidly sheds leaves.
Moisture stress during the early vegetative stages reduces the ability of stomata to conduct carbon dioxide and therefore slows photosynthesis. This in turn reduces leaf area expansion and dry matter production. It also limits root growth, which reduces nutrient uptake. More severe water deficits inhibit photosynthesis because of cell and chloroplast shrinkage.
This is important in seasons with dry winters. It is also important in low-rainfall areas where the period of crop growth is restricted at the start of the season by lack of rainfall and at the end of the season by water deficits and high temperatures.
Plants under early-season moisture stress will usually recover normal growth with subsequent rainfall or irrigation. Stressed plants are able to recover leaf area, form flowers, set pods and fill seeds when water becomes available, but with hastened development rates, crops have early maturity and lower yields. The worst time for drought stress in canola is during stem elongation or flowering.
Long periods of drought will reduce yields more than frequent, short periods of drought. The impact will be greatest on coarse-textured soils and shallow soils with low water-storage capacity.
Adequate soil moisture tends to lengthen the number of days to maturity by up to 10 days. Additional soil moisture will result in no further increase in yield and may cause yield reductions through poor soil aeration and/or increased lodging and diseases. 21
21 J Edwards, K Hertel (2011) Canola growth and development. PROCROP Series. NSW Department of Primary Industries, http://www.dpi.nsw.gov.au/__data/assets/pdf_file/0004/516181/Procrop-canola-growth-and-development.pdf
i MORE INFORMATION
how spring planted canola can work in a graze and grain system
Yield of wheat and canola in the high rainfall zone of south-western australia in years with and without a transient perched water table

16PlaNNINg/PaDDocK PreParatIoN
seCtioN 1 CANOLA
NORTHERNMarch 2017
1.7 Yield and targets
Average canola yields in NSW vary over a range of around 1 t/ha in the drier regions but up to 3–4 t/ha in the more favourable growing areas or on irrigation. Canola has traditionally yielded approximately half of what wheat would yield in the same situation. Said another way it achieves only half the Water Use Efficiency of that of wheat (kg of grain per mm of water available).
With improved varieties, agronomy and management of the crop many farmers are now targeting 60–70% of typical wheat yields.
As discussed in Section 2, varieties vary in yield performances. However, several generalisations can be made:• TT varieties will often perform less well than conventional, Clearfield or Roundup
Ready varieties as there is a fitness penalty integral to breeding herbicide tolerance. This is often referred to as yield drag and quoted as up to 15% compared to conventional varieties. However some agronomists believe this is over-estimated in some regions and it must be remembered that the TT tolerance allows control of weeds that could otherwise not be controlled. TT varieties often have less seedling vigour which can hinder establishment and this can have ramifications through to harvest.
• Hybrid varieties generally have higher yield potential than open pollinated varieties. This is achieved through the hybridization process, enabling coupling of strong and desirable traits from the parent varieties. Many breeding or seed companies are also investing greater effort into hybrid varieties as gains are easier and quicker to achieve as well in ensures seed sales each year.
• GMO varieties, specifically Round Up Ready or glyphosate-tolerant varieties, promise improved yield potential and performance but at present these varieties are achieving only average performance, not withstanding weed management benefits.
In setting yield targets or expectations, growers also need to take into account sowing date, seasonal conditions (particularly rainfall and fallow moisture) and disease and pests. In southern regions Blackleg, and more sporadically Sclerotina, can impact heavily on crop performance but the northern region does not seem to experience the same level of disease particularly Blackleg so this should not in many cases be too much of a yield barrier.
1.7.1 Seasonal outlookThe NSW DPI provides a seasonal outlook to assist grain growers. The Seasonal Conditions and Climate Change Summary e-newsletter will let you know as soon as the monthly report is published. Subscribe now.
1.7.2 Fallow moisture efficiencyLike wheat, canola will benefit from stored subsoil moisture, particularly in marginal cropping areas where winter and spring rainfall is unreliable. Manage fallows efficiently to maximise the amount of moisture at sowing. 22
Key points• While ~20% of rain is stored during fallows, small changes in soil management
can improve this apparent low efficiency and have large impacts on profit.• Water stored can be improved through longer fallow, weed control, soil cover
and reduced compaction. This can be achieved through reduced tillage, controlled traffic and planting crops before the soil fills.
• Stubble retention combined with reduced or zero tillage almost universally results in better water storage.
22 L Jenkins (2009) Crop establishment. Ch. 5. In Canola best practice management guide for south-eastern Australia. (Eds D McCaffrey, T Potter, S Marcroft, F Pritchard) GRDC, http://www.grdc.com.au/uploads/documents/GRDC_Canola_Guide_All_1308091.pdf
i MORE INFORMATION
NsW climate summary
seasonal crop outlook—wheat
Grain marketing—wheat, canola and barley outlook
agribusiness outlook 2015
Canola agronomy research in central NsW
irrigated canola - Management for high yields
Growing hybrid canola
i MORE INFORMATION
Ground Cover Radio 117: Ground Cover supplement - incrop canola management
Ground Cover Radio 121: Future of oP canola hinges on grower support
GRDC Update Paper: irrigation cropping - can we afford the water?
GRDC Update Paper: irrigated cropping project results
GRDC Update Paper: the irrigated cereal and canola project update
GRDC Update Paper: achieving 10 t ha of irrigated wheat and 4 t ha of irrigated canola in the Murrumbidgee Valley region

17PlaNNINg/PaDDocK PreParatIoN
seCtioN 1 CANOLA
NORTHERNMarch 2017
• Better water storage results in better yields, especially in dry years.• Soil water and N mineralisation can be tracked using a number of decision
support tools (e.g. Australian CliMate, Soil Water App, Yield Prophet). 23
1.7.3 Nitrogen- and Water Use efficiencyNitrogen fertiliser can increase the Water Use Efficiency (WUE) of early-sown canola. The additional N enables the crop to cover the ground quicker and develop a dense leaf canopy, resulting in reduced soil evaporation and better WUE. 24
Nitrogen fertiliser is one of the most significant input costs for northern grain growers, so understandably growers want to minimise applied nitrogen losses through better management to maximise return on investment.
Key points• Nitrogen is a mobile nutrient and can be lost downwards (leaching), sidewards
(erosion) and upwards (gas emissions).• To reduce losses avoid unnecessarily high nitrogen rates.• Delay or split nitrogen fertiliser application so that peak nitrogen availability
coincides with peak crop demand.• Using legumes in crop rotations will also reduce nitrogen losses. 25
1.7.4 estimating maximum yield per unit water use by location and nitrogenResearchers propose a three-step procedure to derive the ‘slope’ parameter representing maximum yield per unit water use accounting for N and location.
Figure 7:
Nitrogen supply (kg N/ha)0 50 100 150 200 250
0
4
8
12
16
20
24(a)
-44-42-40-38-36-34-32-30-28-26-24-221012141618
202224 (b)
Latitude
Max
imum
yie
ld p
er u
nit
wat
er u
se (k
g/ha
/mm
)
Maximum yield per unit water use (kg/ha.mm) as a function of (a) nitrogen and (b) location.
Step 1Use the data in Figure 7a to account for the effect of N on maximum yield per unit water use. For severely limited crops (N supply <50 kg N/ha), maximum yield per unit water use would be about 5–6 kg grain/ha.mm. For crops with abundant N supply (>200 kg N/ha), the parameter approaches 24 kg grain/ha.mm. For intermediate N supply, maximum yield per unit water use can be estimated graphically using this curve.
23 D Freebairn (2016) Improving fallow efficiency. GRDC Update Papers 23 February 2016, https://grdc.com.au/Research-and-Development/GRDC-Update-Papers/2016/02/Improving-fallow-efficiency
24 P Hocking, R Norton, A Good (1999) Crop nutrition. Australian Oilseeds Federation, http://www.australianoilseeds.com/__data/assets/pdf_file/0013/2704/Chapter_4_-_Canola_Nutrition.pdf
25 T Somes (2016) Lost nitrogen and what you can do. Ground Cover Issue 123, July–August 2016, https://grdc.com.au/Media-Centre/Ground-Cover/Ground-Cover-Issue-123-JulyAugust-2016/Lost-nitrogen-and-what-you-can-do
i MORE INFORMATION
GRDC Update paper: Pushing the production barriers
GRDC Update paper: Finely irrigated wheat, canola and faba beans systems results 2014
GRDC Update Paper: Understanding & managing N loss pathways

18PlaNNINg/PaDDocK PreParatIoN
seCtioN 1 CANOLA
NORTHERNMarch 2017
Step 2Use the line in Figure 7b to correct for location. For a latitude of –41.5° (Launceston, the southernmost location in this study), maximum yield per unit water use would be ~24–25 kg grain/ha.mm. For a latitude of –23.5° (Emerald, the northernmost location), maximum yield per unit water use would be ~12 kg grain/ha.mm. For intermediate locations, maximum yield per unit water supply can be estimated graphically using the line in Figure 6b.
Step 3Select the lowest value from steps 1 and 2. For example, if we want to estimate the maximum yield per unit water use for Dalby (latitude –27.1°) with intermediate N supply (100 kg N/ha), the location correction would return 14.7 kg/ha.mm and the N correction would return 16.6 kg/ha.mm. We therefore select the lowest value, 14.7 kg/ha.mm, as a benchmark for this combination of location and N supply. 26
table 3: Water Use Efficiency based on total biomass (WUEdm) or grain yield (WUEgy) of different crops.
crop region WUedm WUegy Source
(kg/ha.mm)
Canola Victoria 24.0 (17.1–28.4) 6.8 (4.7–8.9) Norton and Wachsmann 2006
Canola* NSW 13.4 Robertson and Kierkegaard 2005
Chickpeas Western Australia
16.0 (11.1–18.3) 6.2 (2.6–7.7) Siddique et al. 2001
Lentils 12.7 8.5–16.7) 6.7 (2.4–8.5)
Lupins 17.3 (9.3–22.3) 5.1 (2.3–8.3)
Faba beans
24.2 (18.7–29.6)
10.4 (7.7–12.5)
Peas 26.2 (17.6–38.7)
10.5 (6.0–15.9)
Vetch 18.2 (13.4–22.4)
7.5 (5.6–9.6)
Chickpeas Tel Hadya, Syria
13.7 (9.4–18.1) 3.2 (2.1–5.2) Zhang et al. 2000
Lentils 8.7 (5.0–14.2) 3.8 (1.9–5.5)
Wheat South Australia
36.1 (21.2–53.1) 15.9 (9.2–23.2)
Sadras et al. (unpublished)
South-east Australia
9.9 (max =22.5)
Sadras and Angus 2006
Water Use Efficiency is based on the biomass or yield per mm of crop water use. Values are mean and range.
There are intrinsic differences in the WUE of crops (Table 3), with wheat more water-use efficient than grain legumes or canola, in terms of both total biomass production and grain yield. Differences in the composition of the grain—it is more energy efficient to produce starch than oil or protein—partially explain the higher grain yield per unit water use of wheat compared with oilseed crops and pulses.
Further, canola and the grain legumes are grown at lower plant densities and/or have less vigorous seedlings than wheat, contributing to greater early losses of moisture
26 V Sadras, G McDonald (2012) Water Use Efficiency of grain crops in Australia: principles, benchmarks and management. GRDC Integrated Weed Management Hub, http://www.grdc.com.au/GRDC-Booklet-WUE
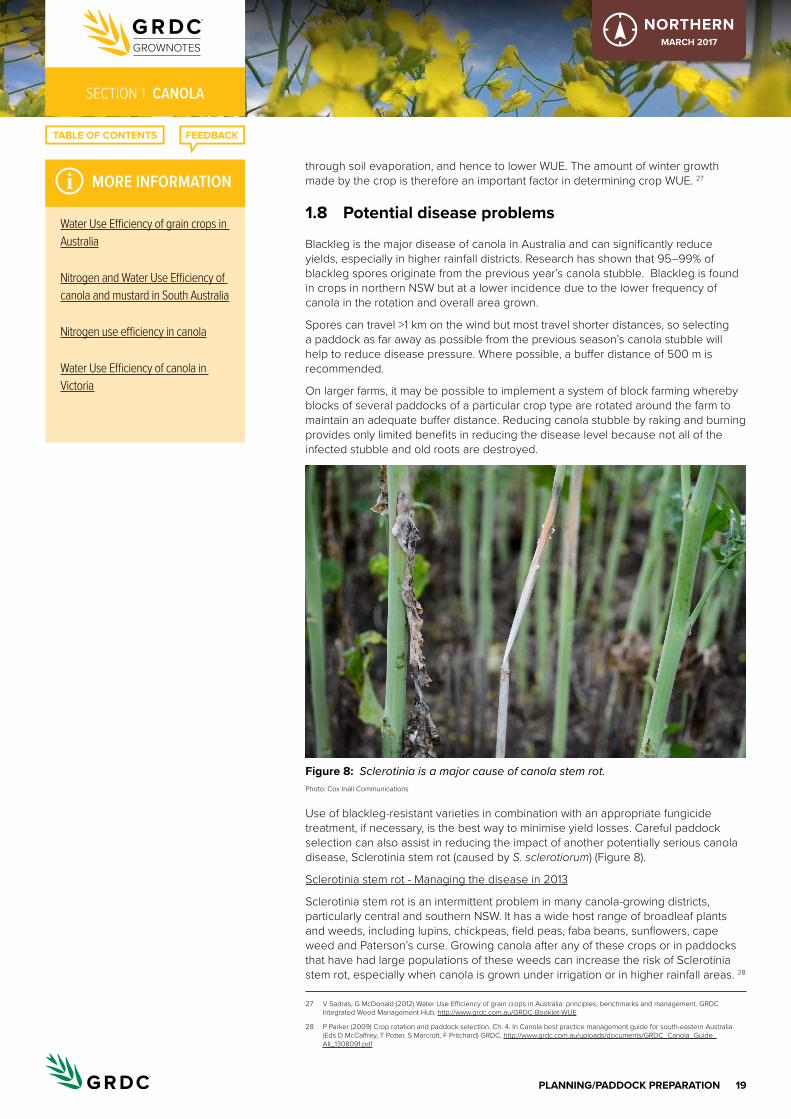
19PlaNNINg/PaDDocK PreParatIoN
seCtioN 1 CANOLA
NORTHERNMarch 2017
through soil evaporation, and hence to lower WUE. The amount of winter growth made by the crop is therefore an important factor in determining crop WUE. 27
1.8 Potential disease problems
Blackleg is the major disease of canola in Australia and can significantly reduce yields, especially in higher rainfall districts. Research has shown that 95–99% of blackleg spores originate from the previous year’s canola stubble. Blackleg is found in crops in northern NSW but at a lower incidence due to the lower frequency of canola in the rotation and overall area grown.
Spores can travel >1 km on the wind but most travel shorter distances, so selecting a paddock as far away as possible from the previous season’s canola stubble will help to reduce disease pressure. Where possible, a buffer distance of 500 m is recommended.
On larger farms, it may be possible to implement a system of block farming whereby blocks of several paddocks of a particular crop type are rotated around the farm to maintain an adequate buffer distance. Reducing canola stubble by raking and burning provides only limited benefits in reducing the disease level because not all of the infected stubble and old roots are destroyed.
Figure 8: Sclerotinia is a major cause of canola stem rot. Photo: Cox Inall Communications
Use of blackleg-resistant varieties in combination with an appropriate fungicide treatment, if necessary, is the best way to minimise yield losses. Careful paddock selection can also assist in reducing the impact of another potentially serious canola disease, Sclerotinia stem rot (caused by S. sclerotiorum) (Figure 8).
Sclerotinia stem rot - Managing the disease in 2013
Sclerotinia stem rot is an intermittent problem in many canola-growing districts, particularly central and southern NSW. It has a wide host range of broadleaf plants and weeds, including lupins, chickpeas, field peas, faba beans, sunflowers, cape weed and Paterson’s curse. Growing canola after any of these crops or in paddocks that have had large populations of these weeds can increase the risk of Sclerotinia stem rot, especially when canola is grown under irrigation or in higher rainfall areas. 28
27 V Sadras, G McDonald (2012) Water Use Efficiency of grain crops in Australia: principles, benchmarks and management. GRDC Integrated Weed Management Hub, http://www.grdc.com.au/GRDC-Booklet-WUE
28 P Parker (2009) Crop rotation and paddock selection. Ch. 4. In Canola best practice management guide for south-eastern Australia. (Eds D McCaffrey, T Potter, S Marcroft, F Pritchard) GRDC, http://www.grdc.com.au/uploads/documents/GRDC_Canola_Guide_All_1308091.pdf
i MORE INFORMATION
Water Use efficiency of grain crops in australia
Nitrogen and Water Use efficiency of canola and mustard in south australia
Nitrogen use efficiency in canola
Water Use efficiency of canola in Victoria

20PlaNNINg/PaDDocK PreParatIoN
seCtioN 1 CANOLA
NORTHERNMarch 2017
Sclerotinia infection occurs when there is rainfall around petal drop but only when those petals have sclerotinia spores on them. Predicting infection is difficult but fungicides can be applied to combat the infection. The economic benefits of this approach in the northern region are questionable.
1.9 Nematode status of paddock
Canola has hosting ability of root-lesion nematodes of low–medium for Pratylenchus thornei and medium–high for P. neglectus.
Testing soil is the only reliable way to determine whether root-lesion nematodes are present in a paddock. Before planting, soil tests can be carried out by PreDicta B (SARDI Diagnostic Services) through accredited agronomists, to establish whether crops are at risk and whether alternative crop types or varieties should be grown. Growing-season tests can be carried out on affected plants and associated soil; contact local state departments of agriculture and PreDicta B. 29
To organise testing and sending of soil samples, visit the PreDicta B website.
For testing and interpretation of results contact:
Rob Long, Crown Analytical Services 0437 996 678 [email protected]
For more information, see GrowNotes Section 8. Nematodes.
29 GRDC (2015) Root-lesion nematodes. GRDC Tips and Tactics, February 2015, http://www.grdc.com.au/TT-RootLesionNematodes
i MORE INFORMATION
Variety choice and crop rotation key to managing root lesion nematodes

1Pre-PlaNtINg
seCtioN 2 CANOLA
NORTHERNMarch 2017
Pre-planting2.1 Varietal performance and ratings yield
The main features to consider when selecting a variety are maturity, yield, oil content, herbicide tolerance and disease resistance. Early-maturing varieties are generally more suited to drier western areas, and midseason types are suited to higher rainfall areas. 1
Canola varieties are either hybrid or open-pollinated (OP). Within these breeding groups there are five herbicide tolerance groups; 1. Conventional; 2. Triazine-tolerant; 3. Imidazolinone-tolerant (marketed as Clearfield®); 4. Roundup Ready; 5. Dual tolerant—Triazine tolerant plus Roundup Ready. 2
There are expected to be 58 canola varieties on the market in NSW for 2016.
There are 12 new releases for NSW:• ATR-MakoA, Monola® 416TT and Nuseed GT-42 from Nuseed Pty Ltd• Banker CL and Rimfire CL from Heritage Seeds• Bayer 3000TR® from Bayer• DG 460RR from Landmark• DG 560TT from Landmark• Hyola® 504RR from Pacific Seeds• Pioneer® 45T01 (TT) from DuPont Pioneer• SF Turbine TT from Seed Force • Victory® V5003RR from AWB
Outclassed, but still available:• Hyola® 50
Withdrawn:• Pioneer 44C79 (CL), Pioneer 44Y84 (CL), Hyola® 400RR, Hyola® 500RR, Hyola®
505RR, Hyola® 971CL, Monola® 605TT 3
2.1.1 MaturityThe relative maturity of varieties can vary depending on location and sowing time. The maturity groupings shown in Table 1 are made as a guide only and relate to physiological maturity or windrow/harvest maturity.
The winter canola types for grazing and grain recovery are not included in Table 1. Maturity of these types is generally considered late–very late. 4
1 L Serafin, J Holland, R Bambach, D McCaffery (2005) Canola: northern NSW planting guide. NSW Department of Primary Industries, http://www.nvtonline.com.au/wp-content/uploads/2013/03/Crop-Guide-Canola-Northern-NSW-Planting-Guide.pdf
2 P Matthews, D McCaffery, L Jenkins (2016) Winter crop variety sowing guide 2016. NSW DPI Management Guide. NSW Department of Primary Industries, http://www.dpi.nsw.gov.au/__data/assets/pdf_file/0011/272945/winter-crop-variety-sowing-guide-2016.pdf
3 P Matthews, D McCaffery, L Jenkins (2016) Winter crop variety sowing guide 2016. NSW DPI Management Guide. NSW Department of Primary Industries, http://www.dpi.nsw.gov.au/__data/assets/pdf_file/0011/272945/winter-crop-variety-sowing-guide-2016.pdf
4 P Matthews, D McCaffery, L Jenkins (2016) Winter crop variety sowing guide 2016. NSW DPI Management Guide. NSW Department of Primary Industries, http://www.dpi.nsw.gov.au/__data/assets/pdf_file/0011/272945/winter-crop-variety-sowing-guide-2016.pdf
FAQ
i MORE INFORMATION
Winter crop variety sowing guide 2016
Canola: northern NsW planting guide
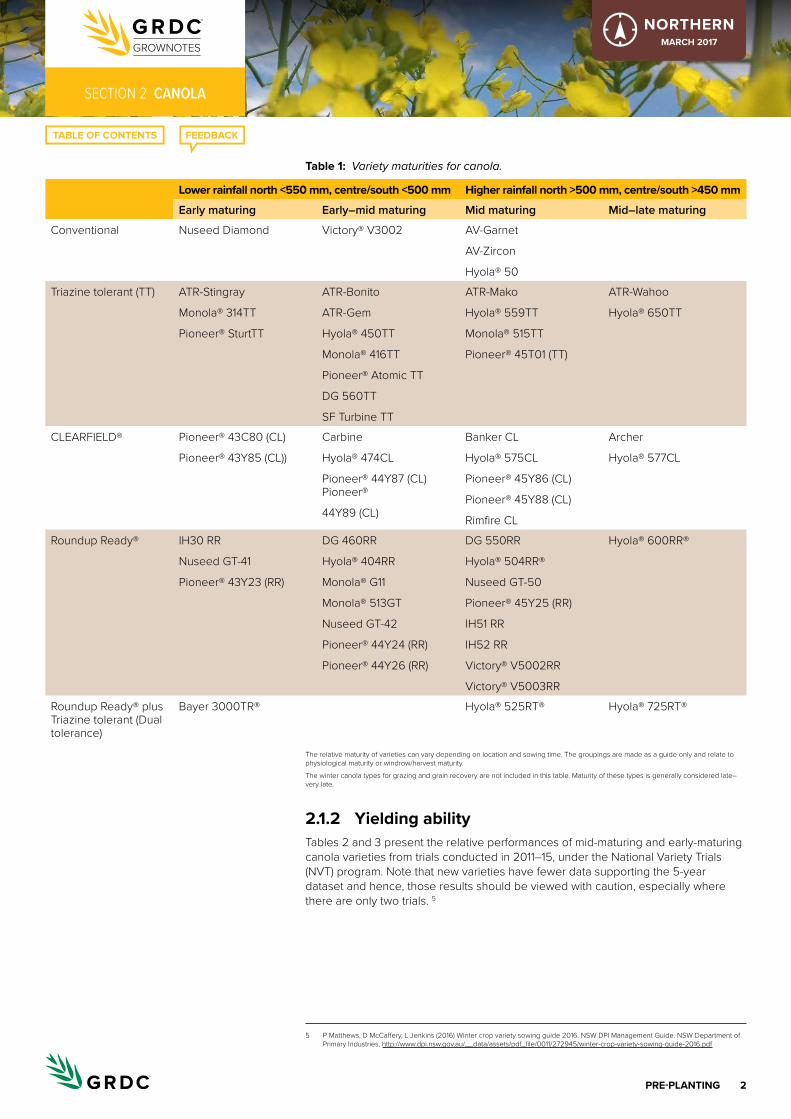
2Pre-PlaNtINg
seCtioN 2 CANOLA
NORTHERNMarch 2017
table 1: Variety maturities for canola.
lower rainfall north <550 mm, centre/south <500 mm higher rainfall north >500 mm, centre/south >450 mm
Early maturing Early–mid maturing Mid maturing Mid–late maturing
Conventional Nuseed Diamond Victory® V3002 AV-Garnet
AV-Zircon
Hyola® 50
Triazine tolerant (TT) ATR-Stingray
Monola® 314TT
Pioneer® SturtTT
ATR-Bonito
ATR-Gem
Hyola® 450TT
Monola® 416TT
Pioneer® Atomic TT
DG 560TT
SF Turbine TT
ATR-Mako
Hyola® 559TT
Monola® 515TT
Pioneer® 45T01 (TT)
ATR-Wahoo
Hyola® 650TT
CLEARFIELD® Pioneer® 43C80 (CL)
Pioneer® 43Y85 (CL))
Carbine
Hyola® 474CL
Pioneer® 44Y87 (CL) Pioneer®
44Y89 (CL)
Banker CL
Hyola® 575CL
Pioneer® 45Y86 (CL)
Pioneer® 45Y88 (CL)
Rimfire CL
Archer
Hyola® 577CL
Roundup Ready® IH30 RR
Nuseed GT-41
Pioneer® 43Y23 (RR)
DG 460RR
Hyola® 404RR
Monola® G11
Monola® 513GT
Nuseed GT-42
Pioneer® 44Y24 (RR)
Pioneer® 44Y26 (RR)
DG 550RR
Hyola® 504RR®
Nuseed GT-50
Pioneer® 45Y25 (RR)
IH51 RR
IH52 RR
Victory® V5002RR
Victory® V5003RR
Hyola® 600RR®
Roundup Ready® plus Triazine tolerant (Dual tolerance)
Bayer 3000TR® Hyola® 525RT® Hyola® 725RT®
The relative maturity of varieties can vary depending on location and sowing time. The groupings are made as a guide only and relate to physiological maturity or windrow/harvest maturity.
The winter canola types for grazing and grain recovery are not included in this table. Maturity of these types is generally considered late– very late.
2.1.2 Yielding abilityTables 2 and 3 present the relative performances of mid-maturing and early-maturing canola varieties from trials conducted in 2011–15, under the National Variety Trials (NVT) program. Note that new varieties have fewer data supporting the 5-year dataset and hence, those results should be viewed with caution, especially where there are only two trials. 5
5 P Matthews, D McCaffery, L Jenkins (2016) Winter crop variety sowing guide 2016. NSW DPI Management Guide. NSW Department of Primary Industries, http://www.dpi.nsw.gov.au/__data/assets/pdf_file/0011/272945/winter-crop-variety-sowing-guide-2016.pdf
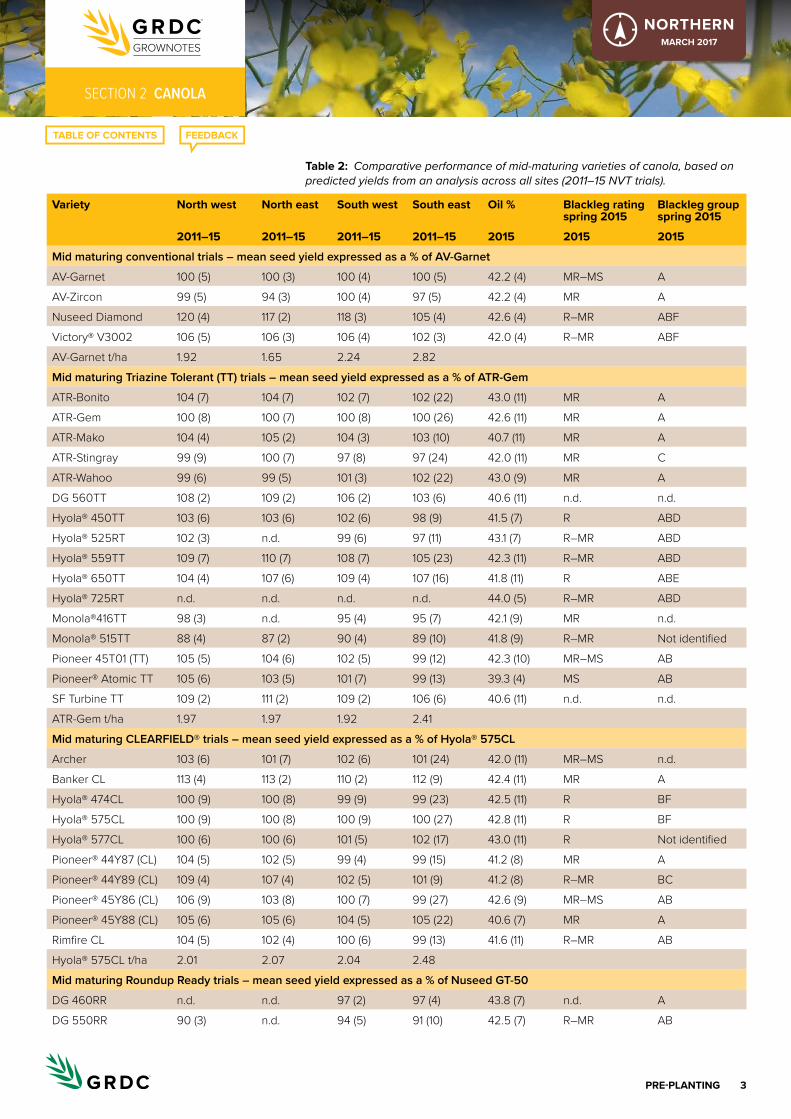
3Pre-PlaNtINg
seCtioN 2 CANOLA
NORTHERNMarch 2017
table 2: Comparative performance of mid-maturing varieties of canola, based on predicted yields from an analysis across all sites (2011–15 NVT trials).
Variety North west North east South west South east oil % Blackleg rating spring 2015
Blackleg group spring 2015
2011–15 2011–15 2011–15 2011–15 2015 2015 2015
Mid maturing conventional trials – mean seed yield expressed as a % of AV-Garnet
AV-Garnet 100 (5) 100 (3) 100 (4) 100 (5) 42.2 (4) MR–MS A
AV-Zircon 99 (5) 94 (3) 100 (4) 97 (5) 42.2 (4) MR A
Nuseed Diamond 120 (4) 117 (2) 118 (3) 105 (4) 42.6 (4) R–MR ABF
Victory® V3002 106 (5) 106 (3) 106 (4) 102 (3) 42.0 (4) R–MR ABF
AV-Garnet t/ha 1.92 1.65 2.24 2.82
Mid maturing Triazine Tolerant (TT) trials – mean seed yield expressed as a % of ATR-Gem
ATR-Bonito 104 (7) 104 (7) 102 (7) 102 (22) 43.0 (11) MR A
ATR-Gem 100 (8) 100 (7) 100 (8) 100 (26) 42.6 (11) MR A
ATR-Mako 104 (4) 105 (2) 104 (3) 103 (10) 40.7 (11) MR A
ATR-Stingray 99 (9) 100 (7) 97 (8) 97 (24) 42.0 (11) MR C
ATR-Wahoo 99 (6) 99 (5) 101 (3) 102 (22) 43.0 (9) MR A
DG 560TT 108 (2) 109 (2) 106 (2) 103 (6) 40.6 (11) n.d. n.d.
Hyola® 450TT 103 (6) 103 (6) 102 (6) 98 (9) 41.5 (7) R ABD
Hyola® 525RT 102 (3) n.d. 99 (6) 97 (11) 43.1 (7) R–MR ABD
Hyola® 559TT 109 (7) 110 (7) 108 (7) 105 (23) 42.3 (11) R–MR ABD
Hyola® 650TT 104 (4) 107 (6) 109 (4) 107 (16) 41.8 (11) R ABE
Hyola® 725RT n.d. n.d. n.d. n.d. 44.0 (5) R–MR ABD
Monola®416TT 98 (3) n.d. 95 (4) 95 (7) 42.1 (9) MR n.d.
Monola® 515TT 88 (4) 87 (2) 90 (4) 89 (10) 41.8 (9) R–MR Not identified
Pioneer 45T01 (TT) 105 (5) 104 (6) 102 (5) 99 (12) 42.3 (10) MR–MS AB
Pioneer® Atomic TT 105 (6) 103 (5) 101 (7) 99 (13) 39.3 (4) MS AB
SF Turbine TT 109 (2) 111 (2) 109 (2) 106 (6) 40.6 (11) n.d. n.d.
ATR-Gem t/ha 1.97 1.97 1.92 2.41
Mid maturing CLEARFIELD® trials – mean seed yield expressed as a % of Hyola® 575CL
Archer 103 (6) 101 (7) 102 (6) 101 (24) 42.0 (11) MR–MS n.d.
Banker CL 113 (4) 113 (2) 110 (2) 112 (9) 42.4 (11) MR A
Hyola® 474CL 100 (9) 100 (8) 99 (9) 99 (23) 42.5 (11) R BF
Hyola® 575CL 100 (9) 100 (8) 100 (9) 100 (27) 42.8 (11) R BF
Hyola® 577CL 100 (6) 100 (6) 101 (5) 102 (17) 43.0 (11) R Not identified
Pioneer® 44Y87 (CL) 104 (5) 102 (5) 99 (4) 99 (15) 41.2 (8) MR A
Pioneer® 44Y89 (CL) 109 (4) 107 (4) 102 (5) 101 (9) 41.2 (8) R–MR BC
Pioneer® 45Y86 (CL) 106 (9) 103 (8) 100 (7) 99 (27) 42.6 (9) MR–MS AB
Pioneer® 45Y88 (CL) 105 (6) 105 (6) 104 (5) 105 (22) 40.6 (7) MR A
Rimfire CL 104 (5) 102 (4) 100 (6) 99 (13) 41.6 (11) R–MR AB
Hyola® 575CL t/ha 2.01 2.07 2.04 2.48
Mid maturing Roundup Ready trials – mean seed yield expressed as a % of Nuseed GT-50
DG 460RR n.d. n.d. 97 (2) 97 (4) 43.8 (7) n.d. A
DG 550RR 90 (3) n.d. 94 (5) 91 (10) 42.5 (7) R–MR AB
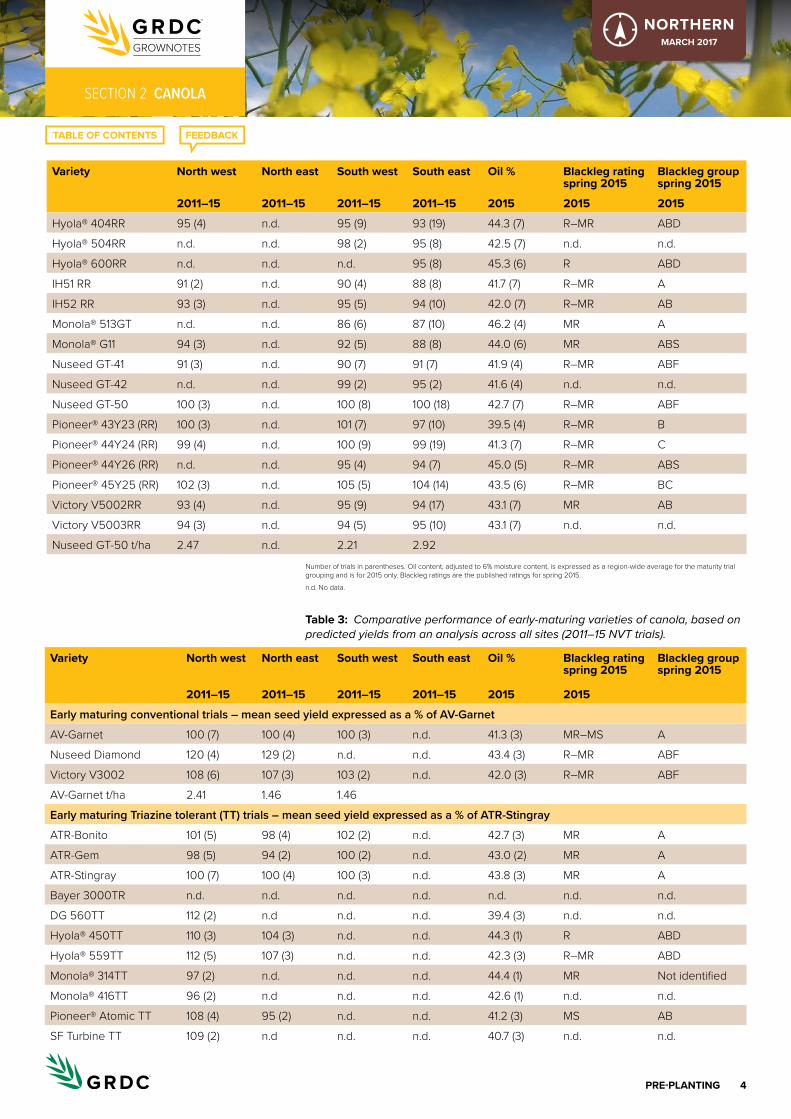
4Pre-PlaNtINg
seCtioN 2 CANOLA
NORTHERNMarch 2017
Variety North west North east South west South east oil % Blackleg rating spring 2015
Blackleg group spring 2015
2011–15 2011–15 2011–15 2011–15 2015 2015 2015
Hyola® 404RR 95 (4) n.d. 95 (9) 93 (19) 44.3 (7) R–MR ABD
Hyola® 504RR n.d. n.d. 98 (2) 95 (8) 42.5 (7) n.d. n.d.
Hyola® 600RR n.d. n.d. n.d. 95 (8) 45.3 (6) R ABD
IH51 RR 91 (2) n.d. 90 (4) 88 (8) 41.7 (7) R–MR A
IH52 RR 93 (3) n.d. 95 (5) 94 (10) 42.0 (7) R–MR AB
Monola® 513GT n.d. n.d. 86 (6) 87 (10) 46.2 (4) MR A
Monola® G11 94 (3) n.d. 92 (5) 88 (8) 44.0 (6) MR ABS
Nuseed GT-41 91 (3) n.d. 90 (7) 91 (7) 41.9 (4) R–MR ABF
Nuseed GT-42 n.d. n.d. 99 (2) 95 (2) 41.6 (4) n.d. n.d.
Nuseed GT-50 100 (3) n.d. 100 (8) 100 (18) 42.7 (7) R–MR ABF
Pioneer® 43Y23 (RR) 100 (3) n.d. 101 (7) 97 (10) 39.5 (4) R–MR B
Pioneer® 44Y24 (RR) 99 (4) n.d. 100 (9) 99 (19) 41.3 (7) R–MR C
Pioneer® 44Y26 (RR) n.d. n.d. 95 (4) 94 (7) 45.0 (5) R–MR ABS
Pioneer® 45Y25 (RR) 102 (3) n.d. 105 (5) 104 (14) 43.5 (6) R–MR BC
Victory V5002RR 93 (4) n.d. 95 (9) 94 (17) 43.1 (7) MR AB
Victory V5003RR 94 (3) n.d. 94 (5) 95 (10) 43.1 (7) n.d. n.d.
Nuseed GT-50 t/ha 2.47 n.d. 2.21 2.92Number of trials in parentheses. Oil content, adjusted to 6% moisture content, is expressed as a region-wide average for the maturity trial grouping and is for 2015 only. Blackleg ratings are the published ratings for spring 2015.
n.d. No data.
table 3: Comparative performance of early-maturing varieties of canola, based on predicted yields from an analysis across all sites (2011–15 NVT trials).
Variety North west North east South west South east oil % Blackleg rating spring 2015
Blackleg group spring 2015
2011–15 2011–15 2011–15 2011–15 2015 2015
Early maturing conventional trials – mean seed yield expressed as a % of AV-Garnet
AV-Garnet 100 (7) 100 (4) 100 (3) n.d. 41.3 (3) MR–MS A
Nuseed Diamond 120 (4) 129 (2) n.d. n.d. 43.4 (3) R–MR ABF
Victory V3002 108 (6) 107 (3) 103 (2) n.d. 42.0 (3) R–MR ABF
AV-Garnet t/ha 2.41 1.46 1.46
Early maturing Triazine tolerant (TT) trials – mean seed yield expressed as a % of ATR-Stingray
ATR-Bonito 101 (5) 98 (4) 102 (2) n.d. 42.7 (3) MR A
ATR-Gem 98 (5) 94 (2) 100 (2) n.d. 43.0 (2) MR A
ATR-Stingray 100 (7) 100 (4) 100 (3) n.d. 43.8 (3) MR A
Bayer 3000TR n.d. n.d. n.d. n.d. n.d. n.d. n.d.
DG 560TT 112 (2) n.d n.d. n.d. 39.4 (3) n.d. n.d.
Hyola® 450TT 110 (3) 104 (3) n.d. n.d. 44.3 (1) R ABD
Hyola® 559TT 112 (5) 107 (3) n.d. n.d. 42.3 (3) R–MR ABD
Monola® 314TT 97 (2) n.d. n.d. n.d. 44.4 (1) MR Not identified
Monola® 416TT 96 (2) n.d n.d. n.d. 42.6 (1) n.d. n.d.
Pioneer® Atomic TT 108 (4) 95 (2) n.d. n.d. 41.2 (3) MS AB
SF Turbine TT 109 (2) n.d n.d. n.d. 40.7 (3) n.d. n.d.

5Pre-PlaNtINg
seCtioN 2 CANOLA
NORTHERNMarch 2017
Variety North west North east South west South east oil % Blackleg rating spring 2015
Blackleg group spring 2015
2011–15 2011–15 2011–15 2011–15 2015 2015
ATR-Stingray t/ha 1.91 1.47 n.d.
Early maturing Clearfield trials – mean seed yield expressed as a % of Hyola® 474CL
Hyola® 474CL 100 (7) 100 (4) 100 (3) n.d. 43.2 (3) R BF
Hyola® 575CL 100 (7) 101 (4) 100 (3) n.d. 43.0 (3) R BF
Pioneer® 44Y87(CL) 101 (5) 92 (4) 98 (2) n.d. 40.8 (3) MR A
Pioneer® 44Y89(CL) 106 (3) 105 (3) n.d. n.d. 42.0 (3) R–MR BC
Rimfire CL 91 (3) 82 (3) n.d. n.d. 41.8 (3) R–MR AB
Hyola® 474CL t/ha n.d. n.d. n.d.
Early maturing Roundup Ready trials – mean seed yield expressed as a % of Hyola® 404RR
Hyola® 404RR 100 (4) n.d. 100 (3) n.d. 43.9 (1) R–MR ABD
IH30 RR 99 (3) n.d. 95 (2) n.d. 47.0 (1) MR AB
Nuseed GT-41 98 (3) n.d. 95 (2) n.d. 42.8 (1) R–MR ABF
Pioneer® 43Y23(RR) 100 (4) n.d. 99 (3) n.d. 42.9 (1) R–MR B
Pioneer® 44Y24(RR) 99 (3) n.d. 99 (2) n.d. 43.8 (1) R–MR C
Hyola® 404RR t/ha 2.35 n.d. 1.63Number of trials in parentheses. The more trials, the greater the reliability. Oil content, adjusted to 6% moisture content, is expressed as a region-wide average for the maturity trial grouping and is for 2015 only. Blackleg ratings are the published ratings for spring 2015.
n.d. No data. New varieties have less trial data supporting the 5-year dataset and hence should be viewed with some caution, especially where there are only 2 trial results.
Blackleg rating disclaimer. The blackleg ratings above, published by NSW Department of Primary Industries, are based on best information available at the time of publication. However, nursery and grower experience has shown that disease severity may vary between locations and years, depending on seasonal conditions and possible changes in the fungus for reasons not currently understood. Therefore, growers may sometimes experience significant variation from the averages shown in these ratings.
2.1.3 oilCanola was developed from rapeseed to produce an oilseed crop with improved nutritional composition. The aim was to produce a crop that had low levels of glucosinolates in the meal and low levels of erucic acid in the oil. 6
Oil is extracted by mechanically crushing the seed. The oil is then processed by using heat and/or chemicals. Approximately 73% of canola in Australia is processed by addition of solvents, 25% by expeller treatment and 2% by cold-pressing.
The seed typically has an oil content of 35–45%. The oil content is generally expressed as a percentage of the whole seed at 8% moisture content. The oil contains: • 10–12% linolenic acid (omega-3) • <0.1% erucic acid • 59–62% oleic acid • 12–22% linoleic acid
Canola oil is high in unsaturated fats (93%) and has no cholesterol or trans-fats. It has the lowest saturated fat content (7%) of any common edible oil. 7
6 R Mailer (2009) Grain quality. In Canola best practice management guide for eastern Australia. (EdsD McCaffrey, T Potter, S Marcroft, F Pritchard)) GRDC, http://www.grdc.com.au/uploads/documents/GRDC_Canola_Guide_All_1308091.pdf
7 J Edwards, K Hertel (2011) Canola growth and development. PROCROP Series. NSW Department of Primary Industries, http://www.dpi.nsw.gov.au/__data/assets/pdf_file/0004/516181/Procrop-canola-growth-and-development.pdf
i MORE INFORMATION
GRDC Update paper: australian canola oil quality
Variety and agronomy trials
http://grdc.com.au/Research-and-Development/GRDC-Update-Papers/2015/02/Australian-canola-oil-quality
6Pre-PlaNtINg
seCtioN 2 CANOLA
NORTHERNMarch 2017
2.1.4 Seed meal The seed meal is what is left over after the oil is removed. It contains proteins, carbohydrates, minerals and fibre. The exact composition of seed meal depends on the oil extraction method. The protein content varies each season and increases as the oil content decreases. Typically, seed meal consists of 36–39% protein, 1.5–2.0% fat, 11–13% fibre and <10 µmolglucosinolate/g.
The minimum protein content of seed meal, as determined by the AOF (Australian Oilseeds Federation) is 36%, measured at 12% moisture. 8
2.2 Varieties for NSW
2.2.1 conventional varieties aV-garnet: a mid-maturing to mid–early-maturing variety. Medium height. Moderate–high oil content. Widely adapted. Blackleg resistance rating 2014, MR; resistance group A. Tested in NVT trials 2006–14. Bred by Department of Environment and Primary Industries (DEPI) Victoria. Marketed by Nuseed Pty Ltd.
aV-Zircon: a mid-maturing variety. Medium height. Moderate oil content. Blackleg resistance rating 2014, MR; resistance group currently unknown. Tested in NVT trials 2011–14. Bred by DEPI Victoria and Nuseed Pty Ltd. Marketed by Nuseed Pty Ltd.
hyola® 50: mid-maturing to mid–early-maturing hybrid. High oil content. Widely adapted. Blackleg resistance rating 2014, R; resistance group AD. Tested in NVT trials 2005–14. Bred by Canola Breeders International. Marketed by Pacific Seeds.
Nuseed® Diamond: new release (coded NCH1203C). Early-maturing hybrid. Medium height. High oil content. Suited to low–medium rainfall zones. Blackleg resistance rating 2014, R–MR; resistance group ABF. Tested in NVT trials 2012–14. Bred and marketed by Nuseed Pty Ltd.
SF Brazzil™: late-maturing, winter, dual-purpose, open-pollinated variety. Suited to early sowing and winter grazing in very high-rainfall zones. Blackleg resistance rating 2014, R–MR; resistance group BC. Not tested in NVT trials. Marketed by Seed Force.
SF Sensation™: very late-maturing, winter, dual-purpose hybrid. Suited to early sowing and winter grazing in very high-rainfall zones. Blackleg resistance rating 2014, R–MR; resistance group currently unknown. Not tested in NVT trials. Marketed by Seed Force.
Victory® V3002: early–mid-maturing conventional specialty (high stability oil) hybrid, slightly later than Victory V3001. Moderate–high oil content. Blackleg resistance rating 2014, R–MR; resistance group ABF. Tested in NVT trials 2011–14. Bred by Cargill and DEPI Victoria. Marketed by AWB Ltd in a closed-loop program. 9
2.2.2 triazine-tolerant varieties Triazine-tolerant (TT) varieties can have lower yield and oil content than some Roundup Ready varieties. However, they can give good yields in weedy paddocks, when sprayed with atrazine and/or simazine herbicides.
atr-Bonito: an early-maturing to early–mid-maturing variety. High–very high oil content. Plant height slightly shorter than ATR-Gem. Blackleg resistance rating 2014, MR; resistance group A. Tested in NVT trials 2012–14. Bred by Nuseed Pty Ltd and DEPI Victoria. Marketed by Nuseed Pty Ltd. An EPR (end-point royalty) applies.
atr-gem: a mid–early-maturing variety. High–very high oil content. Slightly shorter plant height than Tawriffic TT. Blackleg resistance rating 2014, MR; resistance group A.
8 J Edwards, K Hertel (2011) Canola growth and development. PROCROP Series. NSW Department of Primary Industries, http://www.dpi.nsw.gov.au/__data/assets/pdf_file/0004/516181/Procrop-canola-growth-and-development.pdf
9 P Matthews, D McCaffery, L Jenkins (2016) Winter crop variety sowing guide 2016. NSW DPI Management Guide. NSW Department of Primary Industries, http://www.dpi.nsw.gov.au/__data/assets/pdf_file/0011/272945/winter-crop-variety-sowing-guide-2016.pdf
i MORE INFORMATION
Pacific seeds hyola hybrid agronomy

7Pre-PlaNtINg
seCtioN 2 CANOLA
NORTHERNMarch 2017
Tested in NVT trials 2011–14. Bred by Nuseed Pty Ltd and DEPI Victoria. Marketed by Nuseed Pty Ltd.
atr-Mako: new release (coded NT0252). Mid-early maturing OP variety. Suited to medium–high rainfall zones. Slightly taller plant height than ATR-Gem. Blackleg rating spring 2015 MR and resistance group A. Tested in NVT trials 2014 and 2015. Bred and marketed by Nuseed Pty Ltd. An EPR applies.
atr-Stingray: an early-maturing variety. High oil content. Short plant height. Blackleg resistance rating 2014, MR; resistance group C. Tested in NVT trials 2010–14. Bred by Nuseed Pty Ltd and DEPI Victoria. Marketed by Nuseed Pty Ltd.
atr-Wahoo: a mid-maturing variety, similar to ATR-Marlin. High–very high oil content. Plant height similar to ATR-Gem. Blackleg resistance rating 2014, MR; resistance group A. Tested in NVT trials 2012–14. Bred by Nuseed Pty Ltd and DEPI Victoria. Marketed by Nuseed Pty Ltd. An EPR applies.
Dg 560tt: new release (coded SFR65-009TT). Early-mid maturing hybrid. Moderate height. Suited to medium rainfall zones. No published GRDC blackleg rating or resistance group 2015. Tested in NVT trials for the first time in 2015. Marketed by Landmark.
hyola® 450tt: early-maturing to mid–early-maturing hybrid. High–very high oil content. Medium plant height. Suited to low-rainfall to medium–high-rainfall areas. Blackleg resistance rating 2014, R; resistance group ABD. Tested in NVT trials 2013 and 2014. Bred and marketed by Pacific Seeds.
hyola® 559tt: mid-maturing to mid–early-maturing hybrid. High oil content. Medium plant height. Suited to medium–very high-rainfall areas. Blackleg resistance rating 2014, R; resistance group ABD. Tested in NVT trials 2012–14. Bred and marketed by Pacific Seeds.
hyola® 650tt: mid-maturing to mid–late-maturing hybrid. High oil content. Medium–tall plant height. Suited to medium–high-rainfall areas. Blackleg resistance rating 2014, R; resistance group ABE. Tested in NVT trials 2013 and 2014. Bred and marketed by Pacific Seeds
Monola® 314tt: early–mid-maturing, open-pollinated, specialty oil variety. Moderate oil content. Medium plant height. Blackleg resistance rating 2014 and resistance group. Tested in NVT trials 2013 and 2014. Bred and marketed by Nuseed Pty Ltd.
Monola® 416 tt: new release (coded NL0852). Early–mid maturing OP specialty oil variety. Suited to medium–low rainfall zones. Short-medium plant height. No published GRDC blackleg rating or resistance group 2015. Tested in NVT trials in 2014 and 2015. Bred and marketed by Nuseed Pty Ltd.
Monola® 515tt: new release (coded NL805). Mid-maturing, open-pollinated specialty oil variety. Moderate–high oil content. No published GRDC blackleg resistance rating or resistance group for 2014. Tested in NVT trials for the first time in 2014. Bred and marketed by Nuseed Pty Ltd.
Pioneer® 45t01 (tt): new release. Mid maturing hybrid. Medium plant height with strong, early vigour. Suited to medium–high rainfall zones. Blackleg rating spring 2015 MR–MS and resistance group AB. Tested in NVT trials 2013–15. Marketed by DuPont Pioneer.
Pioneer® Sturt tt: early-maturing to early–mid-maturing, open-pollinated variety. Moderate oil content. Short–medium plant height. Adapted to low–medium-rainfall zones. Blackleg resistance rating 2014, MS. Tested in NVT trials 2011–14. Bred by NPZ Australia Pty Ltd. Marketed by DuPont Pioneer. An EPR applies.
Pioneer® atomic tt: mid-maturing hybrid. Medium height. Moderate oil content. Suited to medium-rainfall zones. Blackleg resistance rating 2014, MS; resistance

8Pre-PlaNtINg
seCtioN 2 CANOLA
NORTHERNMarch 2017
group AB. Tested in NVT trials 2012–14. Bred by NPZ Australia Pty Ltd. Marketed by DuPont Pioneer. 10
SF turbine tt: new release (coded SFR65-008TT). Early-mid maturing hybrid. Moderate height. Suited to medium rainfall zones. No published GRDC blackleg rating or resistance group 2015. Tested in NVT trials for the first time in 2015. Bred by NPZ Australia. Marketed by Seed Force.
2.2.3 clearfield® (imidazolinone-tolerant) varieties These varieties are tolerant to Intervix® imidazolinone herbicide and are part of the Clearfield® Production System.
archer: mid–late-maturing hybrid. High oil content. Medium–tall plant height. Blackleg resistance rating 2014, MR–MS. Tested in NVT trials 2011–14. Marketed by Heritage Seeds.
Banker cl: new release (coded HSHC 134 (CL), 2015 and PHI-1401 in 2014). Mid maturing hybrid. Medium plant height. Blackleg rating spring 2015 MR and resistance group A. Tested in NVT trials in 2014 and 2015. Marketed by Heritage Seeds.
carbine: early–mid-maturing hybrid. Moderate–high oil content. Medium plant height. Blackleg resistance rating 2014, MR–MS. Tested in NVT trials 2011–13. Marketed by Heritage Seeds.
hyola® 474cl: mid-maturing to mid–early-maturing hybrid. High oil content. Medium–tall plant height. Suited to medium–low-rainfall to high-rainfall areas. Blackleg resistance rating 2014, R; resistance group BF. Tested in NVT trials 2011–14. Bred and marketed by Pacific Seeds.
hyola® 575cl: mid-maturing hybrid. High–very high oil content. Medium plant height. Suited to medium–very high-rainfall areas. Blackleg resistance rating 2013, R; resistance group BF. Tested in NVT trials 2010–14. Bred and marketed by Pacific Seeds.
hyola® 577cl: mid-maturing hybrid. High–very high oil content. Medium–tall plant height. Suited to medium–high-rainfall areas. Blackleg resistance rating 2014, R. Tested in NVT trials 2013 and 2014. Bred and marketed by Pacific Seeds.
hyola® 970cl: late-maturing, winter graze and grain hybrid. Pacific Seeds indicate high–very high biomass, good grain yield and oil content. Early–mid autumn and spring sowing, graze and grain option for very high-rainfall zones. No published GRDC blackleg resistance rating or resistance group for 2014. Released 2014. Not tested in NVT trials. Bred and marketed by Pacific Seeds.
Pioneer® 43c80(cl): an early-maturing variety. Adapted to low-rainfall areas. Medium plant height. Blackleg resistance rating in 2013, MR–MS. Tested in NVT trials 2008–09 and 2011–12. Bred and marketed by DuPont Pioneer.
Pioneer® 43Y85(cl): early-maturing hybrid. Short–medium plant height. Moderate oil content. Suited to medium–low-rainfall areas. Blackleg resistance rating 2014, MR; resistance group A. Tested in NVT trials 2011–14. Bred and marketed by DuPont Pioneer.
Pioneer® 44Y87(cl): early–mid-maturing hybrid. Moderate–high oil content. Medium plant height. Suited to medium-rainfall areas. Blackleg resistance rating 2014, MR; resistance group A. Tested in NVT trials 2012–14. Bred and marketed by DuPont Pioneer.
Pioneer® 44Y89(cl): new release (coded PHI-1305). Early–mid-maturing hybrid. High oil content. Short–medium plant height. Suited to low–medium-rainfall areas. Blackleg resistance rating 2014, R–MR; resistance group BC. Tested in NVT trials 2013 and 2014. Bred and marketed by DuPont Pioneer.
10 P Matthews, D McCaffery, L Jenkins (2016) Winter crop variety sowing guide 2016. NSW DPI Management Guide. NSW Department of Primary Industries, http://www.dpi.nsw.gov.au/__data/assets/pdf_file/0011/272945/winter-crop-variety-sowing-guide-2016.pdf

9Pre-PlaNtINg
seCtioN 2 CANOLA
NORTHERNMarch 2017
Pioneer® 45Y86(cl): mid-maturing hybrid. High–very high oil content. Medium–tall plant height. Suited for dual-purpose (graze and grain) option in full-season environments. Blackleg resistance rating 2014, MR– MS; resistance group AB. Tested in NVT trials 2010–2014. Bred and marketed by DuPont Pioneer.
Pioneer® 45Y88(cl): mid-maturing hybrid. Moderate–high oil content. Medium plant height. Suited to high-rainfall areas. Blackleg resistance rating 2014, R–MR; resistance group A. Tested in NVT trials 2012–14. Bred and marketed by DuPont Pioneer.
rimfire cl: new release (coded HSHC 133 (CL) in 2014). Mid to mid–early maturing hybrid. Medium plant height. Blackleg rating spring 2015 R–MR and resistance group AB. Tested in NVT trials 2013–15. Marketed by Heritage Seeds.
SF edimax cl: new release. Late-maturing, dual-purpose winter hybrid. Undergoing BASF Clearfield registration. Suited to early sowing and spring sowing in high rainfall areas. Blackleg resistance rating 2014, R–MR; resistance group C. Not tested in NVT trials. Marketed by AGF Seeds.
2.2.4 roundup ready® varieties Dg 460rr: new release (coded SN-ACL 12–1586). Early–mid maturing hybrid. Short plant height. Blackleg rating spring 2015 R–MR and resistance group A. Tested in NVT trials for the first time in 2015. Bred by Seednet and marketed by Landmark.
Dg 550rr: new release (coded VT-WZ-11–2685). Mid maturing hybrid. High oil content. Blackleg resistance rating 2014, R–MR; resistance group AB. Tested in NVT trials 2013 and 2014. Bred and marketed by Seednet.
hyola® 404rr: early-maturing to mid–early maturing hybrid. Very high oil content. Medium plant height. Suited to low–high-rainfall areas. Blackleg resistance rating 2014, R–MR; resistance group ABD. Tested in NVT trials 2010–14. Bred and marketed by Pacific Seeds.
hyola® 504rr: new release (coded M26120 in 2014). Mid maturing hybrid. Medium plant height. Suited to medium–high rainfall areas. No published GRDC blackleg rating or resistance group 2015. Tested in NVT trials 2014 and 2015. Bred by Pacific Seeds and marketed by Advanta Seeds.
hyola® 600rr: new release. Mid maturing to mid–late-maturing hybrid. Very high oil content. Medium–tall plant height. Suited to medium–high-rainfall to very high-rainfall areas. No published GRDC blackleg resistance rating or resistance group 2014. Tested in NVT trials for the first time in 2014. Bred and marketed by Pacific Seeds
Ih30rr: early maturing hybrid. High oil content. Suited to low–medium-rainfall areas. Blackleg resistance rating R–MR; resistance group AB. Tested in NVT trials 2012–14. Bred and marketed by Bayer.
Ih51rr: new release (coded AN13R9003). Mid-maturing hybrid with Bayer’s new pod shatter reduction trait. High oil content. Suited to later windrow timings or direct harvesting in medium–high-rainfall areas. No published GRDC blackleg resistance rating or resistance group for 2014. Tested in NVT trials for the first time in 2014. Bred and marketed by Bayer.
Ih52rr: new release (coded AN11R5201). Mid-maturing hybrid. High oil content. Suited to medium–high-rainfall areas. Blackleg resistance rating 2014, R–MR; resistance group AB. Tested in NVT trials 2013 and 2014. Bred and marketed by Bayer.
Monola® 513gt: early–mid-maturing, open-pollinated, specialty oil variety. Very high oil content. Medium plant height. Blackleg resistance rating 2014, MR. Tested in NVT trials 2012–14. Bred and marketed by Nuseed Pty Ltd.
Monola® g11: new release (coded NMH13G011). Early–mid-maturing, specialty oil hybrid. Very high oil content. Medium plant height. Blackleg resistance rating 2014, R–MR; resistance group ABS. Tested in NVT trials 2013 and 2014. Bred and marketed by Nuseed Pty Ltd.
10Pre-PlaNtINg
seCtioN 2 CANOLA
NORTHERNMarch 2017
Nuseed® gt-41: early maturing hybrid. High oil content. Medium plant height. Blackleg resistance rating 2012, R–MR; resistance group ABF. Tested in NVT trials 2012–14. Bred and marketed by Nuseed Pty Ltd.
Nuseed gt-42: new release (coded NCH14G055). Early to early-mid maturing hybrid. Suited to medium–low rainfall zones. Medium plant height. Blackleg rating spring 2015 R, resistance group not known. Tested in NVT trials 2014 (1 trial) and 2015. Bred and marketed by Nuseed Pty Ltd.
Nuseed® gt-50: mid maturing hybrid. High–very high oil content. Medium–tall plant height. Blackleg resistance rating 2014, R–MR; resistance group ABF. Tested in NVT trials 2012–14. Bred and marketed by Nuseed Pty Ltd.
Pioneer® 43Y23(rr): early maturing hybrid. Moderate–high oil content. Blackleg resistance rating 2014. R–MR; resistance group B. Tested in NVT trials 2011–14. Bred and marketed by DuPont Pioneer.
Pioneer® 44Y24(rr): early–mid-maturing hybrid. High oil content. Medium plant height. Suited to medium–high-rainfall areas. Blackleg resistance rating 2014, MR; resistance group C. Tested in NVT trials 2011–14. Bred and marketed by DuPont Pioneer.
Pioneer® 44Y26(rr): new release (coded PHI-1311). Early–mid-maturing hybrid. High–very high oil content. Medium–tall plant height. Suited to medium–high-rainfall areas. Blackleg resistance rating 2014, R–MR; resistance group ABS. Tested in NVT trials 2013 and 2014. Bred and marketed by DuPont Pioneer.
Pioneer® 45Y25(rr): new release (coded PHI-1306). Mid-maturing hybrid. High–very high oil content. Medium plant height. Suited to medium–high-rainfall areas. Blackleg resistance rating 2014, R–MR; resistance group BC. Tested in NVT trials 2012–14. Bred and marketed by DuPont Pioneer. 11
Victory® V5002rr: Mid maturing RR specialty (high oleic, low linolenic oil) hybrid. Blackleg rating spring 2015 MR and resistance group AB. Tested in NVT trials 2011–15. Bred by Cargill and DPI Victoria. Marketed by AWB under contract.
Victory® V5003rr: new release. Mid maturing RR specialty (high oleic, low linolenic oil) hybrid. Blackleg rating R–MR and resistance group B. Tested in NVT trials 2013–15. Bred by Cargill. Marketed by AWB under contract.
2.2.5 roundup ready®–triazine-tolerant varieties New varieties are being developed that combine two herbicide tolerance traits, allowing improved weed control in paddocks where weeds have developed resistance to other herbicide chemistries.
Bayer 3000 tr®: new release (coded PJTT1). Early maturing dual herbicide tolerant hybrid. Short–medium plant height. Suited to low to low–medium rainfall zones. No published GRDC blackleg rating or resistance group 2015. Tested in NVT trials for the first time in 2015. Bred by NPZ Australia. Marketed by Bayer.
hyola® 525rt®: mid maturing, RT® dual-herbicide-tolerant hybrid. High–very high oil content. Medium plant height. Suited to medium–high-rainfall areas. Blackleg resistance rating 2014, R–MR; resistance group ABD. Tested in NVT trials 2013 and 2014. Bred and marketed by Pacific Seeds.
hyola® 725rt®: new release. Mid–late-maturing, RT® dual-herbicide-tolerant hybrid. High–very high oil content. Medium–tall plant height. Suited to medium–high-rainfall to very high-rainfall areas. No published GRDC blackleg resistance rating or resistance group for 2014. Tested in NVT trials for the first time in 2014. Bred and marketed by Pacific Seeds.
11 P Matthews, D McCaffery, L Jenkins (2016) Winter crop variety sowing guide 2016. NSW DPI Management Guide. NSW Department of Primary Industries, http://www.dpi.nsw.gov.au/__data/assets/pdf_file/0011/272945/winter-crop-variety-sowing-guide-2016.pdf

11Pre-PlaNtINg
seCtioN 2 CANOLA
NORTHERNMarch 2017
2.2.6 Juncea canola (Brassica juncea) Juncea canola is adapted to low-rainfall areas (300–400 mm) and dry conditions. It has oil quality similar to canola, but still requires segregation and has designated delivery sites.
XceeD™ Vt oasis cl: first herbicide-tolerant Clearfield® juncea canola in Australia. Early–mid-maturing, open-pollinated variety. High oil content. Suitable for direct harvesting. Blackleg resistance rating R and resistance group G. Tested in NVT trials 2008–13. Bred by DEPI Victoria/Viterra. Marketed by Seednet. An EPR applies. 12
2.3 Planting seed quality
2.3.1 Seed sizeCanola seeds weigh only approximately 3 mg each, with the 1000-seed weight of canola typically 3–6 g. Seed size varies according to the growing conditions. There are also varietal differences. Generally, hybrid varieties have larger seeds (Figure 1).
Seed size plays an important role in crop establishment. Larger seeds produce seedlings that are more vigorous and give improved crop establishment (Table 4). There is also an interaction with sowing depth. Larger seeds establish more plants, particularly if sown at depth of ≥3 cm. 13
Figure 1: Dr Abed Chaudhury cross-pollinating canola flowers. Following their discovery of two genes that control the size of plant seeds, CSIRO Plant Industry researchers are investigating how that knowledge can be used to produce larger seeds across a wide range of crops.Photo: Carl Davies
12 P Matthews, D McCaffery, L Jenkins (2016) Winter crop variety sowing guide 2016. NSW DPI Management Guide. NSW Department of Primary Industries, http://www.dpi.nsw.gov.au/__data/assets/pdf_file/0011/272945/winter-crop-variety-sowing-guide-2016.pdf
13 J Edwards, K Hertel (2011) Canola growth and development. PROCROP Series. NSW Department of Primary Industries, http://www.dpi.nsw.gov.au/__data/assets/pdf_file/0004/516181/Procrop-canola-growth-and-development.pdf
i MORE INFORMATION
What is Roundup Ready canola?
Queensland hope for short season canola
Crop Guide- Canola: Juncea Canola in low rainfall sW NsW
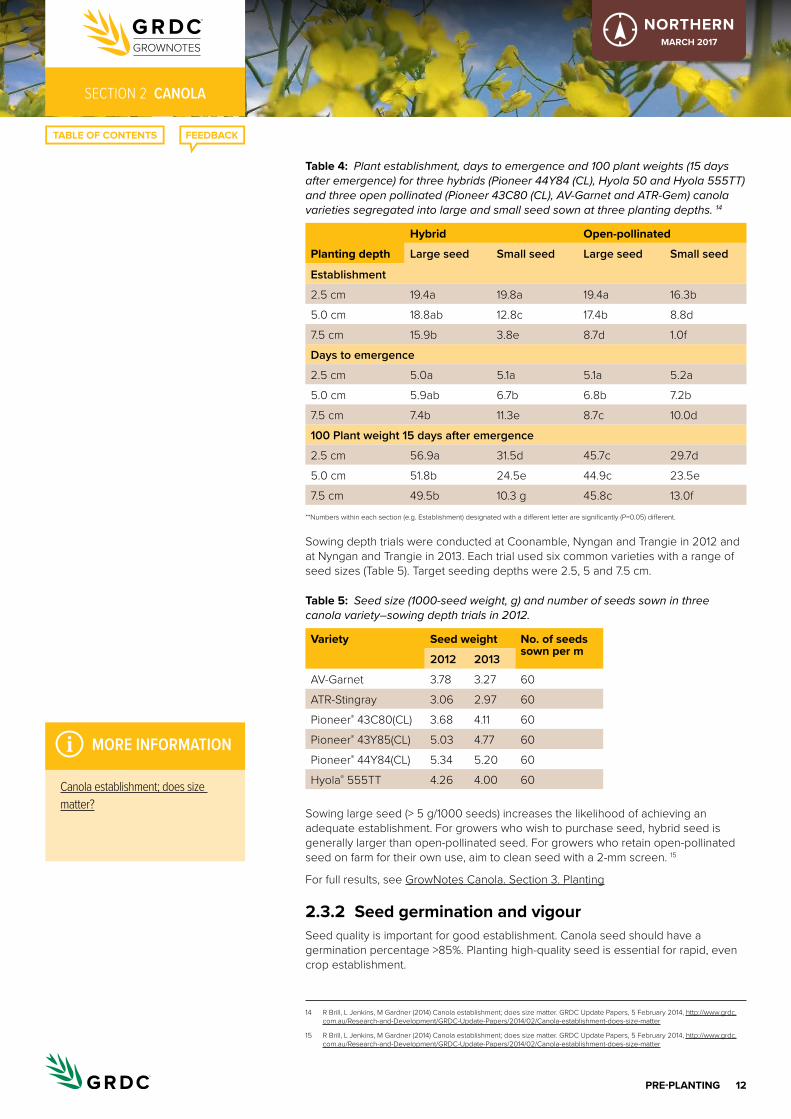
12Pre-PlaNtINg
seCtioN 2 CANOLA
NORTHERNMarch 2017
table 4: Plant establishment, days to emergence and 100 plant weights (15 days after emergence) for three hybrids (Pioneer 44Y84 (CL), Hyola 50 and Hyola 555TT) and three open pollinated (Pioneer 43C80 (CL), AV-Garnet and ATR-Gem) canola varieties segregated into large and small seed sown at three planting depths. 14
Planting depth
hybrid open-pollinated
Large seed Small seed Large seed Small seed
Establishment
2.5 cm 19.4a 19.8a 19.4a 16.3b
5.0 cm 18.8ab 12.8c 17.4b 8.8d
7.5 cm 15.9b 3.8e 8.7d 1.0f
Days to emergence
2.5 cm 5.0a 5.1a 5.1a 5.2a
5.0 cm 5.9ab 6.7b 6.8b 7.2b
7.5 cm 7.4b 11.3e 8.7c 10.0d
100 Plant weight 15 days after emergence
2.5 cm 56.9a 31.5d 45.7c 29.7d
5.0 cm 51.8b 24.5e 44.9c 23.5e
7.5 cm 49.5b 10.3 g 45.8c 13.0f**Numbers within each section (e.g. Establishment) designated with a different letter are significantly (P=0.05) different.
Sowing depth trials were conducted at Coonamble, Nyngan and Trangie in 2012 and at Nyngan and Trangie in 2013. Each trial used six common varieties with a range of seed sizes (Table 5). Target seeding depths were 2.5, 5 and 7.5 cm.
table 5: Seed size (1000-seed weight, g) and number of seeds sown in three canola variety–sowing depth trials in 2012.
Variety Seed weight No. of seeds sown per m
2012 2013
AV-Garnet 3.78 3.27 60
ATR-Stingray 3.06 2.97 60
Pioneer® 43C80(CL) 3.68 4.11 60
Pioneer® 43Y85(CL) 5.03 4.77 60
Pioneer® 44Y84(CL) 5.34 5.20 60
Hyola® 555TT 4.26 4.00 60
Sowing large seed (> 5 g/1000 seeds) increases the likelihood of achieving an adequate establishment. For growers who wish to purchase seed, hybrid seed is generally larger than open-pollinated seed. For growers who retain open-pollinated seed on farm for their own use, aim to clean seed with a 2-mm screen. 15
For full results, see GrowNotes Canola. Section 3. Planting
2.3.2 Seed germination and vigourSeed quality is important for good establishment. Canola seed should have a germination percentage >85%. Planting high-quality seed is essential for rapid, even crop establishment.
14 R Brill, L Jenkins, M Gardner (2014) Canola establishment; does size matter. GRDC Update Papers, 5 February 2014, http://www.grdc.com.au/Research-and-Development/GRDC-Update-Papers/2014/02/Canola-establishment-does-size-matter
15 R Brill, L Jenkins, M Gardner (2014) Canola establishment; does size matter. GRDC Update Papers, 5 February 2014, http://www.grdc.com.au/Research-and-Development/GRDC-Update-Papers/2014/02/Canola-establishment-does-size-matter
i MORE INFORMATION
Canola establishment; does size matter?

13Pre-PlaNtINg
seCtioN 2 CANOLA
NORTHERNMarch 2017
Early seedling growth relies on stored energy reserves in the seed. Good seedling establishment is more likely if the seed is undamaged, stored correctly, and from a plant that has had adequate nutrition.
Seed moisture content, age of seed, seed size and germination percentage all contribute to seed quality. There can be substantial differences in the performance of commercial certified seed lots from different sources, and these differences can be as great as differences among varieties.
Several factors can greatly affect germination, including seed size, seed handling and harvest timing. 16
The larger the seed, the larger the cotyledon and the lipid reserves. Although seed size does not affect germination, larger seeds have earlier and faster emergence than medium-sized and small seeds. This is because larger seeds germinate more rapidly and produce longer roots than smaller seeds.
Seed size is usually measured by weighing 1000 grains; this is known as the 1000-seed weight. The 1000-seed weight differs among varieties and from season to season. As a result, sowing rates should be altered according to seed weight to achieve the desired plant population. 17
Harvest timing The timing of windrowing can also affect germination. If the crop is not windrowed at the correct time, seed development can stop, resulting in unripe seeds with reduced germination ability.
Seed chlorophyll High levels of seed chlorophyll can reduce seedling vigour and increase seedling mortality. Chlorophyll levels <35 mg/kg are desirable. Canola seed harvested from plants suffering frost or severe moisture stress during seed-filling may have elevated chlorophyll levels.
Seed handling Germination can also be affected by seed-handling procedures. Care needs to be taken when harvesting canola seed to ensure that it is not cracked. Cracking can reduce germination. 18
2.3.3 Seed storageThe aims of storage are to preserve the viability of the seed for future sowing and to maintain its quality for market. Canola is more difficult to store than cereals because of its oil content. The oil content makes canola more prone to deterioration in storage. For this reason, canola should not be stored on-farm for more than one summer.
The rate at which canola deteriorates in storage depends on: • aeration• storage temperature • seed moisture content • seed oil content • relative humidity • storage time • percentage of green or immature seeds in the sample• amount of weathering after physiological maturity.
16 J Edwards, K Hertel (2011) Canola growth and development. PROCROP Series. NSW Department of Primary Industries, http://www.dpi.nsw.gov.au/__data/assets/pdf_file/0004/516181/Procrop-canola-growth-and-development.pdf
17 J Edwards, K Hertel (2011) Canola growth and development. PROCROP Series. NSW Department of Primary Industries, http://www.dpi.nsw.gov.au/__data/assets/pdf_file/0004/516181/Procrop-canola-growth-and-development.pdf
18 J Edwards, K Hertel (2011) Canola growth and development. PROCROP Series. NSW Department of Primary Industries, http://www.dpi.nsw.gov.au/__data/assets/pdf_file/0004/516181/Procrop-canola-growth-and-development.pdf
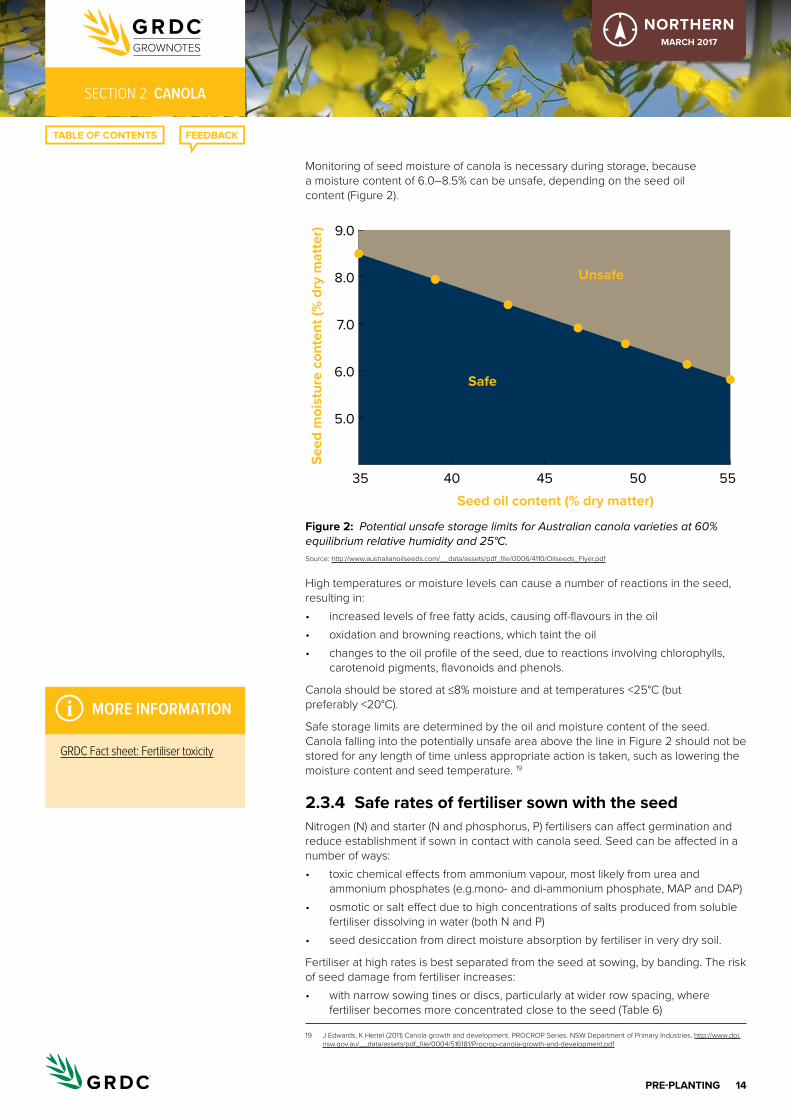
14Pre-PlaNtINg
seCtioN 2 CANOLA
NORTHERNMarch 2017
Monitoring of seed moisture of canola is necessary during storage, because a moisture content of 6.0–8.5% can be unsafe, depending on the seed oil content (Figure 2).
Figure 2:
5.0
40 55504535
6.0
7.0
8.0
9.0
Seed oil content (% dry matter)
Seed
moi
stur
e co
nten
t (%
dry
mat
ter)
Safe
Unsafe
Potential unsafe storage limits for Australian canola varieties at 60% equilibrium relative humidity and 25°C. Source: http://www.australianoilseeds.com/__data/assets/pdf_file/0006/4110/Oilseeds_Flyer.pdf
High temperatures or moisture levels can cause a number of reactions in the seed, resulting in:• increased levels of free fatty acids, causing off-flavours in the oil• oxidation and browning reactions, which taint the oil• changes to the oil profile of the seed, due to reactions involving chlorophylls,
carotenoid pigments, flavonoids and phenols.
Canola should be stored at ≤8% moisture and at temperatures <25°C (but preferably <20°C).
Safe storage limits are determined by the oil and moisture content of the seed. Canola falling into the potentially unsafe area above the line in Figure 2 should not be stored for any length of time unless appropriate action is taken, such as lowering the moisture content and seed temperature. 19
2.3.4 Safe rates of fertiliser sown with the seedNitrogen (N) and starter (N and phosphorus, P) fertilisers can affect germination and reduce establishment if sown in contact with canola seed. Seed can be affected in a number of ways:• toxic chemical effects from ammonium vapour, most likely from urea and
ammonium phosphates (e.g.mono- and di-ammonium phosphate, MAP and DAP)• osmotic or salt effect due to high concentrations of salts produced from soluble
fertiliser dissolving in water (both N and P)• seed desiccation from direct moisture absorption by fertiliser in very dry soil.
Fertiliser at high rates is best separated from the seed at sowing, by banding. The risk of seed damage from fertiliser increases:• with narrow sowing tines or discs, particularly at wider row spacing, where
fertiliser becomes more concentrated close to the seed (Table 6)
19 J Edwards, K Hertel (2011) Canola growth and development. PROCROP Series. NSW Department of Primary Industries, http://www.dpi.nsw.gov.au/__data/assets/pdf_file/0004/516181/Procrop-canola-growth-and-development.pdf
i MORE INFORMATION
GRDC Fact sheet: Fertiliser toxicity
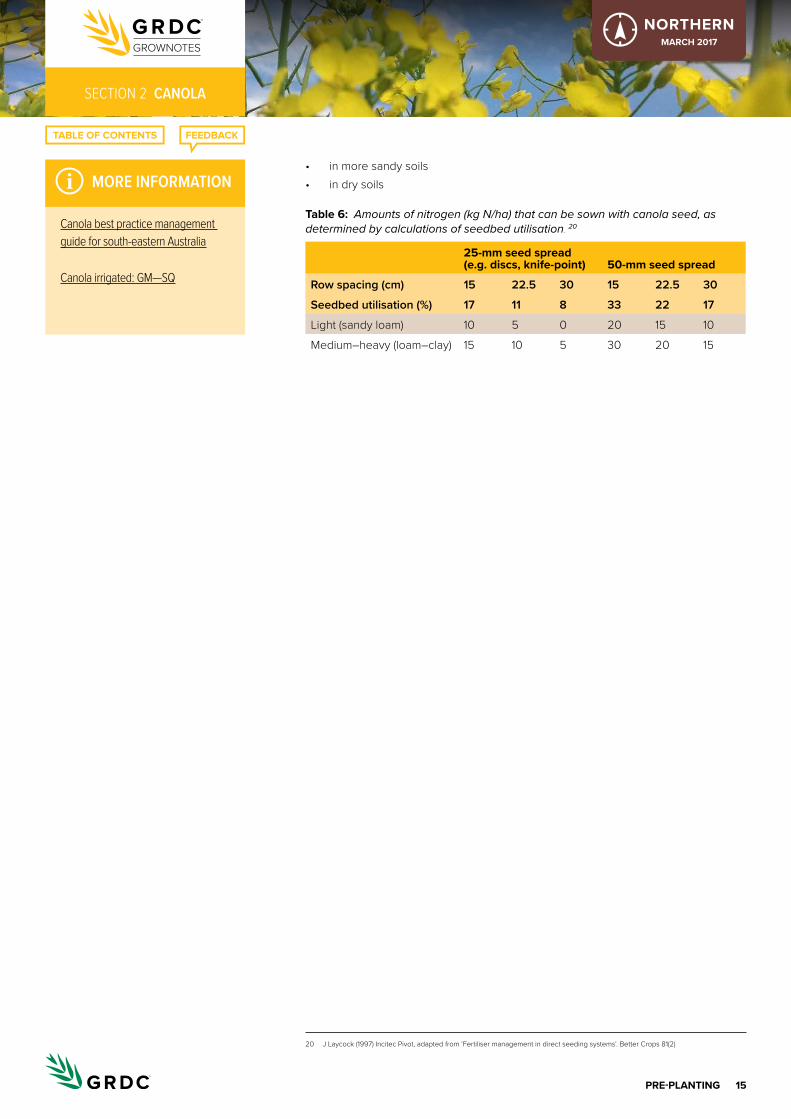
15Pre-PlaNtINg
seCtioN 2 CANOLA
NORTHERNMarch 2017
• in more sandy soils• in dry soils
table 6: Amounts of nitrogen (kg N/ha) that can be sown with canola seed, as determined by calculations of seedbed utilisation. 20
25-mm seed spread (e.g. discs, knife-point) 50-mm seed spread
Row spacing (cm) 15 22.5 30 15 22.5 30
Seedbed utilisation (%) 17 11 8 33 22 17
Light (sandy loam) 10 5 0 20 15 10
Medium–heavy (loam–clay) 15 10 5 30 20 15
20 J Laycock (1997) Incitec Pivot, adapted from ‘Fertiliser management in direct seeding systems’. Better Crops 81(2)
i MORE INFORMATION
Canola best practice management guide for south-eastern australia
Canola irrigated: GM—sQ

1PlaNtINg
seCtioN 3 CANOLA
NORTHERNMarch 2017
Planting3.1 Seed treatments
3.1.1 Insecticide treatmentsInsecticide treatments are important for the proactive control of insect pests in canola.
Imidacloprid products, such as Gaucho® 600 or Picus, are registered for use on canola seed, for protection against redlegged earth mite, blue oat mite and aphids.
These chemicals work through repellency and anti-feeding action, rather than by directly killing earth mites or aphids. They will protect emerging seedlings for 3–4 weeks after sowing. As well as the direct effects of controlling aphids, the use of imidacloprid may also reduce the incidence and spread of aphid-transmitted virus diseases during this period. This product can be applied only by registered operators. All seed companies can supply seed pre-treated with imidacloprid. Fipronil (e.g. Cosmos®) is registered for control of redlegged earth mite in canola. It should be used as part of an integrated pest management approach to redlegged earth mite.
Fipronil can be applied either on-farm or off-farm by a contractor or seed company. 1
APVMA Pubcris
Winter crop variety sowing guide 2016
3.1.2 Fungicide treatmentsFungicide treatments can be used in high disease risk situations, however depending on level of risk may not be required.
Fluquinconazole products (e.g. Jockey®) can be used in high-risk situations as a seed dressing to help minimise the effects of blackleg disease. These products may shorten the hypocotyl length of canola. To avoid the possibility of reduced emergence, do not sow treated seed deeper than 20 mm or in soils prone to crusting. Ensure that treated seed is sown in the season of treatment.
Fludioxonil + metalaxyl-M (Maxim® XL) is a fungicidal seed dressing that provides suppression of blackleg as well as protection against seedling diseases caused by Pythium spp. and Rhizoctonia solani. It will not cause shortening of the hypocotyl or affect seed viability.
Flutriafol products (Impact®) are in-furrow fungicide treatments that are mixed and sown with the fertiliser to assist in minimising the effects of blackleg disease. In situations of high blackleg pressure, research has shown flutriafol products to be superior to other fungicides for controlling blackleg disease. 2
3.2 time of sowing
Early sowings maximise yield potential and oil content (Figure 1). Traditionally ANZAC day (25 April) has been a commonly accepted ideal sowing date but growers can make adjustments from this date in response to the maturity rating of the variety grown, the respective frost risk of that paddock or climate of that location. For
1 L Jenkins (2009) Crop establishment. Ch. 5 In Canola best practice management guide for south-eastern Australia. (Eds D McCaffrey, T Potter, S Marcroft, F Pritchard) GRDC, http://www.grdc.com.au/uploads/documents/GRDC_Canola_Guide_All_1308091.pdf
2 L Jenkins (2009) Crop establishment. Ch. 5 In Canola best practice management guide for south-eastern Australia. (Eds D McCaffrey, T Potter, S Marcroft, F Pritchard) GRDC, http://www.grdc.com.au/uploads/documents/GRDC_Canola_Guide_All_1308091.pdf
i MORE INFORMATION
assessment of fungicide efficacy against blackleg disease
evaluation of fungicides for the control of downy mildew
GRDC Update papers: turning sowing times on their head with winter habit canola and wheat
early sowing of canola in southern NsW
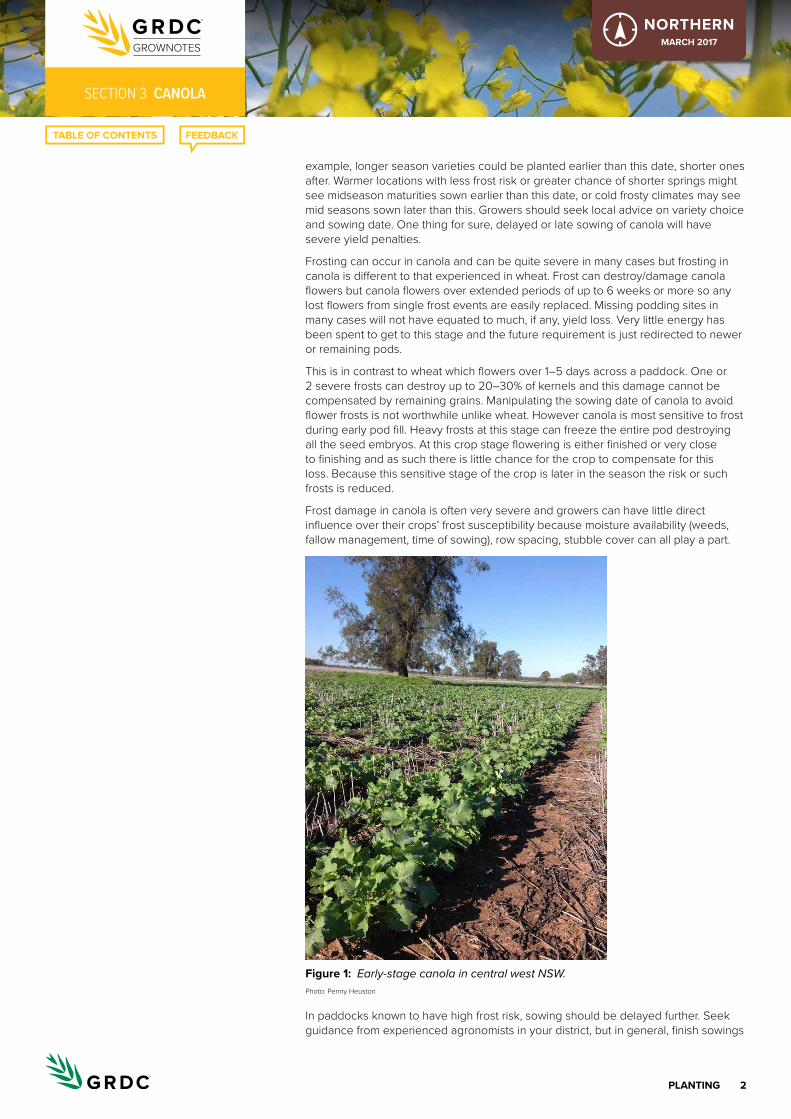
2PlaNtINg
seCtioN 3 CANOLA
NORTHERNMarch 2017
example, longer season varieties could be planted earlier than this date, shorter ones after. Warmer locations with less frost risk or greater chance of shorter springs might see midseason maturities sown earlier than this date, or cold frosty climates may see mid seasons sown later than this. Growers should seek local advice on variety choice and sowing date. One thing for sure, delayed or late sowing of canola will have severe yield penalties.
Frosting can occur in canola and can be quite severe in many cases but frosting in canola is different to that experienced in wheat. Frost can destroy/damage canola flowers but canola flowers over extended periods of up to 6 weeks or more so any lost flowers from single frost events are easily replaced. Missing podding sites in many cases will not have equated to much, if any, yield loss. Very little energy has been spent to get to this stage and the future requirement is just redirected to newer or remaining pods.
This is in contrast to wheat which flowers over 1–5 days across a paddock. One or 2 severe frosts can destroy up to 20–30% of kernels and this damage cannot be compensated by remaining grains. Manipulating the sowing date of canola to avoid flower frosts is not worthwhile unlike wheat. However canola is most sensitive to frost during early pod fill. Heavy frosts at this stage can freeze the entire pod destroying all the seed embryos. At this crop stage flowering is either finished or very close to finishing and as such there is little chance for the crop to compensate for this loss. Because this sensitive stage of the crop is later in the season the risk or such frosts is reduced.
Frost damage in canola is often very severe and growers can have little direct influence over their crops’ frost susceptibility because moisture availability (weeds, fallow management, time of sowing), row spacing, stubble cover can all play a part.
Figure 1: Early-stage canola in central west NSW. Photo: Penny Heuston
In paddocks known to have high frost risk, sowing should be delayed further. Seek guidance from experienced agronomists in your district, but in general, finish sowings

3PlaNtINg
seCtioN 3 CANOLA
NORTHERNMarch 2017
by about 1 June around Moree and 15 June south of Gunnedah at the very latest. Within these guidelines, consider sowing several varieties with different maturities and even several sowing times to spread the risks of unforeseen seasonal factors such as moisture stress or frost.
Canola usually flowers for 3–5 weeks, and frost damage is greatest if it occurs towards the end of flowering and through pod filling. Early-maturing varieties sown at the beginning of May would be subject to frosts in the late flowering and pod-filling stages, whereas midseason varieties will flower and fill pods later, reducing the risk of frost damage.
The small seeds of canola need to be sown ideally no more than 5 cm deep in self-mulching clays (2–3 cm in red soils) into well-prepared, moist seedbeds.
Good seed–soil contact, to help ensure uniform establishment, is aided by the use of rollers, cultipackers and press-wheels. The crop is suited to conventional and no-till systems.
Heavy stubble loads may reduce emergence, and should not be left over the sowing row. Triazine-tolerant (TT) varieties are less vigorous; therefore, planting methods are more critical for even establishment.
Aim to establish 30–50 plants/m in northern NSW (Table 1, Figure 2). This can be achieved with 2–4 kg/ha of seed (provided it is good-quality seed). 3 Recent work by DPI has seen them revise this number back to 20 plants, but stands with as few as 10 plants have shown little negative yield impact.
table 1: Recommended sowing times for canola in NSW. 4
region Week april May June
1 2 3 4 1 2 3 4 1 2 3 4
Northern West
East
Central West
East
Southern West
East
Irrigation1–4 are weeks of the month. , Best sowing time; , earlier or later than desirable (earlier—too vegetative, lodging, disease and/or frost risk; later—spring moisture and heat stress); , too late for good yields unless favourable spring
3 L Serafin, J Holland, R Bambach, D McCaffery (2005) Canola: northern NSW planting guide. NSW Department of Primary Industries, http://www.dpi.nsw.gov.au/__data/assets/pdf_file/0016/148300/canola-northern-NSW-planting-guide.pdf
4 P Matthews, D McCaffery, L Jenkins (2016) Winter crop variety sowing guide 2016. NSW DPI Management Guide. NSW Department of Primary Industries, http://www.dpi.nsw.gov.au/__data/assets/pdf_file/0011/272945/winter-crop-variety-sowing-guide-2016.pdf
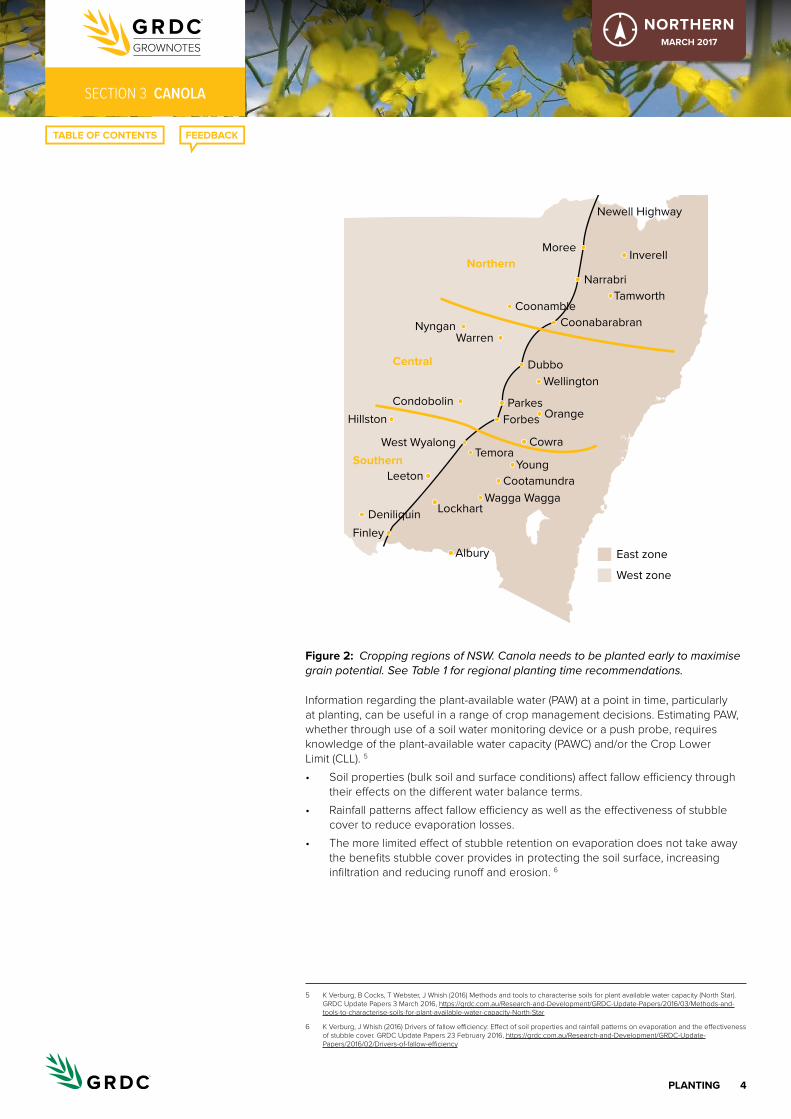
4PlaNtINg
seCtioN 3 CANOLA
NORTHERNMarch 2017
Figure 2:
Northern
Central
Southern
Lockhart
West Wyalong
Leeton
Finley
Albury
Wagga WaggaCootamundra
East zone
Cowra
Orange
Dubbo
Young
Wellington
Parkes
Temora
ForbesCondobolin
NynganWarren
Coonabarabran
Narrabri
CoonambleTamworth
InverellMoree
Newell Highway
Hillston
Deniliquin
West zone
Cropping regions of NSW. Canola needs to be planted early to maximise grain potential. See Table 1 for regional planting time recommendations.
Information regarding the plant-available water (PAW) at a point in time, particularly at planting, can be useful in a range of crop management decisions. Estimating PAW, whether through use of a soil water monitoring device or a push probe, requires knowledge of the plant-available water capacity (PAWC) and/or the Crop Lower Limit (CLL). 5
• Soil properties (bulk soil and surface conditions) affect fallow efficiency through their effects on the different water balance terms.
• Rainfall patterns affect fallow efficiency as well as the effectiveness of stubble cover to reduce evaporation losses.
• The more limited effect of stubble retention on evaporation does not take away the benefits stubble cover provides in protecting the soil surface, increasing infiltration and reducing runoff and erosion. 6
5 K Verburg, B Cocks, T Webster, J Whish (2016) Methods and tools to characterise soils for plant available water capacity (North Star). GRDC Update Papers 3 March 2016, https://grdc.com.au/Research-and-Development/GRDC-Update-Papers/2016/03/Methods-and-tools-to-characterise-soils-for-plant-available-water-capacity-North-Star
6 K Verburg, J Whish (2016) Drivers of fallow efficiency: Effect of soil properties and rainfall patterns on evaporation and the effectiveness of stubble cover. GRDC Update Papers 23 February 2016, https://grdc.com.au/Research-and-Development/GRDC-Update-Papers/2016/02/Drivers-of-fallow-efficiency
https://grdc.com.au/Research-and-Development/GRDC-Update-Papers/2016/02/Drivers-of-fallow-efficiency

5PlaNtINg
seCtioN 3 CANOLA
NORTHERNMarch 2017
3.2.1 Northern NSWIn the western zone, commence sowing mid-maturing varieties in late April. Sow early-maturing varieties about 2 weeks later than mid-maturing varieties to minimise the risk of frost damage. In the eastern zone, commence from the first week of May and finish by the end of May.
3.2.2 central and southern NSWHave paddocks ready to sow by mid–late April. An early break, allowing sowing to occur mid–late April maximises yield potential and oil content. Sowing before mid-April may lead to crops becoming too vegetative, increasing their susceptibility to lodging, disease and moisture stress during podfill. They can also be at greater risk of frost damage. For these reasons, longer season varieties should be chosen for early sowings so that flowering and pod filling occur in a period of lower frost risk and lower risk of spring moisture and heat stress.
Where there is a low risk of frost damage at early podfill, early-maturing varieties can be planted from the second week of April in the western zone. In the eastern zone of central and southern NSW, sow mid–late-maturing varieties at the start of the sowing window and early-maturing varieties towards the end of the sowing window. Aim to finish sowing by mid-May in the better rainfall areas. Yields can fall by 10% per week after this period.
3.2.3 Southern NSW irrigation areasSowing time is often determined by the close to the irrigation season. The risk of winter waterlogging, spring water availability and high spring temperatures are other considerations. These factors need to be taken into account when choosing a variety with suitable maturity. For most situations, mid-maturing to early–mid-maturing varieties are preferred. 7
To maximise grain yield potential, canola needs to be planted early. This requires careful attention to detail in relation to crop establishment. Because the soil surface dries out more rapidly in early–mid April than mid-May, seed may need to be planted slightly deeper than optimal (up to 5–6 cm deep). In this early-planting situation, pay strict attention to seed quality.
Research in the southern region has almost universally shown a negative correlation between canola later sowing date and grain yield. The challenge is that earlier sowing of canola is generally (but not always) more risky for successful crop establishment.
Recent GRDC-funded NSW Department of Primary Industries (DPI) research aimed not to improve canola establishment per se, but rather to increase the likelihood of achieving an adequate plant stand from sowing canola on time or early. The results have greatest relevance for an early planting opportunity and a lesser relevance for canola that is dry-sown or planted into moisture in May. 8
7 P Matthews, D McCaffery, L Jenkins (2016) Winter crop variety sowing guide 2016. NSW DPI Management Guide. NSW Department of Primary Industries, http://www.dpi.nsw.gov.au/__data/assets/pdf_file/0011/272945/winter-crop-variety-sowing-guide-2016.pdf
8 R Brill, L Jenkins, M Gardner (2014) Canola establishment; does size matter? GRDC Update Papers, 5 February 2014, http://www.grdc.com.au/Research-and-Development/GRDC-Update-Papers/2014/02/Canola-establishment-does-size-matter
i MORE INFORMATION
Canola establishment; does size matter?
Canola time of sowing Cowra

6PlaNtINg
seCtioN 3 CANOLA
NORTHERNMarch 2017
IN FOCUS3.3 NSW DPI research. Improving canola profit
in central NSW: effect of time of sowing and variety choice
• In western NSW, the practice of moisture seeking (sowing seed deeper than 3 cm) of canola in early–mid April into marginal moisture conditions may result in lower plant establishment rates than sowing just prior to or just after a rainfall event.
• Waiting until there was adequate moisture for sowing (early May), or dry sowing (late April) with a reliable forecast of follow-up rain, achieved higher yields than sowing in mid-April in 2012. However, the yield loss from early sowing in 2012 was assumed to be due to factors in addition to lower establishment rates.
• A high number of frost events contributed to the reduced yield potential of early-planted (mid-April) canola in 2012 in this trial in western NSW. 9
3.3.1 BackgroundCanola is an important winter crop-rotation option in western NSW. The advent of new varieties in all four herbicide groups has enabled widespread adoption over recent years. As in all areas where canola is produced, timely and uniform establishment is critical to the success of the crop. Sowing date is known to be an important management strategy to optimise yield of canola in all canola-growing regions.
Time of sowing is a balance between ideal sowing conditions and the appropriate maturity cultivar. Early sowing maximises vegetative growth (biomass) and the length of the flowering period but can predispose the crop to yield-damaging frosts at flowering and early grainfill. Later sowing may reduce frost risk but can result in poor vigour due to cold and/or wet soils at planting time, and an inability to complete seed maturity before the onset of high temperatures and moisture stress, reducing both yield and oil content.
NSW DPI recommends sowing canola from early-mid April to early May in the central-west zone (Condobolin–Nyngan), regardless of soil type (Figure 3). For western NSW regions, warm soil conditions in April, which can enable more vigorous establishment of current varieties, are often offset by lack of soil moisture in the seedbed at planting time. A trial was conducted in 2012 to investigate the effect of three times of sowing on yield and oil content of seven canola varieties (hybrid and open-pollinated) and evaluate the impact on length of flowering. For two varieties, a seeding-rate component was also included to determine interactions between sowing time and plant population, especially to investigate whether early-sown, low-density crops (<15 plants/m) show yield comparable to early-sown, higher density crops (>20 plants/m). 10
9 L Jenkins, R Brill (2013) Improving canola profit in central NSW: effect of time of sowing and variety choice. GRDC Update Papers 25 February 2013, http://www.grdc.com.au/Research-and-Development/GRDC-Update-Papers/2013/02/Improving-canola-profit-in-central-NSW-effect-of-time-of-sowing-and-variety-choice
10 L Jenkins, R Brill (2013) Improving canola profit in central NSW: effect of time of sowing and variety choice. GRDC Update Papers 25 February 2013, http://www.grdc.com.au/Research-and-Development/GRDC-Update-Papers/2013/02/Improving-canola-profit-in-central-NSW-effect-of-time-of-sowing-and-variety-choice
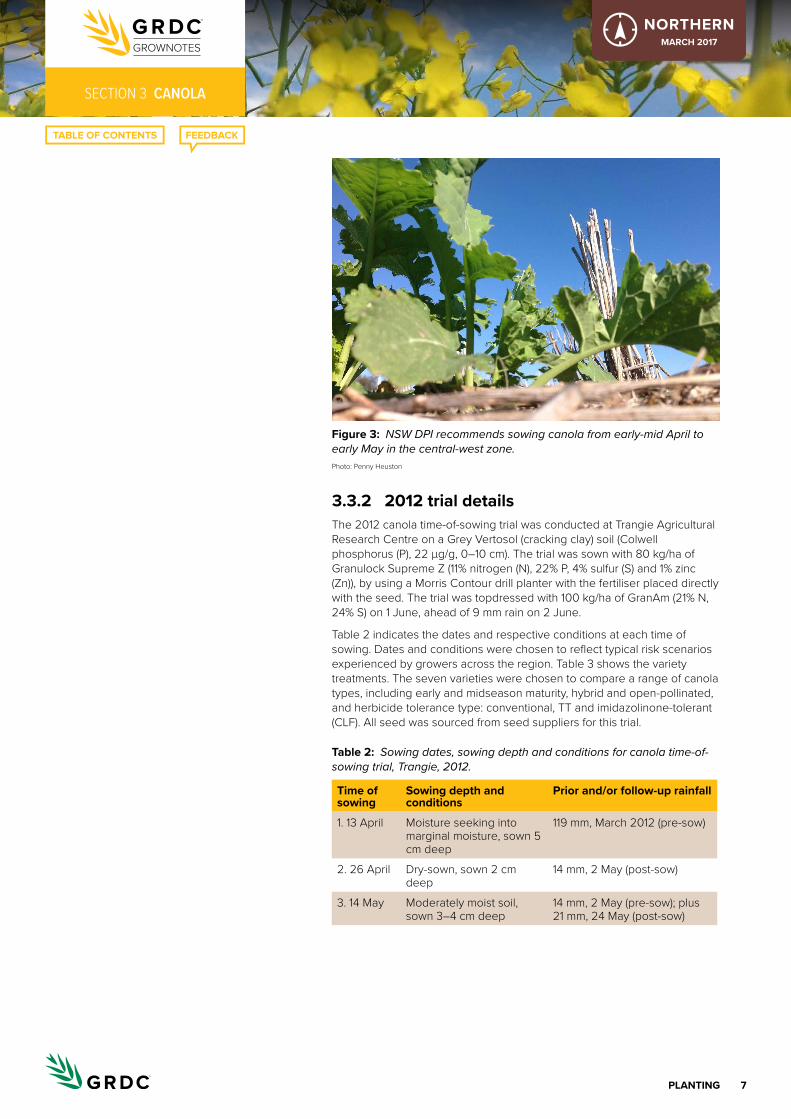
7PlaNtINg
seCtioN 3 CANOLA
NORTHERNMarch 2017
Figure 3: NSW DPI recommends sowing canola from early-mid April to early May in the central-west zone. Photo: Penny Heuston
3.3.2 2012 trial detailsThe 2012 canola time-of-sowing trial was conducted at Trangie Agricultural Research Centre on a Grey Vertosol (cracking clay) soil (Colwell phosphorus (P), 22 µg/g, 0–10 cm). The trial was sown with 80 kg/ha of Granulock Supreme Z (11% nitrogen (N), 22% P, 4% sulfur (S) and 1% zinc (Zn)), by using a Morris Contour drill planter with the fertiliser placed directly with the seed. The trial was topdressed with 100 kg/ha of GranAm (21% N, 24% S) on 1 June, ahead of 9 mm rain on 2 June.
Table 2 indicates the dates and respective conditions at each time of sowing. Dates and conditions were chosen to reflect typical risk scenarios experienced by growers across the region. Table 3 shows the variety treatments. The seven varieties were chosen to compare a range of canola types, including early and midseason maturity, hybrid and open-pollinated, and herbicide tolerance type: conventional, TT and imidazolinone-tolerant (CLF). All seed was sourced from seed suppliers for this trial.
table 2: Sowing dates, sowing depth and conditions for canola time-of-sowing trial, Trangie, 2012.
time of sowing
Sowing depth and conditions
Prior and/or follow-up rainfall
1. 13 April Moisture seeking into marginal moisture, sown 5 cm deep
119 mm, March 2012 (pre-sow)
2. 26 April Dry-sown, sown 2 cm deep
14 mm, 2 May (post-sow)
3. 14 May Moderately moist soil, sown 3–4 cm deep
14 mm, 2 May (pre-sow); plus 21 mm, 24 May (post-sow)

8PlaNtINg
seCtioN 3 CANOLA
NORTHERNMarch 2017
table 3: Variety characteristics, target plant population, number of seeds planted, seed size and actual sowing rate for canola time-of-sowing trial, Trangie, 2012.
Variety characteristics
target plant population (plants/m)
No. of seeds planted per m
Seed weight (g/1000 seeds)
actual sowing rate (kg/ha)
43C80 (CL)
Open-pollinated, Clearfield®, early maturity
40 80 3.68 2.94
43Y85 (CL) Hybrid, Clearfield®, early maturity
40 80 5.03 4.02
44Y84 (CL) Hybrid, Clearfield®, early to early–mid maturity
40 80 5.38 4.30
AV-Garnet Open-pollinated, conventional, mid to mid–early maturity
40 80 3.47 2.78
Hyola 555TT
Hybrid, triazine-tolerant, mid–early maturity
40 80 4.26 3.41
Jackpot TT Open-pollinated, triazine-tolerant, mid–early maturity
40 80 3.76 3.01
ATR-Stingray
Open-pollinated, triazine-tolerant, early maturity
40 80 3.44 2.75
44Y84 (CL)_Low
As per 44Y84 (CL), low seed rate
15 30 5.38 1.61
AV-Garnet_Low
As per AV-Garnet, low seed rate
15 30 3.47 1.04
Total establishment was assumed to be 48% (rounded up to 50%) based on germination of 80% and field establishment of 60% (industry standard figures). Hence, where 40 plants/m was the target density, sowing rate was 80 seeds/m, and for 15 plants/m, sowing rate was 30 seeds/m.
The canola varieties used in this trial were chosen as representative of particular herbicide, plant-type and maturity groups; seed companies may market other varieties with potential similar to or better than the varieties used in this trial. 11
11 L Jenkins, R Brill (2013) Improving canola profit in central NSW: effect of time of sowing and variety choice. GRDC Update Papers 25 February 2013, http://www.grdc.com.au/Research-and-Development/GRDC-Update-Papers/2013/02/Improving-canola-profit-in-central-NSW-effect-of-time-of-sowing-and-variety-choice

9PlaNtINg
seCtioN 3 CANOLA
NORTHERNMarch 2017
3.3.3 2012 trial resultsEffect of time of sowing on establishmentDate and days to emergence (as an average for all varieties) were recorded for the three times of sowing (TOS): 1 (24 April), 11 days; 2 (4 May), 8 days; 3 (28 May), 14 days. Plant counts (Figure 4) were conducted progressively for each time of sowing once there was no recorded change in emergence scores (conducted three times per week).
Figure 4:
4050607080
3020100
Esta
blis
hmen
t (pl
ants
/m2 )
Variety × sowing date
43C80 CL
AV-Garn
et
Jack
pot TT
ATR-Stringray
Hyola5
55TT
43Y85 C
L
44Y84CL
44Y84 CL_
Low
AV-Garn
et_Low
13 April 26 April 14 May
Establishment of seven canola varieties with two target plant populations (40 or 15 plants/m) at three sowing dates (13 April, 26 April, 14 May), Trangie, 2012.
All varieties had reduced establishment from TOS 1, regardless of type (open-pollinated or hybrid) or seed size. For TOS 1, moisture seeking was used to a depth of 5 cm into marginal moisture because there was no rainfall event in early April to plant on. Depth of sowing at TOS 1 may have had a greater effect on establishment than lack of moisture at sowing. For the standard target plant population (40 plants/m), the average of all varieties was 16 plants/m, with only two hybrids (Hyola 555TT and 43Y85 (CL)) achieving >25% establishment (i.e. plant count >20 plants/m from 80 seeds/m planted). For the low seeding rate (target 15 plants/m), the average was <7 plants/m (i.e. <25% target establishment from 30 seeds/m planted). AV-Garnet had the lowest plant count at both seeding rates.
Establishment for all varieties at TOS 2 and TOS 3 exceeded the target plant population, because plant establishment was greater than the assumed 50% on which seed rates were calculated. This could be due to either the shallower sowing depth and/or the follow-up rainfall received post-sowing. TOS 2, with dry sowing at 2 cm depth, showed quicker emergence than either TOS 1 or TOS 3, once follow-up rain was received. The average plant counts for the standard sowing rate (target 40 plants/m) was 48 plants/m (60%) for both TOS 2 and TOS 3, whereas for the low sowing rate (target 15 plants/m), TOS 2 achieved 18 plants/m (60%) and TOS 3 achieved 20 plants/m (67%).
In terms of variety effect, the three hybrids, with seed size >4 g/1000 seeds (Hyola 555TT, 43Y85 (CL) and 44Y84 (CL)), averaged 74% establishment, compared with the four open-pollinated varieties, with seed size <4 g/1000 seeds, which averaged 61% establishment. 12
12 L Jenkins, R Brill (2013) Improving canola profit in central NSW: effect of time of sowing and variety choice. GRDC Update Papers 25 February 2013, http://www.grdc.com.au/Research-and-Development/GRDC-Update-Papers/2013/02/Improving-canola-profit-in-central-NSW-effect-of-time-of-sowing-and-variety-choice
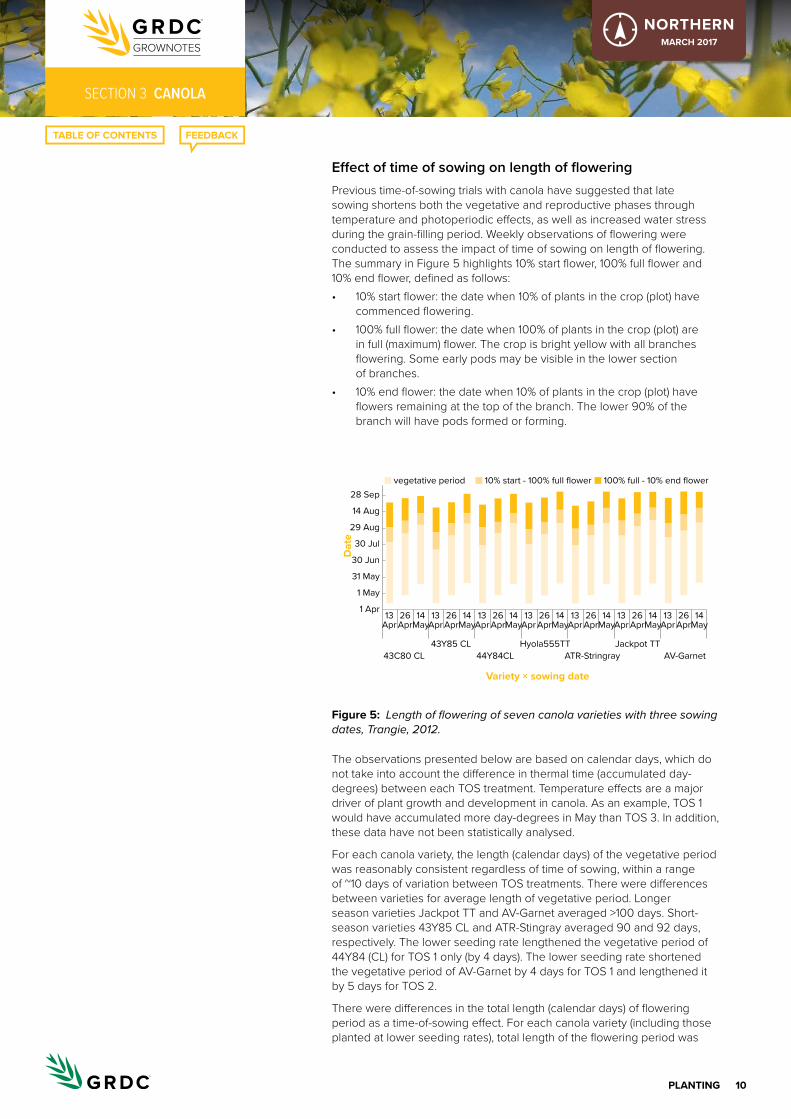
10PlaNtINg
seCtioN 3 CANOLA
NORTHERNMarch 2017
Effect of time of sowing on length of floweringPrevious time-of-sowing trials with canola have suggested that late sowing shortens both the vegetative and reproductive phases through temperature and photoperiodic effects, as well as increased water stress during the grain-filling period. Weekly observations of flowering were conducted to assess the impact of time of sowing on length of flowering. The summary in Figure 5 highlights 10% start flower, 100% full flower and 10% end flower, defined as follows:• 10% start flower: the date when 10% of plants in the crop (plot) have
commenced flowering.• 100% full flower: the date when 100% of plants in the crop (plot) are
in full (maximum) flower. The crop is bright yellow with all branches flowering. Some early pods may be visible in the lower section of branches.
• 10% end flower: the date when 10% of plants in the crop (plot) have flowers remaining at the top of the branch. The lower 90% of the branch will have pods formed or forming.
Figure 5:
30 Jul
29 Aug
14 Aug
28 Sep
30 Jun
31 May
1 May
1 Apr
Dat
e
Variety × sowing date
43C80 CL AV-GarnetJackpot TT
ATR-StringrayHyola555TT43Y85 CL
44Y84CL
vegetative period 10% start - 100% full flower 100% full - 10% end flower
13Apr
26Apr
14May
13Apr
26Apr
14May
13Apr
26Apr
14May
13Apr
26Apr
14May
13Apr
26Apr
14May
13Apr
26Apr
14May
13Apr
26Apr
14May
Length of flowering of seven canola varieties with three sowing dates, Trangie, 2012.
The observations presented below are based on calendar days, which do not take into account the difference in thermal time (accumulated day-degrees) between each TOS treatment. Temperature effects are a major driver of plant growth and development in canola. As an example, TOS 1 would have accumulated more day-degrees in May than TOS 3. In addition, these data have not been statistically analysed.
For each canola variety, the length (calendar days) of the vegetative period was reasonably consistent regardless of time of sowing, within a range of ~10 days of variation between TOS treatments. There were differences between varieties for average length of vegetative period. Longer season varieties Jackpot TT and AV-Garnet averaged >100 days. Short-season varieties 43Y85 CL and ATR-Stingray averaged 90 and 92 days, respectively. The lower seeding rate lengthened the vegetative period of 44Y84 (CL) for TOS 1 only (by 4 days). The lower seeding rate shortened the vegetative period of AV-Garnet by 4 days for TOS 1 and lengthened it by 5 days for TOS 2.
There were differences in the total length (calendar days) of flowering period as a time-of-sowing effect. For each canola variety (including those planted at lower seeding rates), total length of the flowering period was

11PlaNtINg
seCtioN 3 CANOLA
NORTHERNMarch 2017
shortened as sowing was delayed. Lengths of flowering period averaged for all varieties were 62 days (TOS 1), 55 days (TOS 2) and 47 days (TOS 3). Some varieties showed a greater difference between TOS 1 and TOS 2 (e.g. 43Y85 (CL), 13 days; 44Y84 (CL), 11 days), whereas other varieties were more affected by the delay from TOS 2 to TOS 3 (e.g. AV-Garnet, 12 days; Jackpot TT, 10 days). The Pioneer Clearfield® varieties appeared more affected than the TT varieties (shorter flowering period by up to 20 days). The lower seeding rate had opposite effects on the two varieties tested. In 44Y84 (CL)_Low, flowering period was 1.5 days shorter for TOS 1 but 2–3 days longer for TOS 2 and TOS 3 than in 44Y84 (CL). In AV-Garnet_Low, flowering period was 4 days longer for TOS 1 but up to 5 days shorter for TOS 2 and TOS 3 than in AV-Garnet. 13
Effect of time of sowing on yieldThere were significant differences in yield (Figure 6) with regard to both variety and time of sowing. However, there was no significant variety × sowing time interaction, meaning that varieties performed relatively consistently regardless of when they were planted.
Figure 6:
013 April 26 April 9 May
1.5
1.25
1.0
1.75
2.0
Yie
ld (t
/ha)
Sowing date
43C80 CL
AV-Garnet
Jackpot TTATR-Stringray
Hyola555TT
43Y85 CL44Y84CL
Grain yield (t/ha) of seven canola varieties sown with three sowing dates, Trangie, 2012. For statistical comparisons, l.s.d. (P = 0.05) is 0.16 t/ha for varieties and 0.1 t/ha for sowing dates.
Analysis of the effect of time of sowing, averaged for all varieties, showed that yield for TOS 3 was significantly higher than for TOS 2 (by 0.11 t/ha) and, in turn, yield for TOS 2 was significantly higher than for TOS 1 (by 0.43 t/ha). The lower yield of TOS 1 was likely due to a combination of factors including reduced plant establishment, frost damage from early flowering, and potentially higher rates of vegetative water use.
The hybrids 44Y84 (CL) and 43Y85 (CL) were the highest yielding varieties in the trial, with an average yield across all sowing times of 1.72 and 1.62 t/ha, respectively. Jackpot TT and ATR-Stingray were the lowest yielding varieties, with an average yield across all sowing times of 1.15 and 1.07 t/ha, respectively.
Seeding-rate treatment had a significant effect on yield (P = 0.002). Averaged over the two varieties (44Y84 (CL) and AV-Garnet), the high seeding rate targeting 40 plants/m yielded 0.24 t/ha more than the low seeding rate targeting 15 plants/m (l.s.d. (P = 0.05), 0.14 t/ha). There was no
13 L Jenkins, R Brill (2013) Improving canola profit in central NSW: effect of time of sowing and variety choice. GRDC Update Papers 25 February 2013, http://www.grdc.com.au/Research-and-Development/GRDC-Update-Papers/2013/02/Improving-canola-profit-in-central-NSW-effect-of-time-of-sowing-and-variety-choice

12PlaNtINg
seCtioN 3 CANOLA
NORTHERNMarch 2017
seeding rate × sowing time interaction, meaning that the advantage of the higher seeding rate was observed for all sowing times. 14
Effect of time of sowing on oil contentThere were significant differences in oil content between varieties (Figure 7), but no significant difference due to time of sowing. Jackpot TT had the highest average oil content (43.2%), followed by 44Y84 (CL) (42.1%). All other varieties averaged less than the minimum base oil content of 42%, meaning that discounts would apply at delivery. The lowest of these were 43Y85 (CL) (40.8%) and Hyola 555TT (40.6%)
There was no significant effect of seeding-rate treatment on oil content. 15
Figure 7:
4142434445
4039
3635
3738
Oil
conc
entr
atio
n (%
)
Variety
43C80 CL
AV-Garn
et
Jack
pot TT
ATR-Strin
gray
Hyola5
55TT
43Y85 C
L
44Y84CL
Oil concentration at 6% moisture of seven canola varieties averaged across three sowing dates, Trangie, 2012. For statistical comparison between varieties, l.s.d. (P = 0.05) is 0.6%.
3.3.4 DiscussionPreviously published time-of-sowing trial data suggest that, generally, early sowing (early–mid April) predisposes the crop to greater frost risk during flowering, whereas delayed sowing (late May–late June in southern grain zones) can result in reduced yield potential. This reduced potential is due to a combination of factors, including a shortened vegetative period (reduced crop biomass), reduced length of flowering period, and moisture and high temperature stress at grainfill.
The present trial was focused on the early sowing period for western NSW, from mid-April to early May. TOS 1 (13 April) involved moisture seeking into marginal moisture at 5 cm depth, resulting in an average of <25% establishment of target plant densities. TOS 2 (26 April) showed that dry sowing can be a viable option for canola if there is a reliable forecast of follow-up rain (15–20 mm). TOS 2 received 14 mm rain on 2 May and the crop had begun emerging by 4 May. TOS 3 (14 May) was sown into good moisture and received 21 mm follow-up rainfall. Both TOS 2 and TOS 3 achieved plant densities higher than the target because the field establishment percentage was greater than the assumed 50%.
14 L Jenkins, R Brill (2013) Improving canola profit in central NSW: effect of time of sowing and variety choice. GRDC Update Papers 25 February 2013, http://www.grdc.com.au/Research-and-Development/GRDC-Update-Papers/2013/02/Improving-canola-profit-in-central-NSW-effect-of-time-of-sowing-and-variety-choice
15 L Jenkins, R Brill (2013) Improving canola profit in central NSW: effect of time of sowing and variety choice. GRDC Update Papers 25 February 2013, http://www.grdc.com.au/Research-and-Development/GRDC-Update-Papers/2013/02/Improving-canola-profit-in-central-NSW-effect-of-time-of-sowing-and-variety-choice
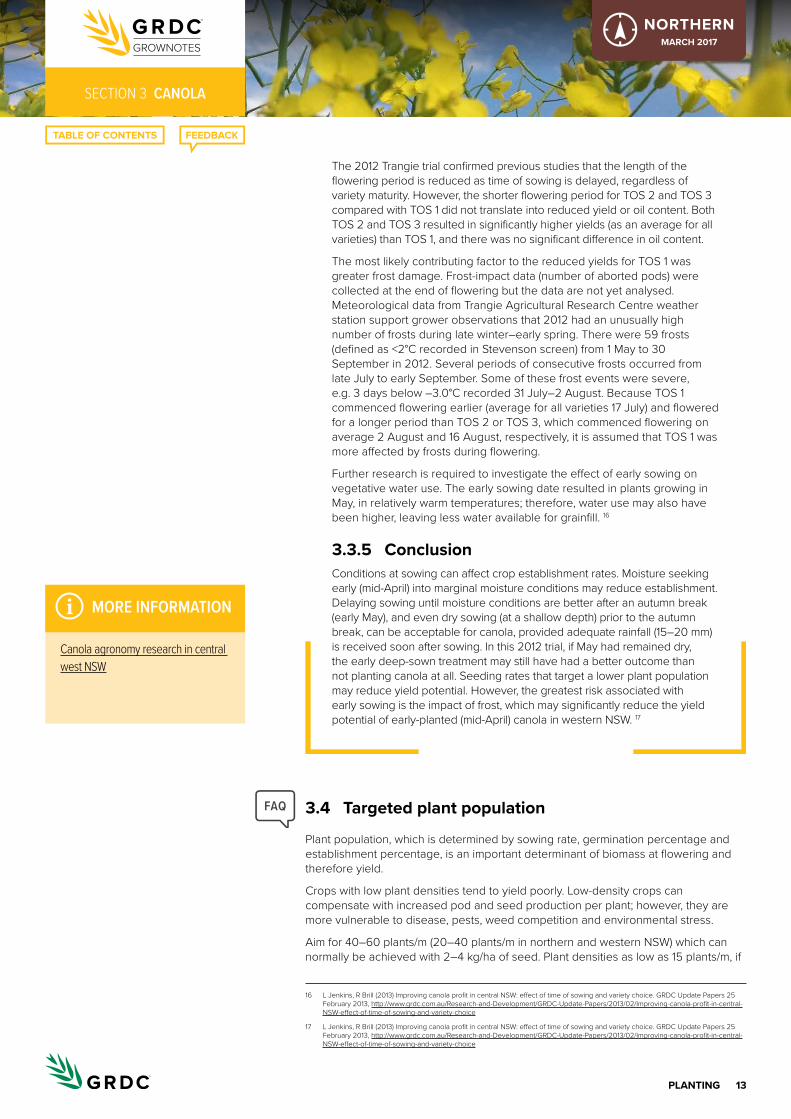
13PlaNtINg
seCtioN 3 CANOLA
NORTHERNMarch 2017
The 2012 Trangie trial confirmed previous studies that the length of the flowering period is reduced as time of sowing is delayed, regardless of variety maturity. However, the shorter flowering period for TOS 2 and TOS 3 compared with TOS 1 did not translate into reduced yield or oil content. Both TOS 2 and TOS 3 resulted in significantly higher yields (as an average for all varieties) than TOS 1, and there was no significant difference in oil content.
The most likely contributing factor to the reduced yields for TOS 1 was greater frost damage. Frost-impact data (number of aborted pods) were collected at the end of flowering but the data are not yet analysed. Meteorological data from Trangie Agricultural Research Centre weather station support grower observations that 2012 had an unusually high number of frosts during late winter–early spring. There were 59 frosts (defined as <2°C recorded in Stevenson screen) from 1 May to 30 September in 2012. Several periods of consecutive frosts occurred from late July to early September. Some of these frost events were severe, e.g. 3 days below –3.0°C recorded 31 July–2 August. Because TOS 1 commenced flowering earlier (average for all varieties 17 July) and flowered for a longer period than TOS 2 or TOS 3, which commenced flowering on average 2 August and 16 August, respectively, it is assumed that TOS 1 was more affected by frosts during flowering.
Further research is required to investigate the effect of early sowing on vegetative water use. The early sowing date resulted in plants growing in May, in relatively warm temperatures; therefore, water use may also have been higher, leaving less water available for grainfill. 16
3.3.5 conclusionConditions at sowing can affect crop establishment rates. Moisture seeking early (mid-April) into marginal moisture conditions may reduce establishment. Delaying sowing until moisture conditions are better after an autumn break (early May), and even dry sowing (at a shallow depth) prior to the autumn break, can be acceptable for canola, provided adequate rainfall (15–20 mm) is received soon after sowing. In this 2012 trial, if May had remained dry, the early deep-sown treatment may still have had a better outcome than not planting canola at all. Seeding rates that target a lower plant population may reduce yield potential. However, the greatest risk associated with early sowing is the impact of frost, which may significantly reduce the yield potential of early-planted (mid-April) canola in western NSW. 17
3.4 targeted plant population
Plant population, which is determined by sowing rate, germination percentage and establishment percentage, is an important determinant of biomass at flowering and therefore yield.
Crops with low plant densities tend to yield poorly. Low-density crops can compensate with increased pod and seed production per plant; however, they are more vulnerable to disease, pests, weed competition and environmental stress.
Aim for 40–60 plants/m (20–40 plants/m in northern and western NSW) which can normally be achieved with 2–4 kg/ha of seed. Plant densities as low as 15 plants/m, if
16 L Jenkins, R Brill (2013) Improving canola profit in central NSW: effect of time of sowing and variety choice. GRDC Update Papers 25 February 2013, http://www.grdc.com.au/Research-and-Development/GRDC-Update-Papers/2013/02/Improving-canola-profit-in-central-NSW-effect-of-time-of-sowing-and-variety-choice
17 L Jenkins, R Brill (2013) Improving canola profit in central NSW: effect of time of sowing and variety choice. GRDC Update Papers 25 February 2013, http://www.grdc.com.au/Research-and-Development/GRDC-Update-Papers/2013/02/Improving-canola-profit-in-central-NSW-effect-of-time-of-sowing-and-variety-choice
i MORE INFORMATION
Canola agronomy research in central west NsW
FAQ

14PlaNtINg
seCtioN 3 CANOLA
NORTHERNMarch 2017
consistent across a paddock, can still result in profitable crops when sown early and plants have time to compensate. Seed size varies between and within varieties and hybrids. Check seed size to calculate the correct number of seeds per square metre to be sown (see NSW DPI Winter crop variety sowing guide 2016). 18
Increasing the sowing rate increases competition between plants, creating thinner main stems and fewer, less productive branches.
Reducing the sowing rate creates plants with thicker main stems and more branches, delays leaf-area development, reduces biomass at flowering, and ultimately reduces yield.
3.4.1 calculating seed requirementsCorrect seed rates are critical in ensuring that target plant density is reached. Calculation of seeding rates for canola is different from that for wheat.
Suppliers usually supply canola seed by number of seeds per kg, e.g. 200,000 seeds/kg. To determine the seeding rate based on this, the formula below assumes that plant density and germination are known.
Sowing rate (kg/ha) = (target plant density × 1,000,000)/(seeds/kg × expected germination)
example
44Y84 has a seed count of 211,400 seeds/kg. We want to achieve a target plant density of 40 plants/m and assume that 85% of the seeds will germinate.
Thus, the seeding rate = (40 × 1,000,000)/(211,400 × 85) = 40,000,000/17,969,000 = 2.23 kg/ha 19
Seeding rate calculators
Pacific Seeds: canola seed planting rate calculators
Pioneer canola seed rate calculator
3.4.2 row spacingCanola has traditionally been sown at 15 cm row spacing, but the adoption of stubble retention and no-till farming systems has resulted in a trend to wider row spacing and the possibility of inter-row sowing using GPS guidance systems.
Experiments in southern NSW have shown that widening row spacing in canola does appear to reduce yield when the row space is increased to 35 cm. 20 Aim for 40–60 plants/m (20–40 plants/m in northern and western NSW), which can normally be achieved with 2–4 kg/ha of seed. Plant densities as low as 15 plants/m, if consistent across a paddock, can still result in profitable crops when sown early and plants have time to compensate. Seed size varies between and within varieties and hybrids. Check seed size to calculate the correct number of seeds to be sown per m.
Establishment can be significantly reduced by sowing too deep, sowing late into cold, wet soils, and no-till sowing into dense stubble. Use the higher seed rate, consider sowing the seed at a shallower depth, or select a variety or hybrid with high vigour in these situations. Hybrids are generally more vigorous than open-pollinated varieties, primarily because of larger seed size. Where seed is retained on-farm, grade the seed and keep the largest seed for sowing.
High plant densities, combined with suitable environmental conditions, can increase the risk of Sclerotinia stem rot during flowering. High plant densities can also
18 P Matthews, D McCaffery, L Jenkins (2016) Winter crop variety sowing guide 2016. NSW DPI Management Guide. NSW Department of Primary Industries, http://www.dpi.nsw.gov.au/__data/assets/pdf_file/0011/272945/winter-crop-variety-sowing-guide-2016.pdf
19 BCG (2015) Calculating canola seeding rates. News article. Birchip Cropping Group, http://www.bcg.org.au/calculating-canola-seeding-rates/
20 J Edwards, K Hertel (2011) Canola growth and development. PROCROP Series. NSW Department of Primary Industries, http://www.dpi.nsw.gov.au/__data/assets/pdf_file/0004/516181/Procrop-canola-growth-and-development.pdf
i MORE INFORMATION
over the bar with better canola agronomy

15PlaNtINg
seCtioN 3 CANOLA
NORTHERNMarch 2017
increase the risk of moisture deficit during grainfill in dry spring conditions, potentially reducing yields. 21
3.5 Sowing depth
Where conditions allow, aim to drill seed through the main seed box to 1.5–3 cm deep and up to 5 cm in self-mulching clays. Where there is moisture below 1.5–3 cm, a reduced but viable establishment may still be achieved by sowing deeper, provided large seed is sown. This strategy can be used to sow some of the crop on time in seasons of good summer rainfall followed by drying surface seedbeds in autumn. Success with this strategy depends on soil type, soil structure and the amount and timing of follow-up rainfall. 22
Sowing depth has a major influence on seedling vigour, which subsequently affects seedling establishment and crop performance. A sowing depth of 1.2–2.5 cm is ideal.
Deep seed placement increases the risk of failed emergence. Deeper sowing reduces light availability, and the hypocotyl (the shoot that emerges from the seed) responds to this by elongating, reducing the chance of seedling emergence. Seeds planted >2 cm deep or into >5 t/ha of stubble develop elongated hypocotyls. This elongation depletes the seed reserves more quickly than in seeds with shorter hypocotyls. The longer hypocotyls are also thinner, with decreased tissue density, and are more susceptible to mechanical damage and collapse.
Plants with longer hypocotyls have smaller root systems, less leaf area from an early stage, and less leaf and root biomass. Leaves are slower to expand, which reduces dry matter. As a result, plants that allocate more resources to the hypocotyls at the expense of leaves and roots have lower relative growth rates. 23
This effect can contribute to slower growth of plants in surface-mulch treatments, and the slower growth can be compounded by low temperatures.
IN FOCUS3.5.1 canola establishment research Sowing depth trials were conducted at Coonamble, Nyngan and Trangie in 2012 and at Nyngan and Trangie in 2013. Each trial had six common varieties with a range in seed size (Table 4). Target seeding depths were 2.5, 5 and 7.5 cm.
table 4: Seed size and number of seeds sown in three canola variety–sowing depth trials in 2012.
Variety Seed weight (g/1000 seeds)
No. of seeds sown per m
2012 2013
AV-Garnet 3.78 3.27 60
ATR-Stingray 3.06 2.97 60
Pioneer 43C80 (CL) 3.68 4.11 60
Pioneer 43Y85 (CL) 5.03 4.77 60
21 P Matthews, D McCaffery, L Jenkins (2016) Winter crop variety sowing guide 2016. NSW DPI Management Guide. NSW Department of Primary Industries, http://www.dpi.nsw.gov.au/__data/assets/pdf_file/0011/272945/winter-crop-variety-sowing-guide-2016.pdf
22 P Matthews, D McCaffery, L Jenkins (2016) Winter crop variety sowing guide 2016. NSW DPI Management Guide. NSW Department of Primary Industries, http://www.dpi.nsw.gov.au/__data/assets/pdf_file/0011/272945/winter-crop-variety-sowing-guide-2016.pdf
23 L Jenkins, R Brill (2013) Improving canola profit in central NSW: effect of time of sowing and variety choice. GRDC Update Papers 25 February 2013, http://www.grdc.com.au/Research-and-Development/GRDC-Update-Papers/2013/02/Improving-canola-profit-in-central-NSW-effect-of-time-of-sowing-and-variety-choice
i MORE INFORMATION
over the bar with better canola agronomy

16PlaNtINg
seCtioN 3 CANOLA
NORTHERNMarch 2017
Variety Seed weight (g/1000 seeds)
No. of seeds sown per m
2012 2013
Pioneer 44Y84 (CL) 5.34 5.20 60
Hyola 555TT 4.26 4.00 60
In 2012, averaged across all trials and varieties, establishment (as a percentage of seeds sown) at the target depth of 2.5 cm was ~66%, with no difference between varieties. All varieties had reduced establishment at 5 cm sowing depth relative to 2.5 cm sowing depth, with the exception of Pioneer 44Y84 (CL), which had the largest seed (Figure 8). At 7.5 cm sowing depth, the differences between varieties, and seed size, became more marked, with the largest seeded variety achieving 50% establishment compared with 20% for the smallest seeded variety.
Figure 8:
20
30
40
50
60
10
0Esta
blis
hmen
t (pl
ants
/m2)
Variety
Hyola
555TT
Pioneer 438Y85 (C
L)
Pioneer 44Y84 (C
L)
Pioneer 43c8
0 (CL)
AV Garn
et
ATR Stingray
l.s.d. p=0.052.5 cm5.0 cm7.5 cm
Establishment of six canola varieties at three sowing depths, averaged across three trials at Coonamble, Nyngan and Trangie in 2012.
The effect of sowing depth on grain yield in 2012 was less marked than the effect on establishment. At Nyngan and Coonamble, the target depth of 7.5 cm yielded ~250 kg/ha less grain than the target depths of 2.5 and 5 cm. At Nyngan, Pioneer 44Y84 (CL) showed no grain-yield reduction at 7.5 cm sowing depth compared with the shallower sowing depths; however, all other varieties showed a significant grain-yield reduction as a result of deep sowing. There was no effect of sowing depth on grain yield at Trangie.
In 2013, the overall establishment achieved was less than in 2012. At 2.5 cm sowing depth, establishment was approximately 50%, with no significant difference between varieties (Figure 9). All varieties showed reduced establishment at 5 cm sowing depth compared with 2.5 cm; however, the reduction was less severe for the hybrids than for the open-pollinated varieties. Establishment was further reduced at 7.5 cm sowing depth, with a hybrid advantage similar to that at 5 cm sowing depth.
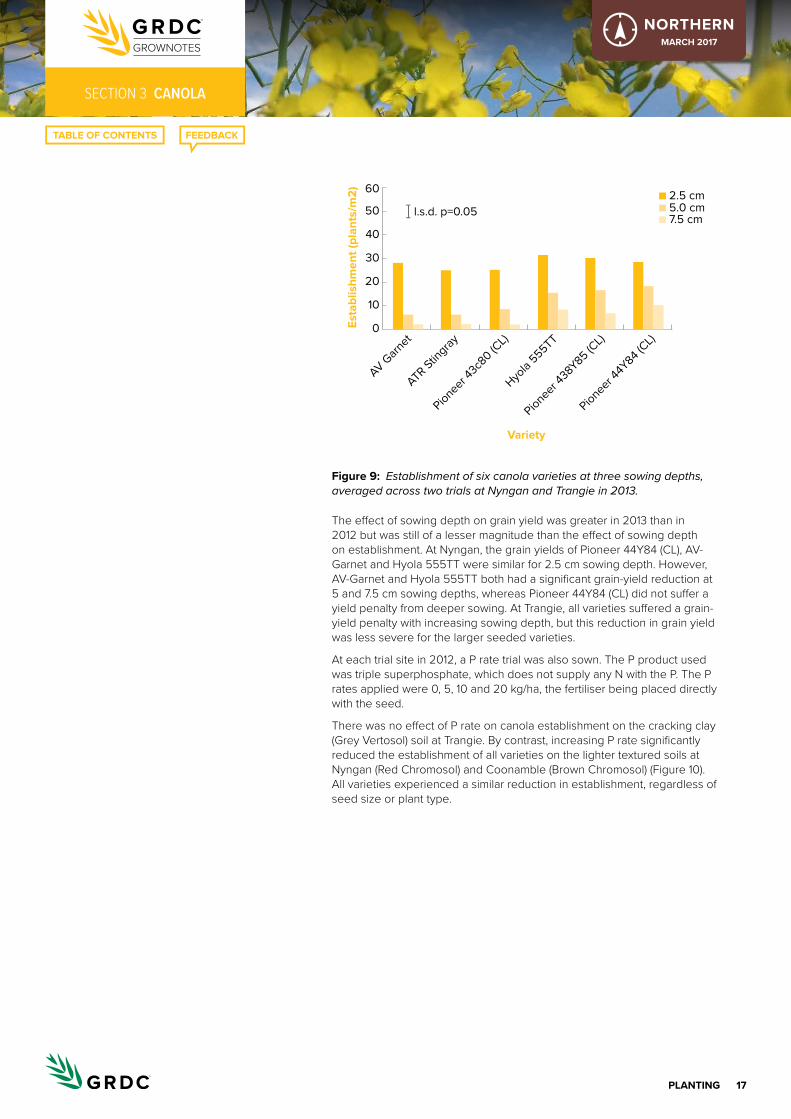
17PlaNtINg
seCtioN 3 CANOLA
NORTHERNMarch 2017
Figure 9:
20
30
40
50
60
10
0Esta
blis
hmen
t (pl
ants
/m2)
Variety
Hyola
555TT
Pioneer 438Y85 (C
L)
Pioneer 44Y84 (C
L)
Pioneer 43c8
0 (CL)
AV Garn
et
ATR Stingray
l.s.d. p=0.052.5 cm5.0 cm7.5 cm
Establishment of six canola varieties at three sowing depths, averaged across two trials at Nyngan and Trangie in 2013.
The effect of sowing depth on grain yield was greater in 2013 than in 2012 but was still of a lesser magnitude than the effect of sowing depth on establishment. At Nyngan, the grain yields of Pioneer 44Y84 (CL), AV-Garnet and Hyola 555TT were similar for 2.5 cm sowing depth. However, AV-Garnet and Hyola 555TT both had a significant grain-yield reduction at 5 and 7.5 cm sowing depths, whereas Pioneer 44Y84 (CL) did not suffer a yield penalty from deeper sowing. At Trangie, all varieties suffered a grain-yield penalty with increasing sowing depth, but this reduction in grain yield was less severe for the larger seeded varieties.
At each trial site in 2012, a P rate trial was also sown. The P product used was triple superphosphate, which does not supply any N with the P. The P rates applied were 0, 5, 10 and 20 kg/ha, the fertiliser being placed directly with the seed.
There was no effect of P rate on canola establishment on the cracking clay (Grey Vertosol) soil at Trangie. By contrast, increasing P rate significantly reduced the establishment of all varieties on the lighter textured soils at Nyngan (Red Chromosol) and Coonamble (Brown Chromosol) (Figure 10). All varieties experienced a similar reduction in establishment, regardless of seed size or plant type.
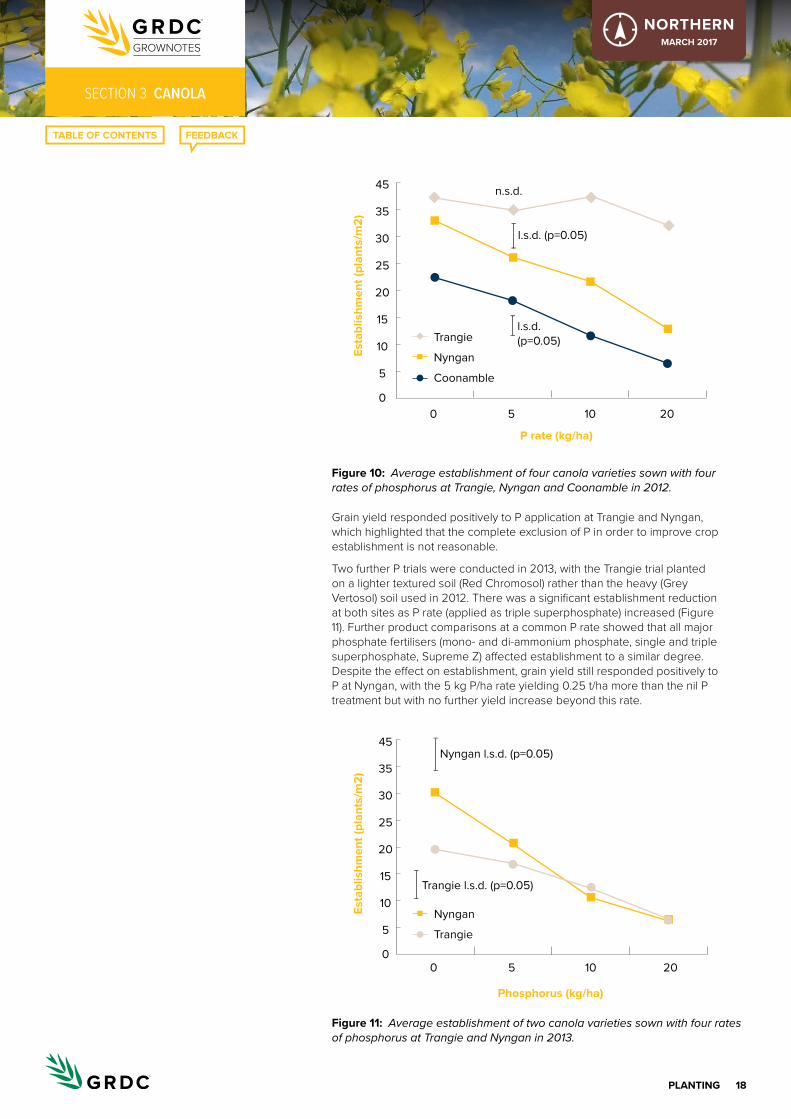
18PlaNtINg
seCtioN 3 CANOLA
NORTHERNMarch 2017
Figure 10:
0
10
5
15
20
25
30
35
45
50 2010
Esta
blis
hmen
t (pl
ants
/m2)
P rate (kg/ha)
n.s.d.
l.s.d. (p=0.05)
l.s.d. (p=0.05)Trangie
Nyngan
Coonamble
Average establishment of four canola varieties sown with four rates of phosphorus at Trangie, Nyngan and Coonamble in 2012.
Grain yield responded positively to P application at Trangie and Nyngan, which highlighted that the complete exclusion of P in order to improve crop establishment is not reasonable.
Two further P trials were conducted in 2013, with the Trangie trial planted on a lighter textured soil (Red Chromosol) rather than the heavy (Grey Vertosol) soil used in 2012. There was a significant establishment reduction at both sites as P rate (applied as triple superphosphate) increased (Figure 11). Further product comparisons at a common P rate showed that all major phosphate fertilisers (mono- and di-ammonium phosphate, single and triple superphosphate, Supreme Z) affected establishment to a similar degree. Despite the effect on establishment, grain yield still responded positively to P at Nyngan, with the 5 kg P/ha rate yielding 0.25 t/ha more than the nil P treatment but with no further yield increase beyond this rate.
Figure 11:
0
10
5
15
20
25
30
35
45
50 2010
Esta
blis
hmen
t (pl
ants
/m2)
Phosphorus (kg/ha)
Nyngan l.s.d. (p=0.05)
Trangie l.s.d. (p=0.05)
Nyngan
Trangie
Average establishment of two canola varieties sown with four rates of phosphorus at Trangie and Nyngan in 2013.
19PlaNtINg
seCtioN 3 CANOLA
NORTHERNMarch 2017
For growers using a tine seeder, it is generally possible (and recommended) to separate seed and fertiliser to avoid the negative effects of starter fertiliser. For growers with a disc seeder (or considering a disc seeder), several management options are available, such as:• Plant on relatively narrow crop rows to reduce fertiliser concentration
in the furrow.• Plant canola early to allow greater root exploration, with potentially
less P application required.• Pay strict attention to closing devices; the firmer or heavier the closing
device, the greater the negative effects of P fertiliser. 24
ConclusionTo maximise grain-yield potential, canola needs to be planted early. This requires careful attention to the details of crop establishment. Because the soil surface dries out more rapidly in early-mid April than mid-May, seed may need to be planted slightly deeper than optimal (up to 5–6 cm deep). In this early planting situation, pay attention to seed quality. Sowing large seeds (> 5 g/1000 seeds) increases the likelihood of achieving an adequate establishment. For growers who wish to purchase seed, hybrid seed is generally larger than open-pollinated seed. For growers who retain open-pollinated seed on farm for their own use, aim to clean seed with a 2-mm screen.
Phosphorus is essential for canola growth, but starter fertiliser may have an effect on crop establishment. Avoid high rates of P in direct contact with canola seed at sowing. Further research is required on P nutrition of canola, especially on the interactions between P application and sowing time and the effect that liquid P products may have on canola establishment. 25
3.6 Sowing equipment
Canola can be sown by using no-till techniques or sown into a well-prepared, cultivated seedbed. When sowing into cereal stubble, ensure that straw and header trash is pushed away from the sowing row. Stubble covering the row can reduce canola emergence and early plant growth to reduce yield significantly. Use rollers, cultipackers or press-wheels to improve seed–soil contact where appropriate, ensuring that the pressure applied by these devices is low. 26
Sow seed through the main seed box or small seed box of standard wheat-sowing equipment. The air-seeder or combine should be in good condition and the level adjusted (from side to side, front to back, and tine to tine) to ensure sowing at a uniform depth. Regulate ground speed to avoid tine bounce, which will cause an uneven sowing depth. Diffusers are fitted to the sowing tines of air-seeders to stop seed from being blown from the seed row. A maximum sowing speed of 8–10 km/h is suggested for most soils.
Several options are available to level the seedbed and help compact moist soil around the seed. These include the use of press-wheels or a rubber-tyred roller, coil packers (flexi-coil roller), or trailing light harrows or mesh behind the planter.
24 R Brill, L Jenkins, M Gardner (2014) Canola establishment; does size matter? GRDC Update Papers, 5 February 2014, http://www.grdc.com.au/Research-and-Development/GRDC-Update-Papers/2014/02/Canola-establishment-does-size-matter
25 R Brill, L Jenkins, M Gardner (2014) Canola establishment; does size matter? GRDC Update Papers, 5 February 2014, http://www.grdc.com.au/Research-and-Development/GRDC-Update-Papers/2014/02/Canola-establishment-does-size-matter
26 J Edwards, K Hertel (2011) Canola growth and development. PROCROP Series. NSW Department of Primary Industries, http://www.dpi.nsw.gov.au/__data/assets/pdf_file/0004/516181/Procrop-canola-growth-and-development.pdf
i MORE INFORMATION
Canola establishment; does size matter?

20PlaNtINg
seCtioN 3 CANOLA
NORTHERNMarch 2017
Knifepoints with press-wheels are the preferred option. Avoid heavy harrows with long tines because they can disturb seed placement.
The seed box on most modern air-seeders and combines can be calibrated for low seeding rates. Check calibrations from year to year, because seed size can change and affect actual sowing rate.
Checklist for sowing equipment:• Ensure accurate calibration for sowing rate.• Ensure even wear of points for accurate seed placement.• Use narrow points to reduce ridging.• Keep front and rear rows of tines level.• Sow slower rather than faster, to avoid overly shallow depth, seed bounce, or
increased soil throw by tines, which effectively result in front-tine seed being sown too deep.
• Ensure level ridges behind the seeder. If using harrows, heavy harrows may be too severe and finger harrows too light.
• Avoid seed–superphosphate mixes that contain excess rates of N (see above). 27
3.6.1 alternate sowing techniquesThe use of wider row spacing to conserve moisture in low-rainfall areas has seen an expansion of the areas in which canola is grown. Other techniques, such as dry sowing, aerial sowing and the use of raised beds, have been further refined, which can reduce sowing delays caused by unseasonably dry or wet conditions. 28
27 L Jenkins (2009) Crop establishment. Ch. 5 In Canola best practice management guide for south-eastern Australia. (Eds D McCaffrey, T Potter, S Marcroft, F Pritchard) GRDC, http://www.grdc.com.au/uploads/documents/GRDC_Canola_Guide_All_1308091.pdf
28 L Jenkins (2009) Crop establishment. Ch. 5 In Canola best practice management guide for south-eastern Australia. (Eds D McCaffrey, T Potter, S Marcroft, F Pritchard) GRDC, http://www.grdc.com.au/uploads/documents/GRDC_Canola_Guide_All_1308091.pdf

1PlaNt groWth aND PhYSIologY
seCtioN 4 CANOLA
NORTHERNMarch 2017
Plant growth and physiology4.1 canola types
4.1.1 conventional The first rapeseed varieties were introduced into Australia from Europe and Canada in 1969. Under Australian conditions these varieties were late flowering (and so restricted to the higher rainfall zones) and very susceptible to blackleg.
From 1970 to 1988, conventional breeding techniques were used to improve yield, adaptation, blackleg resistance and seed quality (low erucic acid, low glucosinolates). These varieties were based on B. rapa (formerly known as B. campestris). They had earlier maturity and tolerance to pod shattering.
In 1988 the first varieties were released that combined blackleg resistance with higher yield. These varieties were based on B. napus material from Asia and Europe. From this time, there was a complete swing to breeding B. napus varieties.
Brassica napus is thought to have formed originally from natural crosses (hybridisation) of B. rapa and B. oleracea. It is distinguished from other species by the shape of the upper leaves: the lower part of the leaf blade half-grasps the stalk. 1
4.1.2 triazine-tolerant canola Triazine-tolerant (TT) varieties were first commercialised in 1993, with the release of the variety Siren. Genes for tolerance to the triazine group of herbicides were bred into conventional canola varieties. This enabled the control of Brassica weeds, which were previously unable to be controlled in standard canola varieties.
The triazine-tolerant trait is associated with reduced conversion of sunlight into biomass (i.e. reduced radiation-use efficiency). Triazine-tolerant varieties are therefore generally less vigorous as seedlings and produce less biomass than conventional varieties. This results in 10% to 15% lower yields and 1% to 3% lower oil contents than in conventional varieties. However the effective weed control available in these varieties means actual yield is often higher then conventional varieties competing with weeds. Another effect of the triazine-tolerant trait is a delay in plant development. 2
4.1.3 hybridsHybrids were first released in 1988. Hybrid varieties are produced using controlled pollination of a female parent by a male parent (the source of pollen). The progeny (the F1 hybrid) contain the best characteristics of both parents, known as hybrid vigour. Hybrid varieties are typically associated with larger seeds, strong seedling vigour and greater biomass production. 3
1 T Potter (2009) The canola plant and how it grows. Ch. 3. In Canola best practice management guide for south-eastern Australia. (Eds D McCaffrey, T Potter, S Marcroft, F Pritchard) GRDC, http://www.grdc.com.au/uploads/documents/GRDC_Canola_Guide_All_1308091.pdf
2 T Potter (2009) The canola plant and how it grows. Ch. 3. In Canola best practice management guide for south-eastern Australia. (Eds D McCaffrey, T Potter, S Marcroft, F Pritchard) GRDC, http://www.grdc.com.au/uploads/documents/GRDC_Canola_Guide_All_1308091.pdf
3 T Potter (2009) The canola plant and how it grows. Ch. 3. In Canola best practice management guide for south-eastern Australia. (Eds D McCaffrey, T Potter, S Marcroft, F Pritchard) GRDC, http://www.grdc.com.au/uploads/documents/GRDC_Canola_Guide_All_1308091.pdf

2PlaNt groWth aND PhYSIologY
seCtioN 4 CANOLA
NORTHERNMarch 2017
4.1.4 Specialty canola – high oleic/low linolenic (holl)Specialty canolas were bred by traditional means to increase the content of the monounsaturated fat oleic acid and decrease the level of the polyunsaturated fat linolenic acid in the oil. This type of oil is more stable at higher temperatures and more suited for deep frying. This gave a high oleic/low linolenic (HOLL) canola. 4
4.1.5 IMI-tolerant canola IMI-tolerant varieties are tolerant to imidazolinones (IMIs), the active ingredients of herbicides such as OnDuty® and Intervix®. They are grown as part of the CLEARFIELD® production system. IMI-tolerant canola varieties were developed by selection of naturally occurring mutations from conventional canola varieties. Unlike the TT gene, the gene for IMI tolerance is not associated with a yield penalty. 5
4.1.6 condiment (Indian) mustardCondiment mustards are varieties of Brassica juncea grown for their hot, peppery taste. Although related to juncea canola, condiment mustards have different meal and oil qualities. The level of glucosinolates in the meal after crushing is much higher in condiment mustard and is responsible for the hot and spicy taste of table mustard. The oil has a distinct ‘nutty’ flavour, but the erucic acid level is sufficiently low to make it suitable for human consumption. Indian mustard is the preferred oilseed in many parts of South Asia, northern and western China and eastern Russia. It has a reputation for having greater drought and shattering tolerance than canola. 6
4.1.7 Junecea canola – Brassica juncea Juncea canola is the name given to plants bred from Brassica juncea to have all the oil and meal quality specifications of canola. The oil has high levels of oleic acid and low levels of erucic acid, and there are low levels of glucosinolates in the meal (Table 1). The meal can be substituted for canola meal in animal diets. Juncea canola has the same market end-use as canola.
Juncea canola is being developed as a drought- and heat-tolerant alternative to canola for the low rainfall zone. It also has excellent seedling vigour (similar to that of hybrid canola) and is more tolerant of shattering than canola. Because it is a relatively new crop, breeding, selection and agronomic research have not progressed as far as with canola. The first commercial varieties were grown in 2007.
4 T Potter (2009) The canola plant and how it grows. Ch. 3. In Canola best practice management guide for south-eastern Australia. (Eds D McCaffrey, T Potter, S Marcroft, F Pritchard) GRDC, http://www.grdc.com.au/uploads/documents/GRDC_Canola_Guide_All_1308091.pdf
5 T Potter (2009) The canola plant and how it grows. Ch. 3. In Canola best practice management guide for south-eastern Australia. (Eds D McCaffrey, T Potter, S Marcroft, F Pritchard) GRDC, http://www.grdc.com.au/uploads/documents/GRDC_Canola_Guide_All_1308091.pdf
6 T Potter (2009) The canola plant and how it grows. Ch. 3. In Canola best practice management guide for south-eastern Australia. (Eds D McCaffrey, T Potter, S Marcroft, F Pritchard) GRDC, http://www.grdc.com.au/uploads/documents/GRDC_Canola_Guide_All_1308091.pdf

3PlaNt groWth aND PhYSIologY
seCtioN 4 CANOLA
NORTHERNMarch 2017
table 1: Typical seed quality characteristics for canola, juncea canola and condiment mustard when grown in the low rainfall zone.
characteristic canola Juncea canola condiment mustard
Oil % 36–42 34–40 34–40
Oleic acid % 57–63 57–63 variable
Linoleic acid % 18–25 18–25 variable
Linolenic acid % 8–13 8–13 variable
Erucic acid % <1 < 1 1–20
Glucosinolate in meal (μmol/g – 10% MC)
< 30 < 30 110–160
Allyl glucosinolate in meal (μmol/g – 10% MC)
0 < 1 NA
Source: NSW DPI
4.1.8 roundup ready® Roundup Ready® (RR) varieties have been bred by genetic modification technology to be tolerant of the herbicide glyphosate. This allows glyphosate to be sprayed over canola in the early stages of growth without affecting the development of the crop. The first varieties were grown commercially in 2008.
4.1.9 Industrial mustard Industrial mustard is a B. juncea type that is not suitable for either of the edible markets because of its high levels of erucic acid and/or glucosinolates. Industrial mustard is grown for use in a number of industrial products, including biodiesel.
4.1.10 Winter types for grazing (dual-purpose canola)Canola is now a viable and reliable grazing option on mixed farms. Research developed ‘rules of thumb’ for grazing the widely grown spring canola varieties are:• be ready• sow early with later-maturing types with high blackleg tolerance• graze when plants are well anchored (six-leaf stage)• lock-up canola before buds elongate more than 10 cm. 7
Research over 2012–15 has refined some of the accepted rules about lock-up times for canola. Until now these were based on the stage of crop development: lock-up before buds elongate 10 cm.
Trials demonstrate that the residual biomass at lock-up time also influences the yield outcome (depending on the yield potential of the season).
Achieving a higher target yield requires more biomass at flowering, which means more residual biomass at lock-up, especially if it is late. Target yield is linked to critical flowering biomass to predict the residual biomass required on different lock-up dates to avoid yield penalties.
For example, spring canola in south-eastern Australia requires 5 t/ha of biomass at flowering for 2.5 to 3 t/ha yield. A residual biomass of 1.5 t/ha at the end of July will be sufficient to reach the critical biomass, so grazing management can be directed by this.
Table 2 shows the typical sowing times, grazing periods, range of grazing days and seed yield achieved in experiments and in commercial fields as part of the dual-purpose canola projects. These varieties were used successfully in dual-purpose
7 GRDC (2016) Canola in the grazing mix is food for thought. Ground Cover Issue 117, https://grdc.com.au/Media-Centre/Ground-Cover-Supplements/Ground-Cover-Issue-117-Optimising-canola-profitability/Canola-in-the-grazing-mix-is-food-for-thought
i MORE INFORMATION
GRDC Update Paper: optimising grain yield and grazing potential of dual-purpose crops
GRDC Update Paper: Managing dual purpose crops to optimise profit from grazing and grain yield
GRDC Fact sheet: Dual-purpose crops
Canola in the grazing mix is food for thought
GRDC Update Paper: Dual purpose crops do they have a fit in your system and how can they be managed to optimise forage and grain production
GRDC Update Paper: the effect of grazing and burning stubbles on grain yield and quality in no till and zero till controlled traffic farming systems in sNsW

4PlaNt groWth aND PhYSIologY
seCtioN 4 CANOLA
NORTHERNMarch 2017
canola experiments across different regions and are representative of others that would also be suitable in specific areas. The results are for crops where grazing had no impact on the seed yield or oil content of canola. 8
table 2: Canola types trialled in dual-purpose canola projects.
region / growing season rainfall
canola type Sowing window
grazing achieved Yield (t/ha)
Timing DSE days/ha
High rainfall 300–500 mm GSR Goulburn, Delegate, Holbrook, Inverleigh
Winter CB Taurus, Pacific Seeds Hyola® 970CL, SF Senesation, SF Edimax CL
1 March to 10 April
May–August
1500–3000
3.0 to 5.0
Medium rainfall 250–350 mm GSR Young, Greenethorpe, Cootamundra
Late spring AV-Garnet®, Pacific Seeds Hyola® 575CL, 45Y88
5 April to 30 April
June–July
600–800
2.0 to 3.5
Lower rainfall 150–250 mm Temora, Wagga Wagga
Mid-spring Tawriffic, 45Y82, 43C80
15 April to 8 May
June–mid July
200–600
1.0 to 2.5
Dual-purpose use of grain crops offers the potential to improve the flexibility and resilience of mixed farming systems. Analysis of experimental data has shown that utilising winter cereals (wheat, barley and triticale) and canola for a period of grazing during their vegetative phase before allowing the crop to regrow to produce grain yield (graze + grain), can increase the net returns from that crop by 25–75%. 9
Dual-purpose crops have become an integral part of mixed farming systems in the medium and high rainfall zones of southern Australia. Winter canola cultivars that require a period of cold (vernalisation) to initiate flowering provide a wide sowing window from early spring through to early autumn and under suitable conditions, can be grazed six to eight weeks after sowing. Although production of dual-purpose winter canola was initially adopted in the high rainfall zones, changing rainfall patterns providing good early sowing opportunities has resulted in growers planting dual-purpose crops in March. Early-sown crops provide significant periods of grazing (up to 3000 sheep grazing days/ha) and can produce good grain yield as a result of the ability to access to moisture by development of deep roots. Dual-purpose crops can also reduce risk by providing income from grazing and grain as well as broader whole-farm benefits. 10
8 GRDC (2016) Canola in the grazing mix is food for thought. Ground Cover Issue 117, https://grdc.com.au/Media-Centre/Ground-Cover-Supplements/Ground-Cover-Issue-117-Optimising-canola-profitability/Canola-in-the-grazing-mix-is-food-for-thought
9 L Bell (2016) Role and fit for dual-purpose crops for mitigating risk and optimising profit in low rainfall western grain growing regions. GRDC Update Papers 25 February 2016, https://grdc.com.au/Research-and-Development/GRDC-Update-Papers/2016/02/Role-and-fit-for-dual-purpose-crops-for-mitigating-risk-and-optimising-profit
10 A Paridaen, S Sprague, J Kirkegaard, J Lilley (2016) Winter canola for grazing and grain production. GRDC Update Papers 28 July 2016, https://grdc.com.au/Research-and-Development/GRDC-Update-Papers/2016/07/Winter-canola-for-grazing-and-grain-production
5PlaNt groWth aND PhYSIologY
seCtioN 4 CANOLA
NORTHERNMarch 2017
IN FOCUS4.2 Why know about canola development?• Understanding the drivers behind canola development will help to
improve canola management and variety selection.• Varietal maturity ratings do not always correlate with
varietal phenology.• Early sowing opportunities may provide a means to maximise canola
yield, but selection of the correct variety is important.
Despite the success of canola in Australian cropping systems, significant gaps remain in the underlying knowledge of canola physiology and agronomy, a situation exacerbated by its expansion into new areas and the release of new technologies, including vigorous hybrid varieties with herbicide tolerance.
Although growers recognise the high profit potential and the farming-system benefits of canola, a perceived risk of growing canola remains, largely due to the high level of input required (e.g. seed, nitrogen (N) fertiliser, sulfur fertiliser, herbicides, windrowing). There is a need to determine the level of investment appropriate for these inputs on a regional scale and the agronomic management practices (for example sowing date decisions) that reduce the overall risk and increase the profitability of canola.
Sound, tactical agronomic decisions require improved understanding of the physiology of yield and oil formation in canola, and of how they are affected by variety, environment and management, and the interaction (G × E × M).
Maximising canola yield and profit will be achieved through an increased understanding of canola physiology. This will occur by taking the following steps:1. Identify the optimum flowering window to minimise heat and frost risk
at specific sites.2. Identify the variety–sowing date combinations that achieve the
optimum flowering window.3. Manage the trajectory of biomass accumulation (of specific varieties) to
maximise Water Use Efficiency, optimise N-use efficiency and minimise the risk of high-input costs (e.g. seed costs, N fertiliser, herbicide types, harvest strategies).
Having optimised these steps, further investigation may reveal specific varietal adaptations that provide yield advantage under specific stress (heat, drought, frost) or provide further G × E × M synergies.
As a first step to improve the understanding of G × E × M interactions in current varieties, CSIRO conducted pre-field-experiment modeling by using the best available information on variety development prior to 2014 trials, and the APSIM model. This modeling explored the potential for planting canola early at locations across Australia and the potential yields to be achieved by planting cultivars with differing maturity at a range of sowing times. The results show that potential exists for longer season varieties to be planted in locations such as Cummins, South Australia, and to have improved yield potential. However, the opportunity for successful sowing of these varieties occurs in only 15% of years (when sufficient summer rainfall occurs).

6PlaNt groWth aND PhYSIologY
seCtioN 4 CANOLA
NORTHERNMarch 2017
The manner in which each canola variety develops can have a large influence on yield, when planted at different times and in different environments. The challenge for researchers is to develop and deliver information on new varieties in a way that is timely and relevant to growers and advisers. Growers and advisers will be able to use this information when selecting a set of varieties suited to the sowing opportunities that most often occur in their district and to capitalise on early or delayed sowing opportunities as the seasons dictate. 11
4.3 Plant physiology and the stages of plant growth
All canola grown commercially in Australia is the Swede rape type Brassica napus. Brassica juncea (brown or Indian mustard), which has the same quality as canola, is also grown but in much smaller quantities.
The 10 oilseed rape types grown throughout the world are mainly annual and biennial forms of B. napus and B. campestris. In Canada, both species are important; in Europe and the Indian subcontinent, B. napus is the dominant species. Each species has an optimum set of environmental and growing conditions.
The life-cycle of the canola plant is divided into seven principal stages. By recognising the beginning of each stage, growers can make more accurate management decisions on timing of weed-control operations, introduction and removal of grazing livestock in crops managed as dual-purpose, timing of fertiliser applications, timing of irrigation, and timing of pest-control measures.
Each growth stage covers a developmental phase of the plant. However, the beginning of each stage is not dependent on the preceding stage being finished, which means growth stages can overlap.
The beginning of each growth stage from budding is determined by looking at the main (terminal) stem. In the literature, it is referred to as a decimal code, similar to the Zadoks code for wheat growth stages. (Figure 1). 12
Figure 1:
Stage 0Germination
and emergence
Stage 1Leaf
production
Stage 2Stem
extension
Stage 3Flower bud
development
Stage 4Flowering
Stage 5Pod
development
Stage 6Seed
development
Vegetative Reproductive
24 weeks
April May June July August September October
6 weeks
4 weeks
Flowering
Podfill
Canola growth stages.
11 A Ware et al. (2015) Canola growth and development—impact of time of sowing (TOS) and seasonal conditions. GRDC Update Papers, 10 February 2015, http://grdc.com.au/Research-and-Development/GRDC-Update-Papers/2015/02/Canola-growth-and-development-impact-of-time-of-sowing-TOS-and-seasonal-conditions
12 T Potter (2009) The canola plant and how it grows. Ch. 3. In Canola best practice management guide for south-eastern Australia. (Eds D McCaffrey, T Potter, S Marcroft, F Pritchard) GRDC, http://www.grdc.com.au/uploads/documents/GRDC_Canola_Guide_All_1308091.pdf
i MORE INFORMATION
Canola growth and development—impact of time of sowing (tos) and seasonal conditions
improved understanding of thresholds of armyworm in barley and aphids in canola
i MORE INFORMATION
Revisiting canola management can lift returns
Canola growth and development—impact of time of sowing (tos) and seasonal conditions

7PlaNt groWth aND PhYSIologY
seCtioN 4 CANOLA
NORTHERNMarch 2017
Plants don’t work by calendar days but by ‘day degrees’. Simply described, this means that if the average temperature in a day is 20°C then a plant accumulates 20 day degrees in one calendar day. On a coarse scale this temperature clock is how trees know to drop their leaves in winter and why herbs bolt to seed in spring. Day degrees are a way of measuring the physiological development of a plant by combining time and temperature into a single number.
All plants receive signals from the environment that influence their rate of development. When studying the physiology of plants, distinct stages of growth have been identified and these have been formalised into keys that are often used in both plant physiology and agronomy. The description of crop growth stages is called the phenology of the plant.
The most well know key is the Zadocks key for wheat. Similar keys exist for canola, cotton and the pulses and describe each plant development stage. The most common and easily recognised stages are emergence, flowering, grain fill and maturity. Temperature, day length and available water are the key environmental triggers that influence plant development. 13
4.3.1 VernalisationVernalisation is the need for a plant to accumulate cold days before the day degree calculation can begin. Winter wheats and winter canola are extreme examples of this, but many spring wheats and canola varieties have some vernalisation requirement. Varieties grown in Victoria can be short season, but when moved to Queensland become long season as vernalisation is not satisfied. It is not uncommon for varying degrees of vernalisation, thermal time and day length sensitivity to occur within different varieties of a crop so every variety is different and needs to be measured.
The complexity of winter crops is one of the reasons that the use of day degree calculations is not standard practice. However, the development of crop simulation models has shown that we can understand the complexity, and predict it. The use of tools such as Yield Prophet® provides a platform to accurately assess crop phenology (the measurement of plant growth incorporating vernalisation, degree days and day length) and allow specific growth stage management to be improved. 14
Key points• Day degrees are a ‘temperature clock’ that are a valuable tool in
crop management.• Crops that are only temperature responsive are easier to work with.• Crop growth can be described by accumulating day degrees to a known target.• Day length can modify the day degree targets in some crop varieties.• Tools such as Yield Prophet® are a simple way to get accurate day degree
information. 15
13 J Whish (2016) Accessing and using day degrees in field crops as a tool to assist crop management. GRDC Update Papers, 23 February 2016 https://grdc.com.au/Research-and-Development/GRDC-Update-Papers/2016/02/Accessing-and-using-day-degrees-in-field-crops-as-a-tool-to-assist-crop-management
14 J Whish (2016) Accessing and using day degrees in field crops as a tool to assist crop management. GRDC Update Papers, 23 February 2016 https://grdc.com.au/Research-and-Development/GRDC-Update-Papers/2016/02/Accessing-and-using-day-degrees-in-field-crops-as-a-tool-to-assist-crop-management
15 J Whish (2016) Accessing and using day degrees in field crops as a tool to assist crop management. GRDC Update Papers, 23 February 2016 https://grdc.com.au/Research-and-Development/GRDC-Update-Papers/2016/02/Accessing-and-using-day-degrees-in-field-crops-as-a-tool-to-assist-crop-management
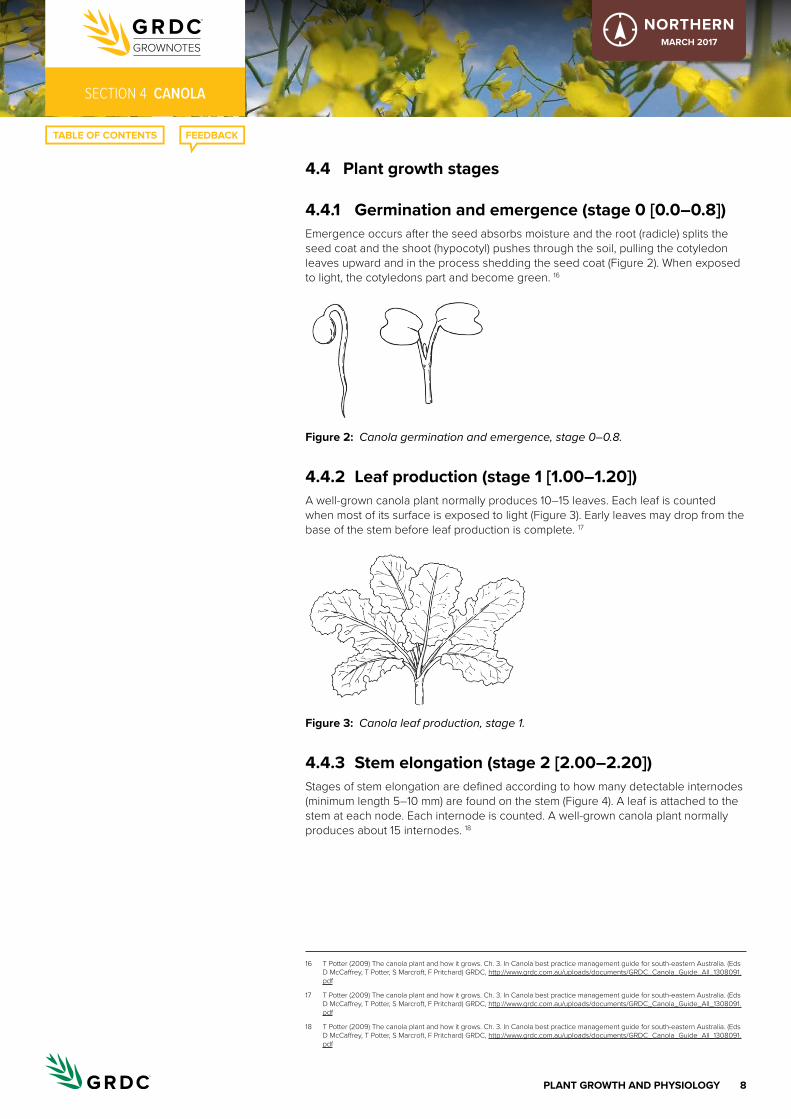
8PlaNt groWth aND PhYSIologY
seCtioN 4 CANOLA
NORTHERNMarch 2017
4.4 Plant growth stages
4.4.1 germination and emergence (stage 0 [0.0–0.8])Emergence occurs after the seed absorbs moisture and the root (radicle) splits the seed coat and the shoot (hypocotyl) pushes through the soil, pulling the cotyledon leaves upward and in the process shedding the seed coat (Figure 2). When exposed to light, the cotyledons part and become green. 16
Figure 2: Canola germination and emergence, stage 0–0.8.
4.4.2 leaf production (stage 1 [1.00–1.20])A well-grown canola plant normally produces 10–15 leaves. Each leaf is counted when most of its surface is exposed to light (Figure 3). Early leaves may drop from the base of the stem before leaf production is complete. 17
Figure 3: Canola leaf production, stage 1.
4.4.3 Stem elongation (stage 2 [2.00–2.20]) Stages of stem elongation are defined according to how many detectable internodes (minimum length 5–10 mm) are found on the stem (Figure 4). A leaf is attached to the stem at each node. Each internode is counted. A well-grown canola plant normally produces about 15 internodes. 18
16 T Potter (2009) The canola plant and how it grows. Ch. 3. In Canola best practice management guide for south-eastern Australia. (Eds D McCaffrey, T Potter, S Marcroft, F Pritchard) GRDC, http://www.grdc.com.au/uploads/documents/GRDC_Canola_Guide_All_1308091.pdf
17 T Potter (2009) The canola plant and how it grows. Ch. 3. In Canola best practice management guide for south-eastern Australia. (Eds D McCaffrey, T Potter, S Marcroft, F Pritchard) GRDC, http://www.grdc.com.au/uploads/documents/GRDC_Canola_Guide_All_1308091.pdf
18 T Potter (2009) The canola plant and how it grows. Ch. 3. In Canola best practice management guide for south-eastern Australia. (Eds D McCaffrey, T Potter, S Marcroft, F Pritchard) GRDC, http://www.grdc.com.au/uploads/documents/GRDC_Canola_Guide_All_1308091.pdf
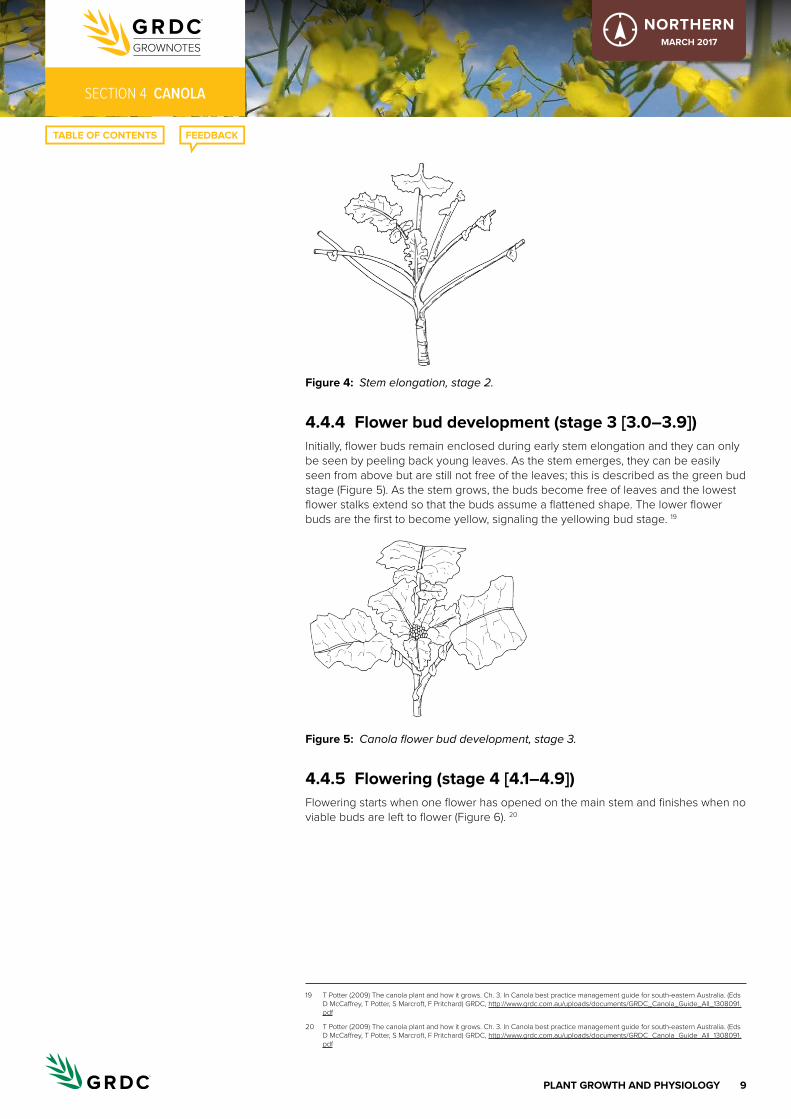
9PlaNt groWth aND PhYSIologY
seCtioN 4 CANOLA
NORTHERNMarch 2017
Figure 4: Stem elongation, stage 2.
4.4.4 Flower bud development (stage 3 [3.0–3.9])Initially, flower buds remain enclosed during early stem elongation and they can only be seen by peeling back young leaves. As the stem emerges, they can be easily seen from above but are still not free of the leaves; this is described as the green bud stage (Figure 5). As the stem grows, the buds become free of leaves and the lowest flower stalks extend so that the buds assume a flattened shape. The lower flower buds are the first to become yellow, signaling the yellowing bud stage. 19
Figure 5: Canola flower bud development, stage 3.
4.4.5 Flowering (stage 4 [4.1–4.9])Flowering starts when one flower has opened on the main stem and finishes when no viable buds are left to flower (Figure 6). 20
19 T Potter (2009) The canola plant and how it grows. Ch. 3. In Canola best practice management guide for south-eastern Australia. (Eds D McCaffrey, T Potter, S Marcroft, F Pritchard) GRDC, http://www.grdc.com.au/uploads/documents/GRDC_Canola_Guide_All_1308091.pdf
20 T Potter (2009) The canola plant and how it grows. Ch. 3. In Canola best practice management guide for south-eastern Australia. (Eds D McCaffrey, T Potter, S Marcroft, F Pritchard) GRDC, http://www.grdc.com.au/uploads/documents/GRDC_Canola_Guide_All_1308091.pdf
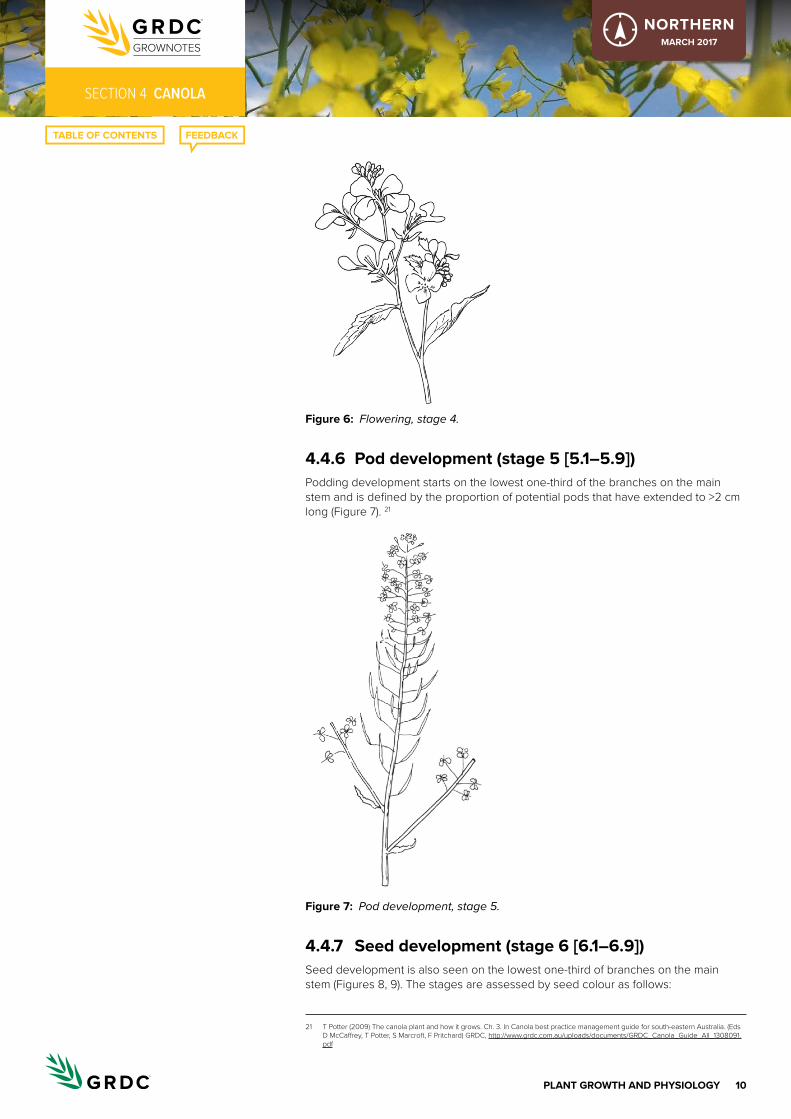
10PlaNt groWth aND PhYSIologY
seCtioN 4 CANOLA
NORTHERNMarch 2017
Figure 6: Flowering, stage 4.
4.4.6 Pod development (stage 5 [5.1–5.9])Podding development starts on the lowest one-third of the branches on the main stem and is defined by the proportion of potential pods that have extended to >2 cm long (Figure 7). 21
Figure 7: Pod development, stage 5.
4.4.7 Seed development (stage 6 [6.1–6.9])Seed development is also seen on the lowest one-third of branches on the main stem (Figures 8, 9). The stages are assessed by seed colour as follows:
21 T Potter (2009) The canola plant and how it grows. Ch. 3. In Canola best practice management guide for south-eastern Australia. (Eds D McCaffrey, T Potter, S Marcroft, F Pritchard) GRDC, http://www.grdc.com.au/uploads/documents/GRDC_Canola_Guide_All_1308091.pdf

11PlaNt groWth aND PhYSIologY
seCtioN 4 CANOLA
NORTHERNMarch 2017
• 6.1, seeds present • 6.2, most seeds translucent but full size • 6.3, most seeds green • 6.4, most seeds green–brown mottled • 6.5, most seeds brown • 6.6, most seeds dark brown • 6.7, most seeds black but soft • 6.8, most seeds black but hard • 6.9, all seeds black and hard
Seed oil concentration in Australian crops increases through seed development following an ‘S’-curve pattern, which starts 20 days after flowering and reaches a plateau ~60 days after flowering, the time when seed dry weight is ~70% of its final value (Figure 10). Final seed oil concentrations usually vary between 30% and 50% (as received). In general, high temperatures during grain filling, terminal water stress, and high N supply depress final seed oil concentration. Variety has a significant impact, with triazine-tolerant (TT) varieties typically having lower oil concentrations than conventional varieties because of their less efficient photosynthetic system. The growth stage when the crop is physiologically mature is important and one that growers should learn to recognise. It occurs when the seeds have reached their maximum dry weight and the crop can be windrowed. At this time, 50–70% of seeds have started to change from green to their mature colour (growth stage 6.4–6.5). Seed moisture content is 35–40% and most seeds are firm enough to roll between the thumb and forefinger without being squashed. It is a period of rapid change, when all seeds can develop from translucent to black over a 12-day period. It is important not to windrow too early; windrowing before physiological maturity will reduce yields by 3–4% for each day too early, because of incomplete seed development. Oil content will also be reduced. Canola can be harvested when the moisture content of mature seed is 8%. 22
22 T Potter (2009) The canola plant and how it grows. Ch. 3. In Canola best practice management guide for south-eastern Australia. (Eds D McCaffrey, T Potter, S Marcroft, F Pritchard) GRDC, http://www.grdc.com.au/uploads/documents/GRDC_Canola_Guide_All_1308091.pdf

12PlaNt groWth aND PhYSIologY
seCtioN 4 CANOLA
NORTHERNMarch 2017
Figure 8: Seed development, stage 6.
Figure 9: Seed pods.
Figure 10:
Seed
oil
conc
entr
atio
n (%
)
0
10
20
30
40
50
0 20 40 60 80 100
Age of fruit (days after anthesis)
Seed oil concentration in Australian crops increases throughout seed development and reaches a plateau at ~60 days after flowering. Source: P. Hocking and L. Mason
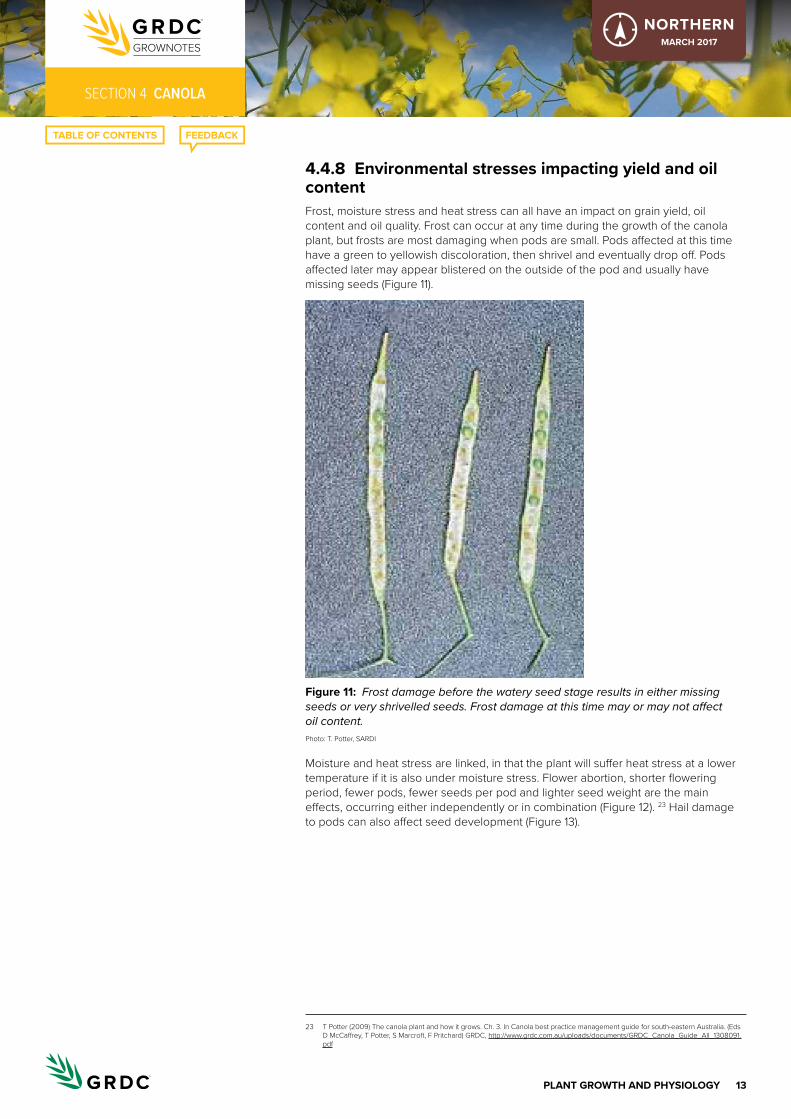
13PlaNt groWth aND PhYSIologY
seCtioN 4 CANOLA
NORTHERNMarch 2017
4.4.8 environmental stresses impacting yield and oil content Frost, moisture stress and heat stress can all have an impact on grain yield, oil content and oil quality. Frost can occur at any time during the growth of the canola plant, but frosts are most damaging when pods are small. Pods affected at this time have a green to yellowish discoloration, then shrivel and eventually drop off. Pods affected later may appear blistered on the outside of the pod and usually have missing seeds (Figure 11).
Figure 11: Frost damage before the watery seed stage results in either missing seeds or very shrivelled seeds. Frost damage at this time may or may not affect oil content. Photo: T. Potter, SARDI
Moisture and heat stress are linked, in that the plant will suffer heat stress at a lower temperature if it is also under moisture stress. Flower abortion, shorter flowering period, fewer pods, fewer seeds per pod and lighter seed weight are the main effects, occurring either independently or in combination (Figure 12). 23 Hail damage to pods can also affect seed development (Figure 13).
23 T Potter (2009) The canola plant and how it grows. Ch. 3. In Canola best practice management guide for south-eastern Australia. (Eds D McCaffrey, T Potter, S Marcroft, F Pritchard) GRDC, http://www.grdc.com.au/uploads/documents/GRDC_Canola_Guide_All_1308091.pdf

14PlaNt groWth aND PhYSIologY
seCtioN 4 CANOLA
NORTHERNMarch 2017
Figure 12: Severe moisture stress during pod filling results in seeds being underdeveloped and small. Photo: D. McCaffery, NSW DPI
Figure 13: Hail damage may penetrate through the pod wall and affect seed development. Photo: D. McCaffery, NSW DPI

1NUtrItIoN aND FertIlISer
seCtioN 5 CANOLA
NORTHERNMarch 2017
Nutrition and fertiliser5.1 Declining soil fertility
The natural fertility of cropped agricultural soils is declining over time, and so growers must continually review their management programs to ensure the long-term sustainability of high quality grain production. Paddock records, including yield and protein levels, fertiliser test strips, crop monitoring, and soil and plant tissue tests all assist in the formulation of an efficient nutrition program.
Pasture leys, legume rotations and fertilisers all play an important role in maintaining and improving the chemical, biological and physical fertility of soils, fertilisers remain the major source of nutrients to replace those removed by grain production. Fertiliser programs must supply a balance of the required nutrients in amounts needed to achieve a crop’s yield potential. The higher yielding the crop, the greater the amount of nutrient removed. Increasing fertiliser costs means growers are increasing pulses within their crop rotation and even the use of ley pastures to complement their fertiliser programs and possibly boost soil organic matter. 1
5.1.1 Soil organic matterSoil organic matter (SOM) is a critical component of healthy soils and sustainable agricultural production. Growers understand that crops grown in healthy soils perform better and are easier to manage. Soil organic matter is ‘all of the organic materials found in soils irrespective of its origin or state of decomposition’ 2 that is anything in or on the soil of biological origin, alive or dead. It is composed mainly of carbon (approximately 60%) as well as a variety of nutrients (including nitrogen, phosphorus and sulfur). It is difficult to actually measure the SOM content of soil directly so we measure the soil organic carbon (SOC) content and estimate SOM through a conversion factor:
Soil organic matter (%) = organic carbon (%) × 1.72
It is important to understand the role of plants in the SOM cycle. Photosynthesis is the process by which plants take in carbon dioxide (CO2) from the atmosphere, combine with water taken up from the soil, and utilising the energy from the sun, form carbohydrate (organic matter) and release oxygen (O2). This is the start of the SOM cycle. When the leaves and roots (carbohydrate) die they enter the soil and become SOM. These residues are decomposed by soil organisms which provides them with the energy to grow and reproduce. The SOM cycle is a continuum of different forms (or fractions) with different time frames under which decomposition takes place. Over time SOM moves through these fractions; particulate, humic and resistant fractions. As SOM decomposes carbon is released from the system along with any nutrients that are not utilised by the microorganisms. These nutrients are then available for plants to utilise. Eventually a component of these residues will become resistant to further decomposition (resistant fraction Figure 1).
1 QDAF (2010) Nutrition management. Overview. Department of Agriculture, Fisheries and Forestry Queensland, https://www.daf.qld.gov.au/plants/field-crops-and-pastures/broadacre-field-crops/nutrition-management/overview
2 JA Baldock, JO Skjemstad (1999) Soil organic carbon/Soil organic matter. In KI Peverill, LA Sparrow, DJ Reuter (eds). Soil analysis: An interpretation manual. CSIRO Publishing, Collingwood Australia.

2NUtrItIoN aND FertIlISer
seCtioN 5 CANOLA
NORTHERNMarch 2017
Figure 1: Organic matter cycle. Source: J Gentry, QDAF
Organic matter is fundamental to several of the physical, chemical and biological functions of the soil. It helps to ameliorate or buffer the harmful effects of plant pathogens and chemical toxicities. It enhances surface and deeper soil structure, with positive effects on infiltration and exchange of water and gases, and for keeping the soil in place. It improves soil water-holding capacity and, through its high cation-exchange capacity, prevents the leaching of essential cations such as calcium (Ca), magnesium (Mg), potassium (K) and sodium (Na). Most importantly, it is a major repository for the cycling of nitrogen and other nutrients and their delivery to crops and pastures.
Australian soils are generally low in SOM. Initial SOM levels are limited by dry matter production (and so climate) for each land type/location. SOM levels have declined under traditional cropping practices. On-farm measures (sampled 2012–15) from over 500 sites in Queensland and northern NSW confirm that soil organic matter, measured as soil organic carbon, declines dramatically when land is cleared and continuously cropped. This decline affects all soils and land types but is most dramatic for the brigalow–belah soils because their starting organic carbon levels are so high (Figure 2). 3
3 QDAF (2016) Queensland Grains Research – 2015. Regional Research Agronomy Network. Department of Agriculture, Fisheries and Forestry Queensland, pp. 112–117, http://www.moreprofitperdrop.com.au/wp-content/uploads/2016/08/RANsTrials2015-screen.pdf
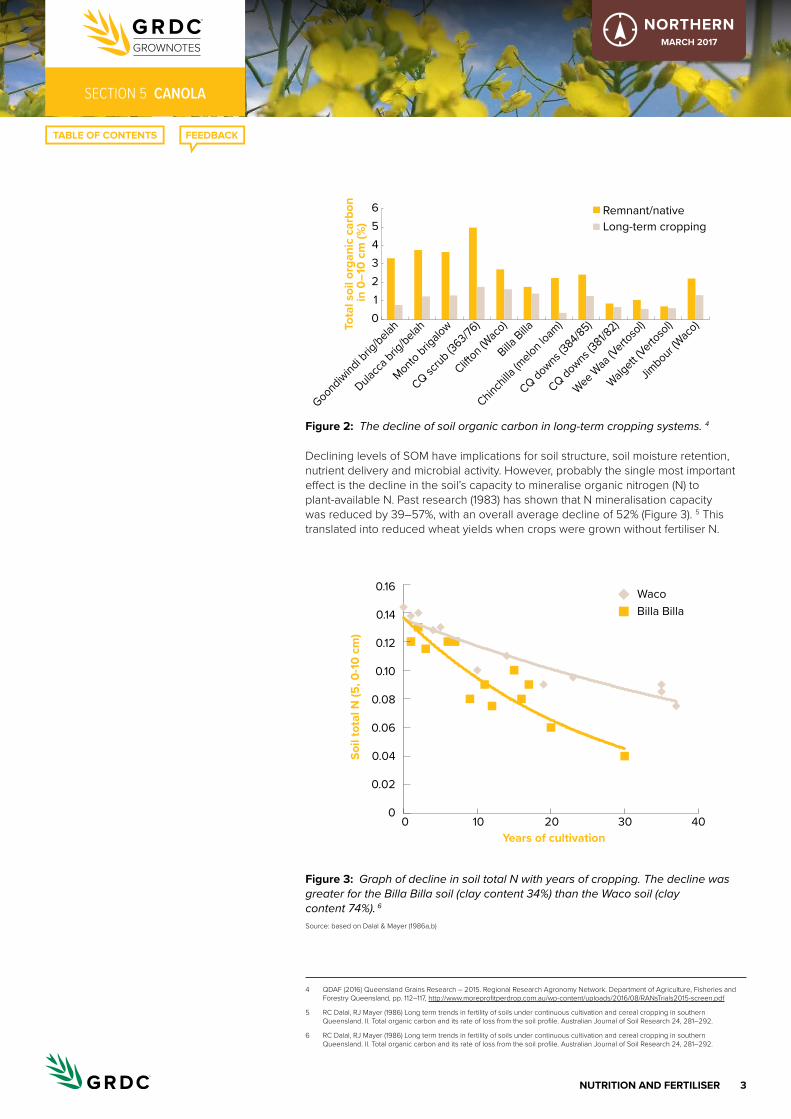
3NUtrItIoN aND FertIlISer
seCtioN 5 CANOLA
NORTHERNMarch 2017
Figure 2:
0123456
Goondiwindi b
rig/belah
Dulacca
brig/belah
Monto brigalo
w
CQ scrub (3
63/76)
Clifton (W
aco)
Billa Billa
Chinchilla
(melon lo
am)
CQ downs (384/85)
CQ downs (381/8
2)
Wee Waa
(Verto
sol)
Walgett (
Vertoso
l)
Jimbour (W
aco)To
tal s
oil o
rgan
ic c
arbo
n in
0–1
0 cm
(%)
Remnant/nativeLong-term cropping
The decline of soil organic carbon in long-term cropping systems. 4
Declining levels of SOM have implications for soil structure, soil moisture retention, nutrient delivery and microbial activity. However, probably the single most important effect is the decline in the soil’s capacity to mineralise organic nitrogen (N) to plant-available N. Past research (1983) has shown that N mineralisation capacity was reduced by 39–57%, with an overall average decline of 52% (Figure 3). 5 This translated into reduced wheat yields when crops were grown without fertiliser N.
Figure 3:
0 10 20 30 40 Years of cultivation
Soil
tota
l N (5
, 0-1
0 cm
)
0.16
0.14
0.12
0.10
0.08
0.06
0.04
0.02
0
WacoBilla Billa
Graph of decline in soil total N with years of cropping. The decline was greater for the Billa Billa soil (clay content 34%) than the Waco soil (clay content 74%). 6
Source: based on Dalal & Mayer (1986a,b)
4 QDAF (2016) Queensland Grains Research – 2015. Regional Research Agronomy Network. Department of Agriculture, Fisheries and Forestry Queensland, pp. 112–117, http://www.moreprofitperdrop.com.au/wp-content/uploads/2016/08/RANsTrials2015-screen.pdf
5 RC Dalal, RJ Mayer (1986) Long term trends in fertility of soils under continuous cultivation and cereal cropping in southern Queensland. II. Total organic carbon and its rate of loss from the soil profile. Australian Journal of Soil Research 24, 281–292.
6 RC Dalal, RJ Mayer (1986) Long term trends in fertility of soils under continuous cultivation and cereal cropping in southern Queensland. II. Total organic carbon and its rate of loss from the soil profile. Australian Journal of Soil Research 24, 281–292.
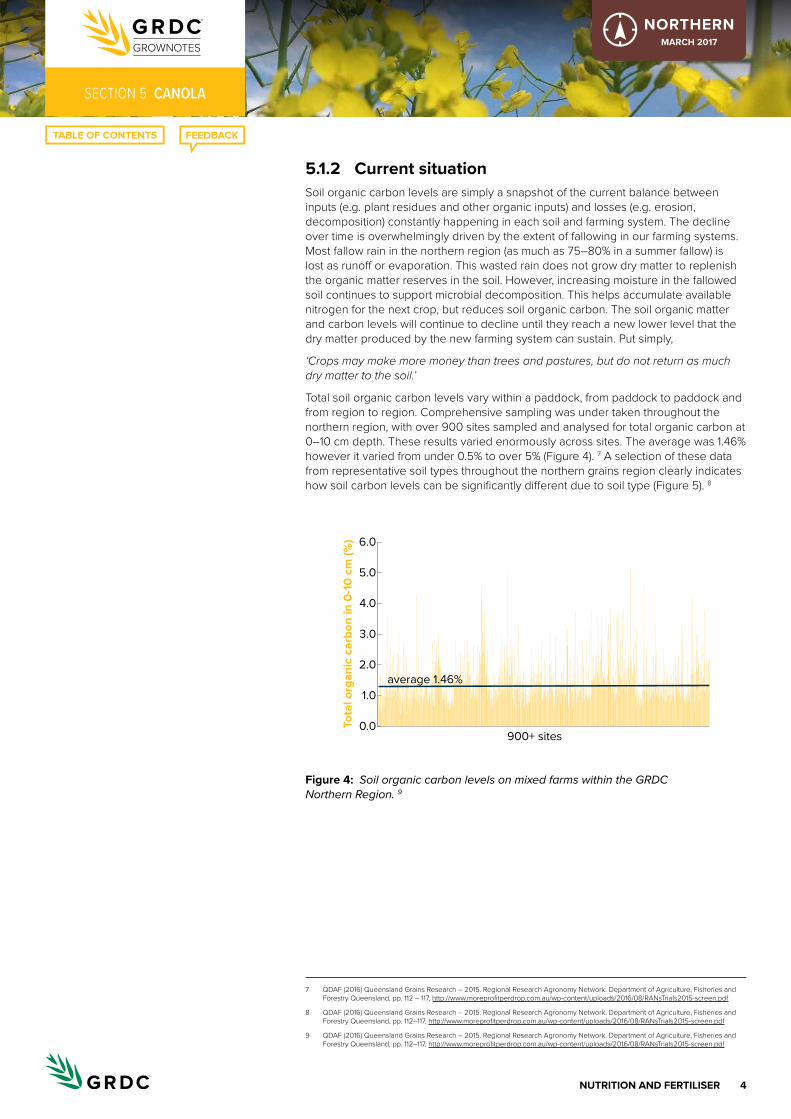
4NUtrItIoN aND FertIlISer
seCtioN 5 CANOLA
NORTHERNMarch 2017
5.1.2 current situationSoil organic carbon levels are simply a snapshot of the current balance between inputs (e.g. plant residues and other organic inputs) and losses (e.g. erosion, decomposition) constantly happening in each soil and farming system. The decline over time is overwhelmingly driven by the extent of fallowing in our farming systems. Most fallow rain in the northern region (as much as 75–80% in a summer fallow) is lost as runoff or evaporation. This wasted rain does not grow dry matter to replenish the organic matter reserves in the soil. However, increasing moisture in the fallowed soil continues to support microbial decomposition. This helps accumulate available nitrogen for the next crop, but reduces soil organic carbon. The soil organic matter and carbon levels will continue to decline until they reach a new lower level that the dry matter produced by the new farming system can sustain. Put simply,
‘Crops may make more money than trees and pastures, but do not return as much dry matter to the soil.’
Total soil organic carbon levels vary within a paddock, from paddock to paddock and from region to region. Comprehensive sampling was under taken throughout the northern region, with over 900 sites sampled and analysed for total organic carbon at 0–10 cm depth. These results varied enormously across sites. The average was 1.46% however it varied from under 0.5% to over 5% (Figure 4). 7 A selection of these data from representative soil types throughout the northern grains region clearly indicates how soil carbon levels can be significantly different due to soil type (Figure 5). 8
Figure 4:
0.0
1.0
2.0
3.0
4.0
5.0
6.0
Tota
l org
anic
car
bon
in 0
-10
cm (%
)
900+ sites
average 1.46%
Soil organic carbon levels on mixed farms within the GRDC Northern Region. 9
7 QDAF (2016) Queensland Grains Research – 2015. Regional Research Agronomy Network. Department of Agriculture, Fisheries and Forestry Queensland, pp. 112 – 117, http://www.moreprofitperdrop.com.au/wp-content/uploads/2016/08/RANsTrials2015-screen.pdf
8 QDAF (2016) Queensland Grains Research – 2015. Regional Research Agronomy Network. Department of Agriculture, Fisheries and Forestry Queensland, pp. 112–117, http://www.moreprofitperdrop.com.au/wp-content/uploads/2016/08/RANsTrials2015-screen.pdf
9 QDAF (2016) Queensland Grains Research – 2015. Regional Research Agronomy Network. Department of Agriculture, Fisheries and Forestry Queensland, pp. 112–117, http://www.moreprofitperdrop.com.au/wp-content/uploads/2016/08/RANsTrials2015-screen.pdf
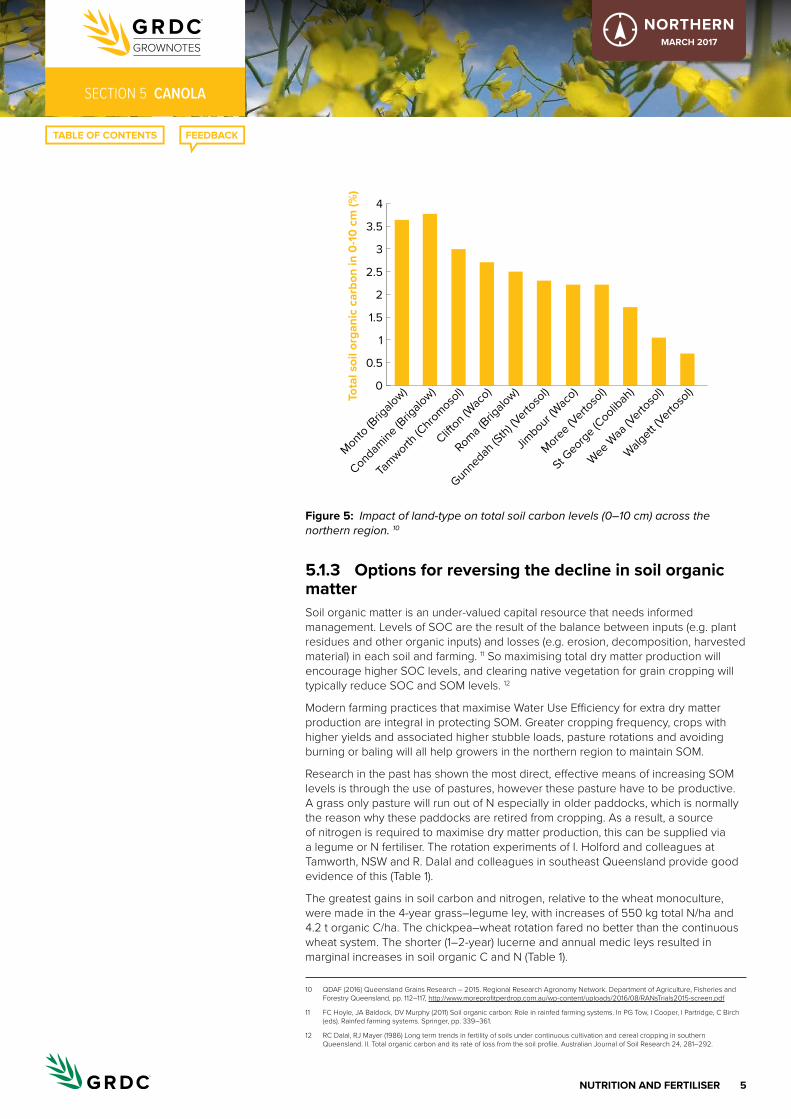
5NUtrItIoN aND FertIlISer
seCtioN 5 CANOLA
NORTHERNMarch 2017
Figure 5:
0
0.5
1
1.5
2
2.5
3
3.5
4
Monto (Brig
alow)
Condamine (B
rigalo
w)
Tamworth
(Chro
mosol)
Clifton (W
aco)
Roma (Brig
alow)
Gunnedah (S
th) (Verto
sol)
Jimbour (W
aco)
Moree (V
ertoso
l)
St Georg
e (Coolib
ah)
Wee Waa
(Verto
sol)
Walgett (
Vertoso
l)Tota
l soi
l org
anic
car
bon
in 0
-10
cm (%
)
Impact of land-type on total soil carbon levels (0–10 cm) across the northern region. 10
5.1.3 options for reversing the decline in soil organic matterSoil organic matter is an under-valued capital resource that needs informed management. Levels of SOC are the result of the balance between inputs (e.g. plant residues and other organic inputs) and losses (e.g. erosion, decomposition, harvested material) in each soil and farming. 11 So maximising total dry matter production will encourage higher SOC levels, and clearing native vegetation for grain cropping will typically reduce SOC and SOM levels. 12
Modern farming practices that maximise Water Use Efficiency for extra dry matter production are integral in protecting SOM. Greater cropping frequency, crops with higher yields and associated higher stubble loads, pasture rotations and avoiding burning or baling will all help growers in the northern region to maintain SOM.
Research in the past has shown the most direct, effective means of increasing SOM levels is through the use of pastures, however these pasture have to be productive. A grass only pasture will run out of N especially in older paddocks, which is normally the reason why these paddocks are retired from cropping. As a result, a source of nitrogen is required to maximise dry matter production, this can be supplied via a legume or N fertiliser. The rotation experiments of I. Holford and colleagues at Tamworth, NSW and R. Dalal and colleagues in southeast Queensland provide good evidence of this (Table 1).
The greatest gains in soil carbon and nitrogen, relative to the wheat monoculture, were made in the 4-year grass–legume ley, with increases of 550 kg total N/ha and 4.2 t organic C/ha. The chickpea–wheat rotation fared no better than the continuous wheat system. The shorter (1–2-year) lucerne and annual medic leys resulted in marginal increases in soil organic C and N (Table 1).
10 QDAF (2016) Queensland Grains Research – 2015. Regional Research Agronomy Network. Department of Agriculture, Fisheries and Forestry Queensland, pp. 112–117, http://www.moreprofitperdrop.com.au/wp-content/uploads/2016/08/RANsTrials2015-screen.pdf
11 FC Hoyle, JA Baldock, DV Murphy (2011) Soil organic carbon: Role in rainfed farming systems. In PG Tow, I Cooper, I Partridge, C Birch (eds). Rainfed farming systems. Springer, pp. 339–361.
12 RC Dalal, RJ Mayer (1986) Long term trends in fertility of soils under continuous cultivation and cereal cropping in southern Queensland. II. Total organic carbon and its rate of loss from the soil profile. Australian Journal of Soil Research 24, 281–292.

6NUtrItIoN aND FertIlISer
seCtioN 5 CANOLA
NORTHERNMarch 2017
Clearly, time and good sources of both carbon and nitrogen are required to build up SOM, which is exactly what the 4-year grass–legume ley provided. Nitrogen was supplied via N2 fixation by the lucerne and annual medic in the pasture, with most of the carbon supplied by the grasses, purple pigeon grass and Rhodes grass. There were no inputs of fertiliser nitrogen in any of the treatments in Table 1. 13
table 1: Effects of different rotations on soil total N and organic C (t/ha) to 30 cm and as gain relative to continuous wheat.
rotationWheat crops 0–30 cm Gain 0–30 cm Gain
Grass/legume ley 4 years
0 2.91 0.55 26.5 4.2
Lucerne ley (1-2 years)
2-3 2.56 0.20 23.5 1.2
Annual medic ley (1-2 years)
2-3 2.49 0.13 23.1 0.8
Chickpeas (2 years)
2 2.35 0.00 22.0 0.0
Continuous wheat 4 years
4 2.36 - 22.3 -
Further research was initiated in 2012 to identify cropping practices that have the potential to increase or maintain soil organic carbon and soil organic matter levels at the highest levels possible in a productive cropping system. Paired sampling has shown that returning cropping country to pasture will increase soil carbon levels (Figure 6). However, there were large variations in carbon level increases detected, indicating not all soil types or pastures preform the same. Soil type influences the speed by which carbon levels change, i.e. a sandy soil will lose and store carbon faster than a soil high in clay. As too does the quality and productivity of the pasture, maximising dry matter production by ensuring adequate nutrition (especially in terms of nitrogen and phosphorus) will maximise increases in soil carbon over time. Current research in Queensland being undertaken by the Department of Agriculture, Fisheries and Forestry (QDAF) is indicating that the most promising practice to date to rebuild soil carbon stocks, in the shortest time frame, is the establishment of a highly productive pasture rotation with annual applications of nitrogen fertiliser, however, adding an adapted legume is also effective. 14
13 D Herridge (2011) Managing legume and fertiliser N for northern grains cropping. Revised 2013. GRDC, https://grdc.com.au/uploads/documents/Managing-N-for-Northern-Grains-Cropping.pdf
14 QDAF (2016) Queensland Grains Research – 2015. Regional Research Agronomy Network. Department of Agriculture, Fisheries and Forestry Queensland, pp. 112–117, http://www.moreprofitperdrop.com.au/wp-content/uploads/2016/08/RANsTrials2015-screen.pdf
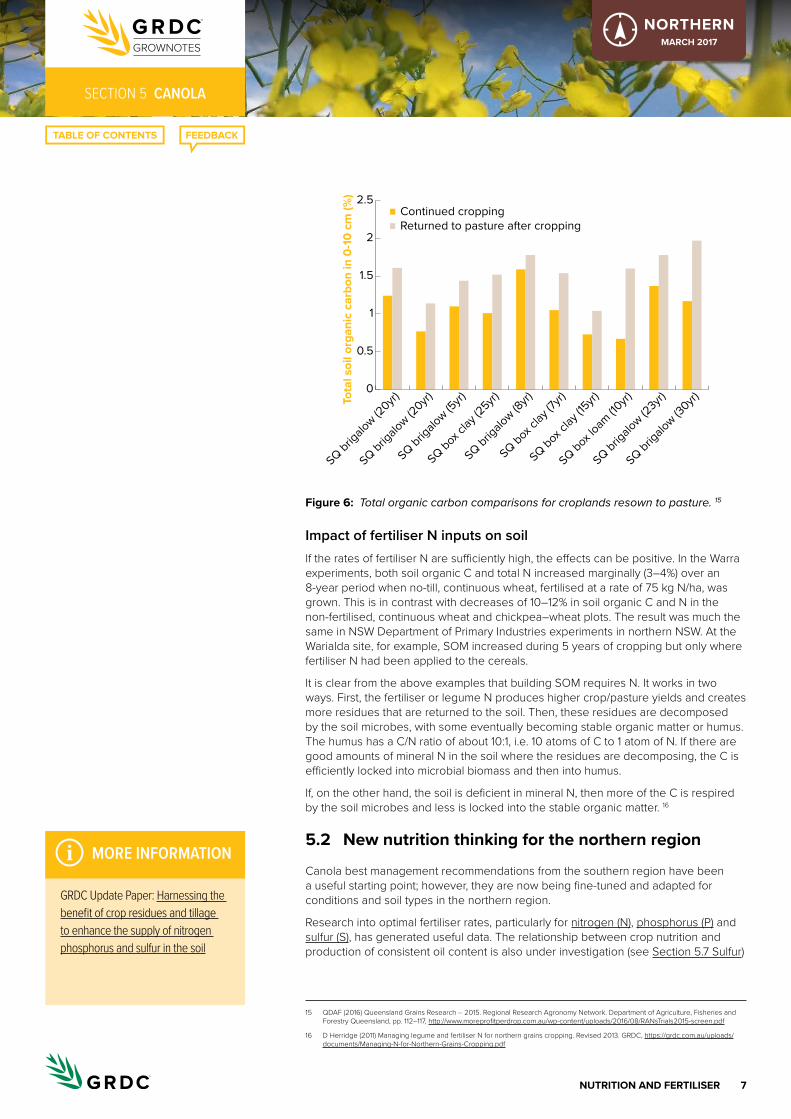
7NUtrItIoN aND FertIlISer
seCtioN 5 CANOLA
NORTHERNMarch 2017
Figure 6:
0
0.5
1
1.5
2
2.5
SQ brigalo
w (20yr)
SQ brigalo
w (20yr)
SQ brigalo
w (5yr)
SQ box cl
ay (2
5yr)
SQ brigalo
w (8yr)
SQ box cl
ay (7
yr)
SQ box cl
ay (15
yr)
SQ box lo
am (10
yr)
SQ brigalo
w (23yr)
SQ brigalo
w (30yr)To
tal s
oil o
rgan
ic c
arbo
n in
0-1
0 cm
(%)
Continued croppingReturned to pasture after cropping
Total organic carbon comparisons for croplands resown to pasture. 15
Impact of fertiliser N inputs on soilIf the rates of fertiliser N are sufficiently high, the effects can be positive. In the Warra experiments, both soil organic C and total N increased marginally (3–4%) over an 8-year period when no-till, continuous wheat, fertilised at a rate of 75 kg N/ha, was grown. This is in contrast with decreases of 10–12% in soil organic C and N in the non-fertilised, continuous wheat and chickpea–wheat plots. The result was much the same in NSW Department of Primary Industries experiments in northern NSW. At the Warialda site, for example, SOM increased during 5 years of cropping but only where fertiliser N had been applied to the cereals.
It is clear from the above examples that building SOM requires N. It works in two ways. First, the fertiliser or legume N produces higher crop/pasture yields and creates more residues that are returned to the soil. Then, these residues are decomposed by the soil microbes, with some eventually becoming stable organic matter or humus. The humus has a C/N ratio of about 10:1, i.e. 10 atoms of C to 1 atom of N. If there are good amounts of mineral N in the soil where the residues are decomposing, the C is efficiently locked into microbial biomass and then into humus.
If, on the other hand, the soil is deficient in mineral N, then more of the C is respired by the soil microbes and less is locked into the stable organic matter. 16
5.2 New nutrition thinking for the northern region
Canola best management recommendations from the southern region have been a useful starting point; however, they are now being fine-tuned and adapted for conditions and soil types in the northern region.
Research into optimal fertiliser rates, particularly for nitrogen (N), phosphorus (P) and sulfur (S), has generated useful data. The relationship between crop nutrition and production of consistent oil content is also under investigation (see Section 5.7 Sulfur)
15 QDAF (2016) Queensland Grains Research – 2015. Regional Research Agronomy Network. Department of Agriculture, Fisheries and Forestry Queensland, pp. 112–117, http://www.moreprofitperdrop.com.au/wp-content/uploads/2016/08/RANsTrials2015-screen.pdf
16 D Herridge (2011) Managing legume and fertiliser N for northern grains cropping. Revised 2013. GRDC, https://grdc.com.au/uploads/documents/Managing-N-for-Northern-Grains-Cropping.pdf
i MORE INFORMATION
GRDC Update Paper: harnessing the benefit of crop residues and tillage to enhance the supply of nitrogen phosphorus and sulfur in the soil
8NUtrItIoN aND FertIlISer
seCtioN 5 CANOLA
NORTHERNMarch 2017
Previous recommendations considered S to be non-negotiable and N applications more seasonally dependent. New research indicates this approach needs to be reversed; S application may not be needed and attention should be refocused and effort redirected to getting N rates right.
Trials over 3 years in the central and northern regions of NSW indicate that the previous recommendation of 20–25 kg S/ha independent of soil nutritional status is unwarranted, with no trial demonstrating a response.
Sulfur deficiency in canola, if it occurs, can be severe but this is not always the case. The frequency of such deficiency is most likely lower than thought and can be rectified early in-crop without ongoing penalty.
Canola has abundant fine roots with the ability to branch and proliferate in zones of higher nutrient content, such as around fertiliser bands or granules. In addition, canola roots can increase their root hair number and length in response to low P conditions.
Strong responses to N have been observed. Savings in S fertiliser costs may be better used to increase N rates. 17
5.3 crop removal rates
Canola requires high inputs per tonne of grain for the major (macro-) nutrients N, P and S compared with other crops (Table 2). However, on a per-hectare basis, canola’s nutritional requirements are similar to cereals, because yields are usually about 50% of wheat. 18
table 2: Comparison of the average amount of major nutrients removed (kg/ha) per tonne of grain and stubble for a range of crops, including canola and wheat.
Nitrogen Phosphorus Potassium Sulfur
Grain Stubble Grain Stubble Grain Stubble Grain Stubble
Canola 40 10 7 2 9 26 3.5–5 3.2
Wheat 21 8 3 0.7 5 21 1.5 1.5
Barley 20 7 2.5 0.7 4.5 18 1.5 1.5
Oats 20 7 2.5 0.6 4.5 18 2 1
Lupins 51 10 4.5 0.4 9 16 3 2.5
5.4 Soil testing
In Australia, canola is not recommended for soils of pHCaCl <4.5, and preferably not <4.7 if exchangeable aluminium (Al) levels exceed 3%. Many soils where canola is grown have a pH <5.0, with some as low as 4.0. Although most of these soils were naturally acidic, their acidity has been increased by agricultural activities. The acidity may occur in the surface soil or subsoil, or in both. Soil tests for pH are recommended before growing canola. Samples are taken from the surface (0–10 cm), as well as at depth (10–30 cm) to check for subsoil acidity.
Where the soil is pH is ≤5, Al and manganese (Mn) toxicities can be a problem for canola. Aluminium is much more detrimental than Mn because it kills root tips, the sites of root growth. Plants with Al toxicity have a shallow, stunted root system that is unable to exploit soil moisture at depth. The crop does not respond to available nutrients, and seed yield is drastically reduced. Severe Mn toxicity reduces yield because
17 GRDC (2014) Canola nutrition in the northern region. GRDC Media Centre, 28 April 2014, http://grdc.com.au/Media-Centre/Hot-Topics/Canola-nutrition-in-the-northern-region
18 P Parker (2009) Nutrition and soil fertility. Ch. 7. In Canola best practice management guide for south-eastern Australia. (Eds D McCaffrey, T Potter, S Marcroft, F Pritchard) GRDC, http://www.grdc.com.au/uploads/documents/GRDC_Canola_Guide_All_1308091.pdf
i MORE INFORMATION
economics and management of P nutrition and multiple nutrient decline
Nitrogen and sulfur for wheat and canola—protein and oil.
i MORE INFORMATION
GRDC Update Paper: the what where and why of soil testing in the northern region
9NUtrItIoN aND FertIlISer
seCtioN 5 CANOLA
NORTHERNMarch 2017
entire leaves become chlorotic and distorted. Mild to severe Mn toxicity is often seen sporadically or in patches and often associated with waterlogged parts of fields. 19
NSW DPI soil testing
5.5 Nitrogen
Canola has a high N demand, twice that per ton of wheat. One ton per ha of canola will remove approximately 40Kg/ha of N but the crop will require at least twice this amount. For a crop with a targeted yield of around 2 t/ha the crop will require around 160 kg/ha of N. This can be supplied through soil reserves but additional N fertiliser will be needed in many cases. Depending on the amount of soil N available to the crop, ~80–100 kg/ha of fertiliser N would be needed. In general, a canola crop requires an amount of N similar to a high-protein wheat crop.
Deep soil testing for N and S is recommended for all growers, particularly first-time growers. This will allow N budgeting.
Canola seed is very sensitive to fertiliser burn. No more than 10 kg/ha of N should be in direct contact with the seed at sowing in narrow (18-cm) rows and proportionally less at wider row spacings. The majority of the N should be either drilled in before sowing or banded 2–3 cm below and beside the seed at sowing (Figure 7). An alternative is to apply N to the growing crop. Application timing should aim to minimise losses from volatilisation, that is, time the topdressing for when the crop has good groundcover and before a rain event. Losses can be high on dry, alkaline soils. 20
WATCH: Interview with central west NSW grain growers Dave and Nigel Newbigging
19 P Hocking, R Norton, A Good (1999) Crop nutrition. 10th International Rapeseed Congress, http://www.regional.org.au/au/gcirc/canola/p-05.htm
20 L Serafin, J Holland, R Bambach, D McCaffery (2009) Canola: northern NSW planting guide. NSW Department of Primary Industries, http://www.dpi.nsw.gov.au/__data/assets/pdf_file/0016/148300/canola-northern-NSW-planting-guide.pdf
i MORE INFORMATION
GRDC Update Paper: Budgeting crop nitrogen supply better estimation better decisions
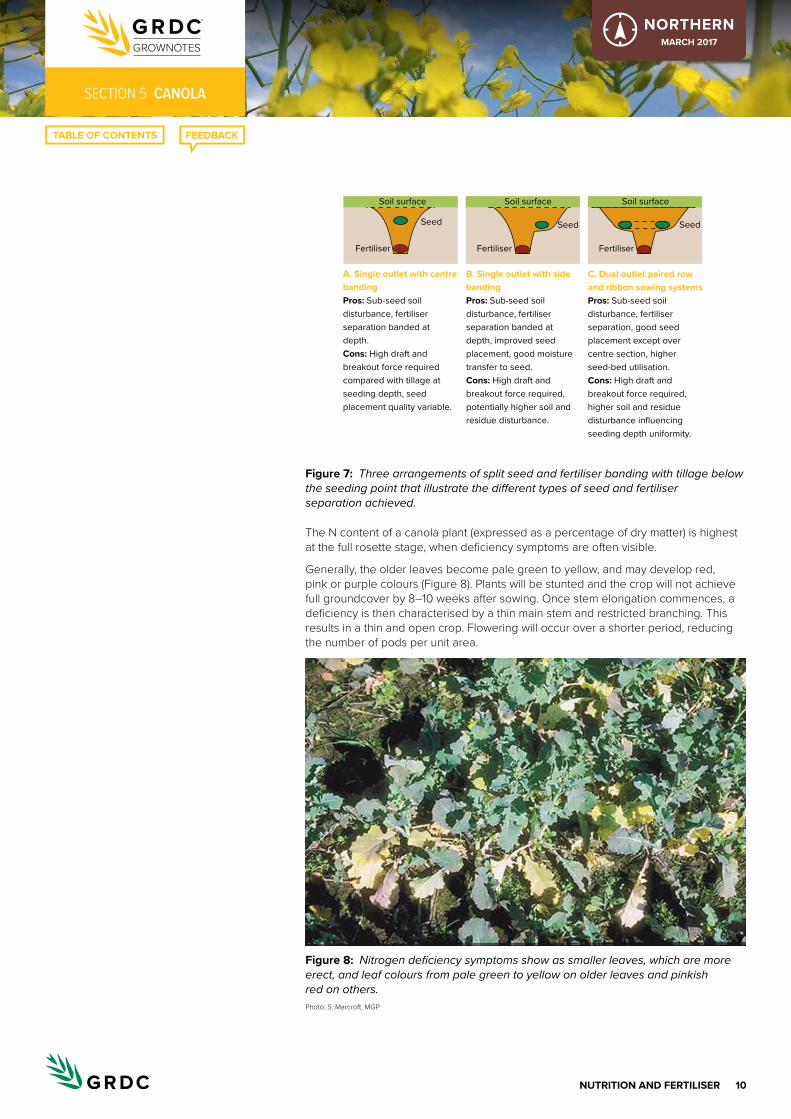
10NUtrItIoN aND FertIlISer
seCtioN 5 CANOLA
NORTHERNMarch 2017
Figure 7:
Soil surface
Seed Seed Seed
FertiliserFertiliserFertiliser
Soil surface Soil surface
A. Single outlet with centre bandingPros: Sub-seed soil disturbance, fertiliser separation banded at depth.Cons: High draft and breakout force required compared with tillage at seeding depth, seed placement quality variable.
B. Single outlet with side bandingPros: Sub-seed soil disturbance, fertiliser separation banded at depth, improved seed placement, good moisture transfer to seed.Cons: High draft and breakout force required, potentially higher soil and residue disturbance.
C. Dual outlet paired row and ribbon sowing systemsPros: Sub-seed soil disturbance, fertiliser separation, good seed placement except over centre section, higher seed-bed utilisation.Cons: High draft and breakout force required, higher soil and residue disturbance influencing seeding depth uniformity.
Three arrangements of split seed and fertiliser banding with tillage below the seeding point that illustrate the different types of seed and fertiliser separation achieved.
The N content of a canola plant (expressed as a percentage of dry matter) is highest at the full rosette stage, when deficiency symptoms are often visible.
Generally, the older leaves become pale green to yellow, and may develop red, pink or purple colours (Figure 8). Plants will be stunted and the crop will not achieve full groundcover by 8–10 weeks after sowing. Once stem elongation commences, a deficiency is then characterised by a thin main stem and restricted branching. This results in a thin and open crop. Flowering will occur over a shorter period, reducing the number of pods per unit area.
Figure 8: Nitrogen deficiency symptoms show as smaller leaves, which are more erect, and leaf colours from pale green to yellow on older leaves and pinkish red on others. Photo: S. Marcroft, MGP

11NUtrItIoN aND FertIlISer
seCtioN 5 CANOLA
NORTHERNMarch 2017
Unfortunately, some visual symptoms are similar to other nutrient deficiencies (e.g. P and S), which can result in incorrect diagnosis. 21
N deficiency affects older leaves first, while sulfur deficiency affects younger leaves first. 22
Tissue tests combined with a good knowledge of the paddock’s history (including past fertiliser use and crop yields) will assist in a more accurate assessment of the most likely deficiency. 23
Diagnosing nitrogen efficiency in canola
5.5.1 estimating nitrogen requirementsCanola is ideally grown in soils of high N fertility; for example, as the first or second crop following several years of legume-dominant pasture. However, paddock fertility is often inadequate, so additional N is required to produce both high yields and good seed quality.
Canola removes 40 kg N/t grain, but the crop requires up to three times this amount of N to produce this yield (referred to as the efficiency factor). This is because the plants must compete for N with soil microorganisms, and some of the N taken up by the plants is retained in the stubble, and senesced leaves and roots. A good canola crop will produce twice as much stubble as grain (by weight), giving a harvest index (HI) of about 33%.
The best way to determine a crop’s potential N requirement is through a combination of N removal (total N in the estimated grain yield × efficiency factor) and the amount of N estimated to be available in the soil. Deep soil tests (to a depth of 60 or 90 cm) can be taken prior to sowing. Most deep soil tests are taken to 60 cm in the major canola-producing areas. They can also be done during the growing season to determine whether topdressing is required.
ExampleAvailable soil N (calculated from deep N test + estimate of in-crop mineralisation) = 125 kg/ha
As a rough ‘rule of thumb’, the in-crop mineralisation is calculated as: Growing season rainfall (mm) × organic carbon (%) × 0.15
Fertiliser N required for crop = total N required – available soil N (kg N/ha) = 200 – 125 kg N/ha = 75 kg N/ha
Nitrogen requirement calculator
Nitrogen removed in grain = target yield × 40 (kg N/t grain)
Total N required = N removed in grain × 2.5 (efficiency factor of 40%)
In the example: Estimated target yield = 2 t/ha N removal in grain 2 × 40 kg N/t = 80 kg N/ha Total N required = 80 × 2.5 kg N/ha = 200 kg N/ha 24
Nitrogen fertiliser rates
Fertiliser N required for crop = total N required – available soil N (kg N/ha)
21 P Parker (2009) Nutrition and soil fertility. Ch. 7. In Canola best practice management guide for south-eastern Australia. (Eds D McCaffrey, T Potter, S Marcroft, F Pritchard) GRDC, http://www.grdc.com.au/uploads/documents/GRDC_Canola_Guide_All_1308091.pdf
22 Diagnosing nitrogen deficiency in canola, https://www.agric.wa.gov.au/mycrop/diagnosing-nitrogen-deficiency-canola
23 P Parker (2009) Nutrition and soil fertility. Ch. 7. In Canola best practice management guide for south-eastern Australia. (Eds D McCaffrey, T Potter, S Marcroft, F Pritchard) GRDC, http://www.grdc.com.au/uploads/documents/GRDC_Canola_Guide_All_1308091.pdf
24 P Parker (2009) Nutrition and soil fertility. Ch. 7. In Canola best practice management guide for south-eastern Australia. (Eds D McCaffrey, T Potter, S Marcroft, F Pritchard) GRDC, http://www.grdc.com.au/uploads/documents/GRDC_Canola_Guide_All_1308091.pdf

12NUtrItIoN aND FertIlISer
seCtioN 5 CANOLA
NORTHERNMarch 2017
Using the example: Available soil N (calculated from deep N test + in-crop mineralisation) = 125 kg/ha Fertiliser N required for crop = 200 – 125 kg N/ha = 75 kg N/ha (or 163 kg/ha of urea)
As the above calculations indicate, about 75 kg/ha of additional N is required as fertiliser to achieve the anticipated yield. The N can be applied in several combinations pre-sowing, at sowing or as topdressing(s) before stem elongation during the season.
Other formulae are available for calculating N requirements; however, these need more detailed inputs, which can be provided by consultants or agronomists. 25
IN FOCUS5.5.2 Northern grower alliance trials
Recent GRDC-funded Northern Grower Alliance (NGA) research has demonstrated strong yield responses to N in situations with ~25–70 kg N/ha available from soil testing (excluding any mineralised N). Nitrogen removal in grain was ~60–80 kg N/ha at yields of ~1.5–2.0 t/ha. This supports a total crop-available N target of ~120–160 kg N/ha where yield targets are in the range of 1.5–2.0 t/ha. It also corresponds to a total crop-available N target of ~80 kg N/ha for each tonne of grain. 26
Other key findings included:• Nitrogen was the key nutrient limiting grain yield, with significant yield
responses at all sites and net returns of $120–200/ha compared with nil N applied.
• Oil content significantly decreased (by 1–3%) with additional N at three of the four sites, but financial impact was more than compensated by yield increases.
• No interaction between N and S was detected at any site. 27
Yield
Key points• Significant yield response to N was found at all sites.• Yield response to N had plateaued at Yallaroi and Bellata but not at
Moree and Blackville.• No yield response to addition of S was detected at any site.• There was a yield response to P at both Yallaroi and Bellata.
There was no significant N × S interaction for yield at any trial. The results presented in Tables 3 and 4 show the main effects of N or S. The factorial experimental design means that each result for a single rate of N or S is based on 32 individual plots at Moree and Blackville and 12 plots at Yallaroi and Bellata. The results for yield response to P (Table 5) and oil content (Tables 6–8) are based on a smaller subset of treatments at
25 P Parker (2009) Nutrition and soil fertility. Ch. 7. In Canola best practice management guide for south-eastern Australia. (Eds D McCaffrey, T Potter, S Marcroft, F Pritchard) GRDC, http://www.grdc.com.au/uploads/documents/GRDC_Canola_Guide_All_1308091.pdf
26 GRDC (2014) Canola nutrition in the northern region. GRDC Media Centre, 28 April 2014, http://grdc.com.au/Media-Centre/Hot-Topics/Canola-nutrition-in-the-northern-region
27 R Daniel, M Gardner, A Mitchell, R Norton (2013) Canola nutrition: what were the benefits from N, S and P in 2012? GRDC Update Papers, 5 March 2013, http://grdc.com.au/Research-and-Development/GRDC-Update-Papers/2013/03/Canola-nutrition-what-were-the-benefits-from-N-S-and-P-in-2012

13NUtrItIoN aND FertIlISer
seCtioN 5 CANOLA
NORTHERNMarch 2017
Yallaroi and Bellata with a factorial of two rates of P and three combinations of N and S. 28
table 3: Grain yield response to different rates of nitrogen addition at four sites.
Moree Blackville Yallaroi Bellata
N added (kg N/ha)
Grain yield (t/ha)
N added (kg N/ha)
Grain yield (t/ha)
N added (kg N/ha)
Grain yield (t/ha)
N added (kg N/ha)
Grain yield (t/ha)
0 0.73d 0 0.99c 34 1.58b 34 1.25b
40 1.08c 50 1.51b 84 1.89a 84 1.40a
80 1.31b 100 1.69b 134 1.91a 134 1.45a
120 1.47a 200 1.99a
l.s.d. (P = 0.05):
0.14 0.19 0.21 0.12
CV 6.4 % 4.8% 14.0% 10.7%
CV, Coefficient of variation. Within columns, means followed by the same letter are not significantly different at P = 0.05
table 4: Grain yield at different rates of sulfur addition at four sites.
Moree Blackville Yallaroi Bellata
S added (kg S/ha)
Grain yield (t/ha)
S added (kg S/ha)
Grain yield (t/ha)
S added (kg S/ha)
Grain yield (t/ha)
S added (kg S/ha)
Grain yield (t/ha)
1 1.16 1 1.53 1 1.75 1 1.32
11 1.14 11 1.52 16 1.77 16 1.40
21 1.12 21 1.56 31 1.85 31 1.38
41 1.16 41 1.54
There were no significant differences
table 5: Grain yield response to different rates of phosphorus addition at two sites.
Yallaroi Bellata
P added (kg P/ha)
Grain yield (t/ha)
P added (kg P/ha)
Grain yield (t/ha)
0 1.54b 0 1.26b
20 1.83a 20 1.43a
l.s.d. (P =0.05) 0.19 0.12
CV 12.2% 12.0%CV, Coefficient of variation. Within columns, means followed by the same letter are not significantly different at P = 0.05
Oil content
Key points• Significant reduction in oil content occurred with increasing N rates at three
of the four sites.• No oil content response was detected to addition of S at any site.
28 R Daniel, M Gardner, A Mitchell, R Norton (2013) Canola nutrition: what were the benefits from N, S and P in 2012? GRDC Update Papers, 5 March 2013, http://grdc.com.au/Research-and-Development/GRDC-Update-Papers/2013/03/Canola-nutrition-what-were-the-benefits-from-N-S-and-P-in-2012

14NUtrItIoN aND FertIlISer
seCtioN 5 CANOLA
NORTHERNMarch 2017
• There was no significant oil content response to addition of P at either site.
table 6: Oil content response to different rates of nitrogen application at four sites.
Moree Blackville Yallaroi Bellata
N added (kg N/ha)
Oil content (%)
N added (kg N/ha)
Oil content (%)
N added (kg N/ha)
Oil content (%)
N added (kg N/ha)
Oil content (%)
0 43.9a 0 45.5b 34 44.5 34 47.3a
40 44.3a 50 46.2a 84 44.4 84 46.0b
80 43.2b 100 45.8b 134 44.6 134 44.5c
120 42.3c 200 44.7c
l.s.d. (P = 0.05)
0.5 0.4 n.s. 0.8
Within columns, means followed by the same letter are not significantly different at P = 0.05; n.s., not significant
table 7: Oil content at different rates of sulfur at four sites.
Moree Blackville Yallaroi Bellata
S added (kg S/ha)
Oil content (%)
S added (kg S/ha)
Oil content (%)
S added (kg S/ha)
Oil content (%)
S added (kg S/ha)
Oil content (%)
1 43.6 1 45.5 1 44.4 1 46.0
11 43.6 11 45.6 16 44.6 16 46.0
21 43.7 21 45.6 31 44.5 31 45.7
41 43.7 41 45.6There were no significant differences
table 8: Oil content at different rates of phosphorus addition at two sites.
Yallaroi Bellata
P added (kg P/ha)
Oil content (%) P added (kg P/ha)
Oil content (%)
0 44.8 0 45.4
20 44.4 20 46.1There were no significant differences
Although the Bellata result in Table 8 was not significant (P = 0.11) with respect to P addition, there was an apparent trend to improved oil content, particularly when combined with lower N rates (~0.7–0.9% oil content). This may be experimental noise but appears worthy of further investigation. 29
For more details about the trial sites and experimental design, read the 2013 Update Paper: Canola nutrition: what were the benefits from N S and P in 2012?
http://www.farmtrials.com.au/
29 R Daniel, M Gardner, A Mitchell, R Norton (2013) Canola nutrition: what were the benefits from N, S and P in 2012? GRDC Update Papers, 5 March 2013, http://grdc.com.au/Research-and-Development/GRDC-Update-Papers/2013/03/Canola-nutrition-what-were-the-benefits-from-N-S-and-P-in-2012
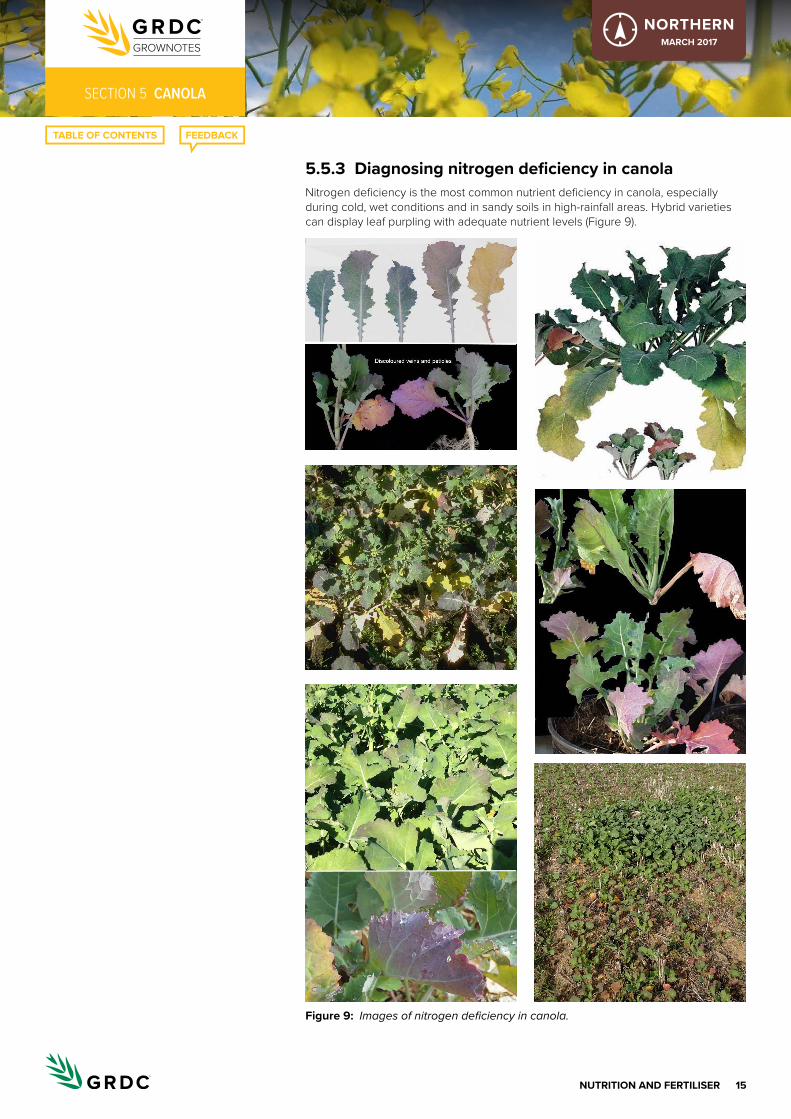
15NUtrItIoN aND FertIlISer
seCtioN 5 CANOLA
NORTHERNMarch 2017
5.5.3 Diagnosing nitrogen deficiency in canolaNitrogen deficiency is the most common nutrient deficiency in canola, especially during cold, wet conditions and in sandy soils in high-rainfall areas. Hybrid varieties can display leaf purpling with adequate nutrient levels (Figure 9).
Figure 9: Images of nitrogen deficiency in canola.
16NUtrItIoN aND FertIlISer
seCtioN 5 CANOLA
NORTHERNMarch 2017
What to look for
Paddock• Plants are smaller and less branched with red to purple or yellow leaves.• Symptoms are worse in wetter seasons, on lighter soil areas and sometimes on
non-legume header rows.
Plant• Mildly deficient plants are smaller with paler green and more erect leaves.
Deficient seedlings have reddened cotyledons.• Oldest leaves develop whitish purple veins and mild purple pigmentation that
starts at the end of the leaf and progresses to the base on both sides of the leaf. (See Table 9 for conditions with similar leaf symptoms.)
• The whole leaf then turns yellow or pinkish purple. Developing leaves are narrow and more erect.
• Established plants that become N-deficient develop yellowing on leaf margins that spreads in toward the midrib between the veins. The midrib becomes discoloured then the leaf dies.
• From stem elongation, the main stem is thinner and branching is restricted. Flowering time and pod numbers are reduced.
What else could it be?
table 9: Conditions that result in symptoms similar to nitrogen deficiency.
condition Similarities Differences
Beet western yellow virus in canola
Purple-red colours spreading from end of oldest leaves
Affected plants are stunted rather than smaller and thinner
Damping off in canola Reddened cotyledons and seedling older leaves
Damping off causes stunted plants with pinched roots or hypocotyls. Often plant death occurs
Sulfur deficiency in canola Purple leaves Sulfur deficiency affects younger leaves the most
Phosphorus deficiency in canola
Purplish older leaves Phosphorus-deficient plants have purpling on leaf margin, then the leaf turns bronze
Where does it occur?Nitrogen deficiency can occur on most soils but is most common in the following situations:• cold, wet conditions that slow N mineralisation and uptake of N• soils with very low organic matter• after high rainfall on sandy soils, which can result in nitrogen leaching.
Management strategies• Nitrogen fertiliser or foliar spray can be applied. However only N can be
absorbed through the leaf so you will still be reliant on rainfall to move the nitrogen into the root zone, economics of liquid vs solid fertilisers should be taken into account.
17NUtrItIoN aND FertIlISer
seCtioN 5 CANOLA
NORTHERNMarch 2017
• There is a risk of volatilisation loss from urea or nitrate sources of N. Loss is greatest from dry alkaline soils with dewy conditions, but new GRDC-funded research shows this may not be as high as traditionally thought. 30
• The yield potential for canola is established during stem elongation and the budding stage, so all N should be applied before this stage of growth (8–10 weeks).
• Unlike cereals, canola does not ‘hay off’ when too much N has been applied, but N reduces oil content, particularly with late application.
Nitrogen volatilisation: Factors affecting how much N is lost and how much is left over time
How can it be monitored?
Tissue test• Use whole top-of-plant test to diagnose suspected deficiency. Critical N levels
vary with plant age and size, but as a rough guide, 2.7% (seedling) to 3.2% (rosette) indicates deficiency.
• Nitrogen soil testing by itself is of little value for most soils.• Models that combine Nitrate, Ammonium, soil organic carbon, soil type and
legume history are valuable for N fertiliser calculation.• Leaf-colour symptoms are not a reliable guide for hybrid varieties. 31
5.6 Phosphorus
Research in northern NSW has shown that P application is more critical for canola than for wheat grown under the same conditions. Results have consistently shown greater responses to P in canola than wheat, and responses have occurred in situations where wheat has not responded. Hence, it is critical that P be applied to canola unless soil tests indicate that the soil is well supplied with this nutrient. 32
With grain removal of ~10 kg P/ha, application of ~15–20 kg P/ha appears warranted from both an agronomic and a financial viewpoint. 33
For more details about the trial sites and experimental design, read the 2013 Update Paper: Canola nutrition: what were the benefits from N S and P in 2012?
30 G. Schwenke, Nitrogen volatilisation: Factors affecting how much N is lost and how much is left over time (2014), http://www.grdc.com.au/Research-and-Development/GRDC-Update-Papers/2014/07/Factors-affecting-how-much-N-is-lost-and-how-much-is-left-over-time
31 DAFWA (2015) Diagnosing nitrogen deficiency in canola. Department of Agriculture and Food, Western Australia, https://www.agric.wa.gov.au/mycrop/diagnosing-nitrogen-deficiency-canola
32 L Serafin, J Holland, R Bambach, D McCaffery (2009) Canola: Northern NSW planting guide. NSW Department of Primary Industries, http://www.dpi.nsw.gov.au/__data/assets/pdf_file/0016/148300/canola-northern-NSW-planting-guide.pdf
33 GRDC (2014) Canola nutrition in the northern region. GRDC Media Centre, 28 April 2014, http://grdc.com.au/Media-Centre/Hot-Topics/Canola-nutrition-in-the-northern-region/Details
i MORE INFORMATION
GRDC Update Paper: improving fertiliser decisions for P on the Western Downs
GRDC Update Paper: Phosphorus and potassium nutrition

18NUtrItIoN aND FertIlISer
seCtioN 5 CANOLA
NORTHERNMarch 2017
Figure 10: Severe phosphorus deficiency showing plant stunting and delayed maturity. Photo: R. Colton, NSW DPI
5.6.1 role and deficiency symptomsPhosphorus plays an important role in the storage and use of energy within the plant. Lack of P restricts root development (resulting in weaker plants) and delays maturity (Figure 10), both of which affect yield potential and seed oil content, particularly in dry spring conditions. Low P levels also restrict the plant’s ability to respond to N. Even a mild deficiency can significantly reduce plant growth without any symptoms. In cases of severe deficiency, the older leaves will often appear dull blue or purple (Figure 11). Phosphorus is a very mobile nutrient within the plant, and if a deficiency occurs, it moves rapidly from older leaves to the young leaves or developing pods.
Figure 11: Phosphorus deficiency shows as distinct pink purpling of the tips and margins of older leaves. Photo: P. Hocking, CSIRO
19NUtrItIoN aND FertIlISer
seCtioN 5 CANOLA
NORTHERNMarch 2017
Fertiliser placementIn the soil, P is immobile, so fertiliser should be banded close to the seed at sowing. This ensures that the developing seedling is able to take up a good supply during the early growth stage when requirement for P is at its highest. Many soils (particularly if exchangeable Al is present) are able to tie up P, making it unavailable to plants. Banding the fertiliser can reduce the amount of P tied up because less fertiliser is in contact with the soil than occurs with broadcasting.
Phosphorus fertiliser banded above and below the seed gives better yield responses than P broadcast before sowing. In sandy soils, which are prone to drying in the surface layer, banding some of the fertiliser below the seed at sowing may improve the efficiency of P uptake.
Phosphorus requirementsIf a wheat crop responds to P, then a rate at least equivalent should be used when sowing canola at that site. Topdressing is ineffective, so it is important to get the P rate right at sowing. A maintenance application of 7–8 kg P/ha is needed for every tonne of canola you expect to harvest.
If a soil-test indicates a high soil P level, then lower rates of P could be applied. In some situations, where soil P levels are very high, it may be uneconomic to apply P. If more is applied than is removed by the grain, it will be added to the soil P bank and may be available for following crops or pastures to utilise. However, a significant proportion (up to 50%) of applied fertiliser P can ultimately become ‘fixed’ into organic and inorganic forms that are largely unavailable for crop uptake in the short-medium term but can add to the P pool in the longer term with a proportion of the P becoming available over time.
Depending on your location there are a few laboratory analysis available for P. The Olsen P test (Bicarb) is often recommended on acid soils. The Colwell P test is more useful on alkaline clay soils, however each of these tests only measures a proportion of the P status of a soil. The Phosphorus Buffering Index is also important as it can indicate how available the phosphorus in the soil is to plants, whilst the BSES-P is recommended as a baseline of the pool P status. Using a qualified soil nutrition advisor will help you decide which tests are applicable on your soil type.
If tests indicate <20 mg/kg, then P is considered low (depending on soil type and rainfall) and a response is likely. If the soil P level is high (>40 mg/kg P) a response to P is less likely, unless the soil is acidic (pHCa <4.8) and has a low cation exchange capacity (<5 cmol(+)/kg); in such cases, significant yield responses have been obtained in southern NSW. Soil P tests are less reliable in low-rainfall zones or on alkaline soils, and so a nutrient budget is better for making P fertiliser decisions. A Colwell P level of ~40 mg/kg provides opportunity for some seasonal adjustment to fertiliser rates. 34
Table 10 shows the critical P soil test values based on data from the Better Fertiliser Decisions for Crops (Bell et al. 2013). Values differ by soil type and crop, and the values indicate that canola is less responsive than wheat or barley on many soils. However, the dataset is incomplete so true comparisons are difficult to make. There is a suggestion that wheat after canola is more P responsive than wheat after wheat, possibly because the canola is quite efficient at accessing soil P.
34 P Parker (2009) Nutrition and soil fertility. Ch. 7. In Canola best practice management guide for south-eastern Australia. (Eds D McCaffrey, T Potter, S Marcroft, F Pritchard) GRDC, http://www.grdc.com.au/uploads/documents/GRDC_Canola_Guide_All_1308091.pdf
i MORE INFORMATION
economics and management of P nutrition and multiple nutrient decline

20NUtrItIoN aND FertIlISer
seCtioN 5 CANOLA
NORTHERNMarch 2017
table 10: Critical Colwell soil test values and ranges as taken from the Better Fertiliser Decisions for Crops database (Bell et al. 2013). 35
crop Soil type critical value (mg/kg) critical range (mg/kg)
Wheat and barley
Vertosol 17 12–25
Chromosol/Sodosol
22 17–28
Calcarosol 34 26–44
Brown/Red Chromosols
25 18–35
Barley Ferrosols 76 46–130
Canola All soils 18 16–19
Field pea All soils 24 21–28
5.7 Sulfur
Traditional thought was that canola requires about 10 kg sulfate-S/t grain. The standard recommendation in southern NSW is to apply 25–30 kg sulfate-S/ha. However, while the standard ‘rule of thumb’ has been commonly extended on northern clay soils as early as 1992, commercial trials indicated a lower requirement on soil types that have naturally occurring gypsum at depth, typically the grey and black clay soils. This was identified in a deep (60–90 cm) soil test.
Recent research suggests that growers in southern Queensland and central/northern parts of NSW can reconsider routinely adding sulfur (S) to canola where there is good soil fertility and plant roots can access subsoil S reserves.
Is sulfur over-rated?• Canola has a high profit potential as well as farming system benefits, such as
reducing disease load (e.g. crown rot, take-all).• Canola is considered by many growers to be a high risk and expensive crop to
grow, mainly due to concerns about high inputs, including fertiliser.• Crop nutrition is a major determinant of profitable crop production, with both
under- and over-fertilisation leading to economic losses.• Field trials in central and northern NSW over five years have shown no significant
responses to added S for yield and oil percentage. 36 This has prompted new advice for growers.
• Where canola is grown more intensively in southern NSW and crop removal of S is higher, sulfur requirements should be determined by deep soil testing, using test strips and keeping accurate records of previous S applications.
• N deficiency is far more common than sulfur deficiency. N and P are crucial nutrients to get right.
• S responses are most likely when soil or seasonal conditions limit root access to deeper soil reserves. In this case, S applied at the surface is more likely to generate a response. S is more mobile in the soil and susceptible to leaching from the topsoil and accumulating at depths below 60 cm.
Key points• Recent research indicates that blanket early applications of 20 kg/ha of S to soil
in central/northern NSW and southern Queensland are not warranted.
35 R Norton (2016) Phosphorus – are we going to hit the wall and how much P in 2015? GRDC Update Papers 21 July 2015, https://grdc.com.au/Research-and-Development/GRDC-Update-Papers/2015/07/Phosphorus
36 M Street (2014) Review of sulfur strategy to improve profitability in canola in the central west of NSW. GRDC Update Papers, 18 February 2014, https://grdc.com.au/Research-and-Development/GRDC-Update-Papers/2013/02/Sulfur-strategy-to-improve-profitability-in-canola-in-the-central-west-of-NSW
FAQ

21NUtrItIoN aND FertIlISer
seCtioN 5 CANOLA
NORTHERNMarch 2017
• S deficiencies can be significant when they occur but occurrences are rare.• Growers can adopt a watch-and-see approach. Be ready to fertilise in-crop if
signs of deficiency occur as 100% of yield and oil percentage can be recovered if sulfur is applied before stem elongation.
• Savings from S fertiliser costs may be better used to increase N rates. • Most soils in the regions researched would have sufficient S in the profile to
meet the requirements of most crops.• Conducting KCl-40 soil tests before growing canola may be useful, however
the currently recommended critical soil test levels are, in most cases, higher than needed.
• Soil requirements for sulfur should be determined by deep soil tests. Shallow soil tests are unreliable. 37
5.7.1 a new paradigm in sulfur thinkingAdvice for growers based on best-available, past research into fertiliser rates (N, P and S) was to always apply a base level of S and to apply N depending on the season.
New research indicates this approach needs to be reversed. More than 20 trials across several seasons and locations in central and northern NSW have shown no yield or oil percentage responses to added S. They also showed no significant N S interaction for yield. Getting N rates right is most important and S application may not be needed. Furthermore, S deficiency can be identified early on and rectified early in-crop. 38
Grain removal rates lower than thought
Commonly quoted grain-removal rates used in nutrient budget are overestimates. Average crop removal rates do not support the requirement of 20 kg S/ha universally. While current industry references suggest 10 kg S/t grain removal rates, it is less than half this. Therefore, planning S fertilisation for maintenance levels of 4 kg to 5 kg S/t of grain removed might be more suitable as a general rule. If soil levels are adequate, this may be reduced even further.
However, it is important to note that more research is needed to calibrate soil test critical levels to enable greater confidence in soil testing for S in canola.
Canola requires higher inputs per tonne of grain for the major (macro-) nutrients N, P and S compared with other crops (Table 11). However, on a per hectare basis, canola’s nutritional requirements are similar to cereals, because yields are usually about half that of wheat. 39
37 GRDC (2016) Canola nutrition and sulfur. GRDC Tips and Tactics, https://grdc.com.au/Resources/Factsheets/2016/04/Canola-nutrition-and-sulfur
38 GRDC (2016) Canola nutrition and sulfur. GRDC Tips and Tactics, https://grdc.com.au/Resources/Factsheets/2016/04/Canola-nutrition-and-sulfur
39 GRDC (2016) Canola nutrition and sulfur. GRDC Tips and Tactics, https://grdc.com.au/Resources/Factsheets/2016/04/Canola-nutrition-and-sulfur

22NUtrItIoN aND FertIlISer
seCtioN 5 CANOLA
NORTHERNMarch 2017
table 11: Comparison of the average quantity of major nutrients removed (kg/ha) per tonne of grain and stubble for a range of crops, including canola and wheat.
Nitrogen Phosphorus Potassium Sulfur
Grain Stubble Grain Stubble Grain Stubble Grain Stubble
Canola 40 10 7 2 9 26 3.5–5 3.2
Wheat 21 8 3 0.7 5 21 1.5 1.5
Barley 20 7 2.5 0.7 4.5 18 1.5 1.5
Oats 20 7 2.5 0.6 4.5 18 2 1
Lupins 51 10 4.5 0.4 9 16 3 2.5Source: Canola best practice management guide for south-eastern Australia
See the GRDC Tips and Tactics fact sheet Canola nutrition and sulfur for FAQs.
Key points• Five years of trials by GOA failed to demonstrate a consistent response to
the addition of S for yield or oil content. Numerous recent trials by other organisations have also failed to demonstrate responses to S in canola.
• Sulfur deficiency occurs in canola and can be quite severe, but the frequency of such deficiency is most likely lower than thought and it can be rectified early in the crop without ongoing penalty.
• Unwarranted applications of 20 kg S/ha are reducing the profitability of some canola crops and rates should be reviewed to maintenance levels of 4 kg S/t grain removed. If soil levels are adequate, this may be reduced even further.
• Canola is more frequently responsive to N applications and at least some expenditure on fertiliser may be better redirected from S to N applications.
• Soil-test critical levels for S are uncalibrated, are most likely too high, and should be reviewed. 40
Reducing rates of sulfur fertiliserWhen considering fertilising canola, its requirement for S distinguishes it from most other field crops. As such, S is often the first nutrient addressed after starter P fertiliser applications in fertiliser programs, and the requirement for N then follows.
More than 20 trials run over three seasons, mentioned above, have failed to demonstrate responses to added S in either yield or oil percentage. Average crop removal rates do not support the requirement of 20 kg S/ha universally.
Given this scenario, reducing the current recommended practice (CRP) of 20 kg S/ha to rates that more closely match crop yields and subsequent removal rates would be a more economical approach, whilst being sustainable in the longer term.
However, the lack of response to S in recent trials raises the possibility of completely removing intended S applications, as it is done in wheat. Because there is often no yield or oil percentage response, profitability in the short term will only decline with any additions of S.
If growers are to take this approach, soil tests may be still useful to predict potential responsiveness when using removal rates. If soil levels and subsequent calculations of soil-available S outstrip the predicted conservative crop requirements of 4–5 kg S/t crop potential, the likelihood of crop responses or a deficient situation developing is low.
In situations where no S is applied, growers do risk deficiencies developing despite prediction to the contrary. The frequency of such a deficiency based on recent trial work is low but not zero. If deficiency is identified prior to stem elongation and S
40 M Street (2014) Review of sulfur strategy to improve profitability in canola in the central west of NSW. GRDC Update Papers, 18 February 2014, http://grdc.com.au/Research-and-Development/GRDC-Update-Papers/2014/02/Review-of-sulfur-strategy

23NUtrItIoN aND FertIlISer
seCtioN 5 CANOLA
NORTHERNMarch 2017
is applied, research by Hocking et al. (1996) has shown that both final yield and oil percentage will not be penalised. 41
5.7.2 Nitrogen versus sulfur canola trialsThe results of more than 30 trials spread over five years in central west NSW have shown a stark difference in canola yield responses to N fertiliser and S. The response to N was significant, compared with negligible responses to S, even in areas where S levels were otherwise low. Experiments included sites as far west as Nyngan, to east around Coolah and centres in between.
Researchers found no evidence of N fertiliser leading to premature haying-off in canola or reduced yields in dry spring years. There appeared to be a close relationship between greater biomass produced from N fertiliser and greater yield, despite the difficult seasonal conditions. Economic N response was also improved by factors such as timely sowing, good weed and disease control, and good subsoil stored moisture at sowing.
Key points• Five years of research in central west NSW noted large and economical canola
responses to 40 to 100 kilograms of N per hectare.• Common dry spring conditions did not result in canola crops burning off with
yield penalties from N fertiliser application.• There was no response to S fertiliser over the five years and more than 30
experiments, despite generally low soil S levels (Figure 12). 42
Figure 12: Canola responds well to nitrogen but new research shows no response to sulfur, even in low sulfur soils. Photo: Bob Freebairn
41 M Street (2014) Review of sulfur strategy to improve profitability in canola in the central west of NSW. GRDC Update Papers, 18 February 2014, http://grdc.com.au/Research-and-Development/GRDC-Update-Papers/2014/02/Review-of-sulfur-strategy
42 B Freebairn (2016) Nitrogen versus sulfur canola trials. GRDC Update Papers 14 July 2016, https://grdc.com.au/Media-Centre/Ground-Cover/Ground-Cover-Issue-123-JulyAugust-2016/Nitrogen-versus-sulfur-canola-trials
24NUtrItIoN aND FertIlISer
seCtioN 5 CANOLA
NORTHERNMarch 2017
IN FOCUS5.7.3 grDc grain orana alliance (goa) researchCanola has been generally accepted as having high requirements for S, much higher than wheat. Sulfur deficiency was first identified in 1988 and 1989, but was only noted as a significant problem in 1990 (Coulton and Sykes 1992). Deficient situations lead to significant yield and oil penalties where it occurred.
In 2010, GOA established four trial sites to investigate the effect of S fertiliser form and timing on canola performance, in particular, on final seed oil percentage. None of the trials demonstrated any response to S fertiliser in terms of yield or oil percentage, regardless of form or timing.
Following this result, GOA questioned why responses were not seen despite prediction that three of the sites would respond. Was it because of changes in our farming systems, a consequence of the trial season being one of the wettest on record, or because our understanding of S nutrition of canola and its occurrence was incorrect?
In 2011 and 2012, GOA established eight and four trials, respectively, to improve our understanding and better identify situations where S deficiency or responses will occur. None of these trials showed any responses to S in yield or oil percentage.
During this period, several other agencies also conducted trials investigating S nutrition in canola. These trials too have failed to realise any responses to S.
The results from these recent trials should challenge our understanding and approach to S nutrition in canola, in particular:• the frequency and likelihood of deficiencies in the Central West of NSW• critical soil test levels• grain removal rates and nutrient budgeting• new approaches to S nutrition in canola. 43
BackgroundUnreliable yields and crop failures of canola in the late 1980s and early 1990s were suspected to be due to S deficiency. Consequently, a series of 14 trials was established in 1992 in collaboration with CSIRO, University of New England, Incitec and NSW Department of Primary Industries (DPI). These trials investigated whether there was an interaction of N and S, and whether higher N rates were exacerbating S deficiency (Sykes 1990).
A report by ACIL Consulting (1998) states that the trials’ responses in 1992–93 were ‘dramatic’, particularly when following pasture. It also states that the trial collaborators reported from the series of trials that ‘applying 20–30 kg/ha is sufficient to achieve maximum yields’ and is ‘the best practice for maximising yield with the least risk versus cost trade off’. Probably, all subsequent recommendations for S application to canola in most industry resources are sourced from this statement.
This recommendation was widely adopted and is still accepted, as quoted in the 2009 Canola best management practice guide for south-eastern Australia:
43 M Street (2014) Review of sulfur strategy to improve profitability in canola in the central west of NSW. GRDC Update Papers, 18 February 2014, http://grdc.com.au/Research-and-Development/GRDC-Update-Papers/2014/02/Review-of-sulfur-strategy
25NUtrItIoN aND FertIlISer
seCtioN 5 CANOLA
NORTHERNMarch 2017
‘All paddocks sown to canola should receive 20 kg/ha of sulfur in the form of available sulfate. On lighter soil with a history of deficiency symptoms, increase rates to 30 kg/ha.’
This practice will be referred to as the CRP. The adoption of this recommendation was rapid; it was estimated that even before the completion of the trials, 90% of canola was receiving the additional levels of S recommended. A key factor supporting this rate of adoption was that the relatively low cost of S fertilisers at the time was outweighed by the risk of penalty in deficient situations (ACIL Consulting 1998).
During the same period in the early 1990s, the KCl-40 soil test for S was introduced and was adopted as a more appropriate test method than the existing MCP (mono-calcium phosphate) method; however, this superiority was demonstrated primarily on pasture sites (ACIL Consulting 1998)
The KCl-40 test was then widely used for estimating soil S levels, particularly for canola. Very little literature was available for NSW until Anderson et al. (2013) reviewed past trial yield performance against soil tests. Presumably, soil critical levels were based upon values extrapolated from critical levels for pasture situations and/or simply on the base blanket recommendations of 20–30 kg S/ha.
Trials conducted by CL Mullen and SJ Druce between 1993 and 1998 demonstrated that responses to S were not common on heavy grey soils of upper central NSW, owing to S contained in the subsoil. Because of this work, S fertiliser is not commonly applied on these soil types, but all other soils in the GOA region commonly still receive the standard 20 kg S/ha.
More recently, research by Khan et al. (2011) has questioned the suitability of gypsum as a source of S for growing of canola compared with sulfate of ammonia (SOA). Gypsum is a commonly used fertiliser in the GOA region, and perhaps this was contributing to lower oil percentages in the region’s crops and/or suppressing yields because of S deficiencies.
This was the basis of four trials run by GOA in 2010 investigating sources of S and timing of applications. None of the trials showed response to S in any form or with any timing despite predictions by soil analysis and experience to the contrary. This work is briefed in Sulfur nutrition in canola—gypsum vs. sulphate of ammonia and application timings (Street 2011).
Following this outcome and other questions raised in above-mentioned paper, GOA continued the research. Trial design was revised to replicate better the earlier trials, with the simple aims of quantifying a response and helping to build on the predictability of response. 44
Recent findingsTables 12–18 summarise the findings from recent trials investigating S responses in canola. 45
GOA trials
2010
Four sites were selected in winter 2010 across the GOA region. Three sites were identified through recent KCl-40 soil tests as being low–moderate in S. The fourth site was deemed adequate in S by way of KCl-40 soil tests.
44 M Street (2014) Review of sulfur strategy to improve profitability in canola in the central west of NSW. GRDC Update Papers, 18 February 2014, http://grdc.com.au/Research-and-Development/GRDC-Update-Papers/2014/02/Review-of-sulfur-strategy
45 M Street (2013) Sulfur strategy to improve profitability in canola in the central west of NSW. GRDC Update Papers, 26 February 2013, http://www.grdc.com.au/Research-and-Development/GRDC-Update-Papers/2013/02/Sulfur-strategy-to-improve-profitability-in-canola-in-the-central-west-of-NSW
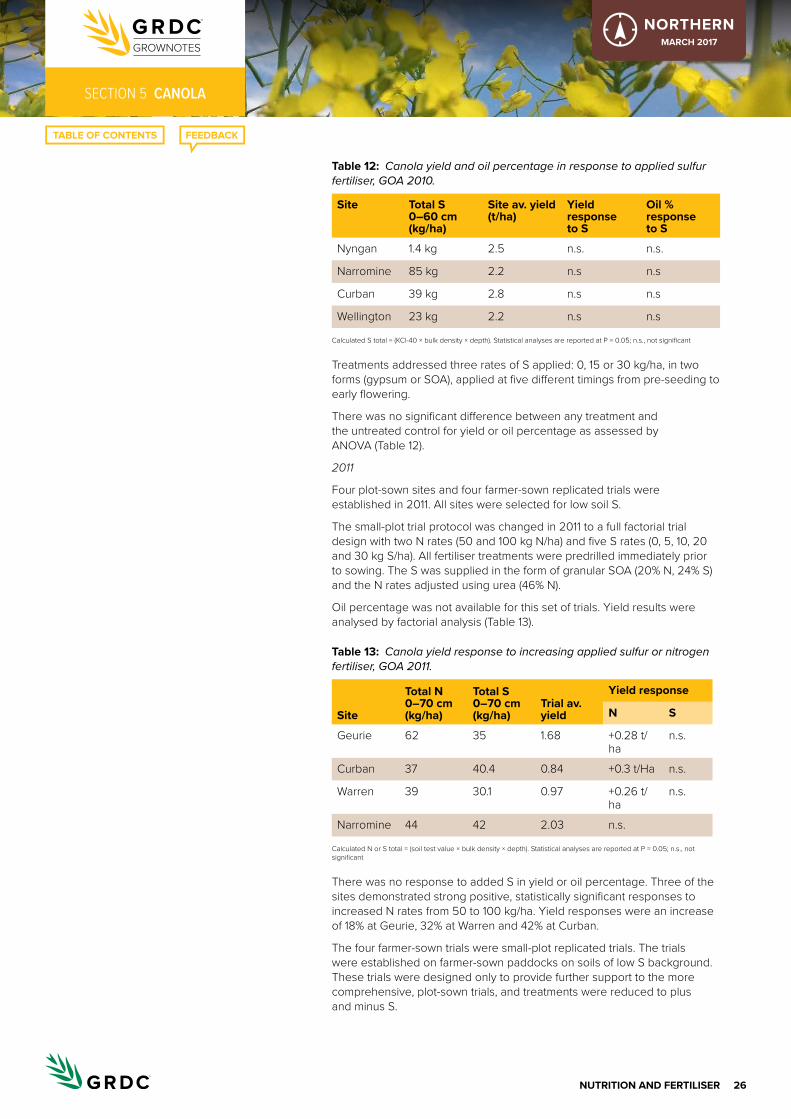
26NUtrItIoN aND FertIlISer
seCtioN 5 CANOLA
NORTHERNMarch 2017
table 12: Canola yield and oil percentage in response to applied sulfur fertiliser, GOA 2010.
Site total S 0–60 cm (kg/ha)
Site av. yield (t/ha)
Yield response to S
oil % response to S
Nyngan 1.4 kg 2.5 n.s. n.s.
Narromine 85 kg 2.2 n.s n.s
Curban 39 kg 2.8 n.s n.s
Wellington 23 kg 2.2 n.s n.s
Calculated S total = (KCl-40 × bulk density × depth). Statistical analyses are reported at P = 0.05; n.s., not significant
Treatments addressed three rates of S applied: 0, 15 or 30 kg/ha, in two forms (gypsum or SOA), applied at five different timings from pre-seeding to early flowering.
There was no significant difference between any treatment and the untreated control for yield or oil percentage as assessed by ANOVA (Table 12).
2011
Four plot-sown sites and four farmer-sown replicated trials were established in 2011. All sites were selected for low soil S.
The small-plot trial protocol was changed in 2011 to a full factorial trial design with two N rates (50 and 100 kg N/ha) and five S rates (0, 5, 10, 20 and 30 kg S/ha). All fertiliser treatments were predrilled immediately prior to sowing. The S was supplied in the form of granular SOA (20% N, 24% S) and the N rates adjusted using urea (46% N).
Oil percentage was not available for this set of trials. Yield results were analysed by factorial analysis (Table 13).
table 13: Canola yield response to increasing applied sulfur or nitrogen fertiliser, GOA 2011.
Site
total N 0–70 cm (kg/ha)
total S 0–70 cm (kg/ha)
trial av. yield
Yield response
N S
Geurie 62 35 1.68 +0.28 t/ha
n.s.
Curban 37 40.4 0.84 +0.3 t/Ha n.s.
Warren 39 30.1 0.97 +0.26 t/ha
n.s.
Narromine 44 42 2.03 n.s.
Calculated N or S total = (soil test value × bulk density × depth). Statistical analyses are reported at P = 0.05; n.s., not significant
There was no response to added S in yield or oil percentage. Three of the sites demonstrated strong positive, statistically significant responses to increased N rates from 50 to 100 kg/ha. Yield responses were an increase of 18% at Geurie, 32% at Warren and 42% at Curban.
The four farmer-sown trials were small-plot replicated trials. The trials were established on farmer-sown paddocks on soils of low S background. These trials were designed only to provide further support to the more comprehensive, plot-sown trials, and treatments were reduced to plus and minus S.
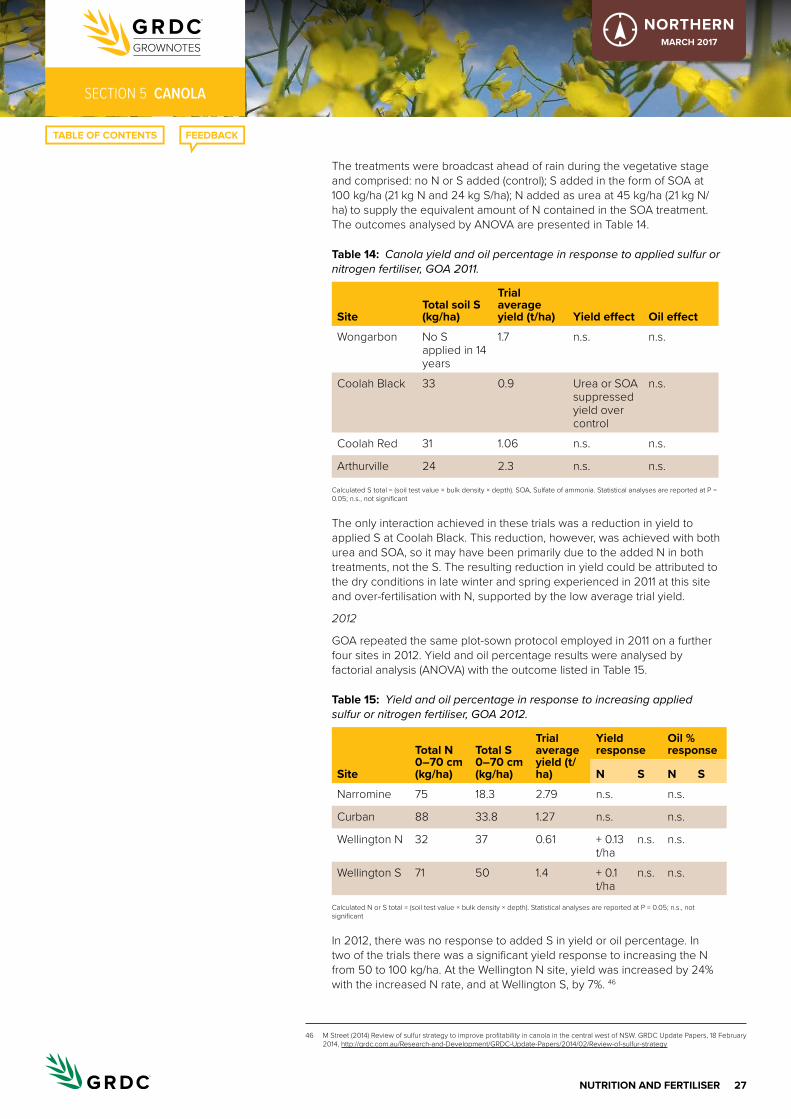
27NUtrItIoN aND FertIlISer
seCtioN 5 CANOLA
NORTHERNMarch 2017
The treatments were broadcast ahead of rain during the vegetative stage and comprised: no N or S added (control); S added in the form of SOA at 100 kg/ha (21 kg N and 24 kg S/ha); N added as urea at 45 kg/ha (21 kg N/ha) to supply the equivalent amount of N contained in the SOA treatment. The outcomes analysed by ANOVA are presented in Table 14.
table 14: Canola yield and oil percentage in response to applied sulfur or nitrogen fertiliser, GOA 2011.
Sitetotal soil S (kg/ha)
trial average yield (t/ha) Yield effect oil effect
Wongarbon No S applied in 14 years
1.7 n.s. n.s.
Coolah Black 33 0.9 Urea or SOA suppressed yield over control
n.s.
Coolah Red 31 1.06 n.s. n.s.
Arthurville 24 2.3 n.s. n.s.
Calculated S total = (soil test value × bulk density × depth). SOA, Sulfate of ammonia. Statistical analyses are reported at P = 0.05; n.s., not significant
The only interaction achieved in these trials was a reduction in yield to applied S at Coolah Black. This reduction, however, was achieved with both urea and SOA, so it may have been primarily due to the added N in both treatments, not the S. The resulting reduction in yield could be attributed to the dry conditions in late winter and spring experienced in 2011 at this site and over-fertilisation with N, supported by the low average trial yield.
2012
GOA repeated the same plot-sown protocol employed in 2011 on a further four sites in 2012. Yield and oil percentage results were analysed by factorial analysis (ANOVA) with the outcome listed in Table 15.
table 15: Yield and oil percentage in response to increasing applied sulfur or nitrogen fertiliser, GOA 2012.
Site
total N 0–70 cm (kg/ha)
total S 0–70 cm (kg/ha)
trial average yield (t/ha)
Yield response
oil % response
N S N S
Narromine 75 18.3 2.79 n.s. n.s.
Curban 88 33.8 1.27 n.s. n.s.
Wellington N 32 37 0.61 + 0.13 t/ha
n.s. n.s.
Wellington S 71 50 1.4 + 0.1 t/ha
n.s. n.s.
Calculated N or S total = (soil test value × bulk density × depth). Statistical analyses are reported at P = 0.05; n.s., not significant
In 2012, there was no response to added S in yield or oil percentage. In two of the trials there was a significant yield response to increasing the N from 50 to 100 kg/ha. At the Wellington N site, yield was increased by 24% with the increased N rate, and at Wellington S, by 7%. 46
46 M Street (2014) Review of sulfur strategy to improve profitability in canola in the central west of NSW. GRDC Update Papers, 18 February 2014, http://grdc.com.au/Research-and-Development/GRDC-Update-Papers/2014/02/Review-of-sulfur-strategy
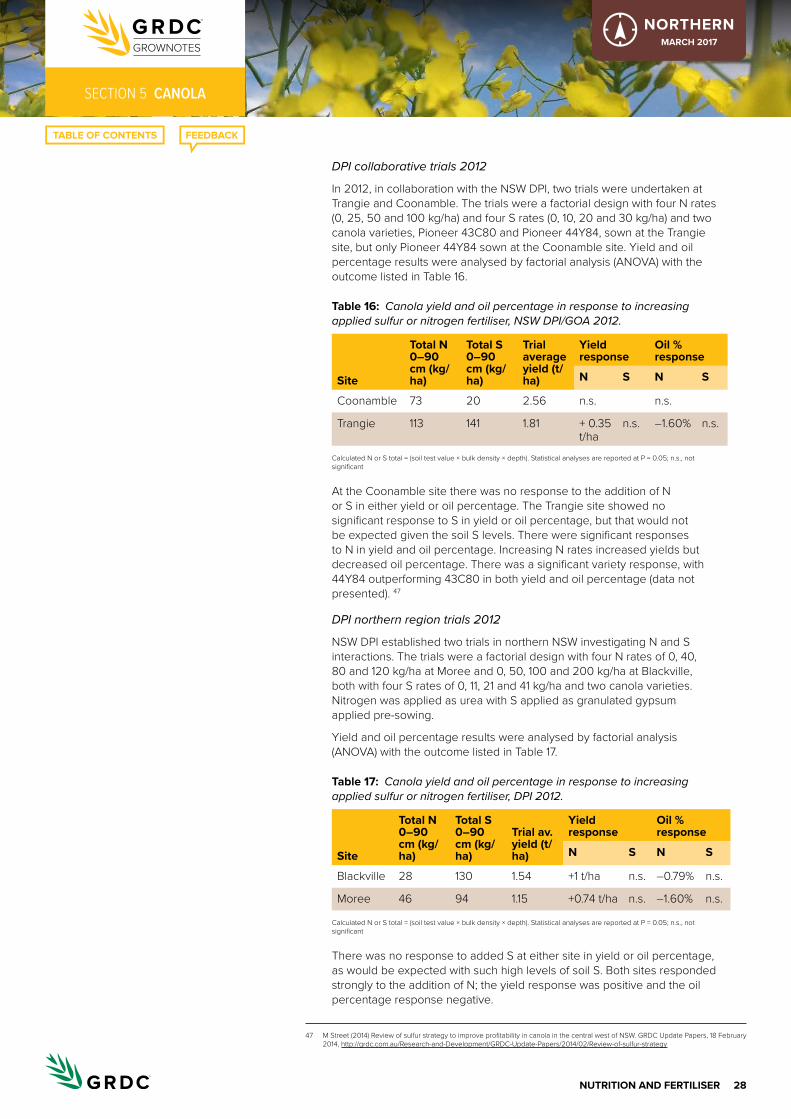
28NUtrItIoN aND FertIlISer
seCtioN 5 CANOLA
NORTHERNMarch 2017
DPI collaborative trials 2012
In 2012, in collaboration with the NSW DPI, two trials were undertaken at Trangie and Coonamble. The trials were a factorial design with four N rates (0, 25, 50 and 100 kg/ha) and four S rates (0, 10, 20 and 30 kg/ha) and two canola varieties, Pioneer 43C80 and Pioneer 44Y84, sown at the Trangie site, but only Pioneer 44Y84 sown at the Coonamble site. Yield and oil percentage results were analysed by factorial analysis (ANOVA) with the outcome listed in Table 16.
table 16: Canola yield and oil percentage in response to increasing applied sulfur or nitrogen fertiliser, NSW DPI/GOA 2012.
Site
total N 0–90 cm (kg/ha)
total S 0–90 cm (kg/ha)
trial average yield (t/ha)
Yield response
oil % response
N S N S
Coonamble 73 20 2.56 n.s. n.s.
Trangie 113 141 1.81 + 0.35 t/ha
n.s. –1.60% n.s.
Calculated N or S total = (soil test value × bulk density × depth). Statistical analyses are reported at P = 0.05; n.s., not significant
At the Coonamble site there was no response to the addition of N or S in either yield or oil percentage. The Trangie site showed no significant response to S in yield or oil percentage, but that would not be expected given the soil S levels. There were significant responses to N in yield and oil percentage. Increasing N rates increased yields but decreased oil percentage. There was a significant variety response, with 44Y84 outperforming 43C80 in both yield and oil percentage (data not presented). 47
DPI northern region trials 2012
NSW DPI established two trials in northern NSW investigating N and S interactions. The trials were a factorial design with four N rates of 0, 40, 80 and 120 kg/ha at Moree and 0, 50, 100 and 200 kg/ha at Blackville, both with four S rates of 0, 11, 21 and 41 kg/ha and two canola varieties. Nitrogen was applied as urea with S applied as granulated gypsum applied pre-sowing.
Yield and oil percentage results were analysed by factorial analysis (ANOVA) with the outcome listed in Table 17.
table 17: Canola yield and oil percentage in response to increasing applied sulfur or nitrogen fertiliser, DPI 2012.
Site
total N 0–90 cm (kg/ha)
total S 0–90 cm (kg/ha)
trial av. yield (t/ha)
Yield response
oil % response
N S N S
Blackville 28 130 1.54 +1 t/ha n.s. –0.79% n.s.
Moree 46 94 1.15 +0.74 t/ha n.s. –1.60% n.s.
Calculated N or S total = (soil test value × bulk density × depth). Statistical analyses are reported at P = 0.05; n.s., not significant
There was no response to added S at either site in yield or oil percentage, as would be expected with such high levels of soil S. Both sites responded strongly to the addition of N; the yield response was positive and the oil percentage response negative.
47 M Street (2014) Review of sulfur strategy to improve profitability in canola in the central west of NSW. GRDC Update Papers, 18 February 2014, http://grdc.com.au/Research-and-Development/GRDC-Update-Papers/2014/02/Review-of-sulfur-strategy
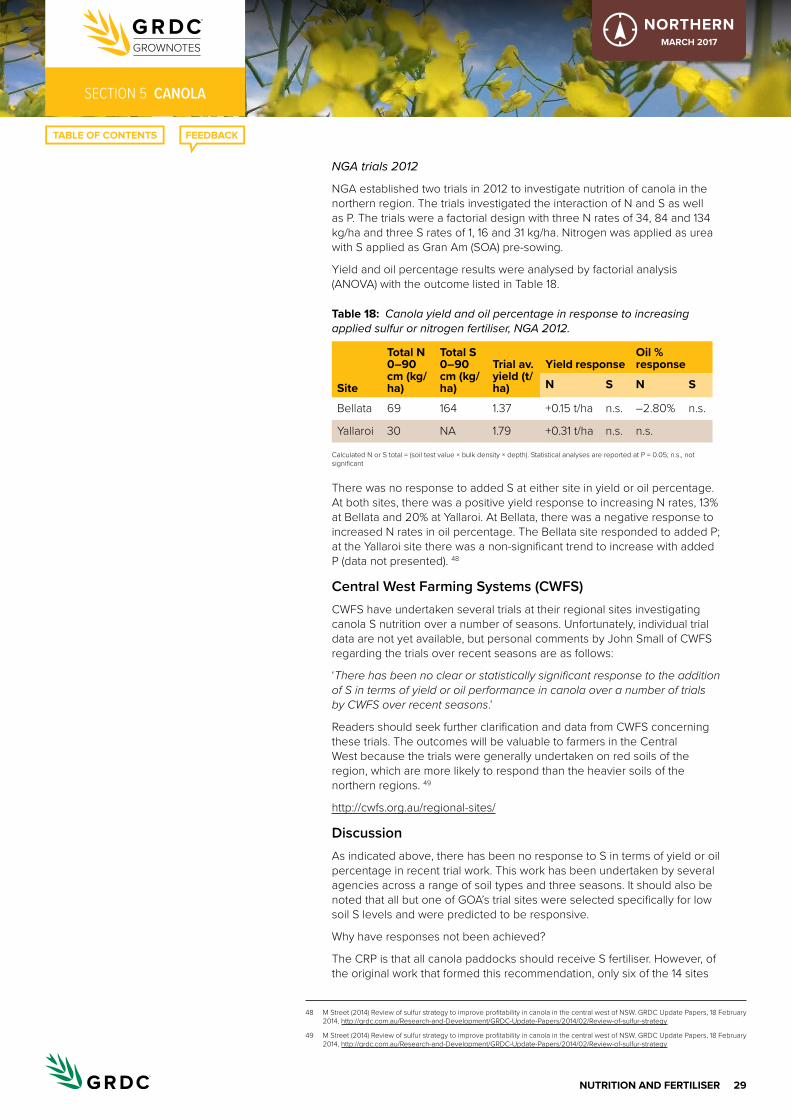
29NUtrItIoN aND FertIlISer
seCtioN 5 CANOLA
NORTHERNMarch 2017
NGA trials 2012
NGA established two trials in 2012 to investigate nutrition of canola in the northern region. The trials investigated the interaction of N and S as well as P. The trials were a factorial design with three N rates of 34, 84 and 134 kg/ha and three S rates of 1, 16 and 31 kg/ha. Nitrogen was applied as urea with S applied as Gran Am (SOA) pre-sowing.
Yield and oil percentage results were analysed by factorial analysis (ANOVA) with the outcome listed in Table 18.
table 18: Canola yield and oil percentage in response to increasing applied sulfur or nitrogen fertiliser, NGA 2012.
Site
total N 0–90 cm (kg/ha)
total S 0–90 cm (kg/ha)
trial av. yield (t/ha)
Yield responseoil % response
N S N S
Bellata 69 164 1.37 +0.15 t/ha n.s. –2.80% n.s.
Yallaroi 30 NA 1.79 +0.31 t/ha n.s. n.s.
Calculated N or S total = (soil test value × bulk density × depth). Statistical analyses are reported at P = 0.05; n.s., not significant
There was no response to added S at either site in yield or oil percentage. At both sites, there was a positive yield response to increasing N rates, 13% at Bellata and 20% at Yallaroi. At Bellata, there was a negative response to increased N rates in oil percentage. The Bellata site responded to added P; at the Yallaroi site there was a non-significant trend to increase with added P (data not presented). 48
Central West Farming Systems (CWFS)CWFS have undertaken several trials at their regional sites investigating canola S nutrition over a number of seasons. Unfortunately, individual trial data are not yet available, but personal comments by John Small of CWFS regarding the trials over recent seasons are as follows:
‘There has been no clear or statistically significant response to the addition of S in terms of yield or oil performance in canola over a number of trials by CWFS over recent seasons.’
Readers should seek further clarification and data from CWFS concerning these trials. The outcomes will be valuable to farmers in the Central West because the trials were generally undertaken on red soils of the region, which are more likely to respond than the heavier soils of the northern regions. 49
http://cwfs.org.au/regional-sites/
DiscussionAs indicated above, there has been no response to S in terms of yield or oil percentage in recent trial work. This work has been undertaken by several agencies across a range of soil types and three seasons. It should also be noted that all but one of GOA’s trial sites were selected specifically for low soil S levels and were predicted to be responsive.
Why have responses not been achieved?
The CRP is that all canola paddocks should receive S fertiliser. However, of the original work that formed this recommendation, only six of the 14 sites
48 M Street (2014) Review of sulfur strategy to improve profitability in canola in the central west of NSW. GRDC Update Papers, 18 February 2014, http://grdc.com.au/Research-and-Development/GRDC-Update-Papers/2014/02/Review-of-sulfur-strategy
49 M Street (2014) Review of sulfur strategy to improve profitability in canola in the central west of NSW. GRDC Update Papers, 18 February 2014, http://grdc.com.au/Research-and-Development/GRDC-Update-Papers/2014/02/Review-of-sulfur-strategy
30NUtrItIoN aND FertIlISer
seCtioN 5 CANOLA
NORTHERNMarch 2017
showed a yield response to S and only three an oil percentage response (Sykes 1990). Many of these sites did not respond despite prediction by soil tests.
The most commonly reported trial was at the Wellington site, where yields increased from 1 to 4 t/ha with the addition of S. At this site, 75% of the site maximum yield was achieved at an application rate of 10 kg S/ha, and 92% at 20 kg S/ha. A similar result was demonstrated at Baradine, but these could be described as the two most severe documented cases of S deficiency.
Many of the other responsive sites did not realise such a magnitude of improvement. At the Gollan site at the rate of 40 kg N/ha, increasing S from 0 to 20 kg/ha increased yields by only 590 kg. At 80 kg N/ha, there was a 325 kg/ha improvement by increasing the S rate from 0 to 20 kg/ha. At the Junee Reefs and Tamworth sites, a maximum response was achieved of ~400 kg/ha. These would still be worthy and economic responses at today’s fertiliser prices, but the penalties are nowhere near the extent often promoted.
The ACIL Consulting (1998) report also mentions other previous work from 1990, commenting, ‘A major field study of canola in NSW reported significant grain yield increases from the addition of N but no significant responses to S (Sykes and Coulton, 1990)’.
The more recent work detailed above shows no response to the addition of S over 3 years and in a range of soils predicted to respond.
In summary, the frequency of response to added S is quite low; considering the trials detailed above, <14% of trial sites were responsive (excluding the field study of 1990 and those of CWFS).
Industry-accepted grain-removal rates used in nutrient budgets may also lend support to the CRP. Current industry references suggest that removal rates are 10 kg S/t grain and that crop requirements of canola are much higher than of wheat (Coulton et al. 1992).
Analysis of grain samples from the GOA and NGA trial work has shown that grain removal is much lower than these levels. Janzen and Bettany (1994), Pinkerton et al. (1993) and Hocking et al. (1996) all measured grain S contents in their range of experiments. Grain S levels no greater than ~0.5% or 5 kg S/t grain were measured, even in treatments with adequate S. In many cases, the S levels were even lower, resulting in them being less than half of the industry benchmarks.
When considering this information for formulating crop requirements and fertiliser programs, there may be little difference in requirements between wheat and canola. For example, an average wheat yield for the GOA region may be 3 t/ha, removing ~1.8 kg S/t or 5.4 kg S/ha. Canola generally performs at 50% of comparable wheat yields, so 1.5 t/ha removing 3.6 kg S/t (critical threshold, Hocking et al. 1996) will remove only 5.4 kg S/ha, or similar amounts to the wheat crop.
So, as a possible explanation of the lack of responsiveness in all of these trials, the sites were simply predicted to respond when in fact that was not likely; there was adequate S contained in the soil profile and subsequent mineralisation to satisfy crop demands, a demand much lower than previously understood.
For example, using the highest achieved yield in the GOA trials of ~ 2.8 t/ha, the crop removal rate would be 9.8 kg/ha. If we assumed an arbitrary uptake or transfer efficiency of 50%, the crop would have a growing requirement of only 20 kg/ha. All of the sites detailed in this paper would have satisfied this requirement with starting soil levels and only a minimal amount of mineralisation; no additional fertiliser would be required.

31NUtrItIoN aND FertIlISer
seCtioN 5 CANOLA
NORTHERNMarch 2017
So, what is the critical soil level to indicate when S addition may be required? To supply this requirement of 20 kg S/ha, a soil KCl-40 test would have a critical level of ~2.3 mg/kg averaged in the top 60 cm of soil. If this were indeed the soil critical level, few cropping soils would be lower. 50
Re-focus investment on nitrogen instead of sulfurBy contrast, the majority of all trials have demonstrated response to N. Twelve of the 14 trials undertaken in 1992 resulted in significant and economic responses, with an average increase in response to 80 kg N/ha of 600 kg/ha (Sykes 1990). Of the two trials that did not show a response, one was following 5 years of grass-free legume-based pasture, and the other was compromised by frost, resulting in a high coefficient of variation.
Three of four GOA trials in 2011 responded significantly to increasing N application from 50 to 100 kg/ha. The average yield increase over the three sites was 280 kg/ha, returning around 200% on investment. Two of GOA’s trials in 2012 also returned a significant yield response to increasing N. Returns were much lower with the dry spring conditions, with the yield increases only breaking even after additional costs.
Trials by NGA in 2012 demonstrated a 13% yield increase or ~150 kg/ha (break-even) by increasing N from 34 to 84 kg/ha in one trial. The second site saw an increase yield of 20% or ~310 kg/ha, resulting in approximately a 200% return on investment.
It should be noted that the GOA and NGA trials did not have nil N treatments, but they were all clearly N-responsive sites.
In the NSW DPI–GOA trials in 2012, treatments of nil N were included, and this allows a response curve to be generated. The Trangie site showed strong responses to N, with yield increasing by 0.35 t/ha or 21% by increasing N from 0 to 100 kg/ha. The economics of such applications are demonstrated in Figure 13.
Figure 13:
0
200
400
600
800
1000
1200 200%
160%
120%
80%
40%
0%N-0 N-25 N-50 N-100
Gro
ss in
com
e $
RO
I
c bc b a
Canola yield performance in relation to applied nitrogen rate and the corresponding return on investment (ROI), Trangie. Columns headed by the same letter are not significantly different. Source: NSW DPI–GOA 2012
Although the starting soil N at this site was high at 113 kg/ha, yield and resultant gross income increased almost in a linear response, and the treatments have not demonstrated a clear upper limit. The responsiveness of canola to high rates of N is reinforced at three other sites detailed in Figure 14; again there was no clear indication of a yield plateau even up to 200 kg N/ha.
50 M Street (2014) Review of sulfur strategy to improve profitability in canola in the central west of NSW. GRDC Update Papers, 18 February 2014, http://grdc.com.au/Research-and-Development/GRDC-Update-Papers/2014/02/Review-of-sulfur-strategy
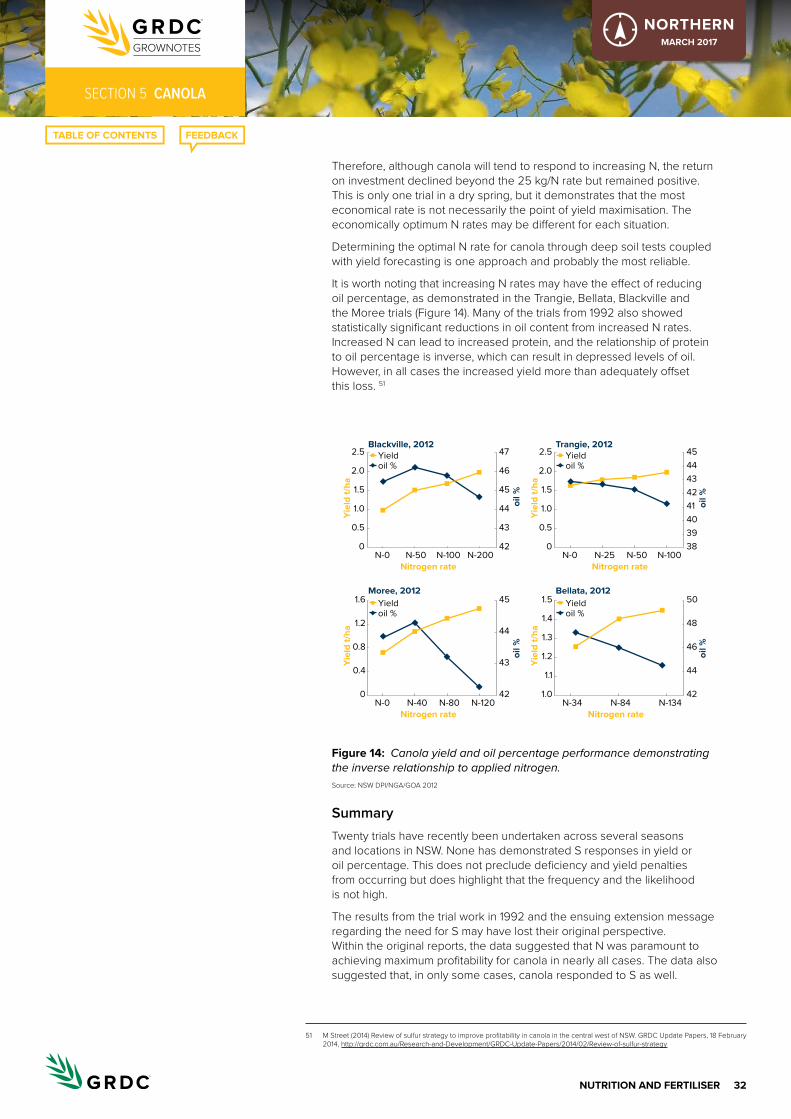
32NUtrItIoN aND FertIlISer
seCtioN 5 CANOLA
NORTHERNMarch 2017
Therefore, although canola will tend to respond to increasing N, the return on investment declined beyond the 25 kg/N rate but remained positive. This is only one trial in a dry spring, but it demonstrates that the most economical rate is not necessarily the point of yield maximisation. The economically optimum N rates may be different for each situation.
Determining the optimal N rate for canola through deep soil tests coupled with yield forecasting is one approach and probably the most reliable.
It is worth noting that increasing N rates may have the effect of reducing oil percentage, as demonstrated in the Trangie, Bellata, Blackville and the Moree trials (Figure 14). Many of the trials from 1992 also showed statistically significant reductions in oil content from increased N rates. Increased N can lead to increased protein, and the relationship of protein to oil percentage is inverse, which can result in depressed levels of oil. However, in all cases the increased yield more than adequately offset this loss. 51
Figure 14:
2.5
2.0
1.5
1.0
0.5
0
47
46
45
44
43
42N-0 N-50 N-100 N-200
Nitrogen rate
Yie
ld t/
ha
Blackville, 2012Yieldoil %
oil %
2.5
2.0
1.5
1.0
0.5
0
4544434241
383940
N-0 N-25 N-50 N-100Nitrogen rate
Yie
ld t/
ha
Trangie, 2012Yieldoil %
oil %
1.6
1.2
0.8
0.4
0
45
44
43
42N-0 N-40 N-80 N-120
Nitrogen rate
Yie
ld t/
ha
Moree, 2012Yieldoil %
oil %
1.5
1.4
1.3
1.2
1.1
1.0
50
48
46
44
42N-34 N-84 N-134
Nitrogen rate
Yie
ld t/
ha
Bellata, 2012Yieldoil %
oil %
Canola yield and oil percentage performance demonstrating the inverse relationship to applied nitrogen. Source: NSW DPI/NGA/GOA 2012
SummaryTwenty trials have recently been undertaken across several seasons and locations in NSW. None has demonstrated S responses in yield or oil percentage. This does not preclude deficiency and yield penalties from occurring but does highlight that the frequency and the likelihood is not high.
The results from the trial work in 1992 and the ensuing extension message regarding the need for S may have lost their original perspective. Within the original reports, the data suggested that N was paramount to achieving maximum profitability for canola in nearly all cases. The data also suggested that, in only some cases, canola responded to S as well.
51 M Street (2014) Review of sulfur strategy to improve profitability in canola in the central west of NSW. GRDC Update Papers, 18 February 2014, http://grdc.com.au/Research-and-Development/GRDC-Update-Papers/2014/02/Review-of-sulfur-strategy
33NUtrItIoN aND FertIlISer
seCtioN 5 CANOLA
NORTHERNMarch 2017
The one extension message that persisted was that all canola crops needed 20 kg S/ha, and sometimes more. The then lower cost of S fertiliser and the significant penalties seen in deficient situations meant that this recommendation was adopted rapidly, needed or not. Declining terms of trade over the last 20 years do not allow for such a potentially wasteful approach.
Through the efforts of GOA, several shortcomings in the understanding of canola agronomy have been highlighted. Removal rates are over-estimated and the lack of calibrated soil critical levels is a major problem. Rectification in both of these areas may improve the predictability of S responsiveness.
With the reduced frequency of response and considering the reviewed S demand of canola, the CRP may need revision to match more closely the S removal rates. This will result in increased profitability and sustainability for growers.
Removal of S from fertiliser programs may be risky but will prove most profitable in many cases. However, wheat, which has a similar S requirement per hectare and is predominantly fertilised with mono- or di-ammonium phosphate (containing only minimal S), is not noted to suffer yield impacts through S deficiencies. It should also be remembered that deficient situations are easily corrected by in-crop applications.
There is a strong case for the savings in expenditure on S to be redirected to N, where a response is much more common. However, the optimal rate of N may need to be revisited or targeted through soil tests and nutrient budgets to ensure that return on investment is also maximised, not simply the yield. 52
WATCH: Interview with grower Tom Quigley, Trangie NSW.
5.8 Potassium
An adequate supply of potassium (K) is important to provide plants with increased resistance to disease, frost and drought, as well as increased carbohydrate production. Canola crops take up large amounts of K during growth but most of it remains in the stubble, with only a small proportion removed in the grain.
Although soil tests, especially the balance of exchangeable cations, can provide a guide to the K level, tissue tests are the most reliable method to determine whether
52 M Street (2013) Sulfur strategy to improve profitability in canola in the central west of NSW. GRDC Update Papers, 26 February 2013, http://www.grdc.com.au/Research-and-Development/GRDC-Update-Papers/2013/02/Sulfur-strategy-to-improve-profitability-in-canola-in-the-central-west-of-NSW
i MORE INFORMATION
Canola research insight for trangie farmer
Review of sulfur strategy
sulfur strategy to improve profitability in-canola in the Central West of NsW
sulfur nutrition in canola—gypsum vs sulphate of ammonia and application timing
sulfur in northern Vertosols
34NUtrItIoN aND FertIlISer
seCtioN 5 CANOLA
NORTHERNMarch 2017
K fertiliser is needed. Avoid sowing potassium fertiliser with the seed; it could affect germination. 53
5.9 Micronutrients
5.9.1 ZincAlthough canola is a non-mycorrhizal crop, it requires zinc (Zn) on alkaline soils. The precise level of response in northern NSW is not known, but in the absence of better information, use wheat guidelines.
Zinc is best applied to the soil and thoroughly incorporated, but if this is not possible, apply it with starter fertiliser and place 2.5 cm beside and below the seed at planting. Zinc is highly competiative with soil moisture and the seed at planting so should not be added in the seed line.
Foliar spraying of zinc sulfate heptahydrate at 1 kg/ha plus wetting agent is an alternative application method if sprayed twice to deficient crops at 3 and 5 weeks after emergence. Zinc sulfate is incompatible with most herbicides and insecticides. Zinc seed treatments are not normally applied to canola, because insufficient Zn will be applied with the low seeding rate used. 54
Deficiency symptomsZinc deficiency appears in crops as poor plant vigour, with areas of poorer growth alongside healthy, apparently normal plants, giving the crop a patchy appearance (Figure 15). Although there are few reports of Zn deficiency in canola, growers should be cautious. Zinc is routinely applied to the clay soils of northern NSW.
Zinc deficiencies can occur in the following situations:• in strongly alkaline soils, pHCa >7.0• with high P levels• after long periods of fallow• following land-forming where alkaline subsoil is exposed.
Other major and trace elements apart from Zn may also need special consideration in land-formed paddocks. 55
Fertiliser strategiesWhere responses to Zn are known to occur, incorporate Zn into the soil before sowing canola. In northern NSW and irrigation areas, broadcast rates of 10–20 kg Zn/ha are common where summer crops such as maize and sorghum are also grown. These rates supply enough Zn for ≥5 years.
On alkaline soils in south-western NSW, Zn is applied at 2–3 kg/ha every 3–5 years, usually as Zn-supplemented fertiliser at sowing.
Zinc oxide is the cheapest and most concentrated form of Zn and it is usually broadcast with fertiliser to ensure an even application. However, it is not water-soluble and is not an effective means of adding Zn if a quick response is required. When coated onto fertiliser, zinc oxide can flake off, resulting in problems with distribution. Foliar sprays are a short-term correction only and need to be applied before symptoms are obvious, soon after crop emergence or if Zn deficiency has been identified through tissue analysis. 56
53 P Parker (2009) Nutrition and soil fertility. Ch. 7. In Canola best practice management guide for south-eastern Australia. (Eds D McCaffrey, T Potter, S Marcroft, F Pritchard) GRDC, http://www.grdc.com.au/uploads/documents/GRDC_Canola_Guide_All_1308091.pdf
54 L Serafin, J Holland, R Bambach, D McCaffery (2009) Canola: northern NSW planting guide. NSW Department of Primary Industries, http://www.dpi.nsw.gov.au/__data/assets/pdf_file/0016/148300/canola-northern-NSW-planting-guide.pdf
55 P Parker (2009) Nutrition and soil fertility. Ch. 7. In Canola best practice management guide for south-eastern Australia. (Eds D McCaffrey, T Potter, S Marcroft, F Pritchard) GRDC, http://www.grdc.com.au/uploads/documents/GRDC_Canola_Guide_All_1308091.pdf
56 P Parker (2009) Nutrition and soil fertility. Ch. 7. In Canola best practice management guide for south-eastern Australia. (Eds D McCaffrey, T Potter, S Marcroft, F Pritchard) GRDC, http://www.grdc.com.au/uploads/documents/GRDC_Canola_Guide_All_1308091.pdf
i MORE INFORMATION
Do we need to revisit potassium
economics and management of P nutrition and multiple nutrient decline

35NUtrItIoN aND FertIlISer
seCtioN 5 CANOLA
NORTHERNMarch 2017
Figure 15: Zinc deficiency appears as bronzing on the upper leaf surface and may occur in neutral to alkaline soils. Photo: B. Holloway, SARDI
5.9.2 MolybdenumRole and deficiency symptomsMolybdenum (Mo) is important in enabling plants to convert nitrates from the soil into a usable form within the plant. Deficiency is more common when soil acidity falls (pHCa <5.5) but is difficult to diagnose other than by a tissue test. Deficiency can be avoided by applying Mo at a rate of 50 g/ha every 5 years. The most common practice is the application of 150 g/ha of the soluble form sodium molybdate (39% Mo) sprayed onto the soil surface. Molybdenum is compatible with pre-emergent herbicides and can be thoroughly incorporated into the soil before sowing. 57
Fertiliser requirementsAlthough fertilisers containing Mo can be used at sowing, the concentration of Mo they contain is less than recommended and they are more expensive than using sodium molybdate.
Molybdenum-treated single superphosphate applied during the pasture phase is cost-effective and it should supply enough Mo for the canola crop. 58
5.9.3 MagnesiumIn recent years, magnesium (Mg) deficiency has been reported in a number of seedling crops. As the crop grows and develops a deeper root system, the deficiency symptoms disappear because most soils have adequate Mg deeper in the profile. Low surface levels of Mg are probably due to low levels of sulfonylurea herbicide residues and the harvesting of subterranean clover hay, where large quantities of Mg are exported from the paddock.
Lime–dolomite blends can be used when liming acid soils if there is a history of deficiency symptoms, and other dry and foliar applied fertilisers are available. 59
57 P Parker (2009) Nutrition and soil fertility. Ch. 7. In Canola best practice management guide for south-eastern Australia. (Eds D McCaffrey, T Potter, S Marcroft, F Pritchard) GRDC, http://www.grdc.com.au/uploads/documents/GRDC_Canola_Guide_All_1308091.pdf
58 P Parker (2009) Nutrition and soil fertility. Ch. 7. In Canola best practice management guide for south-eastern Australia. (Eds D McCaffrey, T Potter, S Marcroft, F Pritchard) GRDC, http://www.grdc.com.au/uploads/documents/GRDC_Canola_Guide_All_1308091.pdf
59 P Parker (2009) Nutrition and soil fertility. Ch. 7. In Canola best practice management guide for south-eastern Australia. (Eds D McCaffrey, T Potter, S Marcroft, F Pritchard) GRDC, http://www.grdc.com.au/uploads/documents/GRDC_Canola_Guide_All_1308091.pdf
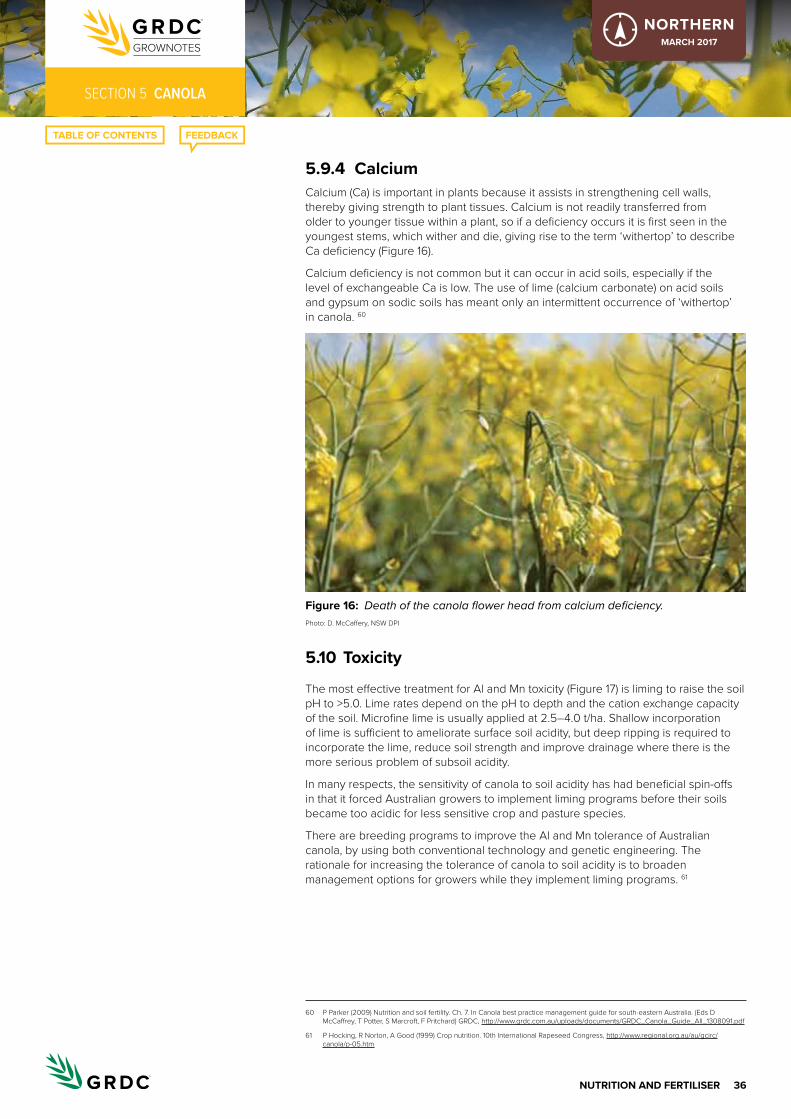
36NUtrItIoN aND FertIlISer
seCtioN 5 CANOLA
NORTHERNMarch 2017
5.9.4 calciumCalcium (Ca) is important in plants because it assists in strengthening cell walls, thereby giving strength to plant tissues. Calcium is not readily transferred from older to younger tissue within a plant, so if a deficiency occurs it is first seen in the youngest stems, which wither and die, giving rise to the term ‘withertop’ to describe Ca deficiency (Figure 16).
Calcium deficiency is not common but it can occur in acid soils, especially if the level of exchangeable Ca is low. The use of lime (calcium carbonate) on acid soils and gypsum on sodic soils has meant only an intermittent occurrence of ‘withertop’ in canola. 60
Figure 16: Death of the canola flower head from calcium deficiency. Photo: D. McCaffery, NSW DPI
5.10 toxicity
The most effective treatment for Al and Mn toxicity (Figure 17) is liming to raise the soil pH to >5.0. Lime rates depend on the pH to depth and the cation exchange capacity of the soil. Microfine lime is usually applied at 2.5–4.0 t/ha. Shallow incorporation of lime is sufficient to ameliorate surface soil acidity, but deep ripping is required to incorporate the lime, reduce soil strength and improve drainage where there is the more serious problem of subsoil acidity.
In many respects, the sensitivity of canola to soil acidity has had beneficial spin-offs in that it forced Australian growers to implement liming programs before their soils became too acidic for less sensitive crop and pasture species.
There are breeding programs to improve the Al and Mn tolerance of Australian canola, by using both conventional technology and genetic engineering. The rationale for increasing the tolerance of canola to soil acidity is to broaden management options for growers while they implement liming programs. 61
60 P Parker (2009) Nutrition and soil fertility. Ch. 7. In Canola best practice management guide for south-eastern Australia. (Eds D McCaffrey, T Potter, S Marcroft, F Pritchard) GRDC, http://www.grdc.com.au/uploads/documents/GRDC_Canola_Guide_All_1308091.pdf
61 P Hocking, R Norton, A Good (1999) Crop nutrition. 10th International Rapeseed Congress, http://www.regional.org.au/au/gcirc/canola/p-05.htm
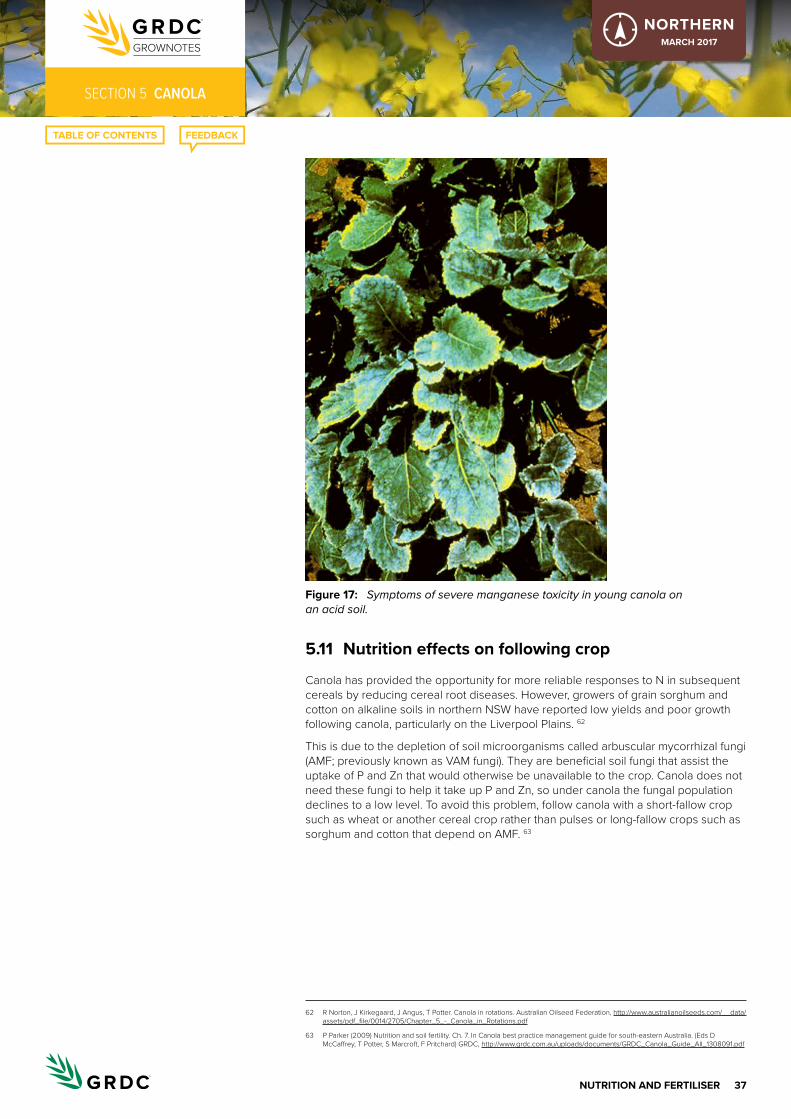
37NUtrItIoN aND FertIlISer
seCtioN 5 CANOLA
NORTHERNMarch 2017
Figure 17: Symptoms of severe manganese toxicity in young canola on an acid soil.
5.11 Nutrition effects on following crop
Canola has provided the opportunity for more reliable responses to N in subsequent cereals by reducing cereal root diseases. However, growers of grain sorghum and cotton on alkaline soils in northern NSW have reported low yields and poor growth following canola, particularly on the Liverpool Plains. 62
This is due to the depletion of soil microorganisms called arbuscular mycorrhizal fungi (AMF; previously known as VAM fungi). They are beneficial soil fungi that assist the uptake of P and Zn that would otherwise be unavailable to the crop. Canola does not need these fungi to help it take up P and Zn, so under canola the fungal population declines to a low level. To avoid this problem, follow canola with a short-fallow crop such as wheat or another cereal crop rather than pulses or long-fallow crops such as sorghum and cotton that depend on AMF. 63
62 R Norton, J Kirkegaard, J Angus, T Potter. Canola in rotations. Australian Oilseed Federation, http://www.australianoilseeds.com/__data/assets/pdf_file/0014/2705/Chapter_5_-_Canola_in_Rotations.pdf
63 P Parker (2009) Nutrition and soil fertility. Ch. 7. In Canola best practice management guide for south-eastern Australia. (Eds D McCaffrey, T Potter, S Marcroft, F Pritchard) GRDC, http://www.grdc.com.au/uploads/documents/GRDC_Canola_Guide_All_1308091.pdf
1WeeD coNtrol
seCtioN 6 CANOLA
NORTHERNMarch 2017
Weed control6.1 general weed management
Weed management is strongly influenced by crop rotation sequence. Careful planning of a five year rotation will enable targeted weed control through both cultural and chemical methods as well as the ability to plan herbicide rotations. The widespread occurrence of herbicide resistance in Australian weeds puts further emphasis on the need for careful planning and resistance management strategies such as monitoring, herbicide MOA rotation and cultural management techniques.
The area sown to herbicide tolerant varieties of canola has increased dramatically in recent years, however widespread use of these varieties without integrated weed management techniques is likely to accelerate the development of resistance to the herbicides.
The resistance to several of these herbicides that already occurs in Australian weeds shows that these varieties are not a panacea for herbicide resistance management, but they will add significantly to the options available to farmers in respect to resistance management.
Key points• Choose paddocks relatively free of broadleaf weeds, especially charlock, wild
turnip, wild radish and other weeds of the Brassica family, because in-crop herbicide options are limited. Grass weeds can be controlled in canola by using trifluralin or post-emergent herbicides however Group A resistant grasses are still of concern.
• Herbicide-resistant varieital syystems such as Triazine Tolerant (TT), Clearfields (CF) and Roundup Ready (RR) can be of use in managing weeds in canola, particularly broad leaf weeds however careful management is needed to avoid the buildup of reistant weed populations.
• When choosing paddocks for canola be careful with those treated with residual herbicides, especially Group B and triazine herbicides (for conventional varieties); their residues can affect canola. Check labels for re-cropping intervals, some of which are up to 36 months.
• Ensure that all spray equipment is thoroughly decontaminated before using to spray canola. Apply chlorine if the spraying equipment has previously been used to spray sulfonylureas, ammonia for hormone herbicides (salt and amine formulations) such as 2,4-D amine and MCPA, and liquid alkali detergent for Broadstrike® (flumetsulam) and Eclipse® (metosulam) decontamination. Where possible, use separate spraying equipment for residual herbicides such as the sulfonylureas.
• Imidazolinone-tolerant varieties are marketed as Clearfield® canola. These varieties allow the use of the Group B herbicide Intervix® (imazamox and imazapyr). Clearfield® varieties do not suffer from the yield and oil penalty that the TT varieties exhibit. The use of Clearfield® varieties allows the rotation of herbicide groups and broadens the spectrum of weeds controlled. 1
1 L Serafin, J Holland, R Bambach, D McCaffery (2005) Canola: northern NSW planting guide. NSW Department of Primary Industries, http://www.dpi.nsw.gov.au/__data/assets/pdf_file/0016/148300/canola-northern-NSW-planting-guide.pdf
FAQi MORE INFORMATION
Weed control in winter crops 2016
integrated weed management manual
soil behaviour of pre-emergent herbicides in australian farming systems
What is Roundup Ready® canola? Clearfield stewardship Best Management Practice 2014
herbicide tolerant canola in farming systems: a guide for growers
Ground Cover Radio 118: torch test on tramline weeds

2WeeD coNtrol
seCtioN 6 CANOLA
NORTHERNMarch 2017
6.1.1 Weed spectrum and herbicide resistanceWhile there are inevitably large numbers of weed species that affect canola production, those that feature consistently in Australia are listed in Table 1. Prior to the introduction of herbicide-resistant varieties, control of key broadleaf weeds was the most important constraint to production of canola throughout Australia.
table 1: Common weeds of Australian canola crops.
Weed (common name) Scientific name
Wild radish* (Figure 1) Raphanus raphanistrum
Indian hedge mustard* Sisymbrium orientale
Annual ryegrass Lolium rigidum
Shepherds purse* Capsella bursa-pastoris
Wild turniP Brassica tournefortii
Charlock* Sinapsis arvensis
Patterson's curse* Echium plantagineum
Vulpia* Vulpia spp.
Wireweed Polygonum aviculare
Toad rush Juncus bufonius
Wild oat Avena spp.
Spiny emex Emex australis
Turnip weed* Rapistrum rugosum
Fumitory Fumaria spp.
Buchan weed Hirschfeldia incana
Capeweed Arctotheca calendula
Volunteer cereals* Weeds species that have been particularly important in restricting canola production prior to the introduction of TT varieties.
The degree to which such weeds have restricted the canola area is reflected in the rapid adoption of the triazine tolerant (TT) varieties across Australia. 2
2 S. Sutherland, Canola Weed Management. http://www.australianoilseeds.com/__data/assets/pdf_file/0012/2712/Chapter_12_-_Canola_Weed_Management.pdf
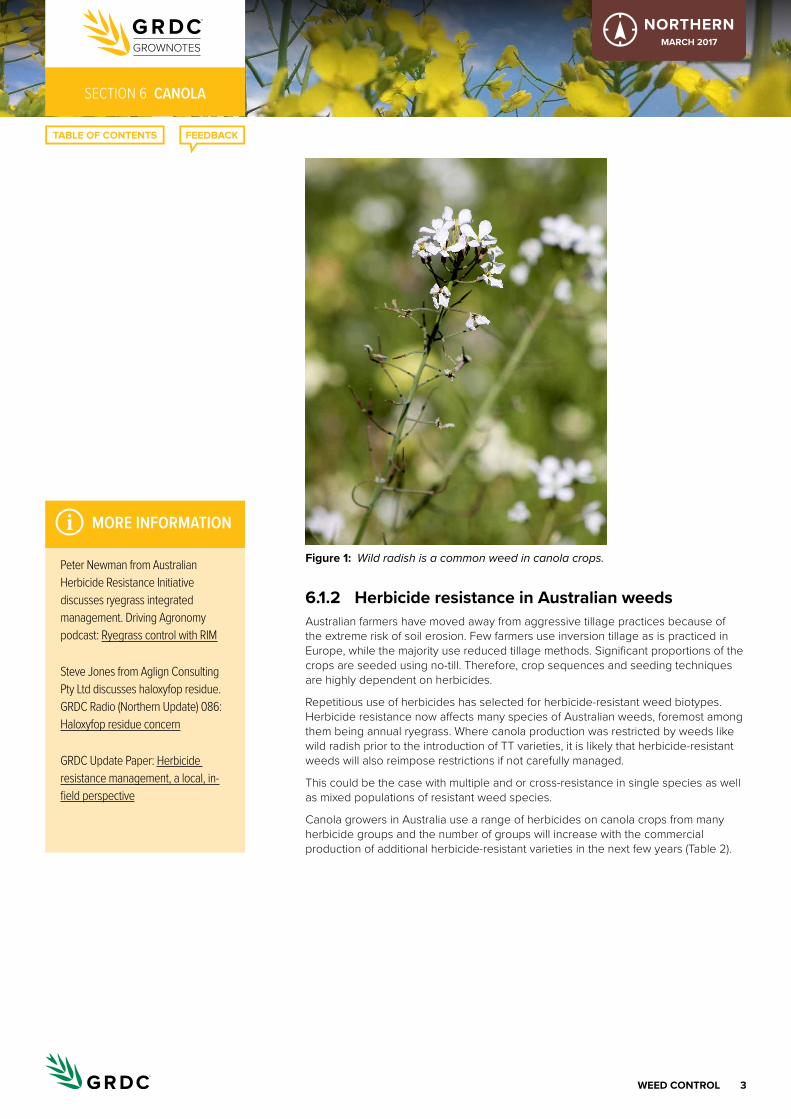
3WeeD coNtrol
seCtioN 6 CANOLA
NORTHERNMarch 2017
Figure 1: Wild radish is a common weed in canola crops.
6.1.2 herbicide resistance in australian weedsAustralian farmers have moved away from aggressive tillage practices because of the extreme risk of soil erosion. Few farmers use inversion tillage as is practiced in Europe, while the majority use reduced tillage methods. Significant proportions of the crops are seeded using no-till. Therefore, crop sequences and seeding techniques are highly dependent on herbicides.
Repetitious use of herbicides has selected for herbicide-resistant weed biotypes. Herbicide resistance now affects many species of Australian weeds, foremost among them being annual ryegrass. Where canola production was restricted by weeds like wild radish prior to the introduction of TT varieties, it is likely that herbicide-resistant weeds will also reimpose restrictions if not carefully managed.
This could be the case with multiple and or cross-resistance in single species as well as mixed populations of resistant weed species.
Canola growers in Australia use a range of herbicides on canola crops from many herbicide groups and the number of groups will increase with the commercial production of additional herbicide-resistant varieties in the next few years (Table 2).
i MORE INFORMATION
Peter Newman from australian herbicide Resistance initiative discusses ryegrass integrated management. Driving agronomy podcast: Ryegrass control with RiM
steve Jones from aglign Consulting Pty Ltd discusses haloxyfop residue. GRDC Radio (Northern Update) 086: haloxyfop residue concern
GRDC Update Paper: herbicide resistance management, a local, in-field perspective
4WeeD coNtrol
seCtioN 6 CANOLA
NORTHERNMarch 2017
table 2: Common herbicides in use in canola crops in Australia.
herbicide groups
herbicides
A Fluazifop, Haloxyfop, Diclofop-methyl, Sethoxydim, Quizalofop, Clethodim
B Intervix* (Clearfield varieties)
C Simazine, Atrazine, (TT varieties)
D Trifluralin
I Clopyralid
K Metolachlor
M Glyphosate (RR varieties)
www.apvma.gov.au
Many populations of annual ryegrass would now be classified as resistant to diclofop methyl and on some farms the ryegrass is cross-resistant to both Group A and Group B herbicides. There have been confirmed cases where annual ryegrass biotypes are resistant to all selective herbicides that are currently available. For each paddock monitoring and resistance testing is imperative to understand the control options open to the grower.
While the major herbicide resistance problems in Australian weeds are with Groups A and B herbicides, resistance to Groups C, D, F, L and M herbicides have also been discovered.
Wild radish has now developed resistance to Group B, Group C and Group F herbicides. Combined with the resistance in ryegrass, this has serious implications for farmers in general but particularly to those wishing to use the IT and TT varieties.
Farmers across Australia are being encouraged to adopt IWM in order to address the resistance problem. There are two essential components to IWM, namely the rotation of herbicide groups to avoid repetitious use of the same or similar herbicides, and the avoidance of treating large numbers of weeds with a single herbicide. Weed seed contamination of the canola seed in excess of limits will lead to reduced prices. This is especially the case with weeds from the family Brassicaceae, which lead to increased erucic acid and glucosinolates and consequent reduction in canola quality. Weed seed and other debris in the canola seed leads to direct penalties, based on the percentage present. Weed competition can affect nutrient uptake by the canola plants and thus affect yield. 3
6.1.3 Weed management in differing scenariosCanola in a continuous cropping sequenceWeed control in these preceding crops consists of manipulating sowing time, exploiting crop competitive effects and relying heavily on selective herbicides.
Selection pressure for herbicide resistance is often high, especially to the Group A and Group B herbicides, because of the need to use these herbicides in the preceding crops.
Weed numbers tend to be higher as farmers do not have the range of non-selective treatments available in the pasture. This increases the risk of resistant biotypes being present in the crops when the herbicides are applied. Due to herbicide resistance, continuous crop programs may include a forage / fodder or green manure crop so that non selective weed control can be achieved.
3 S. Sutherland, Canola Weed Management. http://www.australianoilseeds.com/__data/assets/pdf_file/0012/2712/Chapter_12_-_Canola_Weed_Management.pdf
i MORE INFORMATION
ahRi insight: Canola’s a better crop plant than a weed
5WeeD coNtrol
seCtioN 6 CANOLA
NORTHERNMarch 2017
In both the ley system and the continuous cropping system, a significant component of weed management may be achieved through crop competition, although the effectiveness will vary between environments. 4
Triazine Tolerant (TT) canolaIn 1999, TT canola accounted for almost 50% of the Australian crop, even though the varieties have a yield penalty relative to non-TT varieties. In the majority of cases, TT canola is chosen because the weeds present cannot be controlled in the conventional varieties. In some situations, TT canola may be chosen as part of a strategy to control annual ryegrass resistant to Group A and Group B herbicides, in order to avoid repetitious use of trifluralin. In addition, the TT varieties were initially grown without an associated best management package, although this has now been rectified. All future herbicide-resistant crops will be introduced with a best management guide.
Some areas have a long history of triazine herbicide use, particularly in lupins. The widespread production of TT canola and use of triazines will certainly lead to an escalation in resistant populations of weeds, particularly annual ryegrass. There is already evidence of triazine resistance in wild radish. 5
Imidazolinone Tolerant (IT) canolaIT canola varieties offer some significant benefits but there are important limitations. These varieties are marketed along with an imidazolinone herbicide mix originally called ‘On Duty’ but this has been replaced with a mix called ‘Intervix’. This has a wide spectrum of activity and does not suffer from extended plant-back periods on acid soils. Unlike the TT varieties, the IT varieties carry no yield or oil penalties. The introduction of IT varieties has reduced the area of TT canola, which will have herbicide resistance management and environmental benefits.
Of the disadvantages, Group B herbicides are ‘high risk’ in terms of the development of herbicide resistance. Group B herbicides (e.g. chlorsulfuron and triasulfuron) are already used frequently in cropping sequences. Therefore, producers will have to plan carefully on how to fit the IT varieties without increasing the frequency of Group B herbicide use. The company is developing best management packages that will help greatly in this regard. The Group B resistance problem is so severe already in some areas (particularly in Western Australia) that the IT varieties may have limited, if any, scope for use. 6
Liberty Link® canolaLiberty Link® varieties are currently being developed for the Australian market. At this time, there are problems with efficacy of glufosinate ammonium during the cool growing season, particularly on wild radish and annual ryegrass. This may limit the widespread application of Liberty Link® canola in some areas of southern Australia.
However, when Liberty Link® is combined into hybrids the additional seedling vigour may enhance competition with weeds. 7
Roundup Ready® canolaRoundup Ready® canola (Figure 2) is now available to Australian producers.
Roundup has a wide spectrum of activity on weeds, has no soil residual problems (in the great majority of situations) and belongs to a low risk group in terms of herbicide resistance. Given these factors, Roundup Ready® canola will offer producers a significant alternative to other varieties, herbicide-resistant or otherwise. The
4 S. Sutherland, Canola Weed Management. http://www.australianoilseeds.com/__data/assets/pdf_file/0012/2712/Chapter_12_-_Canola_Weed_Management.pdf
5 S. Sutherland, Canola Weed Management. http://www.australianoilseeds.com/__data/assets/pdf_file/0012/2712/Chapter_12_-_Canola_Weed_Management.pdf
6 S. Sutherland, Canola Weed Management. http://www.australianoilseeds.com/__data/assets/pdf_file/0012/2712/Chapter_12_-_Canola_Weed_Management.pdf
7 S. Sutherland, Canola Weed Management. http://www.australianoilseeds.com/__data/assets/pdf_file/0012/2712/Chapter_12_-_Canola_Weed_Management.pdf
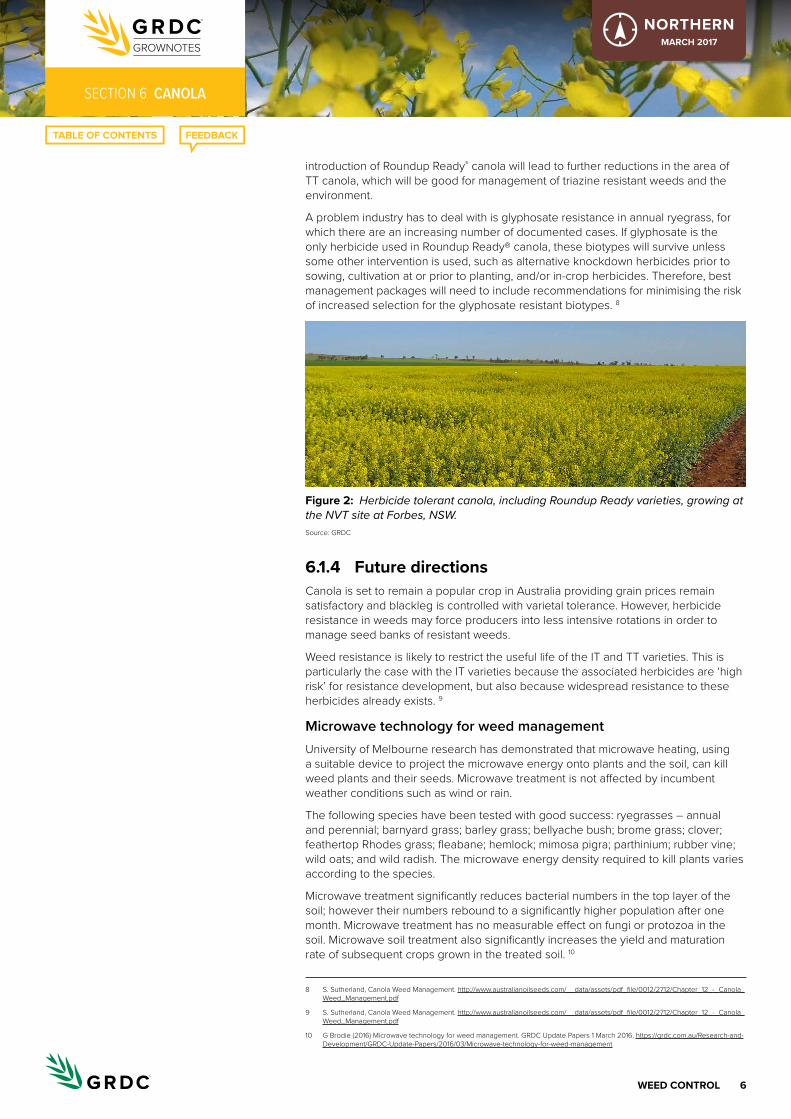
6WeeD coNtrol
seCtioN 6 CANOLA
NORTHERNMarch 2017
introduction of Roundup Ready® canola will lead to further reductions in the area of TT canola, which will be good for management of triazine resistant weeds and the environment.
A problem industry has to deal with is glyphosate resistance in annual ryegrass, for which there are an increasing number of documented cases. If glyphosate is the only herbicide used in Roundup Ready® canola, these biotypes will survive unless some other intervention is used, such as alternative knockdown herbicides prior to sowing, cultivation at or prior to planting, and/or in-crop herbicides. Therefore, best management packages will need to include recommendations for minimising the risk of increased selection for the glyphosate resistant biotypes. 8
Figure 2: Herbicide tolerant canola, including Roundup Ready varieties, growing at the NVT site at Forbes, NSW. Source: GRDC
6.1.4 Future directionsCanola is set to remain a popular crop in Australia providing grain prices remain satisfactory and blackleg is controlled with varietal tolerance. However, herbicide resistance in weeds may force producers into less intensive rotations in order to manage seed banks of resistant weeds.
Weed resistance is likely to restrict the useful life of the IT and TT varieties. This is particularly the case with the IT varieties because the associated herbicides are ‘high risk’ for resistance development, but also because widespread resistance to these herbicides already exists. 9
Microwave technology for weed managementUniversity of Melbourne research has demonstrated that microwave heating, using a suitable device to project the microwave energy onto plants and the soil, can kill weed plants and their seeds. Microwave treatment is not affected by incumbent weather conditions such as wind or rain.
The following species have been tested with good success: ryegrasses – annual and perennial; barnyard grass; barley grass; bellyache bush; brome grass; clover; feathertop Rhodes grass; fleabane; hemlock; mimosa pigra; parthinium; rubber vine; wild oats; and wild radish. The microwave energy density required to kill plants varies according to the species.
Microwave treatment significantly reduces bacterial numbers in the top layer of the soil; however their numbers rebound to a significantly higher population after one month. Microwave treatment has no measurable effect on fungi or protozoa in the soil. Microwave soil treatment also significantly increases the yield and maturation rate of subsequent crops grown in the treated soil. 10
8 S. Sutherland, Canola Weed Management. http://www.australianoilseeds.com/__data/assets/pdf_file/0012/2712/Chapter_12_-_Canola_Weed_Management.pdf
9 S. Sutherland, Canola Weed Management. http://www.australianoilseeds.com/__data/assets/pdf_file/0012/2712/Chapter_12_-_Canola_Weed_Management.pdf
10 G Brodie (2016) Microwave technology for weed management. GRDC Update Papers 1 March 2016, https://grdc.com.au/Research-and-Development/GRDC-Update-Papers/2016/03/Microwave-technology-for-weed-management

7WeeD coNtrol
seCtioN 6 CANOLA
NORTHERNMarch 2017
6.2 clethodim damage
Clethodim damage in canola is particularly relevant in the northern region. The application of clethodim at rates of product of 500 mL/ha (for Select (240 g/L) this is the maximum label rate in canola, but for Select Xtra (360 g/L) the maximum label rate in canola is 330 mL/ha) have been reported to cause the following symptoms on canola:• delayed flowering• distorted flower buds• possible yield suppression. 11
Recent research by the Grain Orana Alliance (GOA) examined the impact of clethodim on canola at different rates and crop stages as growers had become increasingly reliant on clethodim herbicide to manage resistance issues, but in turn were seeing more cases of clethodim damage in their crops following application.
After three years of research and more than a dozen trials GOA found Clethodim was safe to use in canola as long as it was applied according to label rates and timing. If growers get their timing right they can use full label rate (500 ml/hectare) without any significant damage to yield.
But it is absolutely critical growers understand the crop’s growth stages and apply the chemical before the canola is at bud visible stage. This means before the plant is at 8-leaf stage, which is when canola is likely to be budding. Ideally growers should be targeting clethodim application (at the maximum label rate) when the plant is at 2–4 leaf stage.
If canola is at 6-leaf stage growers should exercise caution and check if the bud is visible. 12
Clearly growers need to be aware of the main factor driving such drop damage. There may also be varietal differences, about which little is known, however, farmers can control the timing and rate of herbicide and should be able to avoid such issues. As for controlling the conditions of canola at the time of application, spraying earlier may avoid moisture stress issues particularly in seasons when rainfall is light. Spraying early means late emerging grass weeds will not be controlled with in-crop sprays but these plants are likely to be suppressed by a rapidly closing canola canopy. Seed production from these weed could still be managed with non-chemical options such a windrow burning. 13
6.3 clethodim resistance in annual ryegrass
Clethodim resistance in annual ryegrass is increasing. In the past clethodim resistance was managed by increasing the rate of clethodim. Unfortunately it is no longer possible to do that. There are now populations of annual ryegrass that are resistant to 500 mL ha-1 clethodim and some will survive when treated with 2 L ha-1 of clethodim.
As there are no new post-emergent grass herbicides for canola in the pipeline, pre-emergent herbicides will have to take a greater role in managing ryegrass post-emergent. Researchers examined the ability of some currently registered and potential products for controlling annual ryegrass in canola in 2012 (Table 3). None of the pre-emergent herbicides were particularly efficacious against clethodim resistant annual ryegrass and none were better than using clethodim. Currently, the mix of
11 T Cook, G Brooke, M Widderick, M Street (2014) Herbicides and weeds regional issues trials and developments https://grdc.com.au/Research-and-Development/GRDC-Update-Papers/2014/03/Herbicides-and-weeds-regional-issues-trials-and-developments
12 T Somes (2016) Crop stage critical when using Clethodim in canola. GRDC E-newsletter 6 June 2016, https://grdc.com.au/Media-Centre/GRDC-E-Newsletters/Paddock-Practices/Crop-stage-critical-when-using-Clethodim-in-canola
13 T Cook, G Brooke, M Widderick, M Street (2014) Herbicides and weeds regional issues trials and developments https://grdc.com.au/Research-and-Development/GRDC-Update-Papers/2014/03/Herbicides-and-weeds-regional-issues-trials-and-developments
i MORE INFORMATION
GRDC Update Paper: Managing resistant ryegrass in break crops and new herbicides for resistant ryegrass
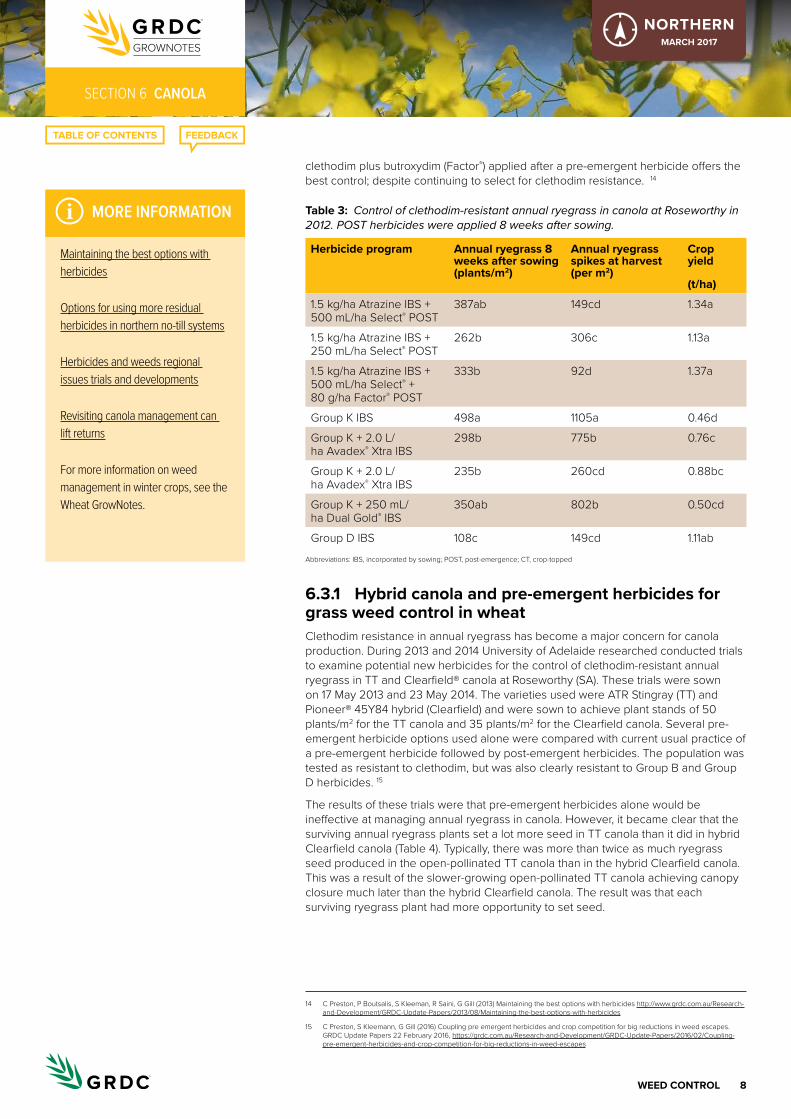
8WeeD coNtrol
seCtioN 6 CANOLA
NORTHERNMarch 2017
clethodim plus butroxydim (Factor®) applied after a pre-emergent herbicide offers the best control; despite continuing to select for clethodim resistance. 14
table 3: Control of clethodim-resistant annual ryegrass in canola at Roseworthy in 2012. POST herbicides were applied 8 weeks after sowing.
herbicide program annual ryegrass 8 weeks after sowing (plants/m2)
annual ryegrass spikes at harvest (per m2)
crop yield
(t/ha)
1.5 kg/ha Atrazine IBS + 500 mL/ha Select® POST
387ab 149cd 1.34a
1.5 kg/ha Atrazine IBS + 250 mL/ha Select® POST
262b 306c 1.13a
1.5 kg/ha Atrazine IBS + 500 mL/ha Select® + 80 g/ha Factor® POST
333b 92d 1.37a
Group K IBS 498a 1105a 0.46d
Group K + 2.0 L/ha Avadex® Xtra IBS
298b 775b 0.76c
Group K + 2.0 L/ha Avadex® Xtra IBS
235b 260cd 0.88bc
Group K + 250 mL/ha Dual Gold® IBS
350ab 802b 0.50cd
Group D IBS 108c 149cd 1.11abAbbreviations: IBS, incorporated by sowing; POST, post-emergence; CT, crop-topped
6.3.1 hybrid canola and pre-emergent herbicides for grass weed control in wheatClethodim resistance in annual ryegrass has become a major concern for canola production. During 2013 and 2014 University of Adelaide researched conducted trials to examine potential new herbicides for the control of clethodim-resistant annual ryegrass in TT and Clearfield® canola at Roseworthy (SA). These trials were sown on 17 May 2013 and 23 May 2014. The varieties used were ATR Stingray (TT) and Pioneer® 45Y84 hybrid (Clearfield) and were sown to achieve plant stands of 50 plants/m2 for the TT canola and 35 plants/m2 for the Clearfield canola. Several pre-emergent herbicide options used alone were compared with current usual practice of a pre-emergent herbicide followed by post-emergent herbicides. The population was tested as resistant to clethodim, but was also clearly resistant to Group B and Group D herbicides. 15
The results of these trials were that pre-emergent herbicides alone would be ineffective at managing annual ryegrass in canola. However, it became clear that the surviving annual ryegrass plants set a lot more seed in TT canola than it did in hybrid Clearfield canola (Table 4). Typically, there was more than twice as much ryegrass seed produced in the open-pollinated TT canola than in the hybrid Clearfield canola. This was a result of the slower-growing open-pollinated TT canola achieving canopy closure much later than the hybrid Clearfield canola. The result was that each surviving ryegrass plant had more opportunity to set seed.
14 C Preston, P Boutsalis, S Kleeman, R Saini, G Gill (2013) Maintaining the best options with herbicides http://www.grdc.com.au/Research-and-Development/GRDC-Update-Papers/2013/08/Maintaining-the-best-options-with-herbicides
15 C Preston, S Kleemann, G Gill (2016) Coupling pre emergent herbicides and crop competition for big reductions in weed escapes. GRDC Update Papers 22 February 2016, https://grdc.com.au/Research-and-Development/GRDC-Update-Papers/2016/02/Coupling-pre-emergent-herbicides-and-crop-competition-for-big-reductions-in-weed-escapes
i MORE INFORMATION
Maintaining the best options with herbicides
options for using more residual herbicides in northern no-till systems
herbicides and weeds regional issues trials and developments
Revisiting canola management can lift returns
For more information on weed management in winter crops, see the Wheat GrowNotes.
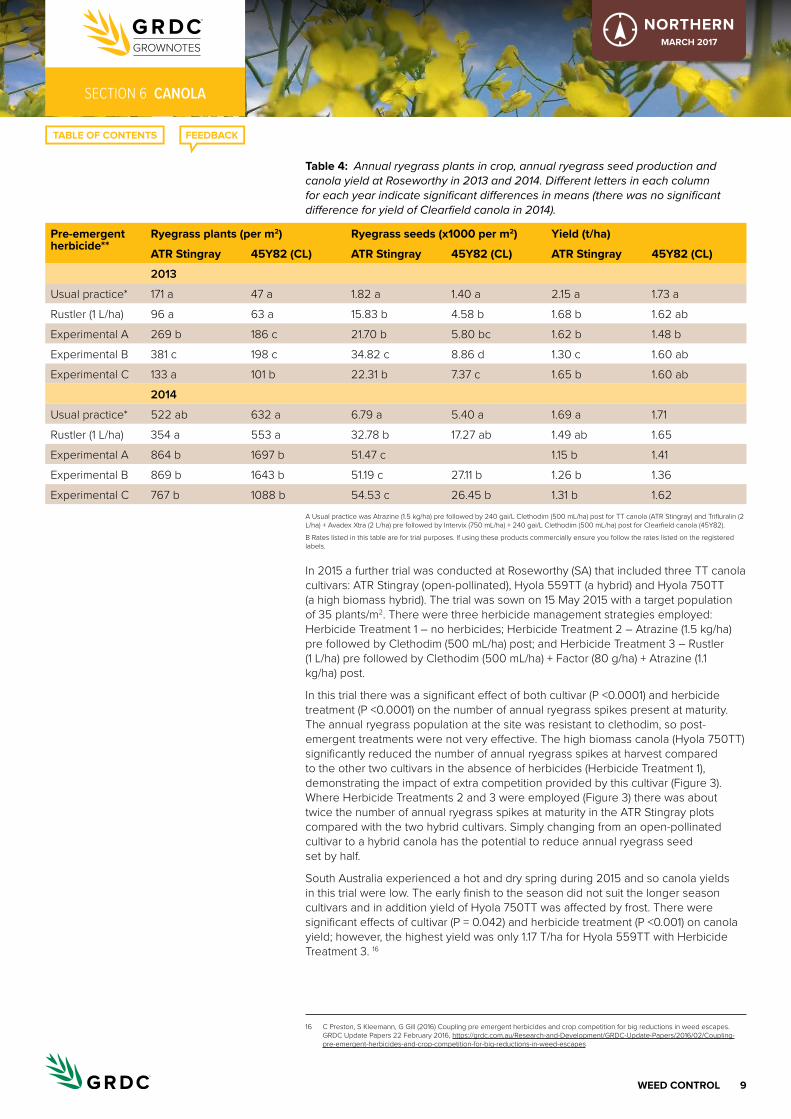
9WeeD coNtrol
seCtioN 6 CANOLA
NORTHERNMarch 2017
table 4: Annual ryegrass plants in crop, annual ryegrass seed production and canola yield at Roseworthy in 2013 and 2014. Different letters in each column for each year indicate significant differences in means (there was no significant difference for yield of Clearfield canola in 2014).
Pre-emergent herbicide**
ryegrass plants (per m2) ryegrass seeds (x1000 per m2) Yield (t/ha)
atr Stingray 45Y82 (cl) atr Stingray 45Y82 (cl) atr Stingray 45Y82 (cl)
2013
Usual practice* 171 a 47 a 1.82 a 1.40 a 2.15 a 1.73 a
Rustler (1 L/ha) 96 a 63 a 15.83 b 4.58 b 1.68 b 1.62 ab
Experimental A 269 b 186 c 21.70 b 5.80 bc 1.62 b 1.48 b
Experimental B 381 c 198 c 34.82 c 8.86 d 1.30 c 1.60 ab
Experimental C 133 a 101 b 22.31 b 7.37 c 1.65 b 1.60 ab
2014
Usual practice* 522 ab 632 a 6.79 a 5.40 a 1.69 a 1.71
Rustler (1 L/ha) 354 a 553 a 32.78 b 17.27 ab 1.49 ab 1.65
Experimental A 864 b 1697 b 51.47 c 1.15 b 1.41
Experimental B 869 b 1643 b 51.19 c 27.11 b 1.26 b 1.36
Experimental C 767 b 1088 b 54.53 c 26.45 b 1.31 b 1.62A Usual practice was Atrazine (1.5 kg/ha) pre followed by 240 gai/L Clethodim (500 mL/ha) post for TT canola (ATR Stingray) and Trifluralin (2 L/ha) + Avadex Xtra (2 L/ha) pre followed by Intervix (750 mL/ha) + 240 gai/L Clethodim (500 mL/ha) post for Clearfield canola (45Y82).
B Rates listed in this table are for trial purposes. If using these products commercially ensure you follow the rates listed on the registered labels.
In 2015 a further trial was conducted at Roseworthy (SA) that included three TT canola cultivars: ATR Stingray (open-pollinated), Hyola 559TT (a hybrid) and Hyola 750TT (a high biomass hybrid). The trial was sown on 15 May 2015 with a target population of 35 plants/m2. There were three herbicide management strategies employed: Herbicide Treatment 1 – no herbicides; Herbicide Treatment 2 – Atrazine (1.5 kg/ha) pre followed by Clethodim (500 mL/ha) post; and Herbicide Treatment 3 – Rustler (1 L/ha) pre followed by Clethodim (500 mL/ha) + Factor (80 g/ha) + Atrazine (1.1 kg/ha) post.
In this trial there was a significant effect of both cultivar (P <0.0001) and herbicide treatment (P <0.0001) on the number of annual ryegrass spikes present at maturity. The annual ryegrass population at the site was resistant to clethodim, so post-emergent treatments were not very effective. The high biomass canola (Hyola 750TT) significantly reduced the number of annual ryegrass spikes at harvest compared to the other two cultivars in the absence of herbicides (Herbicide Treatment 1), demonstrating the impact of extra competition provided by this cultivar (Figure 3). Where Herbicide Treatments 2 and 3 were employed (Figure 3) there was about twice the number of annual ryegrass spikes at maturity in the ATR Stingray plots compared with the two hybrid cultivars. Simply changing from an open-pollinated cultivar to a hybrid canola has the potential to reduce annual ryegrass seed set by half.
South Australia experienced a hot and dry spring during 2015 and so canola yields in this trial were low. The early finish to the season did not suit the longer season cultivars and in addition yield of Hyola 750TT was affected by frost. There were significant effects of cultivar (P = 0.042) and herbicide treatment (P <0.001) on canola yield; however, the highest yield was only 1.17 T/ha for Hyola 559TT with Herbicide Treatment 3. 16
16 C Preston, S Kleemann, G Gill (2016) Coupling pre emergent herbicides and crop competition for big reductions in weed escapes. GRDC Update Papers 22 February 2016, https://grdc.com.au/Research-and-Development/GRDC-Update-Papers/2016/02/Coupling-pre-emergent-herbicides-and-crop-competition-for-big-reductions-in-weed-escapes
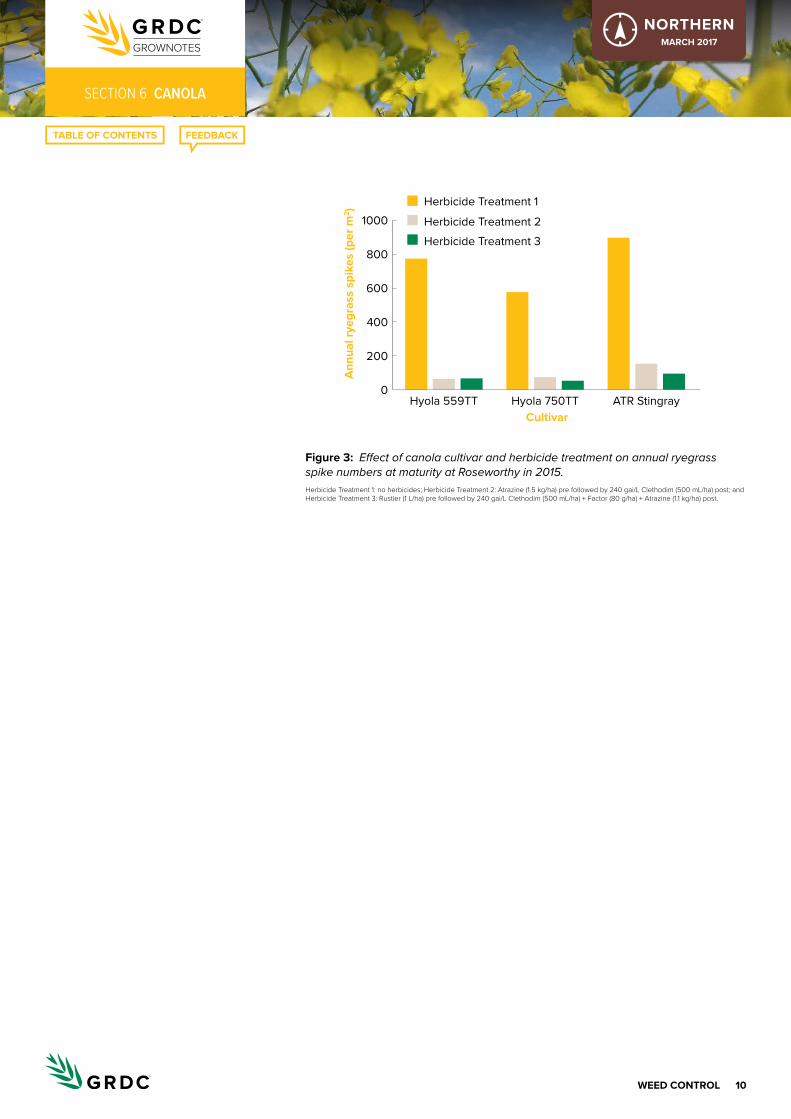
10WeeD coNtrol
seCtioN 6 CANOLA
NORTHERNMarch 2017
Figure 3:
0
200
400
600
800
1000
Hyola 559TT Hyola 750TT ATR Stingray
Ann
ual r
yegr
ass
spik
es (p
er m
2 )
Cultivar
Herbicide Treatment 1
Herbicide Treatment 2
Herbicide Treatment 3
Effect of canola cultivar and herbicide treatment on annual ryegrass spike numbers at maturity at Roseworthy in 2015. Herbicide Treatment 1: no herbicides; Herbicide Treatment 2: Atrazine (1.5 kg/ha) pre followed by 240 gai/L Clethodim (500 mL/ha) post; and Herbicide Treatment 3: Rustler (1 L/ha) pre followed by 240 gai/L Clethodim (500 mL/ha) + Factor (80 g/ha) + Atrazine (1.1 kg/ha) post.
1INSect coNtrol
seCtioN 7 CANOLA
NORTHERNMarch 2017
Insect controlInsects that can pose a problem in canola in NSW include blue oat mites (Penthaleus spp.), redlegged earth mites (Halotydeus destructor), cutworms, diamondback moth, Helicoverpa, aphids Rutherglen bugs, slugs, European earwigs, Lucerne flea and wire worms.
The seed dressing Gaucho® (imidacloprid) protects emerging seedlings from redlegged earth mite, blue oat mite and aphids for ~3–4 weeks after sowing. Another seed dressing, Cosmos® (fipronil) protects seedlings from redlegged earth mites.
Viruses can also occur in canola, carried by aphids that suck sap from leaves, transferring the virus and causing yield loss and sometimes plant death. Protection against early aphid infestation in seedling canola may reduce the incidence of virus in the crop.
Gaucho® (imidacloprid) is the only seed dressing registered for control of aphids in emerging canola. Sowing canola into standing cereal stubble may help to reduce aphid numbers and hence virus infection. 1
7.1 Integrated pest management
Pests are best managed using an integrated pest management (IPM) approach. Careful planning prior to sowing, followed by regular monitoring of crops after sowing, will ensure that potential problems are identified and, if necessary, treated early. Monitoring may involve techniques and aids such as sweep nets, a beat sheet or visual assessment.
Integrated pest management uses a range of control tactics to keep pest numbers below the level where they cause economic damage. It is primarily based on biological control of pests, by either encouraging natural enemies or release of biocontrols.
Other methods of control support these biological controls and can include: • cultural methods such as farm hygiene, weed control, strategic cultivation
(pupae busting), physical barriers, quarantine areas, different planting times, crop rotations, trap crops, use of attractants for beneficials or repellants for pests, and keeping plants healthy so they resist attack
• host plant resistance such as genetically resistant varieties or physical features that repel pests
• genetic control measures such as release of sterile male insects• pheromones to confuse mating or aggregation• use of microbial pesticides such as Bacillus thuringiensis (Bt), nuclear
polyhedrosis virus (NPV) or Metarhizium. • manipulation of micro-environmental conditions (e.g. planting density, row
spacing, row orientation) to make them less suitable for pests or more suitable for beneficials
• use of chemicals as a last resort • use of ‘soft’ chemicals or pest-specific chemicals in preference to broad-
spectrum pesticides (especially early in the growing season when it is important to preserve beneficials).
1 L Serafin, J Holland, R Bambach, D McCaffery (2009) Canola: northern NSW planting guide. NSW Department of Primary Industries, http://www.dpi.nsw.gov.au/__data/assets/pdf_file/0016/148300/canola-northern-NSW-planting-guide.pdf
i MORE INFORMATION
insect and mite control in field crops
Viral diseases in canola and winter pulses
emerging insect pests
‘serial pests’ wrap-up—lessons from 2014 and 2015 and some research updates
Canola disease update 2015 (NsW)
insect pests of canola
Melina Miles QDaF discusses Rutherglen bug. GRDC Radio (Northern Update) 106: safe seed storage strategy
2INSect coNtrol
seCtioN 7 CANOLA
NORTHERNMarch 2017
Integrated pest management relies on monitoring the crop regularly, having pests and beneficial insects correctly identified and strategic control decisions made according to established damage thresholds. 2
7.1.1 area-wide management Area-wide management (AWM) is IPM that operates over a broad region and attacks the pest when and where it is ecologically weakest, without regard to economic thresholds. It is a system currently used in managing resistance in Helicoverpa armigera in cotton. AWM coordinates farmers in implementing management strategies on their own farms to control local populations of H. armigera and prevent numbers building up later in the season. AWM strategies involve a detailed understanding of the biology and life cycle of the pest and of how the pest moves around in a region. Strategies can include coordinated timing of operations such as pupae busting, sowing and destroying of trap crops, and spraying of certain chemical types including ‘soft’ or biological insecticides. 3
7.1.2 Biological control Biological control can be defined as the use of natural enemies to control pest outbreaks. The pest is not usually eradicated, but brought down to levels where it does not cause economic damage. Success with biological control has been varied in many situations. Complete success, where the pests do not exceed the economic thresholds, has occurred in only 19% of cases. Many releases of biocontrol agents have had no significant effect. Success has been more common in long-term agro-ecosystems such as orchards and forests, where pest and natural enemy populations are more stable. In annual cropping systems, maintaining resources that favour the buildup of natural enemies, for example greater biodiversity of plants, retaining stubble and groundcover and limiting use of broad-spectrum insecticides, will help to keep pests in check. 4
2 K Hertel, K Roberts, P Bowden (2013) Insect and mite control in field crops. NSW DPI Management Guide. NSW Department of Primary Industries, http://www.dpi.nsw.gov.au/__data/assets/pdf_file/0005/284576/Insect-and-mite-control-in-field-crops-2013.pdf
3 K Hertel, K Roberts, P Bowden (2013) Insect and mite control in field crops. NSW DPI Management Guide. NSW Department of Primary Industries, http://www.dpi.nsw.gov.au/__data/assets/pdf_file/0005/284576/Insect-and-mite-control-in-field-crops-2013.pdf
4 K Hertel, K Roberts, P Bowden (2013) Insect and mite control in field crops. NSW DPI Management Guide. NSW Department of Primary Industries, http://www.dpi.nsw.gov.au/__data/assets/pdf_file/0005/284576/Insect-and-mite-control-in-field-crops-2013.pdf
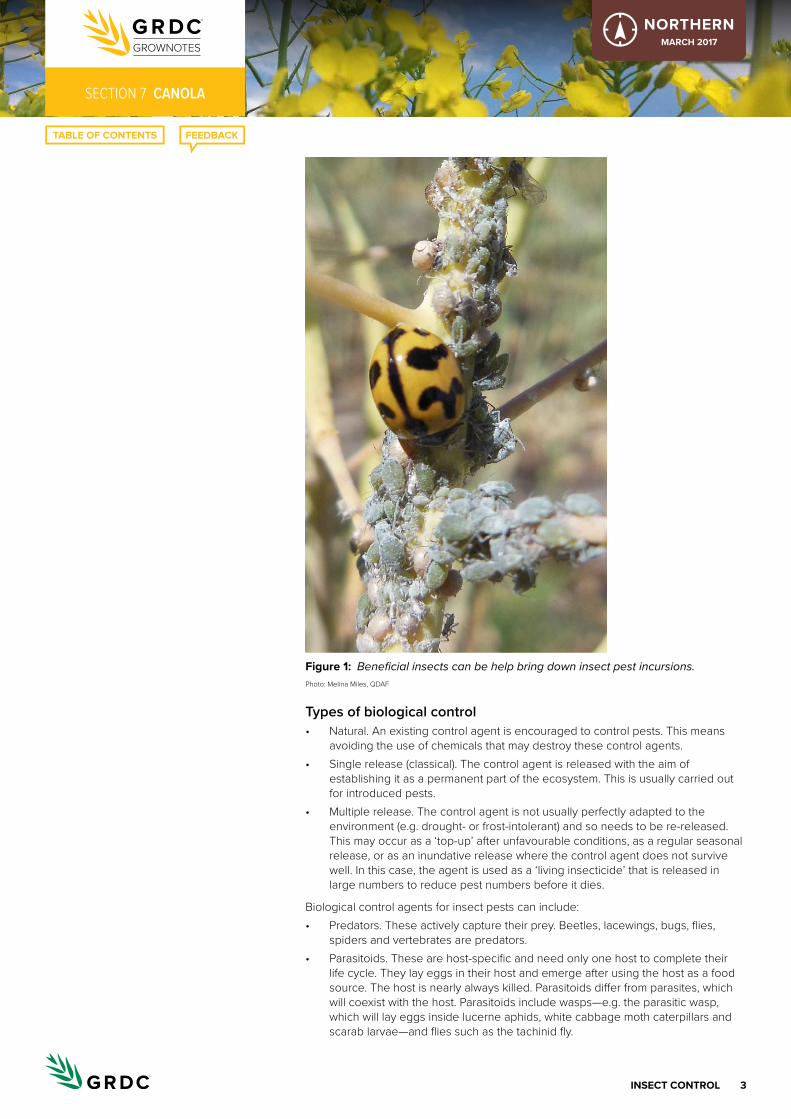
3INSect coNtrol
seCtioN 7 CANOLA
NORTHERNMarch 2017
Figure 1: Beneficial insects can be help bring down insect pest incursions. Photo: Melina Miles, QDAF
Types of biological control • Natural. An existing control agent is encouraged to control pests. This means
avoiding the use of chemicals that may destroy these control agents. • Single release (classical). The control agent is released with the aim of
establishing it as a permanent part of the ecosystem. This is usually carried out for introduced pests.
• Multiple release. The control agent is not usually perfectly adapted to the environment (e.g. drought- or frost-intolerant) and so needs to be re-released. This may occur as a ‘top-up’ after unfavourable conditions, as a regular seasonal release, or as an inundative release where the control agent does not survive well. In this case, the agent is used as a ‘living insecticide’ that is released in large numbers to reduce pest numbers before it dies.
Biological control agents for insect pests can include: • Predators. These actively capture their prey. Beetles, lacewings, bugs, flies,
spiders and vertebrates are predators. • Parasitoids. These are host-specific and need only one host to complete their
life cycle. They lay eggs in their host and emerge after using the host as a food source. The host is nearly always killed. Parasitoids differ from parasites, which will coexist with the host. Parasitoids include wasps—e.g. the parasitic wasp, which will lay eggs inside lucerne aphids, white cabbage moth caterpillars and scarab larvae—and flies such as the tachinid fly.
4INSect coNtrol
seCtioN 7 CANOLA
NORTHERNMarch 2017
• Pathogens. These include bacteria, viruses, fungi, protozoa and nematodes. A few of these organisms can enter and multiply rapidly within the host, e.g. Metarhizium, Bt, NPV.
Parasitoid and pathogen control agents are usually more successful than predators because they are more host-specific.
Trichogramma wasps Trichogramma pretiosum wasps prey on the eggs of Helicoverpa spp., loopers, cabbage moths and others, and are suitable for use in minimally sprayed field crops, maize and vegetables, and for Helicoverpa in fruit crops. They are <0.5 mm in size and lay their eggs into moth eggs. The wasp larvae develop into a fully formed wasp inside the moth egg in the process killing the developing caterpillar. Trichogramma are supplied as parasitised moth eggs in capsules. These are distributed around the crop and can be applied with water. 5
Nuclear polyhedrosis virus (NPV) Insect viruses are naturally occurring, insect-specific pathogens that have been part of the environment for millions of years and play an important role in the natural control of insect populations. Insects consume the virus from the leaves. The virus then moves through the gut wall and invades the body of the insect, causing the insect to stop feeding and die within 5 days because of the breakdown of its internal organs. The body ruptures after death, releasing virus particles that infect other caterpillars. Gemstar® and Vivus Gold® are commercial products that control Helicoverpa punctigera and H. armigera with a liquid concentration of virus particles in cotton and selected crops. Typically, they provide 60–90% control of larvae. Both products fit best within an IPM program that uses natural enemies such as ladybeetles and parasites, but can be alternated with synthetic insecticides. As a biological insecticide, efficacy is dependent on environmental conditions for good performance. It needs to be ingested; therefore, coverage of the target area is essential. 6
Bacillus thuringiensisThe Bt bacteria produce proteins that are characterised by their potency and specificity to certain species, most of which are agronomically important pests. Mixtures of protein crystals and spores have been sprayed in the same way as a chemical pesticide for many years in horticultural industries, but with variable success in broadacre field crops, Full-Bac® WDG being a notable exception. Full-Bac® WDG is a dry flowable, more suited to application by boom spray than previous formulations. The caterpillar ingests the protein, which then attacks the gut wall, causing holes, and the insect stops feeding. The bacterial spores contained in the protein then leak through the gut wall and cause bacterial infection. The insect will die, either from this bacterial infection or from starvation. This is the process that makes the Bt protein highly specific and environmentally desirable. Insertion of the Bt gene into cotton plants has taken many years to develop, and breeding is ongoing of plants that express higher levels of the Bt toxin. Resistance to Bt is being carefully monitored and controlled with the development of management programs and new research on multiple insect-resistance genes. Novel strains of Bt are being isolated for a wide range of pest families, including beetles, flies and locusts. 7
5 K Hertel, K Roberts, P Bowden (2013) Insect and mite control in field crops. NSW DPI Management Guide. NSW Department of Primary Industries, http://www.dpi.nsw.gov.au/__data/assets/pdf_file/0005/284576/Insect-and-mite-control-in-field-crops-2013.pdf
6 K Hertel, K Roberts, P Bowden (2013) Insect and mite control in field crops. NSW DPI Management Guide. NSW Department of Primary Industries, http://www.dpi.nsw.gov.au/__data/assets/pdf_file/0005/284576/Insect-and-mite-control-in-field-crops-2013.pdf
7 K Hertel, K Roberts, P Bowden (2013) Insect and mite control in field crops. NSW DPI Management Guide. NSW Department of Primary Industries, http://www.dpi.nsw.gov.au/__data/assets/pdf_file/0005/284576/Insect-and-mite-control-in-field-crops-2013.pdf
i MORE INFORMATION
integrated Pest Management Fact sheet
5INSect coNtrol
seCtioN 7 CANOLA
NORTHERNMarch 2017
7.2 earth mites
Earth mites are the major pests of seedling canola, especially in central and southern NSW. Damage can be caused by redlegged earth mites and blue oat mites, which often occur in mixed populations. Bryobia mites are an increasing problem in some areas. A good mite-control program starts with a population reduction treatment the previous spring (Table 1). Learn to identify these three species of mites to ensure that the correct insecticide and rate is applied to the correct species.
Bare earth treatments. Germinating and establishing crops can be protected by: • boom spraying the soil surface of previous pasture or high-risk paddocks with a
residual insecticide immediately after sowing• perimeter spraying bare ground in low-risk paddocks, not forgetting to spray
around trees, rocky outcrops and dams, and along water flow-lines.
If you are unsure of the level of risk from mites, spray the whole paddock. Three bare earth sprays are registered that will give several weeks of residual protection. Bifenthrin is registered for redlegged earth mite, blue oat mite and Bryobia mites, but application rates vary according to the mite species being targeted. Alpha-cypermethrin will control redlegged earth mite, while methidathion is registered for both redlegged earth mite and blue oat mite.
Seed dressings. Imidacloprid (e.g. Gaucho®) and Poncho® Plus (clothianidin + imidacloprid) are registered for use on canola seed for protection against redlegged earth mite, blue oat mite and aphids. Poncho® Plus is also registered to control lucerne flea, wireworm and cutworm. A third seed dressing, Cruiser® Opti (thiamethoxam + lambda-cyhalothrin) is registered for suppression of redlegged earth mite and lucerne flea. These seed dressings will protect emerging seedlings for 3–5 weeks after sowing. Use treated seed following a pasture phase if a well-timed spring spray of insecticide has been applied. Apply a bare-earth border spray where untreated pastures border the canola crop. Seed companies can supply seed pre-treated with imidacloprid, Poncho® Plus and Cruiser® Opti. Cosmos® Insecticidal Seed Treatment (fipronil) is also registered for control of redlegged earth mite in canola. Even where a seed-dressing or bare-earth treatment has been used, it is advisable to check seedling canola regularly for mite damage. 8
Redlegged earth mite and blue oat mite (Penthaleus major) are two soil-dwelling mites that damage crops in autumn, winter and spring. They are primarily pests of seedlings but can also seriously injure older plants. Winter crops at establishment may be severely damaged, particularly if growth during and following emergence is slow. Damaged plants die or remain stunted and weak. Sometimes seedlings are killed before they emerge. Both mites prefer light, sandy or loamy, well-drained soils and often occur together in crops on the Tablelands, Slopes and Plains of NSW. 9
8 P Matthews, D McCaffery, L Jenkins (2016) Winter crop variety sowing guide 2016. NSW DPI Management Guide. NSW Department of Primary Industries, http://www.dpi.nsw.gov.au/__data/assets/pdf_file/0011/272945/winter-crop-variety-sowing-guide-2016.pdf
9 K Hertel, K Roberts, P Bowden (2013) Insect and mite control in field crops. NSW DPI Management Guide. NSW Department of Primary Industries, http://www.dpi.nsw.gov.au/__data/assets/pdf_file/0005/284576/Insect-and-mite-control-in-field-crops-2013.pdf
i MORE INFORMATION
Nutrient management may double as pest control
6INSect coNtrol
seCtioN 7 CANOLA
NORTHERNMarch 2017
table 1: Recommended control strategies for earth mites. 10
Pre-season (previous spring–summer)
Assess risk
High-risk situations:
History of high mite pressure Pasture going into crop Susceptible crop being planted (e.g. canola, pasture, lucerne) Seasonal forecast is for dry or cool, wet conditions that slow crop growth
Actions if risk is high:
Ensure accurate identification of species Use Timerite® (redlegged earth mites only) Heavily graze pastures in early-mid spring
Pre-sowing
Actions if risk is high:
Use an insecticide seed dressing on susceptible crops
Plan to monitor more frequently until crop established
Use higher sowing rate to compensate for seedling loss
Consider scheduling a post-emergent insecticide treatment
Actions if risk is low:
Avoid insecticide seed dressings (esp. cereal and pulse crops)
Plan to monitor until crop establishment
emergence
Monitor susceptible crops through to establishment using direct visual searches
Be aware of edge effects; mites move in from weeds around paddock edges
Actions if spraying:
Ensure accurate identification of species before deciding on chemical
Consider border sprays
Spray prior to the production of winter eggs to suppress populations and reduce risk in the following season
Follow threshold guidelines
crop establishment
As the crop grows, it becomes less susceptible unless growth is slowed by dry or cool, wet conditions
FeedingMites feed by rasping the surface of the cotyledons and leaves and by sucking up the sap. Feeding is normally from late afternoon until early morning, but continues through the day in calm, cloudy weather. Mites are very active and, if disturbed on a plant, will drop or descend to the ground and disperse to find shelter. Redlegged earth mites usually remain clustered together on the soil or on parts of the leaves during the day. Blue oat mites generally hide by day in the soil beneath damaged plants or under plant debris on the ground. 11
10 P Umina (2014) Persistent pests; aphids, mites, millipedes and earwigs. GRDC Update Papers, 5 February 2014, http://grdc.com.au/Research-and-Development/GRDC-Update-Papers/2014/02/Persistent-pests-aphids-mites-millipedes-and-earwigs
11 K Hertel, K Roberts, P Bowden (2013) Insect and mite control in field crops. NSW DPI Management Guide. NSW Department of Primary Industries, http://www.dpi.nsw.gov.au/__data/assets/pdf_file/0005/284576/Insect-and-mite-control-in-field-crops-2013.pdf
7INSect coNtrol
seCtioN 7 CANOLA
NORTHERNMarch 2017
7.2.1 redlegged earth miteThe redlegged earth mite is mainly a pest on the Southern and Central Tablelands, Slopes and Plains. It is native to southern Africa and cape weed is its preferred host plant. Other hosts include prickly paddy melon, wild turnip, common sowthistle, Paterson’s curse and chickweed (weeds); and canola, lupins, field peas and linseed (field crops). Sometimes mites may move into young winter cereals from a fence line or adjoining pasture and cause damage along one or more of the crop edges.
Description Adult mites are eight-legged and ~1 mm long with oval, flattened black bodies and pinkish-orange legs and mouthparts.
Seasonal development Three overlapping generations usually occur between mid-autumn and spring, and adult populations are normally highest in May–June and September–October. Redlegged earth mites oversummer as unlaid, aestivating eggs in the dead bodies of spring-generation adult mites lying on or near the soil surface. The aestivating eggs are highly resistant to desiccation and usually do not begin to develop until late summer–early autumn. They hatch when favourable conditions of soil temperature and moisture occur in the following mid-autumn to early winter.
TIMERITE® for management of redlegged earth mite TIMERITE® is an information package that provides individual farmers with the optimum spray date on their farm to control redlegged earth mites during spring. Developed by CSIRO and Australian Wool Innovation, TIMERITE® predicts the optimum date in spring to control redlegged earth mites, just after they have ceased laying normal winter eggs on pasture and just before diapause. (Diapause is when adult redlegged earth mites produce eggs that are retained in the body of the adult female and are therefore protected from the effects of insecticide applications.) The single, strategic spray has a two-fold effect, controlling redlegged earth mites in spring and decreasing the summer population that emerges in the following autumn. The package may form part of an integrated management strategy to control redlegged earth mites.
Close attention should be paid to individual pesticide labels when controlling earth mites. Application rates vary with situations, such as bare earth or post-crop–pasture emergence. Correct identification of earth mite species is essential. Registrations sometimes include redlegged earth mites only, not blue oat mites or Bryobia mites. Application rates may vary with earth mite species. READ THE LABEL.
This strategic approach has little effect on non-target invertebrates, both pest and beneficial, during the following autumn. Farmers need to identify geographically the location to be sprayed. This can be done by a local feature, such as town or mountain, or the longitude and latitude of the area. This information is used to find the optimum date from the package. The spray date for each farm is the same date each year. For information, phone Australian Wool Innovation toll free on 1800 070 099 or visit the website www.timerite.com.au. 12
7.2.2 Blue oat mite Blue oat mites are often confused with redlegged earth mites. There are four recognised species of blue oat mites in Australia: Penthaleus major, P. falcatus, P. minor and P. tectus. Accurate identification of the species requires examination by an entomologist. The four species vary in their geographical distribution in Australia. With the exception of P. minor, all species have been found in NSW, in some instances in mixed populations. Damage to crops and pastures is incurred in the establishment phase. Host-plant preferences vary with the species, as do their life cycles and tolerances to various pesticides. Host plants include black thistle, chickweed, curled
12 K Hertel, K Roberts, P Bowden (2013) Insect and mite control in field crops. NSW DPI Management Guide. NSW Department of Primary Industries, http://www.dpi.nsw.gov.au/__data/assets/pdf_file/0005/284576/Insect-and-mite-control-in-field-crops-2013.pdf
i MORE INFORMATION
Persistent pests; aphids, mites, millipedes and earwigs
i MORE INFORMATION
tiMeRite information package
8INSect coNtrol
seCtioN 7 CANOLA
NORTHERNMarch 2017
dock, dandelion, deadnettle, prickly lettuce, shepherds purse, variegated thistle and wild oat. Cultivated field-crop hosts include wheat, barley, oats, rye, canola, field peas, lupins and linseed.
Description Adult mites have eight legs and are ~1 mm long with oval, rounded, dark brown to black bodies, bright red or pinkish red legs and mouthparts, and a red spot or streak towards the hind end of the back.
Seasonal development Overlapping generations of the blue oat mite usually occur between mid-autumn and late spring. Blue oat mites oversummer as aestivating eggs laid in mid–late spring by the second-generation adults. These aestivating eggs are highly resistant to desiccation. They do not begin to develop until late summer–early autumn and they do not hatch until favourable conditions of temperature and moisture occur in the following mid-autumn to early winter. 13
7.3 lucerne flea
Lucerne flea is an occasional pest of establishing canola crops. The pest is identified by its action of jumping and hopping between plants rather than flying. It is present across a range of soil types in southern NSW. Early-sown crops are more at risk of attack. Frequent crop inspection from the time of emergence and early control measures are important because of the impact of seedling vigour on crop performance. Ensure that monitoring is sufficient to detect localised patches or ‘hot spots’. Seek advice on management and spray strategies. 14
7.4 Slugs
Slugs are a potential problem along the Northern, Central and Southern Slopes, and occasionally adjacent to rivers on the Western Plains. Slugs kill plants at the seedling and rosette stages and can leave large, bare-soil areas. Slugs are favoured by wet springs and summers, where abundant growth and damp conditions provide an ideal habitat. This allows slugs to breed and survive into autumn and winter, when they attack newly sown crops.
Canola sown into dense stubble or adjacent to grassy fence lines, creek banks or damp areas is at greatest risk because these areas provide an ideal habitat for slugs to survive over summer. Heavy, cracking soils provide additional hiding places for slugs. Closely monitor crops at risk for 6–8 weeks after sowing, so that any infestation can be treated with slug pellets containing metaldehyde. 15
7.5 Diamondback moth
Diamondback moth has been observed in canola crops for many years in NSW. The summer of 2001–02 favoured their build-up and they became a serious pest in the drought of 2002. Few, if any, crops have required spraying since, despite major drought in 2006 and 2009. Caterpillars of diamondback moth do most damage when large numbers are present in seedling crops or when they move from leaves to graze developing pods during crop ripening. Diamondback moth has developed resistance to a range of insecticides. Future management will involve regular monitoring and careful selection of control methods. 16
13 K Hertel, K Roberts, P Bowden (2013) Insect and mite control in field crops. NSW DPI Management Guide. NSW Department of Primary Industries, http://www.dpi.nsw.gov.au/__data/assets/pdf_file/0005/284576/Insect-and-mite-control-in-field-crops-2013.pdf
14 P Matthews, D McCaffery, L Jenkins (2016) Winter crop variety sowing guide 2016. NSW DPI Management Guide. NSW Department of Primary Industries, http://www.dpi.nsw.gov.au/__data/assets/pdf_file/0011/272945/winter-crop-variety-sowing-guide-2016.pdf
15 P Matthews, D McCaffery, L Jenkins (2016) Winter crop variety sowing guide 2016. NSW DPI Management Guide. NSW Department of Primary Industries, http://www.dpi.nsw.gov.au/__data/assets/pdf_file/0011/272945/winter-crop-variety-sowing-guide-2016.pdf
16 P Matthews, D McCaffery, L Jenkins (2016) Winter crop variety sowing guide 2016. NSW DPI Management Guide. NSW Department of Primary Industries, http://www.dpi.nsw.gov.au/__data/assets/pdf_file/0011/272945/winter-crop-variety-sowing-guide-2016.pdf
i MORE INFORMATION
Diamondback moth in canola. Fact sheet
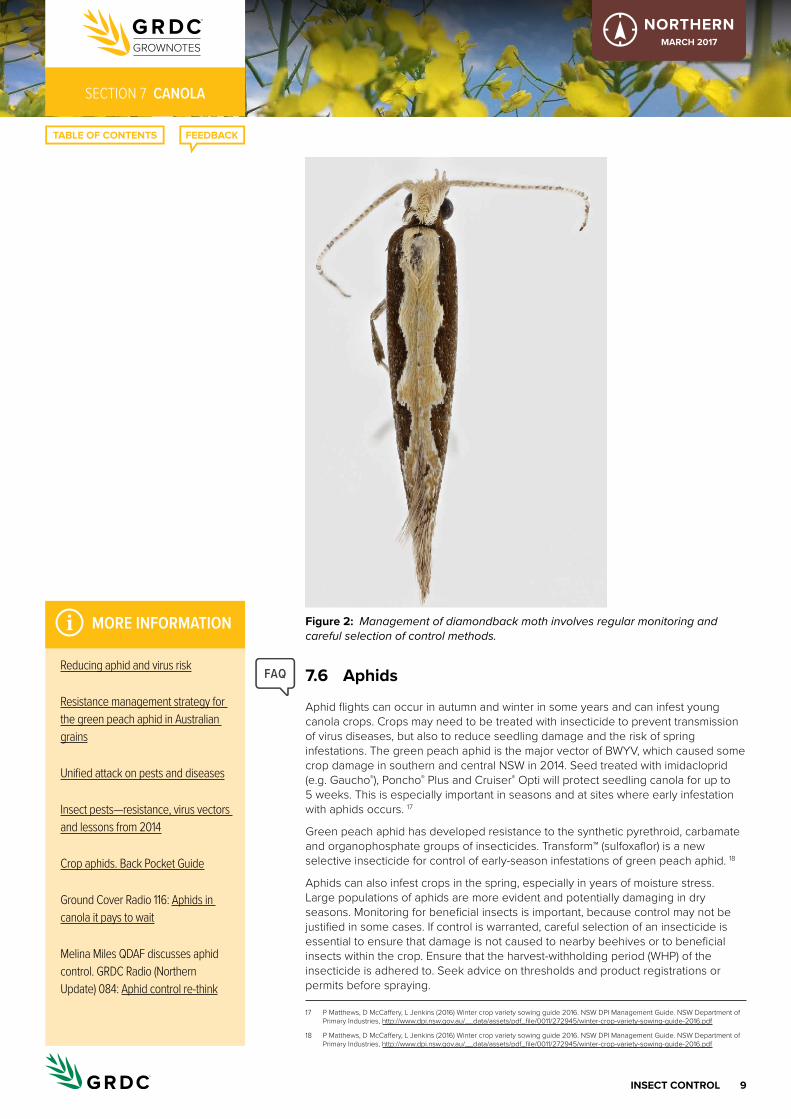
9INSect coNtrol
seCtioN 7 CANOLA
NORTHERNMarch 2017
Figure 2: Management of diamondback moth involves regular monitoring and careful selection of control methods.
7.6 aphids
Aphid flights can occur in autumn and winter in some years and can infest young canola crops. Crops may need to be treated with insecticide to prevent transmission of virus diseases, but also to reduce seedling damage and the risk of spring infestations. The green peach aphid is the major vector of BWYV, which caused some crop damage in southern and central NSW in 2014. Seed treated with imidacloprid (e.g. Gaucho®), Poncho® Plus and Cruiser® Opti will protect seedling canola for up to 5 weeks. This is especially important in seasons and at sites where early infestation with aphids occurs. 17
Green peach aphid has developed resistance to the synthetic pyrethroid, carbamate and organophosphate groups of insecticides. Transform™ (sulfoxaflor) is a new selective insecticide for control of early-season infestations of green peach aphid. 18
Aphids can also infest crops in the spring, especially in years of moisture stress. Large populations of aphids are more evident and potentially damaging in dry seasons. Monitoring for beneficial insects is important, because control may not be justified in some cases. If control is warranted, careful selection of an insecticide is essential to ensure that damage is not caused to nearby beehives or to beneficial insects within the crop. Ensure that the harvest-withholding period (WHP) of the insecticide is adhered to. Seek advice on thresholds and product registrations or permits before spraying.
17 P Matthews, D McCaffery, L Jenkins (2016) Winter crop variety sowing guide 2016. NSW DPI Management Guide. NSW Department of Primary Industries, http://www.dpi.nsw.gov.au/__data/assets/pdf_file/0011/272945/winter-crop-variety-sowing-guide-2016.pdf
18 P Matthews, D McCaffery, L Jenkins (2016) Winter crop variety sowing guide 2016. NSW DPI Management Guide. NSW Department of Primary Industries, http://www.dpi.nsw.gov.au/__data/assets/pdf_file/0011/272945/winter-crop-variety-sowing-guide-2016.pdf
FAQ
i MORE INFORMATION
Reducing aphid and virus risk
Resistance management strategy for the green peach aphid in australian grains
Unified attack on pests and diseases
insect pests—resistance, virus vectors and lessons from 2014
Crop aphids. Back Pocket Guide
Ground Cover Radio 116: aphids in canola it pays to wait
Melina Miles QDaF discusses aphid control. GRDC Radio (Northern Update) 084: aphid control re-think

10INSect coNtrol
seCtioN 7 CANOLA
NORTHERNMarch 2017
Figure 3: Aphids can transmit damaging viruses to canola crops. Photo: Melina Miles, QDAF
IN FOCUS7.6.1 recent grDc-funded research
Take home messageCompensatory capacity of canola supports the use of less conservative aphid thresholds and increased consideration of natural enemies in controlling outbreaks.
Outcomes and recommendations—management of aphids in canola1. Simulated damage through the removal of raceme terminals by cutting
provides an adequate way of simulating aphid damage.2. Trials conducted on the Darling Downs in 2013 and the Liverpool Plains in
2014 show identical trends in terms of crop compensation for simulated aphid damage. Consequently, we have some confidence that the conclusions drawn from these trials will have application to canola crops across a wide range of northern region growing conditions.
3. Removal of the flowering portion of podding racemes (23 days post first flower) did not affect yield, probably because the flowers removed would not have set harvestable pods.
4. Simulated damage to the raceme during the first weeks of flowering had only minimal impact on final yield, except where extreme damage was enacted (66% of, or the entire, raceme removed on every plant).
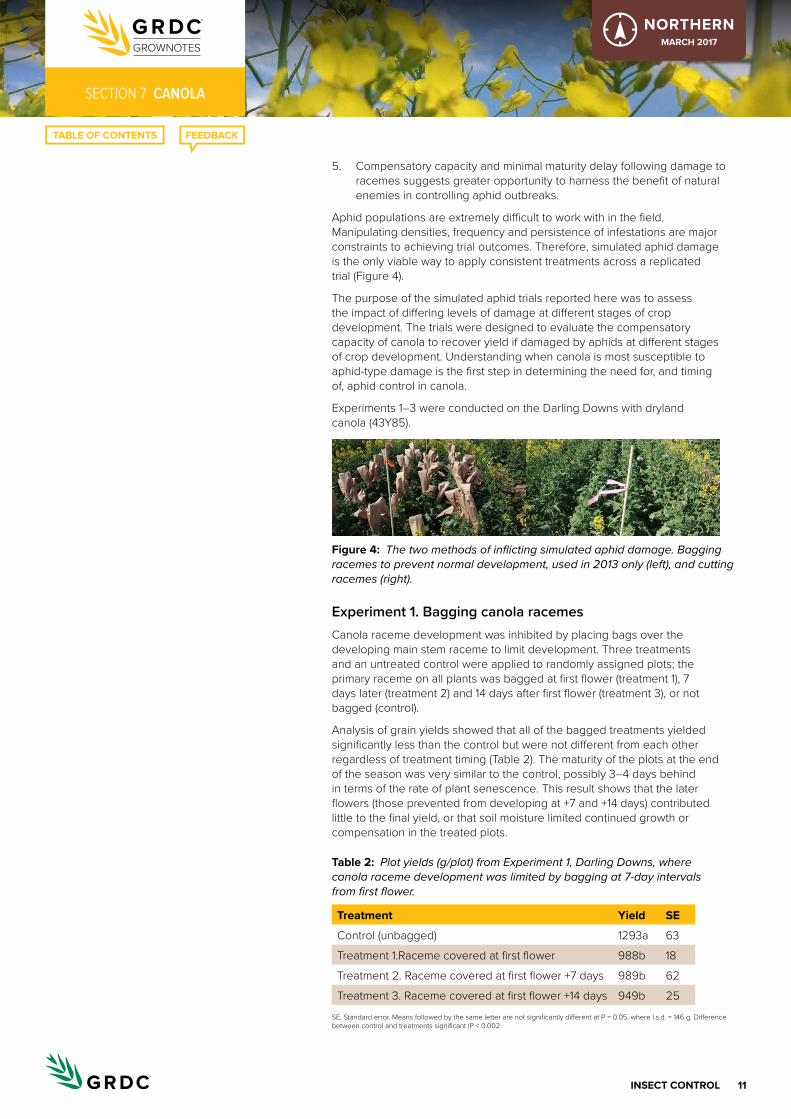
11INSect coNtrol
seCtioN 7 CANOLA
NORTHERNMarch 2017
5. Compensatory capacity and minimal maturity delay following damage to racemes suggests greater opportunity to harness the benefit of natural enemies in controlling aphid outbreaks.
Aphid populations are extremely difficult to work with in the field. Manipulating densities, frequency and persistence of infestations are major constraints to achieving trial outcomes. Therefore, simulated aphid damage is the only viable way to apply consistent treatments across a replicated trial (Figure 4).
The purpose of the simulated aphid trials reported here was to assess the impact of differing levels of damage at different stages of crop development. The trials were designed to evaluate the compensatory capacity of canola to recover yield if damaged by aphids at different stages of crop development. Understanding when canola is most susceptible to aphid-type damage is the first step in determining the need for, and timing of, aphid control in canola.
Experiments 1–3 were conducted on the Darling Downs with dryland canola (43Y85).
Figure 4: The two methods of inflicting simulated aphid damage. Bagging racemes to prevent normal development, used in 2013 only (left), and cutting racemes (right).
Experiment 1. Bagging canola racemesCanola raceme development was inhibited by placing bags over the developing main stem raceme to limit development. Three treatments and an untreated control were applied to randomly assigned plots; the primary raceme on all plants was bagged at first flower (treatment 1), 7 days later (treatment 2) and 14 days after first flower (treatment 3), or not bagged (control).
Analysis of grain yields showed that all of the bagged treatments yielded significantly less than the control but were not different from each other regardless of treatment timing (Table 2). The maturity of the plots at the end of the season was very similar to the control, possibly 3–4 days behind in terms of the rate of plant senescence. This result shows that the later flowers (those prevented from developing at +7 and +14 days) contributed little to the final yield, or that soil moisture limited continued growth or compensation in the treated plots.
table 2: Plot yields (g/plot) from Experiment 1, Darling Downs, where canola raceme development was limited by bagging at 7-day intervals from first flower.
treatment Yield Se
Control (unbagged) 1293a 63
Treatment 1.Raceme covered at first flower 988b 18
Treatment 2. Raceme covered at first flower +7 days 989b 62
Treatment 3. Raceme covered at first flower +14 days 949b 25SE, Standard error. Means followed by the same letter are not significantly different at P = 0.05, where l.s.d. = 146 g. Difference between control and treatments significant (P < 0.002

12INSect coNtrol
seCtioN 7 CANOLA
NORTHERNMarch 2017
Experiment 2. Increasing severity of cutting flowering racemesThe experiment was laid out in the same canola field as used for Experiment 1 to test the effects of damage at different intensities during early flowering. Four treatments were applied with increasing severity at 14 days post first flower, and there was an undamaged control (Table 3).
The damage applied to the plots at 14 days post first flower resulted in a significant yield loss for only the most damaging treatment, in which all developing raceme terminals were cut (top 7 nodes) (Table 3).
The rate of crop senescence was marginally delayed in the two most severe cutting treatments. Crop maturity of treated plots was delayed by ~3–4 days compared with the control.
table 3: Plot yields (g/plot) from Experiment 2, Darling Downs, where canola racemes were cut with increasing severity at 14 days post first flower.
treatment Yield Se
Control (undamaged) 1137a 108
Terminal of raceme cut 1173a 98
Top 3 nodes of raceme cut 1133a 65
Top 5 nodes of raceme cut 1102a 89
Top 7 nodes of raceme cut (nearly all)
841b 111
SE, Standard error. Means followed by the same letter are not significantly different at P = 0.05, where l.s.d. = 242 g. Difference between most severe treatment and other treatments significant (P < 0.005
Experiment 3. Damage to flowering racemes at late flowering-pod fillingIn this experiment, just the flowering portion of filling racemes was removed at 23 days after first flower. There were three treated plots, in which the terminals of 10%, 50% or 90% of the racemes in the plot were damaged, and an undamaged control (Table 4). These treatments were designed to simulate the late terminal infestations commonly observed in late spring.
This damage to the flowering terminals during late flowering–podset had no significant impact on grain yield (Table 4). There was no delay in crop maturity and no significant difference in the rate of crop senescence between treatments.
table 4: Plot yields (g/plot) from Experiment 3, Darling Downs, where increasing proportions of racemes were damaged during late flowering–pod set.
treatment Yield Se
Control 1246 70
10% of racemes terminal removed 1159 37
50% of racemes terminal removed 1193 65
90% of racemes terminal removed 1204 89SE, Standard error. There were no significant treatment differences (P > 0.05
Experiment 4. Liverpool Plains 2014The effects of simulated damage on flowering canola were further tested in a second series of experiments at eight sites near Spring Ridge on the Liverpool Plains, NSW. Three treatments were applied (one-third and

13INSect coNtrol
seCtioN 7 CANOLA
NORTHERNMarch 2017
two-thirds of raceme flowers and whole of raceme removed), with an undamaged control at each site.
The damage was inflicted during the early stages of flowering (within 7–10 days of first flower) at five sites during early August and at three sites where flowering began during late August. An analysis of oil quality and seed characteristics remains to be completed, but harvested grain weights indicated again that main treatment to suffer significant damage was where the entire raceme was removed, leaving plants to regrow completely new flowering structures (Figures 5, 6, 7).
The rate of crop senescence was marginally delayed in the more severe cutting treatments, being 3–5 days behind the undamaged controls, even in the most severe cutting treatment.
Treatment where two-thirds of raceme flowers were removed (top), and 15 days later showing compensation (bottom).
Treatment where entire raceme is removed (top), and 15 days later showing compensation (bottom).
Figure 5: Images of treatments at time of treatment and compensation by the crops 15 days later, near Spring Ridge, Liverpool Plains.
Figure 6:
0
0.3
0.6
0.9
1.2
1.5
1.8
Control 1/3 Racemeflowers removed
2/3 Racemeflowers removed
Whole Racemeflowers removed
Gra
in y
ield
(T/h
a)
Flowering early August
Flowering late August
Mean canola yield for treatments applied soon after first flower during early August (five sites) and late August (three sites), near Spring Ridge, Liverpool Plains. Capped lines denote treatment standard error.
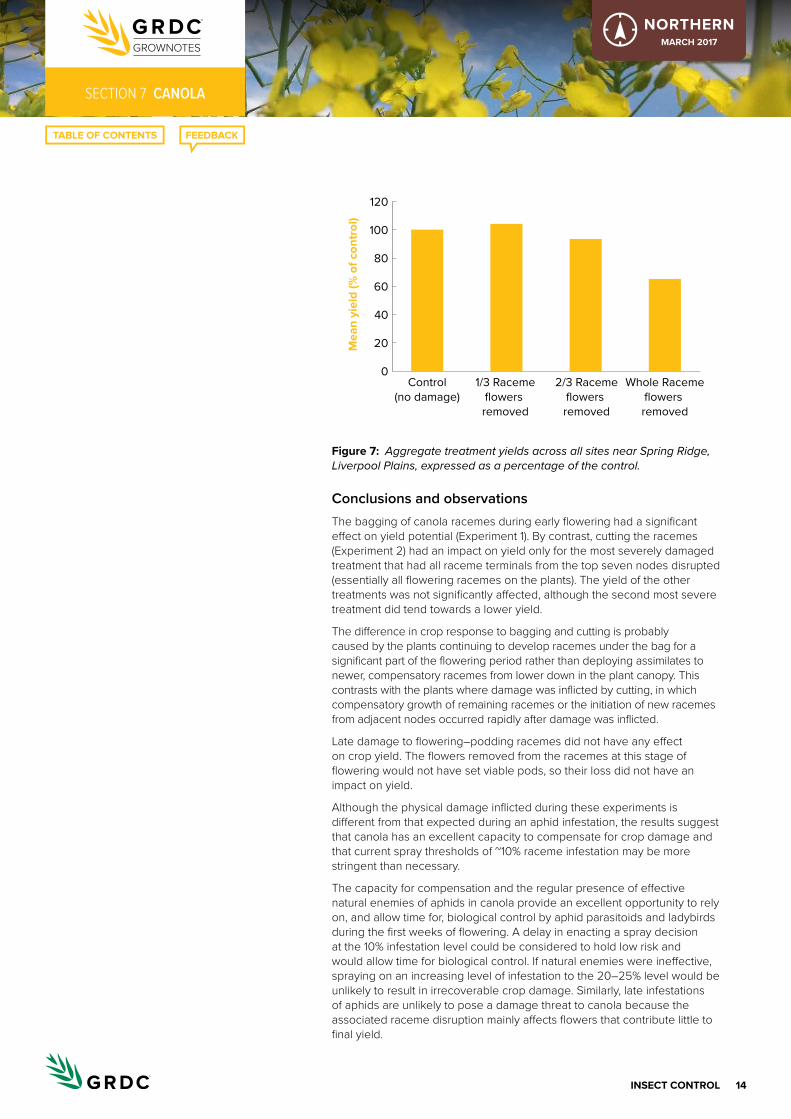
14INSect coNtrol
seCtioN 7 CANOLA
NORTHERNMarch 2017
Figure 7:
0
20
40
60
80
100
120
Control(no damage)
1/3 Racemeflowers removed
2/3 Racemeflowers removed
Whole Racemeflowers removed
Mea
n yi
eld
(% o
f con
trol
)
Aggregate treatment yields across all sites near Spring Ridge, Liverpool Plains, expressed as a percentage of the control.
Conclusions and observationsThe bagging of canola racemes during early flowering had a significant effect on yield potential (Experiment 1). By contrast, cutting the racemes (Experiment 2) had an impact on yield only for the most severely damaged treatment that had all raceme terminals from the top seven nodes disrupted (essentially all flowering racemes on the plants). The yield of the other treatments was not significantly affected, although the second most severe treatment did tend towards a lower yield.
The difference in crop response to bagging and cutting is probably caused by the plants continuing to develop racemes under the bag for a significant part of the flowering period rather than deploying assimilates to newer, compensatory racemes from lower down in the plant canopy. This contrasts with the plants where damage was inflicted by cutting, in which compensatory growth of remaining racemes or the initiation of new racemes from adjacent nodes occurred rapidly after damage was inflicted.
Late damage to flowering–podding racemes did not have any effect on crop yield. The flowers removed from the racemes at this stage of flowering would not have set viable pods, so their loss did not have an impact on yield.
Although the physical damage inflicted during these experiments is different from that expected during an aphid infestation, the results suggest that canola has an excellent capacity to compensate for crop damage and that current spray thresholds of ~10% raceme infestation may be more stringent than necessary.
The capacity for compensation and the regular presence of effective natural enemies of aphids in canola provide an excellent opportunity to rely on, and allow time for, biological control by aphid parasitoids and ladybirds during the first weeks of flowering. A delay in enacting a spray decision at the 10% infestation level could be considered to hold low risk and would allow time for biological control. If natural enemies were ineffective, spraying on an increasing level of infestation to the 20–25% level would be unlikely to result in irrecoverable crop damage. Similarly, late infestations of aphids are unlikely to pose a damage threat to canola because the associated raceme disruption mainly affects flowers that contribute little to final yield.

15INSect coNtrol
seCtioN 7 CANOLA
NORTHERNMarch 2017
Further study is planned for 2015 to determine a better linkage between the simulated damage in these experiments and actual damage caused by aphids in highly controlled, small-plot experiments, so that a definitive recommendation can be made on aphid thresholds. In the interim, the work suggests that the use of the 10% raceme infestation as a spray threshold is very conservative. 19
7.7 rutherglen bug
Rutherglen bug (RGB) is present in canola crops as they are filling pods and maturing. The RGB lay eggs in the soil (up to 400 eggs per female), resulting in an explosion of nymphs in 2–4 weeks after the adult RGB are seen. Although not typical, nymphs will move up the plants and onto the pods. More commonly they remain on the soil and base of plants. Where canola is windrowed, the nymphs may move to shelter under the windrows and feed on the shed seed. The risk of RGB damage to seed through direct feeding is not well understood and warrants research. Overseas research suggests that the risk of impact on grain (oil content/quality) decreases as the crop matures and dries down. 20
7.8 Helicoverpa
Helicoverpa (also known as heliothis) caterpillars are an occasional pest of canola in southern NSW and may require control measures if they are present in large numbers. In central and northern NSW, they are a more frequent pest. Because of the seasonal variation in incidence and timing of infestation relative to crop growth stage, growers should seek advice and check the harvest WHP of the chosen insecticide before deciding to spray.
Corn earworm (Helicoverpa armigera) and native budworm (H. punctigera) are the two pest species of field crops and may be present from mid-September onward. Corn earworm is likely to predominate between February and May.
19 M Miles, P Grundy, A Quade, R Lloyd (2015) Insect management in in fababeans and canola recent research. GRDC Update Papers 25 February 2015, http://grdc.com.au/Research-and-Development/GRDC-Update-Papers/2015/02/Insect-management-in-fababeans-and-canola-recent-research
20 M Miles, A Quade, R Lloyd, P Grundy (2016) Recent insect pest management research findings and the application of results in the field. GRDC Update Papers 23 February 2016, https://grdc.com.au/Research-and-Development/GRDC-Update-Papers/2016/02/Recent-insect-pest-management-research-findings-and-the-application-of-results-in-the-field
i MORE INFORMATION
insect management in faba beans and canola recent research
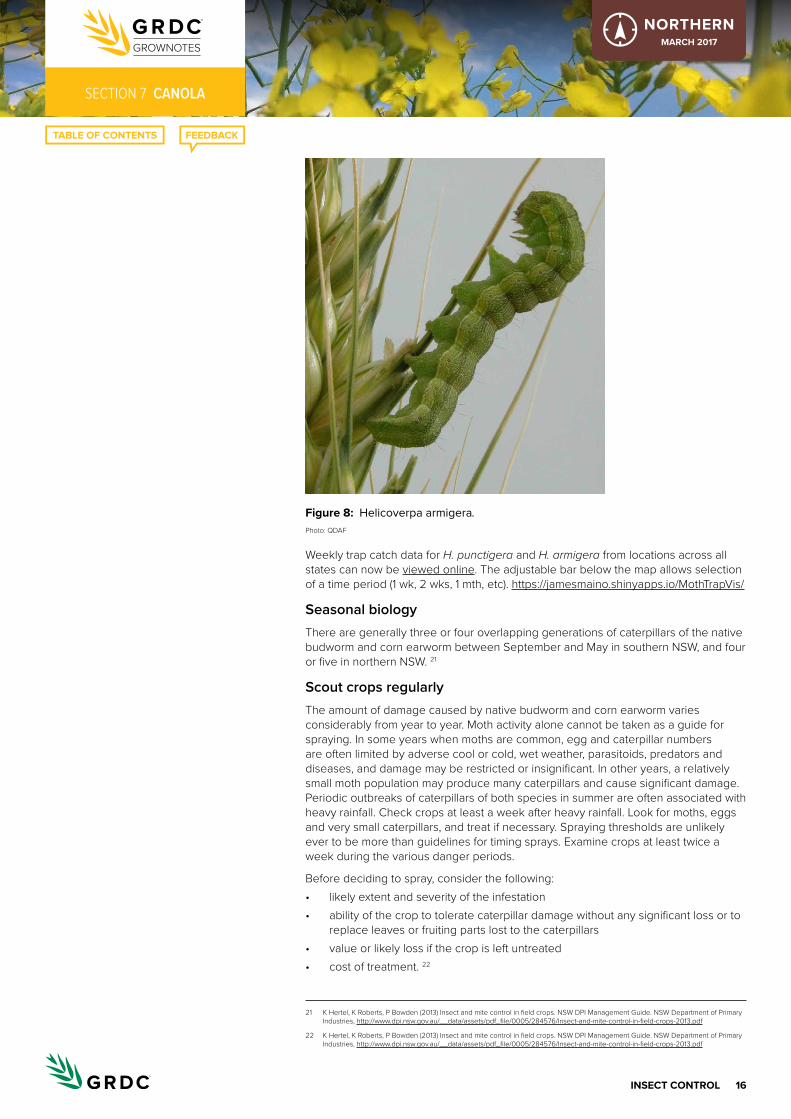
16INSect coNtrol
seCtioN 7 CANOLA
NORTHERNMarch 2017
Figure 8: Helicoverpa armigera.Photo: QDAF
Weekly trap catch data for H. punctigera and H. armigera from locations across all states can now be viewed online. The adjustable bar below the map allows selection of a time period (1 wk, 2 wks, 1 mth, etc). https://jamesmaino.shinyapps.io/MothTrapVis/
Seasonal biology There are generally three or four overlapping generations of caterpillars of the native budworm and corn earworm between September and May in southern NSW, and four or five in northern NSW. 21
Scout crops regularly The amount of damage caused by native budworm and corn earworm varies considerably from year to year. Moth activity alone cannot be taken as a guide for spraying. In some years when moths are common, egg and caterpillar numbers are often limited by adverse cool or cold, wet weather, parasitoids, predators and diseases, and damage may be restricted or insignificant. In other years, a relatively small moth population may produce many caterpillars and cause significant damage. Periodic outbreaks of caterpillars of both species in summer are often associated with heavy rainfall. Check crops at least a week after heavy rainfall. Look for moths, eggs and very small caterpillars, and treat if necessary. Spraying thresholds are unlikely ever to be more than guidelines for timing sprays. Examine crops at least twice a week during the various danger periods.
Before deciding to spray, consider the following: • likely extent and severity of the infestation• ability of the crop to tolerate caterpillar damage without any significant loss or to
replace leaves or fruiting parts lost to the caterpillars• value or likely loss if the crop is left untreated• cost of treatment. 22
21 K Hertel, K Roberts, P Bowden (2013) Insect and mite control in field crops. NSW DPI Management Guide. NSW Department of Primary Industries, http://www.dpi.nsw.gov.au/__data/assets/pdf_file/0005/284576/Insect-and-mite-control-in-field-crops-2013.pdf
22 K Hertel, K Roberts, P Bowden (2013) Insect and mite control in field crops. NSW DPI Management Guide. NSW Department of Primary Industries, http://www.dpi.nsw.gov.au/__data/assets/pdf_file/0005/284576/Insect-and-mite-control-in-field-crops-2013.pdf

17INSect coNtrol
seCtioN 7 CANOLA
NORTHERNMarch 2017
Spray eggs and very small caterpillars, particularly of the corn earworm Corn earworm has developed resistance to many of the pesticides used against it, but the eggs and very small caterpillars (up to 5 mm long) can still be killed if the correct rate of pesticide is used. However, larger caterpillars are not likely to be controlled. 23
7.8.1 corn earworm In NSW, corn earworm is largely restricted to within ~150 km of the coast and to inland, irrigated summer-crop production areas. Unlike native budworm, it mainly overwinters locally as pupae in the soil. These pupae are the source of the moths that produce the spring and summer generations of caterpillars. The moths are not strong fliers but can be carried for long distances by wind. They usually initiate infestations locally—within ~100 km of where they developed as caterpillars. During summer, corn earworm moths may be carried by wind into southern NSW from areas to the north (or into northern NSW from southern Queensland) and initiate infestations in crops over a wide area. Pheromone traps or lights do not always attract moths. There may be no forewarning of a probable outbreak of corn earworm unless growers regularly inspect crops to detect moths.
7.8.2 Native budworm Native budworm is widely distributed throughout mainland Australia and during winter breeds in semi-arid parts of Western Australia, South Australia and south-west Queensland. These vast inland areas are the sources of the moths that produce the spring generation of caterpillars in NSW (local overwintering pupae in the ground are of little concern). The moths are strong fliers and may be carried for very long distances by wind, to initiate infestations in localities far from where they developed as caterpillars.
7.8.3 Descriptions of corn earworm and native budworm eggs and caterpillars Eggs Newly laid eggs are white or yellowish white, dome-shaped, flattened at the base, ribbed and 0.5 mm in diameter. Not all eggs are fertile. Fertile and infertile eggs are laid at the same time, and sometimes all eggs laid are infertile. Fertile eggs change to greenish yellow with an irregular brown or reddish brown ring around the middle. Before hatching, the blackish head and grey body of the caterpillar shows through. They hatch in 3–5 days in warm weather and 6–16 days in cooler weather. Infertile eggs appear cylindrical within ~12 h of being laid and then shrivel to a pyramid shape.
Caterpillars Newly hatched caterpillars are 1–1.5 mm long with dark heads and dark-spotted white bodies. Young caterpillars up to about 15 mm long have dark heads and pale yellow, greenish or brownish bodies with conspicuous upper body hairs in dark bases and, often, narrow dark stripes down the back and along each side. Older caterpillars up to 50 mm long vary greatly in colour from yellow to almost black, often have a broad pale stripe along each side, and their upper body hairs are usually on raised processes.
Egg laying Egg laying is usually confined to the period from flower bud formation until flowering ends. When moths are exceptionally abundant, infestation can be expected before flowering commences. Eggs are laid, usually singly, on the upper parts of plants—
23 K Hertel, K Roberts, P Bowden (2013) Insect and mite control in field crops. NSW DPI Management Guide. NSW Department of Primary Industries, http://www.dpi.nsw.gov.au/__data/assets/pdf_file/0005/284576/Insect-and-mite-control-in-field-crops-2013.pdf

18INSect coNtrol
seCtioN 7 CANOLA
NORTHERNMarch 2017
vegetative or floral growing points, young tender leaves, stems and flower buds, flowers and fruits. The moths prefer the more advanced and succulent portions of crops for egg laying and usually avoid poorly grown areas. Eggs may not be obvious to the untrained eye because of their minuteness. However, moderate to heavy egg lays should be obvious to trained observers. 24
7.8.4 resistance-management strategy Corn earworm has developed resistance to the pyrethroid chemical group (e.g. Decis Options®, Karate®), and the carbamate group (e.g. Lannate® L). However, very small caterpillars (up to 5 mm long) can still be controlled with these and other pesticides. New chemical groups are now available for the control of corn earworm, but often control is slower.
Corn earworm caterpillars are found in all irrigation areas. Their main activity is in summer and autumn. Local overwintering pupae are the main source of new infestations each year.
The following strategies are recommended across all cotton and grain industries:1. Destroying the overwintering pesticide resistant pupae• Corn earworm overwinters as pupae in the soil under crop stubble and moths
emerge from the pupae in the following spring. • Insecticide resistance is carried over between seasons in the pupae. • Where large Helicoverpa caterpillars are present in crops during March, there
is a risk of carryover of resistance to the next season. Cultivate these paddocks to destroy the pupae as soon after harvest as possible and complete by the end of August.
• Check no-till, late-season crops for pupae. Consider busting if detectable numbers (1 pupa/10 m) are present.
• Ensure that cultivation creates full disturbance to at least 10 cm deep as follows: on hills, to 10 cm each side of the plant line; on beds, right across the bed to 20 cm beyond the outside rows; on the flat, the whole area.
2. Scout crops regularly • Monitor crops twice weekly during danger periods to detect eggs and very
small (up to 5 mm long) caterpillars. Infestations are often associated with heavy rainfall.
• Use advisors for monitoring, because moth activity alone cannot be taken as a guide for spraying and eggs are not readily seen with the naked eye—they are small and often hidden.
• Pay closer attention to late season H. armigera activity on susceptible crops (cotton, summer pulses, late sorghum and late sunflowers).
3. Spray eggs and very small caterpillars • Spray to control the eggs and very small (up to 5 mm long) caterpillars. The
chemical must make contact with the eggs and caterpillars. • Egg laying is usually confined to the period from flower bud formation until
flowering ends. At 25°C, it takes 8–10 days from egg lay to 5 mm long caterpillars. 25
4. Pesticide management • Conserve beneficials by using the most selective pesticide available, including
appropriate use of NPV products (e.g. Vivus Gold®). • Monitor natural enemies and be aware that their activity varies depending on
crop types (e.g. they are not very active in chickpeas).
24 K Hertel, K Roberts, P Bowden (2013) Insect and mite control in field crops. NSW DPI Management Guide. NSW Department of Primary Industries, http://www.dpi.nsw.gov.au/__data/assets/pdf_file/0005/284576/Insect-and-mite-control-in-field-crops-2013.pdf
25 K Hertel, K Roberts, P Bowden (2013) Insect and mite control in field crops. NSW DPI Management Guide. NSW Department of Primary Industries, http://www.dpi.nsw.gov.au/__data/assets/pdf_file/0005/284576/Insect-and-mite-control-in-field-crops-2013.pdf

19INSect coNtrol
seCtioN 7 CANOLA
NORTHERNMarch 2017
• Delay the use of disruptive pesticides (pyrethroids, carbamates and organophosphates) in all crops for as long as possible. Review spraying thresholds as a guide to spray timing.
• Where Helicoverpa populations are present and above threshold, control them within the limits of insect resistance and available registrations. Ensure that spray applications are accurate and timely. Do not spray in the heat of the day. Use an NPV product (e.g. Vivus Gold®) where appropriate to reduce selection for insecticide resistance, but caterpillars must be small (5–10 mm), the product must be applied in the evening, and there should be no rainfall within 24 h. Apply NPV as high-volume spray (with a wetting agent) at 30 L/ha aerially and 100 L/ha by a ground-rig.
• Rotate chemical groups when spraying crops. If more than one spray is needed, use a pesticide from each of the three available groups (organochlorines, synthetic pyrethroids and carbamates) in rotation. Never apply two consecutive sprays from the same chemical group. For example, if a pyrethroid is used to control sorghum midge do not use a pyrethroid to control Helicoverpa.
• Remove all farm vegetation likely to encourage the breeding of insect pests. For example, destroy failed or abandoned crops by cultivation or by using herbicides immediately the decision to abandon has been made. Avoid sowing commercial chickpea crops after June. Late flowering crops are a known host for the next generation of H. armigera.
• Use ovicide rates of pesticides only where crops are monitored regularly for eggs and larvae and where eggs are targeted.
• Use larvicide (highest) rates where there is no regular crop monitoring and where larvae are targeted. Use information from pheromone traps.
• During August, September and October, pheromone traps will be in place in some districts. Information gained will indicate whether more detailed sampling of spring host crops (e.g. winter cereals, pulses and weeds) is necessary.
• Advisers or growers wanting assurance on the numbers of corn earworm moths laying eggs in their crops should catch moths in a sweep net and determine their identity. (Moths collected in pheromone traps are a poor indicator of which species of larvae will predominate in crops.) As a guide, catch at least 30 Helicoverpa spp. moths at random throughout the crop and on flowering weeds in the paddock (ignore the other moths such as tobacco loopers, brown cutworms and common armyworms that may fly in company with the native budworms). 26
7.8.5 Preliminary threshold for Helicoverpa in canolaTo date, thresholds available for managing Helicoverpa in canola have been based on ‘best guesses’. In 2015 QDAF researchers conducted a replicated trial to determine the consumption rate of Helicoverpa larvae in canola. A consumption rate is a vital component of an economic threshold, and is an estimate of the yield and crop loss likely to occur. It is calculated from the lifetime consumption of a larva. In other words, it is a reflection of the amount of yield loss that would occur if the larva was not controlled. 27
The trial involved confining individual larvae on canola racemes and allowing them to feed until they pupated. These data were compared with data from racemes that had no Helicoverpa feeding. In summary, results of the trial are:
i) The consumption rate of a Helicoverpa larva is estimated to be 2.4 grams of grain per larva.
ii) On average a larva damaged 10.5 pods and consumed 124 seeds.
26 K Hertel, K Roberts, P Bowden (2013) Insect and mite control in field crops. NSW DPI Management Guide. NSW Department of Primary Industries, http://www.dpi.nsw.gov.au/__data/assets/pdf_file/0005/284576/Insect-and-mite-control-in-field-crops-2013.pdf
27 M Miles, A Quade, R Lloyd, P Grundy (2016) Recent insect pest management research findings and the application of results in the field. GRDC Update Papers 23 February 2016, https://grdc.com.au/Research-and-Development/GRDC-Update-Papers/2016/02/Recent-insect-pest-management-research-findings-and-the-application-of-results-in-the-field
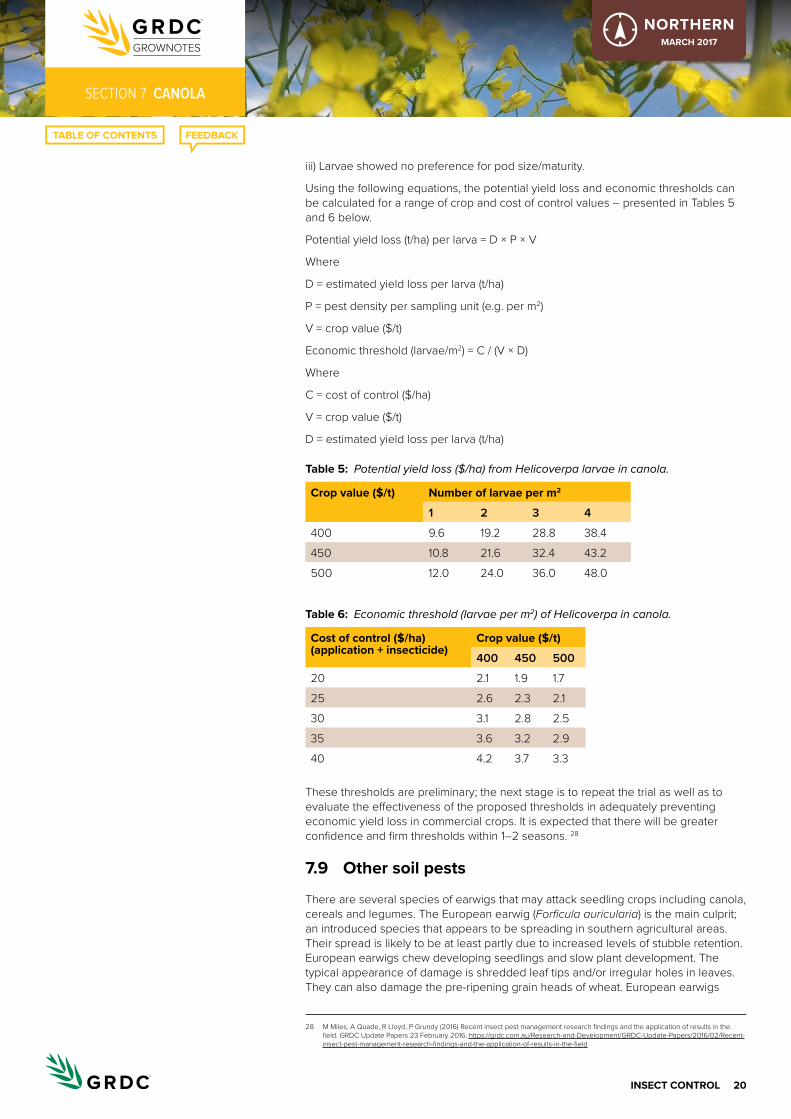
20INSect coNtrol
seCtioN 7 CANOLA
NORTHERNMarch 2017
iii) Larvae showed no preference for pod size/maturity.
Using the following equations, the potential yield loss and economic thresholds can be calculated for a range of crop and cost of control values – presented in Tables 5 and 6 below.
Potential yield loss (t/ha) per larva = D × P × V
Where
D = estimated yield loss per larva (t/ha)
P = pest density per sampling unit (e.g. per m2)
V = crop value ($/t)
Economic threshold (larvae/m2) = C / (V × D)
Where
C = cost of control ($/ha)
V = crop value ($/t)
D = estimated yield loss per larva (t/ha)
table 5: Potential yield loss ($/ha) from Helicoverpa larvae in canola.
crop value ($/t) Number of larvae per m2
1 2 3 4
400 9.6 19.2 28.8 38.4
450 10.8 21.6 32.4 43.2
500 12.0 24.0 36.0 48.0
table 6: Economic threshold (larvae per m2) of Helicoverpa in canola.
cost of control ($/ha) (application + insecticide)
crop value ($/t)
400 450 500
20 2.1 1.9 1.7
25 2.6 2.3 2.1
30 3.1 2.8 2.5
35 3.6 3.2 2.9
40 4.2 3.7 3.3
These thresholds are preliminary; the next stage is to repeat the trial as well as to evaluate the effectiveness of the proposed thresholds in adequately preventing economic yield loss in commercial crops. It is expected that there will be greater confidence and firm thresholds within 1–2 seasons. 28
7.9 other soil pests
There are several species of earwigs that may attack seedling crops including canola, cereals and legumes. The European earwig (Forficula auricularia) is the main culprit; an introduced species that appears to be spreading in southern agricultural areas. Their spread is likely to be at least partly due to increased levels of stubble retention. European earwigs chew developing seedlings and slow plant development. The typical appearance of damage is shredded leaf tips and/or irregular holes in leaves. They can also damage the pre-ripening grain heads of wheat. European earwigs
28 M Miles, A Quade, R Lloyd, P Grundy (2016) Recent insect pest management research findings and the application of results in the field. GRDC Update Papers 23 February 2016, https://grdc.com.au/Research-and-Development/GRDC-Update-Papers/2016/02/Recent-insect-pest-management-research-findings-and-the-application-of-results-in-the-field
21INSect coNtrol
seCtioN 7 CANOLA
NORTHERNMarch 2017
range from 12–20 mm long, are smooth and shiny dark brown in colour with pale yellow legs.
It is important to distinguish earwig species in order to make the most appropriate management decision and accurately assess the risk of attack to emerging crop seedlings. For example, there is one native species, the common brown earwig (Labidura truncata), which is exclusively a beneficial insect that feeds on soft-bodied insects such as caterpillars, lucerne flea and mites. The common brown earwig can be distinguished by the presence of an orange coloured triangle behind the head on the elytra or ‘wing-case’.
Control options for earwigs are limited but there is good evidence that insecticide seed treatments with fipronil will help crop seedlings withstand attack. Cracked grain baits (wheat, sorghum, corn) containing chlorpyrifos and sunflower/vegetable oil may also be used to control pest earwigs in some states. 29
A number of soil dwelling insect pests such as cutworms, wireworms, bronzed field beetle, cockchafers and false wireworms have damaged emerging canola seedlings in recent years. In severe cases, plant stands can be thinned to such an extent that the paddock requires re-sowing. Occurrence of these pests is difficult to predict, so advice on their control should be sought before sowing if any problems are foreseen. The most severe damage tends to occur in crops following pasture, or where stubble has been retained. 30
29 G McDonald, A Govender, P Umina (2016) Pest wrap up 2015 establishment pests, aphids, caterpillars and beneficials. GRDC Update Papers 16 February 2016, https://grdc.com.au/Research-and-Development/GRDC-Update-Papers/2016/02/Pest-wrap-up-2015-establishment-pests-aphids-caterpillars-and-beneficials
30 P Matthews, D McCaffery, L Jenkins (2016) Winter crop variety sowing guide 2016. NSW DPI Management Guide. NSW Department of Primary Industries, http://www.dpi.nsw.gov.au/__data/assets/pdf_file/0011/272945/winter-crop-variety-sowing-guide-2016.pdf
1NeMatoDe MaNageMeNt
seCtioN 8 CANOLA
NORTHERNMarch 2017
Nematode management8.1 Background
Root-lesion nematodes (RLN) can have an impact on canola growth (Figure 1). However, following harvest, levels of the RLN Pratylenchus neglectus (Pn) have been found to decline rapidly, due to the release of isothiocyanates from the decomposing root tissue. Sulfur-deficient or stressed crops are more likely to host increasing nematode numbers during the season and have less effect on their decline at the end of the season. 1
The hosting ability of canola is low–medium for P. thornei (Pt) and medium–high for Pn.
Testing soil is the only reliable way to determine whether RLN are present in a paddock. Before planting, soil tests can be carried out by PreDicta B (SARDI Diagnostic Services) through accredited agronomists to establish whether crops are at risk and whether alternative crop types or varieties should be grown. Growing-season tests can be carried out on affected plants and associated soil; contact local state departments of agriculture and PreDicta B. 2
1 L. Serafin, J Holland, R Bambach, D McCaffery (2005) Canola: northern NSW planting guide. NSW Department of Primary Industries, http://www.dpi.nsw.gov.au/__data/assets/pdf_file/0016/148300/canola-northern-NSW-planting-guide.pdf
2 GRDC (2015) Root-lesion nematodes. GRDC Tips and Tactics, February 2015, http://www.grdc.com.au/TT-RootLesionNematodes
i MORE INFORMATION
Managing root lesion nematodes: how important are crop and variety choice?
Root-lesion nematodes

2NeMatoDe MaNageMeNt
seCtioN 8 CANOLA
NORTHERNMarch 2017
Figure 1:
Nematodes rehydrate and become active following rains and invade growing plant roots
Nematode invades the outer layers of the root (cortex)
Stele
Nematode feeding may cause cortical tissue to turn brown, collapse and breakdown
Eggs laid in roots
Eggs laid in soil
Nematodes reproduce and migrate within roots and soil
Stage 1 moults within eggs
All stages attack roots
There may be several generations of nematodes each growing season
Stage 2 larvaeStage 3 larvaeStage 4 larvae
Adult
All stages of nematodes can survive betweeen crops within root pieces or in a desiccated state
Disease cycle of root-lesion nematode. Adapted from: GN Agrios (1997) Plant pathology, 5th edn. 3
Illustration: Kylie Fowler
IN FOCUS8.2 Impact of crop varieties on rlN multiplication
8.2.1 take-home messages• Know your enemy—soil test to determine whether RLN are a problem,
and which species are present.• Select wheat varieties with high tolerance ratings to minimise yield
losses in RLN infected paddocks.• To manage RLN populations, it is important to increase the frequency
of RLN-resistant crops in the rotation.• Multiple resistant crops in a rotation will be necessary for long-term
management of RLN populations.• There are consistent varietal differences in Pt resistance within wheat
and chickpea varieties.• Avoid crops or varieties that allow the build-up of large populations of
RLN in infected paddocks.• Monitor the impact of your rotation. 4
3 GRDC (2015) Root-lesion nematodes. GRDC Tips and Tactics, February 2015, http://www.grdc.com.au/TT-RootLesionNematodes
4 B Burton (2015) Impact of crop varieties on RLN multiplication. GRDC Update Papers, 1 March 2015, http://grdc.com.au/Research-and-Development/GRDC-Update-Papers/2015/03/Impact-of-crop-varieties-on-RLN-multiplication

3NeMatoDe MaNageMeNt
seCtioN 8 CANOLA
NORTHERNMarch 2017
8.2.2 What are nematodes?Nematodes (or roundworms) are one of the most abundant life forms on earth. They are adapted to nearly all environments. In cropping situations, they can range from beneficial to detrimental to plant health.
The RLN are a genus (Pratylenchus) of microscopic, plant-parasitic nematode that are soil-borne, ~0.5–0.75 mm in length and will feed and reproduce inside roots of susceptible crops or plants. Of the two common species of RLN in the northern grains region, Pt and Pn, the former is often described as the cereal and legume RLN. 5
8.2.3 Why the focus on P. thornei?• The species is widespread in the northern grains region. Surveys
conducted within northern NSW and southern Queensland cropping areas consistently show Pt presence in ~60–70% of paddocks.
• The species frequently occurs at concerning levels; >2 Pt/g soil are found in ~30–40% of paddocks.
• Yield losses in wheat of up to 50% can occur when Pt-intolerant wheat varieties are grown in paddocks infested with Pt.
• Yield losses in chickpeas of up to 20% have also been measured in Department of Agriculture, Fisheries and Forestry Queensland (QDAF) trials.
• There is no easy solution to RLN infestation. Variety and crop rotation are the current major management tools.
Figure 2 is a simplified chart highlighting that the critical first step in the management of RLN is to test the soil and determine whether there is a problem to manage. Where RLN are present, growers should focus on planting tolerant wheat varieties and on increasing the number of resistant crops or varieties in the rotation. 6
Figure 2:
Soil test for RLN
No RLN detectedFocus on hygiene to
avoid incursions (NB flooding is a risk)
Plant tolerant wheat varieties
Increase number of resistant crops
or varieties
Crop and variety choices not limited by
RLN characteristics
Ensure adequate crop
nutrition
Monitor for eectiveness
of rotation
Focus on hygiene to avoid spread to clean
paddocks
Increase fallow lengths
RLN detected
Management flow chart for root-lesion nematode.
5 B Burton (2015) Impact of crop varieties on RLN multiplication. GRDC Update Papers, 1 March 2015, http://grdc.com.au/Research-and-Development/GRDC-Update-Papers/2015/03/Impact-of-crop-varieties-on-RLN-multiplication
6 B Burton (2015) Impact of crop varieties on RLN multiplication. GRDC Update Papers, 1 March 2015, http://grdc.com.au/Research-and-Development/GRDC-Update-Papers/2015/03/Impact-of-crop-varieties-on-RLN-multiplication
4NeMatoDe MaNageMeNt
seCtioN 8 CANOLA
NORTHERNMarch 2017
8.2.4 Soil testingThe first step in the management of RLN is to test the soil and determine whether the problem is present. Testing of soil samples is most commonly conducted via DNA analysis (commercially available as the PreDicta B test from SARDI) with sampling to depths of 0–15 or 0–30 cm.
Vertical distribution of Pt in soil is variable. Some paddocks have relatively uniform populations down to 30 or 60 cm, some will have highest Pt counts in the 0–15 cm layer, whereas other paddocks will have Pt populations increasing at greater depths (e.g. 30–60 cm). Although detailed knowledge of the distribution may be of some value, most on-farm management decisions will be based on the presence or absence of Pt, with sampling at 0–15 or 0–30 cm depth providing that information. 7
To organise testing and sending of soil samples, visit the PreDicta B website.
For testing and interpretation of results contact: Rob Long, Crown Analytical Services 0437 996 678 [email protected]
8.3 Management of rlN• Nematicides. There are no registered nematicides for RLN in broadacre cropping
in Australia. Screening of candidates continues, but RLN are a very difficult target with populations frequently deep in the soil profile.
• Nutrition. Damage from RLN reduces the ability of cereal roots to access nutrients and soil moisture and can induce nutrient deficiencies. Under-fertilising is likely to exacerbate RLN yield impacts; however, over-fertilising is still unlikely to compensate for a poor variety choice.
• Variety choice and crop rotation. These are currently the most effective management tools for RLN. Note that the focus is on two different characteristics: tolerance, which is the ability of the variety to yield under RLN pressure; and resistance, which is the impact of the variety on the build-up of RLN populations. Varieties and crops often have different tolerance and resistance levels to Pt and Pn.
• Fallow. RLN populations will generally decrease during a ‘clean’ fallow, but the process is slow and expensive in lost ‘potential’ income. Additionally, long fallows may decrease levels of arbuscular mycorrhizal fungi (AMF) and create more cropping problems than they solve. 8
Resistance differences between winter cropsThe primary method of managing RLN populations is to increase the number of resistant crops in the rotation. Knowledge of the species of RLN present is critical, because crops that are resistant to Pt may be susceptible to Pn. Canola is generally considered resistant or moderately resistant to Pt, along with sorghum, sunflowers, maize, canary seed, cotton and linseed. Wheat, barley, chickpeas, faba beans, mungbeans and soybeans are generally susceptible, although the level of susceptibility may vary between varieties. Field peas have been considered resistant; however, many newer varieties appear more susceptible. Figure 3 shows the mean Pt population remaining after a range of winter crops were grown near Weemelah in 2011. Crops were sown in individual trials to enable weed and pest control, and so
7 B Burton (2015) Impact of crop varieties on RLN multiplication. GRDC Update Papers, 1 March 2015, http://grdc.com.au/Research-and-Development/GRDC-Update-Papers/2015/03/Impact-of-crop-varieties-on-RLN-multiplication
8 B Burton (2015) Impact of crop varieties on RLN multiplication. GRDC Update Papers, 1 March 2015, http://grdc.com.au/Research-and-Development/GRDC-Update-Papers/2015/03/Impact-of-crop-varieties-on-RLN-multiplication
i MORE INFORMATION
Variety choice and crop rotation key to managing root lesion nematodes
impact of crop varieties on RLN multiplication
Ground Cover Radio 121: analysis underlines value of Predicta B for cropping decisions
i MORE INFORMATION
GRDC Update Paper: summer cropping options to manage root lesion nematodes
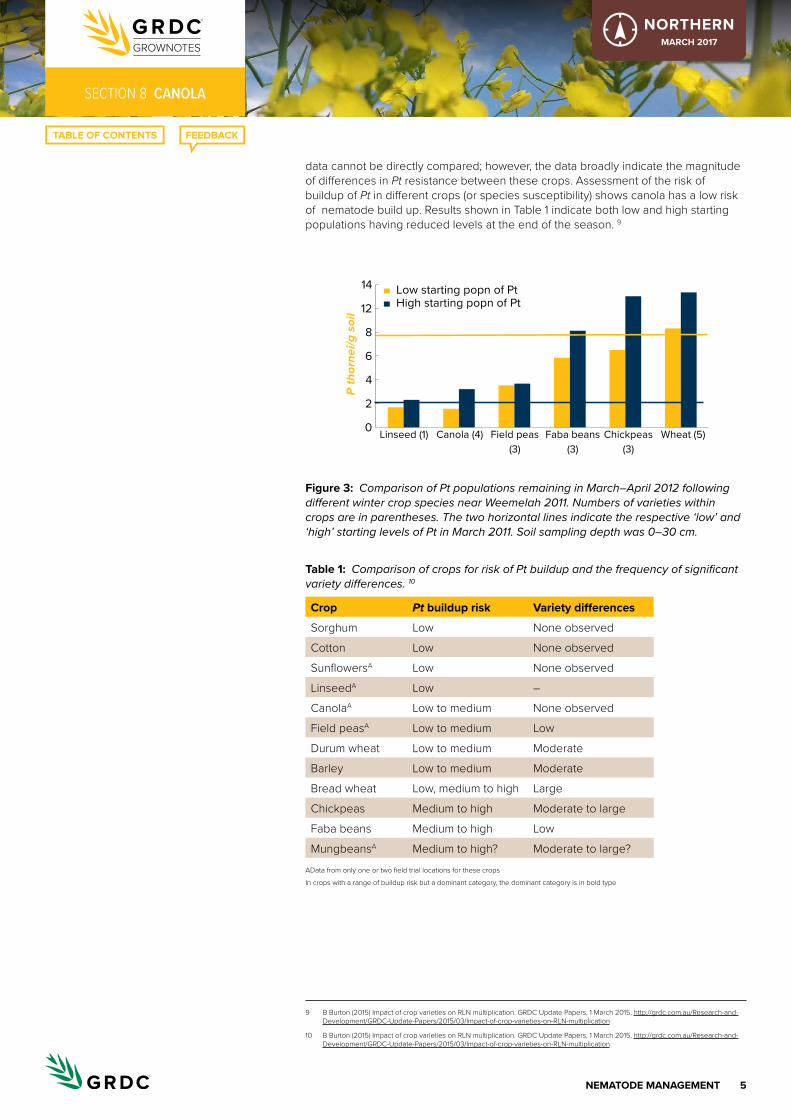
5NeMatoDe MaNageMeNt
seCtioN 8 CANOLA
NORTHERNMarch 2017
data cannot be directly compared; however, the data broadly indicate the magnitude of differences in Pt resistance between these crops. Assessment of the risk of buildup of Pt in different crops (or species susceptibility) shows canola has a low risk of nematode build up. Results shown in Table 1 indicate both low and high starting populations having reduced levels at the end of the season. 9
Figure 3:
Linseed (1) Canola (4) Field peas(3)
Faba beans(3)
Chickpeas(3)
Wheat (5)0
2
4
6
8
12
14
P th
orne
i/g s
oil
Low starting popn of PtHigh starting popn of Pt
Comparison of Pt populations remaining in March–April 2012 following different winter crop species near Weemelah 2011. Numbers of varieties within crops are in parentheses. The two horizontal lines indicate the respective ‘low’ and ‘high’ starting levels of Pt in March 2011. Soil sampling depth was 0–30 cm.
table 1: Comparison of crops for risk of Pt buildup and the frequency of significant variety differences. 10
crop Pt buildup risk Variety differences
Sorghum Low None observed
Cotton Low None observed
SunflowersA Low None observed
LinseedA Low –
CanolaA Low to medium None observed
Field peasA Low to medium Low
Durum wheat Low to medium Moderate
Barley Low to medium Moderate
Bread wheat Low, medium to high Large
Chickpeas Medium to high Moderate to large
Faba beans Medium to high Low
MungbeansA Medium to high? Moderate to large?AData from only one or two field trial locations for these crops
In crops with a range of buildup risk but a dominant category, the dominant category is in bold type
9 B Burton (2015) Impact of crop varieties on RLN multiplication. GRDC Update Papers, 1 March 2015, http://grdc.com.au/Research-and-Development/GRDC-Update-Papers/2015/03/Impact-of-crop-varieties-on-RLN-multiplication
10 B Burton (2015) Impact of crop varieties on RLN multiplication. GRDC Update Papers, 1 March 2015, http://grdc.com.au/Research-and-Development/GRDC-Update-Papers/2015/03/Impact-of-crop-varieties-on-RLN-multiplication

6NeMatoDe MaNageMeNt
seCtioN 8 CANOLA
NORTHERNMarch 2017
Key points• Test soil for nematodes and plan crop rotations that target the species identified.• Resistant crops will reduce high root-lesion nematode populations but several
consecutive resistant crops and fallow may be needed to reduce very high populations.
• Tolerant crops can produce good yields when root-lesion nematodes are present but try to select tolerant varieties with high levels of resistance to have the biggest impact. 11
11 K Owen, T Clewett, J Sheedy, J Thompson (2016) Managing grain crops in nematode infested fields to minimise loss and optimise profit. GRDC Update Papers 2 March 2016, https://grdc.com.au/Research-and-Development/GRDC-Update-Papers/2016/03/Managing-grain-crops-in-nematode-infested-fields-to-minimise-loss-and-optimise-profit
1DISeaSeS
seCtioN 9 CANOLA
NORTHERNMarch 2017
Diseases9.1 Major canola diseases
Blackleg (caused by Leptosphaeria maculans) and Sclerotinia stem rot (caused by Sclerotinia sclerotiorum) are two major diseases of canola. Blackleg is less prevalent in northern NSW and Queensland; however, it is critical that blackleg be controlled by growing resistant varieties and having a 3-year break between crops to allow all the stubble to be broken down. Chemical treatment is available if considered necessary.
Several seed dressings only provide suppression of the blackleg fungus, for example those with the active ingredient (a.i.) fluquinconazole (Jockey®, Quantum®, Prowess™), whereas Maxim®XL (a.i.s fludioxonil + metalaxyl-M) provides suppression of blackleg as well as control of Pythium spp. and Rhizoctonia solani.
Impact®, Bayonet® and Jubilee® (a.i. flutriafol) are in-furrow treatments registered for the control of blackleg.
Sclerotinia stem rot is favoured by wet springs that produce cool, humid conditions in dense crops. Most broadleaf crops and many broadleaf weeds are hosts of Sclerotinia, including sunflowers (Figure 1). 1 Growers are advised to incorporate infected residues, maintain farm hygiene, control hosts and rotate with summer/winter cereal crops. 2
Symptoms include fluffy external growth on the stems, in which numerous black bodies (sclerotia) are found. A possible control measure is a rotation of at least 4 years with no susceptible hosts. 3
1 L Serafin, J Holland, R Bambach, D McCaffery (2005) Canola: northern NSW planting guide. NSW Department of Primary Industries, http://www.dpi.nsw.gov.au/__data/assets/pdf_file/0016/148300/canola-northern-NSW-planting-guide.pdf
2 L. Alexander, S. Thompson, M. Ryley, L. Serafin (2015), Sunflower Disease Management, Successful sunflower production using integrated disease management, http://www.grdc.com.au/TaT-SunflowerDiseaseManagement
3 L Serafin, J Holland, R Bambach, D McCaffery (2005) Canola: northern NSW planting guide. NSW Department of Primary Industries, http://www.dpi.nsw.gov.au/__data/assets/pdf_file/0016/148300/canola-northern-NSW-planting-guide.pdf
i MORE INFORMATION
Ground Cover Radio 118: Biosecurity lesson in northern disease outbreaks
Ground Cover Radio 116: early action the essence of canola protection

2DISeaSeS
seCtioN 9 CANOLA
NORTHERNMarch 2017
Figure 1: Sunflower crops can host sclerotinea. Photo: Sue Thompson, USQ.
Other fungal diseases reported in northern region canola crops include damping off. These diseases are also hosted by other broadleaf crops and weeds.
In 2013, Sclerotinia stem rot affected about 50% of canola crops in northern NSW. Outbreaks are dependent on the season, but the incidence of outbreaks is increasing in high-risk areas such as the high-rainfall zones of northern NSW, indicating that the level of residual inoculum is increasing, particularly under short rotations. The environmental conditions for development of Sclerotinia stem rot are very specific and will not occur every year, so even when the fungus is present, the disease may fail to develop if conditions are dry.
Blackleg is the most important disease of canola and has been reported as present in the northern region. Around 90% of the spores that infect a crop will originate from the previous year’s stubble. Spores can travel 1–2 km on the wind, but a buffer of at least 500 m from the previous year’s stubble is generally recommended. Two-year-old stubble is an issue only if the seasons have been dry. Treating seed with fungicide can protect seedlings from early infection.
Three virus species, Beet western yellows virus (BWYV, syn. Turnip yellows virus), Turnip mosaic virus (TuMV) and Cauliflower mosaic virus (CaMV), have been recorded in canola in Australia. Of these, BWYV is the most common and has potential to cause yield losses, particularly if infection occurs at seedling stage. Aphids spread these diseases from a range of pasture, crop and weed host species. 4
4 GRDC (2014) Canola disease management in the northern region. GRDC Gound Cover, 21 March 2014, http://grdc.com.au/Media-Centre/Hot-Topics/Canola-disease-management-in-the-northern-region
i MORE INFORMATION
Foliar fungal diseases of pulses and oilseeds
Viral diseases in canola and winter pulses
Canola diseases. the Back Pocket Guide
Canola disease update
sunflower Disease Management
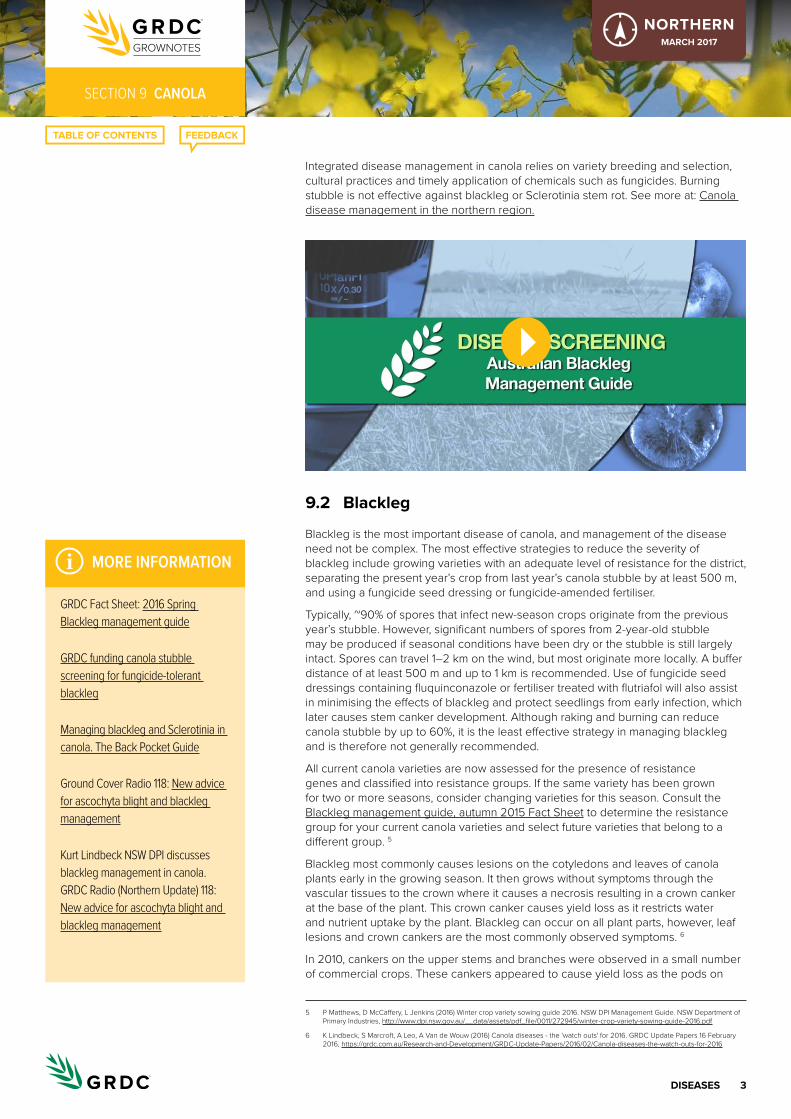
3DISeaSeS
seCtioN 9 CANOLA
NORTHERNMarch 2017
Integrated disease management in canola relies on variety breeding and selection, cultural practices and timely application of chemicals such as fungicides. Burning stubble is not effective against blackleg or Sclerotinia stem rot. See more at: Canola disease management in the northern region.
9.2 Blackleg
Blackleg is the most important disease of canola, and management of the disease need not be complex. The most effective strategies to reduce the severity of blackleg include growing varieties with an adequate level of resistance for the district, separating the present year’s crop from last year’s canola stubble by at least 500 m, and using a fungicide seed dressing or fungicide-amended fertiliser.
Typically, ~90% of spores that infect new-season crops originate from the previous year’s stubble. However, significant numbers of spores from 2-year-old stubble may be produced if seasonal conditions have been dry or the stubble is still largely intact. Spores can travel 1–2 km on the wind, but most originate more locally. A buffer distance of at least 500 m and up to 1 km is recommended. Use of fungicide seed dressings containing fluquinconazole or fertiliser treated with flutriafol will also assist in minimising the effects of blackleg and protect seedlings from early infection, which later causes stem canker development. Although raking and burning can reduce canola stubble by up to 60%, it is the least effective strategy in managing blackleg and is therefore not generally recommended.
All current canola varieties are now assessed for the presence of resistance genes and classified into resistance groups. If the same variety has been grown for two or more seasons, consider changing varieties for this season. Consult the Blackleg management guide, autumn 2015 Fact Sheet to determine the resistance group for your current canola varieties and select future varieties that belong to a different group. 5
Blackleg most commonly causes lesions on the cotyledons and leaves of canola plants early in the growing season. It then grows without symptoms through the vascular tissues to the crown where it causes a necrosis resulting in a crown canker at the base of the plant. This crown canker causes yield loss as it restricts water and nutrient uptake by the plant. Blackleg can occur on all plant parts, however, leaf lesions and crown cankers are the most commonly observed symptoms. 6
In 2010, cankers on the upper stems and branches were observed in a small number of commercial crops. These cankers appeared to cause yield loss as the pods on
5 P Matthews, D McCaffery, L Jenkins (2016) Winter crop variety sowing guide 2016. NSW DPI Management Guide. NSW Department of Primary Industries, http://www.dpi.nsw.gov.au/__data/assets/pdf_file/0011/272945/winter-crop-variety-sowing-guide-2016.pdf
6 K Lindbeck, S Marcroft, A Leo, A Van de Wouw (2016) Canola diseases - the 'watch outs' for 2016. GRDC Update Papers 16 February 2016, https://grdc.com.au/Research-and-Development/GRDC-Update-Papers/2016/02/Canola-diseases-the-watch-outs-for-2016
i MORE INFORMATION
GRDC Fact sheet: 2016 spring Blackleg management guide
GRDC funding canola stubble screening for fungicide-tolerant blackleg
Managing blackleg and sclerotinia in canola. the Back Pocket Guide
Ground Cover Radio 118: New advice for ascochyta blight and blackleg management
Kurt Lindbeck NsW DPi discusses blackleg management in canola. GRDC Radio (Northern Update) 118: New advice for ascochyta blight and blackleg management

4DISeaSeS
seCtioN 9 CANOLA
NORTHERNMarch 2017
affected branches senesced prematurely leading to early pod shatter. Interestingly, preliminary data suggest that stem/branch cankers are not correlated with the presence of traditional crown cankers.
In 2011, 2012 and 2013 cankers on upper stems and branches were observed each year but symptoms were not generally severe. In 2014, the symptoms were more widespread and in some cases caused significant yield loss. In 2015, upper stem and branch cankers have been reported from a number of districts in southern NSW and has caused serious yield loss in some instances. Reports have also been received of symptoms of upper canopy infection being mistaken for sclerotinia stem rot. 7
Possible causes of upper stem and branch infection
With the adoption of no-till cropping systems, many canola crops are now sown earlier in the growing season or even into dry soil. These crops are developing earlier, elongating and in many cases flowering in late winter. In the past, crops typically remained in the vegetative growth stage during the winter period, elongating at the onset of spring. Ideal conditions for infection by Leptosphaeria maculans (constant leaf wetness that coincides with ascospore release) occur during winter. This suggests that the stem/branch cankers result from direct infection at the stem elongation/flowering growth stages due to advanced development of the crop.
Management of upper stem and branch infection:• Try to ensure stem elongation occurs in the normal flowering window, not in
winter when blackleg intensity is at its highest.• Reduced blackleg severity by maintaining 500 m distance between your crop
and the previous season’s stubble.
Blackleg tolerance to Fluquinconazole
In regions where canola is grown intensively growers depend on fungicides to support variety resistance. The only commercially available fungicides are different forms of triazoles (DMIs; Group 3). Due to the widespread use of fungicides with the same mechanism of action, and the propensity for L. maculans to overcome variety resistance, the canola industry has concerns that L. maculans may develop triazole resistance. 8
See Canola diseases - the ‘watch outs’ for 2016 for results of a GRDC survey on fungicide tolerant blackleg populations.
Key points• Never sow your canola crop into last year’s canola stubble.• Monitor your crops in spring to determine yield losses in the current crop.• Choose a cultivar with adequate blackleg resistance for your region.• Relying only on fungicides to control blackleg poses a high risk of
fungicide resistance.• If your monitoring has identified yield loss and you have grown the same cultivar
for three years or more, choose a cultivar from a different resistance group. 9
7 K Lindbeck, S Marcroft, A Leo, A Van de Wouw (2016) Canola diseases - the 'watch outs' for 2016. GRDC Update Papers 16 February 2016, https://grdc.com.au/Research-and-Development/GRDC-Update-Papers/2016/02/Canola-diseases-the-watch-outs-for-2016
8 K Lindbeck, S Marcroft, A Leo, A Van de Wouw (2016) Canola diseases - the 'watch outs' for 2016. GRDC Update Papers 16 February 2016, https://grdc.com.au/Research-and-Development/GRDC-Update-Papers/2016/02/Canola-diseases-the-watch-outs-for-2016
9 GRDC (2016) 2016 Spring Blackleg management guide. GRDC Fact Sheet, http://www.grdc.com.au/GRDC-FS-BlacklegManagementGuide
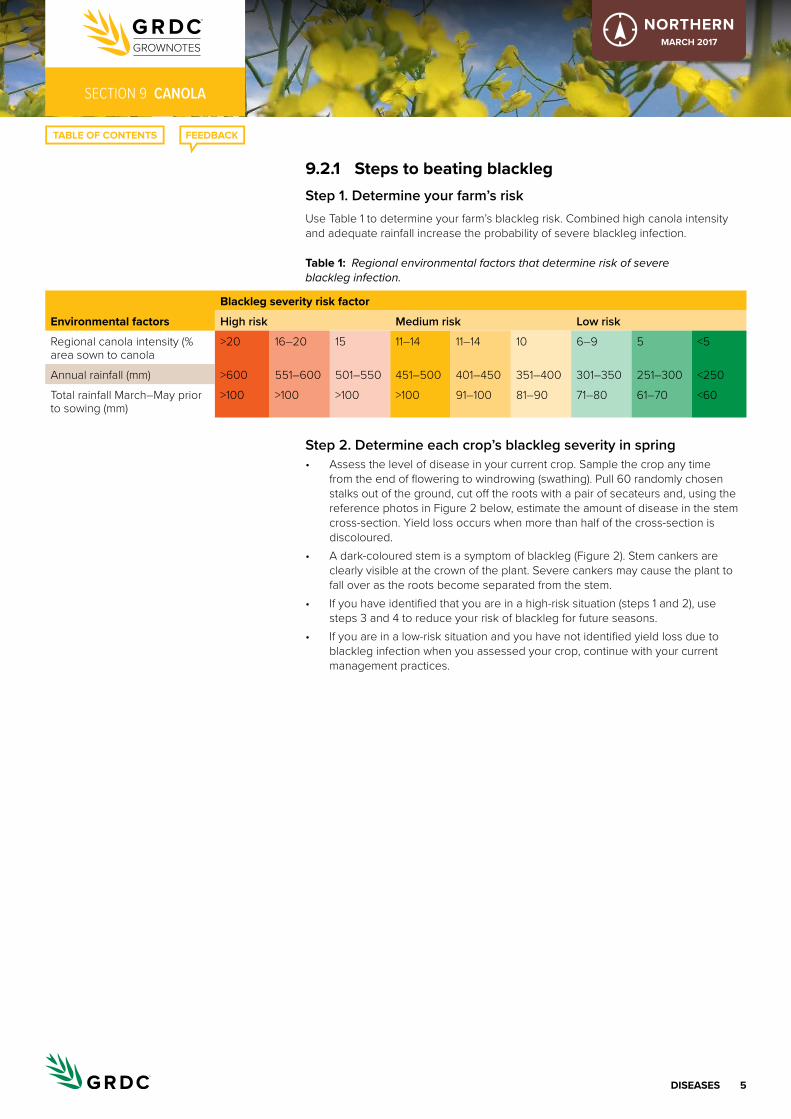
5DISeaSeS
seCtioN 9 CANOLA
NORTHERNMarch 2017
9.2.1 Steps to beating blackleg Step 1. Determine your farm’s riskUse Table 1 to determine your farm’s blackleg risk. Combined high canola intensity and adequate rainfall increase the probability of severe blackleg infection.
table 1: Regional environmental factors that determine risk of severe blackleg infection.
environmental factors
Blackleg severity risk factor
High risk Medium risk Low risk
Regional canola intensity (% area sown to canola
>20 16–20 15 11–14 11–14 10 6–9 5 <5
Annual rainfall (mm) >600 551–600 501–550 451–500 401–450 351–400 301–350 251–300 <250
Total rainfall March–May prior to sowing (mm)
>100 >100 >100 >100 91–100 81–90 71–80 61–70 <60
Step 2. Determine each crop’s blackleg severity in spring• Assess the level of disease in your current crop. Sample the crop any time
from the end of flowering to windrowing (swathing). Pull 60 randomly chosen stalks out of the ground, cut off the roots with a pair of secateurs and, using the reference photos in Figure 2 below, estimate the amount of disease in the stem cross-section. Yield loss occurs when more than half of the cross-section is discoloured.
• A dark-coloured stem is a symptom of blackleg (Figure 2). Stem cankers are clearly visible at the crown of the plant. Severe cankers may cause the plant to fall over as the roots become separated from the stem.
• If you have identified that you are in a high-risk situation (steps 1 and 2), use steps 3 and 4 to reduce your risk of blackleg for future seasons.
• If you are in a low-risk situation and you have not identified yield loss due to blackleg infection when you assessed your crop, continue with your current management practices.

6DISeaSeS
seCtioN 9 CANOLA
NORTHERNMarch 2017
Figure 2:
low risk
20% 0%
Medium risk
60% 40%
Cankered
high risk
100% 80%
Crop blackleg severity.
Step 3. Management practices can reduce the risk of blackleg infectionIf your crop monitoring (see step 2) showed yield loss in the previous year, the following practices can be used to reduce blackleg severity. Complete the following process for each canola paddock to be sown.
For each of the seven management factors listed in Table 2 below (and in the Blackleg risk management worksheet accompanying the 2016 Spring Blackleg management guide, circle where each canola paddock fits to determine the risk of blackleg. For example, for ‘blackleg rating’, if your cultivar is ATR-Stingray, circle MR, indicating a low risk of blackleg; or for ‘distance from last year’s canola stubble’, if your proposed canola crop is 200 m away, high risk is indicated. • Complete all seven management factors to determine which practices are
causing increased risk and how they can be reduced. For example, for ‘distance from last year’s canola stubble’, choose a different paddock, at least 500 m away from last year’s stubble, reducing the risk from high to low.

7DISeaSeS
seCtioN 9 CANOLA
NORTHERNMarch 2017
table 2: Management factors used to determine which practices are increasing the risk of blackleg infection.
Blackleg rating of cultivar VS S–VS S MS–S MS Mr–MS Mr Mr–r r
Distance from last year's canola stubble
0 m 100 m 200 m 300 m 400 m 500 m >500 m >500 m >500 m
Fungicide use No fungicide
Foliar applied fungicide
Seed dressing fungicide
Fertiliser applied fungicide
Seed dressing + fertiliser applied fungicide
Seed dressing or fertiliser applied + foliar fungicide
Seed dressing or fertiliser applied + foliar fungicide
Years of same cultivar grown
Same cv. or resistance group for >3 years
Same cv. or resistance group for 3 years
Same cv. or resistance group for 2 years
Same cv. or resistance group for 2 years
Same cv. or resistance group for 2 years
Distance from 2-year-old canola stubble
0 m 100 m 250 m 250 m 250 m
Canola stubble conservation
Inter-row sowing
Disc tillage
Knife- point tillage
Burning or burying tillage
Burning or burying tillage
Burning or burying tillage
Month sown June–Aug. 15–31 May 1–14 May 15–30 April
15–30 April
15–30 April
Dual purpose grazing canola
Grazing canola
For blackleg rating of cultivar: VS, very susceptible; S, susceptible; MS, moderately susceptible; MR, moderately resistant; R, resistant; see text below (Blackleg rating) for further details.
Step 4. Blackleg resistance groupsCanola cultivars have different combinations of blackleg resistance genes. Over time, growing cultivars with the same blackleg resistance genes has led to changes in the virulence of the blackleg pathogen, which has enabled it to overcome cultivar resistance. By rotating between cultivars with different resistance genes, you can reduce the probability of resistance breakdown and reduce disease severity.
Based on steps 1 to 3, are you in a high-risk region or have you observed increasing blackleg severity and grown the same cultivar in close proximity for ≥3 years?• No. Your current management practices should be sufficient to manage blackleg
resistance adequately.• Yes. You may be at risk of the blackleg fungus overcoming the blackleg
resistance of your cultivar. It is recommended that you grow a cultivar with a different combination of blackleg-resistance genes (see Table 3 in 2016 Spring Blackleg management guide). You do not need to change resistance groups (cultivars) every year. 10
10 GRDC (2016) 2016 Spring Blackleg management guide. GRDC Fact Sheet, http://www.grdc.com.au/GRDC-FS-BlacklegManagementGuide
8DISeaSeS
seCtioN 9 CANOLA
NORTHERNMarch 2017
9.2.2 Blackleg ratingAll varieties are rated according to the independent Australian National Blackleg Resistance rating system, in which all canola-breeding companies are participants. The ratings, based on relative differences between varieties, are as follows: • resistant: R• resistant to moderately resistant: R–MR• moderately resistant: MR• moderately resistant to moderately susceptible: MR–MS• moderately susceptible: MS• moderately susceptible to susceptible: MS–S• susceptible: S• susceptible to very susceptible: S–VS• very susceptible: VS
Varieties with a rating of ‘resistant’ (R) in areas of high blackleg risk and at least ‘moderately resistant’ (MR) in areas of lower blackleg risk will normally give sufficient disease protection. 11 The blackleg-resistance ratings for all varieties for 2015 are available in the Blackleg management guide, autumn 2015 Fact Sheet (see Table 3 therein). 12
9.3 Sclerotinia stem rot
Sclerotinia stem rot is a fungal disease that can infect a wide range of broadleaf plants, including canola. Disease development is favoured by prolonged wet conditions in late winter followed by periods of prolonged leaf wetness during flowering.
The complexity of the disease cycle of sclerotinia stem rot results in disease outbreaks being sporadic compared to other diseases. There are several key stages that must be synchronised and completed in order for plant infection to occur. Weather conditions must be suitable for the pathogen at each stage. These stages of development include:• softening and germination of soil borne sclerotia • apothecia development and release of ascospores• infection of petals by air-borne ascospores • senescence of infected petals in the presence of moisture and subsequent
stem infection.
Weather conditions during flowering play a major role in determining the development of the disease. The presence of moisture during flowering and petal fall will determine if sclerotinia stem rot develops. Dry conditions during this time can quickly prevent development of the disease, hence even if flower petals are infected, dry conditions during petal fall will prevent stem infection development. 13
Outbreaks of sclerotinia stem rot tend to be sporadic, with levels of disease varying between seasons and regions in southern NSW and northern Victoria, so growers are advised to get out into their crops to monitor the situation.
The disease can cause yield reductions of 30 to 40 per cent in heavily infested crops in high-rainfall years, and in 2015 the first warning signs appeared in early August, with apothecia observed in canola crops in southern NSW, and continued wet weather through the month providing periods of extended leaf wetness and opportunities for disease epidemics to develop (Figures 3 and 4).
11 P Matthews, D McCaffery, L Jenkins (2016) Winter crop variety sowing guide 2016. NSW DPI Management Guide. NSW Department of Primary Industries, http://www.dpi.nsw.gov.au/__data/assets/pdf_file/0011/272945/winter-crop-variety-sowing-guide-2016.pdf
12 GRDC (2016) 2016 Spring Blackleg management guide. GRDC Fact Sheet, http://www.grdc.com.au/GRDC-FS-BlacklegManagementGuide
13 K Lindbeck, S Marcroft, A Leo, A Van de Wouw (2016) Canola diseases - the 'watch outs' for 2016. GRDC Update Papers 16 February 2016, https://grdc.com.au/Research-and-Development/GRDC-Update-Papers/2016/02/Canola-diseases-the-watch-outs-for-2016
i MORE INFORMATION
GRDC Fact sheet: 2016 spring Blackleg management guide
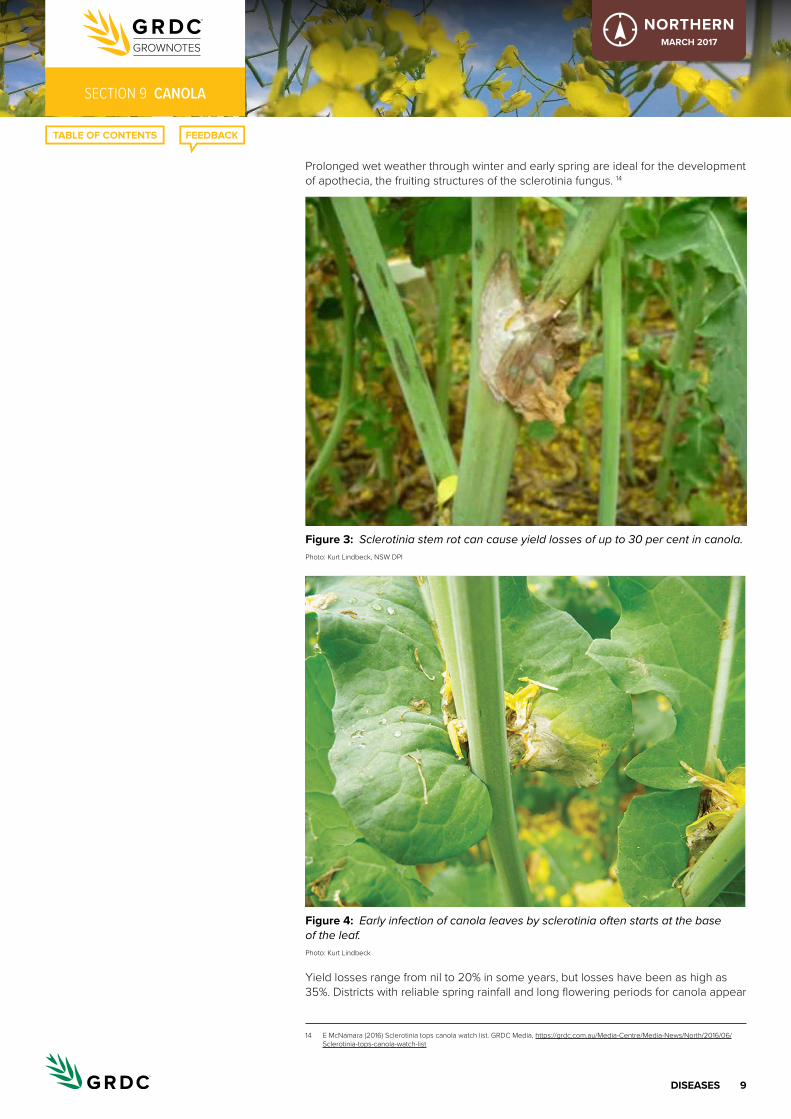
9DISeaSeS
seCtioN 9 CANOLA
NORTHERNMarch 2017
Prolonged wet weather through winter and early spring are ideal for the development of apothecia, the fruiting structures of the sclerotinia fungus. 14
Figure 3: Sclerotinia stem rot can cause yield losses of up to 30 per cent in canola. Photo: Kurt Lindbeck, NSW DPI
Figure 4: Early infection of canola leaves by sclerotinia often starts at the base of the leaf. Photo: Kurt Lindbeck
Yield losses range from nil to 20% in some years, but losses have been as high as 35%. Districts with reliable spring rainfall and long flowering periods for canola appear
14 E McNamara (2016) Sclerotinia tops canola watch list. GRDC Media, https://grdc.com.au/Media-Centre/Media-News/North/2016/06/Sclerotinia-tops-canola-watch-list
10DISeaSeS
seCtioN 9 CANOLA
NORTHERNMarch 2017
to develop the disease more frequently. Continual wheat–canola rotations are also very effective at building up levels of soil-borne sclerotia. 15
Burning canola stubble will not control the disease effectively, because Sclerotinia survives mainly on or in the soil. Crop rotation with cereals, following recommended sowing times and ensuring that crops do not develop heavy vegetative growth, which is likely to reduce air circulation, are the best means of reducing the impact of the disease.
The inconsistent relationship between the level of stem infection and yield loss makes it difficult to predict an economic response from using foliar fungicides in any one year. The specific environmental conditions for development of Sclerotinia stem rot will not occur every year. For example, in dry conditions, even if the fungus is present, the disease may fail to develop.
The fungicide Prosaro® (a.i.s prothioconazole + tebuconazole), and iprodione and some procymidone products, are registered for the management of Sclerotinia stem rot.
Use of foliar fungicides
At this time there are no commercial canola cultivars available on the Australian market with resistance to sclerotinia stem rot. Management of the disease relies on the use of cultural and chemical methods of control. Foliar fungicides should be considered in those districts which are at a high risk of disease development (e.g. districts where the disease frequently occurs, long flowering period and reliable spring rainfall). There are several foliar fungicides currently registered for use in Australia to manage sclerotinia stem rot.
Points to consider when using a foliar fungicide to manage sclerotinia stem rot:• The most yield loss from sclerotinia occurs from early infection events. Early
infection is likely to result in premature ripening of plants and produce little or no yield.
• Plants become susceptible to infection once flowering commences. Research in Australia and Canada has shown that an application of foliar fungicide around the 20–30% bloom stage (20% bloom is 14–16 flowers on the main stem, 30% bloom is approx. 20 flowers on the main stem) can be effective in significantly reducing the level of sclerotinia stem infection. Most registered products can be applied up to the 50 per cent bloom (full bloom) stage.
• The objective of the fungicide application is to prevent early infection of petals while ensuring that fungicide also penetrates into the lower crop canopy to protect potential infection sites (such as lower leaves, leaf axils and stems). Timing of fungicide application is critical.
• A foliar fungicide application is most effective when applied before an infection event (e.g. before a rain event during flowering). These fungicides are best applied as protectants and have no curative activity.
• In general, foliar fungicides offer a period of protection of up to three weeks. After this time the protectant activity of the fungicide is compromised. In some crops development of lateral branch infections later in the season is not uncommon if conditions favourable for the disease continue. The greatest yield loss occurs when the main stem becomes infected, especially early. Lateral branch infection does cause yield loss, but at a much reduced level.
• Use high water rates and fine droplet sizes for good canopy penetration and coverage.
Consult the Sclerotinia Stem Rot in Canola factsheet for further information. This publication is available from the GRDC website. 16
15 GRDC (2014) Canola disease management in the northern region. GRDC Ground Cover, 21 March 2014, http://grdc.com.au/Media-Centre/Hot-Topics/Canola-disease-management-in-the-northern-region
16 K Lindbeck, S Marcroft, A Leo, A Van de Wouw (2016) Canola diseases - the 'watch outs' for 2016. GRDC Update Papers 16 February 2016, https://grdc.com.au/Research-and-Development/GRDC-Update-Papers/2016/02/Canola-diseases-the-watch-outs-for-2016
i MORE INFORMATION
Ground Cover issue 122: stop the rot – early intervention key to disease control
Ground Cover Radio 122: Northern region extension
11DISeaSeS
seCtioN 9 CANOLA
NORTHERNMarch 2017
Key points• An outbreak of Sclerotinia stem rot is highly dependent on the season.• Prolonged wet or humid conditions during flowering favour the disease.• Consider past outbreaks of the disease as a guide to potential yield loss.• Avoid growing canola in paddocks with a history of Sclerotinia stem rot over the
past 4 years, or in adjacent paddocks.• Well-timed fungicide treatments, when canola crops are at 20–30% flowering
stage, can be highly effective in reducing the level of infection.• No Australian canola varieties have known resistance to the disease. 17
9.4 Viruses
Managing viruses centres on implementing best agronomic practice:• Retain standing stubble to deter migrant aphids from landing.• Sow at the optimal seeding rate and sowing time, because earlier sown crops
are more prone to aphid attack.• Control in-crop and fallow weeds to remove the in-crop and nearby sources of
virus infection. 18
BWYV was found in most tested canola crops throughout NSW. However, substantial yield losses appeared to be limited to a few paddocks where early infection occurred. BWYV is a persistently transmitted virus that infects a wide range of crops and weeds. Its main vector is the green peach aphid (Myzus persicae).
Virus control strategies should be based on preventing infection, because infected plants cannot be cured. Preventive measures to avoid BWYV infection in canola include seed treatment with systemic insecticides that are effective for green peach aphid control and sowing in standing wheat stubble.
Growers are advised to check canola crops early in the season for aphid presence. If aphids are found, an effective insecticide should be applied.
There is no indication that the occurrence of BWYV in canola poses a threat to neighbouring pulse crops.
High infestations of aphid species other than green peach aphid were observed in other broadacre crops in June–July 2014. Widespread infestations of cowpea aphid throughout Queensland and NSW resulted in very high levels of infection of BYMV in faba bean and, possibly, lupin crops. 19
Of the three virus species recorded in canola in Australia, BWYV is the most common and has potential to cause yield losses in canola. Commercial canola varieties appear resistant to TuMV. However, some lines of condiment mustard and juncea canola (both Brassica juncea) have been severely affected by TuMV in trials in northern NSW. The importance of CaMV in canola and B. juncea is not known.
All three viruses are spread by aphids from weeds, which act as hosts. BWYV can come from a range of weed, pasture and crop species. Turnip weed, wild radish and other Brassica weeds are important hosts of TuMV. Substantial yield losses from viruses, particularly BWYV, can occur even when there are no obvious symptoms.
Seed treated with an imidacloprid product or Poncho® Plus (imidacloprid + clothiandin) is recommended to protect crops from early infestation with aphids. 20
17 GRDC (2014) Canola disease management in the northern region. GRDC Gound Cover, 21 March 2014, http://grdc.com.au/Media-Centre/Hot-Topics/Canola-disease-management-in-the-northern-region
18 GRDC (2014) Canola disease management in the northern region—details. GRDC Gound Cover, 21 March 2014, http://grdc.com.au/Media-Centre/Hot-Topics/Canola-disease-management-in-the-northern-region/Details
19 eXtensionAUS. Latest on canola disease—2015 GRDC Update Papers. eXtension, https://extensionhub.com.au/web/field-crop-diseases/-/latest-on-canola-disease-2015-grdc-update-papers
20 P Matthews, D McCaffery, L Jenkins (2016) Winter crop variety sowing guide 2016. NSW DPI Management Guide. NSW Department of Primary Industries, http://www.dpi.nsw.gov.au/__data/assets/pdf_file/0011/272945/winter-crop-variety-sowing-guide-2016.pdf
i MORE INFORMATION
sclerotinia stem rot in canola Fact sheet
Canola diseases. the Back Pocket Guide
Canola disease update 2015 (NsW)
economics and timing of fungicide application to control sclerotinia stem rot in canola
i MORE INFORMATION
Beet western yellows virus (synonym: Turnip yellows virus) and green peach aphid in canola
Canola diseases. the Back Pocket Guide
Watch for chickpea viruses near canola
i MORE INFORMATION
Virus diseases in canola and mustard
Reducing aphid and virus risk
Virus development in canola crops during 2014 in NsW and implications for the oilseed and pulse industry

1PlaNt groWth regUlatorS aND caNoPY MaNageMeNt
seCtioN 10 CANOLA
NORTHERNMarch 2017
Plant growth regulators and canopy managementNot applicable for this crop.

1croP DeSIccatIoN/SPraY oUt
seCtioN 11 CANOLA
NORTHERNMarch 2017
crop desiccation/spray out(For information on windrowing, see Section 12. Harvest.)
Chemical desiccation is an alternative to windrowing and very effective where crops have lodged or where weeds have emerged in maturing crops. The most commonly used desiccant is diquat (Reglone®), which is registered for aerial application on canola crops (refer to product label for application rates).
Desiccation can be a useful strategy on variable soil types; for example, where heavier soil types or drainage lines keep the crop greener for longer, a desiccant can hasten harvest of these areas and reduce the risk of problems arising from high moisture. It can also be used where windrowing contractors are not available.
Desiccants have no detrimental effects on the seed or its oil quality if applied at the correct time. They work through contact action and require almost complete coverage of the plant to work effectively. An experienced aerial operator can apply a crop desiccant to ensure uniform coverage with minimal spray drift.
The correct time for desiccation is when 70–80% of seeds have changed colour in middle pods, which is when the crop has passed its optimal windrowing stage. The crop will be ready to harvest within 4–7 days after the desiccant is applied, depending on the size and density of the crop.
Desiccate only an area of crop that can be harvested over a period of 1–2 days. The harvester must be ready within 4 days of a desiccant being applied to minimise the potential of losses from shattering. Withholding periods should be adhered to.
Other products not registered for use in canola should not be used as desiccants as issues with chemical residues can potentially affect markets and quality of the canola.
Desiccation is generally considered a special-purpose management aid to be used when problems with windrowing, weeds or harvesting are anticipated. Specialist agronomic advice should be sought. 1
Glyphosate (specifically Weedmaster) has recently been registered for pre harvest application. It should be noted though that the intention is that it is only registered to control weeds present in the crop at that timing not to manage canola maturity i.e. bringing grain moisture down for harvest.
1 P Carmody (2009) Windrowing and harvesting. Ch. 14. In Canola best practice management guide for south-eastern Australia. (Eds D McCaffrey, T Potter, S Marcroft, F Pritchard) GRDC, http://www.grdc.com.au/uploads/documents/GRDC_Canola_Guide_All_1308091.pdf
i MORE INFORMATION
Pre-harvest herbicide use. Fact sheet.
harvest options for canola—windrowing timing, direct heading, desiccation with Reglone and treatment with Pod-Ceal. effects on yield and oil percentages.Using paraquat in canola, wheat or barley warning: crops will cause residue violations
GRDC Update Paper: Goa investigates Canola desiccation and direct heading and PodGuard canola
1harVeSt
seCtioN 12 CANOLA
NORTHERNMarch 2017
harvestCanola crops can be either windrowed (Figure 1) or direct-harvested. The method chosen depends on the availability and cost of contract windrowing, the type of harvesters available and the relative risk of adverse weather in a particular locality. Some of the advantages of windrowing are: uniform ripening, earlier harvesting (7–10 days), less exposure to spring storms and rain, reduced shattering losses during harvest, and less hail and wind loss. Harvesting can usually continue ‘around the clock’. 1 Some advantages of direct heading include cost, availability of headers on farm and a higher harvest index on low yielding crops.
Figure 1: Windrowing prior to harvest is the more common practice. Photo: Rebecca Jennings
Research by Grain Orana Alliance has demonstrated the importance of getting windrowing timing right to avoid potentially large yield penalties. Other trial work has demonstrated that direct heading of canola is also a viable alternative to windrowing. 2
12.1 Windrowing
The majority of canola is currently windrowed. The objective in windrowing is to lay the cut material on top of the lower stem material to allow air movement under the windrow to assist in the drying process (Figure 2).
1 L Serafin, J Holland, R Bambach, D McCaffery (2009) Canola: northern NSW planting guide. NSW Department of Primary Industries, http://www.dpi.nsw.gov.au/__data/assets/pdf_file/0016/148300/canola-northern-NSW-planting-guide.pdf
2 M Street (2016) GOA investigates Canola desiccation and direct heading and PodGuard canola. GRDC Update Papers 20 July 2016, https://grdc.com.au/Research-and-Development/GRDC-Update-Papers/2016/07/GOA-investigates-Canola-desiccation-and-direct-heading-and-PodGuard-canola
i MORE INFORMATION
Direct heading canola. Fact sheet.
harvest management. Module 7. Better canola.
2harVeSt
seCtioN 12 CANOLA
NORTHERNMarch 2017
Figure 2: The majority of canola crops are windrowed prior to harvest.
Key points• Physiological maturity occurs when the seed moisture content reaches 35–45%.• Check the crop regularly from 14 days after the end of flowering (10% of plants
with flowers).• Look for colour change across the whole plant, particularly in crops with lower
plant populations.• Sample from representative areas of the paddock, and check all varieties for
change in seed colour; it will vary within a district. • Book a contractor early in the season and contact again when the crop has
reached the end of flowering.• Optimal windrowing stage lasts for 4–6 days in most areas.• When seed losses are obvious on the windrower, stop and consider direct
harvesting. Planning is critical for a smooth harvest operation. Less experienced growers are advised to organise a contractor or an experienced neighbour to carry out the windrowing.
Figure 3: Windrowed canola near Binalong, NSW. Photo: Gregory Heath

3harVeSt
seCtioN 12 CANOLA
NORTHERNMarch 2017
Canola is an indeterminate plant, which means it flowers until limited by temperature, water stress or nutrient availability. As a result, pod development can last over 3–5 weeks, with lower pods maturing before higher ones. Consequently, canola is often windrowed to ensure that all pods are mature at harvest (Figure 3).
Older canola varieties had a lengthy flowering period, but growers now have access to a greater range of varieties with differing maturities and more tolerance to pod-shattering.
Some early-maturing varieties have been developed with shorter flowering and pod maturity periods. Direct harvesting (instead of windrowing) is more of an option for these shorter statured and earlier maturing varieties in some regions.
Whether the crop is windrowed or direct-harvested will depend on the varieties grown, soil types, seasonal conditions, availability of windrowers, and the size and variability of the crop. Canola crops that are variable in their maturity or show significant differences in the maturity of the top and bottom pods are ideally windrowed to minimise shattering losses. The plant should be windrowed before the lower pods approach shattering stage.
Like hay cutting, windrowing of canola hastens the maturity of the crop, allowing the top pods to be harvested at the same time as the lower pods. By cutting the crop and placing it in a windrow on the stubble, the pods and seeds can dry faster than a standing crop (by as much as 8–10 days). Windrowed canola is much less susceptible than a standing crop to wind, rain and hail damage. In the windrow, seeds will reach a uniform harvest moisture content of 8% within 6–10 days of being cut.
WATCH: Interview with central NSW farming manager Justin McMillan
Several harvester-front options are available for canola. A belt front, for example, can be used to windrow or direct-head a crop, but with minor modifications, it can also be used to harvest a windrowed crop. Various pick-up attachments or crop lifters can be used on existing open-front headers to harvest canola windrows.
For most canola production areas, windrowing has the advantages of:• allowing earlier harvest (8–10 days) because seed matures more evenly;• hastening maturity (in higher rainfall areas);• evening maturity where soil types are variable in individual paddocks;• reducing losses from hail and excessive winds;• providing flexibility for the grower with large areas, because the timing of harvest
is not as critical;• reducing shattering losses during harvest;• around-the-clock operation to cover large areas; and

4harVeSt
seCtioN 12 CANOLA
NORTHERNMarch 2017
• helping to control escaped or herbicide-resistant weeds in some cases. 3
Disadvantages:• There are additional costs.• In very wet seasons, the crop can deteriorate in a windrow.• The optimum timing only lasts 4–6 days depending on the temperature
and humidity.• The use of contractors may compromise timing.• Timing of windrowing is determined by percentage change in seed colour, which
is a compromise to allow for variability in the weather post-windrowing.• Windrowing too early can lead to yield losses of up to 30% and reduced
oil content, whereas too late makes the crop far more susceptible to shattering losses.
• Poorly made windrows which are uneven resulting in ‘lumps’ or ‘haystacks’ will slow the harvesting process and any blockages that occur can be time consuming and costly to clear especially where contractors charge on a machine hour basis.
• If the cut plants are ‘pushed’ down onto the ground during the windrowing operation the dry down time may be increased especially if moderate to heavy rain is received before harvesting starts. 4
TimingCollect pods from the main stem of a number of plants and from different positions in the canopy to determine the optimum timing for windrowing. The top third of the plant will have mostly green seeds that are firm but pliable; the middle third, ~80% of seeds green or green-red and very firm but pliable, and 20% red-brown to light brown; and the bottom third, dark brown to black seeds. 5
Check withholding periods when using Reglone, see http://www.apvma.gov.au/
12.1.1 When to windrowWindrowing should start when 50–70% of seeds have changed colour to red, brown or black (Figure 4). The crop is usually ready for windrowing 20–30 days after the end of flowering, and should be regularly checked for changes in seed colour. The end of flowering is considered to be when only ~10% of plants have any flowers left on them.
Windrowed crops should be ready to harvest 5–14 days after windrowing, depending on the weather. The moisture content of the grain should be ≤8%. 6
In warmer, drier areas, windrowing is better done when seed reaches 50–60% seed-colour change. Under higher temperatures, the windrowed plant dries too rapidly to allow seeds to mature fully in the pods and oil content can be lower.
3 P Carmody (2009) Windrowing and harvesting. Ch. 14. In Canola best practice management guide for south-eastern Australia. (Eds D McCaffrey, T Potter, S Marcroft, F Pritchard) GRDC, http://www.grdc.com.au/uploads/documents/GRDC_Canola_Guide_All_1308091.pdf
4 J Midwood (2013) Canola harvest: is direct heading a serious option. GRDC Update Papers, 6 February 2013, https://grdc.com.au/Research-and-Development/GRDC-Update-Papers/2013/02/Canola-harvest-Is-direct-heading-a-serious-option
5 J Midwood (2013) Canola harvest: is direct heading a serious option. GRDC Update Papers, 6 February 2013, https://grdc.com.au/Research-and-Development/GRDC-Update-Papers/2013/02/Canola-harvest-Is-direct-heading-a-serious-option
6 L Serafin, J Holland, R Bambach, D McCaffery (2009) Canola: northern NSW planting guide. NSW Department of Primary Industries, http://www.dpi.nsw.gov.au/__data/assets/pdf_file/0016/148300/canola-northern-NSW-planting-guide.pdf
i MORE INFORMATION
GRDC Update Paper: ‘to windrow or not to windrow in 2016?’ this is the question, ‘but if so, when?’
GRDC Update Paper: a snapshot of results from year 1 trials of canola harvest management in northern NsW

5harVeSt
seCtioN 12 CANOLA
NORTHERNMarch 2017
Figure 4: Seed-colour changes determine the optimum time for windrow timing. Photo: DAFWA
In summary, windrowing too early can result in lower yields and oil contents, and too late will lead to shattering losses.
The optimum time for windrowing is when the top third of the plant has mostly green seeds. These should be firm but pliable when rolled between the thumb and forefinger. The middle section of the plant will have 80% of seed green or green-red and be very firm but pliable; the other 20% may be red-brown to light brown. The bottom third of the plant will have dark brown to black seeds.
The time from the end of flowering to windrowing will vary with season, paddock and variety. Check each crop every year to determine the best windrowing time.
If using a contractor, ensure that they are booked well in advance. Noting the end of flowering will help the grower and the contractor to determine approximately when the crop will be ready to windrow. It is most important that a decision to windrow is made based on assessment in a representative area of the paddock.
The optimal windrowing stage for canola lasts ~4–6 days, depending on temperature and humidity. Each day that windrowing is delayed past the optimum time will make the crop more susceptible to shattering losses. These can be minimised by operating at night or when humidity is high after dew or rain. However, where shattering losses during windowing are obvious, growers are advised to change strategy to direct harvesting or to desiccation followed by direct harvesting.
Windrowing too early, for example, by 4–5 days, can lead to yield losses of up to 10% and reduced oil content. A canola crop should never be windrowed before seed colour has changed, because it will result in significant yield loss. Rollers can be attached to the back of windrowers to help push the windrow down into the stubble and minimise wind damage. Note: withholding periods of pesticides relate to windrowing, not to harvest, if windrowing operations occur. 7
Grain Orana Alliance (GOA) ran multiple trials in 2009, 2010 and 2011 to examine the impact of windrowing timing on oil, yields and profitability as well as the alternate option of direct heading: • Windrowing timing within an acceptable window had no impact on oil % in canola• Windrowing timing can have a significant positive impact on yield and
profitability of canola.• Yield increases up to 0.5 t/ha have been seen over relatively short delays in
windrowing of only 8 days.• Yield loss to shattering with later windrowing has not shown to be as bad as first
thought, particularly in contrast to negative yield impacts for going too early.• Windrowing timing has a limited effect on oil potential in canola.• Direct heading is a viable option to harvest canola and in many cases could
maximise profitability.
7 P Carmody (2009) Windrowing and harvesting. Ch. 14. In Canola best practice management guide for south-eastern Australia. (Eds D McCaffrey, T Potter, S Marcroft, F Pritchard) GRDC, http://www.grdc.com.au/uploads/documents/GRDC_Canola_Guide_All_1308091.pdf
i MORE INFORMATION
Revisiting canola management can lift returns.
6harVeSt
seCtioN 12 CANOLA
NORTHERNMarch 2017
• An economic benefit of over $200/ha can be gained from choosing the best method and timing of canola harvesting. 8
12.2 Direct heading
Direct harvesting is cheaper than windrowing and can be done with an open front with an extended platform or with a belt-front attachment. Canola is ready to harvest when almost all pods are dry and rattle when shaken, pods are pale brown, and the seeds are dark brown to black and have <8% moisture content. 9
Recent research into direct cutting of canola has shown it to be a viable harvest alternative to windrowing in some circumstances. Favourable conditions for direct heading include having a crop canopy that is slightly lodged and knitted together, even maturity across the paddock, and few, green weeds (or when sprayed with a desiccant).
Advantages of direct heading:• There are no windrowing or desiccation costs.• Crops dry out faster after wet weather than windrowed crops.• Crops are allowed to maximise yield potential and oil contents.• It suits rocky areas, which can be a problem when windrowing, and reduces the
risk of harvester blockage that can occur with windrows.
Disadvantage:• In crops that are variable, the wait for ripening can expose the crop to wind
damage, and thicker crops can take a considerable time to ripen evenly.
TimingThe general colour of the crop is a poor guide of when to harvest; use seed moisture content. The addition of pod sealants is an extra management aid when direct harvesting; it helps by reducing pod shattering and by allowing crops to achieve their full yield potential but is an added cost. When sprayed onto the crop it provides a unique elastic, semi-permeable membrane over the filling pods. Timing is earlier than the optimum time for windrowing. 10
Direct heading canola can often be carried out sooner than people think because although the crop stalks may still be green, crop delivery is based on grain moisture, not plant moisture.
Most headers are capable of direct heading canola. Many machines come out of Europe where they regularly direct head crops.
It is critically important to correctly set up the header front, according to the manufacturer’s instructions.
Common draper fronts can be used to direct harvest canola, but can be problematic when there is an uneven flow of the crop into the machine. When canola is cut and fed onto the mat, it tends to bounce and fluff up and feed in in lumps. To counter this, a top cross auger that sits across the back of the header front above the belt can be fitted. When the canola fluffs up it hits the auger which then flicks it towards the centre to even out the feed into the header.
Conventional, ‘tin front’ headers which have an auger at the bottom of the table are also capable of direct heading canola.
The crop takes virtually no thrashing to get the grain out of the pods, so machines can be set wide open to handle a significant amount of crop residue.
8 M Street (2016) ‘To windrow or not to windrow in 2016?’ This is the question, ‘but if so, when?’. GRDC Update Papers 3 March 2016, https://grdc.com.au/Research-and-Development/GRDC-Update-Papers/2016/03/Windrowing-in-2016
9 L Serafin, J Holland, R Bambach, D McCaffery (2009) Canola: northern NSW planting guide. NSW Department of Primary Industries, http://www.dpi.nsw.gov.au/__data/assets/pdf_file/0016/148300/canola-northern-NSW-planting-guide.pdf
10 J Midwood (2013) Canola harvest: is direct heading a serious option. GRDC Update Papers, 6 February 2013, http://www.grdc.com.au/Research-and-Development/GRDC-Update-Papers/2013/02/Canola-harvest-Is-direct-heading-a-serious-option
i MORE INFORMATION
aoF harvest Clean Down Guidelines

7harVeSt
seCtioN 12 CANOLA
NORTHERNMarch 2017
The incorrect setting up of the reel can cause significant losses in direct heading canola. The reel on the header only comes into play when the crop isn’t feeding easily into the machine, so it should be set high, well forward and only slightly faster than the machine’s ground speed. The reel is not there to rake the crop into the header front because it will create losses from seed shatter. It should only be a backstop for when the crop doesn’t feed into the machine.
Harvesters should have sharp cutter bars so they cleanly cut the crop rather than ‘gnaw’ it off.
To access the Grain Orana Alliance harvest loss calculator, visit http://www.grainorana.com.au/documents
IN FOCUS12.2.1 comparing windrowing and direct headingGrains Orana Alliance (GOA) research, which was funded by the Grains Research and Development Corporation, has examined the timing and adoption of pre-harvest practices in the central west of NSW (Table 1). Research findings include:• Yield loss due to shattering with later windrowing has proved not as
severe as thought.• Windrowing timing can have a significant positive effect on yield and
profitability of canola.• Relatively short delays in windrowing of only 8 days can lead to yield
increases of up to 0.5 t/ha.• Timing of windrowing has a limited effect on oil potential in canola.• Direct heading is a viable option for harvesting canola and in many
cases could maximise profitability.• An economic benefit of >$200/ha can be gained from choosing the
best method and timing of canola harvesting. 11
table 1: Canola harvest treatments, windrow timing and crop maturity. 12
treatment Windrowing timing
assumptions of crop maturity
Proportion of crop physiologically mature
at risk of not reaching potential
Early windrow
10% seed-colour change in middle third of the main stem
Assume bottom third mature, plus 10% of middle third, nil top third
36% seed potentially already mature
64%
Ideal windrow
50% seed-colour change in middle third of main stem
Assume bottom third mature plus 50% of middle third, 10% of top third
53% seed potentially already mature
47%
11 M Street (2013) Harvesting canola in 2013—to windrow or direct head. GRDC Update Papers, 22 August 2013, http://www.grdc.com.au/Research-and-Development/GRDC-Update-Papers/2013/08/Harvesting-canola-in-2013-to-windrow-or-direct-head
12 M Street (2010) Harvest options for canola—windrowing timing, direct heading, desiccation with Reglone™ and treatment with Pod Ceal™. Effects on yield and oil percentages. GRDC Update Papers, 30 September 2010, https://www.grdc.com.au/Research-and-Development/GRDC-Update-Papers/2010/09/Harvest-options-for-canola-windrowing-timing-direct-heading-desiccation-with-RegloneTM-and-treatment-with-Pod-CealTM-effects-on-yield-and-oil-percentages
i MORE INFORMATION
Direct heading canola. Fact-sheet.
Direct heading canola delivers at Devenish.
the benefits of disc seeders direct heading canola and on-farm storage.
harvest options for canola—windrowing timing, direct heading, desiccation with Reglone and treatment with Pod Ceal. effects on yield and oil percentages.
harvesting canola in 2013—to windrow or direct head?
Canola harvest: is direct heading a serious option?
early planning the key to canola direct harvesting.
the nuts and bolts of efficient and effective windrow burning
FAQ

8harVeSt
seCtioN 12 CANOLA
NORTHERNMarch 2017
treatment Windrowing timing
assumptions of crop maturity
Proportion of crop physiologically mature
at risk of not reaching potential
Late windrow
70% seed-colour change in middle third of the main stem
Assume bottom third mature plus 70% of the middle main stem, 50% of top third
72% seed potentially already mature
28%
Reglone® 70% of all pods have changed colour
70% 70% 30%
Direct head All seeds mature
100% 100% 0%
From these trials, it could be concluded that timing of windrowing has limited effect on oil percentages in canola. Delaying windrowing or direct heading resulted in significant increases in yields of canola. These yield variations may be explained by the proportion of immature seed present at cutting and the risk that this seed will not fill its potential. For this seed to mature, it must draw on stored substrate, which may be influenced by cutting height, time of day or even variability of the level of maturity within the crop. These aspects require further investigation.
The differences in yield coupled with additional costs contribute to significant increases in net returns for some treatments. Figure 5 depicts the relative benefits of the treatments, taking into account average yields, additional costs, and oil penalties or bonuses.
The limited nature of these trials does not allow a recommendation of ‘ideal’ timing of windrowing. However, the trials do demonstrate the potential economic benefit of making the right decision. Paddocks, seasons and risk-averseness of growers will all differ. When formulating a time to windrow, remember that there are potential advantages to allowing immature seed in the paddock to mature before windrowing or desiccation. By ceasing the plant’s growth during the filling of these seeds, yields could be reduced.
Therefore, a balance must be found between potential yield maximisation by delaying windrowing or desiccation, and the potential increases in loss of yield through shattering. This should be considered in view of the grower’s risk-averseness, or other advantages offered through windrowing. Potential risk in terms of pod shattering may be managed by use of products such as Pod Ceal™.
Further investigations may be warranted into:• time of day of windrowing and its effect on maturation of
immature seed• windrowing height—more stem may leave more substrate available to
facilitate grainfill and hence reduce yield losses and variability• quantifying potential sources of losses—standing crop, windrowing
losses, losses while in the windrow 13
13 M Street (2010) Harvest options for canola—windrowing timing, direct heading, desiccation with Reglone™ and treatment with Pod Ceal™. Effects on yield and oil percentages. GRDC Update Papers, 30 September 2010, https://www.grdc.com.au/Research-and-Development/GRDC-Update-Papers/2010/09/Harvest-options-for-canola-windrowing-timing-direct-heading-desiccation-with-RegloneTM-and-treatment-with-Pod-CealTM-effects-on-yield-and-oil-percentages
i MORE INFORMATION
harvesting canola in 2013-to-windrow or direct head?
harvest options for canola—windrowing timing, direct heading, desiccation with Reglone and treatment with Pod Ceal. effects on yield and oil percentages.

9harVeSt
seCtioN 12 CANOLA
NORTHERNMarch 2017
Figure 5:
$200
$250
$300
$150
$100
0
$50
Cha
nge
in g
ross
mar
gin
W128th Oct
W22nd Nov
W38th Nov
W17th Oct
W210th Oct
Dubbo site Coonamble site
W315th Oct
Regione Pod Ceal Directhead
$146
a b b z yz x xy x x
$166
$90
$208
$113$147
$208
Relative cost–profit difference of various harvest options compared with W1 at the Dubbo and Coonamble canola harvest trials. Treatment values headed by the same letter are not significantly different (α = 0.05). 14
12.3 Desiccation followed by direct heading
The most common desiccant is diquat (Reglone®), which is registered for aerial application.
Advantages:• The technique is useful on variable soil types because it allows more even
crop ripening.• It is ideal for weedy crops.• Crops dry out faster after wet weather than a windrowed crop.
Disadvantages:• There are shedding losses if a ground rig has to be used.• Shattering losses can be very high in windy conditions.• It is expensive, especially if the desiccant is applied by air.
TimingThe correct time for desiccation is when 70–80% of seeds have changed colour in the middle pods; this is when the crop has passed its optimal windrowing stage. The crop will be ready to harvest within 4–7 days after the desiccant is applied, depending on the size and density of the crop.
Other desiccants such as glyphosate are regularly used pre-harvest on canola in Canada and Europe. This provides far slower senescence of the plants, considerably reducing pod shattering and providing superior end-of-season grass-weed control. 15
14 M Street (2012) Windrow timing and direct heading in canola—effects on yield and oil. GRDC Update Papers, 12 April 2012, http://grdc.com.au/Research-and-Development/GRDC-Update-Papers/2012/04/Windrow-timing-and-direct-heading-in-canola-effects-on-yield-and-oil
15 J Midwood (2013) Canola harvest: is direct heading a serious option. GRDC Update Papers, 6 February 2013, http://www.grdc.com.au/Research-and-Development/GRDC-Update-Papers/2013/02/Canola-harvest-Is-direct-heading-a-serious-option

10harVeSt
seCtioN 12 CANOLA
NORTHERNMarch 2017
IN FOCUS12.3.1 canola desiccation and direct heading and Podguard canolaGOA has run a number of trials over 2013–16 to address some of the key concerns for growers including:
(i) Direct heading delays the commencement and conclusion of canola harvest which can adversely impact the harvest of other crops compared to windrowed crops.
(ii) Delays in the harvesting of direct headed crops after the crop is ripe can see a rapid decline in yield through pod shattering.
Research findings include:• Reglone™ when applied as a desiccant in canola has shown some
advantage in hastening ripening and bringing harvest forward but generally only by a few days.
• Weedmaster™ DST when applied for pre-harvest weed control has shown little to no practical effect in hastening ripening and bringing harvest forward.
• Windrowing canola crops at an optimal time may not bring harvest forward compared to direct heading as much as conventionally thought - differences may be as little as 2–5 days in some situations.
• Yield loss through pod shattering if direct heading of canola is delayed is not likely to be a linear decline but as a result of extremes in weather conditions which are inconsistent and unpredictable in their timing.
• Yield loss if direct heading is delayed and in the absence of an extreme event may be lower than first thought.
• PodGuard™ canola varieties developed by Bayer, promoted to have increase tolerance to pod shattering, may give growers some insurance against extreme weather conditions and confidence to either delay windrowing later or to direct head crops. 16
12.4 Wet harvest issues and management
Canola generally withstands extended wet harvest periods better than other crops such as wheat. Severe windstorms can cause seed shatter more readily in canola; however, newer varieties have been selected to improve this characteristic. 17
12.5 receival standards
Canola receival standards are presented in Table 2. 18
16 M Street (2016) GOA investigates Canola desiccation and direct heading and PodGuard canola. GRDC Update Papers 20 July 2016, https://grdc.com.au/Research-and-Development/GRDC-Update-Papers/2016/07/GOA-investigates-Canola-desiccation-and-direct-heading-and-PodGuard-canola
17 L Serafin, J Holland, R Bambach, D McCaffery (2009) Canola: northern NSW planting guide. NSW Department of Primary Industries, http://www.dpi.nsw.gov.au/__data/assets/pdf,_file/0016/148300/canola-northern-NSW-planting-guide.pdf
18 AOF (2014) Quality standards, technical information and typical analysis. 2014/15. Australian Oilseeds Federation, http://www.graintrade.org.au/sites/default/files/file/Commodity%20Standards/AOF_Standards_201415_Final.pdf

11harVeSt
seCtioN 12 CANOLA
NORTHERNMarch 2017
table 2: Commodity standards—canola (from AOF 2014).
Parameter Specification
Oil (%) 42.0 base level; 1.5% premium or deduction for each 1% above or below 42
Free fatty acid (%) 1.0 base level; 2% deduction for each 1% over the base level, rejectable over 2.5
Moisture max. (%) 8.0; 2% deduction for each 1% over maximum
Test weight min. (kg/hL)
62.0; rejectable under this limit
Protein Unlimited
Seed retention Unlimited
Germination Unlimited
i MORE INFORMATION
Quality standards, technical information and typical analysis, 2016/17.
GRDC’s integrated Weed Management hub.
Links to GRDC Update papers and reports on weed management are available from the Grain orana alliance.

1Storage
seCtioN 13 CANOLA
NORTHERNMarch 2017
StorageThere are four key best practice strategies that provide good results for on farm storage. When combined, they form the foundation for successful storage and importantly, a grower can build a reputation as a reliable supplier of quality grain.
Aeration: correctly designed and managed, will provide cool grain temperatures and uniform grain moisture conditions. The result is reduced problems with grain moulds and insect pests in storage, plus the ability to maintain grain quality attributes such as germination, pulse seed colour, oil quality and flour quality.
Hygiene: a good standard of storage facility hygiene is crucial in keeping storage pest numbers to a minimum and reducing the risk of grain contamination.
Monitoring: monthly checking of grain in storage for insect pests (sieving / trapping) and at the same time inspect grain quality and temperature. Keep a monthly storage record to record these details, including any grain treatments you applied.
Fumigation: in Australia we now only have gases (fumigation) to deal with insect pest infestations in stored grain. To achieve effective fumigations the storage/silo must be sealable — gas-tight (AS2628) to hold the gas concentration for the required time. 1
13.1 canola storage at a glance• For safe storage and optimum quality, canola should be stored ‘cool and dry’. • Aim to store canola seed with 42% oil content at <7.0% moisture content.
Samples with high oil content (50%) can be stored safely at <6.0% moisture content.
• Clean out storage facilities, grain-handling equipment and headers to reduce carryover of storage pests from one season to the next. This minimises early infestation pressure.
• Aeration to promote uniform, cool storage conditions is a key strategy for maintaining oil and seed quality. During summer, aim for stored canola temperatures in the range 18°–23°C.
• For oilseeds, monitor storages fortnightly and keep records. Sieve grain and use probe traps to detect insect pests. Make visual inspections and smell the canola. Check canola temperature at a number of locations in the storage. 2
1 P Burrill (2016) Part I Achieving great aeration results and Part II Silo recirculation as an aid to fumigation. GRDC Update Papers 20 July 2016, https://grdc.com.au/Research-and-Development/GRDC-Update-Papers/2016/07/Part-I-Achieving-great-aeration-results-and-Part-II-Silo-recirculation-as-an-aid-to-fumigation
2 P Burrill (2012) Safe storage. Module 8. In Better canola—canola technology update for growers and advisors. Australian Oilseeds Federation, http://www.australianoilseeds.com/__data/assets/pdf_file/0019/9082/MODULE_8_-_Safe_Storage_of_Canola_Philip_Burrill_-_V2_Sep_2012.pdf

2Storage
seCtioN 13 CANOLA
NORTHERNMarch 2017
WATCH: Specialist Grain Storage agronomist Philip Burrill commenting on the safe storage of oilseeds and pulses.
13.2 Storing oilseeds
Storage of oilseeds on-farm requires attention to detail, because limited tools are available compared with cereal grain storage. Oilseeds are also more susceptible to quality deterioration and have fewer insect-control options. To retain the canola’s market value, care must be taken to maintain oil quality, visual appearance, and freedom from moulds, insect pests and unregistered chemicals. 3
The decision to store oilseeds requires planning, careful management and a suitable storage system. 4
Points to consider when storing oilseeds such as canola:• Limited chemical control options for insect pests in stored oilseeds increase the
importance of careful management and planning.• Aeration cooling is required when storing oilseeds to maintain seed and oil
quality, limit insect reproduction and reduce risk of mould development.• Seek advice about the appropriate fan size to use to aerate canola. Canola’s
small seed size will reduce fan output by 40–50% or more. In some situations, the fan may fail to produce any airflow.
• Moisture content in oilseeds must be much lower than in cereal grains. The high oil content increases the risk of moulds and quality damage.
• Successful phosphine fumigation requires a gas-tight, sealable silo.• To prevent residues on canola, do not use the standard chemical insecticide
structural treatments. Use diatomaceous earth (DE) products such as Dryacide®. 5
13.3 Seed quality and moisture content at storage
Windrowing canola may have advantages over direct harvesting of the standing crop. It hastens and evens out the drying rate of ripe canola. If direct harvesting, harvest at <7% moisture content to allow for paddock variability with respect to crop maturity.
Timing of harvest and header settings—drum speed, concave gap and fan speed—have a significant impact on minimising trash and impurities and seed damage. If admixture in the seed sample is high, fines can concentrate directly below the
3 P Burrill (2012) Safe storage. Module 8. In Better canola—canola technology update for growers and advisors. Australian Oilseeds Federation, http://www.australianoilseeds.com/__data/assets/pdf_file/0019/9082/MODULE_8_-_Safe_Storage_of_Canola_Philip_Burrill_-_V2_Sep_2012.pdf
4 GRDC (2014) Storing oilseeds. GRDC Stored Grain Information Hub, http://storedgrain.com.au/storing-oilseeds/
5 GRDC (2014) Storing oilseeds. GRDC Grain Storage Fact Sheet, July 2014, http://storedgrain.com.au/wp-content/uploads/2014/09/GSFS-9_Oil-Seed-July14.pdf
i MORE INFORMATION
storing oilseeds—Grain storage Fact sheet
Cool and dry conditions maintain canola quality—Farming ahead
Phil Burrill QDaF discusses storage strategy. GRDC Radio (Northern Update) 106: safe seed storage strategy
stored Grain information hub
Grain storage facilities: Planning for efficiency and quality
i MORE INFORMATION
storing oilseeds
Vigilant monitoring protects grain assets

3Storage
seCtioN 13 CANOLA
NORTHERNMarch 2017
storage fill-point, leading to heating and fire risk. Larger pieces of crop trash may also concentrate along silo walls, leading to mould development.
The presence of damaged seeds is more attractive to storage pests such as the rust-red flour beetle (Tribolium castaneum).
Safe moisture content for storage depends on temperature and oil content. The higher the oil content and storage temperature, the lower the moisture content must be for safe storage. At 25°C, canola with an oil content of 45% is safe to store at <7.0% moisture content. Canola with 50% oil content is safe at <6.0% moisture content (see Figure 1).
The aim is to store the canola in conditions that achieve an equilibrium relative humidity of <60% in the storage (see Figure 1). This reduces the risk of mould development, canola self-heating and oil quality deterioration.
Use of aeration to cool seed temperatures to ≤20°C is a key aid to reliable canola storage. 6
Figure 1:
35 37 39 41 43 45 47 49 51 53 55
9.59.08.58.07.57.06.56.05.55.0
Seed oil content (% dry matter)
Seed
moi
stur
e co
nten
t (%
dry
mat
ter)
Safe storage conditions for canola at 60% equilibrium relative humidity. The relationship between seed moisture content and oil content is shown at 25°C (yellow line). Canola stored at conditions above the line is at potential risk of seed and oil quality loss. Source: CSIRO Stored Grain Research Laboratory
13.4 types of storage
Ideal storage for canola is a well-designed, cone-based, sealable silo fitted with aeration (Figure 2). The storage should be designed for minimum damage to seed, ease of cleaning and hygiene for empty storages, and suitability for effective use of aeration cooling.
If seed requires insect pest control, the silo is then sealed (gas-tight) for the required period as stated on the product label (usually 7–10 days) to enable effective phosphine fumigation. For all storage types, extra caution should be taken to prevent rain/water ingress into storages. 7
6 P Burrill (2012) Safe storage. Module 8. In Better canola—canola technology update for growers and advisors. Australian Oilseeds Federation, http://www.australianoilseeds.com/__data/assets/pdf_file/0019/9082/MODULE_8_-_Safe_Storage_of_Canola_Philip_Burrill_-_V2_Sep_2012.pdf
7 P Burrill (2012) Safe storage. Module 8. In Better canola—canola technology update for growers and advisors. Australian Oilseeds Federation, http://www.australianoilseeds.com/__data/assets/pdf_file/0019/9082/MODULE_8_-_Safe_Storage_of_Canola_Philip_Burrill_-_V2_Sep_2012.pdf
i MORE INFORMATION
Pressure testing sealable silos
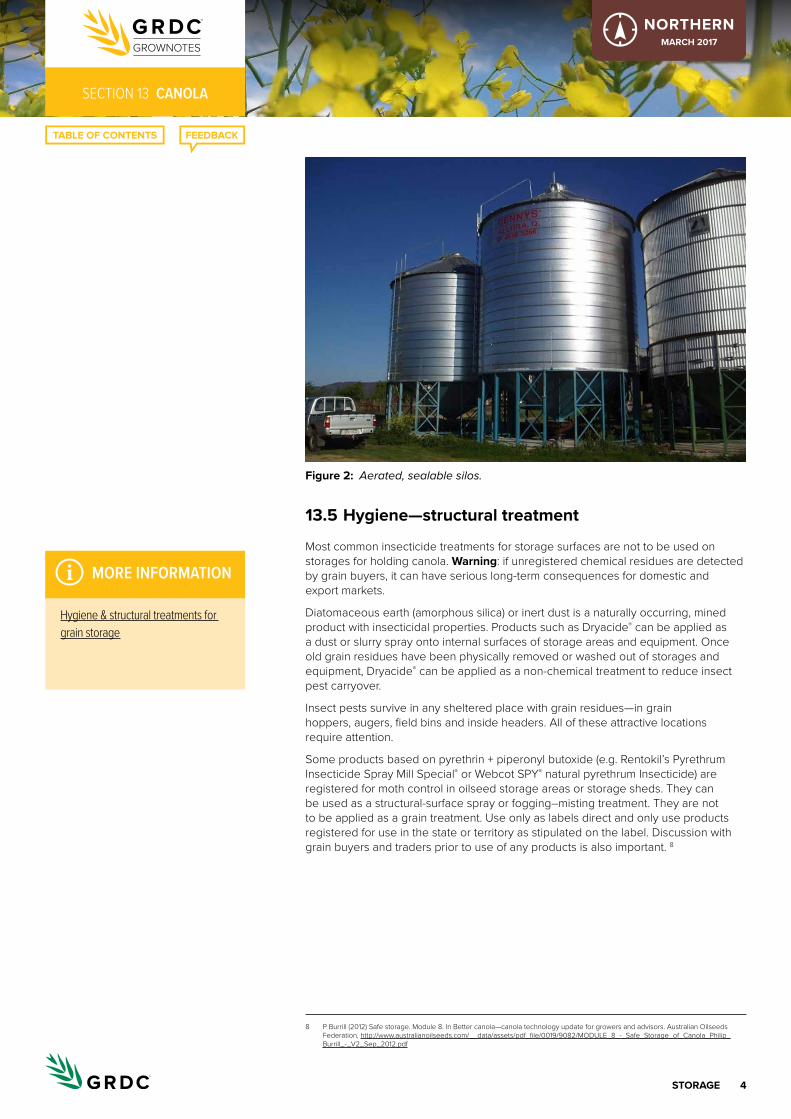
4Storage
seCtioN 13 CANOLA
NORTHERNMarch 2017
Figure 2: Aerated, sealable silos.
13.5 hygiene—structural treatment
Most common insecticide treatments for storage surfaces are not to be used on storages for holding canola. Warning: if unregistered chemical residues are detected by grain buyers, it can have serious long-term consequences for domestic and export markets.
Diatomaceous earth (amorphous silica) or inert dust is a naturally occurring, mined product with insecticidal properties. Products such as Dryacide® can be applied as a dust or slurry spray onto internal surfaces of storage areas and equipment. Once old grain residues have been physically removed or washed out of storages and equipment, Dryacide® can be applied as a non-chemical treatment to reduce insect pest carryover.
Insect pests survive in any sheltered place with grain residues—in grain hoppers, augers, field bins and inside headers. All of these attractive locations require attention.
Some products based on pyrethrin + piperonyl butoxide (e.g. Rentokil’s Pyrethrum Insecticide Spray Mill Special® or Webcot SPY® natural pyrethrum Insecticide) are registered for moth control in oilseed storage areas or storage sheds. They can be used as a structural-surface spray or fogging–misting treatment. They are not to be applied as a grain treatment. Use only as labels direct and only use products registered for use in the state or territory as stipulated on the label. Discussion with grain buyers and traders prior to use of any products is also important. 8
8 P Burrill (2012) Safe storage. Module 8. In Better canola—canola technology update for growers and advisors. Australian Oilseeds Federation, http://www.australianoilseeds.com/__data/assets/pdf_file/0019/9082/MODULE_8_-_Safe_Storage_of_Canola_Philip_Burrill_-_V2_Sep_2012.pdf
i MORE INFORMATION
hygiene & structural treatments for grain storage

5Storage
seCtioN 13 CANOLA
NORTHERNMarch 2017
13.6 aeration
Aeration should be considered an essential storage tool for canola. Correctly managed, it creates uniform, cool conditions in the seed bulk and slows most quality deterioration processes.
Aeration:• helps maintains oil quality — low free fatty acid content / rancidity, good colour
and odour; • reduces the risk of ‘hot spots’, moisture migration and mould development; • slows or stops breeding cycles of storage insect pests (e.g. rust-red flour beetle)
by maintaining grain temperatures at <20°C • maintains germination and seed vigour for longer when kept cool and dry. 9
Canola, being a much smaller seed than cereal grains, adds significantly more back-pressure to the aeration fan. This means that an aeration cooling system set up to produce airflows of 2–4 litres per second per tonne (L/s.t) in cereal grain will typically produce only 40–60% of that when used in canola.
When setting up storages to cater for cereals and canola, seek advice about the fan sizes and number required to achieve the 2–4 L/s.t.
Other factors that affect the amount of airflow through the grain:• depth of the grain in storage• amount of fine admixture and foreign plant material in the grain• design and size of fan ducting and venting on top of the silo
The area and type of ducting must be adequate to disperse the air through the storage and not to be blocked by the small canola seeds. Avoid splitting airflow from one fan into multiple silos, because the back-pressure in each silo will vary and incorrectly apportion the amount of airflow to each. This will be exacerbated if different grains are stored in each silo, such as canola in one and a cereal in the other. 10
Key points• Seek advice to ensure the right size aeration fans and associated equipment are
fitted — ducting, roof vents and fan controller. Not all silo suppliers get it right.• Recommended aeration cooling airflow rates are 2 to 4 litres of air per second,
per tonne (L/s/t). Do your aeration fans achieve this when your silos are full of wheat, barley, chickpeas, sorghum, canola?
• Are you achieving the target ‘grain temperatures’ of 18° to 23°C during summer storage and less than 15°C during the winter period?
• Aeration maintenance: farm case studies show that aeration equipment checks and maintenance can lead to a significant improvement to aeration performance and grain storage results.
• Recirculate air with a small fan during fumigation in a sealed silo (150–2000 tonnes) ensures rapid, uniform distributes of phosphine gas. Otherwise it can take 2–5 days for gas to reach all areas inside a silo. 11
13.6.1 aeration cooling Fans providing low airflow rates of ~2–4 L/s.t can both cool seed and provide uniform seed temperature and moisture conditions in the storage. Always check that the fan’s design and capacity is suitable for the small canola seed. In some cases, an aeration fan may not be able to create any airflow through canola.
9 P Burrill (2012) Safe storage. Module 8. In Better canola—canola technology update for growers and advisors. Australian Oilseeds Federation, http://www.australianoilseeds.com/__data/assets/pdf_file/0019/9082/MODULE_8_-_Safe_Storage_of_Canola_Philip_Burrill_-_V2_Sep_2012.pdf
10 GRDC (2014) Storing oilseeds. GRDC Stored Grain Information Hub, http://storedgrain.com.au/storing-oilseeds/
11 P Burrill (2016) Part I Achieving great aeration results and Part II Silo recirculation as an aid to fumigation. GRDC Update Papers 20 July 2016, https://grdc.com.au/Research-and-Development/GRDC-Update-Papers/2016/07/Part-I-Achieving-great-aeration-results-and-Part-II-Silo-recirculation-as-an-aid-to-fumigation
i MORE INFORMATION
aerating stored grain, cooling or drying for quality control
Performance testing aeration systems

6Storage
seCtioN 13 CANOLA
NORTHERNMarch 2017
Well-managed cooling aeration typically makes seed temperature fall safely to ~≤20°C within days. Regular checking of canola in storage is essential. Make visual inspections, check seed moisture, use a temperature probe to monitor bulk seed temperature, and sieve for insects. 12
13.6.2 automatic controllersOften, ‘aeration cooling’ fans are simply turned on and off manually or a timer clock is used. However, much can be gained by investing $5000–7000 in an automatic controller that selects the optimum run-times and ambient air conditions under which to turn on the fans. The controller continually monitors air temperatures and relative humidity and may select air from only 2 or 3 days in a week or fortnight. One unit has the capacity to control fans on multiple silos. 13
13.6.3 operation of aeration fans• Run fans constantly during the first 4–5 days when grain is first put into the silo.
This removes the ‘harvest heat’. Smell the air coming from the silo top-hatch. It should change from a warm, humid smell to a fresh, cool smell after 3–5 days. The first cooling front has moved through.
• For the next 5–7 days, set the controller to the ‘rapid’ setting. This turns fans on for the coolest 12 h of each day to reduce the seed temperature further.
• Finally, set the controller to the ‘normal’ mode. The fans are now turned on for ~100 hours per month, selecting the coolest air temperatures and avoiding high-humidity air. 14
13.6.4 aeration dryingWell-designed, purpose-built, high-flow-rate aeration-drying systems with airflow rates of 15–20 L/s.t can dry seed reliably. During aeration drying, fans should force large volumes of air through the grain bulk for many hours each day. This ensures that drying fronts are pushed quickly through so that seed at the top of the silo is not left sitting at excessively high moisture contents (Figure 3).
Seeds from oilseed crops are generally well suited to this form of drying when correctly managed. Utilise all ambient air available with relative humidity <70% to provide a low average relative humidity for each run time. This can reduce moisture content without the risk of heat damage to seed oil quality. Monitor regularly and take care that seed in the bottom of the silo is not over-dried. Seek advice when undertaking aeration drying for the first time.
Do not use aeration fans with low airflow rates when attempting to dry high-moisture seed.
Automatic controllers for aeration drying are also available to run fans at optimum ambient air conditions. Some controller models provide the option to switch to either cooling or drying function. Ensure that the controller is fitted with a good-quality relative humidity sensor. 15
12 P Burrill (2012) Safe storage. Module 8. In Better canola—canola technology update for growers and advisors. Australian Oilseeds Federation, http://www.australianoilseeds.com/__data/assets/pdf_file/0019/9082/MODULE_8_-_Safe_Storage_of_Canola_Philip_Burrill_-_V2_Sep_2012.pdf
13 P Burrill (2012) Safe storage. Module 8. In Better canola—canola technology update for growers and advisors. Australian Oilseeds Federation, http://www.australianoilseeds.com/__data/assets/pdf_file/0019/9082/MODULE_8_-_Safe_Storage_of_Canola_Philip_Burrill_-_V2_Sep_2012.pdf
14 P Burrill (2012) Safe storage. Module 8. In Better canola—canola technology update for growers and advisors. Australian Oilseeds Federation, http://www.australianoilseeds.com/__data/assets/pdf_file/0019/9082/MODULE_8_-_Safe_Storage_of_Canola_Philip_Burrill_-_V2_Sep_2012.pdf
15 P Burrill (2012) Safe storage. Module 8. In Better canola—canola technology update for growers and advisors. Australian Oilseeds Federation, http://www.australianoilseeds.com/__data/assets/pdf_file/0019/9082/MODULE_8_-_Safe_Storage_of_Canola_Philip_Burrill_-_V2_Sep_2012.pdf
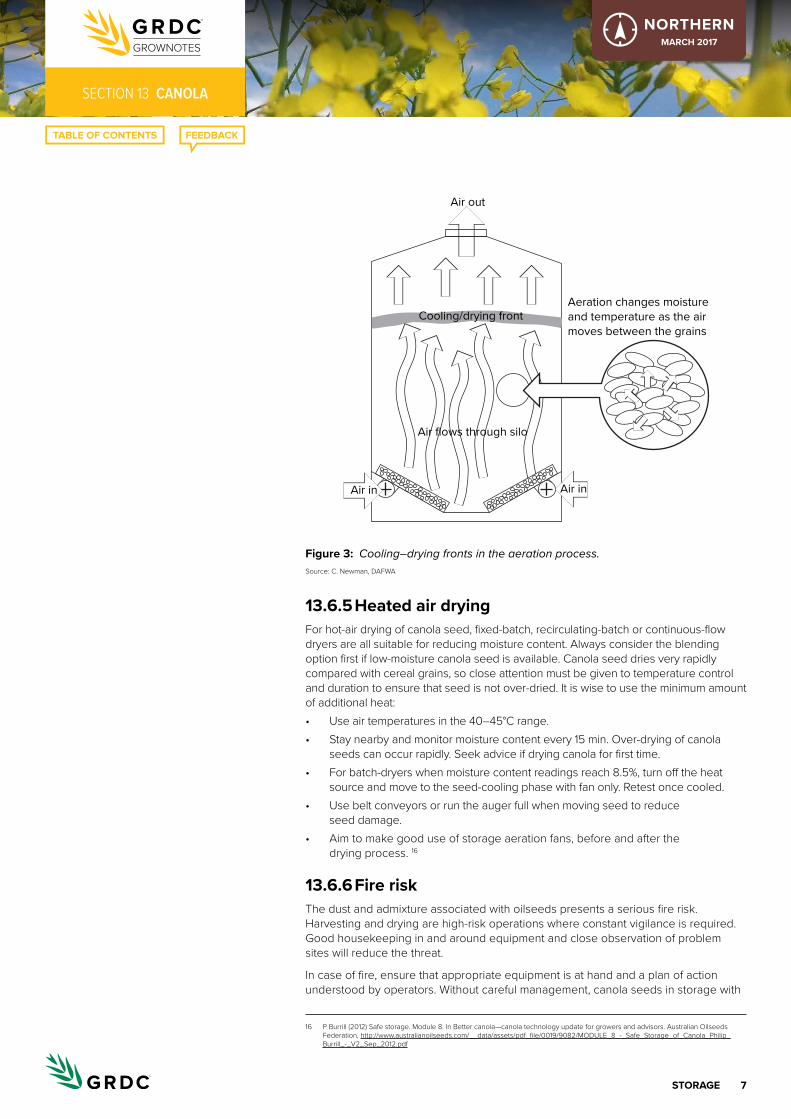
7Storage
seCtioN 13 CANOLA
NORTHERNMarch 2017
Figure 3:
Air out
Air flows through silo
Aeration changes moistureand temperature as the air moves between the grains
Cooling/drying front
Air inAir in
Cooling–drying fronts in the aeration process. Source: C. Newman, DAFWA
13.6.5 heated air drying For hot-air drying of canola seed, fixed-batch, recirculating-batch or continuous-flow dryers are all suitable for reducing moisture content. Always consider the blending option first if low-moisture canola seed is available. Canola seed dries very rapidly compared with cereal grains, so close attention must be given to temperature control and duration to ensure that seed is not over-dried. It is wise to use the minimum amount of additional heat:• Use air temperatures in the 40–45°C range.• Stay nearby and monitor moisture content every 15 min. Over-drying of canola
seeds can occur rapidly. Seek advice if drying canola for first time.• For batch-dryers when moisture content readings reach 8.5%, turn off the heat
source and move to the seed-cooling phase with fan only. Retest once cooled.• Use belt conveyors or run the auger full when moving seed to reduce
seed damage.• Aim to make good use of storage aeration fans, before and after the
drying process. 16
13.6.6 Fire risk The dust and admixture associated with oilseeds presents a serious fire risk. Harvesting and drying are high-risk operations where constant vigilance is required. Good housekeeping in and around equipment and close observation of problem sites will reduce the threat.
In case of fire, ensure that appropriate equipment is at hand and a plan of action understood by operators. Without careful management, canola seeds in storage with
16 P Burrill (2012) Safe storage. Module 8. In Better canola—canola technology update for growers and advisors. Australian Oilseeds Federation, http://www.australianoilseeds.com/__data/assets/pdf_file/0019/9082/MODULE_8_-_Safe_Storage_of_Canola_Philip_Burrill_-_V2_Sep_2012.pdf

8Storage
seCtioN 13 CANOLA
NORTHERNMarch 2017
high moisture content and/or high levels of admixture pose a risk of mould formation, heating and fire through spontaneous combustion. 17
13.7 Insect pest control
Several insect pests will infest stored oilseeds, usually favouring the grain surface. These are the rust-red flour beetle (Figure 4), Indian meal moth (Plodia interpunctella) (Figure 5), warehouse moths (Ephestia spp.) and psocids (Liposcelis spp.)
Figure 4: Rust-red flour beetle (Tribolium castaneum).
Figure 5: Indian meal moth (Plodia interpunctella).
These pests multiply rapidly given food, shelter, and warm, moist conditions. They can complete their full life cycle in about 4 weeks under optimum breeding temperatures of ~30°C.
Only a few treatments are registered for insect control in oilseeds. Always check labels prior to use and abide by use restrictions for different states and territories in Australia. For most states, treatments include phosphine, pyrethrins, DE, and ethyl formate as Vapormate®. Use of pyrethrins and DE should be limited to storage-area
17 P Burrill (2012) Safe storage. Module 8. In Better canola—canola technology update for growers and advisors. Australian Oilseeds Federation, http://www.australianoilseeds.com/__data/assets/pdf_file/0019/9082/MODULE_8_-_Safe_Storage_of_Canola_Philip_Burrill_-_V2_Sep_2012.pdf
i MORE INFORMATION
Northern and southern Regions. stored grain pests—identification
Fumigating with phosphine, other fumigants and controlled atmospheres
GRDC Update Paper: Finding storage pests early
GRDC Update Paper: Practical management of high level phosphine resistance in Rusty grain beetle

9Storage
seCtioN 13 CANOLA
NORTHERNMarch 2017
treatments, and Vapormate® is restricted for use by licensed fumigators only. This leaves phosphine as the key farm storage treatment for oilseed storage pests.
Phosphine fumigation must take place in a gas-tight, well-sealed silo. If the silo passes the standard pressure test, it shows that there are no serious leakage points. Given this, phosphine gas can be held in the silo at high enough concentrations for sufficient time to kill all life stages of the pest (eggs, larvae, pupae, adults).
Several silo manufacturers make aeratable, sealable silos that pass the Australian Standard Pressure Test—AS 2628. Like most oilseeds, canola seed has the ability to adsorb phosphine gas, and so it is important to use the full, correct label dose rate.
By using phosphine bag-chains, belts or blankets, placement and removal of the treatment is simplified. If using the standard phosphine tablets, ensure that tablets are kept separate from the canola seed by using trays so the spent tablet dust can be removed following fumigation.
If aeration cooling has been in use and the seed temperature is <25°C, ensure that the fumigation exposure period is ≥10 days. See product label for details.
Once the fumigation is completed, release the seal, vent the gas, and return the stored canola to aeration cooling. 18
13.7.1 Phosphine fumigation in large silos Results of QDAF trial fumigations with phosphine conducted in 1,400 t silos to test the capability of these large storages led to the following conclusions: • Recirculation greatly facilitates the distribution of gas in large silos.• Fumigation in large silos without recirculation results in much lower
concentrations in the base of the silo.• Peak concentrations of phosphine typically occur between day 4 and 6 and
decline for the rest of the fumigation.• The current pressure half-life Australian Standard (AS2628) of 5 minutes is
appropriate for large silos and is vital for effective fumigation.• Fumigations are likely to fail where there are points of gas / fresh air leaks in a
silo. Pressure testing prior to fumigation is a vital step in identifying and locating gas leaks.
• Strongly phosphine resistant rusty grain beetle can only be controlled by extending fumigation time beyond the label direction (of 20 d for blankets) or by implementing active recirculation. 19
Grain Storage Information Hotline: 1800 WEEVIL (1800 933 845) will put you in contact with your nearest grain storage specialist
18 P Burrill (2012) Safe storage. Module 8. In Better canola—canola technology update for growers and advisors. Australian Oilseeds Federation, http://www.australianoilseeds.com/__data/assets/pdf_file/0019/9082/MODULE_8_-_Safe_Storage_of_Canola_Philip_Burrill_-_V2_Sep_2012.pdf
19 A Ridley, P Burrill, P Collins (2016) Killing storage pests without mercy Narrabri. GRDC Update Papers 22 July 2016, https://grdc.com.au/Research-and-Development/GRDC-Update-Papers/2016/07/Killing-storage-pests-without-mercy-Narrabri

1eNVIroNMeNtal ISSUeS
seCtioN 14 CANOLA
NORTHERNMarch 2017
environmental issuesFrost, moisture stress and heat stress can all have an impact on grain yield, oil content and oil quality. Frost can occur at any time during the growth of the canola plant, but the most damaging frosts occur when pods are small. Pods affected at this time have a green to yellowish discoloration, then shrivel and eventually drop off. Pods affected later may appear blistered on the outside of the pod and usually have missing seeds.
Moisture stress and heat stress are linked; the plant will suffer heat stress at a lower temperature if it is also under moisture stress. Flower abortion, shorter flowering period, fewer pods, fewer seeds per pod and lower seed weight are the main effects, occurring either independently or in combination. 1
14.1 Frost
Once established, canola is relatively frost-tolerant, but damage can occur during the cotyledon stage and the seedlings can die if frosted. Plants become more frost-tolerant as they develop.
Seedling growth and vigour are reduced at temperatures <7°C, and occasionally seedlings will die.
Soluble carbohydrates accumulate when there is a rapid reduction in leaf temperature. This accumulation suppresses photosynthesis, and therefore seedling growth rates, during the cooler winter months. 2
Canola is least tolerant to frost damage from flowering to the clear watery stage (~60% moisture).
Symptoms include:• yellow-green discoloration of pods (Figure 1)• scarring of external pod surfaces• abortion of flowers (Figure 2)• shrivelling of pods• pods eventually dropping off (Figure 3)• shrivelling and absence of seeds (Figure 4).
1 T Potter (2009) The canola plant and how it grows. Ch. 3. In Canola best practice management guide for south-eastern Australia. (Eds D McCaffrey, T Potter, S Marcroft, F Pritchard) GRDC, http://www.grdc.com.au/uploads/documents/GRDC_Canola_Guide_All_1308091.pdf
2 J Edwards, K Hertel (2011) Canola growth and development. New South Wales Department of Primary Industries, http://www.dpi.nsw.gov.au/__data/assets/pdf_file/0004/516181/Procrop-canola-growth-and-development.pdf
i MORE INFORMATION
Phenology of canola cultivars in the northern region and implications for frost risk
DaFWa: Frost and cropping
GRDC Update papers: What’s going on with frost?
the GRDC National Frost initiative
Burnt stubble pre-empts frost risk
i MORE INFORMATION
Frost-damaged crops—where to from here?

2eNVIroNMeNtal ISSUeS
seCtioN 14 CANOLA
NORTHERNMarch 2017
Figure 1: Yellow-green discoloration of pods, compared with healthy green pods.
Figure 2: Canola plant showing various stages of pod loss and flower abortion.
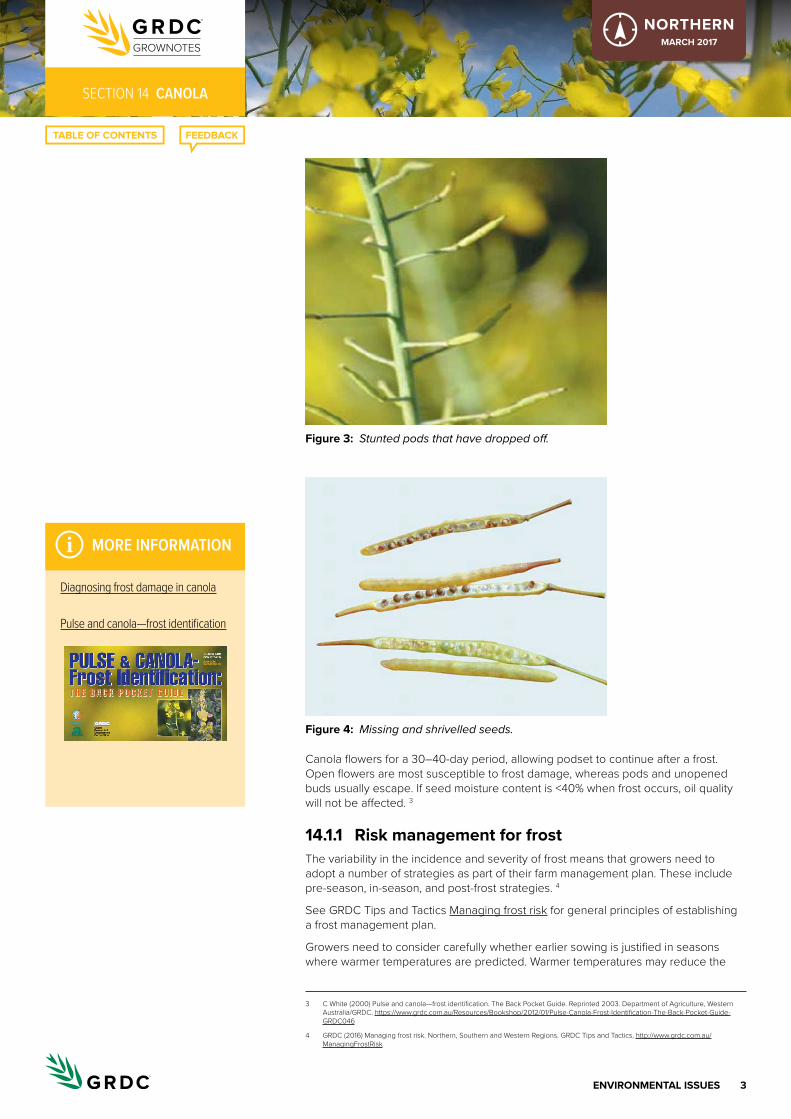
3eNVIroNMeNtal ISSUeS
seCtioN 14 CANOLA
NORTHERNMarch 2017
Figure 3: Stunted pods that have dropped off.
Figure 4: Missing and shrivelled seeds.
Canola flowers for a 30–40-day period, allowing podset to continue after a frost. Open flowers are most susceptible to frost damage, whereas pods and unopened buds usually escape. If seed moisture content is <40% when frost occurs, oil quality will not be affected. 3
14.1.1 risk management for frostThe variability in the incidence and severity of frost means that growers need to adopt a number of strategies as part of their farm management plan. These include pre-season, in-season, and post-frost strategies. 4
See GRDC Tips and Tactics Managing frost risk for general principles of establishing a frost management plan.
Growers need to consider carefully whether earlier sowing is justified in seasons where warmer temperatures are predicted. Warmer temperatures may reduce the
3 C White (2000) Pulse and canola—frost identification. The Back Pocket Guide. Reprinted 2003. Department of Agriculture, Western Australia/GRDC, https://www.grdc.com.au/Resources/Bookshop/2012/01/Pulse-Canola-Frost-Identification-The-Back-Pocket-Guide-GRDC046
4 GRDC (2016) Managing frost risk. Northern, Southern and Western Regions. GRDC Tips and Tactics, http://www.grdc.com.au/ManagingFrostRisk
i MORE INFORMATION
Diagnosing frost damage in canola
Pulse and canola—frost identification
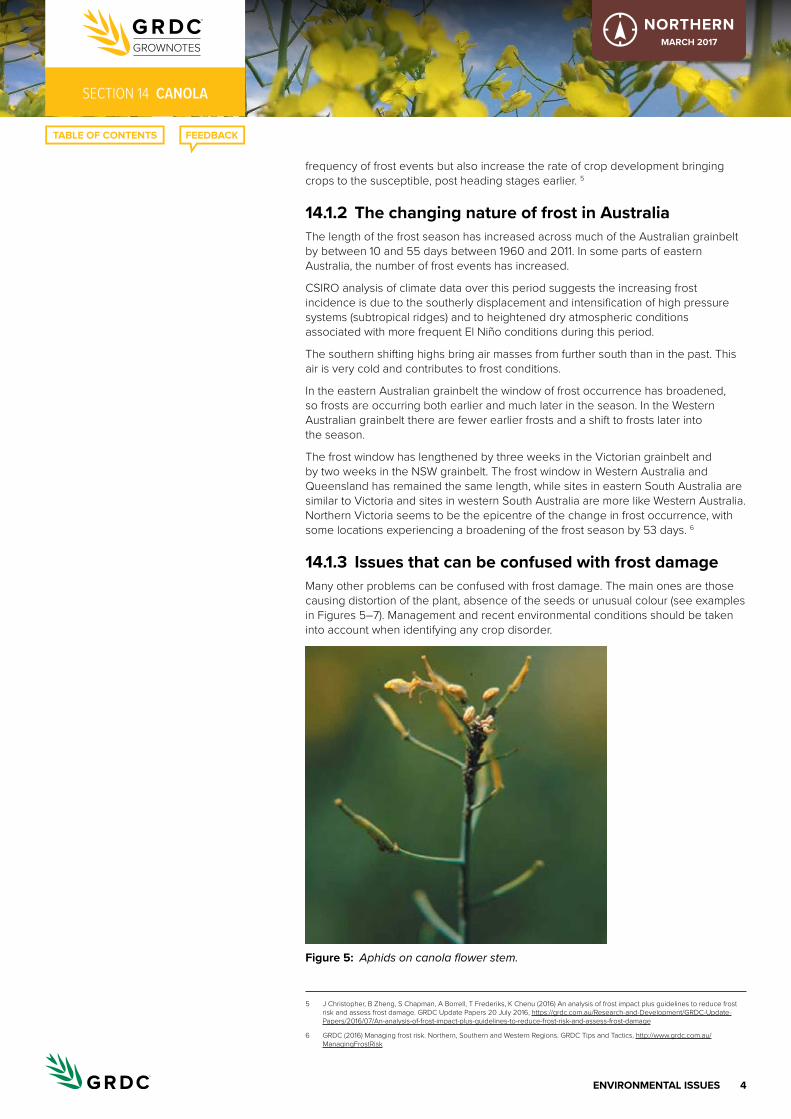
4eNVIroNMeNtal ISSUeS
seCtioN 14 CANOLA
NORTHERNMarch 2017
frequency of frost events but also increase the rate of crop development bringing crops to the susceptible, post heading stages earlier. 5
14.1.2 the changing nature of frost in australia The length of the frost season has increased across much of the Australian grainbelt by between 10 and 55 days between 1960 and 2011. In some parts of eastern Australia, the number of frost events has increased.
CSIRO analysis of climate data over this period suggests the increasing frost incidence is due to the southerly displacement and intensification of high pressure systems (subtropical ridges) and to heightened dry atmospheric conditions associated with more frequent El Niño conditions during this period.
The southern shifting highs bring air masses from further south than in the past. This air is very cold and contributes to frost conditions.
In the eastern Australian grainbelt the window of frost occurrence has broadened, so frosts are occurring both earlier and much later in the season. In the Western Australian grainbelt there are fewer earlier frosts and a shift to frosts later into the season.
The frost window has lengthened by three weeks in the Victorian grainbelt and by two weeks in the NSW grainbelt. The frost window in Western Australia and Queensland has remained the same length, while sites in eastern South Australia are similar to Victoria and sites in western South Australia are more like Western Australia. Northern Victoria seems to be the epicentre of the change in frost occurrence, with some locations experiencing a broadening of the frost season by 53 days. 6
14.1.3 Issues that can be confused with frost damageMany other problems can be confused with frost damage. The main ones are those causing distortion of the plant, absence of the seeds or unusual colour (see examples in Figures 5–7). Management and recent environmental conditions should be taken into account when identifying any crop disorder.
Figure 5: Aphids on canola flower stem.
5 J Christopher, B Zheng, S Chapman, A Borrell, T Frederiks, K Chenu (2016) An analysis of frost impact plus guidelines to reduce frost risk and assess frost damage. GRDC Update Papers 20 July 2016, https://grdc.com.au/Research-and-Development/GRDC-Update-Papers/2016/07/An-analysis-of-frost-impact-plus-guidelines-to-reduce-frost-risk-and-assess-frost-damage
6 GRDC (2016) Managing frost risk. Northern, Southern and Western Regions. GRDC Tips and Tactics, http://www.grdc.com.au/ManagingFrostRisk

5eNVIroNMeNtal ISSUeS
seCtioN 14 CANOLA
NORTHERNMarch 2017
Figure 6: Sulfur deficiency and aphids. Flower petals retained; pods stunted with yellowing-reddening.
Figure 7: Herbicide damage in lupins.
It is important to remember that frost damage is random and sporadic, and not all plants (or parts of plants) will be affected, whereas most disease, nutrient and moisture-related symptoms will follow soil type. 7
The optimum temperature range for leaf development of canola is 13°–22°C. At higher temperatures, growth is faster, and the period of leaf development is therefore shorter. Lower temperatures do not reduce yield in early growth, except when heavy frosts occur, but they do slow the rate of development. As temperatures increase to >20°C in July and August, yields are reduced.
7 C White (2000) Pulse and canola—frost identification. The Back Pocket Guide. Reprinted 2003. Department of Agriculture, Western Australia/GRDC, https://www.grdc.com.au/Resources/Bookshop/2012/01/Pulse-Canola-Frost-Identification-The-Back-Pocket-Guide-GRDC046

6eNVIroNMeNtal ISSUeS
seCtioN 14 CANOLA
NORTHERNMarch 2017
For frost injury, ice must form between or inside the cells. Water surrounding the plant cells will freeze at 0°C, but water inside the cells needs to be a few degrees cooler to freeze. The length of exposure of the plant to cold is another important factor. Plants can be cold-hardened by repeated exposure over several days. They can survive –8°C to –12°C in Canada, but exposure to warm weather will reverse this hardening, making the plants susceptible to temperatures of –3°C to –4°C. 8
Crops that have been treated with herbicides before or immediately after frosts will often show greater effect. Growers should delay herbicide applications until the crop is actively growing.
14.2 Waterlogging and flooding
14.2.1 Symptoms of waterloggingPaddock symptoms:• Poor germination or purple-yellow plants can occur in areas that collect water.• Bare wet soil and/or water-loving weeds are present.• Plant lodging and early death occur in waterlogging-prone areas.• Saline areas are more affected.
Plant symptoms:• Waterlogged seedlings can die before emergence or show symptoms similar to
nitrogen deficiency.• Lower leaves turn purple-red to yellow, then die.• Prolonged waterlogging causes root death and eventually death of the whole
plant; plants are more susceptible to root disease.• Waterlogging of adult plants causes yellowing of lower leaves.• Salinity magnifies waterlogging effects, with more marked stunting and oldest
leaf marginal necrosis and death. 9
14.2.2 effect on yieldCanola roots need a good mix of water and air in the soil. When the amount of water exceeds the soil’s water-holding capacity, waterlogging may occur. Canola is susceptible to waterlogging and shows a yield reduction after only 3 days.
The severity of yield loss depends on the growth stage at the time of waterlogging, the duration of waterlogging, and the temperature (Figure 8).
8 J Edwards, K Hertel (2011) Canola growth and development. New South Wales Department of Primary Industries, http://www.dpi.nsw.gov.au/__data/assets/pdf_file/0004/516181/Procrop-canola-growth-and-development.pdf
9 DAFWA. Diagnosing waterlogging in canola. MyCrop. Department of Agriculture and Food Western Australia, https://www.agric.wa.gov.au/mycrop/diagnosing-waterlogging-canola
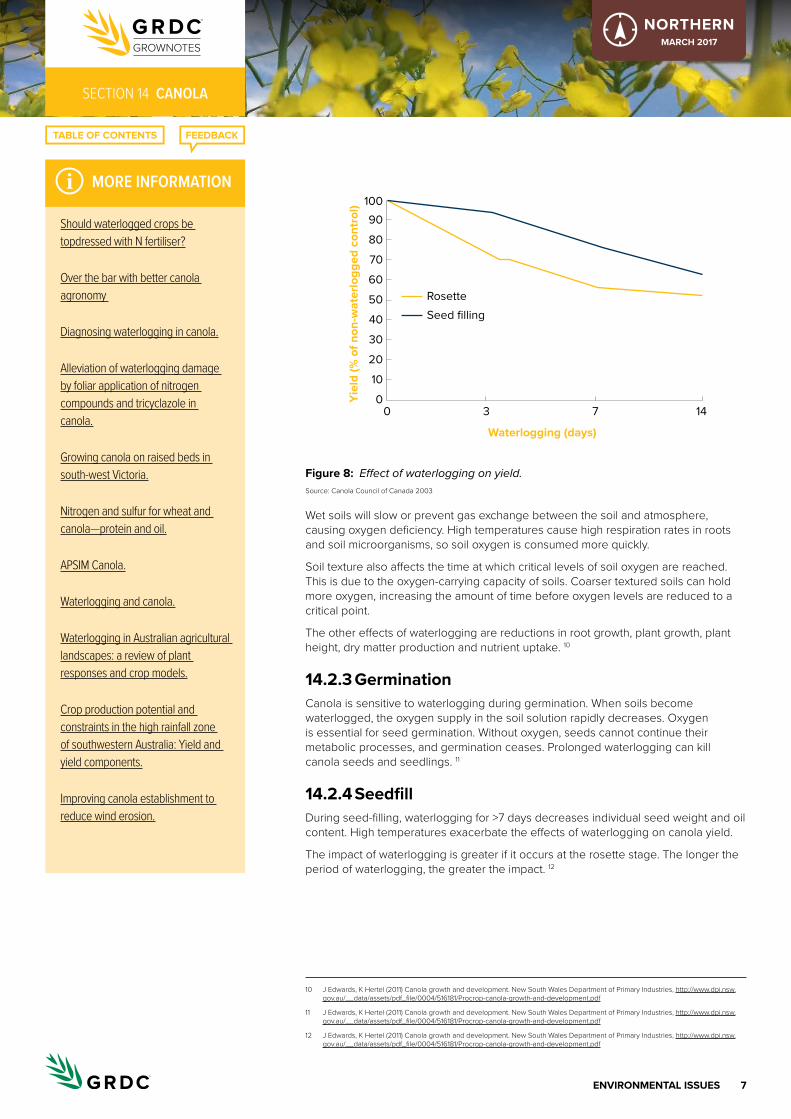
7eNVIroNMeNtal ISSUeS
seCtioN 14 CANOLA
NORTHERNMarch 2017
Figure 8:
Yie
ld (%
of n
on-w
ater
logg
ed c
ontr
ol)
Waterlogging (days)
100
90
80
70
60
50
40
30
20
10
00 3 7 14
Rosette
Seed filling
Effect of waterlogging on yield. Source: Canola Council of Canada 2003
Wet soils will slow or prevent gas exchange between the soil and atmosphere, causing oxygen deficiency. High temperatures cause high respiration rates in roots and soil microorganisms, so soil oxygen is consumed more quickly.
Soil texture also affects the time at which critical levels of soil oxygen are reached. This is due to the oxygen-carrying capacity of soils. Coarser textured soils can hold more oxygen, increasing the amount of time before oxygen levels are reduced to a critical point.
The other effects of waterlogging are reductions in root growth, plant growth, plant height, dry matter production and nutrient uptake. 10
14.2.3 germinationCanola is sensitive to waterlogging during germination. When soils become waterlogged, the oxygen supply in the soil solution rapidly decreases. Oxygen is essential for seed germination. Without oxygen, seeds cannot continue their metabolic processes, and germination ceases. Prolonged waterlogging can kill canola seeds and seedlings. 11
14.2.4 SeedfillDuring seed-filling, waterlogging for >7 days decreases individual seed weight and oil content. High temperatures exacerbate the effects of waterlogging on canola yield.
The impact of waterlogging is greater if it occurs at the rosette stage. The longer the period of waterlogging, the greater the impact. 12
10 J Edwards, K Hertel (2011) Canola growth and development. New South Wales Department of Primary Industries, http://www.dpi.nsw.gov.au/__data/assets/pdf_file/0004/516181/Procrop-canola-growth-and-development.pdf
11 J Edwards, K Hertel (2011) Canola growth and development. New South Wales Department of Primary Industries, http://www.dpi.nsw.gov.au/__data/assets/pdf_file/0004/516181/Procrop-canola-growth-and-development.pdf
12 J Edwards, K Hertel (2011) Canola growth and development. New South Wales Department of Primary Industries, http://www.dpi.nsw.gov.au/__data/assets/pdf_file/0004/516181/Procrop-canola-growth-and-development.pdf
i MORE INFORMATION
should waterlogged crops be topdressed with N fertiliser?
over the bar with better canola agronomy
Diagnosing waterlogging in canola.
alleviation of waterlogging damage by foliar application of nitrogen compounds and tricyclazole in canola.
Growing canola on raised beds in south-west Victoria.
Nitrogen and sulfur for wheat and canola—protein and oil.
aPsiM Canola.
Waterlogging and canola.
Waterlogging in australian agricultural landscapes: a review of plant responses and crop models.
Crop production potential and constraints in the high rainfall zone of southwestern australia: Yield and yield components.
improving canola establishment to reduce wind erosion.
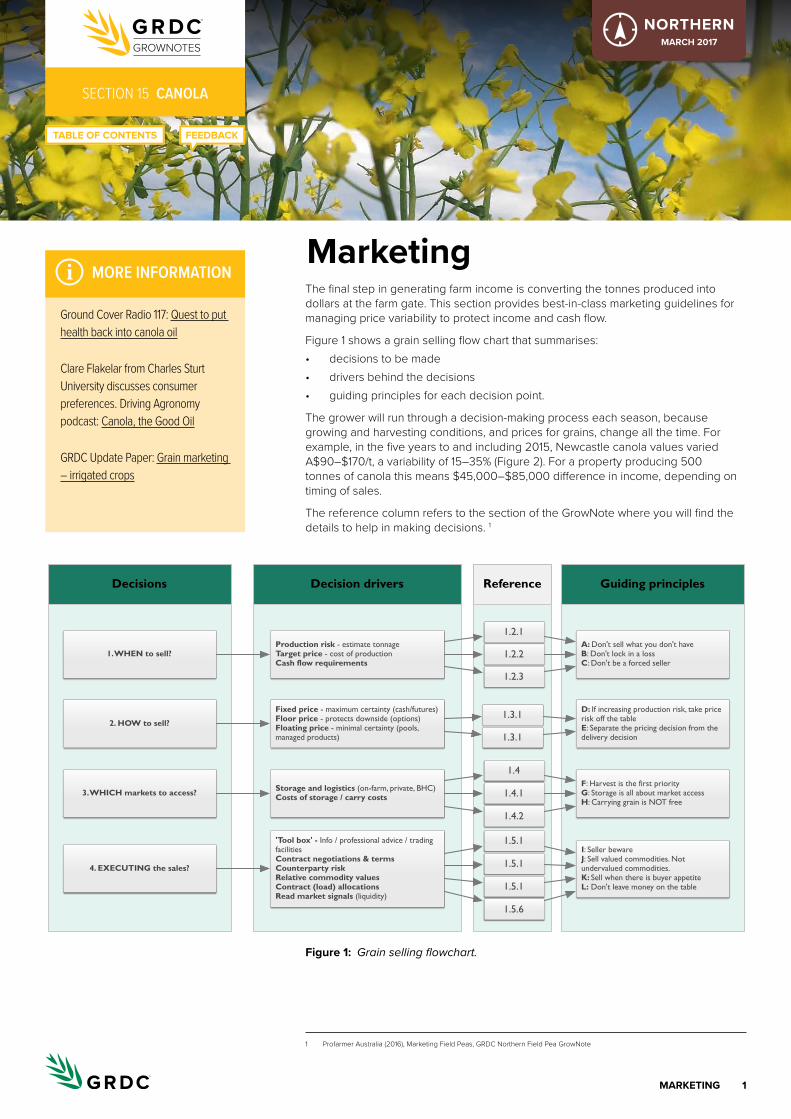
1MarKetINg
seCtioN 15 CANOLA
NORTHERNMarch 2017
MarketingThe final step in generating farm income is converting the tonnes produced into dollars at the farm gate. This section provides best-in-class marketing guidelines for managing price variability to protect income and cash flow.
Figure 1 shows a grain selling flow chart that summarises:• decisions to be made• drivers behind the decisions• guiding principles for each decision point.
The grower will run through a decision-making process each season, because growing and harvesting conditions, and prices for grains, change all the time. For example, in the five years to and including 2015, Newcastle canola values varied A$90–$170/t, a variability of 15–35% (Figure 2). For a property producing 500 tonnes of canola this means $45,000–$85,000 difference in income, depending on timing of sales.
The reference column refers to the section of the GrowNote where you will find the details to help in making decisions. 1
Figure 1: Grain selling flowchart.
1 Profarmer Australia (2016), Marketing Field Peas, GRDC Northern Field Pea GrowNote
Decisions Decision drivers Guiding principles
1. WHEN to sell?
2. HOW to sell?
3. WHICH markets to access?
4. EXECUTING the sales?
Production risk - estimate tonnageTarget price - cost of productionCash flow requirements
Fixed price - maximum certainty (cash/futures)Floor price - protects downside (options)Floating price - minimal certainty (pools, managed products)
Storage and logistics (on-farm, private, BHC)Costs of storage / carry costs
'Tool box' - Info / professional advice / trading facilitiesContract negotiations & termsCounterparty riskRelative commodity valuesContract (load) allocationsRead market signals (liquidity)
Reference
A: Don't sell what you don't haveB: Don't lock in a lossC: Don't be a forced seller
D: If increasing production risk, take price risk off the tableE: Separate the pricing decision from the delivery decision
F: Harvest is the first priorityG: Storage is all about market accessH: Carrying grain is NOT free
I: Seller bewareJ: Sell valued commodities. Not undervalued commodities.K: Sell when there is buyer appetiteL: Don't leave money on the table
1.2.2
1.2.3
1.3.1
1.4
1.4.1
1.4.2
1.5.1
1.5.1
1.5.1
1.2.1
1.3.1
1.5.6
i MORE INFORMATION
Ground Cover Radio 117: Quest to put health back into canola oil
Clare Flakelar from Charles sturt University discusses consumer preferences. Driving agronomy podcast: Canola, the Good oil
GRDC Update Paper: Grain marketing – irrigated crops

2MarKetINg
seCtioN 15 CANOLA
NORTHERNMarch 2017
Figure 2: Intraseasonal variance of Newcastle canola values. Source: Profarmer Australia
15.1 Selling principles
The aim of a selling program is to achieve a profitable average price (the target price) across the entire business. This requires managing several unknowns to establish a target price and then work towards achieving the target price.
Unknowns include the amount of grain available to sell (production variability), the final cost of producing the grain, and the future prices that may result. Australian farm gate prices are subject to volatility caused by a range of global factors that are beyond our control and are difficult to predict.
The skills growers have developed to manage production unknowns can also be used to manage pricing unknowns. This guide will help growers manage and overcome price uncertainty. 2
15.1.1 Be preparedBeing prepared by having a selling plan is essential for managing uncertainty. The steps involved are forming a selling strategy, and forming a plan for effectively executing sales. The selling strategy consists of when and how to sell.
When to sellKnowing when to sell requires an understanding of the farm’s internal business factors, including:• production risk• a target price based on the cost of production and the desired profit margin• business cashflow requirements.
How to sellWorking out how to sell your grain is more dependent on external market factors, including:• the time of year—determines the pricing method• market access—determines where to sell• relative value—determines what to sell.
2 Profarmer Australia (2016), Marketing Field Peas, GRDC Northern Field Pea GrowNote
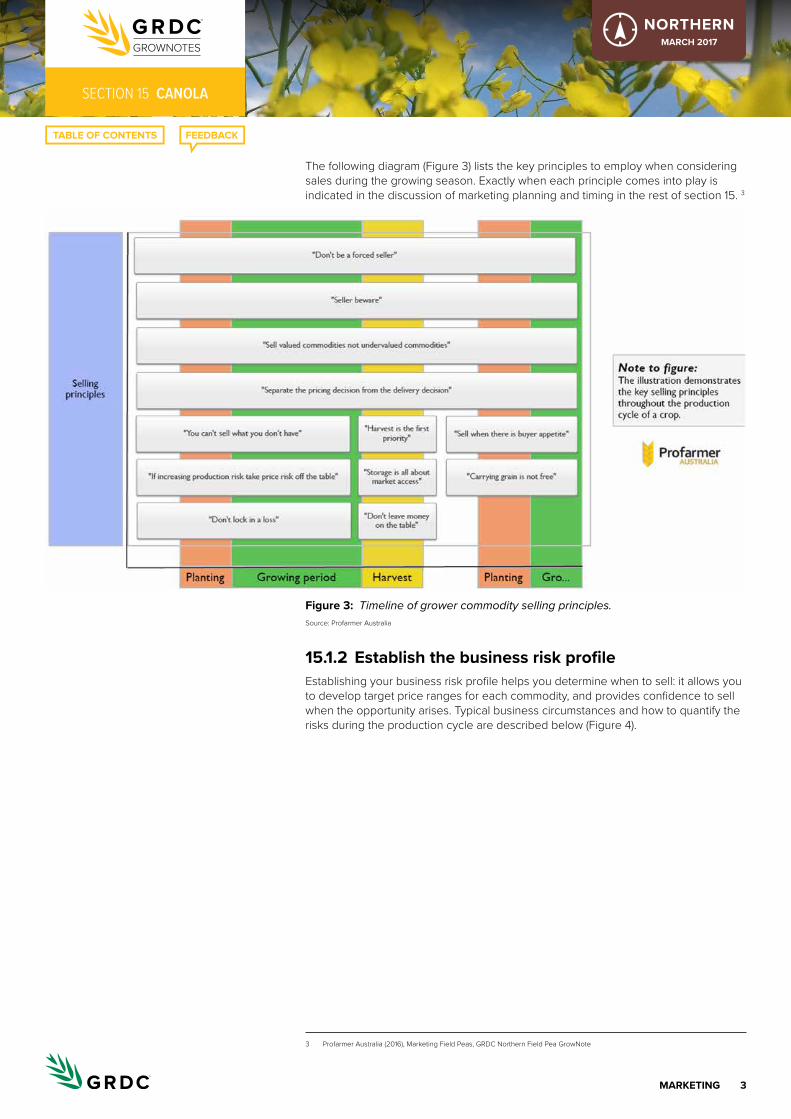
3MarKetINg
seCtioN 15 CANOLA
NORTHERNMarch 2017
The following diagram (Figure 3) lists the key principles to employ when considering sales during the growing season. Exactly when each principle comes into play is indicated in the discussion of marketing planning and timing in the rest of section 15. 3
Figure 3: Timeline of grower commodity selling principles. Source: Profarmer Australia
15.1.2 establish the business risk profileEstablishing your business risk profile helps you determine when to sell: it allows you to develop target price ranges for each commodity, and provides confidence to sell when the opportunity arises. Typical business circumstances and how to quantify the risks during the production cycle are described below (Figure 4).
3 Profarmer Australia (2016), Marketing Field Peas, GRDC Northern Field Pea GrowNote
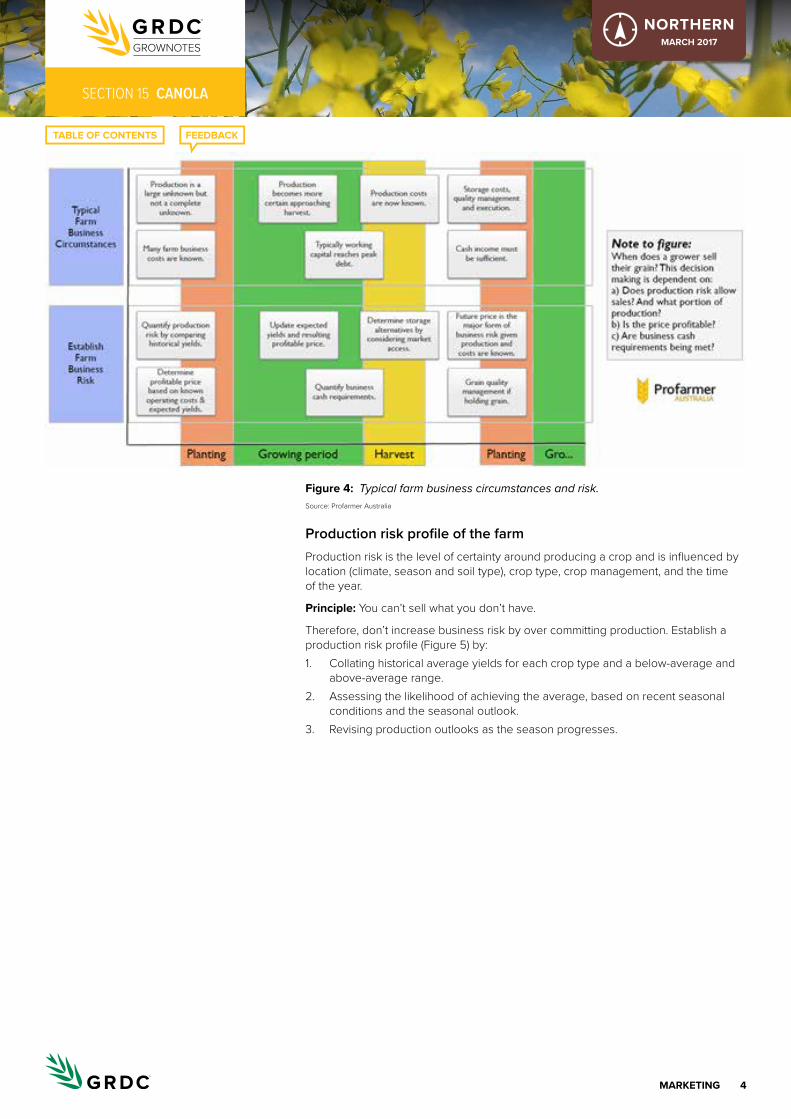
4MarKetINg
seCtioN 15 CANOLA
NORTHERNMarch 2017
Figure 4: Typical farm business circumstances and risk. Source: Profarmer Australia
Production risk profile of the farmProduction risk is the level of certainty around producing a crop and is influenced by location (climate, season and soil type), crop type, crop management, and the time of the year.
Principle: You can’t sell what you don’t have.
Therefore, don’t increase business risk by over committing production. Establish a production risk profile (Figure 5) by:1. Collating historical average yields for each crop type and a below-average and
above-average range.2. Assessing the likelihood of achieving the average, based on recent seasonal
conditions and the seasonal outlook.3. Revising production outlooks as the season progresses.

5MarKetINg
seCtioN 15 CANOLA
NORTHERNMarch 2017
Figure 5: Typical risk profile of a farm operation. Source: Profarmer Australia
Establishing a target priceA profitable commodity target price is the cost of production per tonne plus a desired profit margin. It is essential to know the cost of production per tonne for the farm business, which means knowing all farming costs, both variable and fixed.
Principle: Don’t lock in a loss.
If committing production ahead of harvest, ensure the price will be profitable. The steps needed to calculate an estimated profitable price is based on the total cost of production and a range of yield scenarios, as provided below (Figure 6).

6MarKetINg
seCtioN 15 CANOLA
NORTHERNMarch 2017
estimating cost of production - WheatPlanted area 1,200 haEstimate yield 2.85 t/haEstimated production 3,420 tFixed costsInsurance and general expenses $100,000Finance $80,000Depreciation/Capital replacement
$70,000
Drawings $60,000Other $30,000Variable costsSeed and sowing $48,000Fertiliser and application $156,000Herbicide and application $78,000Insect/fungicide and application $36,000Harvest costs $48,000Crop insurance $18,000Total fixed and variable costs $724,000Per tonne equivalent (total costs + estimated production)
$212 /t
Per tonne costsLevies $3 /tCartage $12 /tReceival fee $11 /tFreight to port $22 /tTotal per tonne costs $48 /tCost of production port FIS equiv $259.20Target profit (ie 20%) $52.00Target price (port FIS equiv) $311.20
Figure 6: An example of how to estimate the costs of production. Source: Profarmer Australia
GRDC’s manual Farming the Business also provides a cost-of-production template and tips on grain selling v. grain marketing.
Income requirementsUnderstanding farm business cash flow requirements and peak cash debt enables growers to time grain sales so that cash is available when required. This prevents having to sell grain below the target price to satisfy a need for cash.
Principle: Don’t be a forced seller.
Be ahead of cash requirements to avoid selling in unfavourable markets.
Typical cash flow to grow a crop are illustrated below (Figures 7 and 8). Costs are incurred up front and during the growing season, with peak working capital debt incurred at or before harvest. Patterns will vary depending on circumstance and enterprise mix. Figure 8 demonstrates how managing sales can change the farm’s cash balance.
Step 1: Estimate your production potential. The more uncertain your production is, the more conservative the yield estimate should be. As yield falls, your cost of production per tonne will rise.
Step 2: Attribute your fixed farm business costs. In this instance if 1,200 ha reflects 1/3 of the farm enterprise, we have attributed 1/3 fixed costs. There are a number of methods for doing this (see M Krause ‘Farming your Business’) but the most important thing is that in the end all costs are accounted for.
Step 3: Calculate all the variable costs attributed to producing that crop. This can also be expressed as $ per ha × planted area.
Step 4: Add together fixed and variable costs and divide by estimated production
Step 5: Add on the 'Per tonne' costs like levies and freight.
Step 6: Add the 'Per tonne' costs to the fixed and variable per tonne costs calculated at step 4.
Step 7: Add a desired profit margin to arrive at the port equivalent target profitable price.

7MarKetINg
seCtioN 15 CANOLA
NORTHERNMarch 2017
Figure 7: Typical operating cash balance when relying on cash sales at harvest. Source: Profarmer Australia
Figure 8: Typical operating cash balance when crop sales are spread over the year. Source: Profarmer Australia
The ‘when to sell’ steps above result in an estimated production tonnage and the risk associated with producing that tonnage, a target price range for each commodity, and the time of year when cash is most needed. 4
15.1.3 Managing your priceThe first part of the selling strategy answers the question about when to sell and establishes comfort around selling a portion of the harvest.
4 Profarmer Australia (2016), Marketing Field Peas, GRDC Northern Field Pea GrowNote

8MarKetINg
seCtioN 15 CANOLA
NORTHERNMarch 2017
The second part of the strategy, managing your price, addresses how to sell your crop.
Methods of price managementPricing products provide varying levels of price risk coverage, but not all products are available for all crops (Table 1).
table 1: Pricing methods and how they are used for different crops.
Description Wheat Barley canola oats lupins Field peas
chick peas
Fixed price products
Provides the most price certainty
Cash, futures, bank swaps
Cash, futures, bank swaps
Cash, futures, bank swaps
Cash Cash Cash Cash
Floor price products
Limits price downside but provides exposure to future price upside
Options on futures, floor price pools
Options on futures
Options on futures
none none none none
Floating price products
Subject to both price upside and downside
Pools Pools Pools Pools Pools Pools Pools
Figure 9 summarises how the different methods of price management are suited to the majority of farm businesses.
Figure 9: Price strategy timeline, summarising the suitability for most farm businesses of different methods of price management for different phases of production. Source: Profarmer Australia
Principle: If increasing production risk, take price risk off the table.
When committing to unknown production, price certainty should be achieved to avoid increasing overall business risk.

9MarKetINg
seCtioN 15 CANOLA
NORTHERNMarch 2017
Principle: Separate the pricing decision from the delivery decision.
Most commodities can be sold at any time with delivery timeframes being negotiable, hence price management is not determined by delivery.
Fixed price
A fixed price is achieved via cash sales and/or selling a futures position (swaps) (Figure 10). It provides some certainty around expected revenue from a sale as the price is largely a known factor, except when there is a floating component in the price, e.g. a multi-grade cash contract with floating spreads or a floating-basis component on futures positions.
Figure 10: Fixed price strategy. Source: Profarmer Australia
Floor price
Floor price strategies (Figure 11) can be achieved by utilising options on a relevant futures exchange (if one exists), or via a managed-sales program (i.e. a pool with a defined floor price strategy) offered by a third party. This pricing method protects against potential future price decrease while capturing any price increase. The disadvantage is that this kind of price ‘insurance’ has a cost, which adds to the farm’s cost of production.
Figure 11: Floor price strategy. Source: Profarmer Australia

10MarKetINg
seCtioN 15 CANOLA
NORTHERNMarch 2017
3. Floating price
Many of the pools or managed-sales programs are a floating price, where the net price received will move up and down with the future movement in price (Figure 12). Floating price products provide the least price certainty and are best suited for use at or after harvest rather than before harvest.
Figure 12: Floating price strategy. Source: Profarmer Australia
Having considered the variables of production for the crop to be sold, and how these fit against the different pricing mechanisms, the farmer may revise their selling strategy, taking the risks associated with each mechanism into account.
Fixed price strategies include physical cash sales or futures products, and provide the most price certainty, but production risk must be considered.
Floor price strategies include options or floor price pools. They provide a minimum price with upside potential and rely less on production certainty, but cost more.
Floating price strategies provide minimal price certainty, and so are best used after harvest. 5
15.1.4 ensuring access to marketsOnce the questions of when and how to sell are sorted out, planning moves to the storage and delivery of commodities to ensure timely access to markets and execution of sales. Planning where to store the commodity is an important component of ensuring the type of access to the market that is likely to yield the highest return (Figure 13).
5 Profarmer Australia (2016), Marketing Field Peas, GRDC Northern Field Pea GrowNote
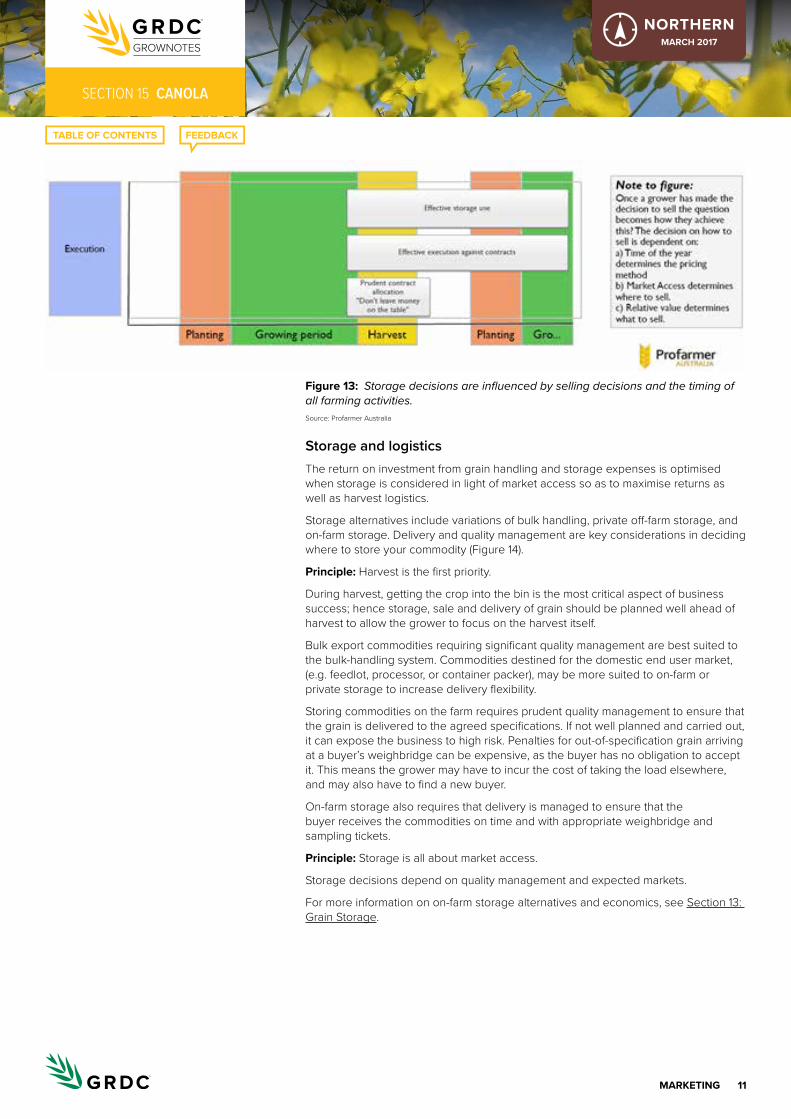
11MarKetINg
seCtioN 15 CANOLA
NORTHERNMarch 2017
Figure 13: Storage decisions are influenced by selling decisions and the timing of all farming activities. Source: Profarmer Australia
Storage and logisticsThe return on investment from grain handling and storage expenses is optimised when storage is considered in light of market access so as to maximise returns as well as harvest logistics.
Storage alternatives include variations of bulk handling, private off-farm storage, and on-farm storage. Delivery and quality management are key considerations in deciding where to store your commodity (Figure 14).
Principle: Harvest is the first priority.
During harvest, getting the crop into the bin is the most critical aspect of business success; hence storage, sale and delivery of grain should be planned well ahead of harvest to allow the grower to focus on the harvest itself.
Bulk export commodities requiring significant quality management are best suited to the bulk-handling system. Commodities destined for the domestic end user market, (e.g. feedlot, processor, or container packer), may be more suited to on-farm or private storage to increase delivery flexibility.
Storing commodities on the farm requires prudent quality management to ensure that the grain is delivered to the agreed specifications. If not well planned and carried out, it can expose the business to high risk. Penalties for out-of-specification grain arriving at a buyer’s weighbridge can be expensive, as the buyer has no obligation to accept it. This means the grower may have to incur the cost of taking the load elsewhere, and may also have to find a new buyer.
On-farm storage also requires that delivery is managed to ensure that the buyer receives the commodities on time and with appropriate weighbridge and sampling tickets.
Principle: Storage is all about market access.
Storage decisions depend on quality management and expected markets.
For more information on on-farm storage alternatives and economics, see Section 13: Grain Storage.

12MarKetINg
seCtioN 15 CANOLA
NORTHERNMarch 2017
Figure 14: Grain storage decision-making. Source: Profarmer Australia
Cost of holding grainStoring grain to access sales opportunities post-harvest invokes a cost to ‘carry’, or hold, the grain. Price targets for carried grain need to account for the cost of carrying it. Carrying costs are typically $3–4/t per month and consist of:• monthly storage fee charged by a commercial provider (typically ~$1.50–2.00/t)• monthly interest associated with having wealth tied up in grain rather than
available as cash or for paying off debt (~$1.50–$2.00/t, depending on the price of the commodity and interest rates).
The price of carried grain therefore needs to be $3–4/t per month higher than the price offered at harvest (Figure 15).
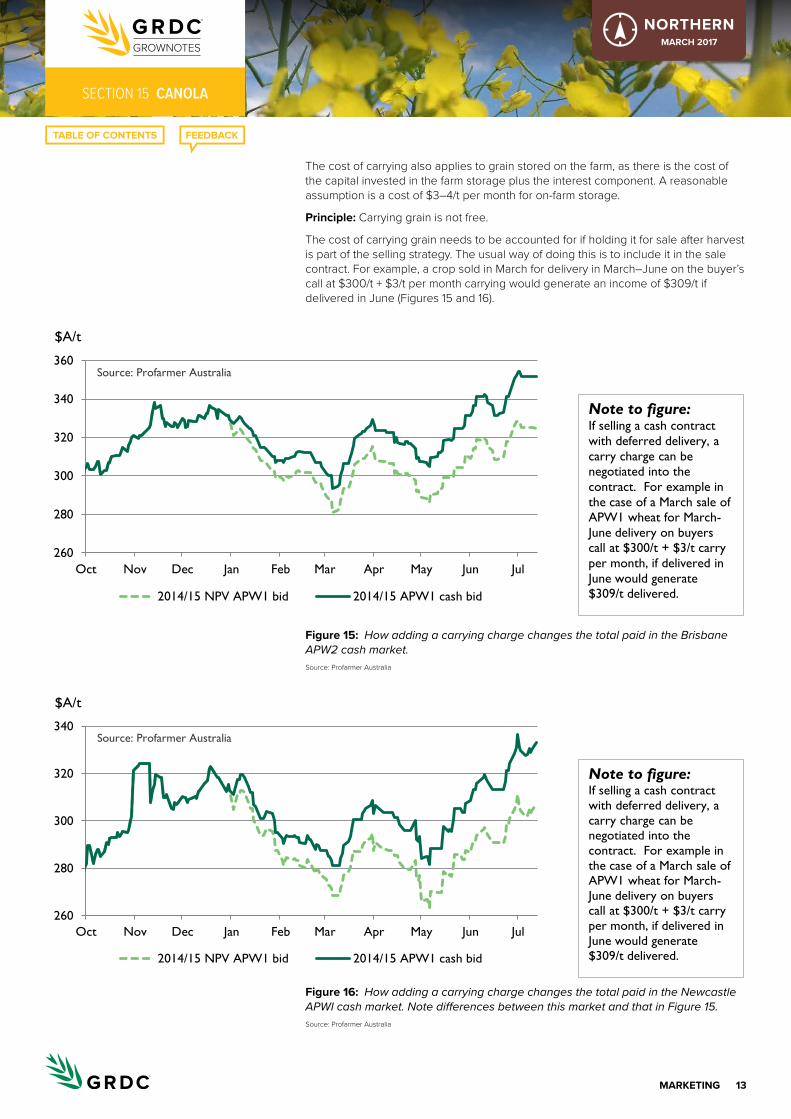
13MarKetINg
seCtioN 15 CANOLA
NORTHERNMarch 2017
The cost of carrying also applies to grain stored on the farm, as there is the cost of the capital invested in the farm storage plus the interest component. A reasonable assumption is a cost of $3–4/t per month for on-farm storage.
Principle: Carrying grain is not free.
The cost of carrying grain needs to be accounted for if holding it for sale after harvest is part of the selling strategy. The usual way of doing this is to include it in the sale contract. For example, a crop sold in March for delivery in March–June on the buyer’s call at $300/t + $3/t per month carrying would generate an income of $309/t if delivered in June (Figures 15 and 16).
Figure 15: How adding a carrying charge changes the total paid in the Brisbane APW2 cash market. Source: Profarmer Australia
Figure 16: How adding a carrying charge changes the total paid in the Newcastle APWI cash market. Note differences between this market and that in Figure 15. Source: Profarmer Australia
260
280
300
320
340
360
Oct Nov Dec Jan Feb Mar Apr May Jun Jul
2014/15 NPV APW1 bid 2014/15 APW1 cash bid
Source: Profarmer Australia
$A/t
Note to figure: If selling a cash contract with deferred delivery, a carry charge can be negotiated into the contract. For example in the case of a March sale of APW1 wheat for March-June delivery on buyers call at $300/t + $3/t carry per month, if delivered in June would generate $309/t delivered.
260
280
300
320
340
Oct Nov Dec Jan Feb Mar Apr May Jun Jul
2014/15 NPV APW1 bid 2014/15 APW1 cash bid
Source: Profarmer Australia
$A/t
Note to figure: If selling a cash contract with deferred delivery, a carry charge can be negotiated into the contract. For example in the case of a March sale of APW1 wheat for March-June delivery on buyers call at $300/t + $3/t carry per month, if delivered in June would generate $309/t delivered.
14MarKetINg
seCtioN 15 CANOLA
NORTHERNMarch 2017
Optimising farm gate returns involves planning the appropriate storage strategy for each commodity so as to improve market access and ensure that carrying costs are covered in the price received. 6
15.1.5 converting tonnes into cashThis section provides guidelines for converting the selling and storage strategy into cash by effective execution of sales.
Set up the toolboxSelling opportunities can be captured when they arise by assembling the necessary tools in advance. The toolbox for converting tonnes of grain into cash includes the following.1. Timely information—this is critical for awareness of selling opportunities
and includes:• market information provided by independent parties• effective price discovery including indicative bids, firm bids and trade prices• other market information pertinent to the particular commodity.2. Professional services—grain-selling professional services and cost structures
vary considerably. An effective grain-selling professional will put their clients’ best interests first by not having conflicts of interest and by investing time in the relationship. A better return on investment for the farm business is achieved through higher farm gate prices, which are obtained by accessing timely information, and being able to exploit the seller’s greater market knowledge and greater market access.
3. Futures account and a bank-swap facility—these accounts provide access to global futures markets. Hedging futures markets is not for everyone; however, strategies which utilise exchanges such as the Chicago Board of Trade (CBOT) can add significant value.
How to sell for cashLike any market transaction, a cash–grain transaction occurs when a bid by the buyer is matched by an offer from the seller. Cash contracts are made up of the following components, with each component requiring a level of risk management (Figure 17):• Price—future price is largely unpredictable, so devising a selling plan
to put current prices into the context of the farm business is critical to managing price risk.
• Quantity and quality—when entering a cash contract, you are committing to deliver the nominated amount of grain at the quality specified, so production and quality risks must be managed.
• Delivery terms—the timing of the title transfer from the grower to the buyer is agreed at time of contracting. If this requires delivery direct to end users, it relies on prudent execution management to ensure delivery within the contracted period.
• Payment terms—in Australia, the traditional method of contracting requires title on the grain to be transferred ahead of payment, so counterparty risk must be managed.
6 Profarmer Australia (2016), Marketing Field Peas, GRDC Northern Field Pea GrowNote
i MORE INFORMATION
access to buyers, brokers, agents, products and banks through Grain trade australia
Commodity futures brokers
asX, Find a futures broker
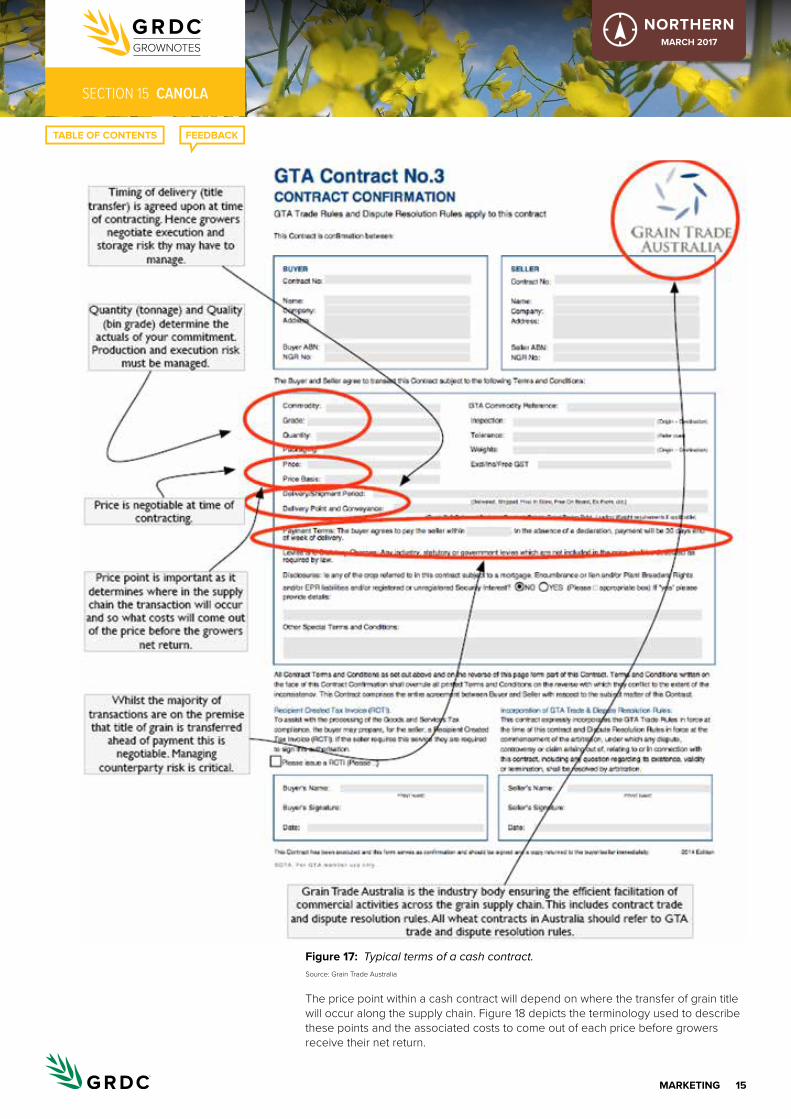
15MarKetINg
seCtioN 15 CANOLA
NORTHERNMarch 2017
Figure 17: Typical terms of a cash contract. Source: Grain Trade Australia
The price point within a cash contract will depend on where the transfer of grain title will occur along the supply chain. Figure 18 depicts the terminology used to describe these points and the associated costs to come out of each price before growers receive their net return.

16MarKetINg
seCtioN 15 CANOLA
NORTHERNMarch 2017
Figure 18: Cost and pricing points throughout the supply chains. Source: Profarmer Australia
On ship at customer wharf
On board ship
In port terminalOn truck/train at port terminal
On truck/train ex siteIn local silo
At weighbridge
Farm gate
Bulk seafreight
FOB costs
Freight toPort
(GTA LD)
Receival fee
Cartage
Farm gatereturns
Levies & EPRs
Out-turn fee
FOB costs
Freight toPort
(GTA LD)
Receival fee
Cartage
Farm gatereturns
Levies & EPRs
Freight toPort
(GTA LD)
Receival fee
Cartage
Farm gatereturns
Levies & EPRs
Receival fee
Cartage
Farm gatereturns
Levies & EPRs
Receival fee
Cartage
Farm gatereturns
Levies & EPRs
Cartage
Farm gatereturns
Levies & EPRs
Farm gatereturns
Farm gatereturns
Net farmgate return
Ex-farmprice
Free in store.
Price at commercial
storage.
Free on truck price
Post truck price
Port FIS price
Free on board price.
Carry and freight price.
Up countrydelivered silo
price. Delivered
domestic to end
user price.Delivered container
packer price.
Levies & EPRs
Freight toPort
(GTA LD)
Cartage
Farm gatereturns
Levies & EPRs
Out-turn fee
Out-turn fee
Note to figure:The price point within a cash contract will depend on where the transfer of grain title will occur along the supply chain. The below image depicts the terminology used to describe pricing points along the supply chain and the associated costs to come out of each price before the growers receive their net farm gate return.

17MarKetINg
seCtioN 15 CANOLA
NORTHERNMarch 2017
Cash sales generally occur through three methods:• Negotiation via personal contact—traditionally prices are posted as a public
indicative bid. The bid is then accepted or negotiated by a grower with the merchant or via an intermediary. This method is the most common and is available for all commodities.
• Accepting a public firm bid—cash prices in the form of public firm bids are posted during harvest and for warehoused grain by merchants on a site basis. Growers can sell their parcel of grain immediately by accepting the price on offer via an online facility and then transfer the grain online to the buyer. The availability of this option depends on location and commodity.
• Placing an anonymous firm offer—growers can place a firm offer price on a parcel of grain anonymously and expose it to the entire market of buyers, who then bid on it anonymously using the Clear Grain Exchange, which is an independent online exchange. If the offer and bid match, the particulars of the transaction are sent to a secure settlement facility, although the title on the grain does not transfer from the grower until they receive funds from the buyer. The availability of this option depends on location and commodity. Anonymous firm offers can also be placed to buyers by an intermediary acting on behalf of the grower. If the grain sells, the buyer and seller are disclosed to each counterparty.
Counterparty riskMost sales involve transferring the title on the grain prior to being paid. The risk of a counterparty defaulting when selling grain is very real and must be managed. Conducting business in a commercial and professional manner minimises this risk.
Principle: Seller beware.
There is not much point selling for an extra $5/t if you don’t get paid.
Counterparty risk management includes:• Dealing only with known and trusted counterparties.• Conducting a credit check (banks will do this) before dealing with a buyer they
are unsure of.• Selling only a small amount of grain to unknown counterparties.• Considering credit insurance or a letter of credit from the buyer.• Never delivering a second load of grain if payment has not been received
for the first.• Not parting with the title before payment, or requesting and receiving a cash
deposit of part of the value ahead of delivery. Payment terms are negotiated at time of contracting. Alternatively, the Clear Grain Exchange provides secure settlement whereby the grower maintains title on the grain until they receive payment, and then title and payment are settled simultaneously.
Above all, act commercially to ensure the time invested in implementing a selling strategy is not wasted by poor management of counterparty risk.
Relative valuesGrain sales revenue is optimised when selling decisions are made in the context of the whole farming business. The aim is to sell each commodity when it is priced well, and to hold commodities that are not well priced at any given time. That is, give preference to the commodities with the highest relative value. This achieves price protection for the overall revenue of the farm business and enables more flexibility to a grower’s selling program while achieving the business goal of reducing overall risk.
Principle: Sell valued commodities, not undervalued commodities.
If one commodity is priced strongly relative to another, focus sales there. Don’t sell the cheaper commodity for a discount.
Reviewing price relativities between two commodities is one method of assessing which grain holds the greatest value in the current market. This may be achieved
i MORE INFORMATION
Grain trade australia, a guide to taking out grain contracts
Grain trade australia, trading standards
Graintransact Resource Centre
GrainFlow
emerald Grain
Clear Grain exchange, Getting started
Clear Grain exchange, terms and conditions
i MORE INFORMATION
Gta, Managing counterparty risk
Clear Grain exchange’s title transfer model
GrainGrowers, Managing risk in grain contracts
Leo Delahunty, Counterparty risk: a producer’s perspective

18MarKetINg
seCtioN 15 CANOLA
NORTHERNMarch 2017
by considering flat prices, relative decile values, or performance against offshore markets. In the example below (Figure 19), for a wheat and canola production system, canola values surged in May–June and maintained strong relative value, despite softening values in late July and early August. Once confident that the price surge had become established, a grower would probably choose to hold off on sales of wheat and sell canola.
Figure 19: The Newcastle APW1 wheat v. canola values for the 2015–16 season indicate how a grower might follow both prices to decide which grain is better to sell, relative to the other. Source: Profarmer Australia
Contract allocation means choosing which contracts to allocate your grain against come delivery time. Different contracts will have different characteristics (e.g. price, premiums-discounts, oil bonuses), and optimising your allocation reflects directly on your bottom line.
Principle: Don’t leave money on the table.
Contract allocation decisions don’t take long, and can be worth thousands of dollars to your bottom line.
To achieve the best average price for their crop growers should:• allocate lower grades of grain to contracts with the lowest discounts• allocate higher grades of grain to contracts with the highest premiums
(Figure 20).
The grower may have several options. For example, Figure 20 shows that the only difference between achieving an average price of $518.4/t and $520.7/t is which contracts each parcel is allocated to. Over an amount of 400 t, the difference in average price equates to nearly $1,000, which could be lost just in how parcels are allocated to contracts.
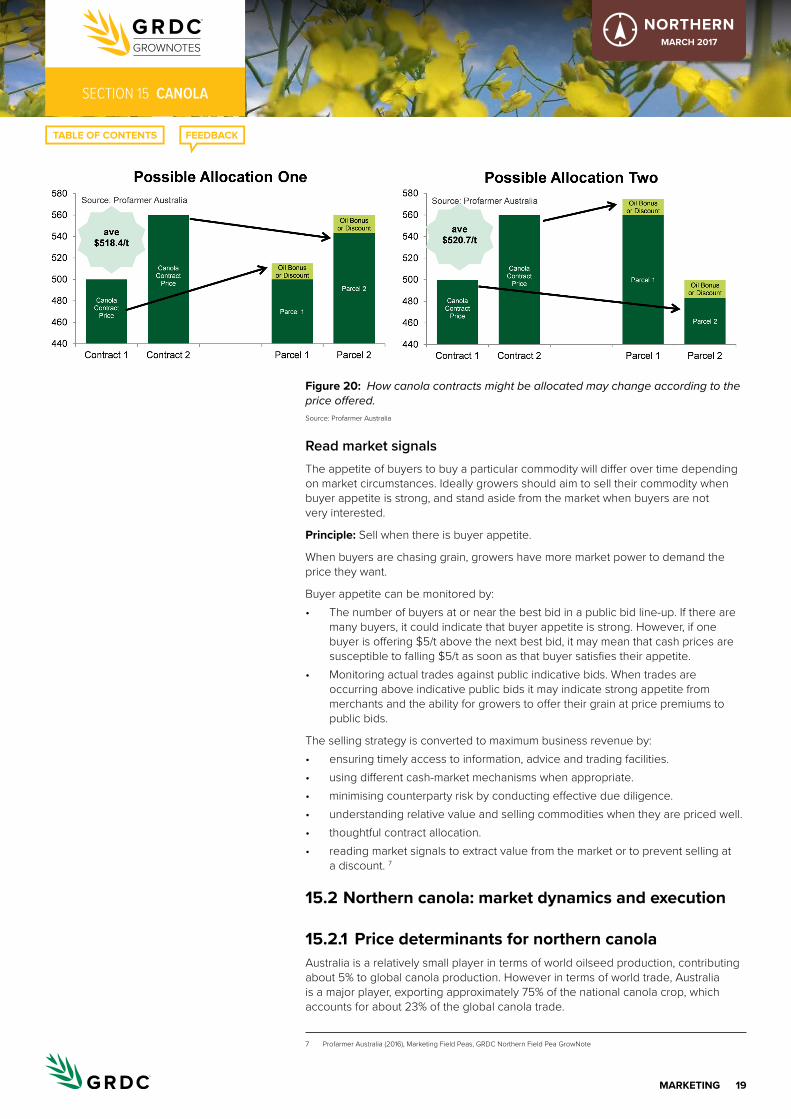
19MarKetINg
seCtioN 15 CANOLA
NORTHERNMarch 2017
Figure 20: How canola contracts might be allocated may change according to the price offered. Source: Profarmer Australia
Read market signalsThe appetite of buyers to buy a particular commodity will differ over time depending on market circumstances. Ideally growers should aim to sell their commodity when buyer appetite is strong, and stand aside from the market when buyers are not very interested.
Principle: Sell when there is buyer appetite.
When buyers are chasing grain, growers have more market power to demand the price they want.
Buyer appetite can be monitored by:• The number of buyers at or near the best bid in a public bid line-up. If there are
many buyers, it could indicate that buyer appetite is strong. However, if one buyer is offering $5/t above the next best bid, it may mean that cash prices are susceptible to falling $5/t as soon as that buyer satisfies their appetite.
• Monitoring actual trades against public indicative bids. When trades are occurring above indicative public bids it may indicate strong appetite from merchants and the ability for growers to offer their grain at price premiums to public bids.
The selling strategy is converted to maximum business revenue by:• ensuring timely access to information, advice and trading facilities.• using different cash-market mechanisms when appropriate.• minimising counterparty risk by conducting effective due diligence.• understanding relative value and selling commodities when they are priced well.• thoughtful contract allocation.• reading market signals to extract value from the market or to prevent selling at
a discount. 7
15.2 Northern canola: market dynamics and execution
15.2.1 Price determinants for northern canolaAustralia is a relatively small player in terms of world oilseed production, contributing about 5% to global canola production. However in terms of world trade, Australia is a major player, exporting approximately 75% of the national canola crop, which accounts for about 23% of the global canola trade.
7 Profarmer Australia (2016), Marketing Field Peas, GRDC Northern Field Pea GrowNote
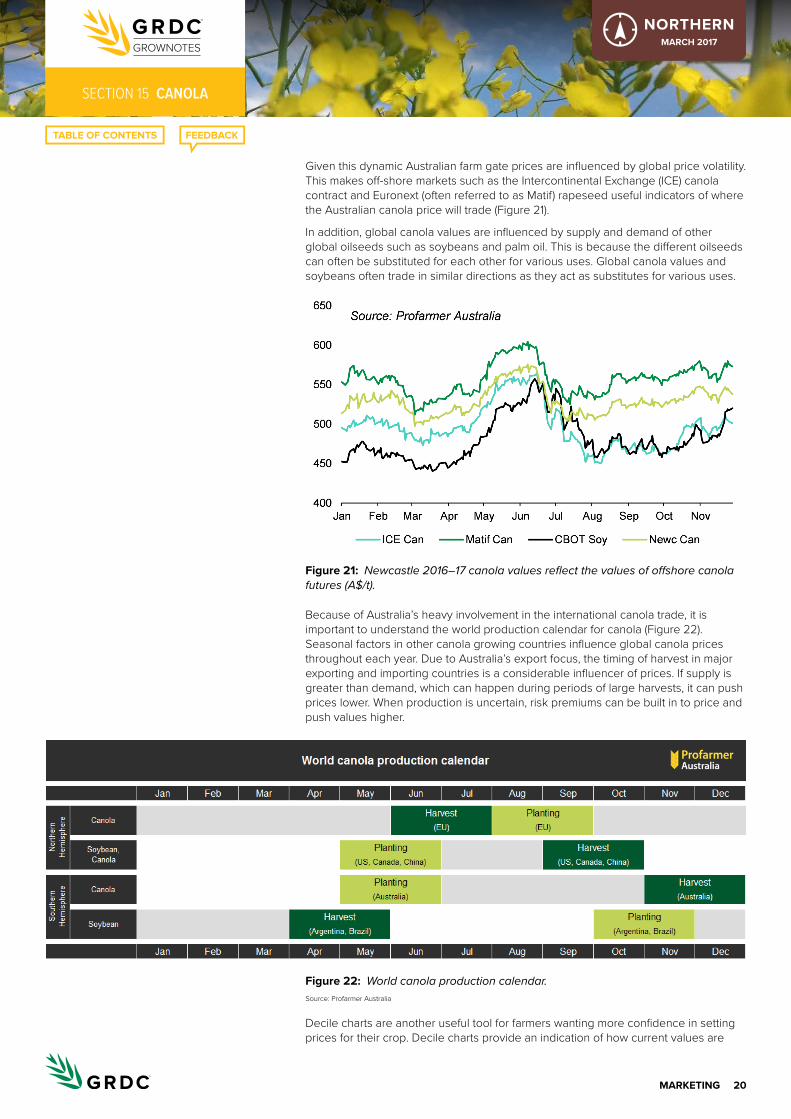
20MarKetINg
seCtioN 15 CANOLA
NORTHERNMarch 2017
Given this dynamic Australian farm gate prices are influenced by global price volatility. This makes off-shore markets such as the Intercontinental Exchange (ICE) canola contract and Euronext (often referred to as Matif) rapeseed useful indicators of where the Australian canola price will trade (Figure 21).
In addition, global canola values are influenced by supply and demand of other global oilseeds such as soybeans and palm oil. This is because the different oilseeds can often be substituted for each other for various uses. Global canola values and soybeans often trade in similar directions as they act as substitutes for various uses.
Figure 21: Newcastle 2016–17 canola values reflect the values of offshore canola futures (A$/t).
Because of Australia’s heavy involvement in the international canola trade, it is important to understand the world production calendar for canola (Figure 22). Seasonal factors in other canola growing countries influence global canola prices throughout each year. Due to Australia’s export focus, the timing of harvest in major exporting and importing countries is a considerable influencer of prices. If supply is greater than demand, which can happen during periods of large harvests, it can push prices lower. When production is uncertain, risk premiums can be built in to price and push values higher.
Figure 22: World canola production calendar. Source: Profarmer Australia
Decile charts are another useful tool for farmers wanting more confidence in setting prices for their crop. Decile charts provide an indication of how current values are
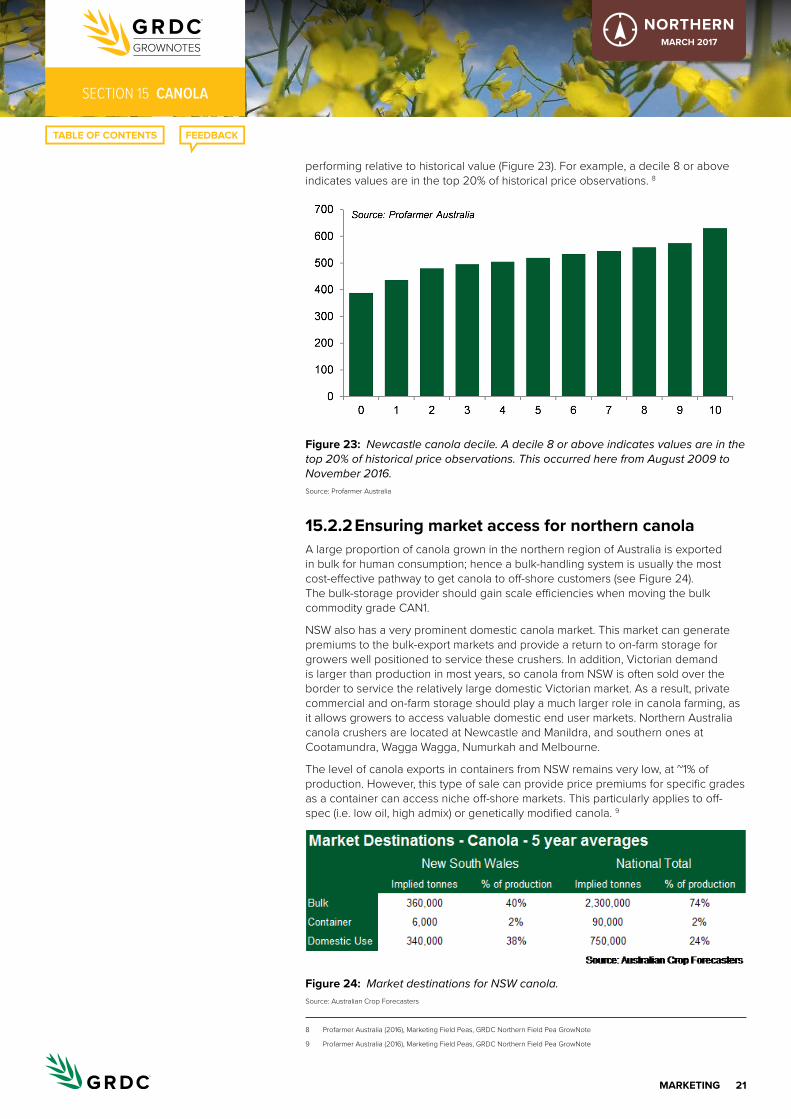
21MarKetINg
seCtioN 15 CANOLA
NORTHERNMarch 2017
performing relative to historical value (Figure 23). For example, a decile 8 or above indicates values are in the top 20% of historical price observations. 8
Figure 23: Newcastle canola decile. A decile 8 or above indicates values are in the top 20% of historical price observations. This occurred here from August 2009 to November 2016. Source: Profarmer Australia
15.2.2 ensuring market access for northern canolaA large proportion of canola grown in the northern region of Australia is exported in bulk for human consumption; hence a bulk-handling system is usually the most cost-effective pathway to get canola to off-shore customers (see Figure 24). The bulk-storage provider should gain scale efficiencies when moving the bulk commodity grade CAN1.
NSW also has a very prominent domestic canola market. This market can generate premiums to the bulk-export markets and provide a return to on-farm storage for growers well positioned to service these crushers. In addition, Victorian demand is larger than production in most years, so canola from NSW is often sold over the border to service the relatively large domestic Victorian market. As a result, private commercial and on-farm storage should play a much larger role in canola farming, as it allows growers to access valuable domestic end user markets. Northern Australia canola crushers are located at Newcastle and Manildra, and southern ones at Cootamundra, Wagga Wagga, Numurkah and Melbourne.
The level of canola exports in containers from NSW remains very low, at ~1% of production. However, this type of sale can provide price premiums for specific grades as a container can access niche off-shore markets. This particularly applies to off-spec (i.e. low oil, high admix) or genetically modified canola. 9
Figure 24: Market destinations for NSW canola. Source: Australian Crop Forecasters
8 Profarmer Australia (2016), Marketing Field Peas, GRDC Northern Field Pea GrowNote
9 Profarmer Australia (2016), Marketing Field Peas, GRDC Northern Field Pea GrowNote
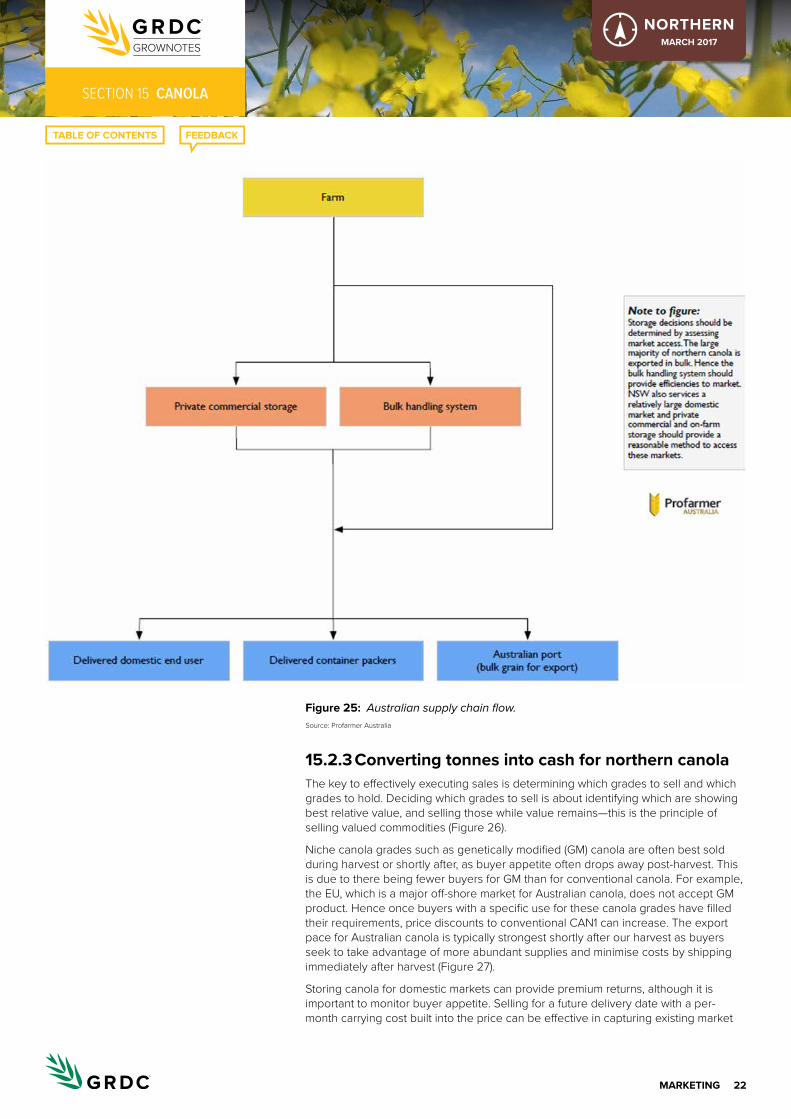
22MarKetINg
seCtioN 15 CANOLA
NORTHERNMarch 2017
Figure 25: Australian supply chain flow. Source: Profarmer Australia
15.2.3 converting tonnes into cash for northern canolaThe key to effectively executing sales is determining which grades to sell and which grades to hold. Deciding which grades to sell is about identifying which are showing best relative value, and selling those while value remains—this is the principle of selling valued commodities (Figure 26).
Niche canola grades such as genetically modified (GM) canola are often best sold during harvest or shortly after, as buyer appetite often drops away post-harvest. This is due to there being fewer buyers for GM than for conventional canola. For example, the EU, which is a major off-shore market for Australian canola, does not accept GM product. Hence once buyers with a specific use for these canola grades have filled their requirements, price discounts to conventional CAN1 can increase. The export pace for Australian canola is typically strongest shortly after our harvest as buyers seek to take advantage of more abundant supplies and minimise costs by shipping immediately after harvest (Figure 27).
Storing canola for domestic markets can provide premium returns, although it is important to monitor buyer appetite. Selling for a future delivery date with a per-month carrying cost built into the price can be effective in capturing existing market

23MarKetINg
seCtioN 15 CANOLA
NORTHERNMarch 2017
premiums, and generating a return on farm infrastructure, without running the risk of the domestic buyers adequately covering their requirements. 10
Figure 26: Melbourne 2015–16 values for conventional canola and GM canola. Source: Profarmer Australia
Figure 27: Monthly export pace of canola (’000 t), averaged over five years. Source: Australian Crop Forecasters
15.2.4 risk management tools available for northern canolaAn Australian cash price is made up of three components: futures, foreign exchange, and basis. Each component impacts on price—a higher futures and a higher basis, and a lower exchange rate will create a higher Australian grain price.
10 Profarmer Australia (2016), Marketing Field Peas, GRDC Northern Field Pea GrowNote
i MORE INFORMATION
oilseeds industry—delivering high quality products to local and global markets
Grain market lingo—what does it all mean?
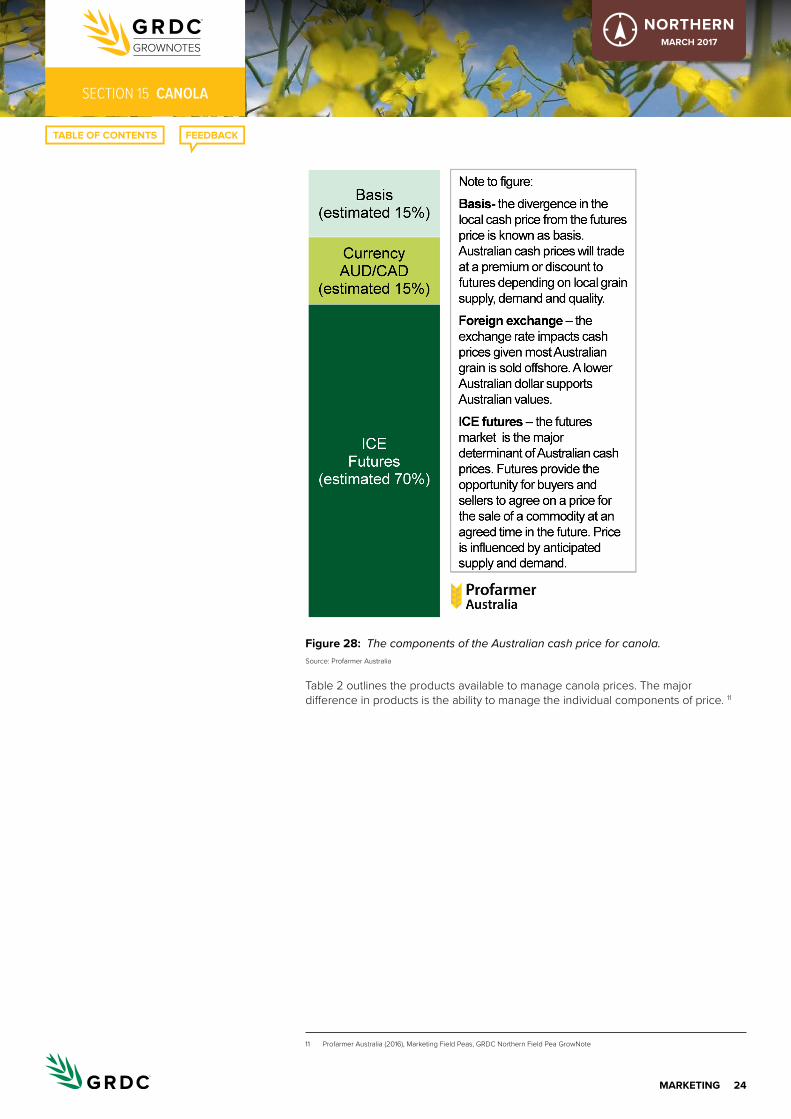
24MarKetINg
seCtioN 15 CANOLA
NORTHERNMarch 2017
Figure 28: The components of the Australian cash price for canola. Source: Profarmer Australia
Table 2 outlines the products available to manage canola prices. The major difference in products is the ability to manage the individual components of price. 11
11 Profarmer Australia (2016), Marketing Field Peas, GRDC Northern Field Pea GrowNote
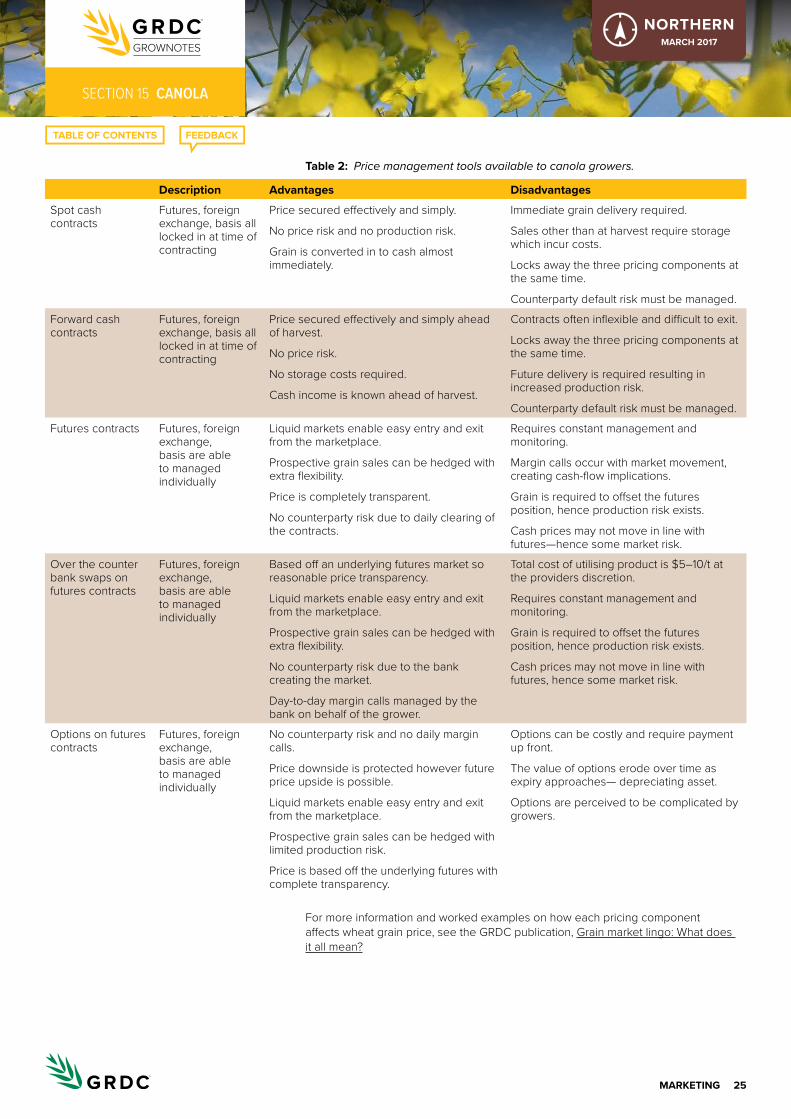
25MarKetINg
seCtioN 15 CANOLA
NORTHERNMarch 2017
table 2: Price management tools available to canola growers.
Description advantages Disadvantages
Spot cash contracts
Futures, foreign exchange, basis all locked in at time of contracting
Price secured effectively and simply.
No price risk and no production risk.
Grain is converted in to cash almost immediately.
Immediate grain delivery required.
Sales other than at harvest require storage which incur costs.
Locks away the three pricing components at the same time.
Counterparty default risk must be managed.
Forward cash contracts
Futures, foreign exchange, basis all locked in at time of contracting
Price secured effectively and simply ahead of harvest.
No price risk.
No storage costs required.
Cash income is known ahead of harvest.
Contracts often inflexible and difficult to exit.
Locks away the three pricing components at the same time.
Future delivery is required resulting in increased production risk.
Counterparty default risk must be managed.
Futures contracts Futures, foreign exchange, basis are able to managed individually
Liquid markets enable easy entry and exit from the marketplace.
Prospective grain sales can be hedged with extra flexibility.
Price is completely transparent.
No counterparty risk due to daily clearing of the contracts.
Requires constant management and monitoring.
Margin calls occur with market movement, creating cash-flow implications.
Grain is required to offset the futures position, hence production risk exists.
Cash prices may not move in line with futures —hence some market risk.
Over the counter bank swaps on futures contracts
Futures, foreign exchange, basis are able to managed individually
Based off an underlying futures market so reasonable price transparency.
Liquid markets enable easy entry and exit from the marketplace.
Prospective grain sales can be hedged with extra flexibility.
No counterparty risk due to the bank creating the market.
Day-to-day margin calls managed by the bank on behalf of the grower.
Total cost of utilising product is $5–10/t at the providers discretion.
Requires constant management and monitoring.
Grain is required to offset the futures position, hence production risk exists.
Cash prices may not move in line with futures, hence some market risk.
Options on futures contracts
Futures, foreign exchange, basis are able to managed individually
No counterparty risk and no daily margin calls.
Price downside is protected however future price upside is possible.
Liquid markets enable easy entry and exit from the marketplace.
Prospective grain sales can be hedged with limited production risk.
Price is based off the underlying futures with complete transparency.
Options can be costly and require payment up front.
The value of options erode over time as expiry approaches— depreciating asset.
Options are perceived to be complicated by growers.
For more information and worked examples on how each pricing component affects wheat grain price, see the GRDC publication, Grain market lingo: What does it all mean?

1cUrreNt aND PaSt reSearch
seCtioN 16 CANOLA
NORTHERNMarch 2017
current and past researchProject Summaries www.grdc.com.au/ProjectSummariesAs part of a continuous investment cycle each year the Grains Research and Development Corporation (GRDC) invests in several hundred research, development and extension and capacity building projects. To raise awareness of these investments the GRDC has made available summaries of these projects.
These project summaries have been compiled by GRDC’s research partners with the aim of raising awareness of the research activities each project investment.
The GRDC’s project summaries portfolio is dynamic: presenting information on current projects, projects that have concluded and new projects which have commenced. It is updated on a regular basis.
The search function allows project summaries to be searched by keywords, project title, project number, theme or by GRDC region (i.e. Northern, Southern or Western Region).
Where a project has been completed and a final report has been submitted and approved a link to a summary of the project’s final report appears at the top of the page.
The link to Project Summaries is www.grdc.com.au/ProjectSummaries
Final report Summaries http://finalreports.grdc.com.au/final_reportsIn the interests of raising awareness of GRDC’s investments among growers, advisers and other stakeholders, the GRDC has available final reports summaries of projects.
These reports are written by GRDC research partners and are intended to communicate a useful summary as well as present findings of the research activities from each project investment.
The GRDC’s project portfolio is dynamic with projects concluding on a regular basis.
In the final report summaries there is a search function that allows the summaries to be searched by keywords, project title, project number, theme or GRDC Regions. The advanced options also enables a report to be searched by recently added, most popular, map or just browse by agro-ecological zones.
The link to the Final Report Summaries is http://finalreports.grdc.com.au/final_reports
online Farm trials http://www.farmtrials.com.au/The Online Farm Trials project brings national grains research data and information directly to the grower, agronomist, researcher and grain industry community through innovative online technology. Online Farm Trials is designed to provide growers with the information they need to improve the productivity and sustainability of their farming enterprises.
Using specifically developed research applications, users are able to search the Online Farm Trials database to find a wide range of individual trial reports, project

2cUrreNt aND PaSt reSearch
seCtioN 16 CANOLA
NORTHERNMarch 2017
summary reports and other relevant trial research documents produced and supplied by Online Farm Trials contributors.
The Online Farm Trials website collaborates closely with grower groups, regional farming networks, research organisations and industry to bring a wide range of crop research datasets and literature into a fully accessible and open online digital repository.
Individual trial reports can also be accessed in the trial project information via the Trial Explorer.
The link to the Online Farm Trials is http://www.farmtrials.com.au/

1reFereNceS
seCtioN 17 CANOLA
NORTHERNMarch 2017
referencesSection a: Introduction
J Kirkegaard (2015) Canola insights will guide tactical agronomy. Ground Cover Supplements, Ground Cover Issue 117—Optimising canola profitability, 29 June 2015, https://grdc.com.au/Media-Centre/Ground-Cover-Supplements/Ground-Cover-Issue-117-Optimising-canola-profitability/Canola-insights-will-guide-tactical-agronomy
Canola. Wikipedia, http://en.wikipedia.org/wiki/Canola
CanolaInfo (2015) Where does canola come from? CanolaInfo, http://www.canolainfo.org/canola/where.php
OGTR (2002) The biology and ecology of canola (Brassica napus). Office of the Gene Technology Regulator, http://www.ogtr.gov.au/internet/ogtr/publishing.nsf/content/canola-3/$FILE/brassica.pdf
AEGIC. Australian grain note: canola. Australian Export Grains Innovation Centre, http://www.australianoilseeds.com/oilseeds_industry/quality_of_australian_canola
B. Colton, T. Potter. History. Australian Oilseeds Federation, http://www.australianoilseeds.com/__data/assets/pdf_file/0010/2701/Chapter_1_-_History.pdf
D McCaffrey (2009) Introduction. In Canola best practice management guide for south-eastern Australia. (Eds D McCaffrey, T Potter, S Marcroft, F Pritchard) GRDC, http://www.grdc.com.au/uploads/documents/GRDC_Canola_Guide_All_1308091.pdf
JF Holland et al. Canola in the northern region: where are we up to? Australian Oilseeds Federation, http://www.australianoilseeds.com/__data/assets/pdf_file/0018/4446/CANOLA_IN_THE_NORTHERN_REGION_WHERE_ARE_WE_UP_TO.pdf
GRDC (2004) Canola nutrition in the northern region. GRDC Media Centre, Hot Topics, 28 April 2004, http://www.grdc.com.au/Media-Centre/Hot-Topics/Canola-nutrition-in-the-northern-region
GRDC (2010) Growing hybrid canola. GRDC Canola Fact Sheet, August 2010, https://www.grdc.com.au/~/media/D4B939DB8790453FB2D6CBD04CA11B78.pdf
Australian Oilseeds Federation (2016) Crop report. Canola 2016/17. http://www.australianoilseeds.com/__data/assets/pdf_file/0014/10832/AOF_Crop_Report_September_2016.pdf
Section 1: Planning/Paddock preparation
P Parker (2009) Crop rotation and paddock selection. Ch. 4. In Canola best practice management guide for south-eastern Australia. (Eds D McCaffrey, T Potter, S Marcroft, F Pritchard) GRDC, http://www.grdc.com.au/uploads/documents/GRDC_Canola_Guide_All_1308091.pdf
L Bell, J Whish, A Zull, P DeVoil, D Thornby (2016) High performance crop sequences for Southern Queensland. GRDC Update Papers 22 June 2016, https://grdc.com.au/Research-and-Development/GRDC-Update-Papers/2016/06/High-performance-crop-sequences-for-Southern-Queensland
T Somes (2016) Right crop sequence critical for farm sustainability. GRDC E-Newsletter 27 July 2016, https://grdc.com.au/Media-Centre/GRDC-E-Newsletters/Paddock-Practices/Right-crop-sequence-critical-for-farm-sustainability
2reFereNceS
seCtioN 17 CANOLA
NORTHERNMarch 2017
L Serafin, J Holland, R Bambach, D McCaffery (2005) Canola: northern NSW planting guide. NSW Department of Primary Industries, http://www.dpi.nsw.gov.au/__data/assets/pdf_file/0016/148300/canola-northern-NSW-planting-guide.pdf
A Mitchell, B Burton, R Daniel (2016) Sorghum following canola – Is there an issue? GRDC Update Papers 21 July 2016, https://grdc.com.au/Research-and-Development/GRDC-Update-Papers/2016/07/Is-there-an-issue-with-sorghum-following-canola
S Simpfendorfer (2016) Crown rot an update on latest research. GRDC Update Papers 24 July 2015, https://grdc.com.au/Research-and-Development/GRDC-Update-Papers/2015/07/Crown-rot-an-update-on-latest-research
T Swan, L Goward, J Hunt & M Peoples, T Pratt (2015) Impact of crop rotations on profit, nitrogen and ryegrass seed bank in crop sequences in southern NSW. GRDC Update Papers 28 July 2015, https://grdc.com.au/Research-and-Development/GRDC-Update-Papers/2015/07/Impact-of-crop-rotations-on-profit-nitrogen-and-ryegrass-seed-bank-in-crop-sequences-in-southern-NSW
C Borger, V Stewart, A Storrie. Double knockdown or ‘double knock’. Department of Agriculture and Food Western Australia.
M Widderick, H Wu. Fleabane. Department of Agriculture and Food Western Australia.
R Daniel (2013) Weeds and resistance—considerations for awnless barnyard grass, Chloris spp. and fleabane management. Northern Grower Alliance, http://www.nga.org.au/module/documents/download/225
B Haskins (2012) Using pre-emergent herbicides in conservation farming systems. NSW Department of Primary Industries, http://www.dpi.nsw.gov.au/__data/assets/pdf_file/0003/431247/Using-pre-emergent-herbicides-in-conservation-farming-systems.pdf
J Edwards, K Hertel (2011) Canola growth and development. PROCROP Series. NSW Department of Primary Industries, http://www.dpi.nsw.gov.au/__data/assets/pdf_file/0004/516181/Procrop-canola-growth-and-development.pdf
L Jenkins (2009) Crop establishment. Ch. 5. In Canola best practice management guide for south-eastern Australia. (Eds D McCaffrey, T Potter, S Marcroft, F Pritchard) GRDC, http://www.grdc.com.au/uploads/documents/GRDC_Canola_Guide_All_1308091.pdf
D Freebairn (2016) Improving fallow efficiency. GRDC Update Papers 23 February 2016, https://grdc.com.au/Research-and-Development/GRDC-Update-Papers/2016/02/Improving-fallow-efficiency
P Hocking, R Norton, A Good (1999) Crop nutrition. Australian Oilseeds Federation, http://www.australianoilseeds.com/__data/assets/pdf_file/0013/2704/Chapter_4_-_Canola_Nutrition.pdf
T Somes (2016) Lost nitrogen and what you can do. Ground Cover Issue 123, July–August 2016, https://grdc.com.au/Media-Centre/Ground-Cover/Ground-Cover-Issue-123-JulyAugust-2016/Lost-nitrogen-and-what-you-can-do
V Sadras, G McDonald (2012) Water Use Efficiency of grain crops in Australia: principles, benchmarks and management. GRDC Integrated Weed Management Hub , http://www.grdc.com.au/GRDC-Booklet-WUE
GRDC (2015) Root-lesion nematodes. GRDC Tips and Tactics, February 2015, http://www.grdc.com.au/TT-RootLesionNematodes
Section 2: Pre-planting
L Serafin, J Holland, RBambach, DMcCaffery (2005) Canola: northern NSW planting guide. NSW Department of Primary Industries, http://www.nvtonline.com.au/wp-content/uploads/2013/03/Crop-Guide-Canola-Northern-NSW-Planting-Guide.pdf
P Matthews, D McCaffery, L Jenkins (2016) Winter crop variety sowing guide 2016. NSW DPI Management Guide. NSW Department of Primary Industries, http://www.dpi.nsw.gov.au/__data/assets/pdf_file/0011/272945/winter-crop-variety-sowing-guide-2016.pdf

3reFereNceS
seCtioN 17 CANOLA
NORTHERNMarch 2017
R Mailer (2009) Grain quality. In Canola best practice management guide for eastern Australia. (EdsD McCaffrey, T Potter, S Marcroft, F Pritchard)) GRDC, http://www.grdc.com.au/uploads/documents/GRDC_Canola_Guide_All_1308091.pdf
J Edwards, K Hertel (2011) Canola growth and development. PROCROP Series. NSW Department of Primary Industries, http://www.dpi.nsw.gov.au/__data/assets/pdf_file/0004/516181/Procrop-canola-growth-and-development.pdf
R Brill, L Jenkins, M Gardner (2014) Canola establishment; does size matter. GRDC Update Papers, 5 February 2014, http://www.grdc.com.au/Research-and-Development/GRDC-Update-Papers/2014/02/Canola-establishment-does-size-matter
J Laycock (1997) Incitec Pivot, adapted from ‘Fertiliser management in direct seeding systems’. Better Crops 81(2)
Section 3: Planting
L Jenkins (2009) Crop establishment. Ch. 5 In Canola best practice management guide for south-eastern Australia. (Eds D McCaffrey, T Potter, S Marcroft, F Pritchard) GRDC, http://www.grdc.com.au/uploads/documents/GRDC_Canola_Guide_All_1308091.pdf
L Serafin, J Holland, R Bambach, D McCaffery (2005) Canola: northern NSW planting guide. NSW Department of Primary Industries, http://www.dpi.nsw.gov.au/__data/assets/pdf_file/0016/148300/canola-northern-NSW-planting-guide.pdf
P Matthews, D McCaffery, L Jenkins (2016) Winter crop variety sowing guide 2016. NSW DPI Management Guide. NSW Department of Primary Industries, http://www.dpi.nsw.gov.au/__data/assets/pdf_file/0011/272945/winter-crop-variety-sowing-guide-2016.pdf
K Verburg, B Cocks, T Webster, J Whish (2016) Methods and tools to characterise soils for plant available water capacity (North Star). GRDC Update Papers 3 March 2016, https://grdc.com.au/Research-and-Development/GRDC-Update-Papers/2016/03/Methods-and-tools-to-characterise-soils-for-plant-available-water-capacity-North-Star
K Verburg, J Whish (2016) Drivers of fallow efficiency: Effect of soil properties and rainfall patterns on evaporation and the effectiveness of stubble cover. GRDC Update Papers 23 February 2016, https://grdc.com.au/Research-and-Development/GRDC-Update-Papers/2016/02/Drivers-of-fallow-efficiency
R Brill, L Jenkins, M Gardner (2014) Canola establishment; does size matter? GRDC Update Papers, 5 February 2014, http://www.grdc.com.au/Research-and-Development/GRDC-Update-Papers/2014/02/Canola-establishment-does-size-matter
L Jenkins, R Brill (2013) Improving canola profit in central NSW: effect of time of sowing and variety choice. GRDC Update Papers 25 February 2013, http://www.grdc.com.au/Research-and-Development/GRDC-Update-Papers/2013/02/Improving-canola-profit-in-central-NSW-effect-of-time-of-sowing-and-variety-choice
BCG (2015) Calculating canola seeding rates. News article. Birchip Cropping Group, http://www.bcg.org.au/calculating-canola-seeding-rates/
J Edwards, K Hertel (2011) Canola growth and development. PROCROP Series. NSW Department of Primary Industries, http://www.dpi.nsw.gov.au/__data/assets/pdf_file/0004/516181/Procrop-canola-growth-and-development.pdf
Section 4: Plant growth and physiology
T Potter (2009) The canola plant and how it grows. Ch. 3. In Canola best practice management guide for south-eastern Australia. (Eds D McCaffrey, T Potter, S Marcroft, F Pritchard) GRDC, http://www.grdc.com.au/uploads/documents/GRDC_Canola_Guide_All_1308091.pdf
GRDC (2016) Canola in the grazing mix is food for thought. Ground Cover Issue 117, https://grdc.com.au/Media-Centre/Ground-Cover-Supplements/Ground-Cover-Issue-117-Optimising-canola-profitability/Canola-in-the-grazing-mix-is-food-for-thought
https://grdc.com.au/Research-and-Development/GRDC-Update-Papers/2016/02/Drivers-of-fallow-efficiency
4reFereNceS
seCtioN 17 CANOLA
NORTHERNMarch 2017
L Bell (2016) Role and fit for dual-purpose crops for mitigating risk and optimising profit in low rainfall western grain growing regions. GRDC Update Papers 25 February 2016, https://grdc.com.au/Research-and-Development/GRDC-Update-Papers/2016/02/Role-and-fit-for-dual-purpose-crops-for-mitigating-risk-and-optimising-profit
A Paridaen, S Sprague, J Kirkegaard, J Lilley (2016) Winter canola for grazing and grain production. GRDC Update Papers 28 July 2016, https://grdc.com.au/Research-and-Development/GRDC-Update-Papers/2016/07/Winter-canola-for-grazing-and-grain-production
A Ware et al. (2015) Canola growth and development—impact of time of sowing (TOS) and seasonal conditions. GRDC Update Papers, 10 February 2015, http://grdc.com.au/Research-and-Development/GRDC-Update-Papers/2015/02/Canola-growth-and-development-impact-of-time-of-sowing-TOS-and-seasonal-conditions
J Whish (2016) Accessing and using day degrees in field crops as a tool to assist crop management. GRDC Update Papers, 23 February 2016 https://grdc.com.au/Research-and-Development/GRDC-Update-Papers/2016/02/Accessing-and-using-day-degrees-in-field-crops-as-a-tool-to-assist-crop-management
Section 5: Nutrition and fertiliser
JA Baldock, JO Skjemstad (1999) Soil organic carbon/Soil organic matter. In KI Peverill, LA Sparrow, DJ Reuter (eds). Soil analysis: An interpretation manual. CSIRO Publishing, Collingwood Australia.
QDAF (2016) Queensland Grains Research – 2015. Regional Research Agronomy Network. Department of Agriculture, Fisheries and Forestry Queensland, pp. 112 – 117, http://www.moreprofitperdrop.com.au/wp-content/uploads/2016/08/RANsTrials2015-screen.pdf
RC Dalal, RJ Mayer (1986) Long term trends in fertility of soils under continuous cultivation and cereal cropping in southern Queensland. II. Total organic carbon and its rate of loss from the soil profile. Australian Journal of Soil Research 24, 281–292.
FC Hoyle, JA Baldock, DV Murphy (2011) Soil organic carbon: Role in rainfed farming systems. In PG Tow, I Cooper, I Partridge, C Birch (eds). Rainfed farming systems. Springer, pp. 339–361.
D Herridge (2011) Managing legume and fertiliser N for northern grains cropping. Revised 2013. GRDC, https://grdc.com.au/uploads/documents/Managing-N-for-Northern-Grains-Cropping.pdf
GRDC (2014) Canola nutrition in the northern region. GRDC Media Centre, 28 April 2014, http://grdc.com.au/Media-Centre/Hot-Topics/Canola-nutrition-in-the-northern-region
P Parker (2009) Nutrition and soil fertility. Ch. 7. In Canola best practice management guide for south-eastern Australia. (Eds D McCaffrey, T Potter, S Marcroft, F Pritchard) GRDC, http://www.grdc.com.au/uploads/documents/GRDC_Canola_Guide_All_1308091.pdf
P Hocking, R Norton, A Good (1999) Crop nutrition. 10th International Rapeseed Congress, http://www.regional.org.au/au/gcirc/canola/p-05.htm
L Serafin, J Holland, R Bambach, D McCaffery (2009) Canola: northern NSW planting guide. NSW Department of Primary Industries, http://www.dpi.nsw.gov.au/__data/assets/pdf_file/0016/148300/canola-northern-NSW-planting-guide.pdf
Diagnosing nitrogen deficiency in canola, https://www.agric.wa.gov.au/mycrop/diagnosing-nitrogen-deficiency-canola
R Daniel, M Gardner, A Mitchell, R Norton (2013) Canola nutrition: what were the benefits from N, S and P in 2012? GRDC Update Papers, 5 March 2013, http://grdc.com.au/Research-and-Development/GRDC-Update-Papers/2013/03/Canola-nutrition-what-were-the-benefits-from-N-S-and-P-in-2012
G. Schwenke, Nitrogen volatilisation: Factors affecting how much N is lost and how much is left over time (2014), http://www.grdc.com.au/Research-and-Development/GRDC-Update-Papers/2014/07/Factors-affecting-how-much-N-is-lost-and-how-much-is-left-over-time

5reFereNceS
seCtioN 17 CANOLA
NORTHERNMarch 2017
DAFWA (2015) Diagnosing nitrogen deficiency in canola. Department of Agriculture and Food, Western Australia, https://www.agric.wa.gov.au/mycrop/diagnosing-nitrogen-deficiency-canola
R Norton (2016) Phosphorus – are we going to hit the wall and how much P in 2015? GRDC Update Papers 21 July 2015, https://grdc.com.au/Research-and-Development/GRDC-Update-Papers/2015/07/Phosphorus
GRDC (2016) Canola nutrition and sulfur. GRDC Tips and Tactics, https://grdc.com.au/Resources/Factsheets/2016/04/Canola-nutrition-and-sulfur
M Street (2014) Review of sulfur strategy to improve profitability in canola in the central west of NSW. GRDC Update Papers, 18 February 2014, http://grdc.com.au/Research-and-Development/GRDC-Update-Papers/2014/02/Review-of-sulfur-strategy
B Freebairn (2016) Nitrogen versus sulfur canola trials. GRDC Update Papers 14 July 2016, https://grdc.com.au/Media-Centre/Ground-Cover/Ground-Cover-Issue-123-JulyAugust-2016/Nitrogen-versus-sulfur-canola-trials
M Street (2013) Sulfur strategy to improve profitability in canola in the central west of NSW. GRDC Update Papers, 26 February 2013, http://www.grdc.com.au/Research-and-Development/GRDC-Update-Papers/2013/02/Sulfur-strategy-to-improve-profitability-in-canola-in-the-central-west-of-NSW
R Norton, J Kirkegaard, J Angus, T Potter. Canola in rotations. Australian Oilseed Federation, http://www.australianoilseeds.com/__data/assets/pdf_file/0014/2705/Chapter_5_-_Canola_in_Rotations.pdf
Section 6: Weed control
L Serafin, J Holland, R Bambach, D McCaffery (2005) Canola: northern NSW planting guide. NSW Department of Primary Industries, http://www.dpi.nsw.gov.au/__data/assets/pdf_file/0016/148300/canola-northern-NSW-planting-guide.pdf
S. Sutherland, Canola Weed Management. http://www.australianoilseeds.com/__data/assets/pdf_file/0012/2712/Chapter_12_-_Canola_Weed_Management.pdf
G Brodie (2016) Microwave technology for weed management. GRDC Update Papers 1 March 2016, https://grdc.com.au/Research-and-Development/GRDC-Update-Papers/2016/03/Microwave-technology-for-weed-management
T Somes (2016) Crop stage critical when using Clethodim in canola. GRDC E-newsletter 6 June 2016, https://grdc.com.au/Media-Centre/GRDC-E-Newsletters/Paddock-Practices/Crop-stage-critical-when-using-Clethodim-in-canola
T. Cook, G. Brooke, M. Widderick, M. Street (2014) , Herbicides and weeds regional issues trials and developments https://grdc.com.au/Research-and-Development/GRDC-Update-Papers/2014/03/Herbicides-and-weeds-regional-issues-trials-and-developments
C. Preston, P. Boutsalis, S. Kleeman, R.K. Saini and G. Gill (2013), Maintaining the best options with herbicides http://www.grdc.com.au/Research-and-Development/GRDC-Update-Papers/2013/08/Maintaining-the-best-options-with-herbicides
C Preston, S Kleemann, G Gill (2016) Coupling pre emergent herbicides and crop competition for big reductions in weed escapes. GRDC Update Papers 22 February 2016, https://grdc.com.au/Research-and-Development/GRDC-Update-Papers/2016/02/Coupling-pre-emergent-herbicides-and-crop-competition-for-big-reductions-in-weed-escapes
Section 7: Insect control
L Serafin, J Holland, R Bambach, D McCaffery (2009) Canola: northern NSW planting guide. NSW Department of Primary Industries, http://www.dpi.nsw.gov.au/__data/assets/pdf_file/0016/148300/canola-northern-NSW-planting-guide.pdf
6reFereNceS
seCtioN 17 CANOLA
NORTHERNMarch 2017
K Hertel, K Roberts, P Bowden (2013) Insect and mite control in field crops. NSW DPI Management Guide. NSW Department of Primary Industries, http://www.dpi.nsw.gov.au/__data/assets/pdf_file/0005/284576/Insect-and-mite-control-in-field-crops-2013.pdf
P Matthews, D McCaffery, L Jenkins (2016) Winter crop variety sowing guide 2016. NSW DPI Management Guide. NSW Department of Primary Industries, http://www.dpi.nsw.gov.au/__data/assets/pdf_file/0011/272945/winter-crop-variety-sowing-guide-2016.pdf
P Umina (2014) Persistent pests; aphids, mites, millipedes and earwigs. GRDC Update Papers, 5 February 2014, http://grdc.com.au/Research-and-Development/GRDC-Update-Papers/2014/02/Persistent-pests-aphids-mites-millipedes-and-earwigs
M Miles, P Grundy, A Quade, R Lloyd (2015) Insect management in in fababeans and canola recent research. GRDC Update Papers 25 February 2015, http://grdc.com.au/Research-and-Development/GRDC-Update-Papers/2015/02/Insect-management-in-fababeans-and-canola-recent-research
M Miles, A Quade, R Lloyd, P Grundy (2016) Recent insect pest management research findings and the application of results in the field. GRDC Update Papers 23 February 2016, https://grdc.com.au/Research-and-Development/GRDC-Update-Papers/2016/02/Recent-insect-pest-management-research-findings-and-the-application-of-results-in-the-field
G McDonald, A Govender, P Umina (2016) Pest wrap up 2015 establishment pests, aphids, caterpillars and beneficials. GRDC Update Papers 16 February 2016, https://grdc.com.au/Research-and-Development/GRDC-Update-Papers/2016/02/Pest-wrap-up-2015-establishment-pests-aphids-caterpillars-and-beneficials
Section 8: Nematode management
L. Serafin, J Holland, R Bambach, D McCaffery (2005) Canola: northern NSW planting guide. NSW Department of Primary Industries, http://www.dpi.nsw.gov.au/__data/assets/pdf_file/0016/148300/canola-northern-NSW-planting-guide.pdf
GRDC (2015) Root-lesion nematodes. GRDC Tips and Tactics, February 2015, http://www.grdc.com.au/TT-RootLesionNematodes
B Burton (2015) Impact of crop varieties on RLN multiplication. GRDC Update Papers, 1 March 2015, http://grdc.com.au/Research-and-Development/GRDC-Update-Papers/2015/03/Impact-of-crop-varieties-on-RLN-multiplication
K Owen, T Clewett, J Sheedy, J Thompson (2016) Managing grain crops in nematode infested fields to minimise loss and optimise profit. GRDC Update Papers 2 March 2016, https://grdc.com.au/Research-and-Development/GRDC-Update-Papers/2016/03/Managing-grain-crops-in-nematode-infested-fields-to-minimise-loss-and-optimise-profit
Section 9: Diseases
E McNamara (2016) Sclerotinia tops canola watch list. GRDC Media, https://grdc.com.au/Media-Centre/Media-News/North/2016/06/Sclerotinia-tops-canola-watch-list
eXtensionAUS. Latest on canola disease—2015 GRDC Update Papers. eXtension, https://extensionhub.com.au/web/field-crop-diseases/-/latest-on-canola-disease-2015-grdc-update-papers
GRDC (2014) Canola disease management in the northern region. GRDC Gound Cover, 21 March 2014, http://grdc.com.au/Media-Centre/Hot-Topics/Canola-disease-management-in-the-northern-region
GRDC (2014) Canola disease management in the northern region—details. GRDC Gound Cover, 21 March 2014, http://grdc.com.au/Media-Centre/Hot-Topics/Canola-disease-management-in-the-northern-region/Details
GRDC (2015) Blackleg management guide, autumn 2015. GRDC Fact Sheet, 29 April 2015, http://www.grdc.com.au/GRDC-FS-BlacklegManagementGuide
7reFereNceS
seCtioN 17 CANOLA
NORTHERNMarch 2017
GRDC (2016) 2016 Spring Blackleg management guide. GRDC Fact Sheet, http://www.grdc.com.au/GRDC-FS-BlacklegManagementGuide
K Lindbeck, S Marcroft, A Leo, A Van de Wouw (2016) Canola diseases - the 'watch outs' for 2016. GRDC Update Papers 16 February 2016, https://grdc.com.au/Research-and-Development/GRDC-Update-Papers/2016/02/Canola-diseases-the-watch-outs-for-2016
L Serafin, J Holland, R Bambach, D McCaffery (2005) Canola: northern NSW planting guide. NSW Department of Primary Industries, http://www.dpi.nsw.gov.au/__data/assets/pdf_file/0016/148300/canola-northern-NSW-planting-guide.pdf
L. Alexander, S. Thompson, M. Ryley, L. Serafin (2015), Sunflower Disease Management, Successful sunflower production using integrated disease management, http://www.grdc.com.au/TaT-SunflowerDiseaseManagement
P Matthews, D McCaffery, L Jenkins (2016) Winter crop variety sowing guide 2016. NSW DPI Management Guide. NSW Department of Primary Industries, http://www.dpi.nsw.gov.au/__data/assets/pdf_file/0011/272945/winter-crop-variety-sowing-guide-2016.pdf
Section 11: crop desiccation/spray out
P Carmody (2009) Windrowing and harvesting. Ch. 14. In Canola best practice management guide for south-eastern Australia. (Eds D McCaffrey, T Potter, S Marcroft, F Pritchard) GRDC, http://www.grdc.com.au/uploads/documents/GRDC_Canola_Guide_All_1308091.pdf
Section 12: harvest
M Street (2016) GOA investigates Canola desiccation and direct heading and PodGuard canola. GRDC Update Papers 20 July 2016, https://grdc.com.au/Research-and-Development/GRDC-Update-Papers/2016/07/GOA-investigates-Canola-desiccation-and-direct-heading-and-PodGuard-canola
P Carmody (2009) Windrowing and harvesting. Ch. 14. In Canola best practice management guide for south-eastern Australia. (Eds D McCaffrey, T Potter, S Marcroft, F Pritchard) GRDC, http://www.grdc.com.au/uploads/documents/GRDC_Canola_Guide_All_1308091.pdf
J Midwood (2013) Canola harvest: is direct heading a serious option. GRDC Update Papers, 6 February 2013, https://grdc.com.au/Research-and-Development/GRDC-Update-Papers/2013/02/Canola-harvest-Is-direct-heading-a-serious-option
M Street (2016) ‘To windrow or not to windrow in 2016?’ This is the question, ‘but if so, when?’. GRDC Update Papers 3 March 2016, https://grdc.com.au/Research-and-Development/GRDC-Update-Papers/2016/03/Windrowing-in-2016
L Serafin, J Holland, R Bambach, D McCaffery (2009) Canola: northern NSW planting guide. NSW Department of Primary Industries, http://www.dpi.nsw.gov.au/__data/assets/pdf_file/0016/148300/canola-northern-NSW-planting-guide.pdf
M Street (2013) Harvesting canola in 2013—to windrow or direct head. GRDC Update Papers, 22 August 2013, http://www.grdc.com.au/Research-and-Development/GRDC-Update-Papers/2013/08/Harvesting-canola-in-2013-to-windrow-or-direct-head
M Street (2010) Harvest options for canola—windrowing timing, direct heading, desiccation with Reglone™ and treatment with Pod Ceal™. Effects on yield and oil percentages. GRDC Update Papers, 30 September 2010, https://www.grdc.com.au/Research-and-Development/GRDC-Update-Papers/2010/09/Harvest-options-for-canola-windrowing-timing-direct-heading-desiccation-with-RegloneTM-and-treatment-with-Pod-CealTM-effects-on-yield-and-oil-percentages
M Street (2012) Windrow timing and direct heading in canola—effects on yield and oil. GRDC Update Papers, 12 April 2012, http://grdc.com.au/Research-and-Development/GRDC-Update-Papers/2012/04/Windrow-timing-and-direct-heading-in-canola-effects-on-yield-and-oil

8reFereNceS
seCtioN 17 CANOLA
NORTHERNMarch 2017
AOF (2014) Quality standards, technical information and typical analysis. 2014/15. Australian Oilseeds Federation, http://www.graintrade.org.au/sites/default/files/file/Commodity%20Standards/AOF_Standards_201415_Final.pdf
Section 13: Storage
P Burrill (2016) Part I Achieving great aeration results and Part II Silo recirculation as an aid to fumigation. GRDC Update Papers 20 July 2016, https://grdc.com.au/Research-and-Development/GRDC-Update-Papers/2016/07/Part-I-Achieving-great-aeration-results-and-Part-II-Silo-recirculation-as-an-aid-to-fumigation
P Burrill (2012) Safe storage. Module 8. In Better canola—canola technology update for growers and advisors. Australian Oilseeds Federation, http://www.australianoilseeds.com/__data/assets/pdf_file/0019/9082/MODULE_8_-_Safe_Storage_of_Canola_Philip_Burrill_-_V2_Sep_2012.pdf
GRDC (2014) Storing oilseeds. GRDC Grain Storage Fact Sheet, July 2014, http://storedgrain.com.au/wp-content/uploads/2014/09/GSFS-9_Oil-Seed-July14.pdf
A Ridley, P Burrill, P Collins (2016) Killing storage pests without mercy Narrabri. GRDC Update Papers 22 July 2016, https://grdc.com.au/Research-and-Development/GRDC-Update-Papers/2016/07/Killing-storage-pests-without-mercy-Narrabri
Section 14: environmental issues
T Potter (2009) The canola plant and how it grows. Ch. 3. In Canola best practice management guide for south-eastern Australia. (Eds D McCaffrey, T Potter, S Marcroft, F Pritchard) GRDC, http://www.grdc.com.au/uploads/documents/GRDC_Canola_Guide_All_1308091.pdf
J Edwards, K Hertel (2011) Canola growth and development. New South Wales Department of Primary Industries, http://www.dpi.nsw.gov.au/__data/assets/pdf_file/0004/516181/Procrop-canola-growth-and-development.pdf
C White (2000) Pulse and canola—frost identification. The Back Pocket Guide. Reprinted 2003. Department of Agriculture, Western Australia/GRDC, https://www.grdc.com.au/Resources/Bookshop/2012/01/Pulse-Canola-Frost-Identification-The-Back-Pocket-Guide-GRDC046
GRDC (2016) Managing frost risk. Northern, Southern and Western Regions. GRDC Tips and Tactics, http://www.grdc.com.au/ManagingFrostRisk
J Christopher, B Zheng, S Chapman, A Borrell, T Frederiks, K Chenu (2016) An analysis of frost impact plus guidelines to reduce frost risk and assess frost damage. GRDC Update Papers 20 July 2016, https://grdc.com.au/Research-and-Development/GRDC-Update-Papers/2016/07/An-analysis-of-frost-impact-plus-guidelines-to-reduce-frost-risk-and-assess-frost-damage
DAFWA. Diagnosing waterlogging in canola. MyCrop. Department of Agriculture and Food Western Australia, https://www.agric.wa.gov.au/mycrop/diagnosing-waterlogging-canola
Section 15: Marketing
Profarmer Australia (2016), Marketing Field Peas, GRDC Northern Field Pea GrowNote
Related Documents