arXiv:0812.4870v1 [gr-qc] 29 Dec 2008 Gravitational wave burst search in the Virgo C7 data F. Acernese 5ac , M. Alshourbagy 10ab , F. Antonucci 11a , S. Aoudia 6 , K. G. Arun 7 , P. Astone 11a , G. Ballardin 2 , F. Barone 5ac , L. Barsotti 10ab , M. Barsuglia 14 , Th. S. Bauer 12a , S. Bigotta 10ab , S. Birindelli 6 , M.-A. Bizouard 7 , C. Boccara 8 , F. Bondu 6 , L. Bonelli 10ab , L. Bosi 9a , S. Braccini 10a , C. Bradaschia 10a , A. Brillet 6 , V. Brisson 7 , H. J. Bulten 12ab , D. Buskulic 1 , G. Cagnoli 3a , E. Calloni 5ab , E. Campagna 3ac , B. Canuel 2 , F. Carbognani 2 , L. Carbone 9a , F. Cavalier 7 , R. Cavalieri 2 , G. Cella 10a , E. Cesarini 3ab , E. Chassande-Mottin 14 , S. Chatterji 11a , N. Christensen 2 , A.-C. Clapson 7 , F. Cleva 6 , E. Coccia 13ab , M. Colombini 11b , C. Corda 10ab , A. Corsi 11a , F. Cottone 9ab , J.-P. Coulon 6 , E. Cuoco 2 , S. D’Antonio 13a , A. Dari 9ab , V. Dattilo 2 , M. Davier 7 , R. De Rosa 5ab , M. Del Prete 10ac , L. Di Fiore 5a , A. Di Lieto 10ab , M. Di Paolo Emilio 13ad , A. Di Virgilio 10a , V. Fafone 13ab , I. Ferrante 10ab , F. Fidecaro 10ab , I. Fiori 2 , R. Flaminio 4 , J.-D. Fournier 6 , S. Frasca 11ab , F. Frasconi 10a , L. Gammaitoni 9ab , F. Garufi 5ab , E. Genin 2 , A. Gennai 10a , A. Giazotto 10a,2 , M. Granata 14 , V. Granata 1 , C. Greverie 6 , G. Guidi 3ac , H. Heitmann 6 , P. Hello 7 , S. Hild ∗ , D. Huet 2 , P. La Penna 2 , M. Laval 6 , N. Leroy 7 , N. Letendre 1 , M. Lorenzini 3a , V. Loriette 8 , G. Losurdo 3a , J.-M. Mackowski 4 , E. Majorana 11a , N. Man 6 , M. Mantovani 2 , F. Marchesoni 9a , F. Marion 1 , J. Marque 2 , F. Martelli 3ac , A. Masserot 1 , F. Menzinger 2 , C. Michel 4 , L. Milano 5ab , Y. Minenkov 13a , S. Mitra 6 , J. Moreau 8 , N. Morgado 4 , M. Mohan 2 , A. Morgia 13ab , S. Mosca 5ab , B. Mours 1 , I. Neri 9ab , F. Nocera 2 , G. Pagliaroli 13ad , C. Palomba 11a , F. Paoletti 10a,2 , S. Pardi 5ab , A. Pasqualetti 2 , R. Passaquieti 10ab , D. Passuello 10a , G. Persichetti 5ab , F. Piergiovanni 3ac , L. Pinard 4 , R. Poggiani 10ab , M. Punturo 9a , P. Puppo 11a , O. Rabaste 14 , P. Rapagnani 11ab , T. Regimbau 6 , F. Ricci 11ab , A. Rocchi 13a , L. Rolland 1 , R. Romano 5ac , P. Ruggi 2 , B. Sassolas 4 , D. Sentenac 2 , B. L. Swinkels 2 , R. Terenzi 13ac , A. Toncelli 10ab , M. Tonelli 10ab , E. Tournefier 1 , F. Travasso 9ab , G. Vajente 10ab , J. F. J. van den Brand 12ab , S. van der Putten 12a , D. Verkindt 1 , F. Vetrano 3ac , A. Vicer´ e 3ac , J.-Y.Vinet 6 , H. Vocca 9a , M. Was 7 , M. Yvert 1 1 Laboratoire d’Annecy-le-Vieux de Physique des Particules (LAPP), IN2P3/CNRS, Universit´ e de Savoie, F-74941 Annecy-le-Vieux, France 2 European Gravitational Observatory (EGO), I-56021 Cascina (Pi), Italia 3 INFN, Sezione di Firenze, I-50019 Sesto Fiorentino a ; Universit`a degli Studi di Firenze, I-50121 b , Firenze; Universit`a degli Studi di Urbino ”Carlo Bo”, I-61029 Urbino c , Italia 4 Laboratoire des Mat´ eriaux Avanc´ es LMA, IN2P3/CNRS, F-69622 Villeurbanne, Lyon, France 5 INFN, sezione di Napoli a ; Universit`a di Napoli ”Federico II” b Complesso Universitario di Monte S.Angelo, I-80126 Napoli; Universit`a di Salerno, Fisciano, I-84084 Salerno c , Italia 6 Departement Artemis, Observatoire de la Cˆote d’Azur, CNRS, F-06304 Nice, France. 7 LAL, Universit´ e Paris-Sud, IN2P3/CNRS, F-91898 Orsay, France 8 ESPCI, CNRS, F-75005 Paris, France 9 INFN, Sezione di Perugia a ; Universit`a di Perugia b , I-6123 Perugia,Italia 10 INFN, Sezione di Pisa a ; Universit`a di Pisa b ; I-56127 Pisa; Universit`a di Siena, I-53100 Siena c , Italia 11 INFN, Sezione di Roma a ; Universit`a ”La Sapienza” b , I-00185 Roma, Italia 12 National institute for subatomic physics, NL-1009 DB a ; Vrije Universiteit, NL-1081 HV b , Amsterdam, The Netherlands 13 INFN, Sezione di Roma Tor Vergata a ; Universit`a di Roma Tor Vergata b , Istituto di Fisica dello Spazio Interplanetario (IFSI) INAF c , I-00133 Roma; Universit`a dell’Aquila, I-67100 L’Aquila d , Italia 14 AstroParticule et Cosmologie (APC), CNRS: UMR7164-IN2P3-Observatoire de Paris-Universit´ e Denis Diderot-Paris VII - CEA : DSM/IRFU and ∗ Permanent address: School of Physics & Astronomy University of Birmingham B15 2TT, UK (Dated: January 7, 2014 - DRAFT 5.4.2) A search for gravitational wave burst events has been performed with the Virgo C7 commissioning run data that have been acquired in September 2005 over five days. It focused on un-modeled short duration signals in the frequency range 150 Hz to 2 kHz. A search aimed at detecting the GW emission from the merger and ringdown phases of binary black hole coalescences was also carried out. An extensive understanding of the data was required to be able to handle a burst search using the output of only one detector. A 90% confidence level upper limit on the number of expected events given the Virgo C7 sensitivity curve has been derived as a function of the signal strength, for un-modeled gravitational wave search. The sensitivity of the analysis presented is, in terms of the root sum square strain amplitude, hrss ≃ 10 −20 / √ Hz. This can be interpreted in terms of a frequentist upper limit on the rate R 90% of detectable gravitational wave bursts at the level of 1.1 events per day at 90% confidence level. From the binary black hole search, we obtained the distance reach at 50% and 90% efficiency as a function of the total mass of the final black hole. The maximal detection distance for non-spinning high and equal mass black hole binary system obtained by this analysis in C7 data is ≃ 2.9 ± 0.1 Mpc for a detection efficiency of 50% for a binary of total mass 80M⊙.

Welcome message from author
This document is posted to help you gain knowledge. Please leave a comment to let me know what you think about it! Share it to your friends and learn new things together.
Transcript
arX
iv:0
812.
4870
v1 [
gr-q
c] 2
9 D
ec 2
008
Gravitational wave burst search in the Virgo C7 data
F. Acernese5ac, M. Alshourbagy10ab, F. Antonucci11a, S. Aoudia6, K. G. Arun7, P. Astone11a, G. Ballardin2, F.
Barone5ac, L. Barsotti10ab, M. Barsuglia14, Th. S. Bauer12a, S. Bigotta10ab, S. Birindelli6, M.-A. Bizouard7, C.
Boccara8, F. Bondu6, L. Bonelli10ab, L. Bosi9a, S. Braccini10a, C. Bradaschia10a, A. Brillet6, V. Brisson7, H. J.
Bulten12ab, D. Buskulic1, G. Cagnoli3a, E. Calloni5ab, E. Campagna3ac, B. Canuel2, F. Carbognani2, L.Carbone9a, F. Cavalier7, R. Cavalieri2, G. Cella10a, E. Cesarini3ab, E. Chassande-Mottin14, S. Chatterji11a,
N. Christensen2, A.-C. Clapson7, F. Cleva6, E. Coccia13ab, M. Colombini11b, C. Corda10ab, A. Corsi11a, F.
Cottone9ab, J.-P. Coulon6, E. Cuoco2, S. D’Antonio13a, A. Dari9ab, V. Dattilo2, M. Davier7, R. De Rosa5ab,
M. Del Prete10ac, L. Di Fiore5a, A. Di Lieto10ab, M. Di Paolo Emilio13ad, A. Di Virgilio10a, V. Fafone13ab,I. Ferrante10ab, F. Fidecaro10ab, I. Fiori2, R. Flaminio4, J.-D. Fournier6, S. Frasca11ab, F. Frasconi10a, L.
Gammaitoni9ab, F. Garufi5ab, E. Genin2, A. Gennai10a, A. Giazotto10a,2, M. Granata14, V. Granata1, C.
Greverie6, G. Guidi3ac, H. Heitmann6, P. Hello7, S. Hild∗, D. Huet2, P. La Penna 2, M. Laval6, N. Leroy7,
N. Letendre1, M. Lorenzini3a, V. Loriette8, G. Losurdo3a, J.-M. Mackowski4, E. Majorana11a, N. Man6,
M. Mantovani2, F. Marchesoni9a, F. Marion1, J. Marque2, F. Martelli3ac, A. Masserot1, F. Menzinger2, C.Michel4, L. Milano5ab, Y. Minenkov13a, S. Mitra6, J. Moreau8, N. Morgado4, M. Mohan2, A. Morgia13ab, S.
Mosca5ab, B. Mours1, I. Neri9ab, F. Nocera2, G. Pagliaroli13ad, C. Palomba11a, F. Paoletti10a,2, S. Pardi5ab,
A. Pasqualetti2, R. Passaquieti10ab, D. Passuello10a, G. Persichetti5ab, F. Piergiovanni3ac, L. Pinard4, R.
Poggiani10ab, M. Punturo9a, P. Puppo11a, O. Rabaste14, P. Rapagnani11ab, T. Regimbau6, F. Ricci11ab, A.Rocchi13a, L. Rolland1, R. Romano5ac, P. Ruggi2, B. Sassolas4, D. Sentenac2, B. L. Swinkels2, R. Terenzi13ac, A.
Toncelli10ab, M. Tonelli10ab, E. Tournefier1, F. Travasso9ab, G. Vajente10ab, J. F. J. van den Brand12ab, S. van
der Putten12a, D. Verkindt1, F. Vetrano3ac, A. Vicere3ac, J.-Y.Vinet6, H. Vocca9a, M. Was7, M. Yvert11Laboratoire d’Annecy-le-Vieux de Physique des Particules (LAPP),
IN2P3/CNRS, Universite de Savoie, F-74941 Annecy-le-Vieux, France2European Gravitational Observatory (EGO), I-56021 Cascina (Pi), Italia
3INFN, Sezione di Firenze, I-50019 Sesto Fiorentinoa; Universita degli Studi di Firenze,I-50121b, Firenze; Universita degli Studi di Urbino ”Carlo Bo”, I-61029 Urbinoc, Italia
4Laboratoire des Materiaux Avances LMA, IN2P3/CNRS, F-69622 Villeurbanne, Lyon, France5 INFN, sezione di Napoli a; Universita di Napoli ”Federico II”b Complesso Universitario di Monte S.Angelo,
I-80126 Napoli; Universita di Salerno, Fisciano, I-84084 Salernoc, Italia6 Departement Artemis, Observatoire de la Cote d’Azur, CNRS, F-06304 Nice, France.
7LAL, Universite Paris-Sud, IN2P3/CNRS, F-91898 Orsay, France8ESPCI, CNRS, F-75005 Paris, France
9INFN, Sezione di Perugiaa; Universita di Perugiab, I-6123 Perugia,Italia10INFN, Sezione di Pisaa; Universita di Pisab; I-56127 Pisa; Universita di Siena, I-53100 Sienac, Italia
11INFN, Sezione di Romaa; Universita ”La Sapienza”b, I-00185 Roma, Italia12National institute for subatomic physics, NL-1009 DBa; Vrije Universiteit, NL-1081 HV b, Amsterdam, The Netherlands
13INFN, Sezione di Roma Tor Vergataa; Universita di Roma Tor Vergatab,Istituto di Fisica dello Spazio Interplanetario (IFSI) INAFc,
I-00133 Roma; Universita dell’Aquila, I-67100 L’Aquilad, Italia14 AstroParticule et Cosmologie (APC), CNRS: UMR7164-IN2P3-Observatoire
de Paris-Universite Denis Diderot-Paris VII - CEA : DSM/IRFU and∗Permanent address: School of Physics & Astronomy University of Birmingham B15 2TT, UK
(Dated: January 7, 2014 - DRAFT 5.4.2)
A search for gravitational wave burst events has been performed with the Virgo C7 commissioningrun data that have been acquired in September 2005 over five days. It focused on un-modeled shortduration signals in the frequency range 150 Hz to 2 kHz. A search aimed at detecting the GWemission from the merger and ringdown phases of binary black hole coalescences was also carriedout. An extensive understanding of the data was required to be able to handle a burst search usingthe output of only one detector. A 90% confidence level upper limit on the number of expectedevents given the Virgo C7 sensitivity curve has been derived as a function of the signal strength,for un-modeled gravitational wave search. The sensitivity of the analysis presented is, in terms ofthe root sum square strain amplitude, hrss ≃ 10−20/
√Hz. This can be interpreted in terms of a
frequentist upper limit on the rate R90% of detectable gravitational wave bursts at the level of 1.1events per day at 90% confidence level. From the binary black hole search, we obtained the distancereach at 50% and 90% efficiency as a function of the total mass of the final black hole. The maximaldetection distance for non-spinning high and equal mass black hole binary system obtained by thisanalysis in C7 data is ≃ 2.9 ± 0.1 Mpc for a detection efficiency of 50% for a binary of total mass80M⊙.
2
PACS numbers: 04.80.Nn, 07.05Kf
1. INTRODUCTION
Virgo [1] is a 3-km long arm power-recycled Michelson interferometer located near Pisa, Italy, whose goal is to detectgravitational waves (GW) emitted by astrophysical sources extending out past the Virgo cluster. The commissioningof the detector started in 2003 and regular data taking campaigns have been organized after each important milestone.The last commissioning run (C7) took place in September 2005 and lasted for 5 days. The best achieved sensitivity
was h ≃ 7×10⁻²²/√Hz at 300 Hz. The Virgo design sensitivity at this frequency is expected to be better by an order
of magnitude assuming that 10 W enters into the interferometer. However, during the C7 run, Virgo was runningwith a reduced light power, 0.7 W, because the backscattering in the mode-cleaner cavity of the light reflected bythe recycling mirror prevented the control of the interferometer at full power. Despite the reduced sensitivity, severalGW searches have been carried out using this data set in order to set up and tune the pipelines developed in Virgo:the search of the coalescence of neutron stars [2], the search of continuous wave sources [3], a joint Virgo, AURIGA,EXPLORER and NAUTILUS GW search [4], a targeted GW burst search associated with the long GRB 050915a [5],and the search of GW burst signals that is reported in this paper.
The category of gravitational wave bursts includes all possible signals whose duration is short, less than a fewhundreds of milliseconds. Many violent astrophysical phenomena will be accompanied by an emission of GW burst.If these events happen sufficiently close by, the ground based gravitational detectors will be able to observe theseshort duration GW bursts. There are many candidate GW burst sources. These include massive star core collapse[6, 7, 8, 9, 10], the merging phase of coalescing compact binary systems forming a single black hole (BH) [11, 12, 13, 14],BH ring-down [15], astrophysical engines that generate gamma-ray bursts (GRB) [16], neutron star oscillation modesand instabilities [17], or cosmic string cusps and kinks [18]. Some of these sources are well modeled, but not all, andas such a burst pipeline is built by making very few assumptions about the nature of these waveforms. The theoreticalevent rates for many of these sources are quite uncertain.
Binary black hole (BBH) mergers are an interesting source for GW burst searches. The typical event rate for thesesources is 1 Myr−1 per galaxy [19, 20] and is still highly uncertain given the lack of direct observational evidence forthe existence of BBH systems, unlike the double neutron star systems. Though these sources are routinely searched forby the inspiral phase prior to merger using matched filtering techniques, an independent search focusing on the mergerand ring-down GW emission, which is dominant for high mass binaries [11], may bring additional confidence [67]. Asearch of this type was first attempted with the LIGO S2 data [21]; this used the then-available numerical relativitywaveforms from the Lazarus project as a model of BBH mergers. However the estimates obtained were projected asorder of magnitude estimates due to the nonrobusteness of the waveforms used. Though the burst searches do nothave as large of a distance reach as an inspiral search, it will be interesting to understand the implications of a BHbinary search from a burst perspective, especially because a burst search is sensitive to the merger and ring-downphase of a BBH coalescence. Among the three phases of inspiral, merger and ring-down, most of the energy may bereleased in the highly relativistic phase of merger, that is difficult to model by analytic approximation methods. Butrecently numerical relativity simulations have made significant advances in generating the waveforms for all the threephases of the binary evolution (see [22] and references there in).
In this paper, we report on an all-sky burst search for un-modeled waveforms and BBH mergers without using anyprior information on the expected waveform. This concerns all short duration (≪ 1 s) signals having energy in thebest sensitivity frequency band of the C7 data, 150-2000 Hz. This search has been performed using the data of onlyone interferometer which does not allow one to perform timing coincidence to eliminate spurious events in one of thedetectors, as was done in the burst searches performed using the LIGO detectors [21, 23, 24] and the bar detectors[25]. However, a similar one-detector burst search has already been carried out with the data from the TAMA detector[26]. The C7 run data has been used for extensive analysis of the Virgo noise; this is a fundamental step in the pathtoward performing a GW burst search with only one detector. Indeed, numerous sources of noise generate, in theinterferometer’s GW strain amplitude channel, transient events which mimic GW burst events; environmental noise,such as acoustic noise, has been found at the origin of many of them. Non stationary data can also generate an excessof short duration events. Such phenomena have been found, examined, and understood in the C7 data. These studiesallowed us to define the pre-processing and post-processing steps needed in order to optimize the performance of theGW burst pipeline used in this analysis.
The outline of this paper is as follows. In Section 2 we describe the main features of the Virgo detector, emphasizingthe operating characteristics during the C7 run that played a role in understanding the quality of the data. In Section2.2 we describe how we select the data periods that have been used for this analysis. The burst pipeline used in thisanalysis is described in Section 3. In Section 3.4 the main results on the C7 data characterization needed in orderto understand and to suppress the sources of glitches are summarized; this includes the veto strategy used against
3
identified sources of noise. Section 4 gives the results of the search in the C7 data. Section 5 explains how the analysissensitivity has been estimated considering different types of possible GW burst waveforms. We especially consideredin this paper BBH merger and ring-down numerical waveforms [27]. Section 6 gives the upper limits obtained at 90%of confidence level on the number of events as a function of the signal strain amplitude. We finally conclude thispaper with an astrophysical interpretation of the present GW burst search.
2. VIRGO DURING THE COMMISSIONING RUN C7
2.1. Detector status
The Virgo detector [28] is a power recycled Michelson interferometer with 3-km long arms that each contain aFabry-Perot cavity. All mirrors are suspended from the so-called Superattenuator [29], whose goal is to reducedrastically above 10 Hz the seismic noise transferred to the instrument. A 20 W Nd:YAG laser is used to illuminatethe interferometer. The laser light is modulated in phase at the frequencies ≃ 22 and 6MHz; this technique permitsthe GW strain to be detected at the modulation frequency where the laser power fluctuation is much smaller thanin the interferometer bandwidth. The beam is spatially filtered with a 144m long triangular input mode-cleanercavity before being injected into the main interferometer. The laser frequency is pre-stabilized in order to acquire thecontrol of the different optical cavities, but to reach the extreme sensitivity targeted by Virgo an enhanced controlof the laser frequency noise is required; it has to be reduced by several orders of magnitude. This is the role of theso-called second stage frequency stabilization which is engaged during the cavities’ lock acquisition [30]. The beamentering the interferometer is divided by the beam splitter (BS) into two beams that are injected into the 3-km longarm cavities. Apart from the mirrors’ losses, all light fed-in by the injection system subsequently returns to it. Thepower-recycling (PR) mirror, with a reflectivity of 92%, reflects the out-going light back to the main interferometer.Together with the Michelson interferometer the power-recycling mirror forms a Fabry-Perot-like cavity in which thelight power is resonantly enhanced, thereby improving the shot noise limit. The Michelson interferometer is held onthe dark fringe, and the GW strain signal is expected in the beam at the dark port, which leaves the vacuum via theso-called detection bench. The detection bench is a suspended table accommodating several optical components. Thebeam coming from the BS passes through an output mode-cleaner, a 3.6 cm long rigid cavity. The main output beamis detected by a pair of InGaAs photodiodes. Useful signals are obtained by detecting the light in the transmission ofthe arm cavities and in reflection of the power-recycling cavity (B2 photodiode). The GW signal that results from adetuning of the carrier resonance in the arms is extracted from the dark port channel, demodulated, and then sampledat 20 kHz. This signal is digitized and filtered.
The control of the interferometer consists in maintaining the laser light resonant in the optical cavities and theoutput port tuned on the dark fringe, defining its working point. More precisely, the carrier must be resonant in allcavities while the sidebands must be resonant in the central cavity but anti-resonant in the arms. Despite the goodseismic noise attenuation provided by the Superattenuator, feedback controls are mandatory in order to keep theinterferometer locked on the right working point. In addition to the control of the longitudinal degrees of freedom ofthe cavities, the mirrors must be kept aligned with respect to each other. This is the so-called auto-alignment control(AA). If uncontrolled, the angular degrees of freedom of the suspended optics distort the cavity eigen-modes. Thiscauses power modulation of the light fields; furthermore, long term drifts will make the longitudinal control impossibleafter a certain amount of time, and misalignments increase the coupling of other noise sources into the dark port.This has been a major problem in the C7 data analysis (see Section 3.4). In actuality, during C7 not all of the mirrorswere under AA control; the arm input mirrors and the injection bench were only controlled locally.
To convert the signal received on the dark port into a measure of GW strain one needs to calibrate the residualarm-length difference; this includes at low frequencies the effect of the control loop keeping the cavities in resonance.The loop correction signals are subtracted from the dark port signal that is then converted into a strain via knowledgeof the optical gain of the feedback control loops. This gain may vary depending, for instance, on the alignment driftsof the optical elements. To monitor the variation, some sinusoidal signals (four between 100 and 110 Hz, and fourbetween 350 and 360 Hz) are applied on the end-arm mirrors and the amplitude of the lines are measured. Anotherimportant aspect of the GW strain reconstruction is the good knowledge of the transfer function of the actuator chainwhich is used to control the mirrors. Actually, during the C7 run, the calibration procedure was not as accurate asit is now. For instance, the frequency dependence of the digital to analog converter transfer function was not takeninto account in the reconstruction of the GW strain amplitude channel h(t). This yielded a systematic error on h(t)which has been estimated to be 40% [31].
Moreover, during C7 Virgo was running with a 700 mW laser beam entering the interferometer in order to avoidinstabilities due to the backscattering of light into the mode-cleaner cavity reflected by the recycling mirror. Theproblem has since been fixed during a shutdown carried out just after the C7 run. This reduced power light limited
4
frequency[Hz]10 210 310 410
Hz
h/
-2310
-2210
-2110
-2010
-1910
-1810
-1710
-1610
-1510
-1410
-1310
-1210C1 Nov 03C2 Feb 04C3 Apr 04
C4 Jun 04C5 Dec 04C6 Aug 05C7 Sept 05Design
C1 & C2 : single arm; C3 & C4 recombined; C5 & after : recycled
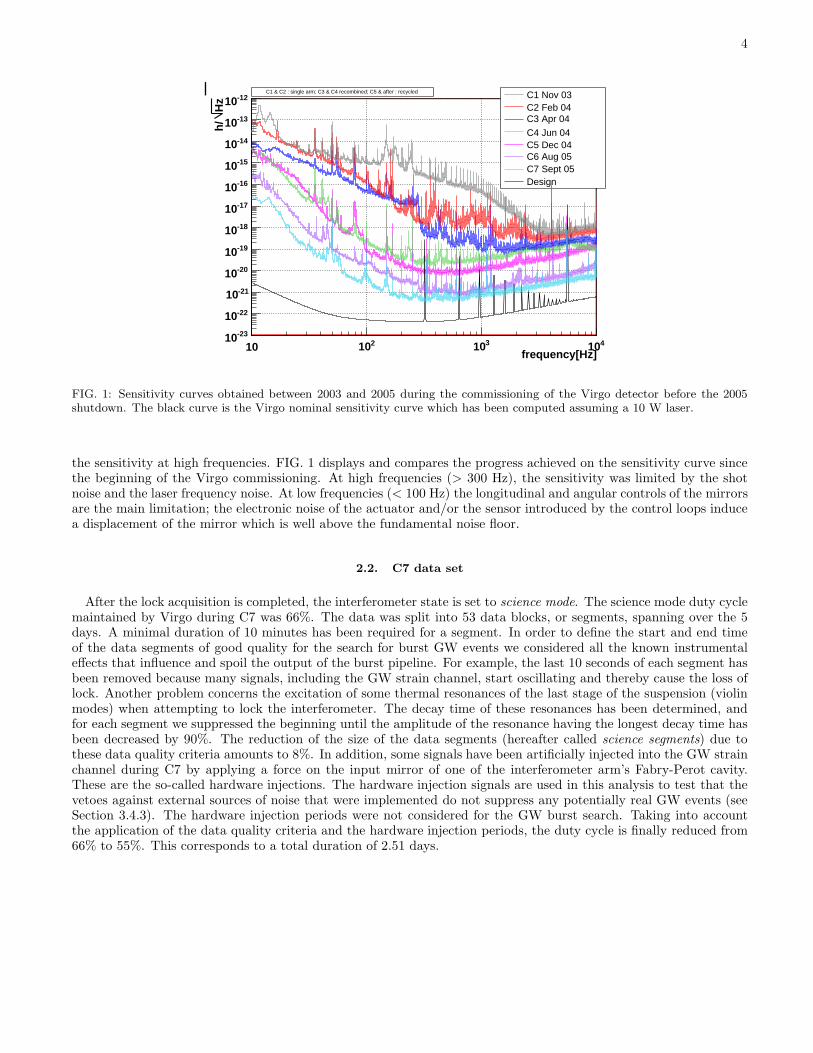
FIG. 1: Sensitivity curves obtained between 2003 and 2005 during the commissioning of the Virgo detector before the 2005shutdown. The black curve is the Virgo nominal sensitivity curve which has been computed assuming a 10 W laser.
the sensitivity at high frequencies. FIG. 1 displays and compares the progress achieved on the sensitivity curve sincethe beginning of the Virgo commissioning. At high frequencies (> 300 Hz), the sensitivity was limited by the shotnoise and the laser frequency noise. At low frequencies (< 100 Hz) the longitudinal and angular controls of the mirrorsare the main limitation; the electronic noise of the actuator and/or the sensor introduced by the control loops inducea displacement of the mirror which is well above the fundamental noise floor.
2.2. C7 data set
After the lock acquisition is completed, the interferometer state is set to science mode. The science mode duty cyclemaintained by Virgo during C7 was 66%. The data was split into 53 data blocks, or segments, spanning over the 5days. A minimal duration of 10 minutes has been required for a segment. In order to define the start and end timeof the data segments of good quality for the search for burst GW events we considered all the known instrumentaleffects that influence and spoil the output of the burst pipeline. For example, the last 10 seconds of each segment hasbeen removed because many signals, including the GW strain channel, start oscillating and thereby cause the loss oflock. Another problem concerns the excitation of some thermal resonances of the last stage of the suspension (violinmodes) when attempting to lock the interferometer. The decay time of these resonances has been determined, andfor each segment we suppressed the beginning until the amplitude of the resonance having the longest decay time hasbeen decreased by 90%. The reduction of the size of the data segments (hereafter called science segments) due tothese data quality criteria amounts to 8%. In addition, some signals have been artificially injected into the GW strainchannel during C7 by applying a force on the input mirror of one of the interferometer arm’s Fabry-Perot cavity.These are the so-called hardware injections. The hardware injection signals are used in this analysis to test that thevetoes against external sources of noise that were implemented do not suppress any potentially real GW events (seeSection 3.4.3). The hardware injection periods were not considered for the GW burst search. Taking into accountthe application of the data quality criteria and the hardware injection periods, the duty cycle is finally reduced from66% to 55%. This corresponds to a total duration of 2.51 days.
5
3. DESCRIPTION OF THE BURST SEARCH PIPELINE
3.1. Overview
The GW burst pipeline that has been used in this search is composed of several parts that allow us to select andanalyze all segments of Virgo data and eliminate, as much as possible, the artifacts in the detector output that couldmimic a GW event. The core of the pipeline is the GW detection statistic, described in Section 3.3, that is applied onpre-selected segments of data of good quality. This results in lists of triggers. As we are dealing with non Gaussianand non stationary data, many of these triggers are due to instrumental effects. The next step consists of identifyingall the sources of noise disturbances that pollute the detector output, and then define vetoes to be applied a posteriorion the trigger lists. This step in this pipeline is playing an important role as we cannot suppress these artifacts byrequesting coincidence with another detector. We provide details on how the vetoes have been defined and whichsources of noise they help in suppressing.
3.2. Data selection
Instrumental problems and environmental conditions have been identified that temporarily affect the detectorsensitivity for a GW burst search. In a pre-selection step, we discard the periods where the detector operation is notoptimal. To do so, we have defined a list of data quality flags (DQ) that highlight the intervals of malfunctioning.Among the DQ flags, some pertain to the saturation of the photodiodes and/or actuator signals that are used tokeep the interferometer locked to its operating point. The analog electronics of the control loop that maintains thelaser frequency noise below the requirements was sometimes also saturating. That then induces incorrect controlsignals and consequently a misbehaving GW strain amplitude. An excess of events was found when the GW strainh(t) reconstruction process was facing a problem, for instance when the calibration lines were buried in the noise.When this happens the h(t) reconstruction program sets a DQ flag stored in the data stream. Sometimes during C7a few frames or channels were missing due to some failure of the data acquisition system. That produces a hole in thecontinuous time series. The burst pipelines manage properly with the presence of holes in a segment, but to accuratelycompute the effective duty cycle we have defined a DQ flag pertaining to this issue. Finally, it has been found thatwhen an aircraft is flying above the interferometer at a relatively low altitude acoustic and/or seismic noise couplesinto the dark fringe beam and induces a strong effect in h(t) that is detected by the burst pipelines. The band limitedRMS of some acoustic probes (located in the end arm buildings) were monitored to detect the airplanes. All theseDQ segments have been combined into a single list, taking into account possible overlaps. The dead time induced bythe application of these DQ flags on triggers list was only 0.8%, of the total duration which is acceptably low.
3.3. Event trigger generation: Exponential Gaussian Correlator
Different pipelines have been developed to search for GW bursts. Many of them [32, 33, 34, 35] rely on a commonprinciple i.e., the detection of clusters of excess energy in a time-frequency representation of the data. The pipelinewe use in this analysis follows the same idea; we refer to it as the Exponential Gaussian Correlator (EGC) as it beendescribed in [36], but here we give here a short summary.
The time-frequency plane can be tiled using a lattice of sine Gaussian waveforms i.e.,
Φ(t) = exp
(
−1
2
(
t
τ0
)2)
e2πif0t, (1)
where the values of the central frequency f0 and typical duration τ0 can be chosen in such way as to optimize thecoverage of the plane. The idea is to consider the above waveforms as typical burst transients and to search for themusing a matched filtering technique. For this reason, we designate Φ(t) as a template waveform. The EGC computesthe cross-correlation of the data with the templates, namely
C(t) =1
N
∫ +∞
−∞
x(f)Φ∗(f)
S(f)e2πiftdf, (2)
where x(f) and Φ(f) are the Fourier transforms of the data and template, and S(f) is the two-sided power spectral
6
density of the noise. N is the normalization factor of the templates defined as
N =
√
∫ +∞
−∞
|Φ(f)|2S(f)
df, (3)
For the present analysis, the power spectral density has been estimated over data segments of 600 second duration.To define the template lattice, the parameterization using the quality factor Q0 = 2πτ0f0 instead of the duration τ0is preferred. Using the algorithm of [37], we tile the parameter space (f0, Q0) with a minimal match of 99%. Theparameter ranges 150 Hz ≤ f0 ≤ 2 kHz and 2 ≤ Q0 ≤ 16 correspond to the frequency band of best sensitivity for Virgoduring the C7 run. This generates 420 templates; the shortest and longest ones have 0.31 ms and 34 ms duration.
The quantity ρ =√
2 × |C|2 is the signal-to-noise ratio (SNR), which we use as a detection statistic. It depends onthe analysis time t, the template frequency f0, and quality factorQ0. It thus defines a three-dimensional representationmap of the data [36] in which we search for a local excess as compared to typical noise fluctuations.
We first apply a low threshold (SNR of 3.3) to the map. We form clusters with the surviving pixels of energy |Ci|2with a two pass procedure. The pixels are grouped into clusters using the Hoshen-Kopelman algorithm [38]. Oncethe cluster is formed, all pixels that have a SNR lower than 5 are removed. Then, all clusters overlapping in time orseparated by less than 50 ms are grouped together once again. We produce the final list of triggers by requesting thatthe cluster SNR (
√
2 ×∑
|Ci|2) is larger than 11.3. This choice for the threshold is a good compromise between nothaving too many triggers and not losing too much detection efficiency.
The triggers’ information is extracted from the clusters. The peak time, peak frequency and the trigger SNR aredefined by the pixel that has the highest SNR. The duration and the frequency bandwidth of the trigger take intoaccount all the pixels in the cluster. The timing resolution of EGC has been estimated for different kinds of waveforms[36, 39]. For most signals used in the benchmark test, the timing resolution of EGC is smaller than 1 ms for SNR of10, but it can be as large as a few ms.
3.4. Vetoes
The search for GW burst events presented here was carried out on real data that are non-Gaussian and non-stationary. This prevents the use of theoretical estimates of the expected false alarm rate. On the contrary, thebackground rate must be extracted from the data itself. In the multi-detector context, the background can beestimated by computing the rate of (purely accidental) coincidences between trigger lists that were time shifted withrandom delays [21, 24]. We cannot resort to such procedure in the case of this study since we only have the Virgo C7data set at our disposal. There is a need to initially identify, in an thorough way, all the sources of noise that generatelarge SNR triggers that can mimic GW burst events; these types of noise events have to be suppressed before we tryto estimate the background event number.
We define a methodology that guaranties that we do not discard any true GW event as long as they do not coincidewith a bad quality data period. Initially, there was the study of all the sources of noise that generate large SNRtriggers, or more generally an excess of triggers, and the construction of vetoes to suppress these triggers. The studywas performed on a subset of the C7 dataset (the playground segment) chosen arbitrarily before starting the GWburst search, in order to avoid bias. Our main concern in the veto development process was to minimize the deadtime introduced by the data quality selection, while assuring a high level of noise trigger rejection. To perform thebackground studies and develop the veto strategy we used the longest C7 science segment; this segment was 14 hoursin duration (22% of the whole dataset used for the GW burst search).
Several transient detection algorithms have been applied to the playground dataset to identify and characterize thesources of noise that generate the high SNR triggers that mimic a GW burst event. Mean Filter searches for an excessin a moving average computed on whitened data [40]. Peak Correlator is a matched filter using Gaussian waveformtemplates [40]. The Wavelet Detection Filter is based on a multi-resolution time-frequency transform applied onwhitened data [5]. Results of these pipelines have been compared to ensure that all sources of transient events havebeen discovered. These detection algorithms search for a short duration excess of energy, but using different methods.All of the trigger lists show a rather large excess of events compared to expectation from Gaussian noise; there was adefinite excess of large SNR triggers.
Two categories of large triggers have been identified; the first one corresponds to short glitches correlated to a glitchalso present in an auxiliary channel. These auxiliary channels includes the available environmental monitoring andcontrol loop signals (see Section 3.4.1). The second category of glitches have been found to be due to the so-called”bursts of bursts” that we describe in Section 3.4.2. Specific vetoes against these two sorts of glitches have beendeveloped as explained in Section 3.4.3
7
3.4.1. Origin of the short duration glitches
To veto all periods of data during which instrumental or environmental problems occurred and generated a glitch inthe GW channel data, one first needs to figure out which auxiliary channels are the most sensitive to these particularsources of noise. The by-eye scanning of the loudest events observed in the playground dataset already gave hints topotentially useful auxiliary channels. However we subsequently performed a systematic analysis using many channelsrecorded by Virgo and using the Mean Filter pipeline.
We have found that three channels were particularly interesting for vetoing glitches in the GW strain amplitudechannel h(t). It has been seen that many high SNR burst events are coincident in time with the realignment of thequadrant photodiodes by some stepping motors. These quadrant photodiodes, used for the interferometer automaticalignment system, are located at the output of the interferometer, on the same optical bench hosting the photodiodesused to detect the interferometer dark port signal. The stepping motors were generating very loud acoustic andmechanical noise that coupled into the dark fringe beam nearby. Each time a quadrant photodiode is moved there is alarge increase in the signal measured by an accelerometer probe located on the detection bench. When the quadrantphotodiodes were not re-aligned (horizontal and vertical positions remain constant) the RMS of the accelerometerprobe signal remained low. The rate of the quadrant photodiodes’ realignment was not constant over the run; initiallythe alignment occurred every 3 seconds, but this was then reduced to every 300 seconds at the end the C7 run afterthe discovery of the problem (the parameters of the process responsible for the quadrant photodiodes realignmenthave subsequently been changed to diminish this problem). This acoustic/mechanical noise generated glitches in theGW strain amplitude channel whose frequency content was around 550 Hz. Due to the fact that the excess of acousticnoise could last up to 1 second, which is long for a glitch finding algorithm, we used the RMS computed over 100 ms ofdata from an accelerometer located on the detection bench instead of the Mean Filter triggers to create a veto (called’Seismic’ in the writing below). This allowed a more precise definition of the GPS time of the maximum of the excessof noise. This source of glitches has been found to be dominant in the playground dataset, but other (and rarer)types of glitches have also been found in the C7 data. Indeed, events in the Second Stage Frequency StabilizationSystem correction signal were observed in coincidence with h(t) glitches. Some remaining loud glitches discoveredin the GW strain amplitude channel have been found to be coincident in time with a dip in the power of the beamreflected by the interferometer toward the laser as recorded by the so-called B2 photodiode. The light impinging onthe B2 photodiode is sensitive to the power recycling cavity length change. The origin of the power dips have notbeen understood, but the effect on the GW strain amplitude was demonstrated and the safety of this veto using anoptical auxiliary channel has been carefully studied, and is discussed below. To define an event by event veto for thetwo latest categories of glitches we used the Mean Filter triggers. These vetoes are hereafter referred to as ’SSFS’ and’B2’.
3.4.2. Bursts of bursts
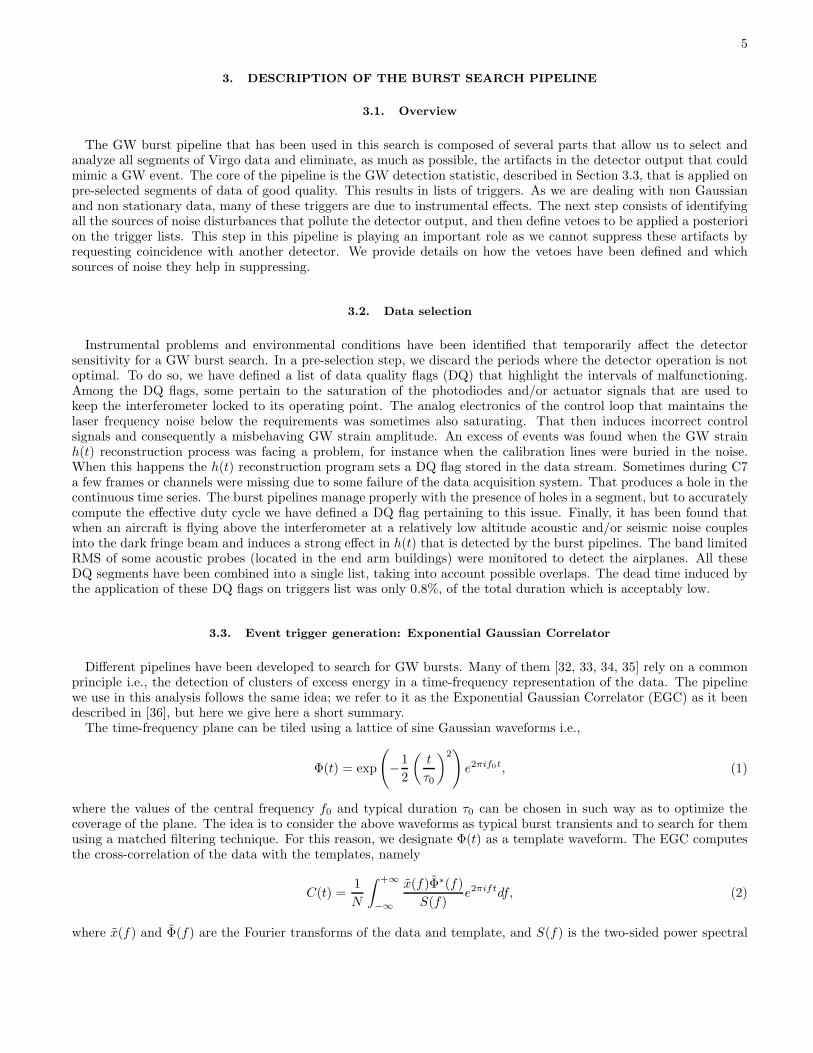
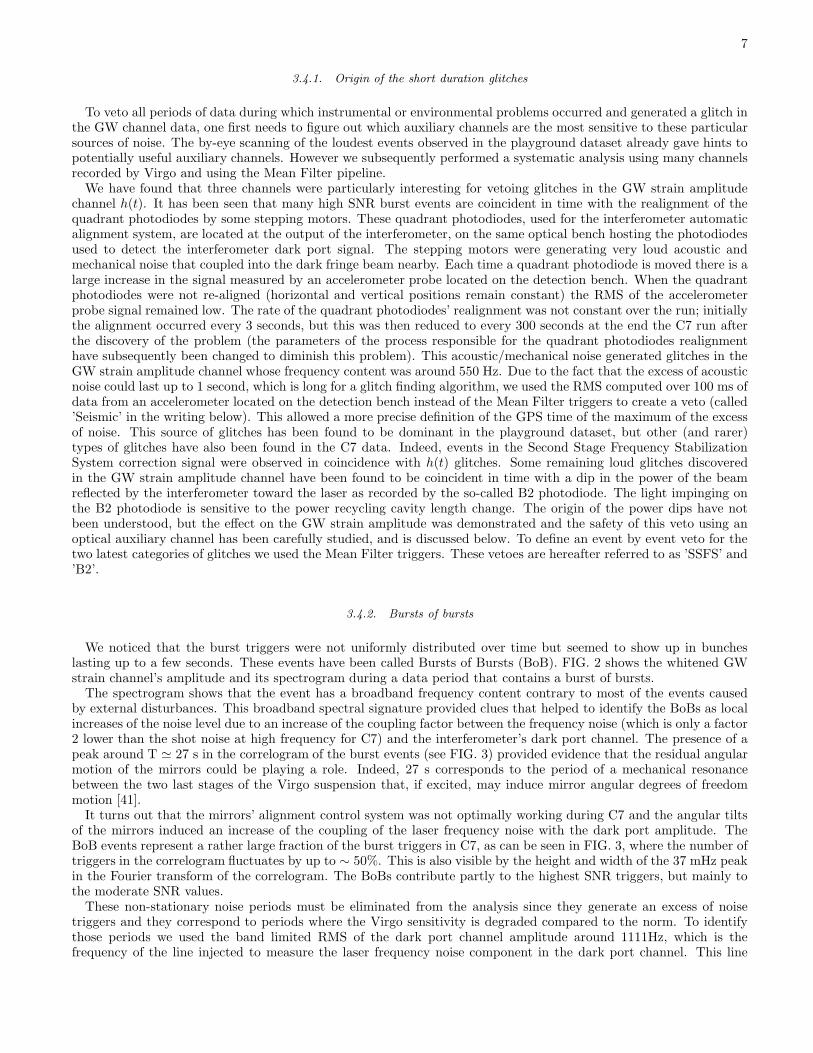
We noticed that the burst triggers were not uniformly distributed over time but seemed to show up in buncheslasting up to a few seconds. These events have been called Bursts of Bursts (BoB). FIG. 2 shows the whitened GWstrain channel’s amplitude and its spectrogram during a data period that contains a burst of bursts.
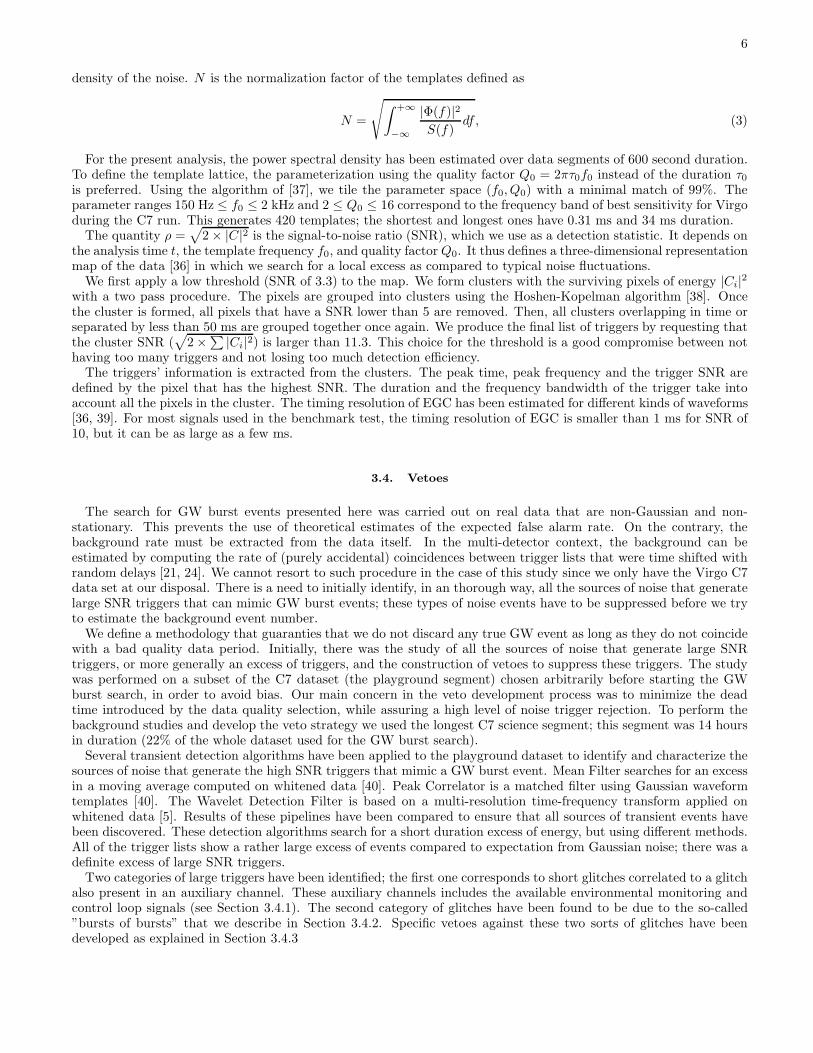
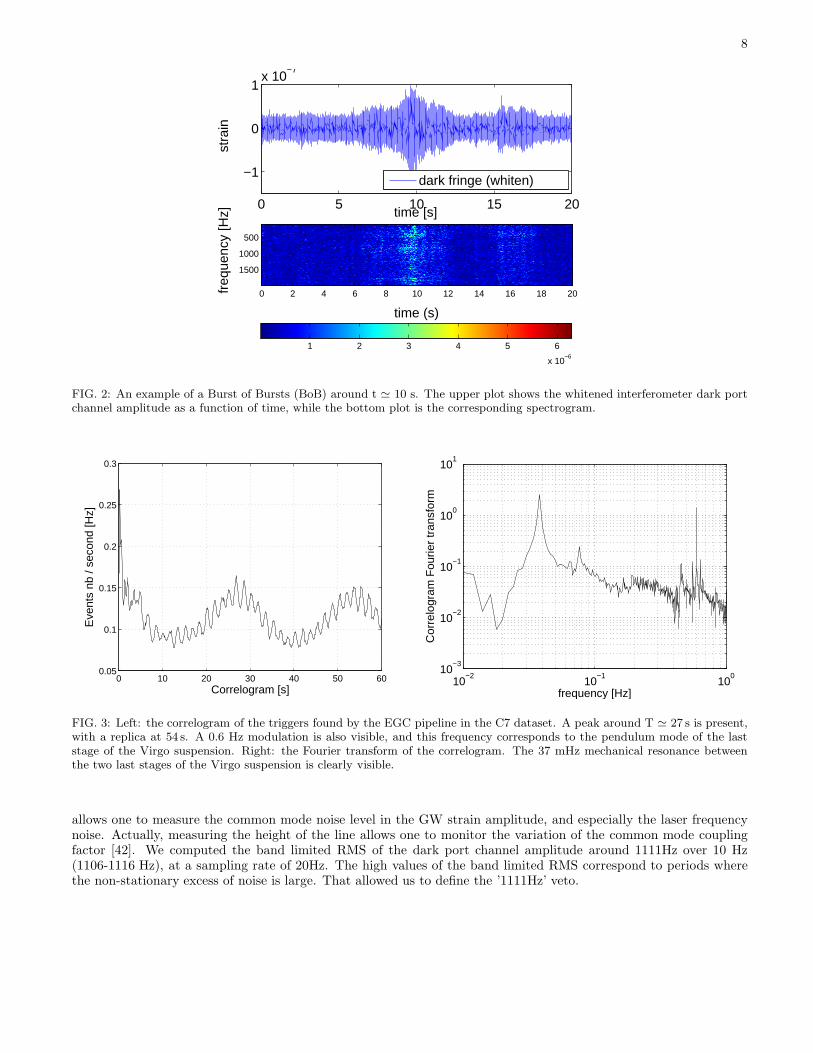
The spectrogram shows that the event has a broadband frequency content contrary to most of the events causedby external disturbances. This broadband spectral signature provided clues that helped to identify the BoBs as localincreases of the noise level due to an increase of the coupling factor between the frequency noise (which is only a factor2 lower than the shot noise at high frequency for C7) and the interferometer’s dark port channel. The presence of apeak around T ≃ 27 s in the correlogram of the burst events (see FIG. 3) provided evidence that the residual angularmotion of the mirrors could be playing a role. Indeed, 27 s corresponds to the period of a mechanical resonancebetween the two last stages of the Virgo suspension that, if excited, may induce mirror angular degrees of freedommotion [41].
It turns out that the mirrors’ alignment control system was not optimally working during C7 and the angular tiltsof the mirrors induced an increase of the coupling of the laser frequency noise with the dark port amplitude. TheBoB events represent a rather large fraction of the burst triggers in C7, as can be seen in FIG. 3, where the number oftriggers in the correlogram fluctuates by up to ∼ 50%. This is also visible by the height and width of the 37 mHz peakin the Fourier transform of the correlogram. The BoBs contribute partly to the highest SNR triggers, but mainly tothe moderate SNR values.
These non-stationary noise periods must be eliminated from the analysis since they generate an excess of noisetriggers and they correspond to periods where the Virgo sensitivity is degraded compared to the norm. To identifythose periods we used the band limited RMS of the dark port channel amplitude around 1111Hz, which is thefrequency of the line injected to measure the laser frequency noise component in the dark port channel. This line
8
0 5 10 15 20
−1
0
1x 10
−7
time [s]st
rain
time (s)
freq
uenc
y [H
z]
0 2 4 6 8 10 12 14 16 18 20
500
1000
1500
dark fringe (whiten)
1 2 3 4 5 6
x 10−6
FIG. 2: An example of a Burst of Bursts (BoB) around t ≃ 10 s. The upper plot shows the whitened interferometer dark portchannel amplitude as a function of time, while the bottom plot is the corresponding spectrogram.
0 10 20 30 40 50 600.05
0.1
0.15
0.2
0.25
0.3
Correlogram [s]
Eve
nts
nb /
seco
nd [H
z]
10−2
10−1
100
10−3
10−2
10−1
100
101
frequency [Hz]
Cor
relo
gram
Fou
rier
tran
sfor
m
FIG. 3: Left: the correlogram of the triggers found by the EGC pipeline in the C7 dataset. A peak around T ≃ 27 s is present,with a replica at 54 s. A 0.6 Hz modulation is also visible, and this frequency corresponds to the pendulum mode of the laststage of the Virgo suspension. Right: the Fourier transform of the correlogram. The 37 mHz mechanical resonance betweenthe two last stages of the Virgo suspension is clearly visible.
allows one to measure the common mode noise level in the GW strain amplitude, and especially the laser frequencynoise. Actually, measuring the height of the line allows one to monitor the variation of the common mode couplingfactor [42]. We computed the band limited RMS of the dark port channel amplitude around 1111Hz over 10 Hz(1106-1116 Hz), at a sampling rate of 20Hz. The high values of the band limited RMS correspond to periods wherethe non-stationary excess of noise is large. That allowed us to define the ’1111Hz’ veto.
9
3.4.3. Veto parameters tuning
Once the channel and filter have been identified, one needs to tune the parameters of the veto, namely the thresholdand the duration of the vetoed window around the time of the glitch. The parameters are adjusted to maximize theveto significance, keeping the dead time (i.e., percentage of vetoed science time) below a reasonable value. Thesignificance is defined as the ratio of the number of triggers (presumed to be instrumental glitches) that the procedurevetoes by the square root of the number of triggers it would accidentally veto if there is no physical link between theglitches of the auxiliary channel and h(t) [68]. The significance measures the excess of coincident events in standarddeviation units. We used the GW strain amplitude triggers of the EGC pipeline to tune the vetoes as we wanted anoptimal background rejection for this analysis. The rate of accidental coincidence was measured by artificially timeshifting the list of auxiliary glitches while the number of vetoed triggers is obtained for the zero-lag. We vary thethreshold on the auxiliary channel output (SNR or RMS) and the duration of the veto window. For each value wecompute the dead time, the efficiency (fraction of EGC triggers that are vetoed) and the use percentage of the veto(fraction of auxiliary channel triggers that veto an EGC trigger). A good veto must have a high use percentage [43].The size of the veto window must be larger than the peak time difference in order to conservatively veto the regionaround the glitch, and can be as large as the total duration of the auxiliary channel trigger. Values from 100 ms upto 600 ms have been tested.
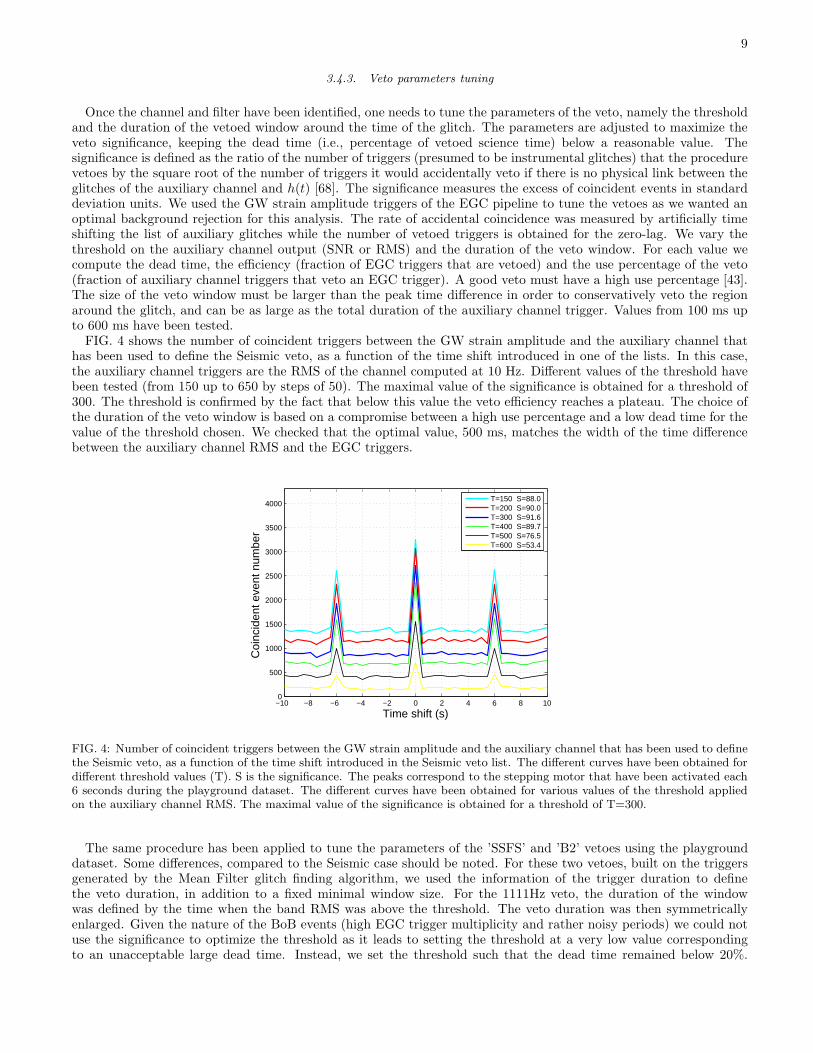
FIG. 4 shows the number of coincident triggers between the GW strain amplitude and the auxiliary channel thathas been used to define the Seismic veto, as a function of the time shift introduced in one of the lists. In this case,the auxiliary channel triggers are the RMS of the channel computed at 10 Hz. Different values of the threshold havebeen tested (from 150 up to 650 by steps of 50). The maximal value of the significance is obtained for a threshold of300. The threshold is confirmed by the fact that below this value the veto efficiency reaches a plateau. The choice ofthe duration of the veto window is based on a compromise between a high use percentage and a low dead time for thevalue of the threshold chosen. We checked that the optimal value, 500 ms, matches the width of the time differencebetween the auxiliary channel RMS and the EGC triggers.
−10 −8 −6 −4 −2 0 2 4 6 8 100
500
1000
1500
2000
2500
3000
3500
4000
Time shift (s)
Coi
ncid
ent e
vent
num
ber
T=150 S=88.0T=200 S=90.0T=300 S=91.6T=400 S=89.7T=500 S=76.5T=600 S=53.4
FIG. 4: Number of coincident triggers between the GW strain amplitude and the auxiliary channel that has been used to definethe Seismic veto, as a function of the time shift introduced in the Seismic veto list. The different curves have been obtained fordifferent threshold values (T). S is the significance. The peaks correspond to the stepping motor that have been activated each6 seconds during the playground dataset. The different curves have been obtained for various values of the threshold appliedon the auxiliary channel RMS. The maximal value of the significance is obtained for a threshold of T=300.
The same procedure has been applied to tune the parameters of the ’SSFS’ and ’B2’ vetoes using the playgrounddataset. Some differences, compared to the Seismic case should be noted. For these two vetoes, built on the triggersgenerated by the Mean Filter glitch finding algorithm, we used the information of the trigger duration to definethe veto duration, in addition to a fixed minimal window size. For the 1111Hz veto, the duration of the windowwas defined by the time when the band RMS was above the threshold. The veto duration was then symmetricallyenlarged. Given the nature of the BoB events (high EGC trigger multiplicity and rather noisy periods) we could notuse the significance to optimize the threshold as it leads to setting the threshold at a very low value correspondingto an unacceptable large dead time. Instead, we set the threshold such that the dead time remained below 20%.
10
We checked that this choice assures that the veto was able to suppress a large fraction of the BoB events. The vetodefinitions and the chosen parameters are reported in TABLE I.
Veto Auxiliary channel quantity threshold tuning method threshold time window
1111Hz Band RMS (computed at 20Hz) dead time 12 period above the threshold +/-300 ms
Seismic RMS (computed at 10Hz) significance 300 500 ms (fixed)
SSFS SNR of the Mean Filter triggers significance 6 Mean Filter trigger duration - minimal value: 300ms
B2 SNR of the Mean Filter triggers significance 10 Mean Filter trigger duration - minimal value: 300ms
TABLE I: Definition and parameters of the four event by event vetoes that have been developed and tuned for this analysis.
3.4.4. Veto safety
The safety of a veto is of fundamental importance as we do not want to inadvertently eliminate any real GW event.Vetoes based and dedicated to suppress coincident glitches in the GW strain amplitude channel must be safe withrespect to real GW events. The DQ flags and vetoes which suppress deleterious periods of data can be potentiallyunsafe since the source of noise is independent from the effect of a real GW impinging upon the detector. On thecontrary, we must be sure that a veto based on an auxiliary channel that has some glitches remains silent when areal GW event is passing through the detector. More precisely, environmental channels such as acoustic or seismicprobes are expected to be safe, whereas vetoes constructed on optical or interferometer control channels may beunsafe, since a GW event will generate a change in photodiode signals that can be used within the feedback loopof some control systems. To test the safety of an auxiliary channel, one can examine the periods where hardwareinjections of fictitious GW signals are inserted into the interferometer. A deterministic force applied on the NorthInput (NI) mirror, induces a variation of the length of the North arm Fabry-Perot cavity which then mimics the effectof a real GW on the interferometer. During C7 there were two periods of hardware injections, and these includedtwo different type of burst waveforms: 60 Sine Gaussian (f=920 Hz, Q=15, and f=460 Hz, Q=15), and 33 Gaussian(σ=1ms). Both of these signals were injected with a SNR of 15 using a sensitivity curve taken just before the runstarted (the real SNR of the hardware injections is somehow different due to the sensitivity variation during the run).The critical point concerns the safety of the SSFS and B2 vetoes, which could in principle be unsafe. None of thehardware injection signals have been vetoed by the Seismic, SSFS and B2 vetoes. This establishes that our vetoes weresafe. The anti-BoB veto 1111Hz which was built using directly the gravitational wave channel was, by construction,unsafe for GW burst event whose frequency content is around 1111 ± 5 Hz. We could not check that the veto wasunsafe for these signals using the hardware injections as no signal with enough amplitude in this frequency range hasbeen injected, but we should consider that the GW burst analysis presented here is insensitive for GW signals in the1106-1116 Hz frequency band. Besides, the safety of a veto assumes that its dead time remains small. This is thecase for all the vetoes used in this analysis except the 1111Hz veto whose large dead time (16.1%) might suppress areal GW burst event. The anti-BoB veto 1111Hz suppressed 2 hardware injections, which is less than what we couldforesee given the large dead time of this veto.
4. OUTPUT OF THE GW BURST SEARCH PIPELINE
4.1. First results
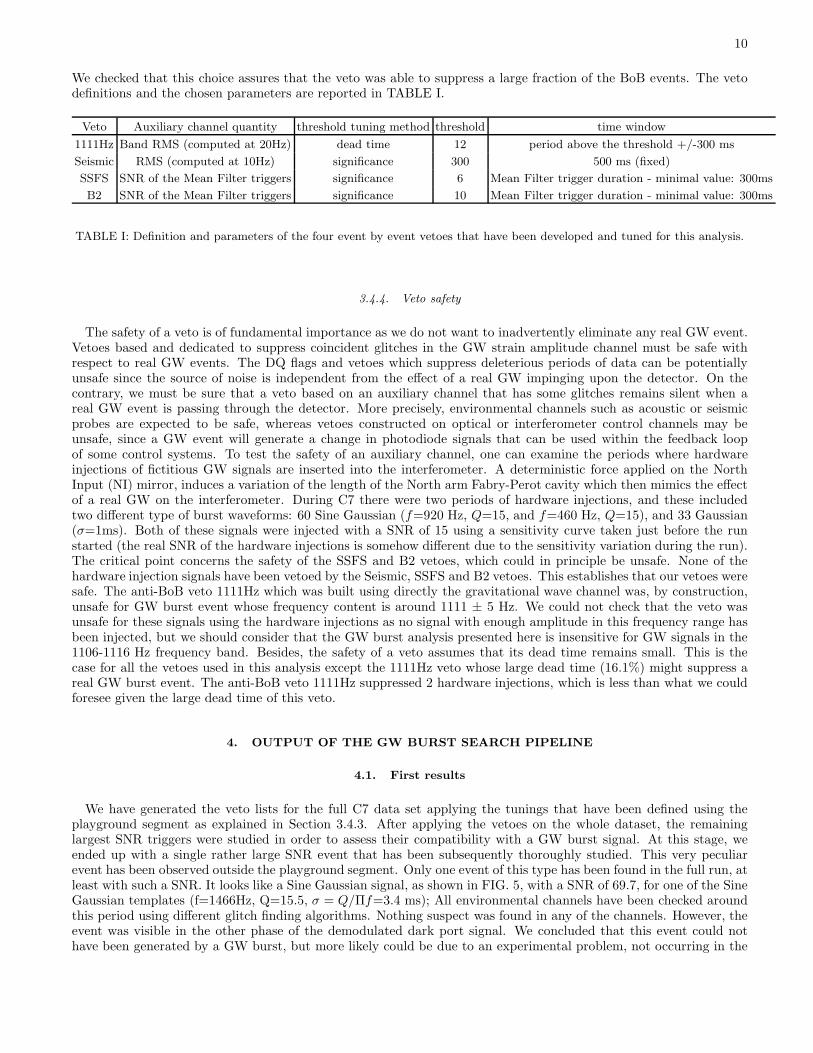
We have generated the veto lists for the full C7 data set applying the tunings that have been defined using theplayground segment as explained in Section 3.4.3. After applying the vetoes on the whole dataset, the remaininglargest SNR triggers were studied in order to assess their compatibility with a GW burst signal. At this stage, weended up with a single rather large SNR event that has been subsequently thoroughly studied. This very peculiarevent has been observed outside the playground segment. Only one event of this type has been found in the full run, atleast with such a SNR. It looks like a Sine Gaussian signal, as shown in FIG. 5, with a SNR of 69.7, for one of the SineGaussian templates (f=1466Hz, Q=15.5, σ = Q/Πf=3.4 ms); All environmental channels have been checked aroundthis period using different glitch finding algorithms. Nothing suspect was found in any of the channels. However, theevent was visible in the other phase of the demodulated dark port signal. We concluded that this event could nothave been generated by a GW burst, but more likely could be due to an experimental problem, not occurring in the
11
chosen playground segment. Indeed, the modulation phase angle was tuned such that the effect of a GW crossing theinterferometer was contained in one demodulated phase (ACp) of the dark port signal, while the other (ACq) shouldnot be perturbed. This observation lead us to develop an event by event veto (called ’PQ’) based on the ratio ofthe SNR of time coincident triggers in the two demodulated phase signals as proposed in the literature [44, 45, 46].Despite the fact that such kind of events have not been found in the playground segment as a significant source ofloud noise events, we decided to develop this veto and to apply it on the full data set. The other loudest high SNRevents have been found compatible with BoB-like events.
04s62 04s6304s62 04s6334
35
36
37
-610×
time
dark port channel
time
04s62 04s6304s62 04s63
-0.2
0
0.2
-610×
time
whitened dark port channel
timetimetime
FIG. 5: Time series in the dark port channel (left) and the whitened dark port channel (right) of the loudest event detected bythe EGC pipeline in the search for GW bursts in the C7 data. This event was seen with a SNR of 69.7 at a frequency about1466 Hz.
4.2. Necessity of an a posteriori veto
The in-phase signal contains a priori the GW strain amplitude, provided that the demodulation phase is well tuned.An error in the demodulation phase induces a small coupling of the GW signal with the quadrature channel. However,the ratio of the GW energy seen in the two phases is expected to remain high. The ratio is expected to be proportionalto 1
sin(δφ) , where δφ is the error on the demodulation phase [45]. Unfortunately we do not know precisely the value
of δφ during C7. A real GW event will be seen with a SNR in ACp much higher than in ACq. On the contrary, ACqwill be sensitive to glitches in signals which are related to common mode noise. It may happen that some source ofnoise can affect both quadrature signals with similar strength. This is especially the case for a dust particle crossingthe laser beam before the output dark port photodiode where the beam is especially small in width. A key pointof such a veto is to assure that no real GW events would be suppressed, and therefore one would need to develop aveto with a rather good security factor. To do so, we used the hardware injections to verify safety and develop thecharacteristics of this veto.
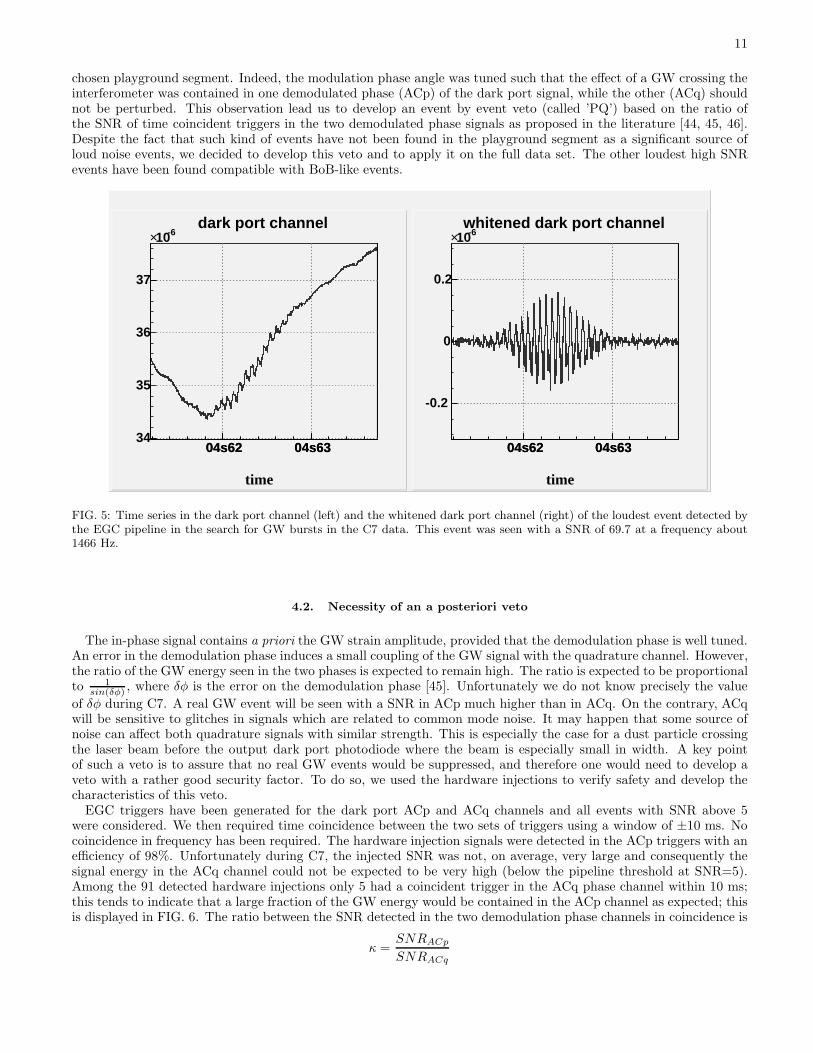
EGC triggers have been generated for the dark port ACp and ACq channels and all events with SNR above 5were considered. We then required time coincidence between the two sets of triggers using a window of ±10 ms. Nocoincidence in frequency has been required. The hardware injection signals were detected in the ACp triggers with anefficiency of 98%. Unfortunately during C7, the injected SNR was not, on average, very large and consequently thesignal energy in the ACq channel could not be expected to be very high (below the pipeline threshold at SNR=5).Among the 91 detected hardware injections only 5 had a coincident trigger in the ACq phase channel within 10 ms;this tends to indicate that a large fraction of the GW energy would be contained in the ACp channel as expected; thisis displayed in FIG. 6. The ratio between the SNR detected in the two demodulation phase channels in coincidence is
κ =SNRACp
SNRACq
12
101
102
101
102
ACp SNR
AC
q S
NR
κ=1
κ=2
κ=3
C7 data (DQ only)SG + GaussianCBCC7 data vetoed
FIG. 6: SNR of the coincident EGC triggers in the two quadrature demodulated channels of the output dark port signal: ACp(in phase) and ACq (in quadrature). The time coincidence window of the triggers seen in the two channels is 10 ms. TheSeismic, SSFS, B2 and 1111Hz vetoes have already been applied. The peculiar event appears very isolated with respect to theother triggers with its ACq SNR of 141. The hardware injection signals, which were seen in both of the two demodulationphase channels, are indicated by the circles for burst-like signals and by the squares for the compact binary coalescence (CBC)signals.
The very low event statistics (5 events detected simultaneously in ACp and ACq) encourages us to stay conservativewhen defining the PQ veto parameters. We checked that the use of a ±10 ms window limits the accidental coincidenceevent rate to 0.2 over the period of the hardware injections (assuming a Poisson trigger rate). This excludes the factthat we have more than one accidental association with an ACq trigger for the fix burst hardware injections as shownin FIG. 6. In this figure, the strange and unique high SNR event is totally isolated from the rest of the events. Thisevent has κ ≃ 0.42 and a SNR in the ACq channel of 141; these facts totally exclude the possibility that this eventhas been generated by a real GW.
The goal of the PQ veto is to suppress high SNR events in the ACq channel that induce a transient in the darkport channel amplitude. That is why it is reasonable to consider only large SNR ACq triggers. A threshold is appliedon the SNR of the ACq triggers (SNRACq). The other veto parameter threshold pertains to the ratio κ. We didnot try to optimize these two parameters, but rather we keep a conservative attitude with respect to the hardwareinjection signals’ position in the two-dimensional plane that shows the SNR of both quadratures for the coincidenttriggers (see FIG. 6). The veto list segments have been defined as the periods during which SNRACq > 8 and κ < 1.All burst hardware injection signals pass these conditions with a safety factor since they are all below the κ = 2 line.The starting and ending times of the veto segments are given by the ACq trigger times. The dead time of the PQveto is 0.07%, which is very acceptable.
4.3. Final results
TABLE II gives the dead time of the five event-by-event vetoes which have been used in this analysis. The totaldead time amounts to 21.2% taking into account overlaping veto segments. This is a rather high value, mainly becauseof the presence of the non-stationary excess of noise due the looseness of the mirror’s angular degree of freedom controlduring C7.
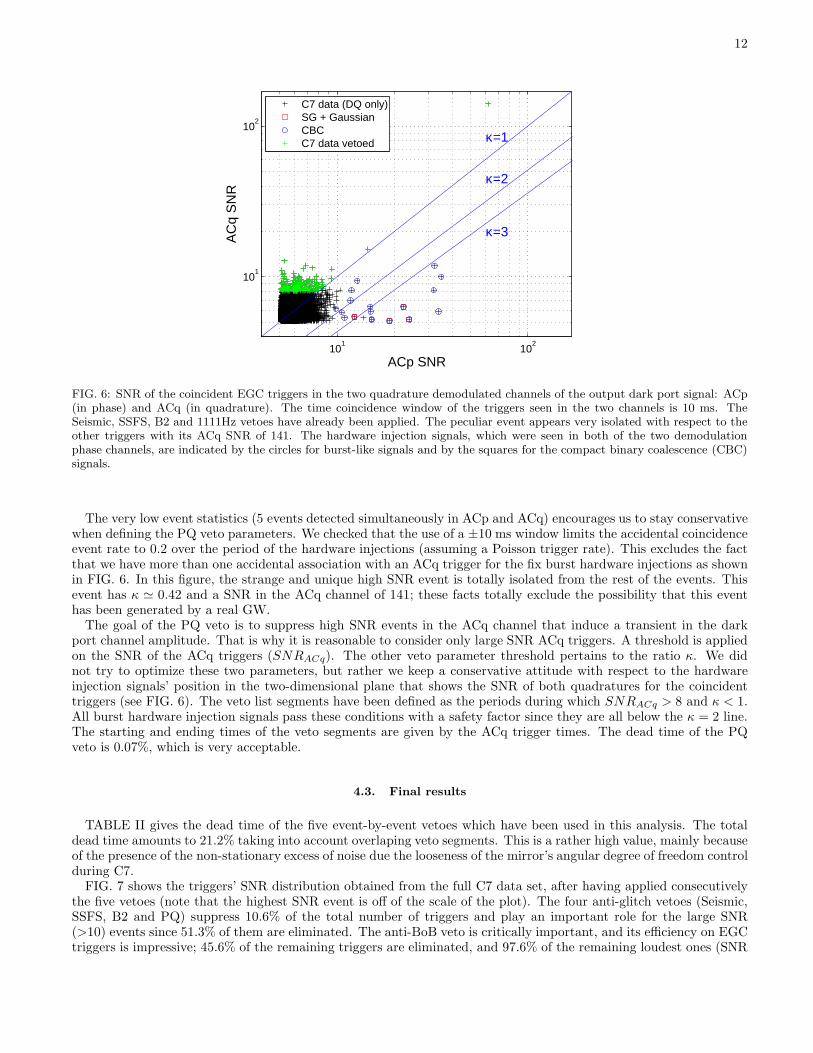
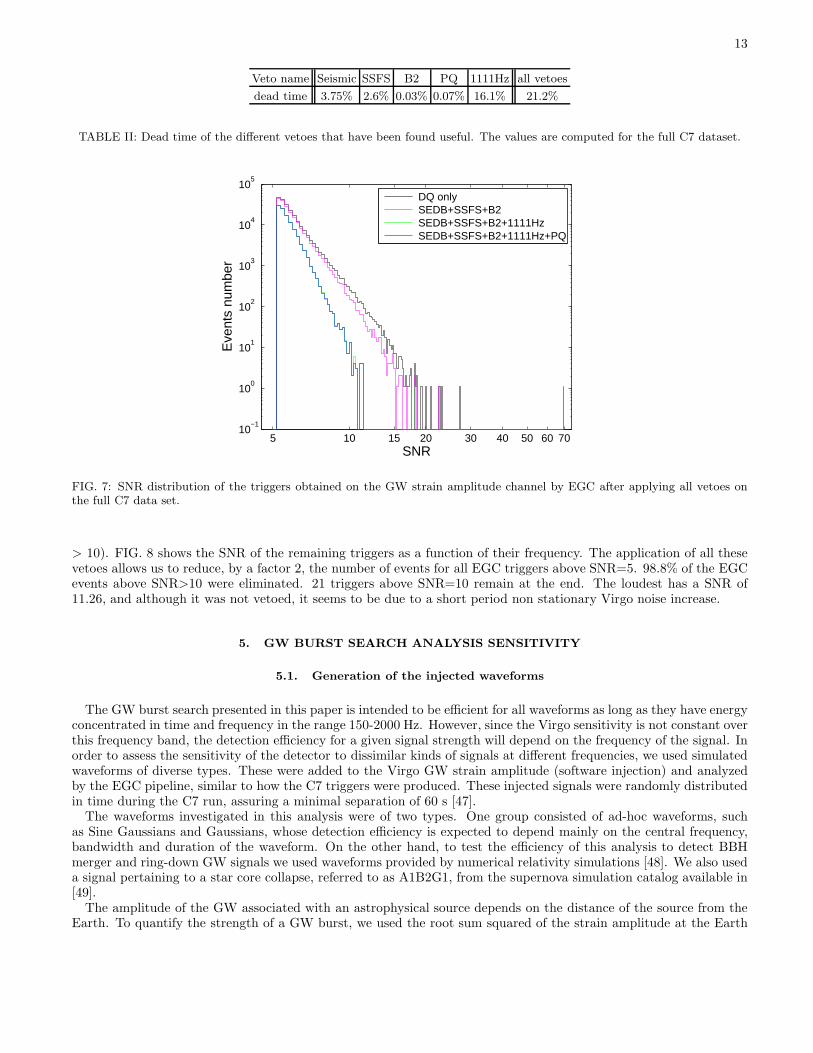
FIG. 7 shows the triggers’ SNR distribution obtained from the full C7 data set, after having applied consecutivelythe five vetoes (note that the highest SNR event is off of the scale of the plot). The four anti-glitch vetoes (Seismic,SSFS, B2 and PQ) suppress 10.6% of the total number of triggers and play an important role for the large SNR(>10) events since 51.3% of them are eliminated. The anti-BoB veto is critically important, and its efficiency on EGCtriggers is impressive; 45.6% of the remaining triggers are eliminated, and 97.6% of the remaining loudest ones (SNR
13
Veto name Seismic SSFS B2 PQ 1111Hz all vetoes
dead time 3.75% 2.6% 0.03% 0.07% 16.1% 21.2%
TABLE II: Dead time of the different vetoes that have been found useful. The values are computed for the full C7 dataset.
5 10 15 20 30 40 50 60 7010
−1
100
101
102
103
104
105
SNR
Eve
nts
num
ber
DQ only SEDB+SSFS+B2 SEDB+SSFS+B2+1111Hz SEDB+SSFS+B2+1111Hz+PQ
FIG. 7: SNR distribution of the triggers obtained on the GW strain amplitude channel by EGC after applying all vetoes onthe full C7 data set.
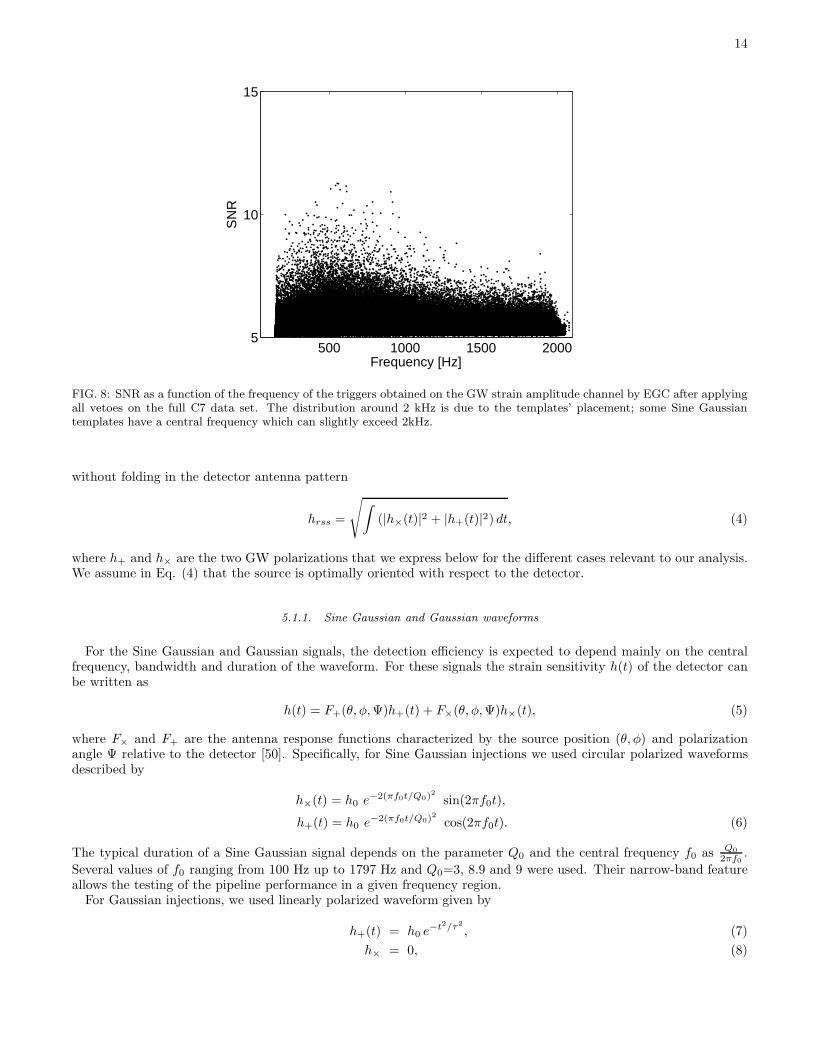
> 10). FIG. 8 shows the SNR of the remaining triggers as a function of their frequency. The application of all thesevetoes allows us to reduce, by a factor 2, the number of events for all EGC triggers above SNR=5. 98.8% of the EGCevents above SNR>10 were eliminated. 21 triggers above SNR=10 remain at the end. The loudest has a SNR of11.26, and although it was not vetoed, it seems to be due to a short period non stationary Virgo noise increase.
5. GW BURST SEARCH ANALYSIS SENSITIVITY
5.1. Generation of the injected waveforms
The GW burst search presented in this paper is intended to be efficient for all waveforms as long as they have energyconcentrated in time and frequency in the range 150-2000 Hz. However, since the Virgo sensitivity is not constant overthis frequency band, the detection efficiency for a given signal strength will depend on the frequency of the signal. Inorder to assess the sensitivity of the detector to dissimilar kinds of signals at different frequencies, we used simulatedwaveforms of diverse types. These were added to the Virgo GW strain amplitude (software injection) and analyzedby the EGC pipeline, similar to how the C7 triggers were produced. These injected signals were randomly distributedin time during the C7 run, assuring a minimal separation of 60 s [47].
The waveforms investigated in this analysis were of two types. One group consisted of ad-hoc waveforms, suchas Sine Gaussians and Gaussians, whose detection efficiency is expected to depend mainly on the central frequency,bandwidth and duration of the waveform. On the other hand, to test the efficiency of this analysis to detect BBHmerger and ring-down GW signals we used waveforms provided by numerical relativity simulations [48]. We also useda signal pertaining to a star core collapse, referred to as A1B2G1, from the supernova simulation catalog available in[49].
The amplitude of the GW associated with an astrophysical source depends on the distance of the source from theEarth. To quantify the strength of a GW burst, we used the root sum squared of the strain amplitude at the Earth
14
500 1000 1500 20005
10
15
Frequency [Hz]
SN
R
FIG. 8: SNR as a function of the frequency of the triggers obtained on the GW strain amplitude channel by EGC after applyingall vetoes on the full C7 data set. The distribution around 2 kHz is due to the templates’ placement; some Sine Gaussiantemplates have a central frequency which can slightly exceed 2kHz.
without folding in the detector antenna pattern
hrss =
√
∫
(|h×(t)|2 + |h+(t)|2) dt, (4)
where h+ and h× are the two GW polarizations that we express below for the different cases relevant to our analysis.We assume in Eq. (4) that the source is optimally oriented with respect to the detector.
5.1.1. Sine Gaussian and Gaussian waveforms
For the Sine Gaussian and Gaussian signals, the detection efficiency is expected to depend mainly on the centralfrequency, bandwidth and duration of the waveform. For these signals the strain sensitivity h(t) of the detector canbe written as
h(t) = F+(θ, φ,Ψ)h+(t) + F×(θ, φ,Ψ)h×(t), (5)
where F× and F+ are the antenna response functions characterized by the source position (θ, φ) and polarizationangle Ψ relative to the detector [50]. Specifically, for Sine Gaussian injections we used circular polarized waveformsdescribed by
h×(t) = h0 e−2(πf0t/Q0)2 sin(2πf0t),
h+(t) = h0 e−2(πf0t/Q0)2 cos(2πf0t). (6)
The typical duration of a Sine Gaussian signal depends on the parameter Q0 and the central frequency f0 as Q0
2πf0
.
Several values of f0 ranging from 100 Hz up to 1797 Hz and Q0=3, 8.9 and 9 were used. Their narrow-band featureallows the testing of the pipeline performance in a given frequency region.
For Gaussian injections, we used linearly polarized waveform given by
h+(t) = h0 e−t2/τ2
, (7)
h× = 0, (8)

15
where τ is the width of the signal. Gaussian waveforms are of interest in the GW burst search because many predictedsignals associated with core collapse GW emission just after the bounce have large peak structures. We chose thevalues of τ to lie between 0.1 and 6 ms. In the case of linearly polarized Gaussians, the angles θ, φ have been randomlychosen. For the circularly polarized Sine Gaussians the randomization has been done over the angles θ, φ and Ψ.
5.1.2. Astrophysical waveforms
For the core collapse signals, we have chosen only one waveform produced by a core collapse 3D simulationconducted with numerical general relativistic techniques in order to estimate, with a physical model, the detectionefficiency for a realistic supernova GW signal. This signal corresponds to the case of a stiff equation of state, asmall initial differential rotation, and a moderate rotational kinetic energy [49]; this leads to a waveform with alarge negative peak followed by a ring-down phase (regular collapse). More up-to-date simulations [51, 52] usinghydrodynamical models with realistic nuclear equations of state tend to confirm the general features of the regularcore collapse. In this present study we are not interested in the details of the waveform. The waveform is linearlypolarized and the simulations have been done similarly to the Gaussian signals.
With the recent breakthroughs in the field of numerical relativity (NR), many groups have been able to simulatethe evolution of binary BHs through three stages: inspiral, merger and ring-down [13, 48, 53]. These waveforms havebeen shown to be consistent with the already existing analytical results using post-Newtonian and BH perturbationtheories [54, 55, 56, 57] for the inspiral and ring-down phases respectively. Furthermore, despite the differences in thenumerical methods employed, gauges chosen, and methods adopted to evolve the systems, qualitatively the resultsfrom all groups show good agreement [58]. All these provide a motivation to use these results from a data analysisperspective. Many such attempts have already been made to search the three phases of the binary black hole evolutionusing NR outcomes [54, 59, 60]. We apply these results from the point of view of a GW burst data analysis and usethe NR waveforms to assess the efficiency of the EGC burst pipeline to detect the BBH merger. For this applicationwe used the numerical relativity (NR) simulations of the non-spinning, equal mass BBHs provided by the GoddardSpace Flight Center group [48]. The injected waveforms were GW strains from the leading l = 2,m = 2 spin-weightedspherical harmonics from the simulations. These waveforms had (approximately) 3 cycles of inspiral, followed bymerger, and then a ring-down.
Unlike the ad-hoc waveforms or the linearly polarized case of SN waveforms, one has to include the effect of theorbital inclination angle ι for the BBH merger waveforms. Eq. (5) should be rewritten in order to include the effectof orbital inclination as
h(t) = F+(θ, φ, ψ)A+(ι)h+(t; ι = 0) + F×(θ, φ, ψ)A×(ι)h×(t; ι = 0), (9)
where F+ and F× are the usual antenna pattern functions, A+ = − 12 (1 + cos2 ι), A× = − cos ι and h+(t; ι = 0) and
h×(t; ι = 0) are the polarizations for the situation of zero inclination angle ι. In this case, the simulated waveformsare generated by randomizing all four angles involved. The NR waveforms for the BBH mergers in the total massrange 5M⊙–150M⊙ were injected into the C7 data in order to calibrate the detection efficiency of the pipeline to thesetypes of mergers. The range of masses chosen for the injection was decided in accordance with the sensitivity of theC7 run.
5.2. Detection efficiency of the GW burst search with the software injections
We applied the same data quality criteria (DQ and vetoes) on the trigger list containing the waveform injections.The detection efficiency is defined as the fraction of injected signals reconstructed with a SNR larger than 11.3corresponding to the loudest event found in the C7 data triggers. As the veto dead time is rather large, the vetoedperiods have not been considered when computing the detection efficiency. FIGs. 9, 10 and 11 show the detectionefficiency as a function of hrss for each family of waveforms. The error on the efficiency data points takes intoaccount only the statistical error. To estimate the values of hrss at efficiency 50% and 90% the four parameters of anasymmetric sigmoid function have been fitted to the data points. The efficiency ǫ(hrss) is defined as follows,
ǫ(hrss) =ǫmax
1 + rmidα(1+β tanh(rmid)), (10)
where ǫmax is the maximal efficiency obtained for strong signals (it should tend to unity). rmid is the ratio hrss/hmidrss
where hmidrss is the strain amplitude at half height i.e., we have ǫ(hmid
rss ) = ǫmax/2. α and β are respectively the slope
16
10−21
10−20
10−19
10−18
10−17
0
0.2
0.4
0.6
0.8
1
hrss
[strain / √Hz]
De
tectio
n e
ffic
ien
cy
Gaussians + supernova A1B2G1
0.1 ms1 ms2.5 ms4 msA1B2G1
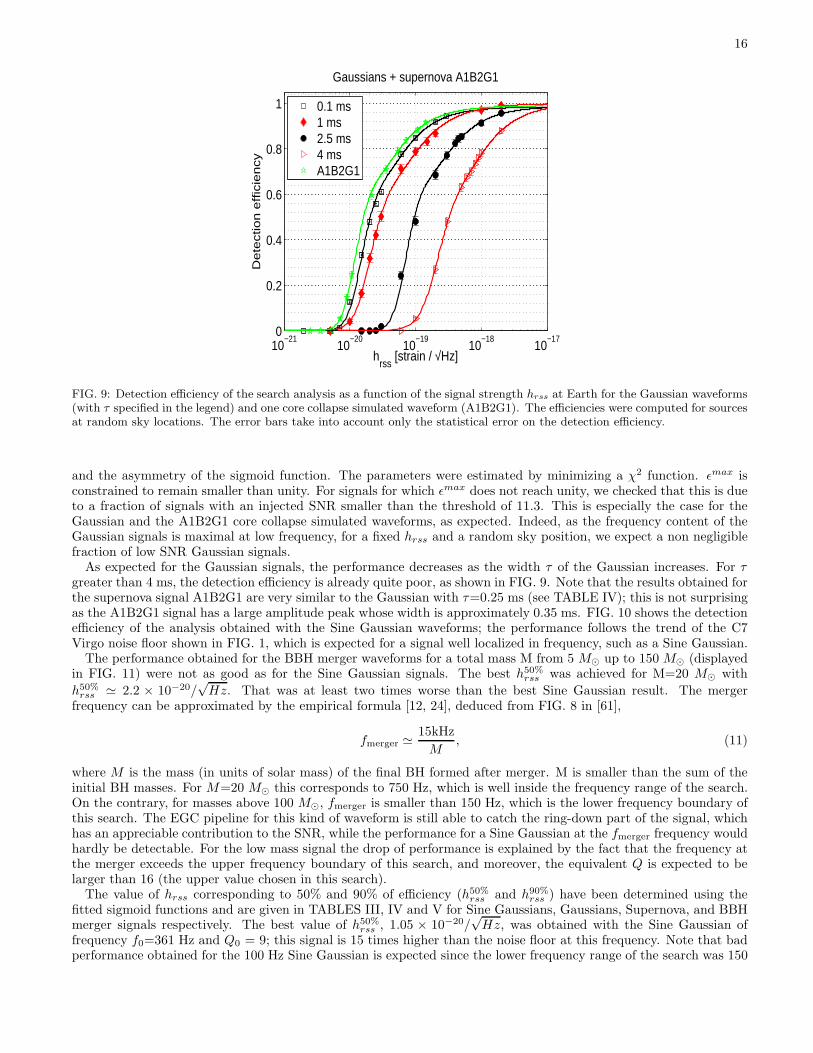
FIG. 9: Detection efficiency of the search analysis as a function of the signal strength hrss at Earth for the Gaussian waveforms(with τ specified in the legend) and one core collapse simulated waveform (A1B2G1). The efficiencies were computed for sourcesat random sky locations. The error bars take into account only the statistical error on the detection efficiency.
and the asymmetry of the sigmoid function. The parameters were estimated by minimizing a χ2 function. ǫmax isconstrained to remain smaller than unity. For signals for which ǫmax does not reach unity, we checked that this is dueto a fraction of signals with an injected SNR smaller than the threshold of 11.3. This is especially the case for theGaussian and the A1B2G1 core collapse simulated waveforms, as expected. Indeed, as the frequency content of theGaussian signals is maximal at low frequency, for a fixed hrss and a random sky position, we expect a non negligiblefraction of low SNR Gaussian signals.
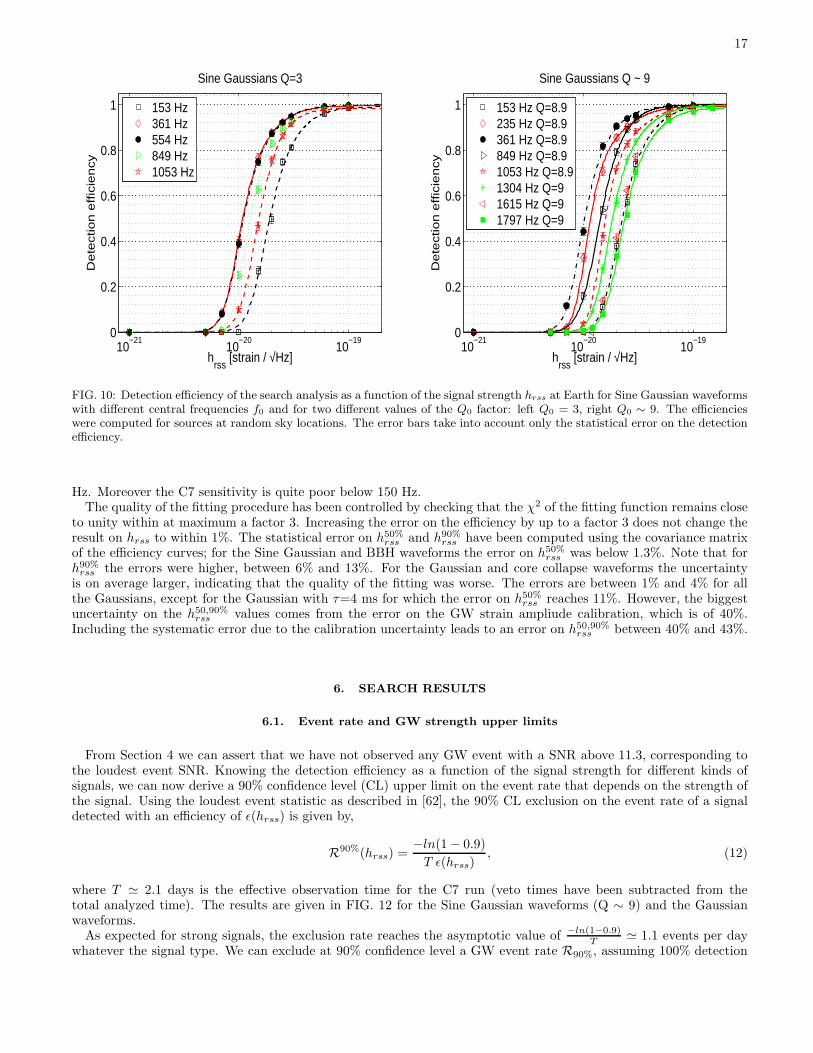
As expected for the Gaussian signals, the performance decreases as the width τ of the Gaussian increases. For τgreater than 4 ms, the detection efficiency is already quite poor, as shown in FIG. 9. Note that the results obtained forthe supernova signal A1B2G1 are very similar to the Gaussian with τ=0.25 ms (see TABLE IV); this is not surprisingas the A1B2G1 signal has a large amplitude peak whose width is approximately 0.35 ms. FIG. 10 shows the detectionefficiency of the analysis obtained with the Sine Gaussian waveforms; the performance follows the trend of the C7Virgo noise floor shown in FIG. 1, which is expected for a signal well localized in frequency, such as a Sine Gaussian.
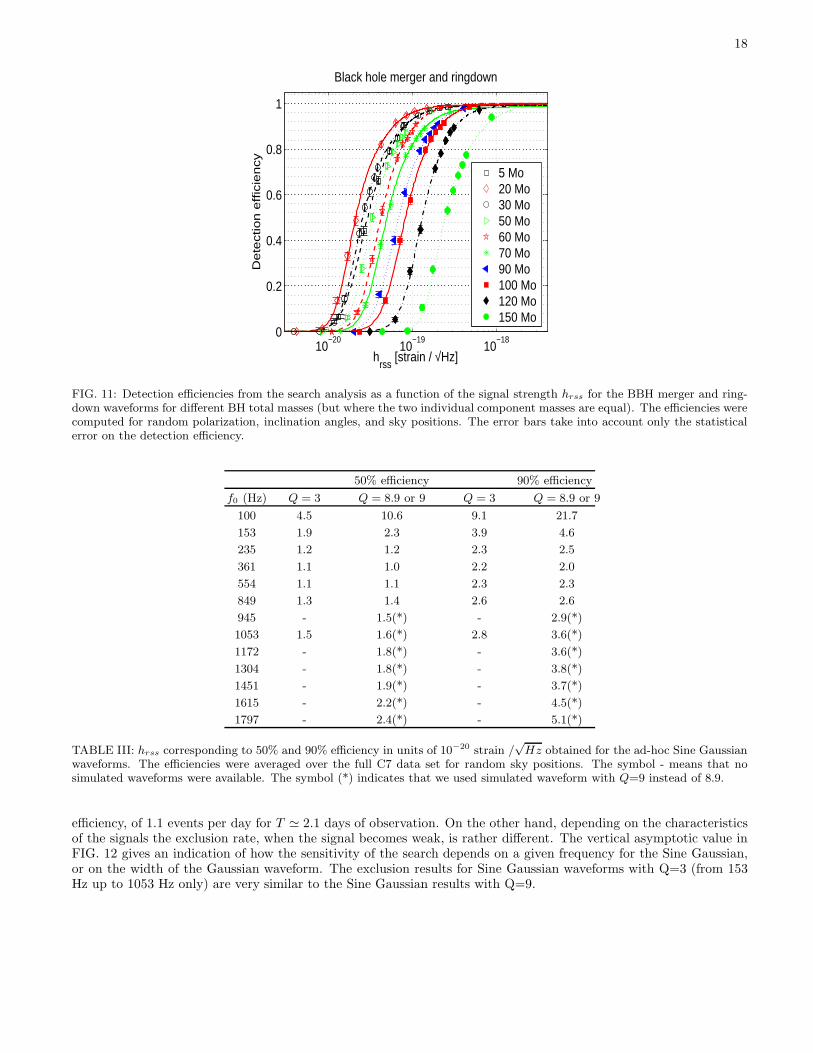
The performance obtained for the BBH merger waveforms for a total mass M from 5 M⊙ up to 150 M⊙ (displayedin FIG. 11) were not as good as for the Sine Gaussian signals. The best h50%
rss was achieved for M=20 M⊙ with
h50%rss ≃ 2.2 × 10⁻²⁰/
√Hz. That was at least two times worse than the best Sine Gaussian result. The merger
frequency can be approximated by the empirical formula [12, 24], deduced from FIG. 8 in [61],
fmerger ≃15kHz
M, (11)
where M is the mass (in units of solar mass) of the final BH formed after merger. M is smaller than the sum of theinitial BH masses. For M=20 M⊙ this corresponds to 750 Hz, which is well inside the frequency range of the search.On the contrary, for masses above 100 M⊙, fmerger is smaller than 150 Hz, which is the lower frequency boundary ofthis search. The EGC pipeline for this kind of waveform is still able to catch the ring-down part of the signal, whichhas an appreciable contribution to the SNR, while the performance for a Sine Gaussian at the fmerger frequency wouldhardly be detectable. For the low mass signal the drop of performance is explained by the fact that the frequency atthe merger exceeds the upper frequency boundary of this search, and moreover, the equivalent Q is expected to belarger than 16 (the upper value chosen in this search).
The value of hrss corresponding to 50% and 90% of efficiency (h50%rss and h90%
rss ) have been determined using thefitted sigmoid functions and are given in TABLES III, IV and V for Sine Gaussians, Gaussians, Supernova, and BBHmerger signals respectively. The best value of h50%
rss , 1.05 × 10⁻²⁰/√Hz, was obtained with the Sine Gaussian of
frequency f0=361 Hz and Q0 = 9; this signal is 15 times higher than the noise floor at this frequency. Note that badperformance obtained for the 100 Hz Sine Gaussian is expected since the lower frequency range of the search was 150
17
10−21
10−20
10−19
0
0.2
0.4
0.6
0.8
1
hrss
[strain / √Hz]
De
tectio
n e
ffic
ien
cy
Sine Gaussians Q=3
153 Hz361 Hz554 Hz849 Hz1053 Hz
10−21
10−20
10−19
0
0.2
0.4
0.6
0.8
1
hrss
[strain / √Hz]
De
tectio
n e
ffic
ien
cy
Sine Gaussians Q ~ 9
153 Hz Q=8.9235 Hz Q=8.9361 Hz Q=8.9849 Hz Q=8.91053 Hz Q=8.91304 Hz Q=91615 Hz Q=91797 Hz Q=9
FIG. 10: Detection efficiency of the search analysis as a function of the signal strength hrss at Earth for Sine Gaussian waveformswith different central frequencies f0 and for two different values of the Q0 factor: left Q0 = 3, right Q0 ∼ 9. The efficiencieswere computed for sources at random sky locations. The error bars take into account only the statistical error on the detectionefficiency.
Hz. Moreover the C7 sensitivity is quite poor below 150 Hz.The quality of the fitting procedure has been controlled by checking that the χ2 of the fitting function remains close
to unity within at maximum a factor 3. Increasing the error on the efficiency by up to a factor 3 does not change theresult on hrss to within 1%. The statistical error on h50%
rss and h90%rss have been computed using the covariance matrix
of the efficiency curves; for the Sine Gaussian and BBH waveforms the error on h50%rss was below 1.3%. Note that for
h90%rss the errors were higher, between 6% and 13%. For the Gaussian and core collapse waveforms the uncertainty
is on average larger, indicating that the quality of the fitting was worse. The errors are between 1% and 4% for allthe Gaussians, except for the Gaussian with τ=4 ms for which the error on h50%
rss reaches 11%. However, the biggestuncertainty on the h50,90%
rss values comes from the error on the GW strain ampliude calibration, which is of 40%.Including the systematic error due to the calibration uncertainty leads to an error on h50,90%
rss between 40% and 43%.
6. SEARCH RESULTS
6.1. Event rate and GW strength upper limits
From Section 4 we can assert that we have not observed any GW event with a SNR above 11.3, corresponding tothe loudest event SNR. Knowing the detection efficiency as a function of the signal strength for different kinds ofsignals, we can now derive a 90% confidence level (CL) upper limit on the event rate that depends on the strength ofthe signal. Using the loudest event statistic as described in [62], the 90% CL exclusion on the event rate of a signaldetected with an efficiency of ǫ(hrss) is given by,
R90%(hrss) =−ln(1 − 0.9)
T ǫ(hrss), (12)
where T ≃ 2.1 days is the effective observation time for the C7 run (veto times have been subtracted from thetotal analyzed time). The results are given in FIG. 12 for the Sine Gaussian waveforms (Q ∼ 9) and the Gaussianwaveforms.
As expected for strong signals, the exclusion rate reaches the asymptotic value of −ln(1−0.9)T ≃ 1.1 events per day
whatever the signal type. We can exclude at 90% confidence level a GW event rate R90%, assuming 100% detection
18
10−20
10−19
10−18
0
0.2
0.4
0.6
0.8
1
hrss
[strain / √Hz]
De
tectio
n e
ffic
ien
cy
Black hole merger and ringdown
5 Mo20 Mo30 Mo50 Mo60 Mo70 Mo90 Mo100 Mo120 Mo150 Mo
FIG. 11: Detection efficiencies from the search analysis as a function of the signal strength hrss for the BBH merger and ring-down waveforms for different BH total masses (but where the two individual component masses are equal). The efficiencies werecomputed for random polarization, inclination angles, and sky positions. The error bars take into account only the statisticalerror on the detection efficiency.
50% efficiency 90% efficiency
f0 (Hz) Q = 3 Q = 8.9 or 9 Q = 3 Q = 8.9 or 9
100 4.5 10.6 9.1 21.7
153 1.9 2.3 3.9 4.6
235 1.2 1.2 2.3 2.5
361 1.1 1.0 2.2 2.0
554 1.1 1.1 2.3 2.3
849 1.3 1.4 2.6 2.6
945 - 1.5(*) - 2.9(*)
1053 1.5 1.6(*) 2.8 3.6(*)
1172 - 1.8(*) - 3.6(*)
1304 - 1.8(*) - 3.8(*)
1451 - 1.9(*) - 3.7(*)
1615 - 2.2(*) - 4.5(*)
1797 - 2.4(*) - 5.1(*)
TABLE III: hrss corresponding to 50% and 90% efficiency in units of 10−20 strain /√
Hz obtained for the ad-hoc Sine Gaussianwaveforms. The efficiencies were averaged over the full C7 data set for random sky positions. The symbol - means that nosimulated waveforms were available. The symbol (*) indicates that we used simulated waveform with Q=9 instead of 8.9.
efficiency, of 1.1 events per day for T ≃ 2.1 days of observation. On the other hand, depending on the characteristicsof the signals the exclusion rate, when the signal becomes weak, is rather different. The vertical asymptotic value inFIG. 12 gives an indication of how the sensitivity of the search depends on a given frequency for the Sine Gaussian,or on the width of the Gaussian waveform. The exclusion results for Sine Gaussian waveforms with Q=3 (from 153Hz up to 1053 Hz only) are very similar to the Sine Gaussian results with Q=9.
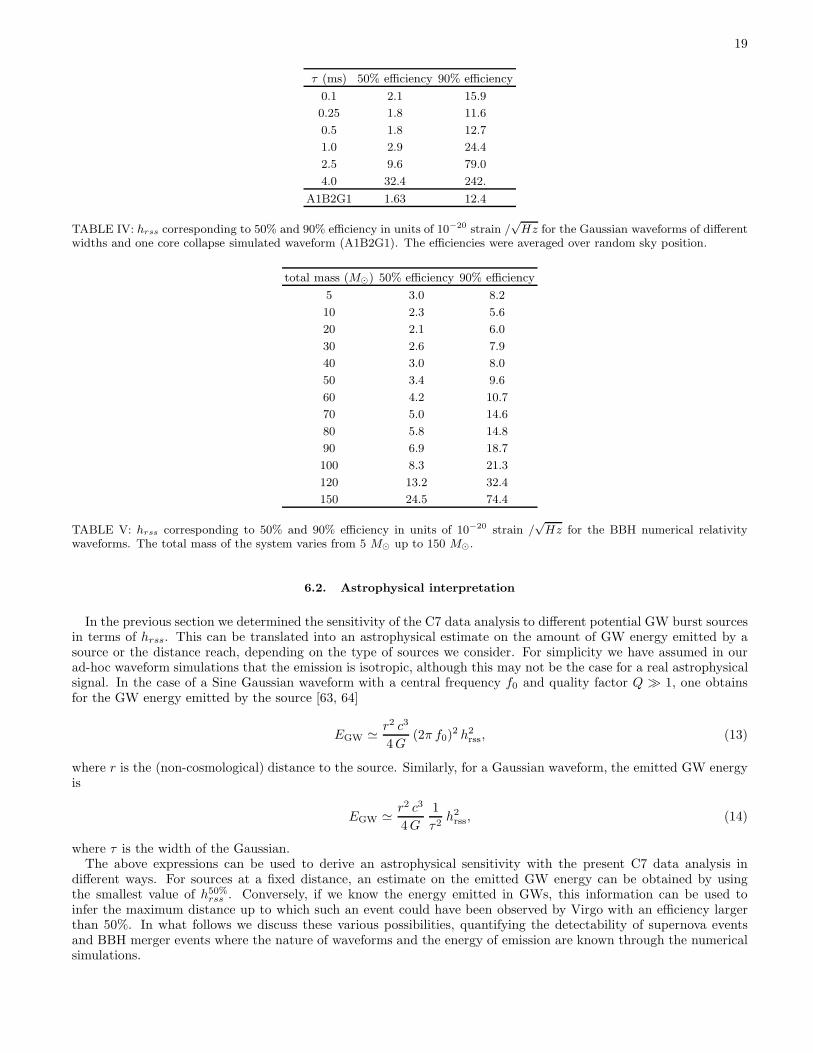
19
τ (ms) 50% efficiency 90% efficiency
0.1 2.1 15.9
0.25 1.8 11.6
0.5 1.8 12.7
1.0 2.9 24.4
2.5 9.6 79.0
4.0 32.4 242.
A1B2G1 1.63 12.4
TABLE IV: hrss corresponding to 50% and 90% efficiency in units of 10−20 strain /√
Hz for the Gaussian waveforms of differentwidths and one core collapse simulated waveform (A1B2G1). The efficiencies were averaged over random sky position.
total mass (M⊙) 50% efficiency 90% efficiency
5 3.0 8.2
10 2.3 5.6
20 2.1 6.0
30 2.6 7.9
40 3.0 8.0
50 3.4 9.6
60 4.2 10.7
70 5.0 14.6
80 5.8 14.8
90 6.9 18.7
100 8.3 21.3
120 13.2 32.4
150 24.5 74.4
TABLE V: hrss corresponding to 50% and 90% efficiency in units of 10−20 strain /√
Hz for the BBH numerical relativitywaveforms. The total mass of the system varies from 5 M⊙ up to 150 M⊙.
6.2. Astrophysical interpretation
In the previous section we determined the sensitivity of the C7 data analysis to different potential GW burst sourcesin terms of hrss. This can be translated into an astrophysical estimate on the amount of GW energy emitted by asource or the distance reach, depending on the type of sources we consider. For simplicity we have assumed in ourad-hoc waveform simulations that the emission is isotropic, although this may not be the case for a real astrophysicalsignal. In the case of a Sine Gaussian waveform with a central frequency f0 and quality factor Q ≫ 1, one obtainsfor the GW energy emitted by the source [63, 64]
EGW ≃ r2 c3
4G(2π f0)
2 h2rss, (13)
where r is the (non-cosmological) distance to the source. Similarly, for a Gaussian waveform, the emitted GW energyis
EGW ≃ r2 c3
4G
1
τ2h2
rss, (14)
where τ is the width of the Gaussian.The above expressions can be used to derive an astrophysical sensitivity with the present C7 data analysis in
different ways. For sources at a fixed distance, an estimate on the emitted GW energy can be obtained by usingthe smallest value of h50%
rss . Conversely, if we know the energy emitted in GWs, this information can be used toinfer the maximum distance up to which such an event could have been observed by Virgo with an efficiency largerthan 50%. In what follows we discuss these various possibilities, quantifying the detectability of supernova eventsand BBH merger events where the nature of waveforms and the energy of emission are known through the numericalsimulations.
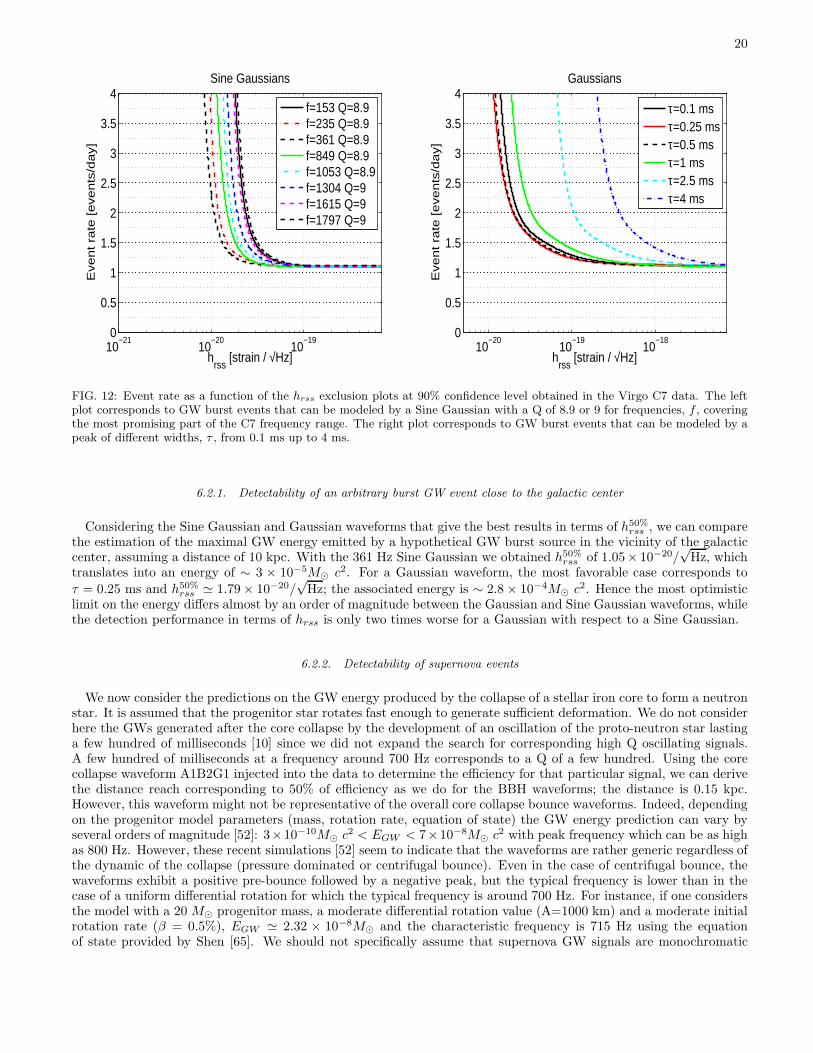
20
10−21
10−20
10−19
0
0.5
1
1.5
2
2.5
3
3.5
4
hrss
[strain / √Hz]
Eve
nt ra
te [e
ve
nts
/da
y]
Sine Gaussians
f=153 Q=8.9f=235 Q=8.9f=361 Q=8.9f=849 Q=8.9f=1053 Q=8.9f=1304 Q=9f=1615 Q=9f=1797 Q=9
10−20
10−19
10−18
0
0.5
1
1.5
2
2.5
3
3.5
4
hrss
[strain / √Hz]
Eve
nt ra
te [e
ve
nts
/da
y]
Gaussians
τ=0.1 msτ=0.25 msτ=0.5 msτ=1 msτ=2.5 msτ=4 ms
FIG. 12: Event rate as a function of the hrss exclusion plots at 90% confidence level obtained in the Virgo C7 data. The leftplot corresponds to GW burst events that can be modeled by a Sine Gaussian with a Q of 8.9 or 9 for frequencies, f , coveringthe most promising part of the C7 frequency range. The right plot corresponds to GW burst events that can be modeled by apeak of different widths, τ , from 0.1 ms up to 4 ms.
6.2.1. Detectability of an arbitrary burst GW event close to the galactic center
Considering the Sine Gaussian and Gaussian waveforms that give the best results in terms of h50%rss , we can compare
the estimation of the maximal GW energy emitted by a hypothetical GW burst source in the vicinity of the galacticcenter, assuming a distance of 10 kpc. With the 361 Hz Sine Gaussian we obtained h50%
rss of 1.05× 10⁻²⁰/√
Hz, whichtranslates into an energy of ∼ 3 × 10⁻⁵M⊙ c2. For a Gaussian waveform, the most favorable case corresponds to
τ = 0.25 ms and h50%rss ≃ 1.79 × 10⁻²⁰/
√Hz; the associated energy is ∼ 2.8 × 10⁻⁴M⊙ c2. Hence the most optimistic
limit on the energy differs almost by an order of magnitude between the Gaussian and Sine Gaussian waveforms, whilethe detection performance in terms of hrss is only two times worse for a Gaussian with respect to a Sine Gaussian.
6.2.2. Detectability of supernova events
We now consider the predictions on the GW energy produced by the collapse of a stellar iron core to form a neutronstar. It is assumed that the progenitor star rotates fast enough to generate sufficient deformation. We do not considerhere the GWs generated after the core collapse by the development of an oscillation of the proto-neutron star lastinga few hundred of milliseconds [10] since we did not expand the search for corresponding high Q oscillating signals.A few hundred of milliseconds at a frequency around 700 Hz corresponds to a Q of a few hundred. Using the corecollapse waveform A1B2G1 injected into the data to determine the efficiency for that particular signal, we can derivethe distance reach corresponding to 50% of efficiency as we do for the BBH waveforms; the distance is 0.15 kpc.However, this waveform might not be representative of the overall core collapse bounce waveforms. Indeed, dependingon the progenitor model parameters (mass, rotation rate, equation of state) the GW energy prediction can vary byseveral orders of magnitude [52]: 3×10⁻¹⁰M⊙ c2 < EGW < 7×10⁻⁸M⊙ c2 with peak frequency which can be as highas 800 Hz. However, these recent simulations [52] seem to indicate that the waveforms are rather generic regardless ofthe dynamic of the collapse (pressure dominated or centrifugal bounce). Even in the case of centrifugal bounce, thewaveforms exhibit a positive pre-bounce followed by a negative peak, but the typical frequency is lower than in thecase of a uniform differential rotation for which the typical frequency is around 700 Hz. For instance, if one considersthe model with a 20 M⊙ progenitor mass, a moderate differential rotation value (A=1000 km) and a moderate initialrotation rate (β = 0.5%), EGW ≃ 2.32 × 10⁻⁸M⊙ and the characteristic frequency is 715 Hz using the equationof state provided by Shen [65]. We should not specifically assume that supernova GW signals are monochromatic

21
waveforms like Sine Gaussians. They do not look like Gaussians either (they are more localized in frequency thanGaussian). Taking the h50%
rss value for the τ = 0.5 ms Gaussian (that roughly corresponds to the width of the peakof the considered waveform), we obtain a maximal distance range of 0.18 kpc. Using the Sine Gaussian expression,and using the h50%
rss for a central frequency 715 Hz we obtain a distance of 0.12 kpc. For the A1B2G1 waveformused in this paper, and considering a radiated energy of EGW ≃ 2.13 × 10⁻⁸M⊙c
2 computed using Eq. (5) of [7],we obtain a distance of 0.12 kpc whatever the assumption made on the waveform (Gaussian of τ = .35 ms or a SineGaussian of f0=650 Hz). These numbers indicate the order of magnitude of the maximal detection distance we havereached during Virgo’s C7 run. This achieved distance is somewhat small, and we expect to gain at least one orderof magnitude with Virgo data acquired during more recent observation runs.
6.2.3. Distance reach for binary black hole mergers
From the detection efficiency results obtained with the BBH waveforms in Section 5.2, one can derive a distanceat which EGC is able to detect a signal with 50% or 90% efficiency, respectively d50% and d90%. These values havebeen extracted from the results of the fits of the detection efficiency as a function of the distances for which the BBHsources have been simulated. An asymmetric sigmoid function has been used and the errors on d50% and d90% havebeen estimated as they have for h50%
rss and h90%rss . FIG. 13 shows the d50% and d90% detection distances as a function
of the total mass of the system. d90% gives an indication of the average distance range up to which this search couldhave been able to detect a BBH source. With the present choice of threshold on the SNR, our search is sensitive toBBH mergers in the mass range 20 M⊙-150 M⊙ up to a distance of 1-3 Mpc (0.5-1Mpc) for 50% (90%) detectionefficiency. The distance reach is maximum for a BBH of total mass 80-90 M⊙. In the C7 sensitivity band, this massrange corresponds to signals where the merger part is dominant. Besides, for a mass higher than 100 M⊙, the mergerfrequency (given by Eq. (11)) is below the frequency lower bound studied in the analysis (150 Hz). This fact adds tothe degraded C7 run sensitivity below 150 Hz, and explains why the distance reach for the high mass waveforms isdecreasing.
0 50 100 1500
0.5
1
1.5
2
2.5
3
3.5
Black hole binary total mass [Mo]
Dis
tan
ce
[M
pc]
NR ε = 50%NR ε = 90%SG ε = 90%
0 50 100 1500
0.5
1
1.5
2
2.5
3
3.5
Black hole binary total mass [Mo]
Dis
tan
ce
[M
pc]
NR ε = 50%NR ε = 90%SG ε = 90%
300 150 100Merger frequency [Hz]
FIG. 13: Detection distance of the black hole binary source with efficiency of 90% and 50% as a function of the total mass ofthe system. The curves with circles and squares have been obtained by estimating the EGC pipeline detection efficiency tonumerical relativity black hole binary waveforms. The curve with diamonds was derived from the results obtained with SineGaussian waveforms assuming that the waveform when the two black holes merge resembles a Sine Gaussian. The error barstake into account only the statistical error on the detection efficiency.
This bound on the distance can, in principle, be translated into an upper limit on the event rate, assuming aGaussian distribution of BBH masses around 80 M⊙. This analysis would require combining a model for the galaxies,their blue light luminosity distribution as a function of distance and mass, along with the antenna pattern of thedetector; this has been proposed in [66] for the LIGO detectors. But given the limited volume of the universe that
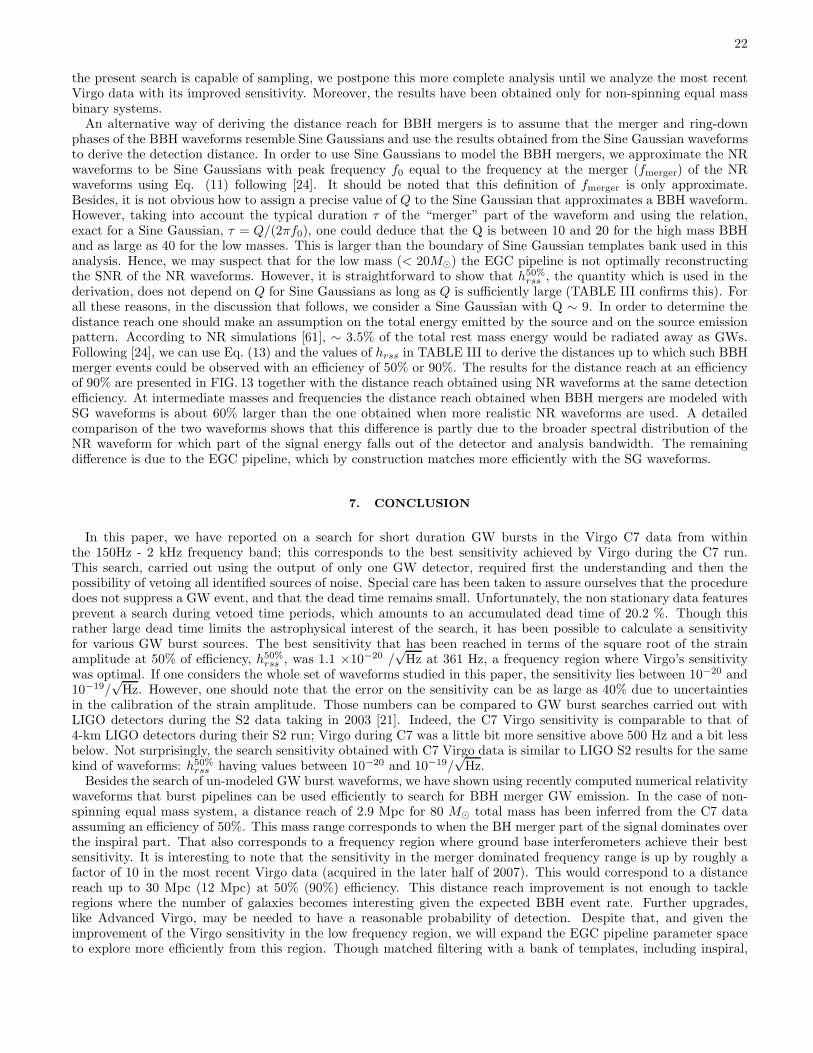
22
the present search is capable of sampling, we postpone this more complete analysis until we analyze the most recentVirgo data with its improved sensitivity. Moreover, the results have been obtained only for non-spinning equal massbinary systems.
An alternative way of deriving the distance reach for BBH mergers is to assume that the merger and ring-downphases of the BBH waveforms resemble Sine Gaussians and use the results obtained from the Sine Gaussian waveformsto derive the detection distance. In order to use Sine Gaussians to model the BBH mergers, we approximate the NRwaveforms to be Sine Gaussians with peak frequency f0 equal to the frequency at the merger (fmerger) of the NRwaveforms using Eq. (11) following [24]. It should be noted that this definition of fmerger is only approximate.Besides, it is not obvious how to assign a precise value of Q to the Sine Gaussian that approximates a BBH waveform.However, taking into account the typical duration τ of the “merger” part of the waveform and using the relation,exact for a Sine Gaussian, τ = Q/(2πf0), one could deduce that the Q is between 10 and 20 for the high mass BBHand as large as 40 for the low masses. This is larger than the boundary of Sine Gaussian templates bank used in thisanalysis. Hence, we may suspect that for the low mass (< 20M⊙) the EGC pipeline is not optimally reconstructingthe SNR of the NR waveforms. However, it is straightforward to show that h50%
rss , the quantity which is used in thederivation, does not depend on Q for Sine Gaussians as long as Q is sufficiently large (TABLE III confirms this). Forall these reasons, in the discussion that follows, we consider a Sine Gaussian with Q ∼ 9. In order to determine thedistance reach one should make an assumption on the total energy emitted by the source and on the source emissionpattern. According to NR simulations [61], ∼ 3.5% of the total rest mass energy would be radiated away as GWs.Following [24], we can use Eq. (13) and the values of hrss in TABLE III to derive the distances up to which such BBHmerger events could be observed with an efficiency of 50% or 90%. The results for the distance reach at an efficiencyof 90% are presented in FIG. 13 together with the distance reach obtained using NR waveforms at the same detectionefficiency. At intermediate masses and frequencies the distance reach obtained when BBH mergers are modeled withSG waveforms is about 60% larger than the one obtained when more realistic NR waveforms are used. A detailedcomparison of the two waveforms shows that this difference is partly due to the broader spectral distribution of theNR waveform for which part of the signal energy falls out of the detector and analysis bandwidth. The remainingdifference is due to the EGC pipeline, which by construction matches more efficiently with the SG waveforms.
7. CONCLUSION
In this paper, we have reported on a search for short duration GW bursts in the Virgo C7 data from withinthe 150Hz - 2 kHz frequency band; this corresponds to the best sensitivity achieved by Virgo during the C7 run.This search, carried out using the output of only one GW detector, required first the understanding and then thepossibility of vetoing all identified sources of noise. Special care has been taken to assure ourselves that the proceduredoes not suppress a GW event, and that the dead time remains small. Unfortunately, the non stationary data featuresprevent a search during vetoed time periods, which amounts to an accumulated dead time of 20.2 %. Though thisrather large dead time limits the astrophysical interest of the search, it has been possible to calculate a sensitivityfor various GW burst sources. The best sensitivity that has been reached in terms of the square root of the strainamplitude at 50% of efficiency, h50%
rss , was 1.1 ×10⁻²⁰ /√
Hz at 361 Hz, a frequency region where Virgo’s sensitivitywas optimal. If one considers the whole set of waveforms studied in this paper, the sensitivity lies between 10−20 and10−19/
√Hz. However, one should note that the error on the sensitivity can be as large as 40% due to uncertainties
in the calibration of the strain amplitude. Those numbers can be compared to GW burst searches carried out withLIGO detectors during the S2 data taking in 2003 [21]. Indeed, the C7 Virgo sensitivity is comparable to that of4-km LIGO detectors during their S2 run; Virgo during C7 was a little bit more sensitive above 500 Hz and a bit lessbelow. Not surprisingly, the search sensitivity obtained with C7 Virgo data is similar to LIGO S2 results for the samekind of waveforms: h50%
rss having values between 10−20 and 10−19/√
Hz.Besides the search of un-modeled GW burst waveforms, we have shown using recently computed numerical relativity
waveforms that burst pipelines can be used efficiently to search for BBH merger GW emission. In the case of non-spinning equal mass system, a distance reach of 2.9 Mpc for 80 M⊙ total mass has been inferred from the C7 dataassuming an efficiency of 50%. This mass range corresponds to when the BH merger part of the signal dominates overthe inspiral part. That also corresponds to a frequency region where ground base interferometers achieve their bestsensitivity. It is interesting to note that the sensitivity in the merger dominated frequency range is up by roughly afactor of 10 in the most recent Virgo data (acquired in the later half of 2007). This would correspond to a distancereach up to 30 Mpc (12 Mpc) at 50% (90%) efficiency. This distance reach improvement is not enough to tackleregions where the number of galaxies becomes interesting given the expected BBH event rate. Further upgrades,like Advanced Virgo, may be needed to have a reasonable probability of detection. Despite that, and given theimprovement of the Virgo sensitivity in the low frequency region, we will expand the EGC pipeline parameter spaceto explore more efficiently from this region. Though matched filtering with a bank of templates, including inspiral,
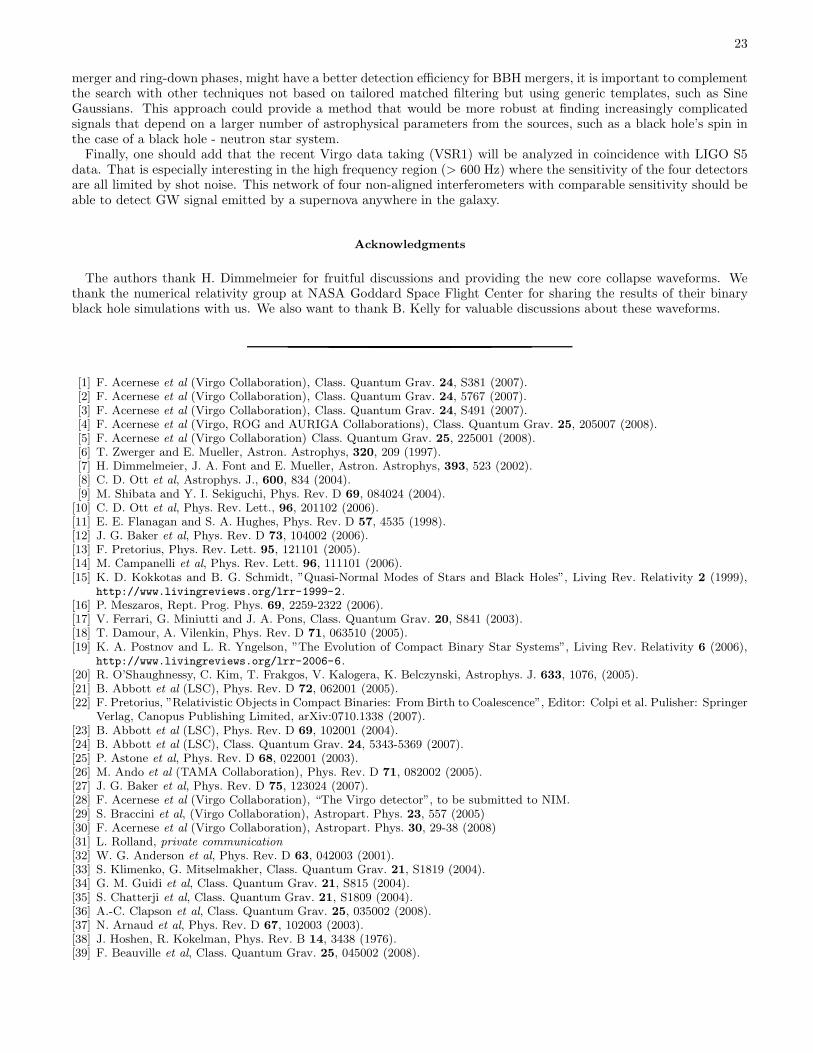
23
merger and ring-down phases, might have a better detection efficiency for BBH mergers, it is important to complementthe search with other techniques not based on tailored matched filtering but using generic templates, such as SineGaussians. This approach could provide a method that would be more robust at finding increasingly complicatedsignals that depend on a larger number of astrophysical parameters from the sources, such as a black hole’s spin inthe case of a black hole - neutron star system.
Finally, one should add that the recent Virgo data taking (VSR1) will be analyzed in coincidence with LIGO S5data. That is especially interesting in the high frequency region (> 600 Hz) where the sensitivity of the four detectorsare all limited by shot noise. This network of four non-aligned interferometers with comparable sensitivity should beable to detect GW signal emitted by a supernova anywhere in the galaxy.
Acknowledgments
The authors thank H. Dimmelmeier for fruitful discussions and providing the new core collapse waveforms. Wethank the numerical relativity group at NASA Goddard Space Flight Center for sharing the results of their binaryblack hole simulations with us. We also want to thank B. Kelly for valuable discussions about these waveforms.
[1] F. Acernese et al (Virgo Collaboration), Class. Quantum Grav. 24, S381 (2007).[2] F. Acernese et al (Virgo Collaboration), Class. Quantum Grav. 24, 5767 (2007).[3] F. Acernese et al (Virgo Collaboration), Class. Quantum Grav. 24, S491 (2007).[4] F. Acernese et al (Virgo, ROG and AURIGA Collaborations), Class. Quantum Grav. 25, 205007 (2008).[5] F. Acernese et al (Virgo Collaboration) Class. Quantum Grav. 25, 225001 (2008).[6] T. Zwerger and E. Mueller, Astron. Astrophys, 320, 209 (1997).[7] H. Dimmelmeier, J. A. Font and E. Mueller, Astron. Astrophys, 393, 523 (2002).[8] C. D. Ott et al, Astrophys. J., 600, 834 (2004).[9] M. Shibata and Y. I. Sekiguchi, Phys. Rev. D 69, 084024 (2004).
[10] C. D. Ott et al, Phys. Rev. Lett., 96, 201102 (2006).[11] E. E. Flanagan and S. A. Hughes, Phys. Rev. D 57, 4535 (1998).[12] J. G. Baker et al, Phys. Rev. D 73, 104002 (2006).[13] F. Pretorius, Phys. Rev. Lett. 95, 121101 (2005).[14] M. Campanelli et al, Phys. Rev. Lett. 96, 111101 (2006).[15] K. D. Kokkotas and B. G. Schmidt, ”Quasi-Normal Modes of Stars and Black Holes”, Living Rev. Relativity 2 (1999),
http://www.livingreviews.org/lrr-1999-2.[16] P. Meszaros, Rept. Prog. Phys. 69, 2259-2322 (2006).[17] V. Ferrari, G. Miniutti and J. A. Pons, Class. Quantum Grav. 20, S841 (2003).[18] T. Damour, A. Vilenkin, Phys. Rev. D 71, 063510 (2005).[19] K. A. Postnov and L. R. Yngelson, ”The Evolution of Compact Binary Star Systems”, Living Rev. Relativity 6 (2006),
http://www.livingreviews.org/lrr-2006-6.[20] R. O’Shaughnessy, C. Kim, T. Frakgos, V. Kalogera, K. Belczynski, Astrophys. J. 633, 1076, (2005).[21] B. Abbott et al (LSC), Phys. Rev. D 72, 062001 (2005).[22] F. Pretorius, ”Relativistic Objects in Compact Binaries: From Birth to Coalescence”, Editor: Colpi et al. Pulisher: Springer
Verlag, Canopus Publishing Limited, arXiv:0710.1338 (2007).[23] B. Abbott et al (LSC), Phys. Rev. D 69, 102001 (2004).[24] B. Abbott et al (LSC), Class. Quantum Grav. 24, 5343-5369 (2007).[25] P. Astone et al, Phys. Rev. D 68, 022001 (2003).[26] M. Ando et al (TAMA Collaboration), Phys. Rev. D 71, 082002 (2005).[27] J. G. Baker et al, Phys. Rev. D 75, 123024 (2007).[28] F. Acernese et al (Virgo Collaboration), “The Virgo detector”, to be submitted to NIM.[29] S. Braccini et al, (Virgo Collaboration), Astropart. Phys. 23, 557 (2005)[30] F. Acernese et al (Virgo Collaboration), Astropart. Phys. 30, 29-38 (2008)[31] L. Rolland, private communication[32] W. G. Anderson et al, Phys. Rev. D 63, 042003 (2001).[33] S. Klimenko, G. Mitselmakher, Class. Quantum Grav. 21, S1819 (2004).[34] G. M. Guidi et al, Class. Quantum Grav. 21, S815 (2004).[35] S. Chatterji et al, Class. Quantum Grav. 21, S1809 (2004).[36] A.-C. Clapson et al, Class. Quantum Grav. 25, 035002 (2008).[37] N. Arnaud et al, Phys. Rev. D 67, 102003 (2003).[38] J. Hoshen, R. Kokelman, Phys. Rev. B 14, 3438 (1976).[39] F. Beauville et al, Class. Quantum Grav. 25, 045002 (2008).
24
[40] N. Arnaud et al, Phys. Rev. D 67, 062004 (2003).[41] F. Acernese et al (Virgo Collaboration), Class. Quantum Grav. 21, S425 (2004).[42] R. Flaminio, R. Gouaty, E. Tournefier, Virgo technical document, VIR-NOT-LAP-1390-313.[43] N. Christensen, P. Shawhan, G. Gonzalez (for the LIGO Scientific Collaboration), Class. Quantum Grav. 21, S1747 (2004).[44] K. Koetter, I. Heng, M. Hewitson, K. Strain, G. Woan and H. Ward, Class. Quantum Grav. 20 S895-S902 (2003).[45] C. R. Hanna (for the LSC Collaboration), Class. Quantum Grav. 23 S17-S22 (2006).[46] N. Christensen (for the LSC Collaboration), Class. Quantum Grav. 22 S1059-S1068 (2005).[47] B. Caron et al, Astropart. Phys. 10, 369 (1999).[48] J. G. Baker et al, Phys. Rev. D 73, 104002 (2006).[49] http://www.mpa-garching.mpg.de/rel_hydro/
[50] N. Christensen, Phys. Rev. D, 46, 5250 (1992).[51] H. Dimmelmeier et al, Phys. Rev. Lett. 98, 251101 (2007).[52] H. Dimmelmeier et al, Phys. Rev. D 78, 064056 (2008).[53] B. Bruegmann et al, Phys. Rev. Lett. 92, 211101 (2004).[54] A. Buonanno, G. B. Cook, F. Pretorius, Phys. Rev. D 75, 124018 (2007).[55] J. G. Baker et al, Phys. Rev. Lett. 99, 181101 (2007).[56] E. Berti et al, Phys. Rev. D 76, 064034 (2007).[57] M. Hannam et al, Phys. Rev. D 77, 044020, (2008).[58] J. G. Baker et al, Class. Quantum Grav. 24, S25-S31 (2007).[59] P. Ajith et al, Class. Quantum Grav. 24 S689-S700, (2007).[60] Y. Pan et al, Phys. Rev. D 77, 024014, (2008).[61] J. G. Baker et al, Phys. Rev. D 73, 104002 (2006).[62] P. R. Brady, J. D. E. Creighton, and A. G. Wiseman, Class. Quant. Grav. 21, S1775 (2004).[63] S. L. Shapiro and S. A. Teukolsky, “BlackHoles, White Dwarfs and Neutron Stars”, John Wiley a& Sons, New-York (1983).[64] K. Riles, LIGO technical document, LIGO-T040055-00-Z.[65] H. Shen et al, Prog. Theor. Phys 100, 1013 (1998).[66] R. K. Kopparapu et al, Astrophys. J. 675, 1459, (2008).[67] Template based searches for binary black hole sources using different waveforms which capture the different phases, in-
cluding merger and ringdown, are now applied to analyze the LIGO and Virgo data.[68] The significance = N−n√
nwhere N is the number of coincidences and n is the estimation of accidental events assuming
Poisson statistics.
Related Documents