4 2 5 1 0011 0010 1010 1101 0001 0100 1011 Graphs How to set up successful graphs

Welcome message from author
This document is posted to help you gain knowledge. Please leave a comment to let me know what you think about it! Share it to your friends and learn new things together.
Transcript
42510011 0010 1010 1101 0001 0100 1011
Graphs
How to set up successful graphs
4251
0011 0010 1010 1101 0001 0100 1011
How to set up your graph!
4251
0011 0010 1010 1101 0001 0100 1011
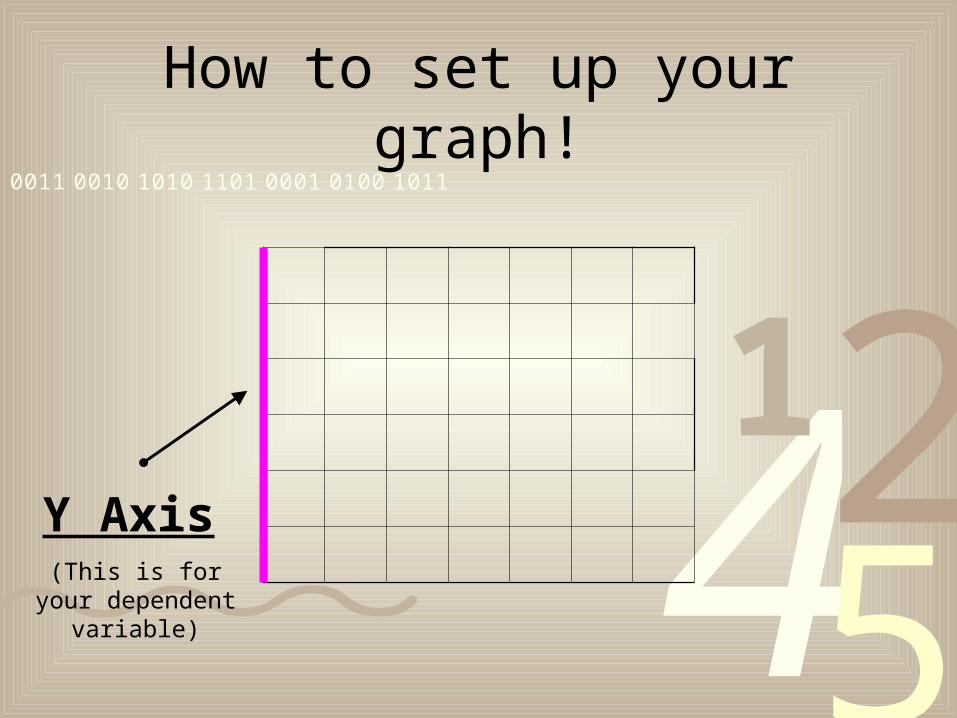
How to set up your graph!
Y Axis
(This is for your dependent variable)
4251
0011 0010 1010 1101 0001 0100 1011
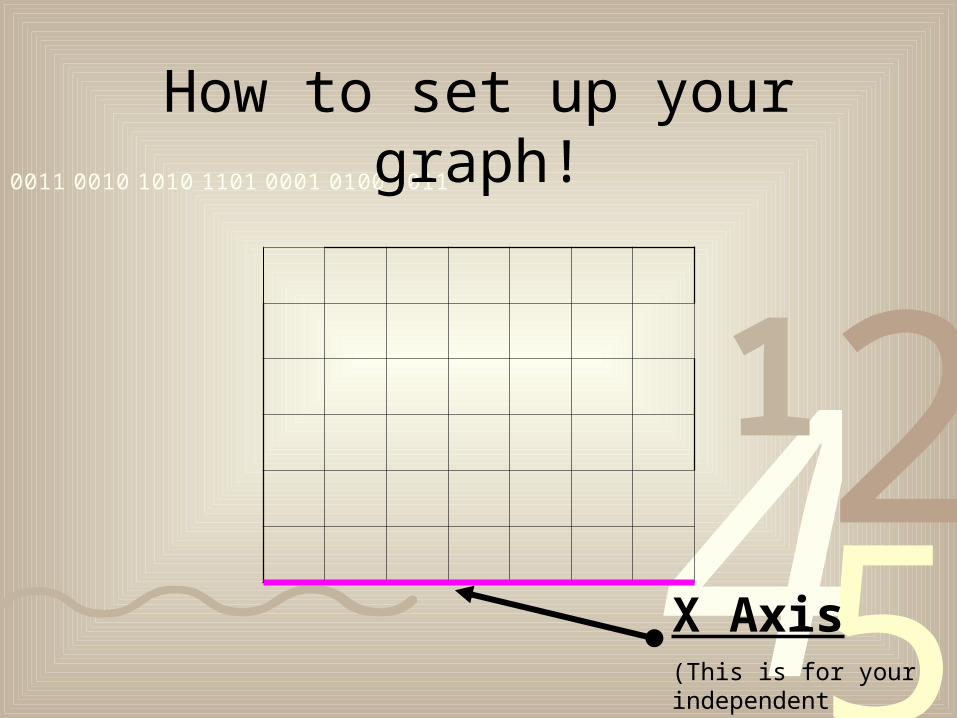
How to set up your graph!
X Axis
(This is for your independent variable)
4251
0011 0010 1010 1101 0001 0100 1011
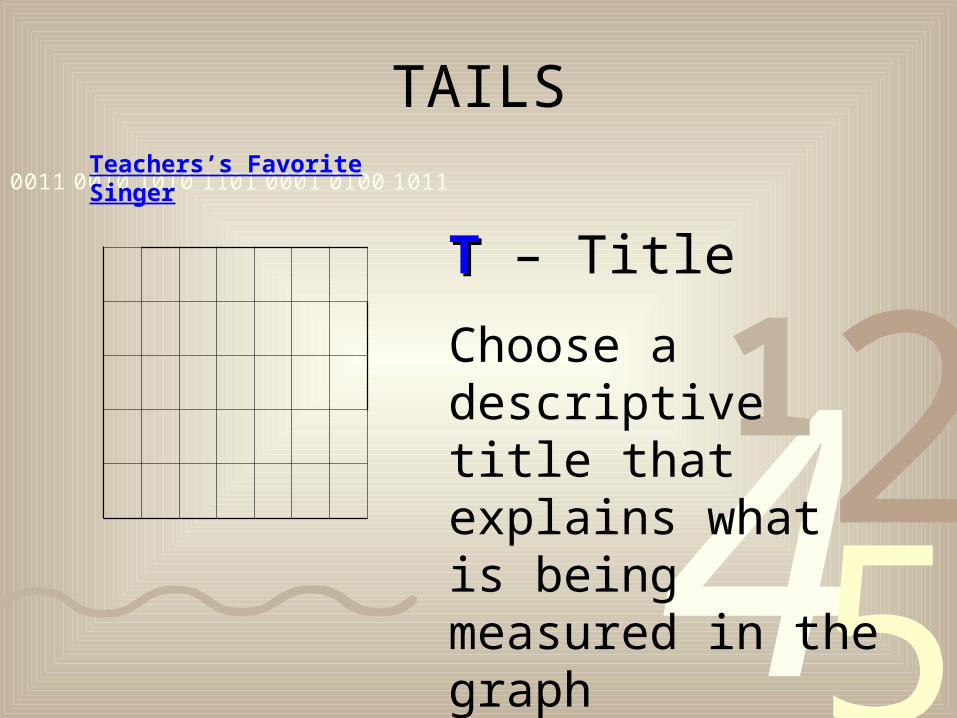
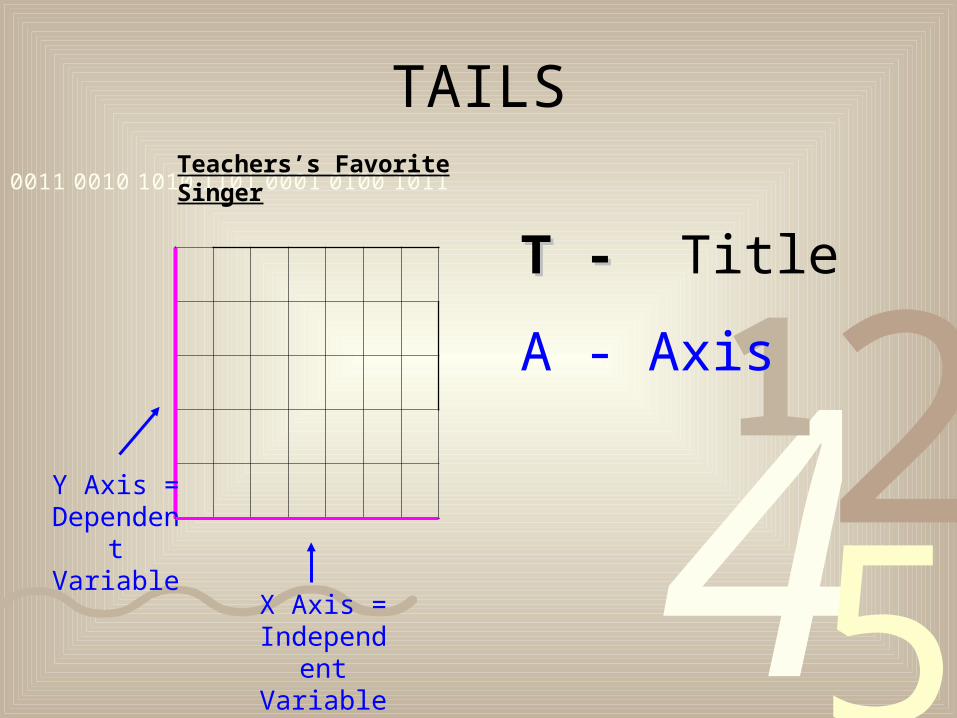
TAILS
TT – Title
Choose a descriptive title that explains what is being measured in the graph
Teachers’s Favorite Singer
4251
0011 0010 1010 1101 0001 0100 1011
TAILS
T - T - Title
A - Axis
Teachers’s Favorite Singer
Y Axis = Dependent Variable
X Axis = Independent
Variable
4251
0011 0010 1010 1101 0001 0100 1011
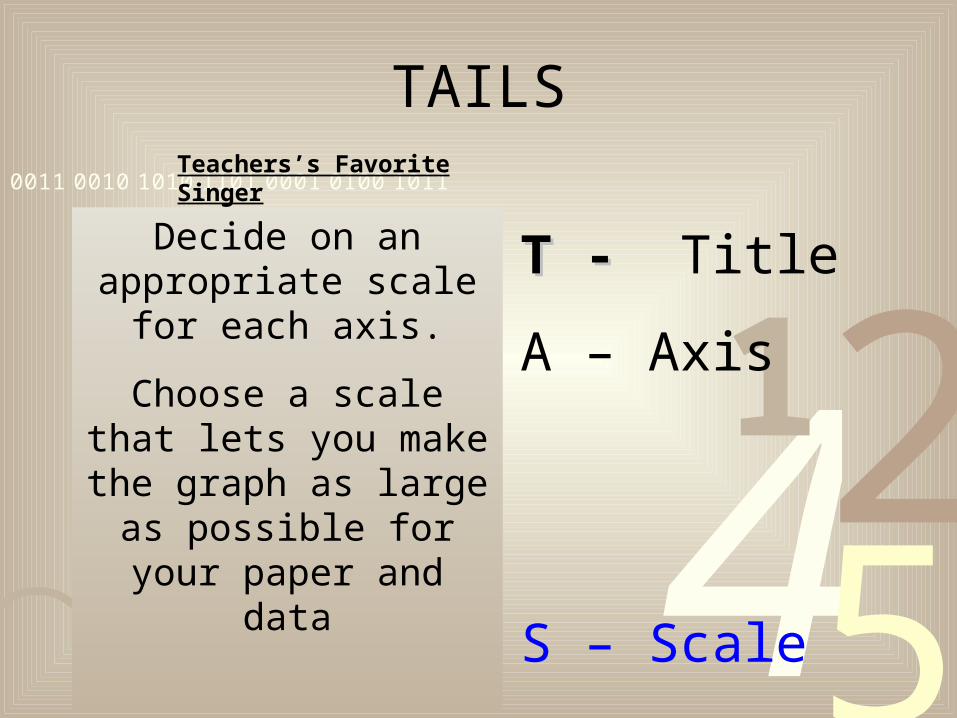
TAILS
T - T - Title
A – Axis
S – Scale
Teachers’s Favorite Singer
Decide on an appropriate scale for each axis.
Choose a scale that lets you make the graph as
large as possible for your paper and data
4251
0011 0010 1010 1101 0001 0100 1011
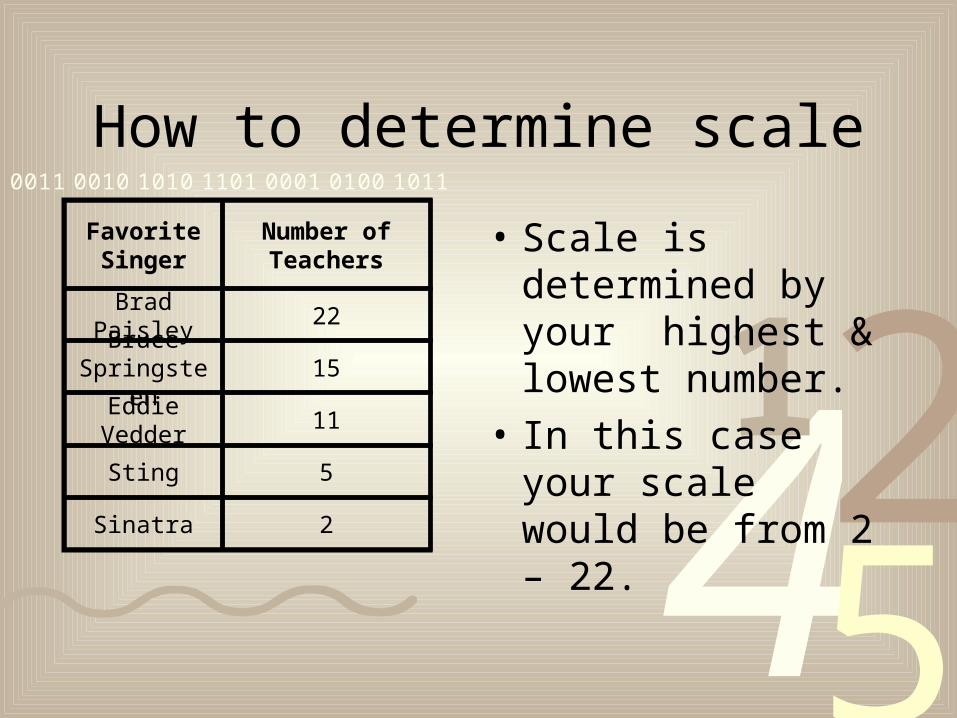
How to determine scale
• Scale is determined by your highest & lowest number.
• In this case your scale would be from 2 – 22.
Favorite Singer
Number of Teachers
Brad Paisley
22
Bruce Springsteen
15
Eddie Vedder 11
Sting 5
Sinatra 2
4251
0011 0010 1010 1101 0001 0100 1011
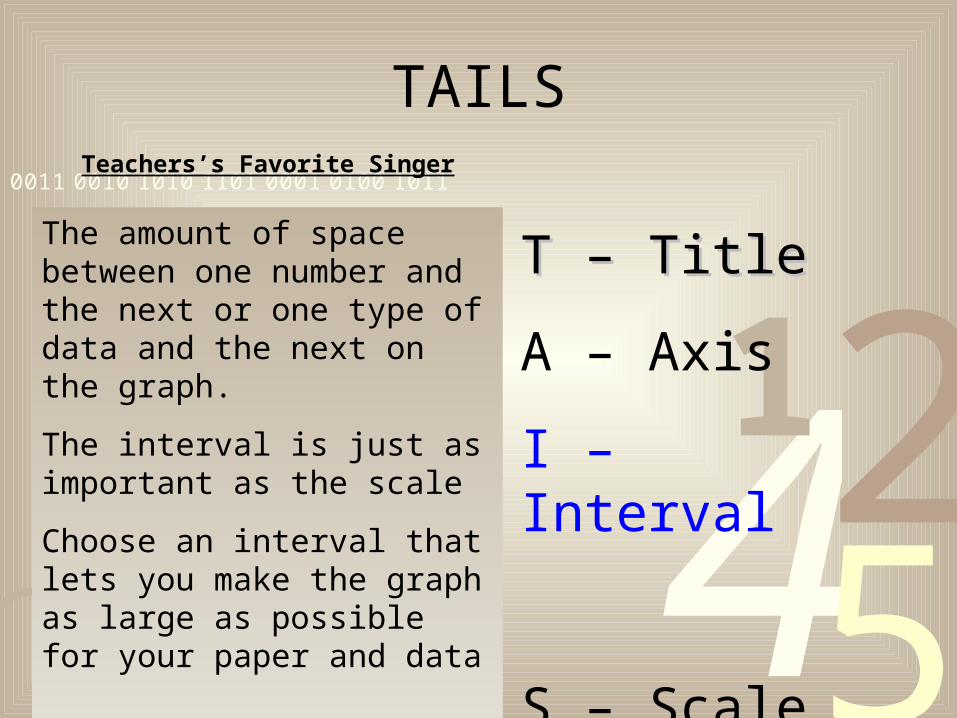
TAILS
T – TitleT – Title
A – Axis
I – Interval
S – Scale
Teachers’s Favorite Singer
The amount of space between one number and the next or one type of data and the next on the graph.
The interval is just as important as the scale
Choose an interval that lets you make the graph as large as possible for your paper and data
4251
0011 0010 1010 1101 0001 0100 1011
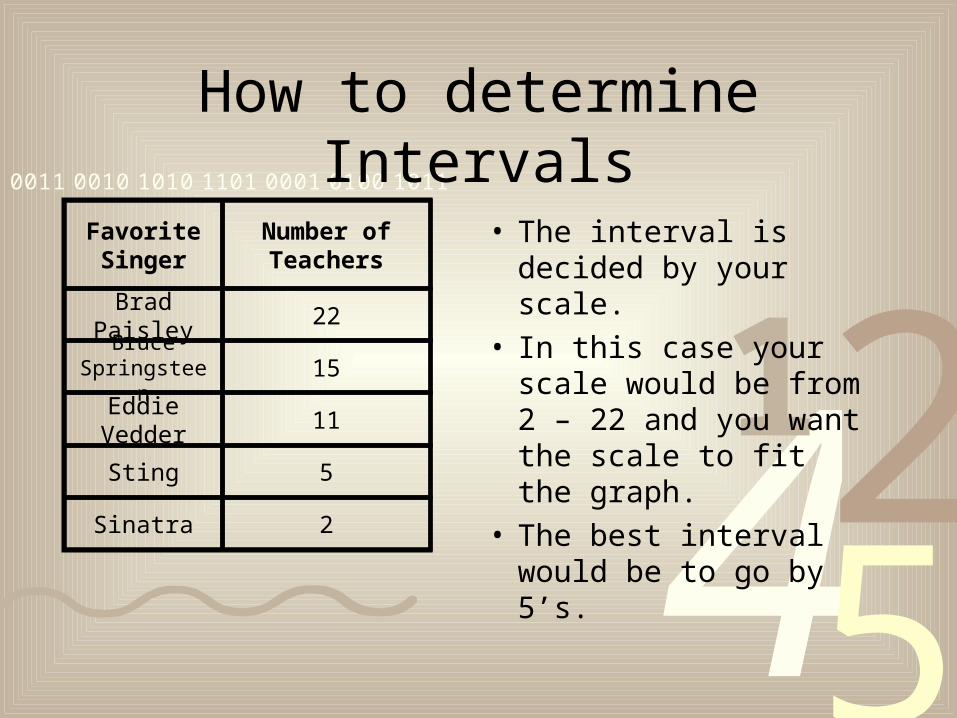
How to determine Intervals
• The interval is decided by your scale.
• In this case your scale would be from 2 – 22 and you want the scale to fit the graph.
• The best interval would be to go by 5’s.
Favorite Singer
Number of Teachers
Brad Paisley
22
Bruce Springsteen 15
Eddie Vedder
11
Sting 5
Sinatra 2
4251
0011 0010 1010 1101 0001 0100 1011
TAILS
T – TitleT – Title
A – Axis
I – Interval
S – Scale
Teachers’s Favorite Singer
0
5
10
15
20
25
4251
0011 0010 1010 1101 0001 0100 1011
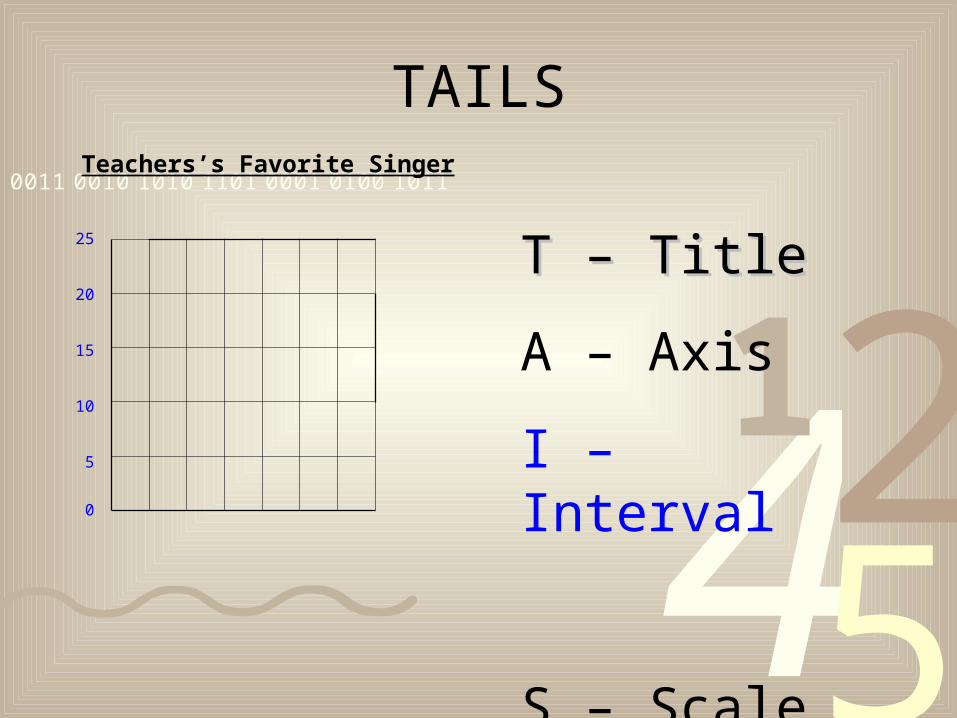
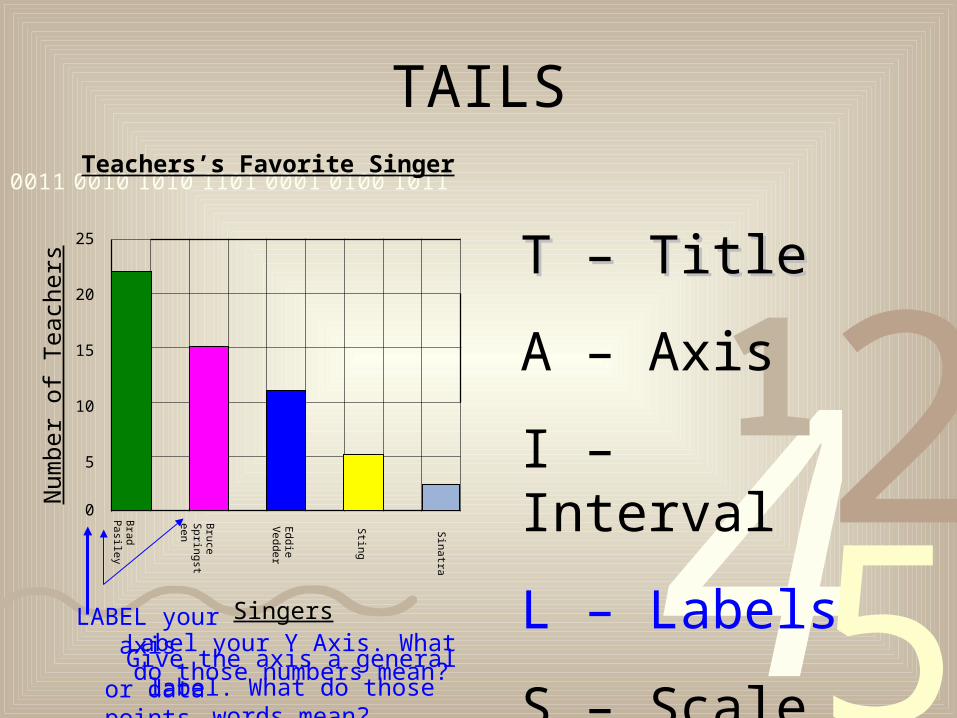
TAILS
T – TitleT – Title
A – Axis
I – Interval
L – Labels
S – Scale
Teachers’s Favorite Singer
0
5
10
15
20
25
Brad Pasiley
Bruce
Springsteen
Eddie
Vedder
Sting
Sinatra
LABEL your axis
or data points
Singers
Give the axis a general label. What do those words mean?
Num
ber
of T
each
ers
Label your Y Axis. What do those numbers mean?
4251
0011 0010 1010 1101 0001 0100 1011
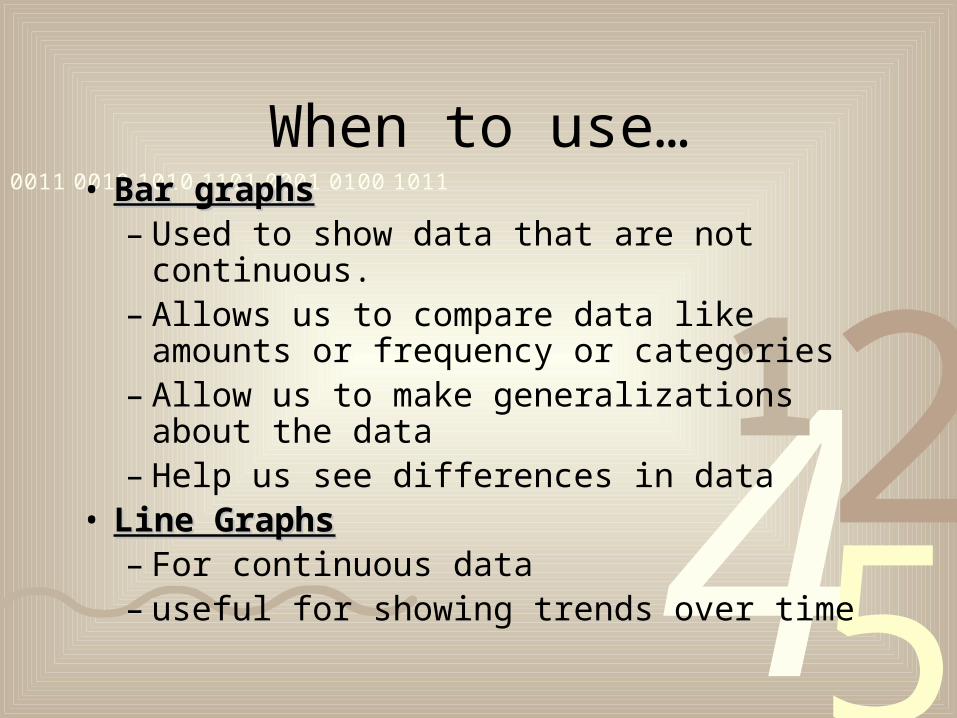
When to use…• Bar graphsBar graphs
– Used to show data that are not continuous.– Allows us to compare data like amounts or
frequency or categories– Allow us to make generalizations about the data– Help us see differences in data
• Line GraphsLine Graphs– For continuous data– useful for showing trends over time
4251
0011 0010 1010 1101 0001 0100 1011
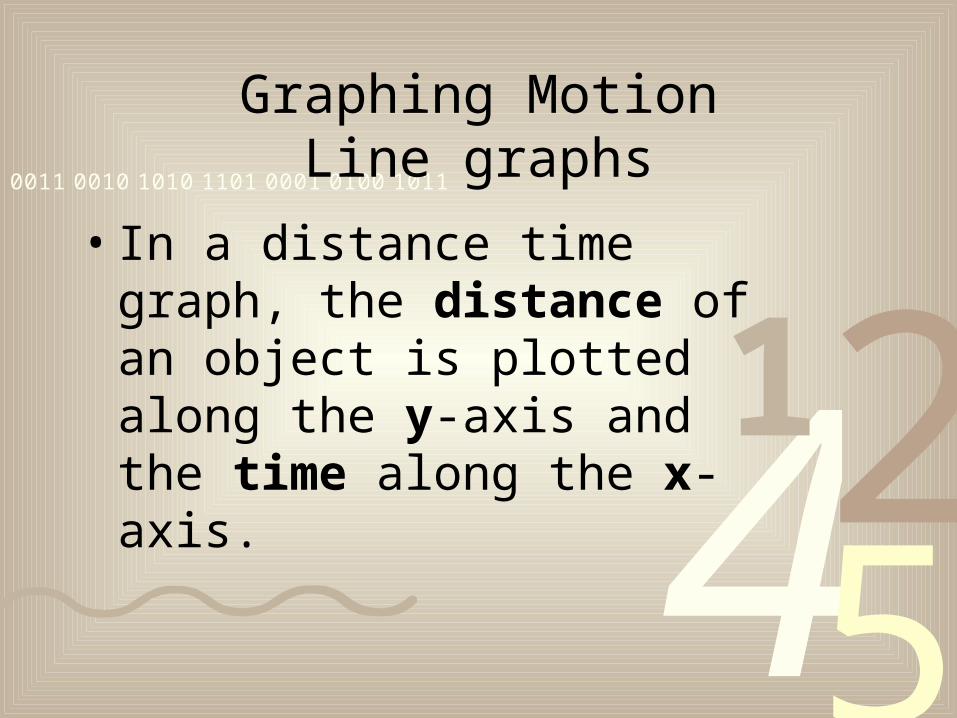
Graphing MotionLine graphs
• In a distance time graph, the distance of an object is plotted along the y-axis and the time along the x-axis.
4251
0011 0010 1010 1101 0001 0100 1011
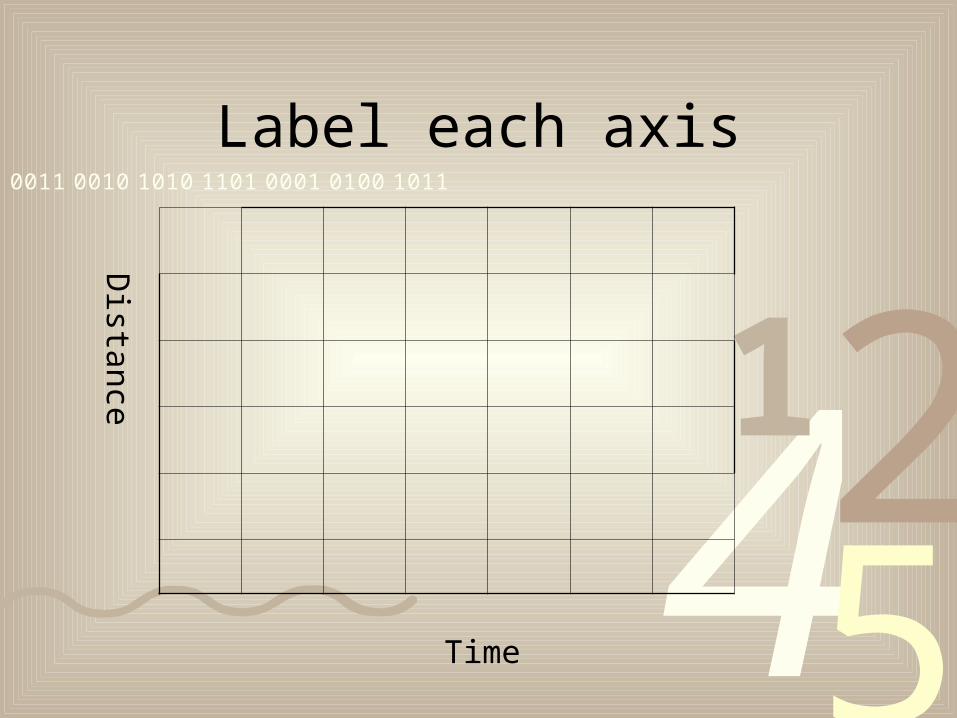
Label each axis
Time
Distance
4251
0011 0010 1010 1101 0001 0100 1011
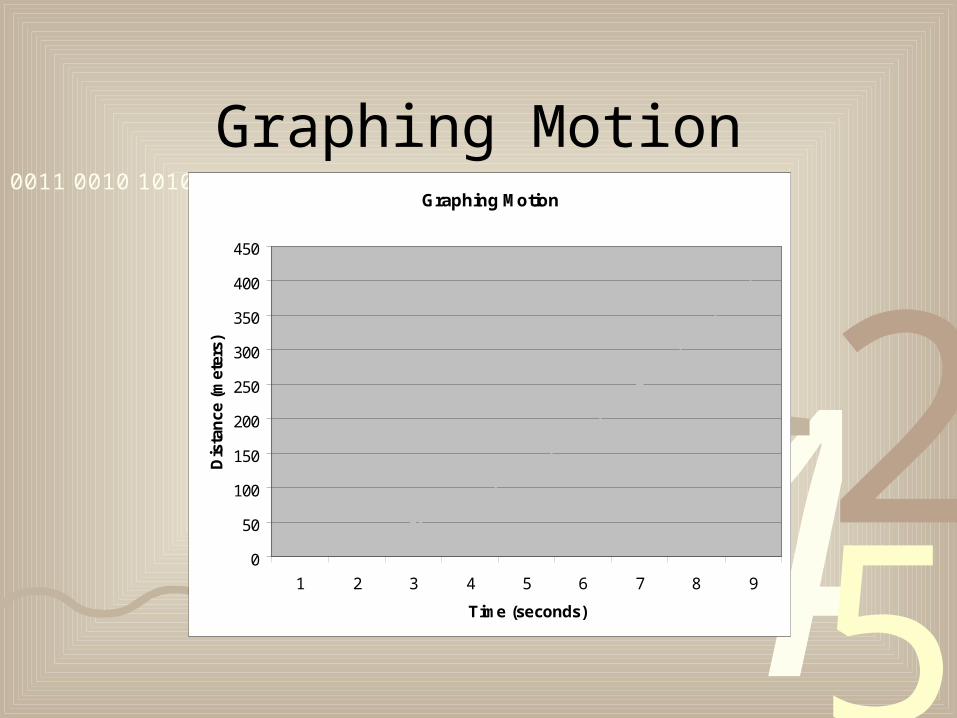
Graphing MotionGraphing Motion
0
50
100
150
200
250
300
350
400
450
1 2 3 4 5 6 7 8 9
Time (seconds)
Dis
tan
ce (
met
ers)
4251
0011 0010 1010 1101 0001 0100 1011
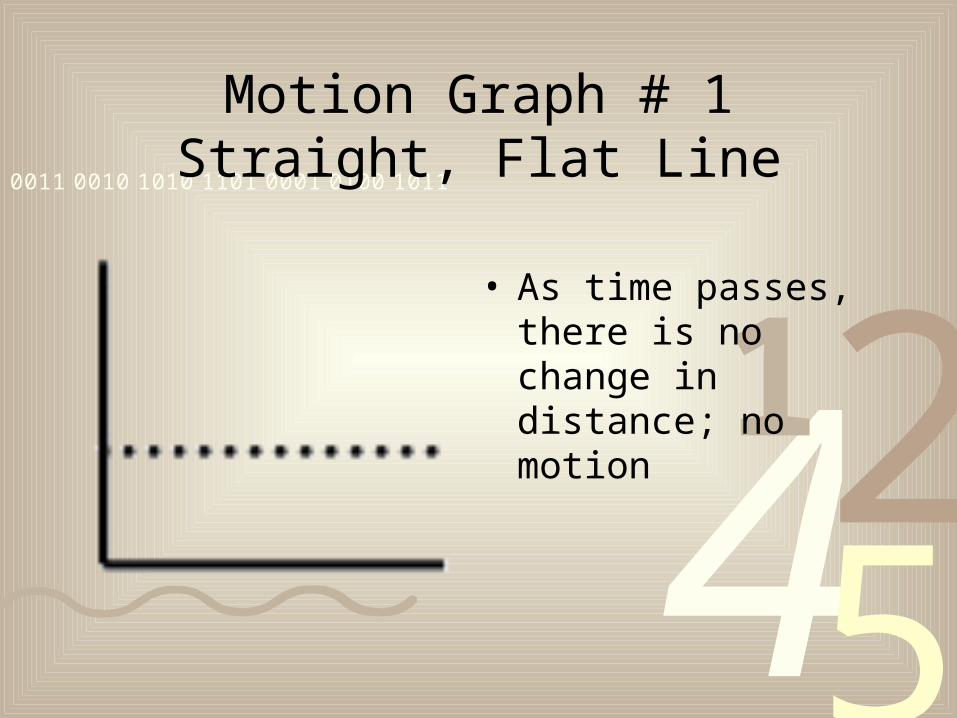
Motion Graph # 1Straight, Flat Line
• As time passes, there is no change in distance; no motion
4251
0011 0010 1010 1101 0001 0100 1011
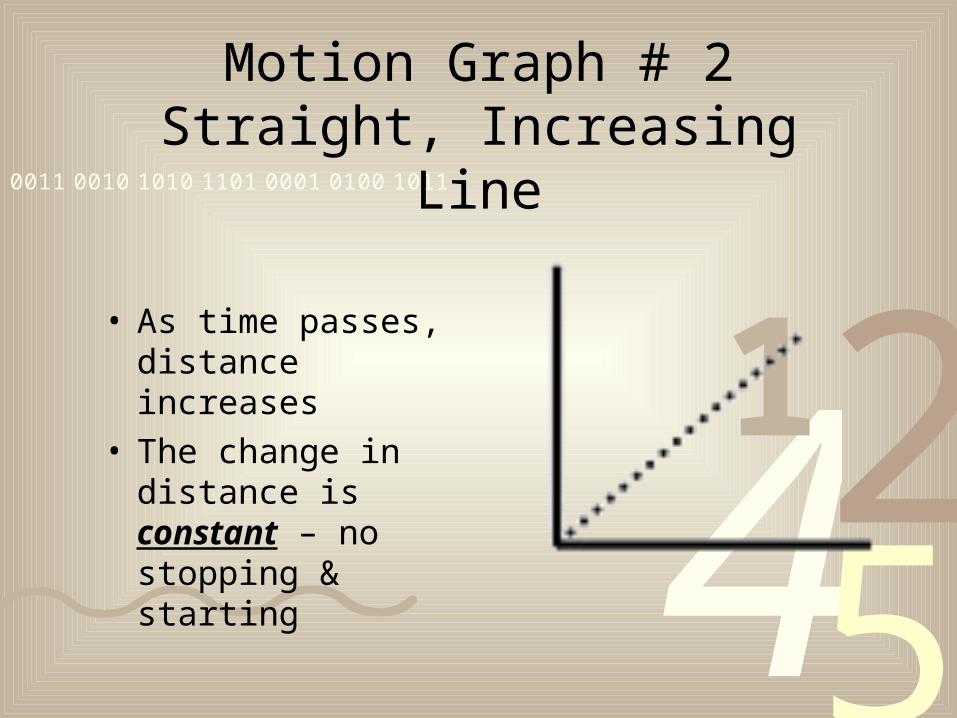
Motion Graph # 2Straight, Increasing Line
• As time passes, distance increases
• The change in distance is constant – no stopping & starting
4251
0011 0010 1010 1101 0001 0100 1011
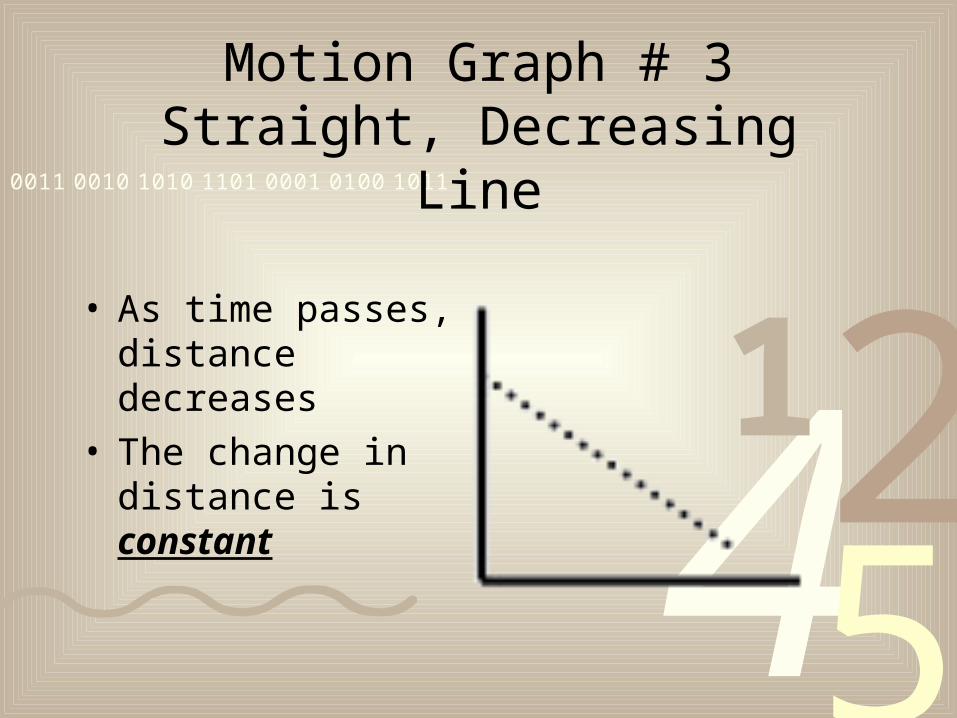
Motion Graph # 3Straight, Decreasing Line
• As time passes, distance decreases
• The change in distance is constant
4251
0011 0010 1010 1101 0001 0100 1011
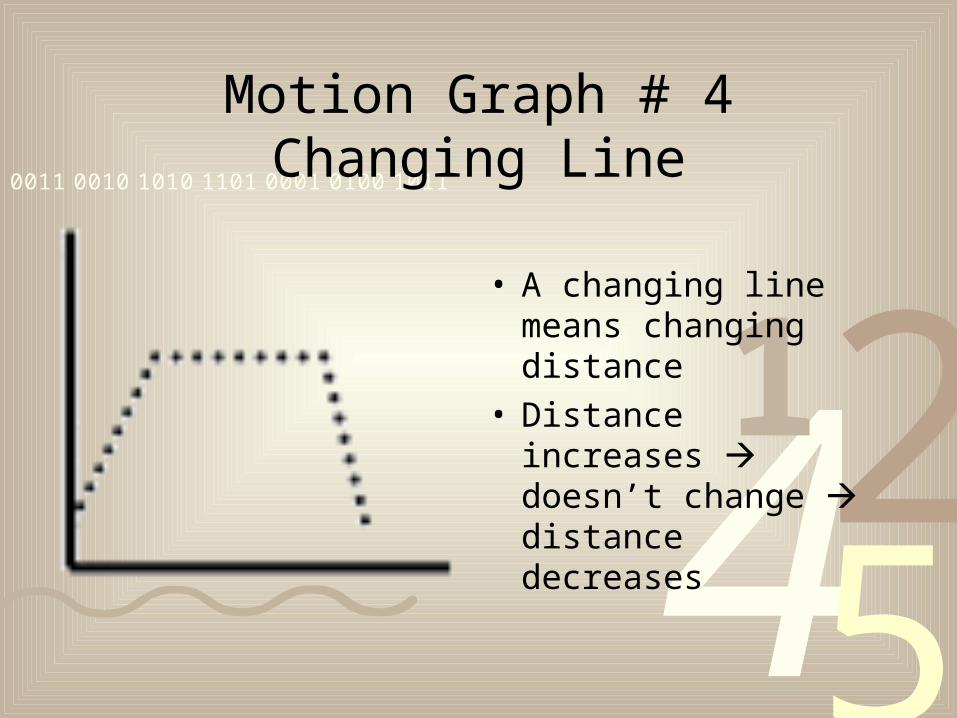
Motion Graph # 4Changing Line
• A changing line means changing distance
• Distance increases doesn’t change distance decreases
4251
0011 0010 1010 1101 0001 0100 1011
Graphing acceleration
• Acceleration is always shown as a curved line
4251
0011 0010 1010 1101 0001 0100 1011
Graphs
• T – TitleT – Title
• A – Axis
• I – Interval
• L – Labels
• S – Scale
Related Documents