GRAPHING LINEAR EQUATIONS AND FUNCTIONS Carly Cofer

Graphing linear equations and functions
Jan 02, 2016
Graphing linear equations and functions. Carly Cofer. 4.1 : The cartesian cooridinate system. Origin. X ~ Axis. Y ~ Axis. Quadrants. Quadrant II ( - , + ). Quadrant I ( + , + ). Quadrant III ( - , - ). Quadrant IV ( + , - ). To plot a point…. - PowerPoint PPT Presentation
Welcome message from author
This document is posted to help you gain knowledge. Please leave a comment to let me know what you think about it! Share it to your friends and learn new things together.
Transcript
GRAPHING LINEAR EQUATIONS AND
FUNCTIONS
Carly Cofer
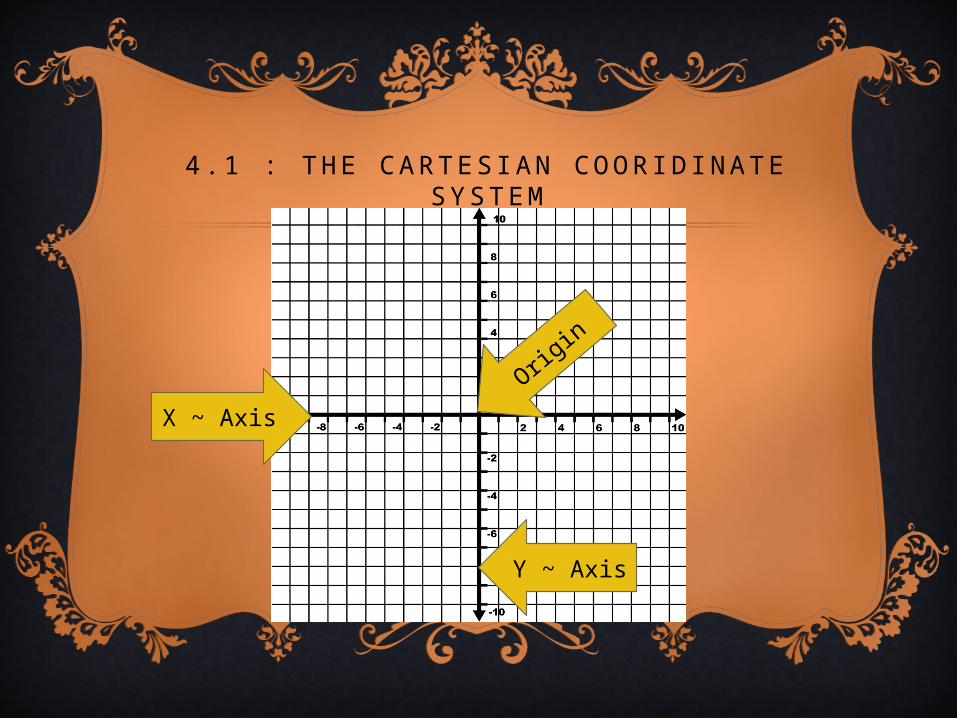
4 .1 : THE CARTESIAN COORIDINATE SYSTEM
X ~ Axis
Y ~ Axis
Origin
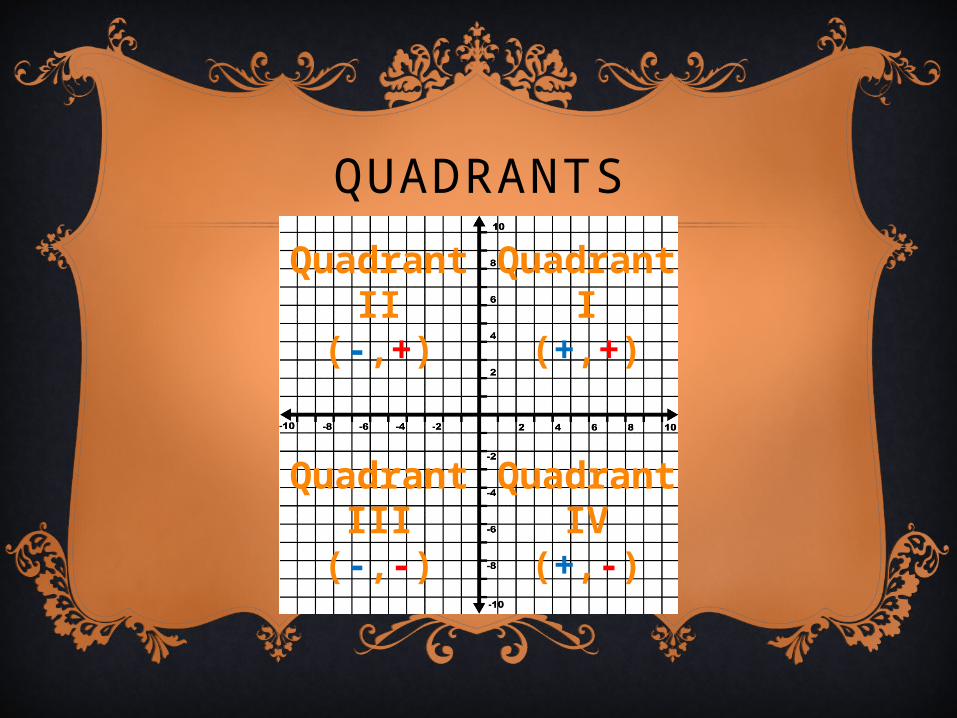
QUADRANTS
Quadrant II
(-,+)
Quadrant I
(+,+)
Quadrant IV(+,-)
Quadrant III(-,-)
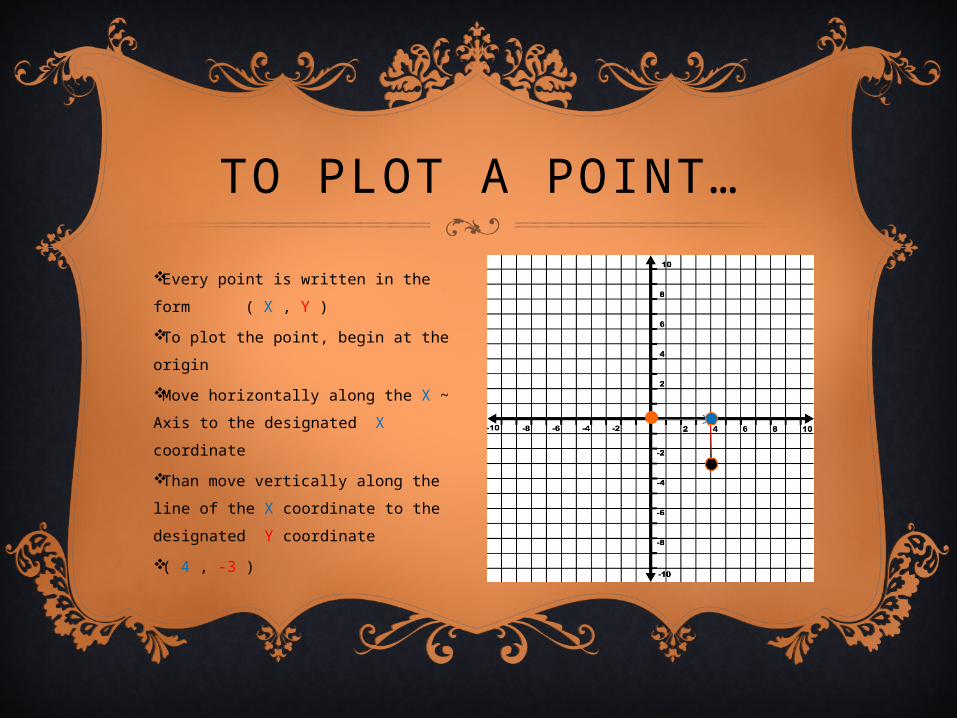
Every point is written in the form
( X , Y )
To plot the point, begin at the
origin
Move horizontally along the X ~
Axis to the designated X coordinate
Than move vertically along the line
of the X coordinate to the
designated Y coordinate
( 4 , -3 )
TO PLOT A POINT…
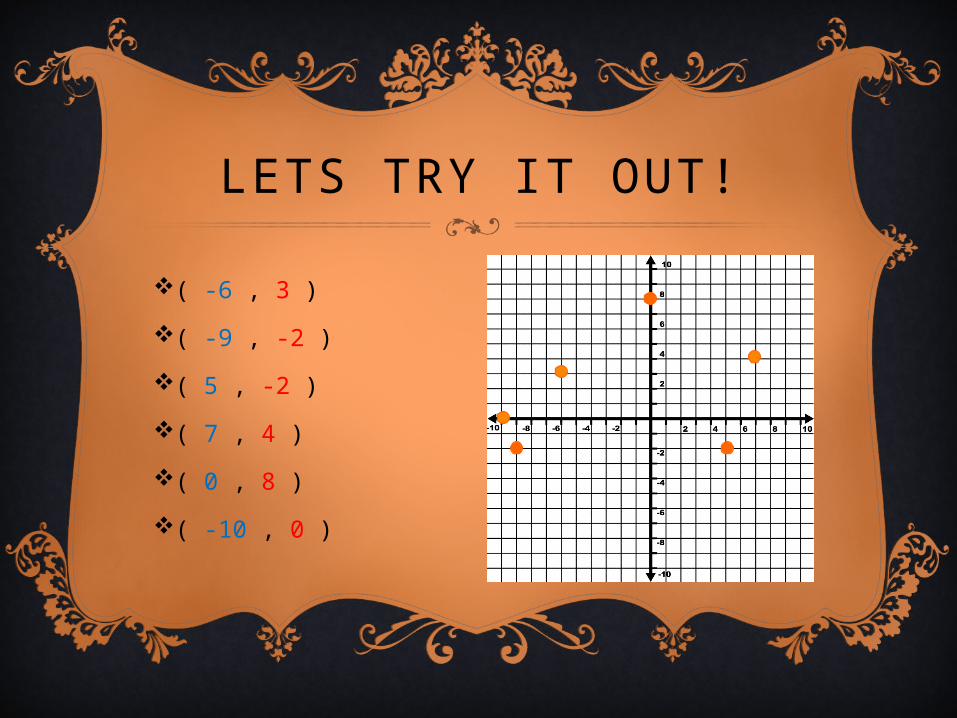
( -6 , 3 )
( -9 , -2 )
( 5 , -2 )
( 7 , 4 )
( 0 , 8 )
( -10 , 0 )
LETS TRY IT OUT!

Without plotting the
points, can you figure
out what quadrant these
points lie in? :• ( -7 , -5 )• ( 8 , 1 )• ( -9 , 4 )• ( 6 , -3 )
LETS TRY IT OUT!
Quadrant II
(-,+)
Quadrant I
(+,+)Quadran
t
III(-,-)
Quadrant IV(+,-)
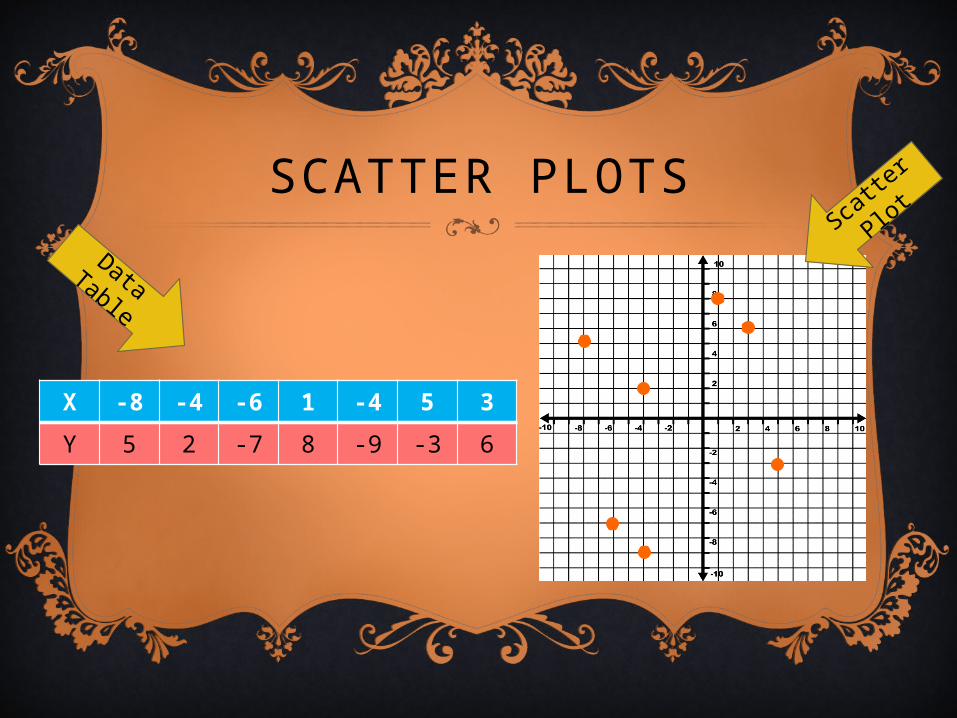
SCATTER PLOTS
A Scatter Plot is a specific type of graph which has
multiple sets of coordinate pairs
These pairs of points are typically organized in a
data table
Each pair is plotted on the same graph
This type of graph is often used to interpret data
and trends in real world applications
SCATTER PLOTSSca
tter
Plot
Data Table
X -8 -4 -6 1 -4 5 3
Y 5 2 -7 8 -9 -3 6
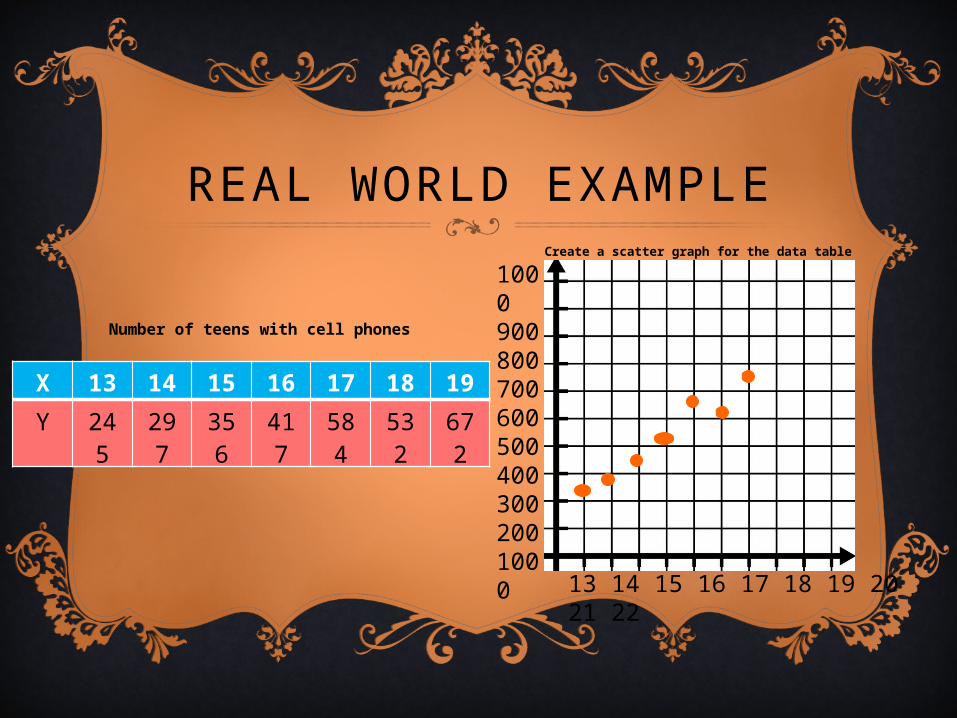
REAL WORLD EXAMPLE
Number of teens with cell phones
Create a scatter graph for the data table
10009008007006005004003002001000 13 14 15 16 17 18 19 20
21 22
X 13 14 15 16 17 18 19
Y 245
297
356
417
584
532
672
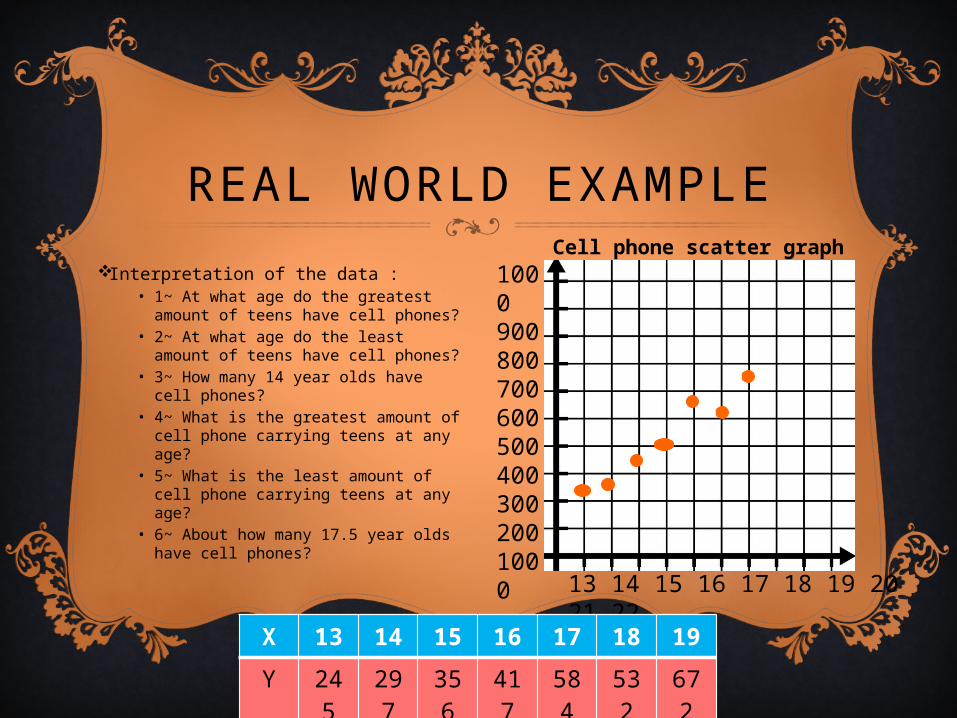
REAL WORLD EXAMPLECell phone scatter graph
10009008007006005004003002001000 13 14 15 16 17 18 19 20
21 22
Interpretation of the data :• 1~ At what age do the greatest
amount of teens have cell phones?• 2~ At what age do the least
amount of teens have cell phones?• 3~ How many 14 year olds have
cell phones?• 4~ What is the greatest amount
of cell phone carrying teens at any age?
• 5~ What is the least amount of cell phone carrying teens at any age?
• 6~ About how many 17.5 year olds have cell phones?
X 13 14 15 16 17 18 19
Y 245
297
356
417
584
532
672
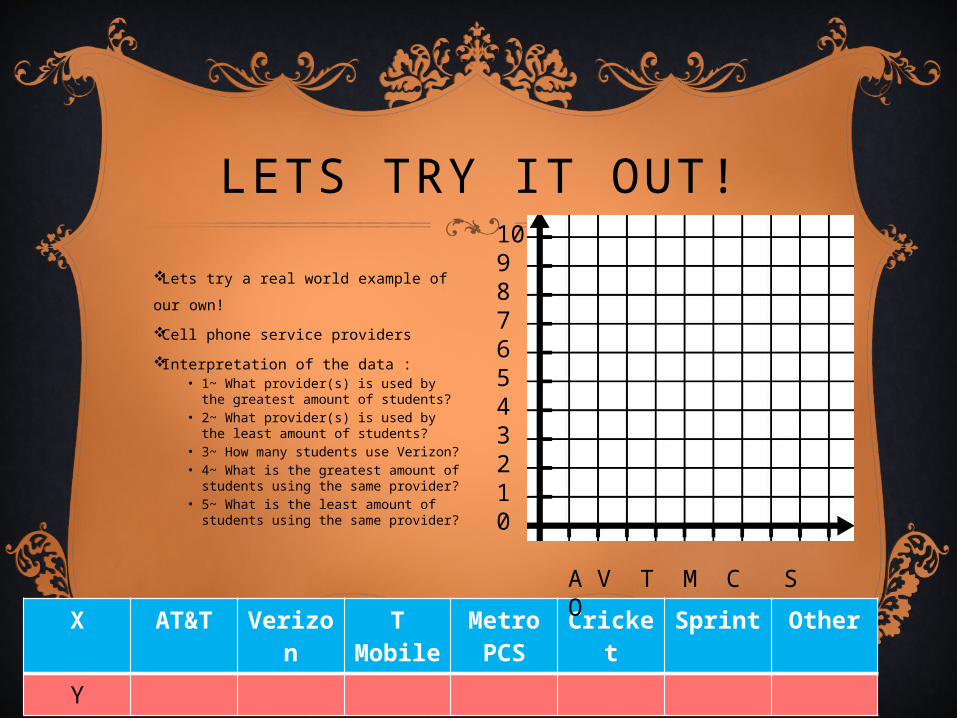
Lets try a real world example of our
own!
Cell phone service providers
Interpretation of the data :• 1~ What provider(s) is used by
the greatest amount of students?• 2~ What provider(s) is used by
the least amount of students?• 3~ How many students use
Verizon?• 4~ What is the greatest amount of
students using the same provider?• 5~ What is the least amount of
students using the same provider?
LETS TRY IT OUT!
X AT&T Verizon
T Mobil
e
Metro PCS
Cricket
Sprint Other
Y
A V T M C S O
109876543210

Page 206• 3, 4, 5, 6, 7 & 8
IN CLASS EXERCISES
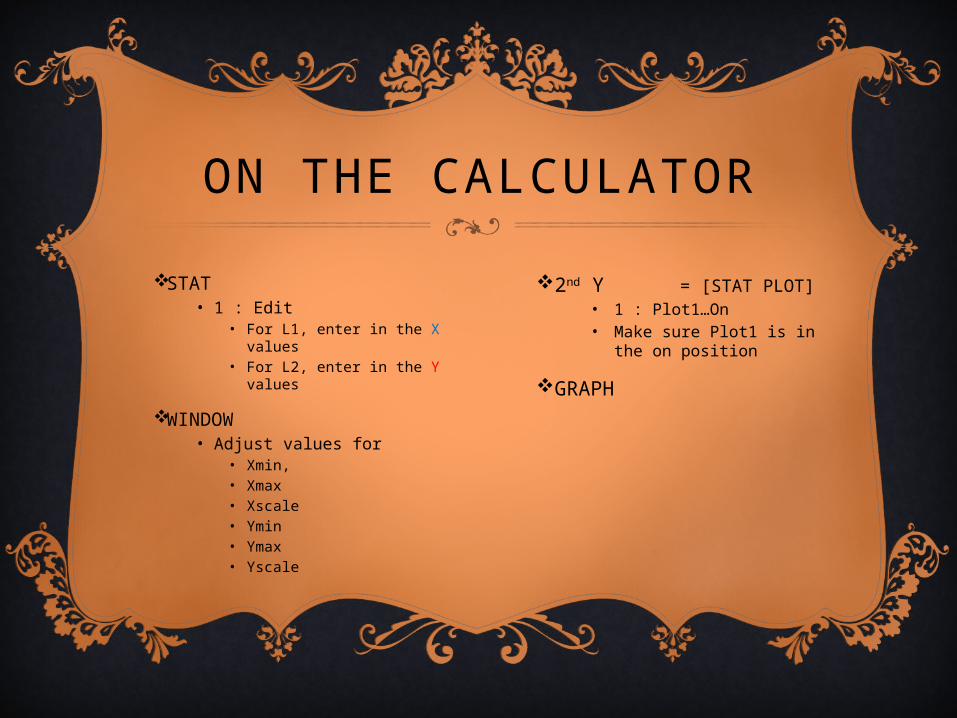
ON THE CALCULATOR
2nd Y = [STAT
PLOT]• 1 : Plot1…On• Make sure Plot1 is in the on
position
GRAPH
STAT• 1 : Edit
• For L1, enter in the X values
• For L2, enter in the Y values
WINDOW• Adjust values for
• Xmin,• Xmax• Xscale• Ymin• Ymax • Yscale

Page 206
10, 12, 16, 18, 20, 22, 24 & 25
Good Luck!
TRY IT YOURSELF!
"Coordinate Grids." Chart. ClipArt ETC. First Last. Web.
23 Oct 2011.
<http://etc.usf.edu/clipart/galleries/math/coordinate_grids
>.
Larson, Ron on, Laurie Laurie Boswell, and Timothy
Timothy D. Kanold. Algebra 1. McDougal
Littell/Houghton Mifflin, 2006. 202~209. Print.
WORKS CITED
Related Documents