Graphical Data Exploration Eli Bressert @astrobiased Stitch Fix / Data Labs

Welcome message from author
This document is posted to help you gain knowledge. Please leave a comment to let me know what you think about it! Share it to your friends and learn new things together.
Transcript
Graphical Data Exploration
Eli Bressert @astrobiased Stitch Fix / Data Labs

graphics & exploration
statistical design
1
2
What we [data scientists]
do
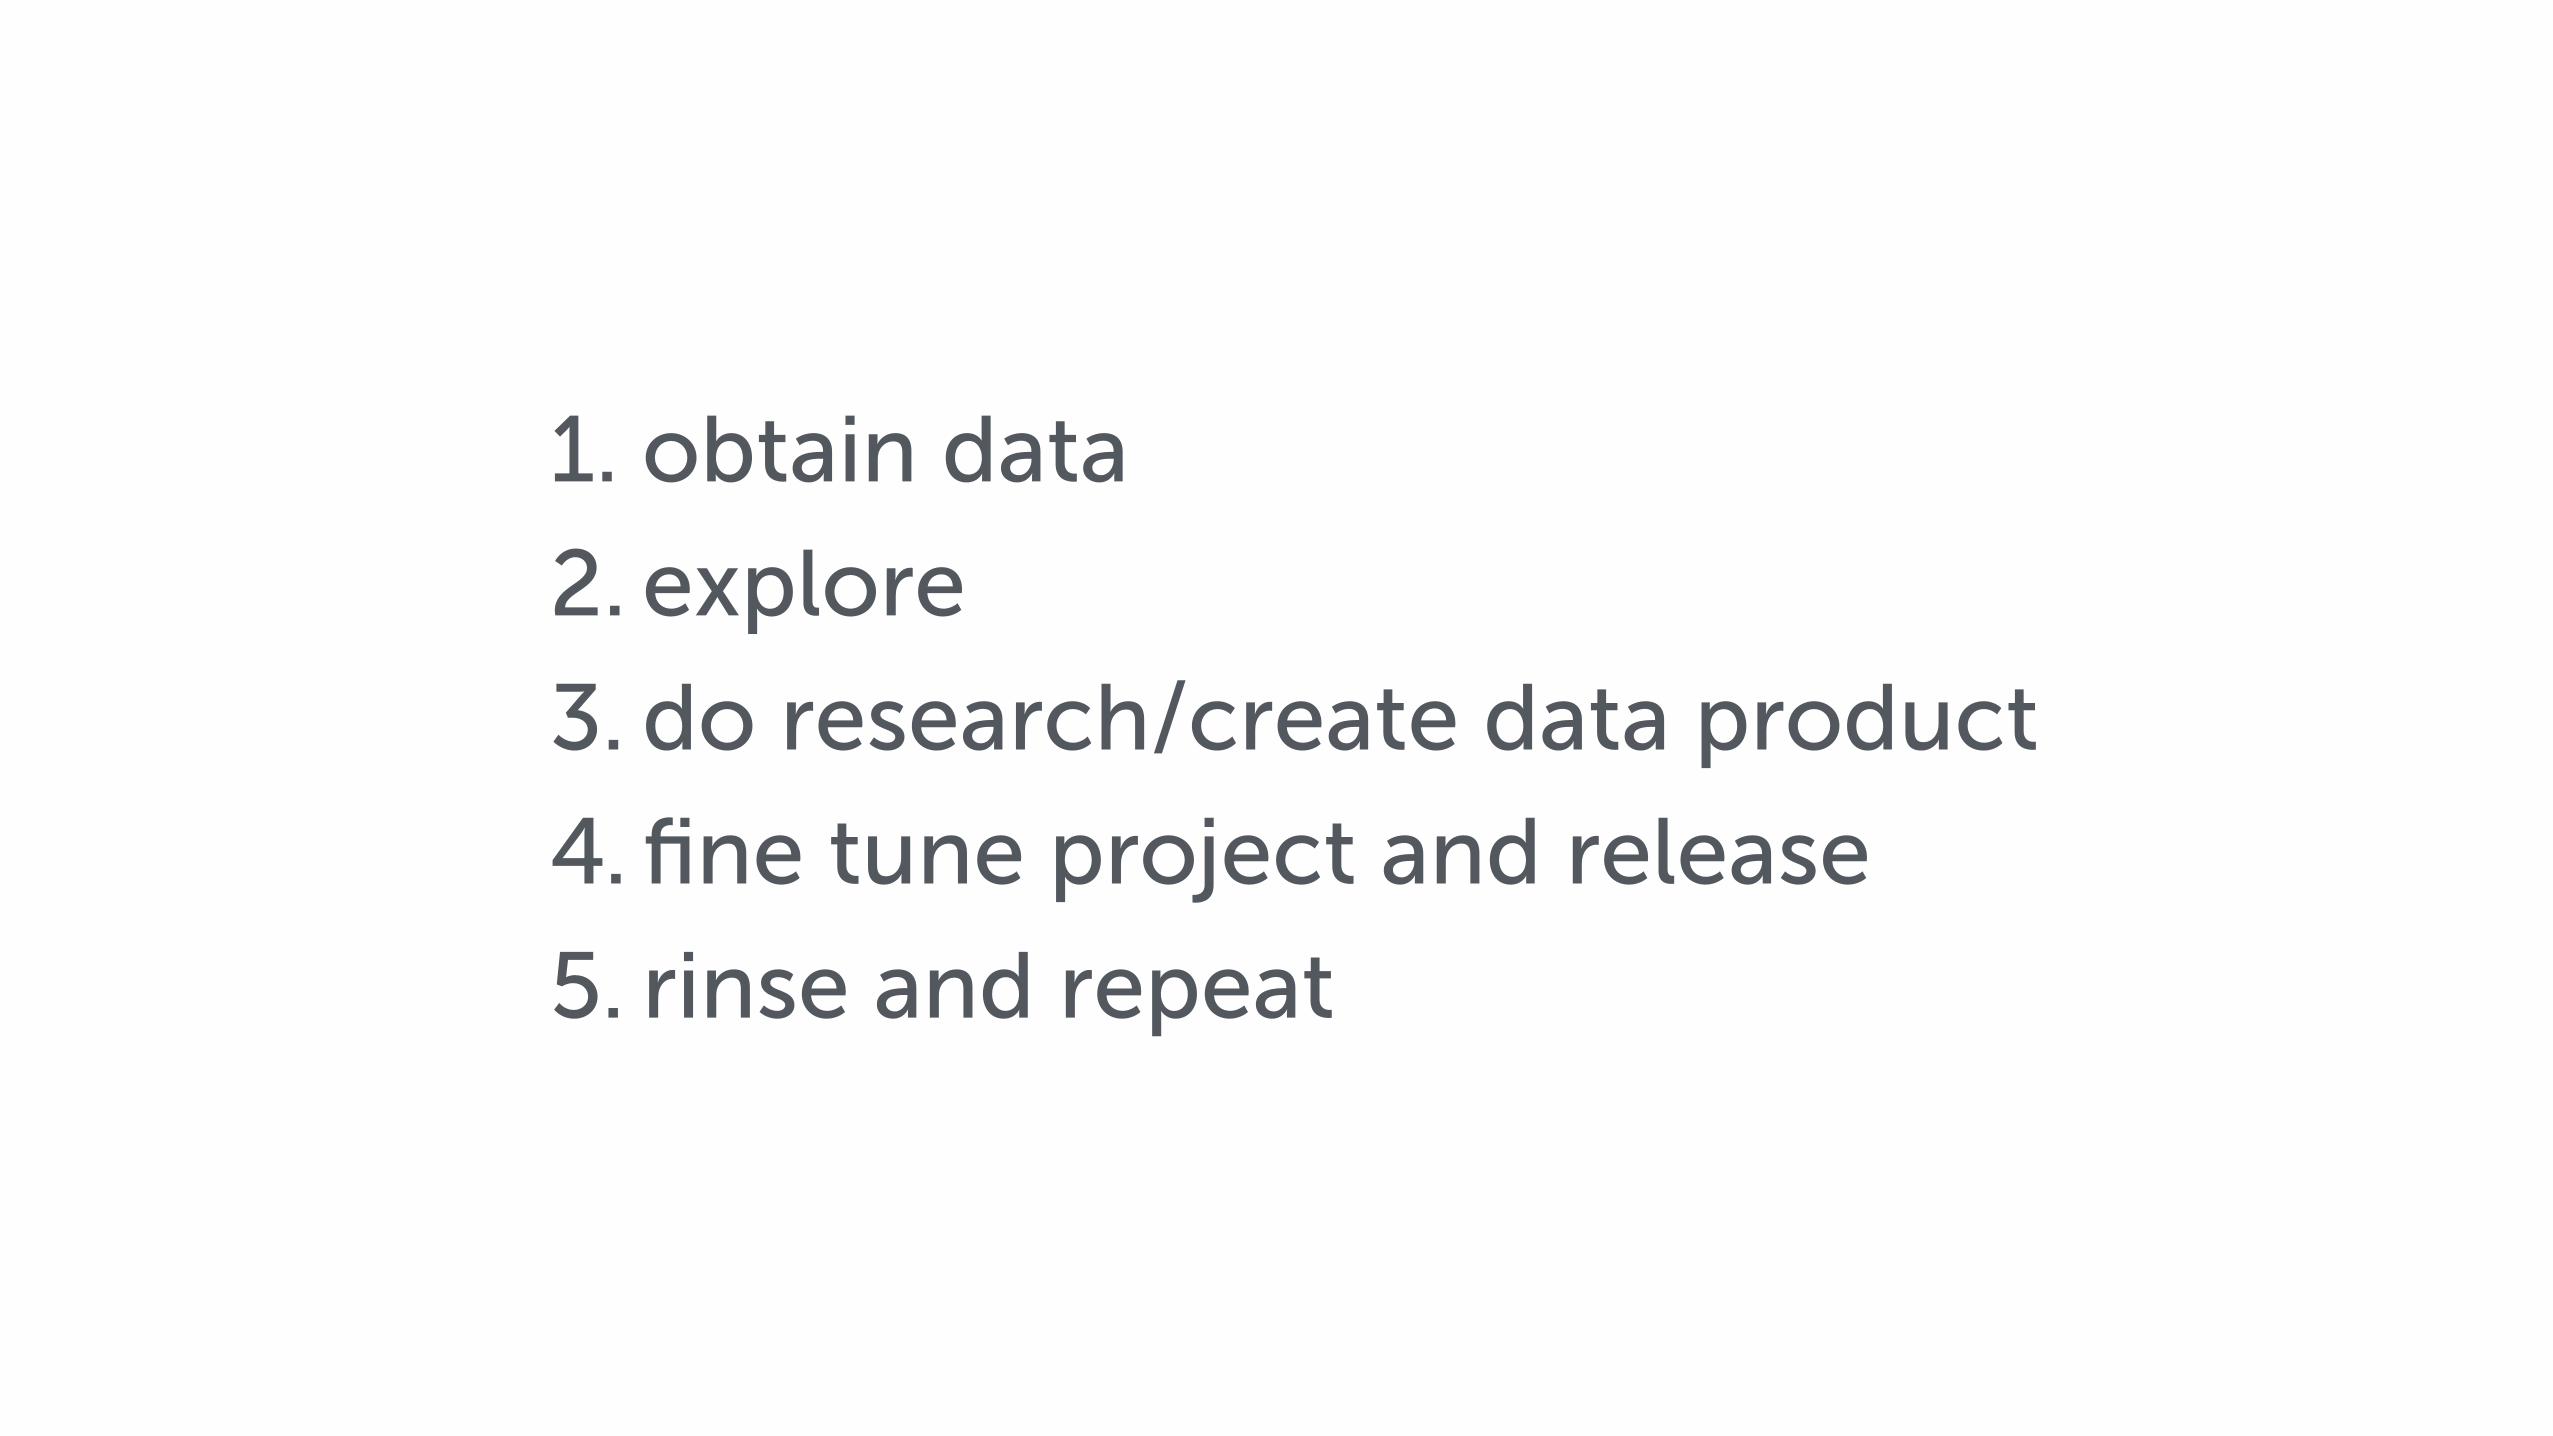
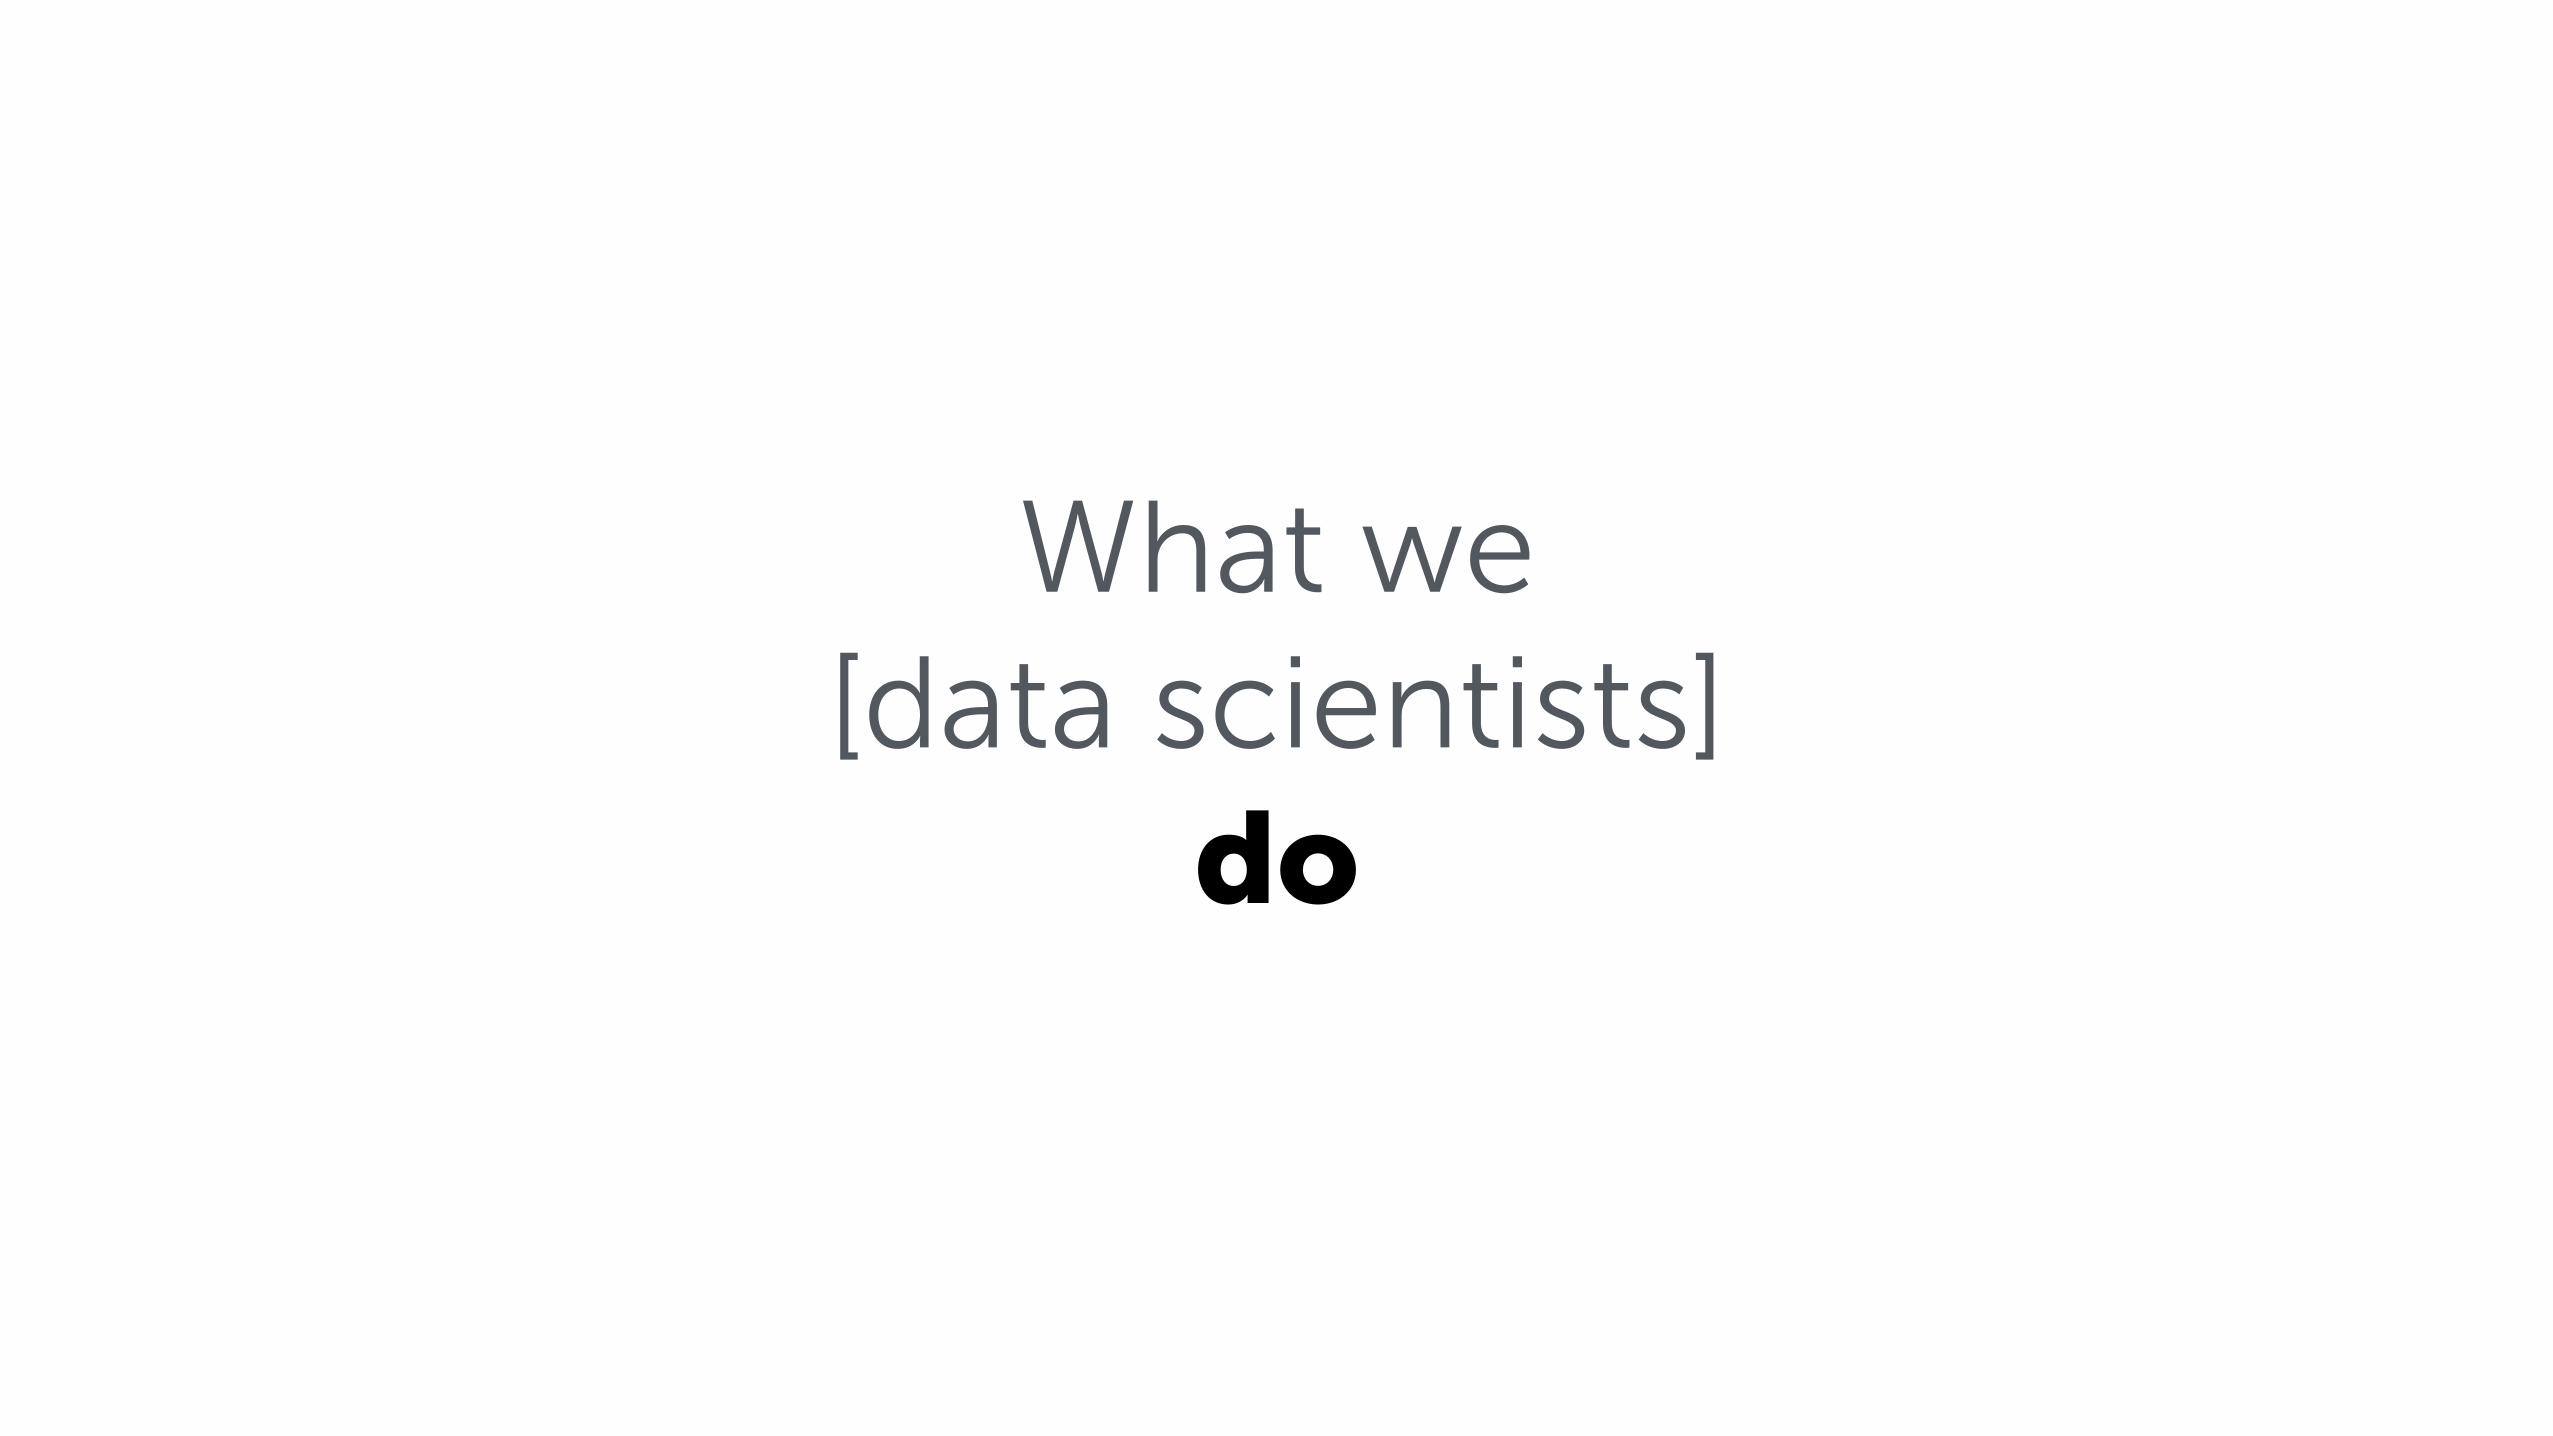
1. obtain data 2. explore 3. do research/create data product 4. fine tune project and release 5. rinse and repeat

1. obtain data 2.explore 3. do research/create data product 4. fine tune project and release 5. rinse and repeat
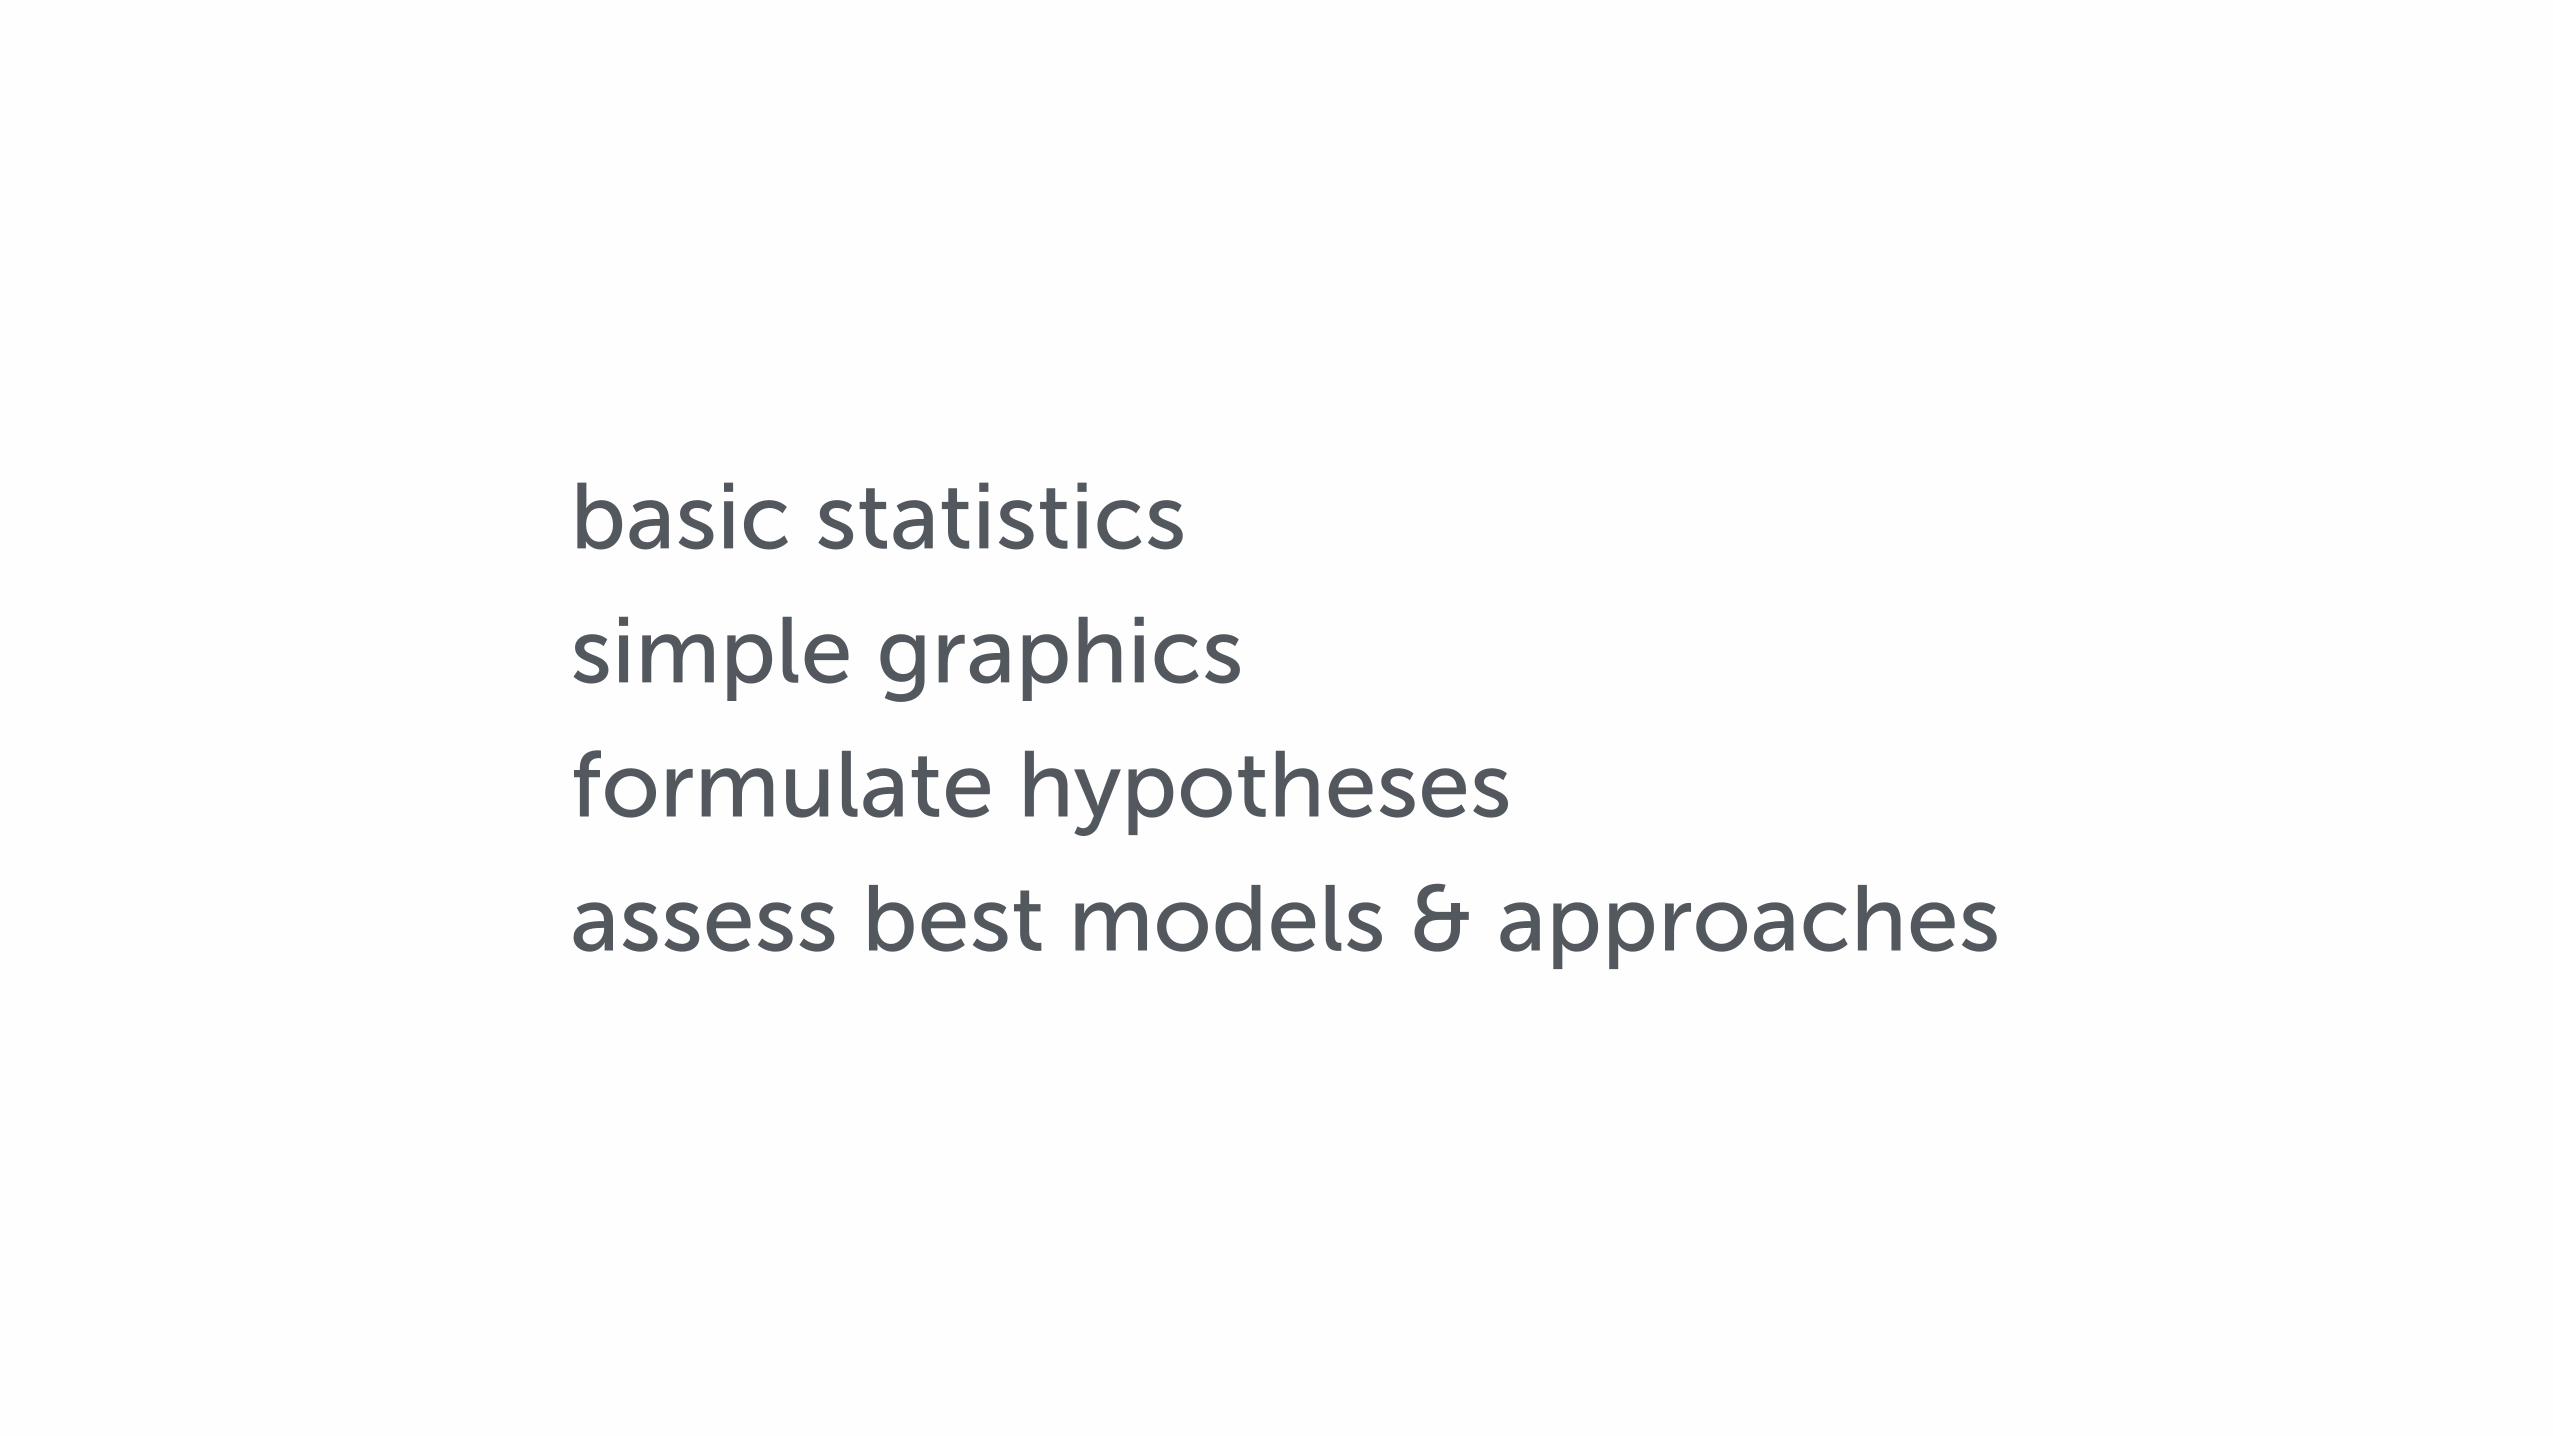
basic statistics simple graphics formulate hypotheses assess best models & approaches

1 graphics & exploration

graphic importance

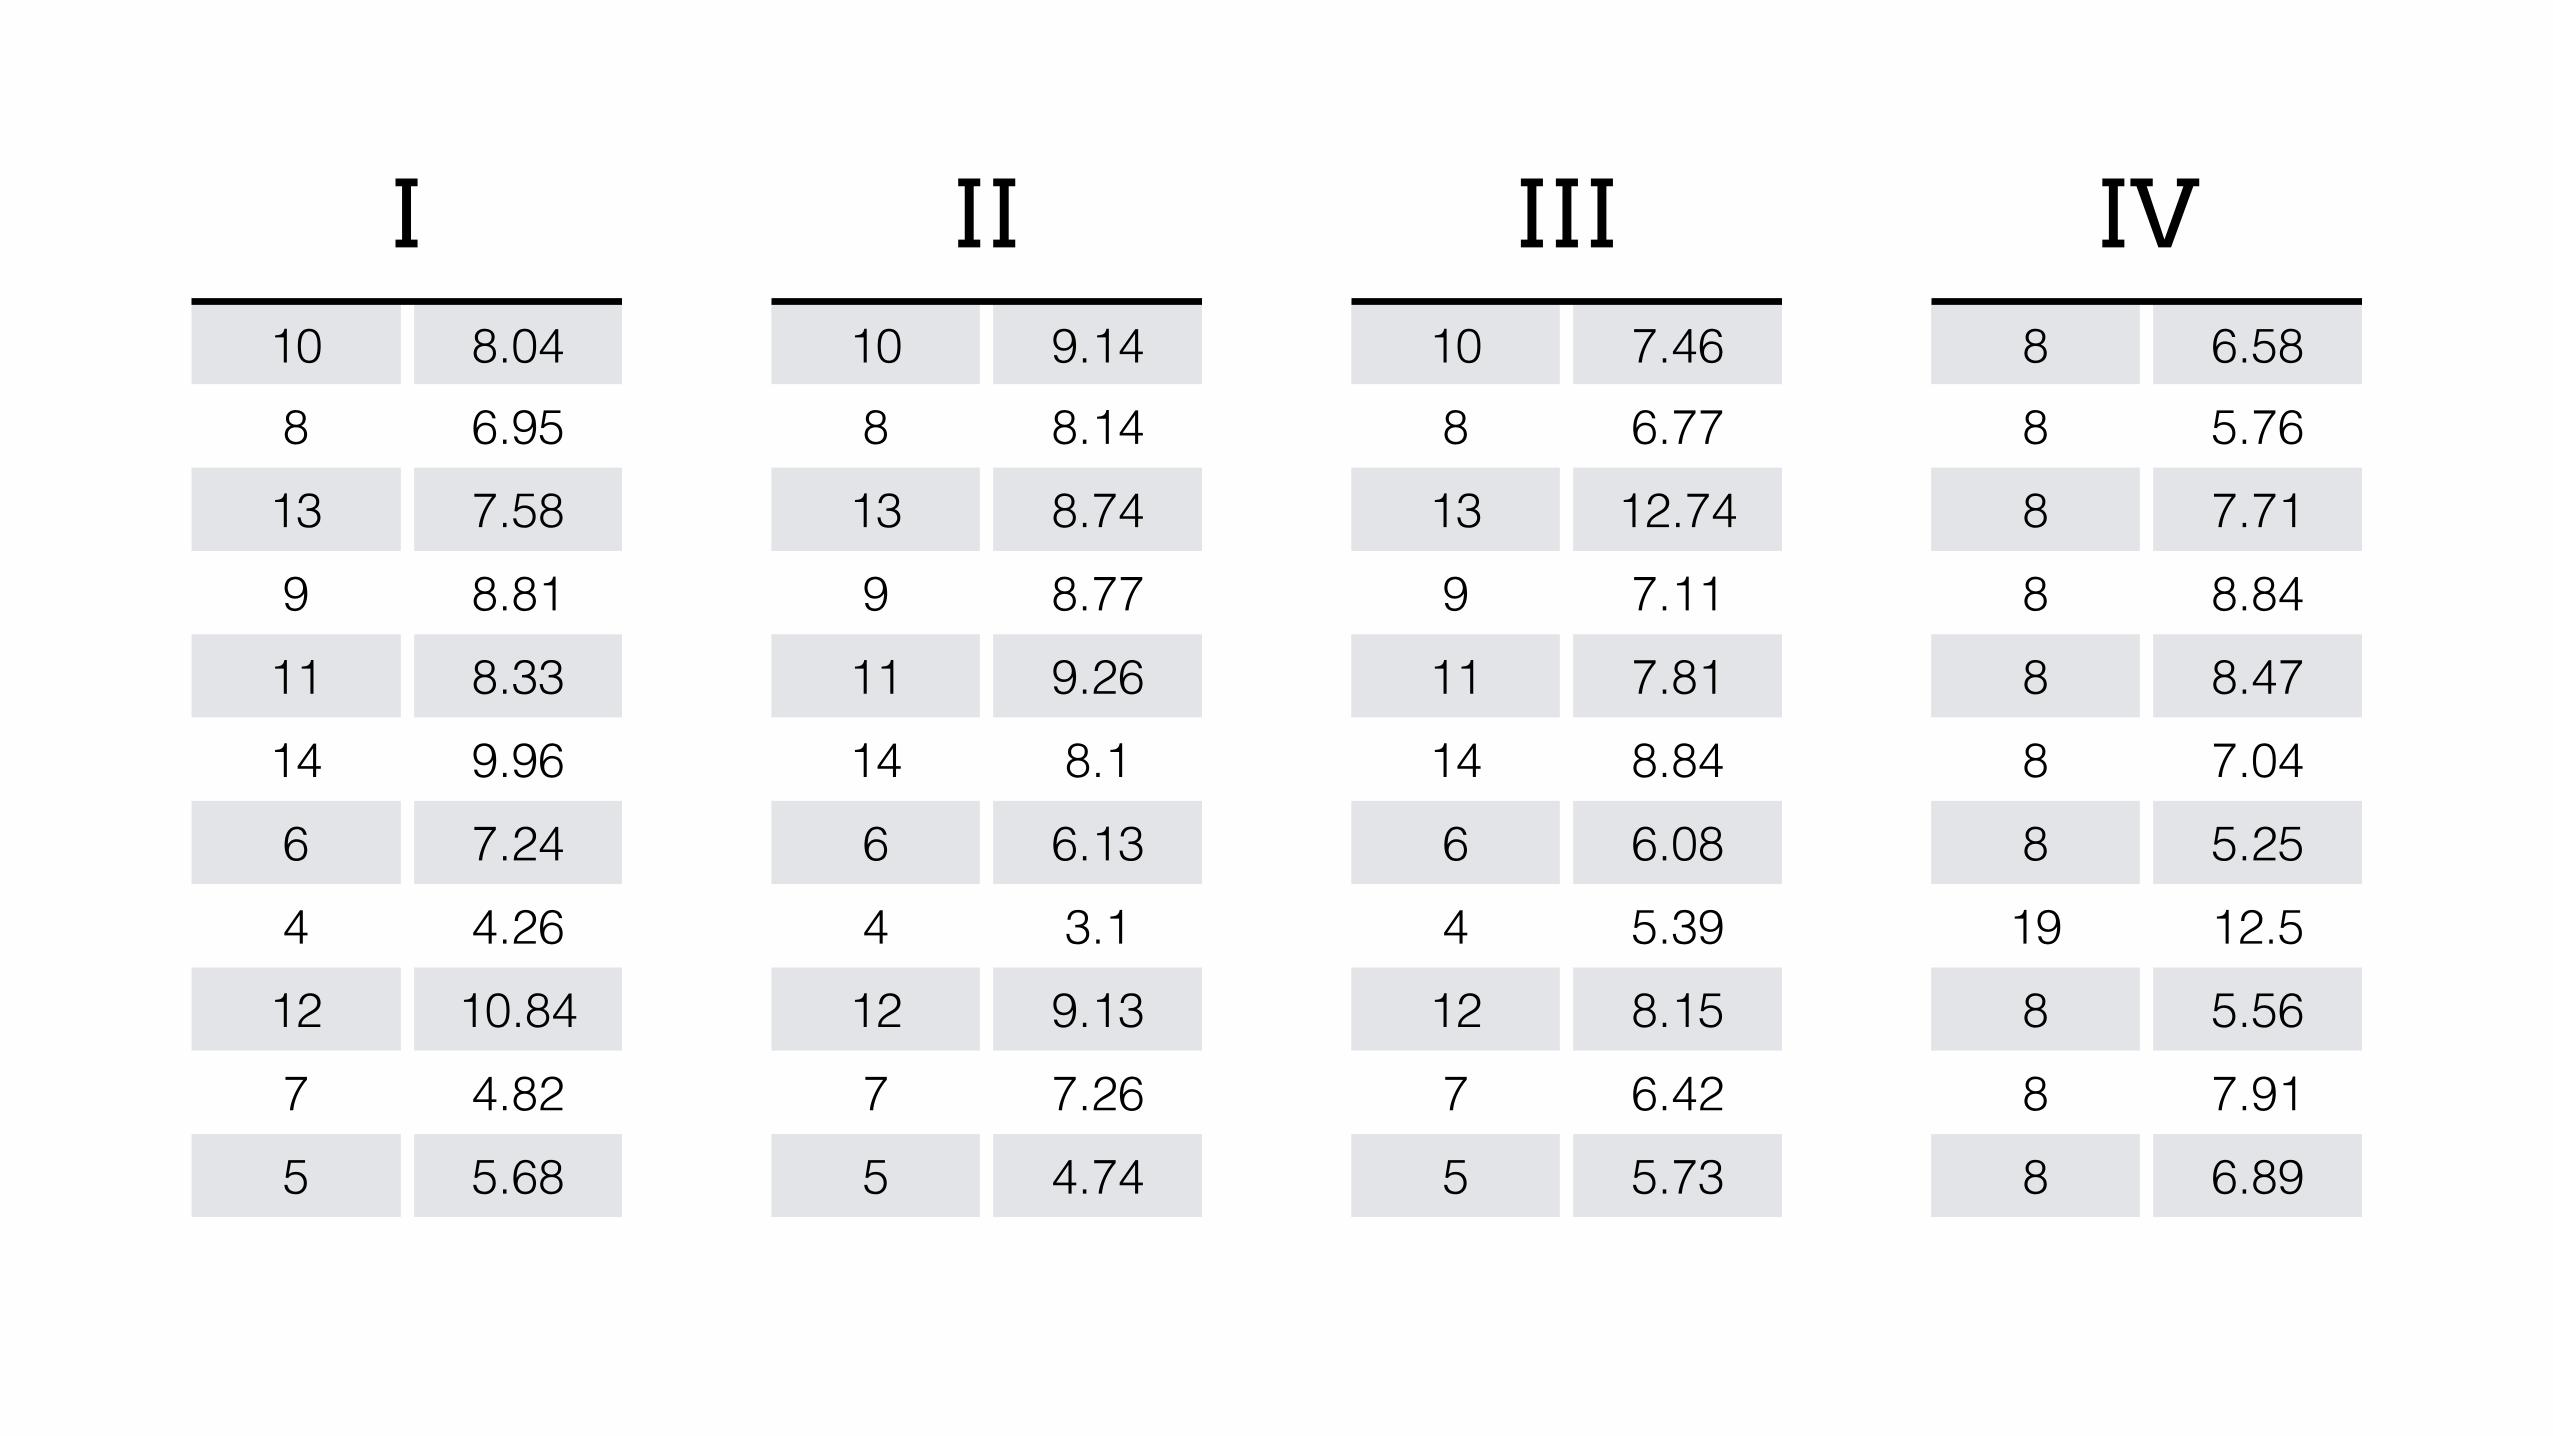
Anscombe’s Quartet
10 8.048 6.95
13 7.589 8.81
11 8.3314 9.966 7.244 4.26
12 10.847 4.825 5.68
10 9.148 8.1413 8.749 8.7711 9.2614 8.16 6.134 3.112 9.137 7.265 4.74
10 7.468 6.7713 12.749 7.1111 7.8114 8.846 6.084 5.3912 8.157 6.425 5.73
8 6.588 5.768 7.718 8.848 8.478 7.048 5.2519 12.58 5.568 7.918 6.89
I II III IV
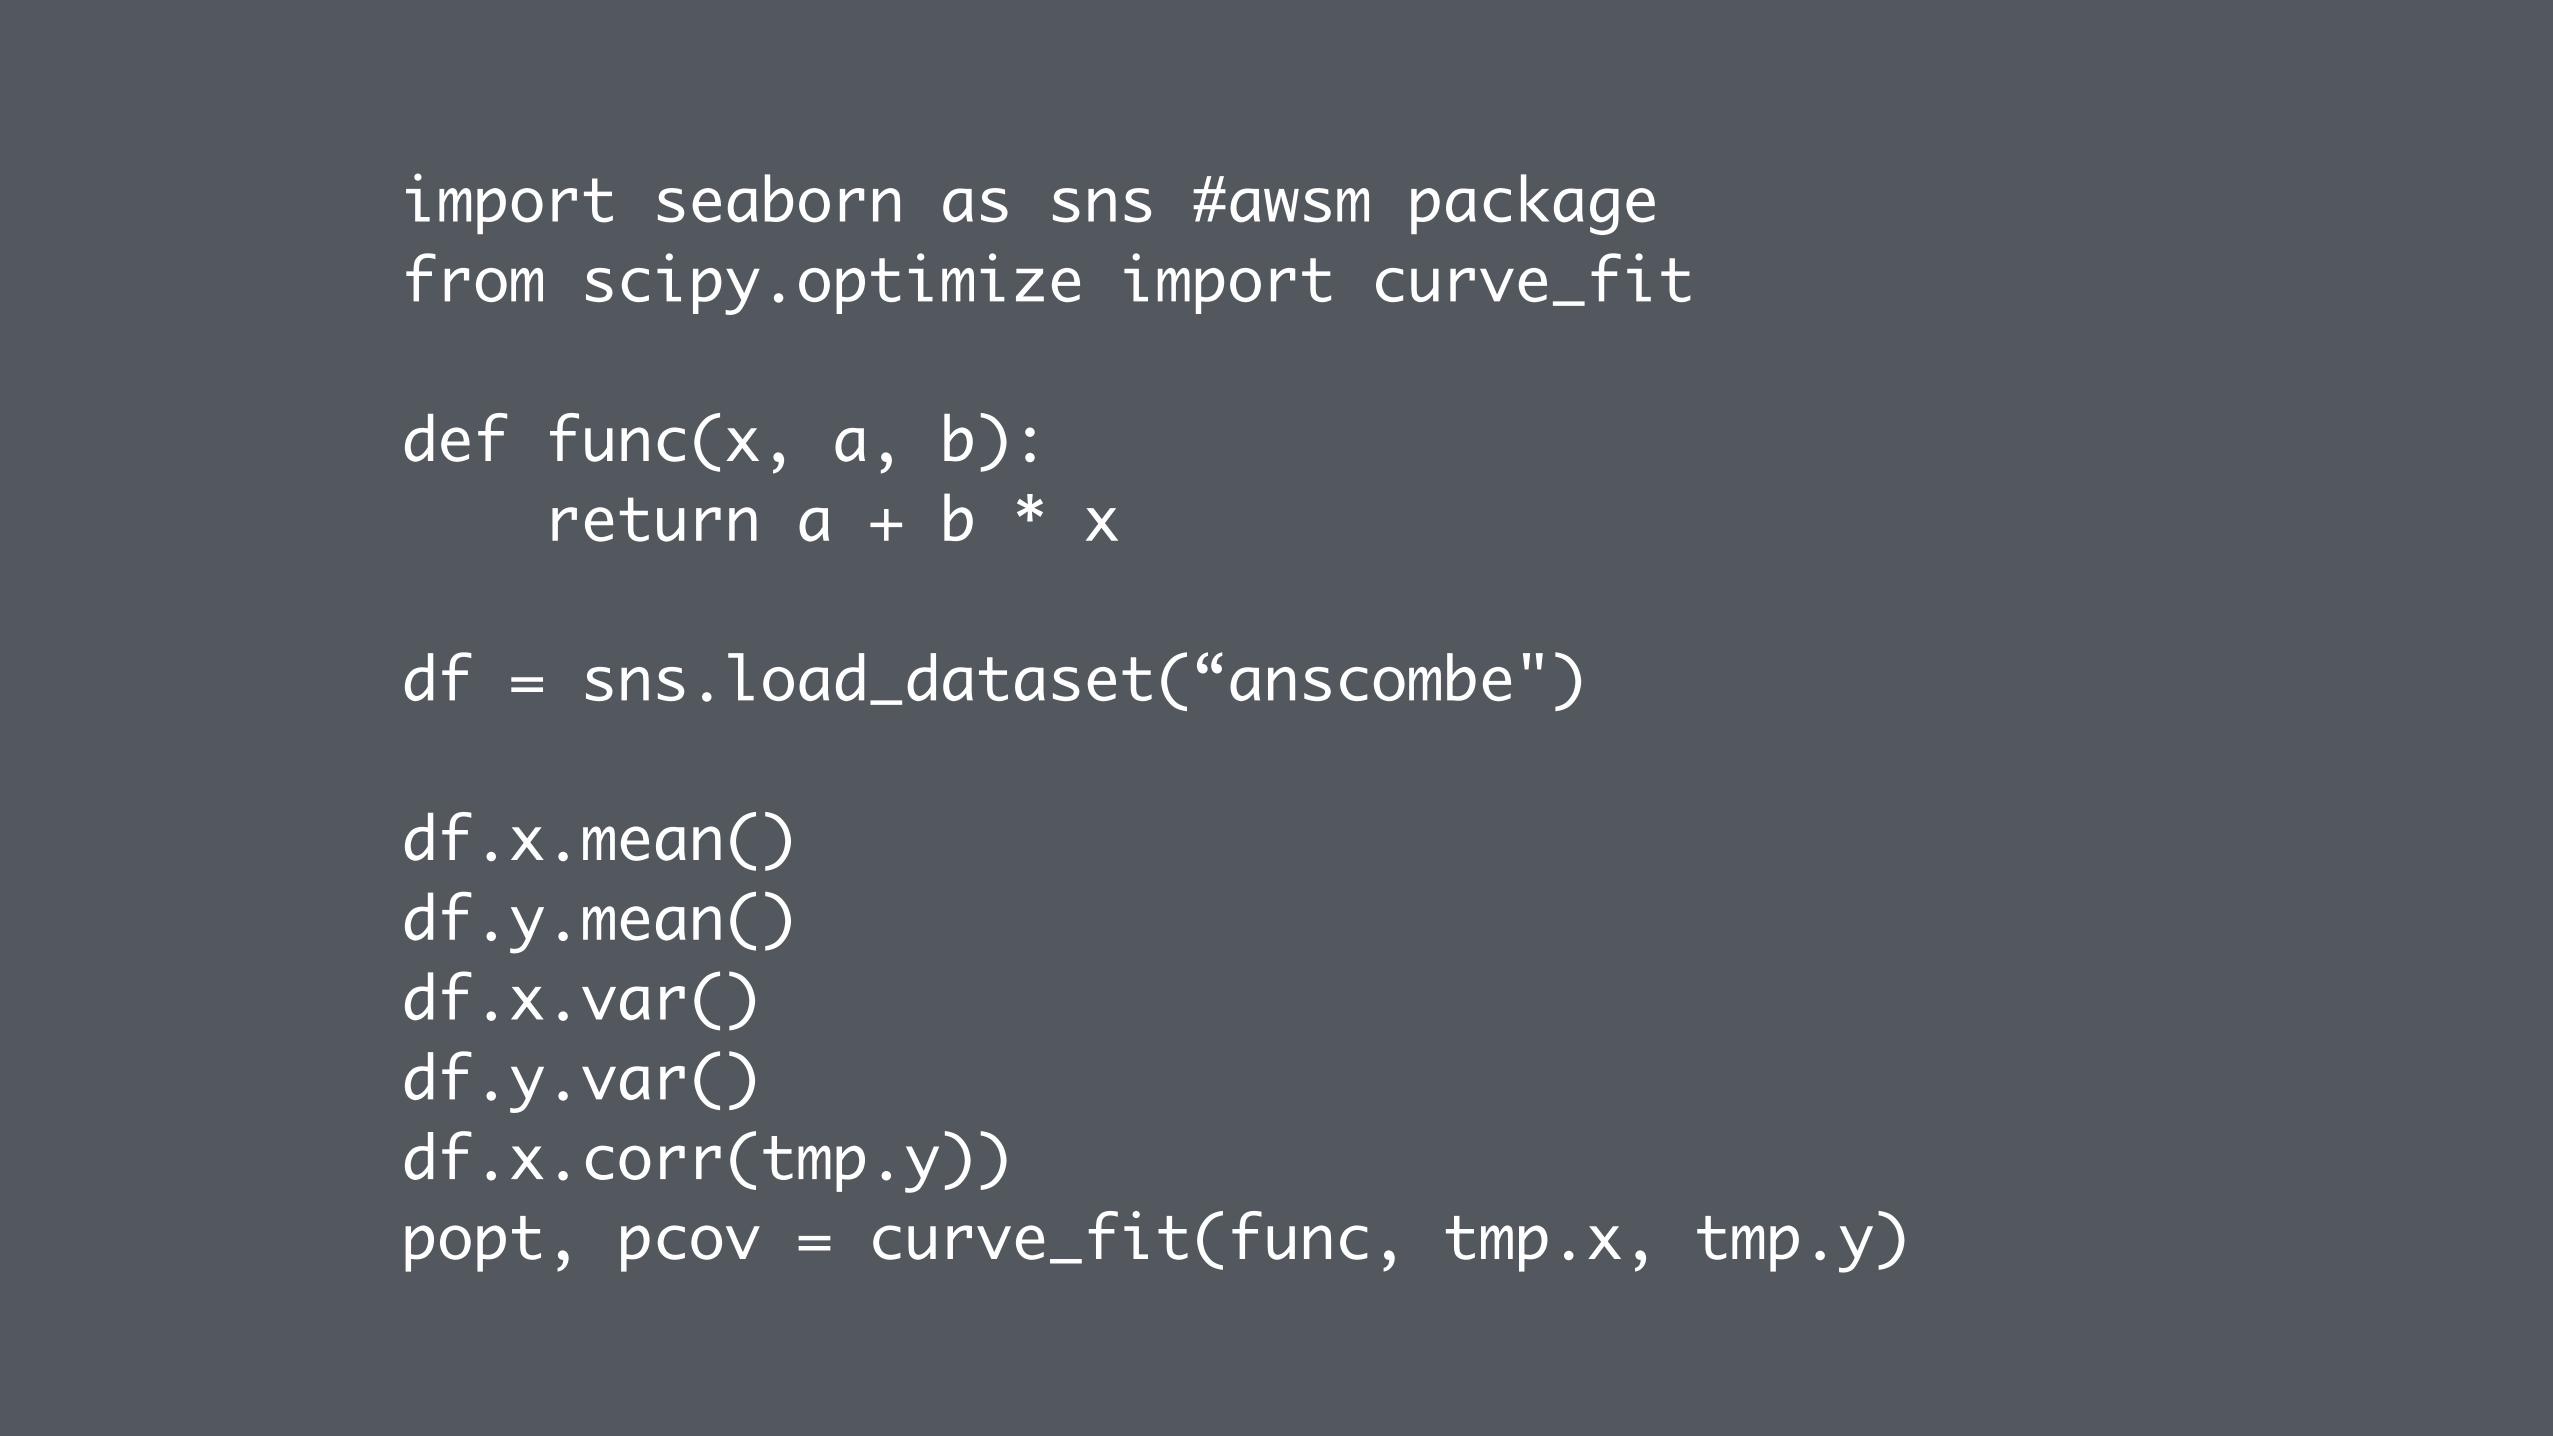
import seaborn as sns #awsm package from scipy.optimize import curve_fit
def func(x, a, b): return a + b * x
df = sns.load_dataset(“anscombe")
df.x.mean()df.y.mean()df.x.var()df.y.var()df.x.corr(tmp.y))popt, pcov = curve_fit(func, tmp.x, tmp.y)

Mean x: 9.0Mean y: 7.5Variance x: 11.00Variance y: 4.13Correlation between x and y: 0.816Linear regression coefficients: y = 3.00 + 0.50x
http://goo.gl/Zuw4Qe

2
4
6
8
10
12
14
y
dataVet I dataVet II
2 4 6 8 10 12 14 16 18 20x
2
4
6
8
10
12
14
y
dataVet III
2 4 6 8 10 12 14 16 18 20x
dataVet IV
dataVetIIIIIIIV

complexity

“Now if the function of man is an activity of soul in accordance with, or not without, rational principle, and if we say a so-and-so and a good so-and-so have a function which is the same in kind, e.g. a lyre-player and a good lyre-player, and so without qualification in all cases, eminence in respect of excellence being added to the function (for the function of a lyre-player is to play the lyre, and that of a good lyre-player is to do so well): if this is the case, [and we state the function of man to be a certain kind of life, and this to be an activity or actions of the soul implying a rational principle, and the function of a man to be the good and noble performance of these, and if any action is well performed when it is performed in accordance with the appropriate excellence: if this is the case,] human good turns out to be activity of soul in conformity with excellence, and if there are more than one excellence, in conformity with the best and most complete.”
Nicomachean Ethics, Aristotle

ಠ_ಠ

What did it all mean?

What did it all mean?
Virtue

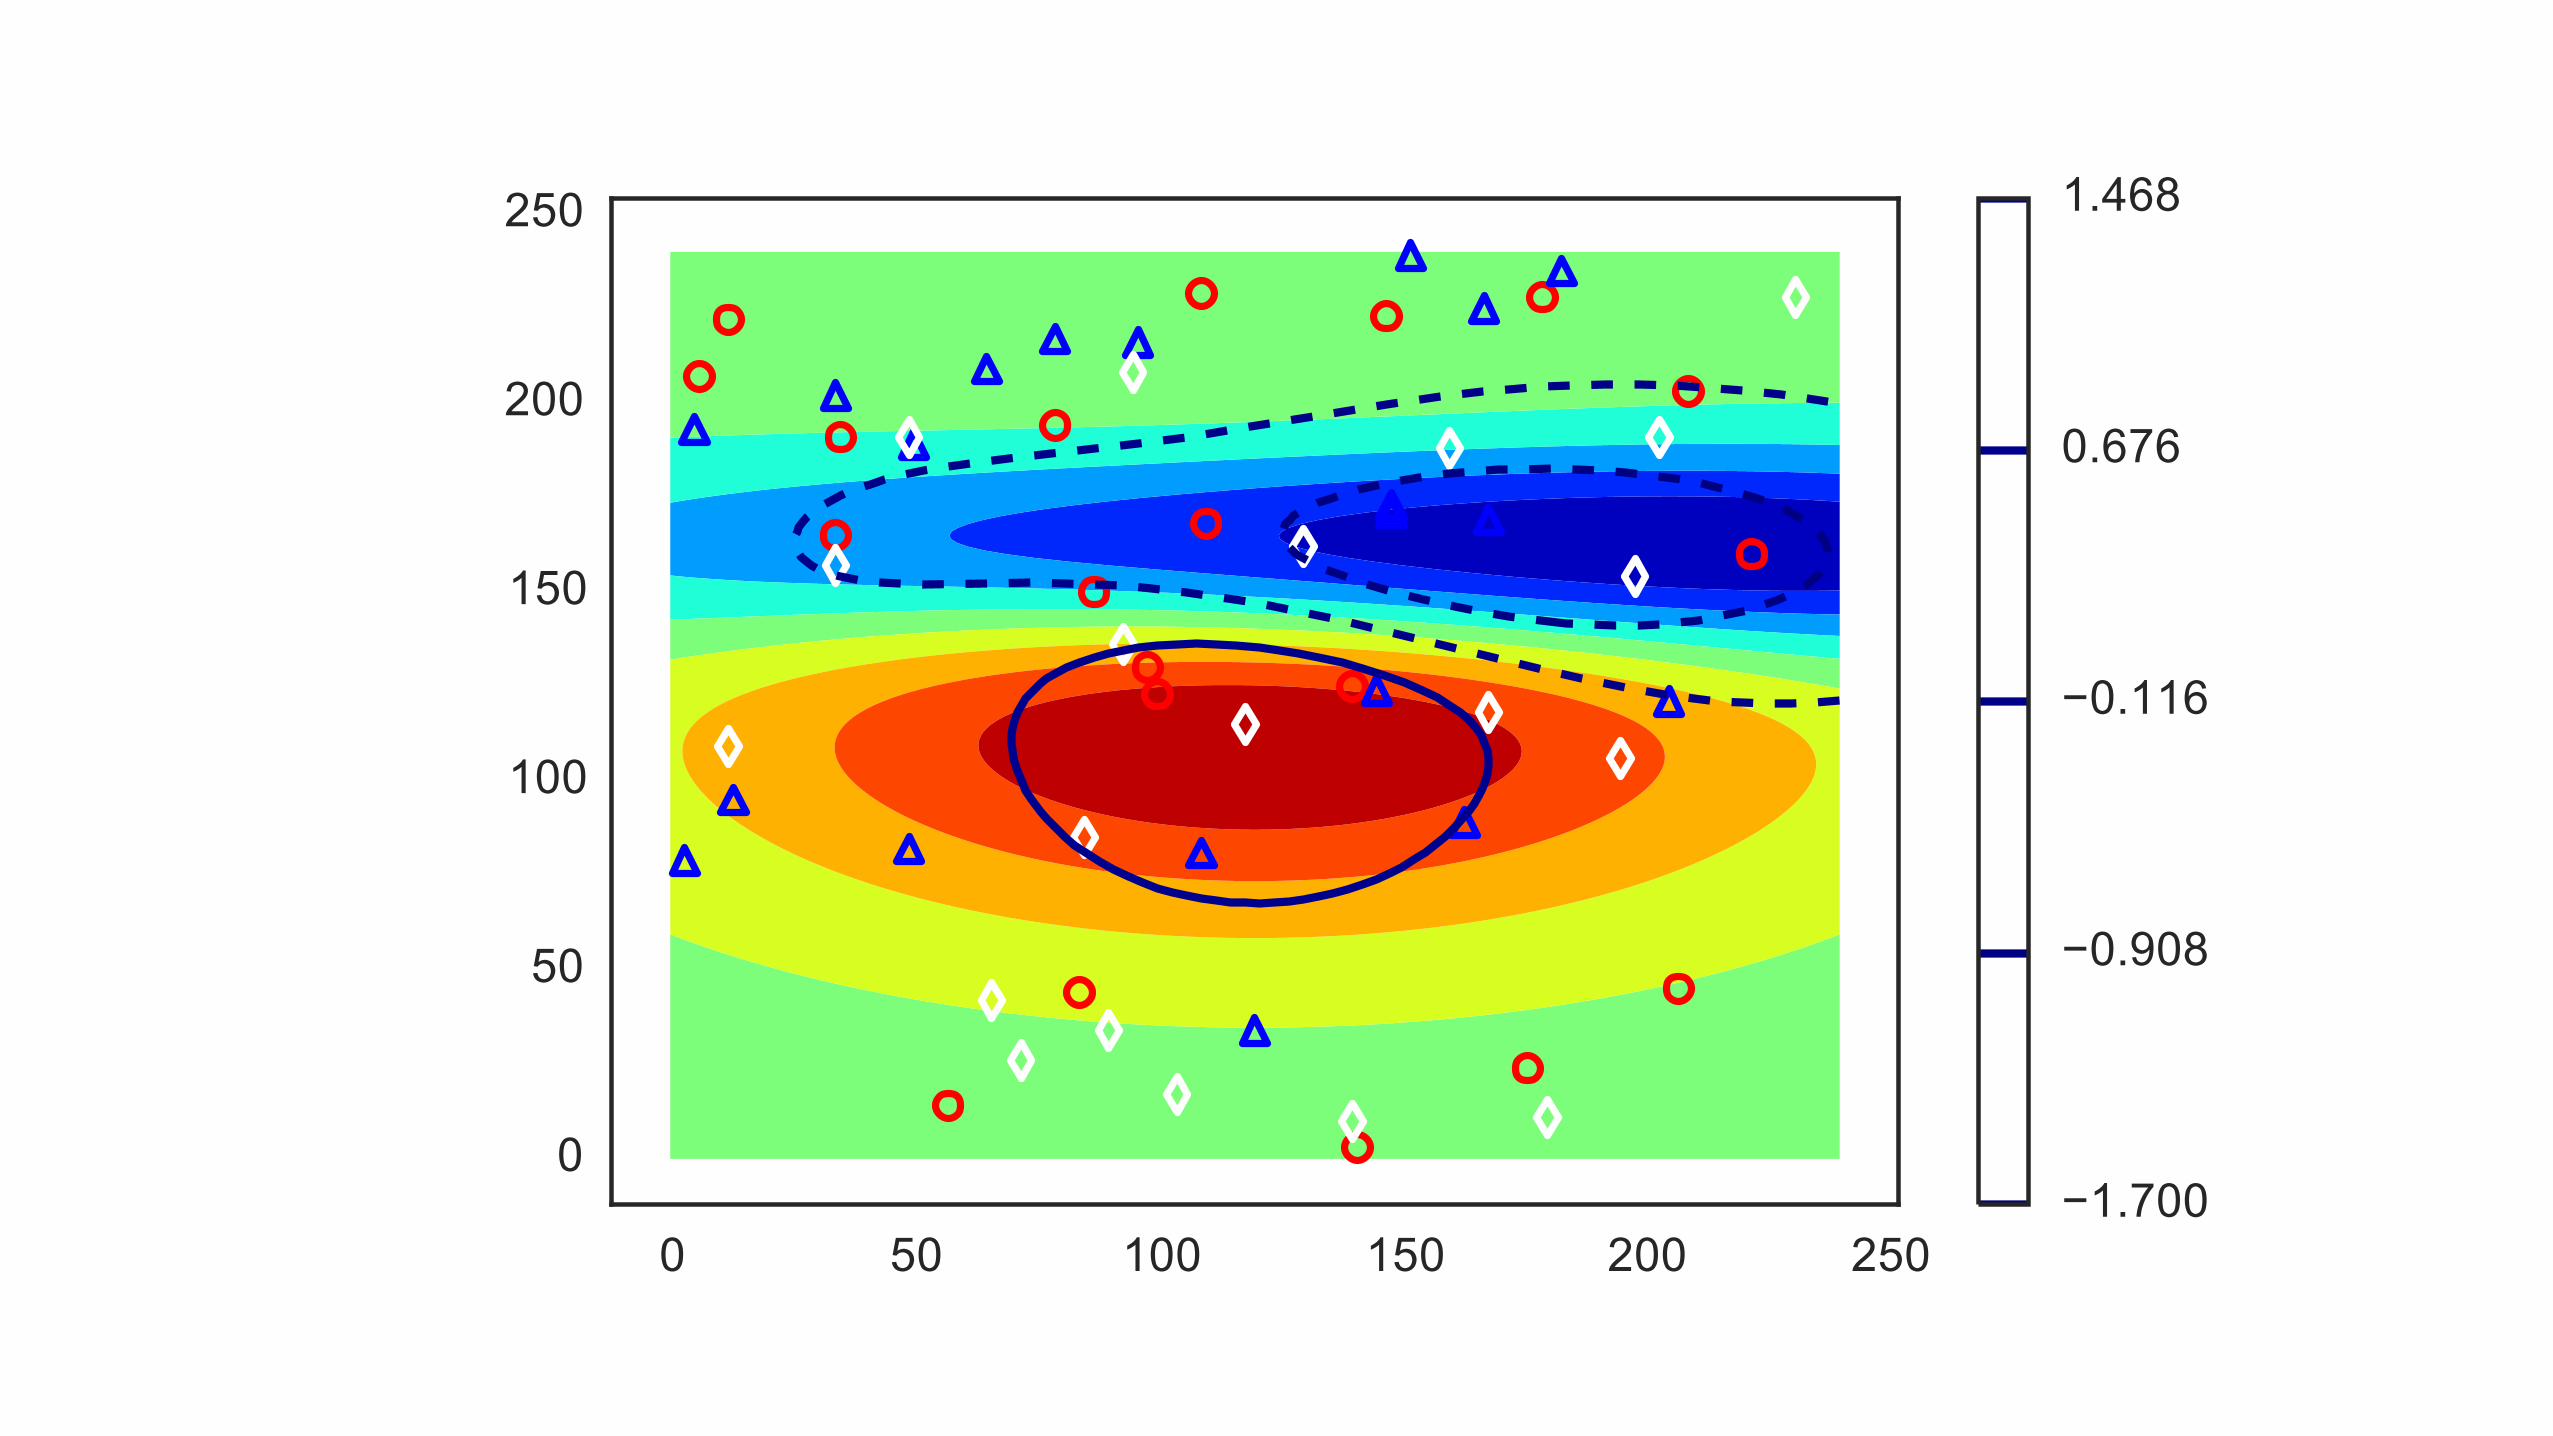
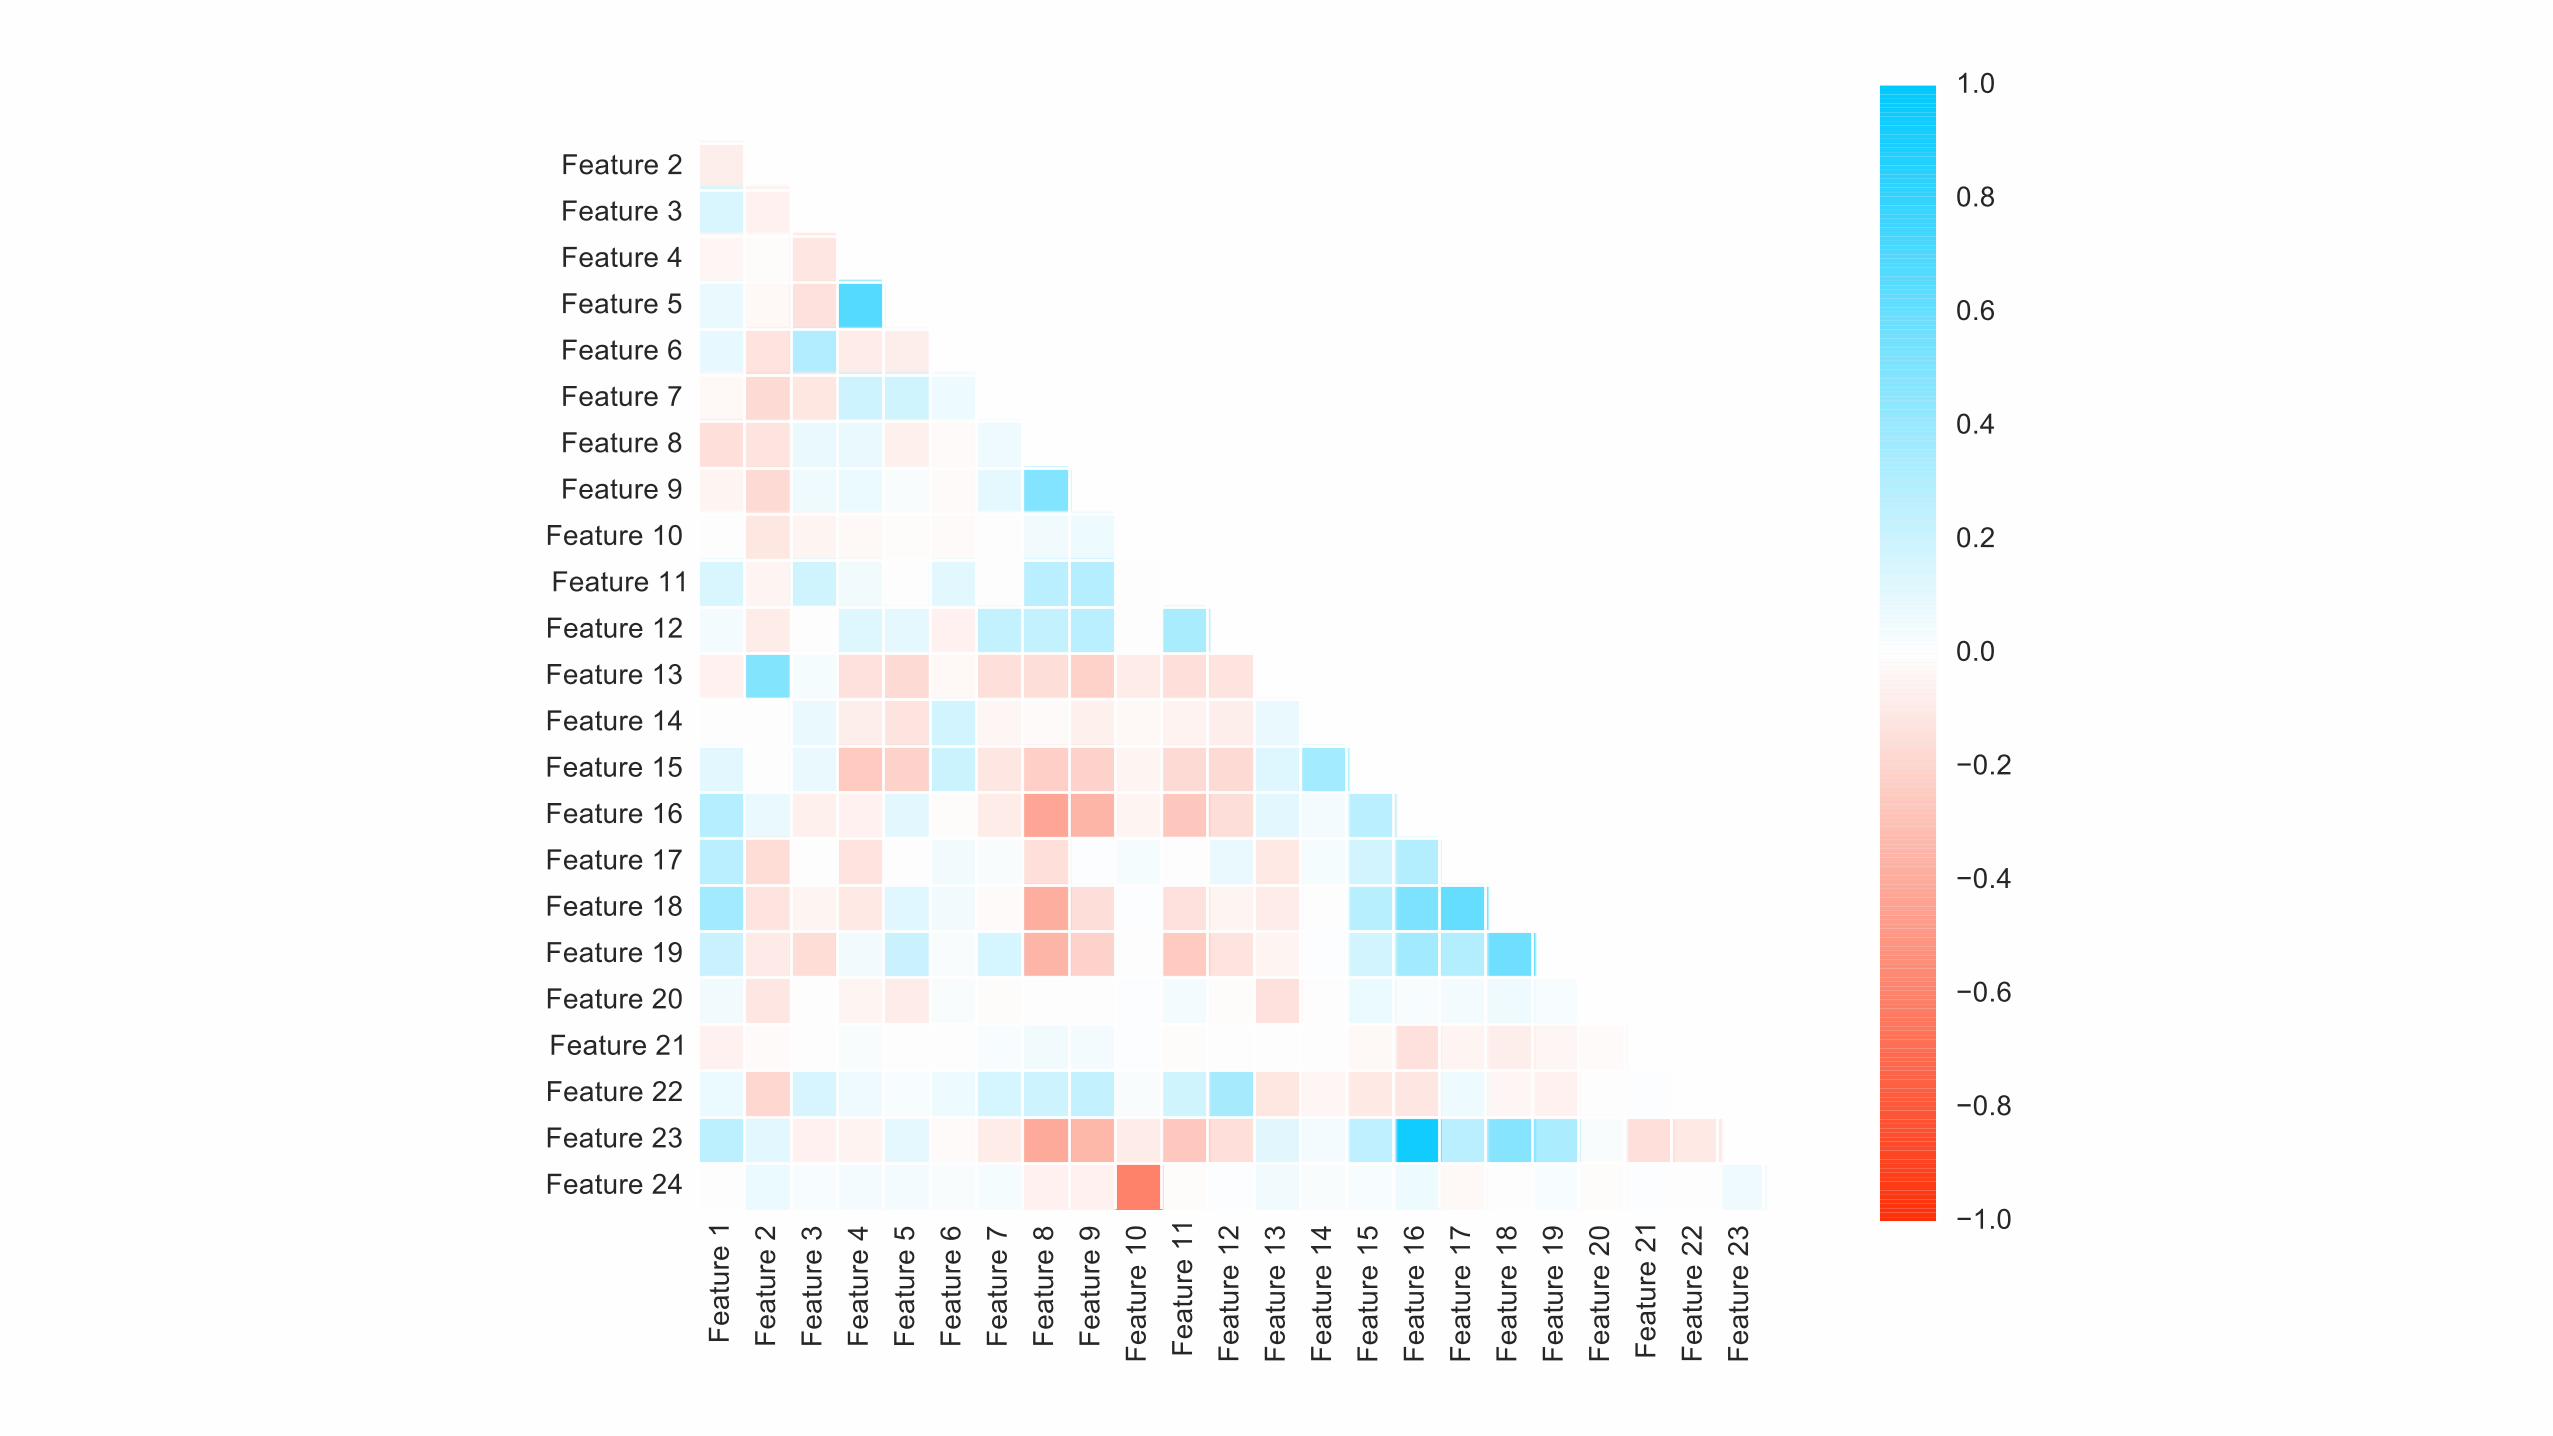
overly complex graphics is analogous to a run-on sentence
0 50 100 150 200 250
0
50
100
150
200
250
−1.700
−0.908
−0.116
0.676
1.468

(╯°□°)╯︵ ┻━┻

simplicity

Feature 1 Feature 2 Feature 3 Feature 4 Feature 5 Feature 6
Feature 7 Feature 8 Feature 9 Feature 10 Feature 11 Feature 12
Feature 13 Feature 14 Feature 15 Feature 16 Feature 17 Feature 18
Feature 19 Feature 20 Feature 21 Feature 22 Feature 23 Feature 24
Feat
ure
1
Feat
ure
2
Feat
ure
3
Feat
ure
4
Feat
ure
5
Feat
ure
6
Feat
ure
7
Feat
ure
8
Feat
ure
9
Feat
ure
10
Feat
ure
11
Feat
ure
12
Feat
ure
13
Feat
ure
14
Feat
ure
15
Feat
ure
16
Feat
ure
17
Feat
ure
18
Feat
ure
19
Feat
ure
20
Feat
ure
21
Feat
ure
22
Feat
ure
23
Feature 2
Feature 3
Feature 4
Feature 5
Feature 6
Feature 7
Feature 8
Feature 9
Feature 10
Feature 11
Feature 12
Feature 13
Feature 14
Feature 15
Feature 16
Feature 17
Feature 18
Feature 19
Feature 20
Feature 21
Feature 22
Feature 23
Feature 24−1.0
−0.8
−0.6
−0.4
−0.2
0.0
0.2
0.4
0.6
0.8
1.0

−4 −2 0 2 4 63C1
−4
−3
−2
−1
0
1
2
3
4
5
3C2
awesome D3.js tools

JavaScript SVG Canvas
D3.js
Vega
Lyra
Vegalite
Voyager Polestar
Credit: Jeff Heer

JavaScript SVG Canvas
D3.js
Vega
Lyra
Vegalite
Voyager Polestar
Credit: Jeff Heer


github.com/uwdata
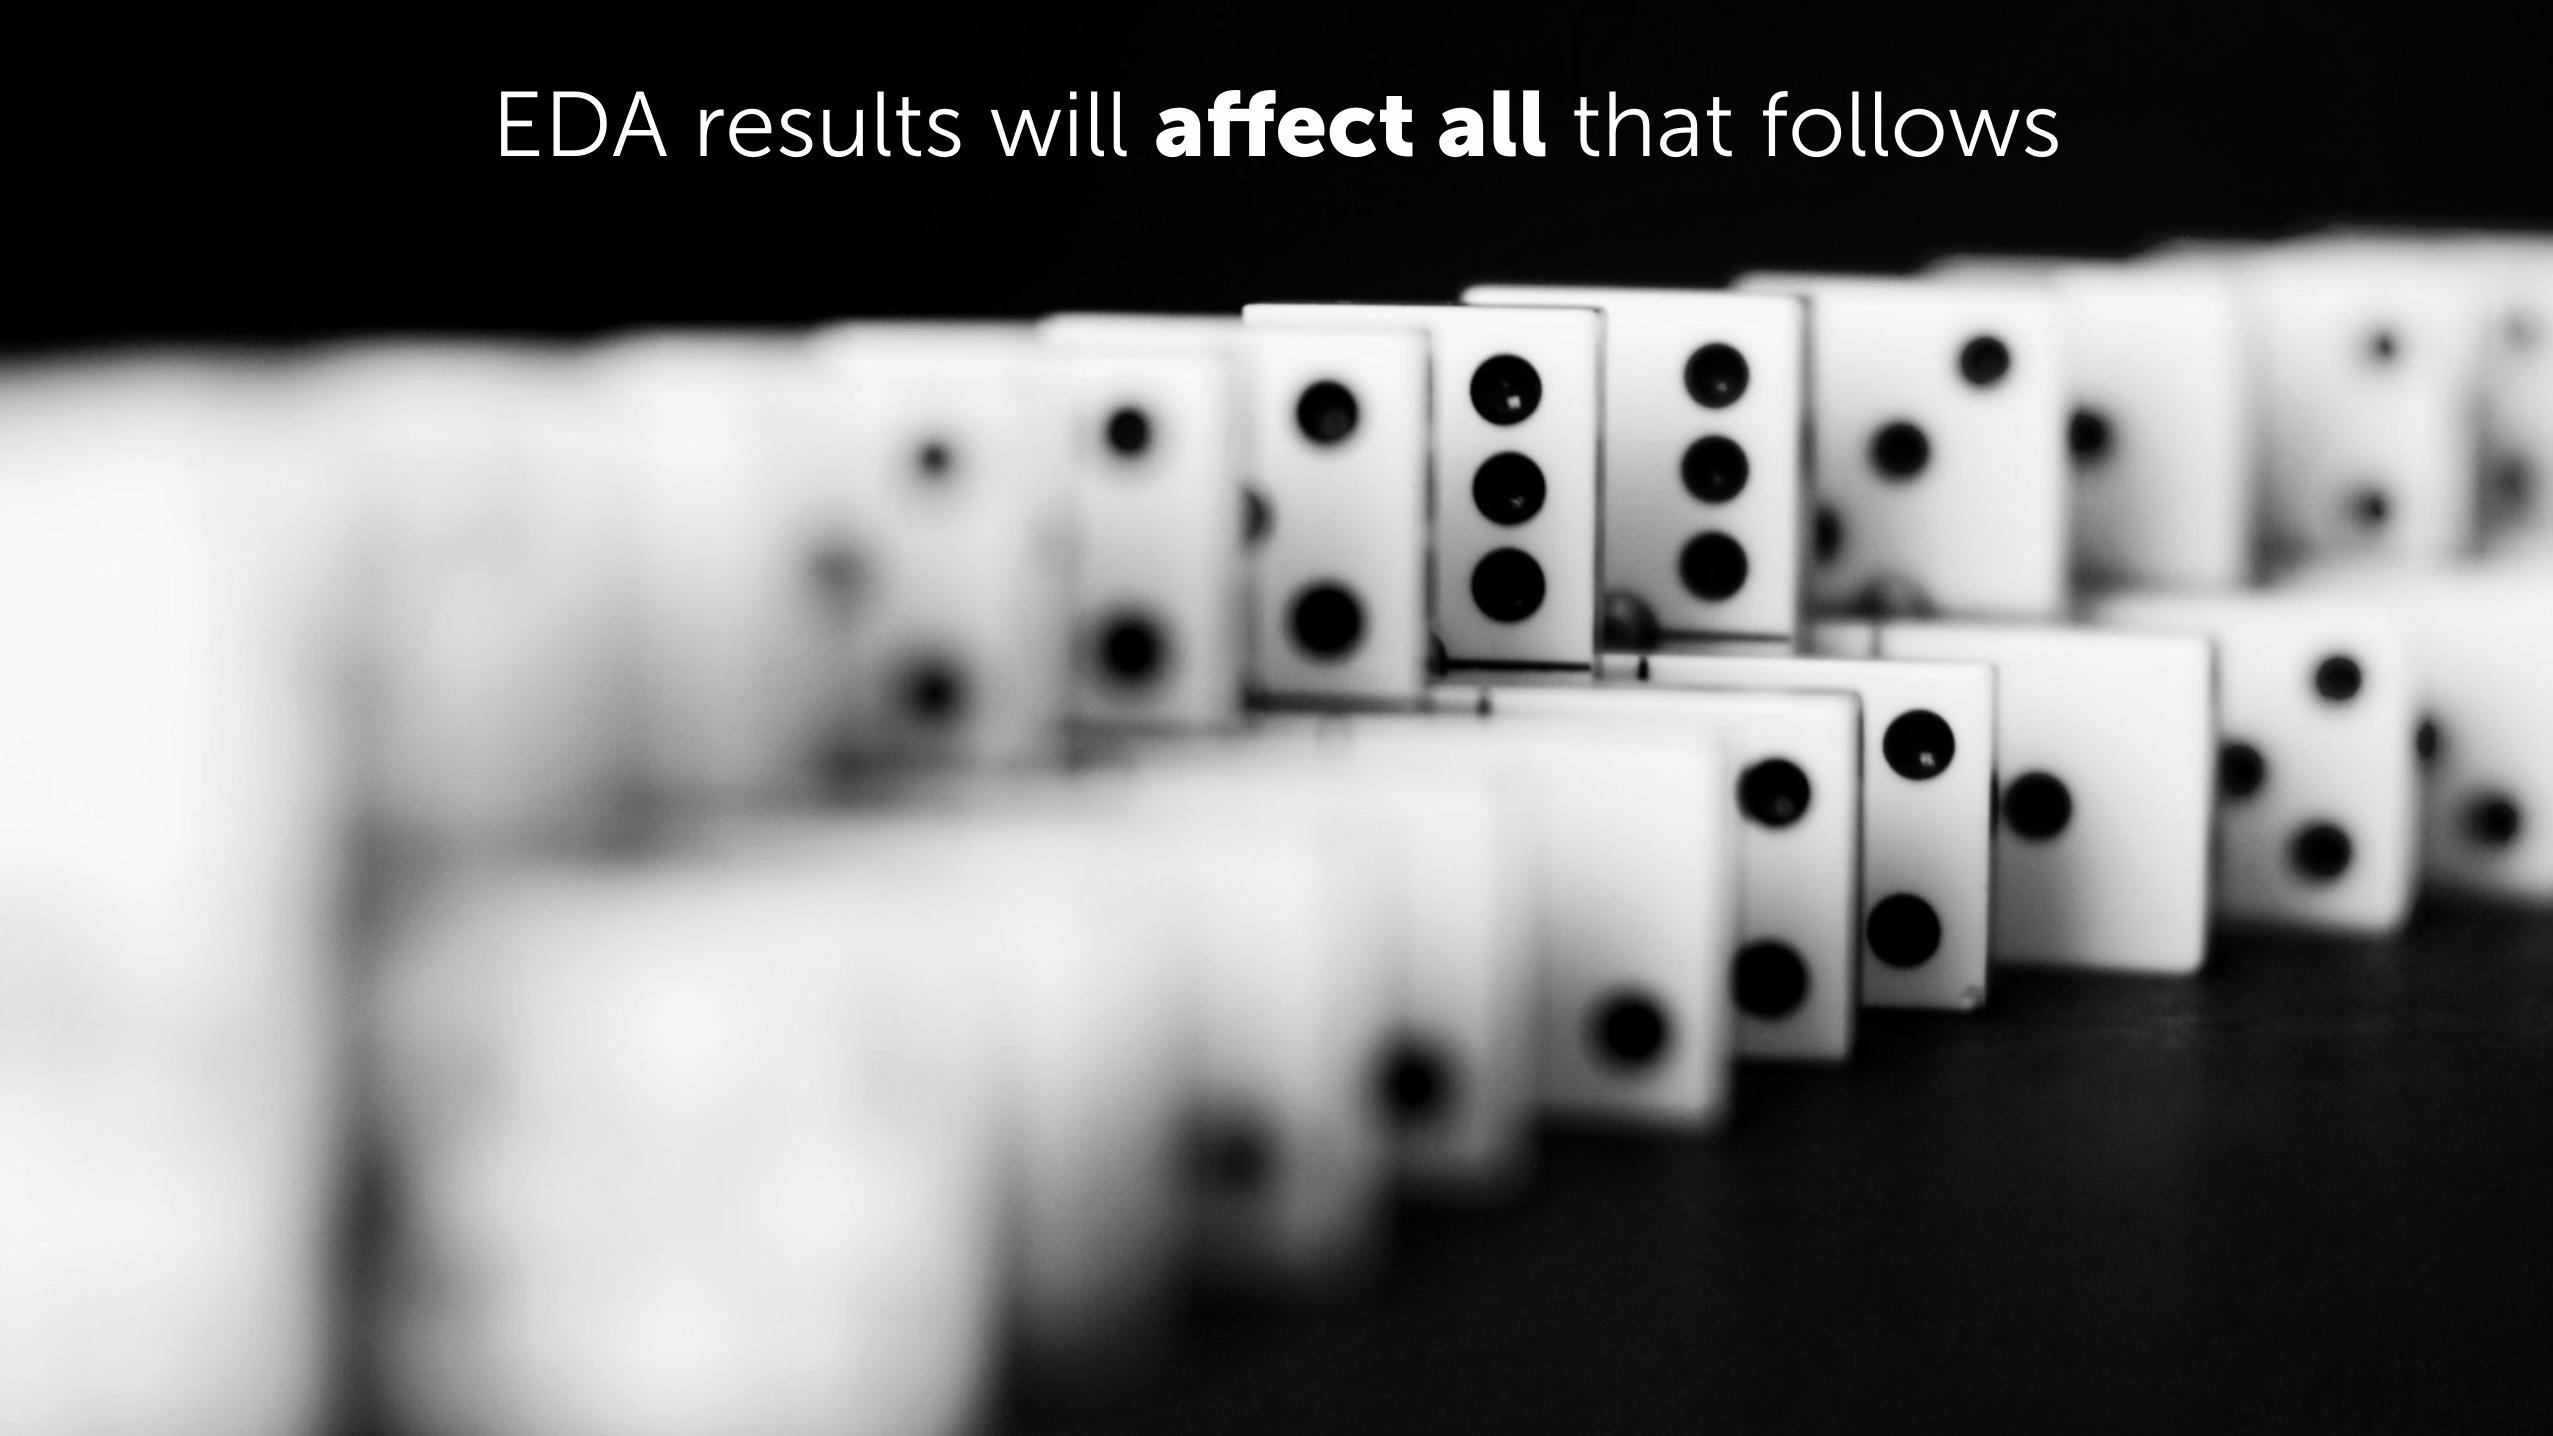
EDA results will affect all that follows
statistical design2

processing speed

faster technology

bigger data

Boundaries
Pushing

You have two options

design your data sample
plan and execute
hit the big red button and wait for the process
to finish


attention span

?

time cost
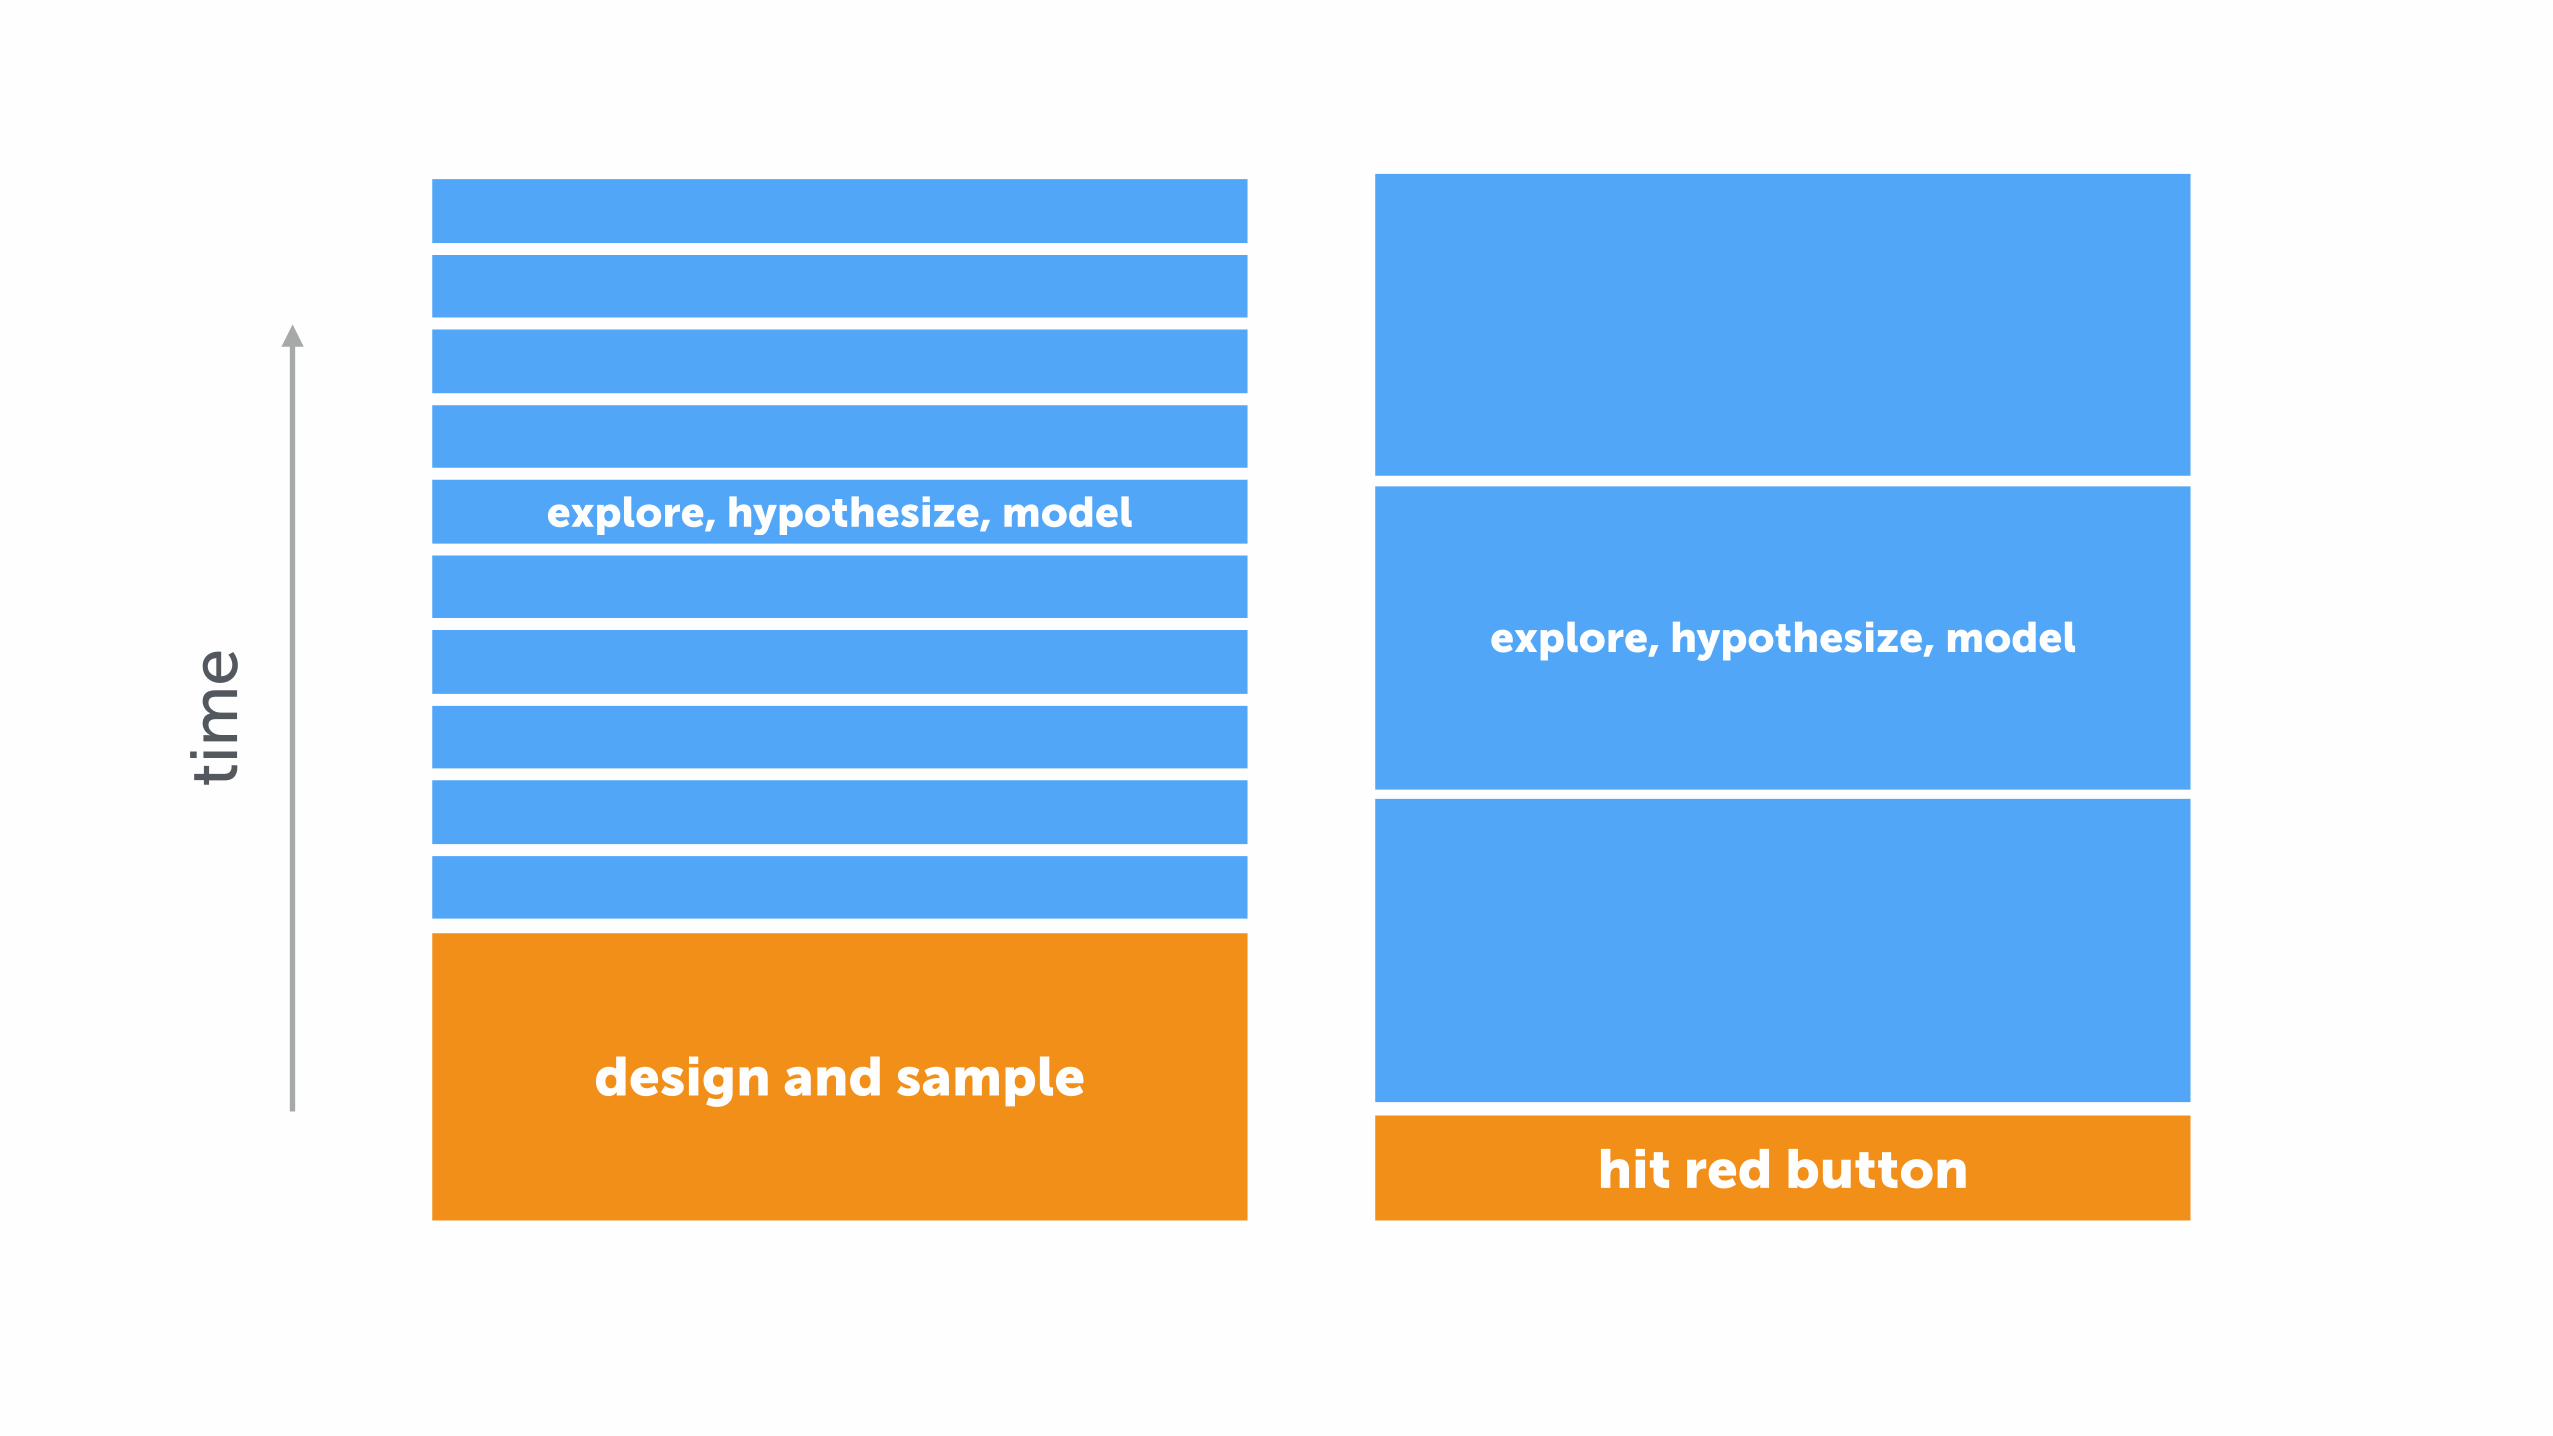
hit red button
design and sample
explore, hypothesize, model
explore, hypothesize, model
tim
e
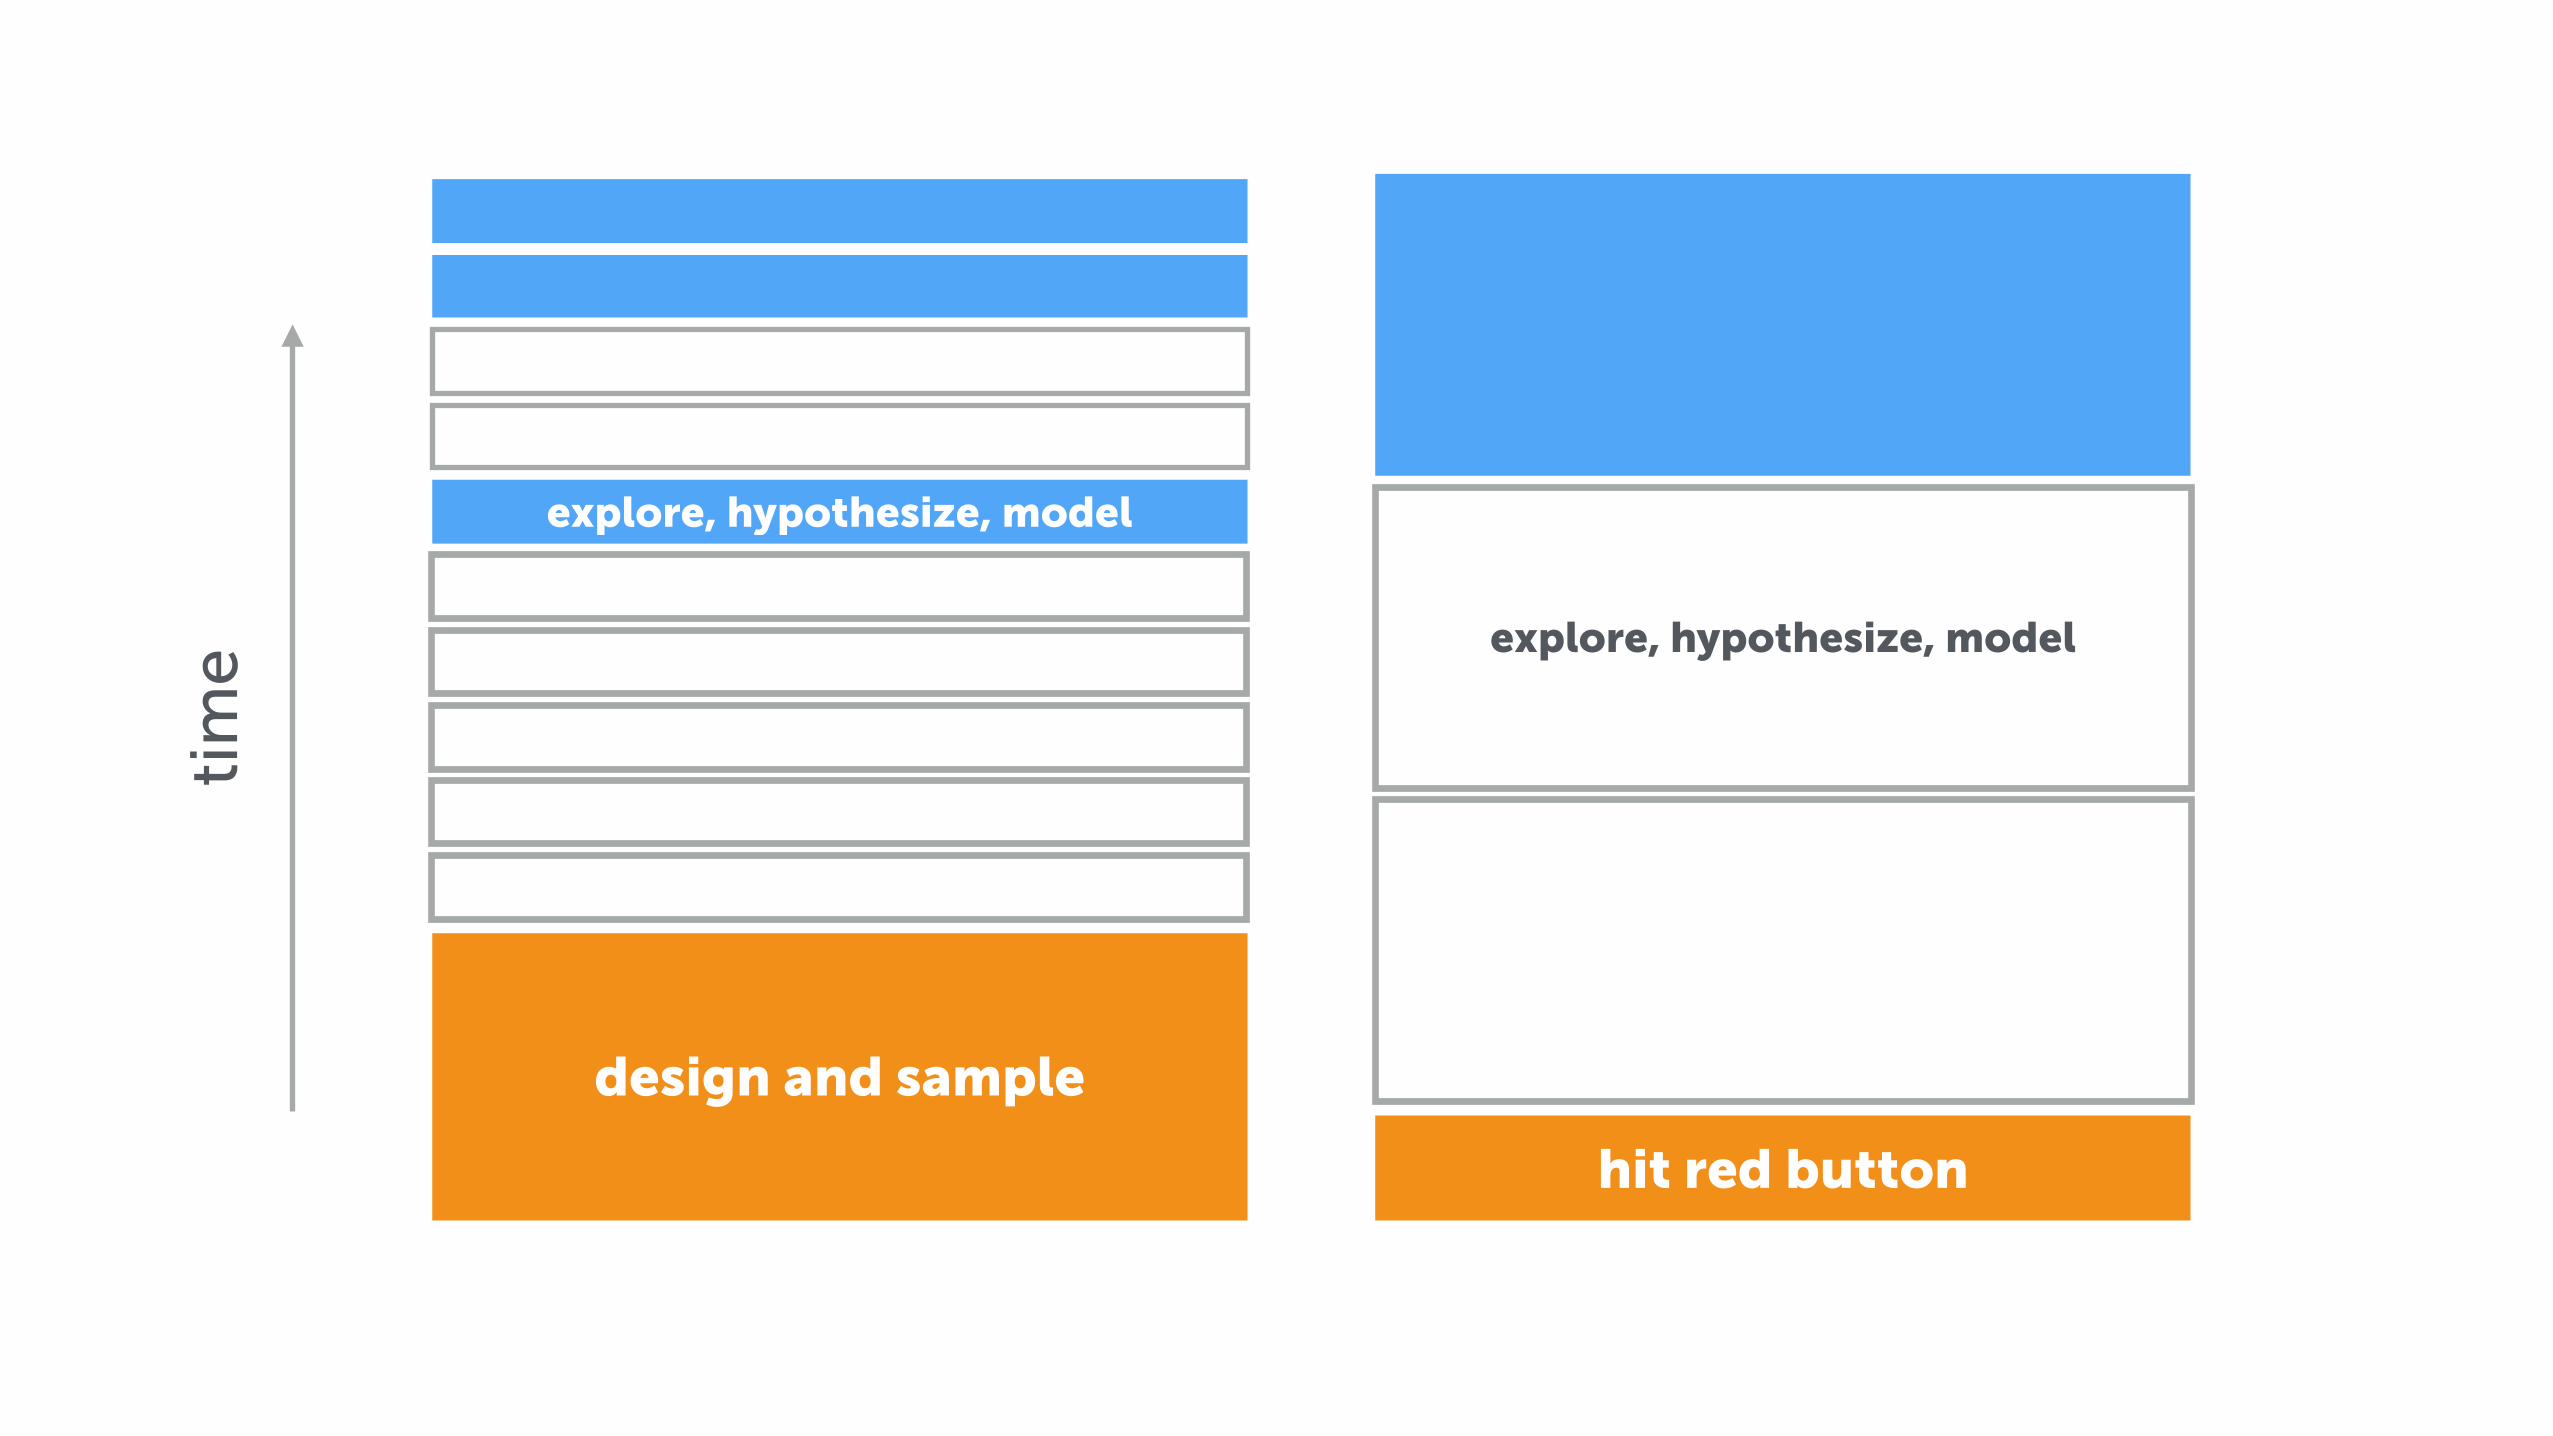
hit red button
design and sample
explore, hypothesize, model
explore, hypothesize, model
tim
e

fail frequently
learn fast

?
Related Documents