Grand Prixtensions 2000 Grand Prixtensions 2000

Grand Prixtensions 2000 March 20002 Prixtensions 2000-Overview The Australian Grand Prix Corporation runs the Melbourne Grand Prix races on the assertion.
Dec 31, 2015
Welcome message from author
This document is posted to help you gain knowledge. Please leave a comment to let me know what you think about it! Share it to your friends and learn new things together.
Transcript

Grand Prixtensions 2000Grand Prixtensions 2000

March 2000 2
Prixtensions 2000-OverviewPrixtensions 2000-Overview
The Australian Grand Prix Corporation runs the Melbourne Grand Prix races on the assertion that it is ‘good’ for the Victorian economy.
This presentation (Prixtensions 2000) addresses this assertion based on previous work in 1998 and further refinements in 1999 - 2001.
Key Points
1. Methodology/data
2. AGPC losses
3. Imports & License fees
4. Economic losses/gains

March 2000 3
Main Points: 1Main Points: 1
• Methodology & Data• Survey technique, visitor numbers,
expenditure levels are still questionable.
• The GPEE2 report repeats a claim made in the previous report that Victorians save less because of the Grand Prix.
• A claim rejected by most economists;
• Prof. Peter Forsyth - “To the extent that savings are reduced to fund current expenditure, future expenditure will be reduced” Letter to SAP, Head of Economics, Monash Uni, Cost-benefit/Tourism expert.
• AGPC loses money• AGPC 2000 Grand Prix lost $16.1m
rather than the $3.996m reported.
• AGPC has accumulated losses of $73.7m to date ($13.5m on AGPC data).
• AGPC F1 Grand Prix is expected to accumulate losses, by the end of the 2010 contract in the order of $231.3m ($53.5m on extrapolation of AGPC data).
(calculated on an accounting basis based on the existing trend)

March 2000 4
Main Points: 2Main Points: 2
• Imports & License fees• The AGPC pays out license fees (hidden
from the public), prize money and insurance.
• These are ‘imports’ which should be offset by the ‘exports’ earned from offshore.
• In the words of GPEE2* - ‘The ideal situation for major events is a net import content of at least zero or negative’. If net import content is positive then ‘in the absence of offsetting effects, there would be little to be gained from Victoria hosting
the event’. GPEE2, pg 4
• License fees are hidden-Trust Us!• *GPEE2 refers to the Grand Prix Economic
Evaluation 2000 by the Vic Government.
• Economic losses & gains• Dwyer/Forsyth ‘back of the envelope’
estimates imply a net surplus of $7.59m from F1 QAGP (if we accept GPEE2 data - which we do not & assuming that all the $7.59m accrues to Victoria - which it will not!).
• The cost of the promotion is the net cost of the FI QAGP.
• The cost of the promotion in 2000 is the cost of staging F1 QAGP. We estimate a cost of $16.142m (AGPC estimates $3.996m).
• Net benefit=$16.142m - $7.59m = a loss of $8.552m - there is a loss from the 2000 F1 Grand Prix.

The Main ReportThe Main Report
In subsequent pages we outline the analysis behind the main points in
the previous slides

March 2000 6
Associated DocumentsAssociated Documents
• Letter from Professor Peter Forsyth (see notes below).
• See Executive summary provided in written (ie non-powerpoint) format
• Copy of report by AGPC consultants on the economic impact of the 2000 F1 Grand Prix (GPEE2) - available from the Vic govt.
• SAP paper on survey methodology.
• See notes attached to some overheads.

March 2000 7
Sources: 1Sources: 1
• Papers prepared by Professor Forsyth et al.
• Sources:Dwyer, L., & Forsyth, P., Government Support for Inbound Tourism Promotion: Some Neglected Issues, Australian Economic Papers, December 1993, pg 355 - 374.
• Dwyer, L., & Forsyth, P., Impacts and Benefits of MICE Tourism: A Framework for Analysis, Tourism Economics, 1997, Volume 3, No 1, pg 21 - 38.

March 2000 8
Sources: 2Sources: 2• Dwyer, L., & Forsyth, P., Assessing the Benefits &
Costs of Inbound Tourism, Annals of Tourism Research, Volume 20, 1993, pg 751 - 768.
• Dwyer, L., and Forsyth, P., Estimating the Employment Impacts of Tourism to a Nation, Tourism Recreation Research, Volume 23, No 2, 1998, pg 3 - 12.
• Dwyer, L., & Forsyth, P., Modelling Tourism Jobs: Measuring the Employment Impacts of Inbound Tourism, Commonwealth Department of Tourism, 1994.
March 2000 9
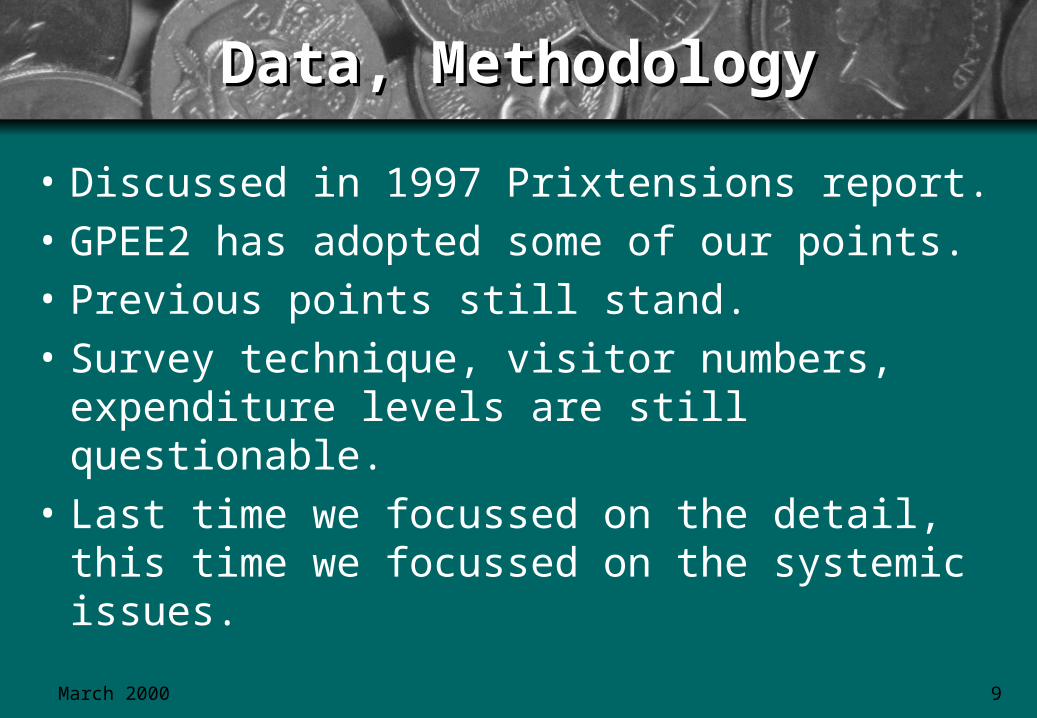
Data, MethodologyData, Methodology
• Discussed in 1997 Prixtensions report.
• GPEE2 has adopted some of our points.
• Previous points still stand.
• Survey technique, visitor numbers, expenditure levels are still questionable.
• Last time we focussed on the detail, this time we focussed on the systemic issues.

March 2000 10
Victoria saves less due to F1 Victoria saves less due to F1
• The GPEE2 report repeats a claim made in the previous report that Victorians save less because of the Grand Prix.
• A claim rejected by most economists.
• Prof. Peter Forsyth - “To the extent that savings are reduced to fund current expenditure, future expenditure will be reduced” Letter to SAP, Head of Economics, Monash Uni, Cost-benefit/Tourism expert.

March 2000 11
Summary of GPEE2 net impactSummary of GPEE2 net impact• International Visitors $13.2m @ an average $1497.7/visitor (7556
net additional visitors) (probably reduce significantly).• Interstate visitors $22.5m/visitor (15,996 net additional visitors) @
$1,346 per head (probably reduce significantly).• Event personnel/complementary expenditures $14.5m.• Induced tourism $8.1m.• Enhanced resident expenditure effect $11.5m.• Complementary expenditures $2m. • Direct import content $-0.4m (this becomes positive by about $4m
if $11.5m in savings is dropped as we suggest).• Repulsion tourism effect $-1.8m (they adopted one of our criticisms
but gave it a low value).
High but AGPC says: Trust us!!
March 2000 12
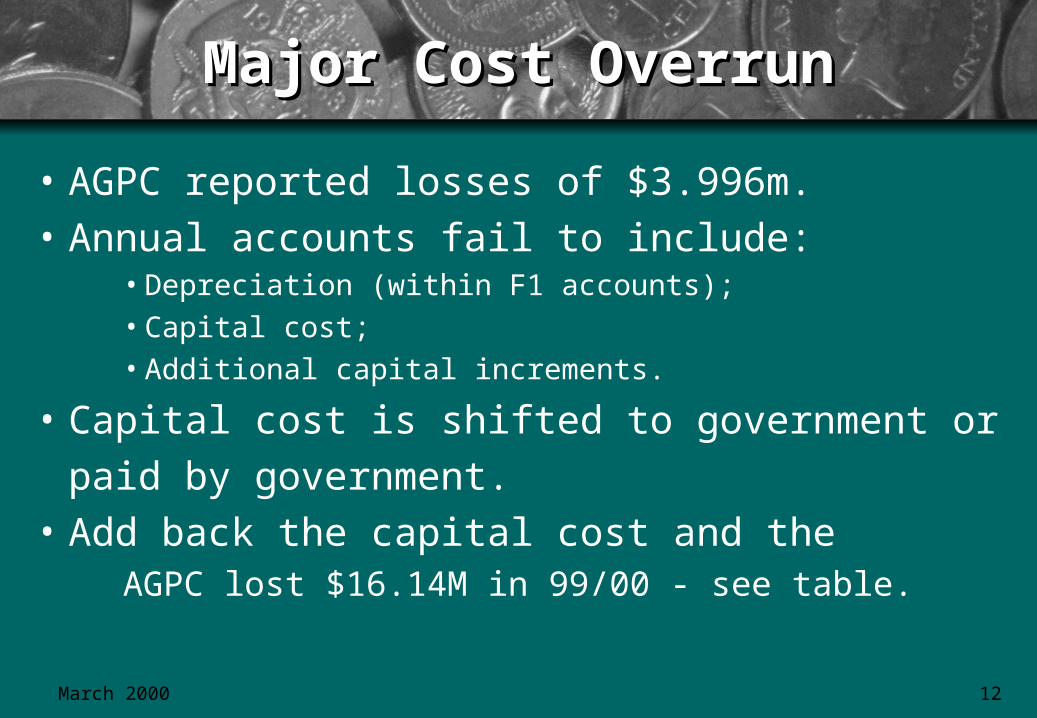
Major Cost OverrunMajor Cost Overrun
• AGPC reported losses of $3.996m.
• Annual accounts fail to include:• Depreciation (within F1 accounts);• Capital cost;• Additional capital increments.
• Capital cost is shifted to government or
paid by government.
• Add back the capital cost and theAGPC lost $16.14M in 99/00 - see table.

March 2000 13
AGPC Version ofAGPC Version ofthe Annual Acctsthe Annual Accts
AGPC Annual Report Data
1999/2000 pg 16
Formula One Grand Prix
94/95
$'000
95/96
$'000
96/97
$'000
97/98
$'000
98/99
$'000
99/00
$'000
Sales Revenue $0 $40,018 $37,895 $34,818 $34,791 $38,112
Total Revenue $55 $51,140 $48,470 $45,357 $44,109 $47,952
Total Expenditure $3,240 $52,886 $51,189 $47,155 $47,340 $51,948
Operating Surplus/Deficit (-$3,185) (-$1,746) (-$2,719 ) (-$1,798 ) (-$3,231 ) (-$3,996 )
Missing rows from the AGPCAnnual Report Table are:
Depreciation $m $? $? $? $? $? $?
Dividend for shareholders $? $? $? $? $? $?
Shareholder’s equity $ '000 $50,500 $50,500 $50,500 $50,500 $50,500 $50,500
Return on equity (%) xx% xx% xx% xx% xx% xx%
By missing rows we mean that the Formula 1 Grand Prix accounts need to include the data in the missing rows in order to provide a complete picture of the AGPC financial performance
Table 1

March 2000 14
Corrected AGPC AcctCorrected AGPC Acct
*Note - non-operating costs refer to costs not directly incurred by operations of the race but by the financial structure of the business.
Table 2
Table 3
Australian Grand Prix Corporation Version of the Accounts (6)
94/95 (5) 95/96 96/97 97/98 98/99 99/00Gross Revenue -$ 51,140,000$ 48,470,000$ 45,357,000$ 44,109,000$ 47,952,000$
Operating Costs -$ 52,886,000$ 51,189,000$ 47,155,000$ 47,340,000$ 51,948,000$ Non-operating costs -$ -$ -$ -$ -$ -$
Profit (loss) -$ (1,746,000)$ (2,719,000)$ (1,798,000)$ (3,231,000)$ (3,996,000)$
Capital Cost (4) 50,500,000$
Corrected Version of the Accounts
94/95 (5) 95/96 96/97 97/98 98/99 99/00Gross Revenue -$ 51,140,000$ 48,470,000$ 45,357,000$ 44,109,000$ 47,952,000$
Operating Costs -$ 52,886,000$ 51,189,000$ 47,155,000$ 47,340,000$ 51,948,000$ Non-operating costs -$ 11,081,667$ 12,503,799$ 12,454,392$ 11,978,411$ 12,146,731$
Profit (loss) -$ (12,827,667)$ (15,222,799)$ (14,252,392)$ (15,209,411)$ (16,142,731)$
Capital Cost (4) 50,500,000$

March 2000 15
The Forgotten CostsThe Forgotten Costs
Table 4
Non-operating costs per financial year not included in the AGPC Annual report calculation
Financial Year 94/95 (5) 95/96 96/97 97/98 98/99 99/00Depreciation(1) -$ 3,366,667$ 3,366,667$ 3,366,667$ 3,366,667$ 3,366,667$
Return on investment (2) -$ 7,575,000$ 7,575,000$ 7,575,000$ 7,575,000$ 7,575,000$ Government capital works costs (3) -$ -$ 659,132$ 1,237,725$ 797,843$ 1,110,304$
Other costs (7) -$ 140,000$ 903,000$ 275,000$ 238,901$ 94,760$
Total Non-operating Costs -$ 11,081,667$ 12,503,799$ 12,454,392$ 11,978,411$ 12,146,731$
Note (1) Depreciation assumed to be a return of 1/15th of the original capital expenditure, each year for 15 years between 1996 and 2010.Note (2) Return on investment is calculated as being 15% of the capital value of the investment which should be paid to shareholders
(ie taxpayers, government) each year.Note (3) Government has been making 'below the line' contributions to QAGP capital expenditures
as a result we have added these expenditures back as additional non-operating costs.Note (4) The government commissioned report into the economics of the Grand Prix (Grand Prix Economic Evaluation 2000 (GPEE)) used this updated figure
in year 2000 dollar terms. We suspect the figure is higher than this but are happy to illustrate our point using thier figures sinceit gives a 'conservative' outcome.
Note (5) The costs incurred in 1994/95 have been assumed to have been capitalised (that is included in the capital cost figure of $50.5m).Note (6) The cost data has been taken from the AGPC Annual Report 1999/00 page 16.Note (7) See the table of other costs compiled by the Save Albert Park Group.

March 2000 16
Other costs by componentOther costs by componentTable 5
Additional Costs compiled by the Save Albert Park group not considered under the AGPC Formula 1 accounting framework
Other Operating Costs 94-95 95-96 96-97 97-98 98-99 99-00 Total 93-00
Compaction compensation (Budget) (1) -$ 100,000$ -$ -$ -$ -$ 100,000$ Net costs to other public sector agencies (Aud-G) (2) -$ -$ 778,000$ -$ 211,000$ 50,300$ 1,039,300$
Parks Victoria -direct costs (PV) (3) -$ 40,000$ 125,000$ 75,000$ 27,901$ 44,460$ 312,361$ Police (Audit-General report) (4) -$ -$ -$ 200,000$ -$ -$ 200,000$
Total (5) -$ 140,000$ 903,000$ 275,000$ 238,901$ 94,760$ 1,651,661$
The following notes are listed by year and then by note number.95/96:
Note (1) $100,000 compaction compensation carried by Dept of State Development ($161,000 paid in 94/95); (Source:Report of the Auditor-General on the Statementof Financial Operations, 1995-96, p. 148).
Note (3) $40,000 direct costs to Parks Victoria (information provided by Minister Garbutt's office).96/97
Note (2) $778,000 net costs of Public Transport Corp.(Report of the Auditor General on the Govt's Annual Financial Statement , p.129.Note (3) $125,000 direct costs to Parks Victoria (source as above).
97/98Note (4) $200,000 estimated police costs - Auditor-General's Report on Victorian Govt's Finances, 1997-98 (p.99) reported total
costs incurred by Victoria Police for two GP events as $240,000.Note (3) $75,000 direct costs to Parks Victoria.
98/99Note (3) $27,901 directs to Parks Victoria.
$7,000 VicRoads (Report of the Auditor-General on Vic Govt's Finances, 1998-99, p. 56).$99,000 costs incurred by two tram businesses (as above).$105,000 incurred by Dept of Infrastructure (transport related) (source as above).99/00
Note (3) $44,460 direct costs to Parks Victoria (source as above).$24,500 incurred by VicRoads (Report of the Auditor-General on the Finances of the State of Victoria, 1999-2000, p. 56).$25,800 incurred by Dept of Infrastructure for promotion of public transport (source as above).
Note (5) This does not include public agency sponsorship provided to the Grand Prix.Such sponsorship is controversial and it is likely that some of it should be attributable to the Grand Prix.

March 2000 17
Additional capital costsAdditional capital costsTable 6
Table 7
Additional capital costs compiled from AGPC annual accounts (9)
Capital costs not elsewhere included 94-95 95-96 96-97 97-98 98-99 (note 3) 99-00 Total 93-00
AGPC race infrastructure (5) -$ -$ -$ 78,246$ 384,681$ 831,188$ 1,294,115$ AGPC capital works in Albert Park (6) -$ -$ 187,633$ 1,005,003$ 215,319$ 160,812$ 1,568,767$
Other capital-related items (7) -$ -$ 471,499$ 154,476$ 197,843$ 118,304$ 942,122$
Total -$ -$ 659,132$ 1,237,725$ 797,843$ 1,110,304$ 3,805,004$
Note (5) Source AGPC Annual reportsNote (6) Source AGPC Annual reportsNote (7) Source AGPC Annual reportsNote (8) This does not include our revisions of the original capital cost dataNote (9) These are paid by government but not attributed to the Grand Prix though they appear to be used by, and to the benefit, of the Grand Prix
Total Additional Capital costs and other agency costs
94-95 95-96 96-97 97-98 98-99 (note 3) 99-00 Total 93-00
Total other agency costs -$ 140,000$ 903,000$ 275,000$ 238,901$ 94,760$ 1,651,661$ Total capital costs -$ -$ 659,132$ 1,237,725$ 797,843$ 1,110,304$ 3,805,004$
Total Additional Costs from both sources -$ 140,000$ 1,562,132$ 1,512,725$ 1,036,744$ 1,205,064$ 5,456,665$

March 2000 18
AGPC F1 in the redAGPC F1 in the red
• AGPC 2000 Grand Prix lost $16.1m rather than the $3.996m reported.
• AGPC has accumulated losses of $73.7m to date ($13.5m on AGPC data).
• AGPC F1 Grand Prix is expected to accumulate losses, by the end of the 2010 contract in the order of $231.3m ($53.5m on extrapolation of AGPC data).
(calculated on an accounting basis based on the existing trend)

March 2000 19
AGPC Version of AccountsAGPC Version of Accounts
AGPC Version of Accounts
$(10,000,000)
$-
$10,000,000
$20,000,000
$30,000,000
$40,000,000
$50,000,000
$60,000,000
94/95 (5) 95/96 96/97 97/98 98/99 99/00
Financial Years
Dollars
Gross Revenue
Total costs (operating + non-operating)
Profit (loss)
Chart 1

March 2000 20
Corrected version of AccountsCorrected version of AccountsCorrected version of Accounts
$(30,000,000)
$(20,000,000)
$(10,000,000)
$-
$10,000,000
$20,000,000
$30,000,000
$40,000,000
$50,000,000
$60,000,000
$70,000,000
94/95 (5) 95/96 96/97 97/98 98/99 99/00
Financial Years
Gross Revenue
Total costs (operating + non-operating)
Profit (loss)
Chart 2

March 2000 21
AGPC ‘loss’ vs ‘real’ lossesAGPC ‘loss’ vs ‘real’ lossesProfit Comparison
$(18,000,000)
$(16,000,000)
$(14,000,000)
$(12,000,000)
$(10,000,000)
$(8,000,000)
$(6,000,000)
$(4,000,000)
$(2,000,000)
$-
94/95 (5) 95/96 96/97 97/98 98/99 99/00
Financial Years
AGPC Profit (loss)
Actual Profit (loss)
Chart 3

March 2000 22
Imports=hidden license feesImports=hidden license fees
• The AGPC pays out license fees (hidden from the public), prize money and insurance.
• These are ‘imports’ which should be offset by the ‘exports’ earned from offshore.
• In the words of GPEE2 - ‘The ideal situation for major events is a net import content of at least zero or negative’. If net import content is positive then ‘in the absence of offsetting effects, there would be little to be gained from Victoria hosting the event’. GPEE2, pg 4

March 2000 23
Show Us The Money!!!!!Show Us The Money!!!!!
• License fees are not disclosed - import & export details not made available
• If the import/export details are wrong (license fees understated) this event becomes a net importer and the economic benefits are reduced - possibly substantially
• We are asked to take this on trust!
• License fees need to be disclosed

March 2000 24
TV payments to F1 HQTV payments to F1 HQ
• Payments (net) for TV license fees do not appear to be included - these go directly from networks to Formula One overseas and would be imports.
• If they are significant GP imports would exceed exports by a significant margin undermining the alleged economic gains to Victoria such that ‘there would be little to be gained from Victoria hosting the event’.GPEE2, pg 4

March 2000 25
Economic benefitsEconomic benefits
• F1 rationale - good for the Victorian economy.
• GPEE2 claims economic benefit through increased economic activity ($130.7m).
• Is this true?
• Depends on:– The foregone project;– The ‘cut-off’ point– Definition of economic benefit.

March 2000 26
What did we give up?What did we give up?
• The foregone project - GPEE2 suggests we gave up some public works.
• We suggest that the Kennett Govt would have added to the budget surplus, and lent money to the private sector via the market creating a new or bigger business - ie focus on economic growth.
• If they wanted to add value to tourism they could also have underwritten a overseas tourism campaign.

March 2000 27
Business vs Party optionBusiness vs Party option
• In the previous report we assessed the economic impact of a ‘business’ option.
• The business option (investing in industry) delivers benefits that exceed those from the ‘party’ or F1 option.
• Why does the ‘business’ option deliver more than the ‘party’ option? The business option ‘creates’ wealth through uniting capital with a business enterprise - in the next section we map out the trade-off posed by the QAGP.

March 2000 28
The Grand Prix trade-offThe Grand Prix trade-off
• GPEE2 identifies five revenue sources ‘unlocked’ by the event.
• The business option identifies what could have been - profits/return on investment & recouped capital expenditure as sources of new ‘additional expenditure’ given up in pursuit of F1.

March 2000 29
AGPC: costs & revenuesAGPC: costs & revenues
Capital investment
= $50.5m (assumed low estimate from GPEE2)
Gross revenue
$
Categories of expenditure
Diagram 1
Not drawn to scale
Net additional revenue claimed by GPEE2 to provide the source of economic benefits
Operating cost for QAGP
‘Apparent’ loss on QAGP paid by government
Outline of the QAGP
‘business’
Missing profits & depreciation
Actual losses suffered by govt
A
C
B
D

March 2000 30
Key policy question?Key policy question?
• How much should you spend in government subsidy to ‘suck’ expenditure into Victoria before the cost of the subsidy outweighs the net benefit?
• This question is not answered by GPEE2 which is why it is an inadequate explanation.
• According to diagram 1 govt spends the yellow part to earn the extra revenues (maroon) which we believe is offset by the foregone profits and depreciation (orange).

March 2000 31
GPEE2 claims GPEE2 claims ‘net additional revenue’‘net additional revenue’
•GPEE2 claims economic benefit derived from additional revenue comprising:
–Retained Victorian expenditure;–Ticket revenue from interstate & overseas;–Non-ticket expenditure by additional non-Victorian visitors + enhanced expenditure by Victorians;–Non-Victorian sponsorship–Retained sponsorship.
Source GPEE2, pg 4 (see page 49 for the amounts)•We could compare the F1 option vs business option at this point but it would be misleading because the wrong data is being used.

March 2000 32
The AGPC & Gross ProductThe AGPC & Gross Product
Capital investment
= $50.5m (assumed low estimate from GPEE2)
$
Categories of expenditure
Not drawn to scale
Net additional revenue claimed by GPEE2 to provide the source of economic benefits
Pink + Yellow = Gross revenue of QAGP
Yellow = purchases on supplies (intermediate goods) by QAGP
Pink = purchases of labour, capital by QAGP equivalent to Gross State Product (Gross State Surplus) used in GPEE2 as a measure of ‘economic activity’ - GPEE2 claims that the pink expands because of F1
Gross revenue
Where gross revenue goes beneath the line this captures the subsidy from government
Diagram 2

March 2000 33
AGPC vs ‘public works’AGPC vs ‘public works’
Capital investment
= $50.5m (assumed low estimate from GPEE2)
Gross revenue
$
Categories of expenditure
Not drawn to scale
Net additional revenue claimed by GPEE2 to provide the source of economic benefits
Pink + Yellow = Gross revenue of QAGP
Yellow = purchases on supplies (intermediate goods) by QAGP
Pink = purchases of labour, capital by QAGP equivalent to Gross State Product (Surplus) used in GPEE2 as a measure of ‘economic activity’ - GPEE2 claims that the pink expands because of F1
B
Column B represents the gross revenue of the project chosen by GPEE2 to be ‘foregone’ (given up) in order to fund the QAGP
Green + brown = Gross revenue of foregone project
Brown = purchases on supplies (intermediate goods)
Green = purchases on capital & labour (ie gross state surplus as correctly measured by GPEE2)
Diagram 3

March 2000 34
Misleading: net versus grossMisleading: net versus gross
• GPEE2 correctly subtracts the ‘green’ in the foregone project (column B) from the ‘pink’ (gross state surplus in the QAGP).
• The ‘net’ gross state surplus is considered to be the increase in Gross State Surplus caused by the F1 according to GPEE2.
• Gross State Surplus is the equivalent to a large company subtracting input costs from the gross revenue and claiming this is the benefit to shareholders. The benefit to shareholders is profit - not gross state surplus.

March 2000 35
Misleading Data: Misleading Data: net vs grossnet vs gross
Capital investment
= $50.5m (assumed low estimate from GPEE2)
Gross revenue
$
Categories of expenditure
Not drawn to scale
Net additional revenue claimed by GPEE2 to provide the source of economic benefits
B The Pink area represents the gross state surplus from QAPG (pink) less the gross state surplus equivalent from the foregone project (green) as undertaken in GPEE2.
In cost - benefit analysis the gross surplus is useless as a measure of the benefit because it does not tell us what the profit is. That is the labour and capital tied up in producing the gross surplus did not come for free - this capital & labour could have been used elsewhere. In order to determine the ‘net’ surplus the ‘costs’ of labour and capital should be deducted. The light blue areas represent the ‘net surplus’ component of the gross surplus of each entity. The net surplus represents the unique increment in wealth flowing from the chosen project.
Diagram 4
A cost-benefit analysis would have compared the net surpluses from each project
B
F1
March 2000 36
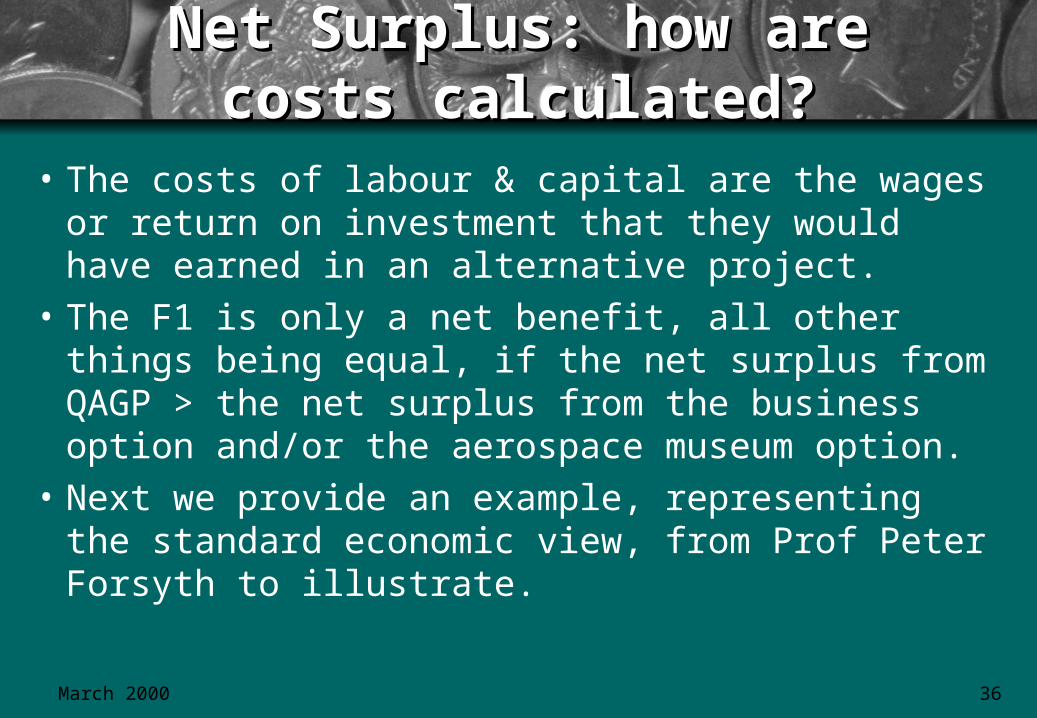
Net Surplus: how are costs Net Surplus: how are costs calculated?calculated?
• The costs of labour & capital are the wages or return on investment that they would have earned in an alternative project.
• The F1 is only a net benefit, all other things being equal, if the net surplus from QAGP > the net surplus from the business option and/or the aerospace museum option.
• Next we provide an example, representing the standard economic view, from Prof Peter Forsyth to illustrate.

March 2000 37
Tourism promotion exampleTourism promotion example
• Assume Aust Govt spends $1m through the Australian Tourism Commission to promote Australia overseas.
• Raising $1m in revenue causes costs to the economy of $0.275m through efficiency and foreign currency losses (this is not essential to the analysis but is part of being complete).
• Estimates show that $1m spent on overseas promotions produces additional tourist expenditure of $40m in Australia.
March 2000 38
$1m expended = $40m on $1m expended = $40m on gross benefitgross benefit
• The gross benefit needs to adjusted to reflect the cost of factors of production (labour, capital).
• Modelling shows that for every $1 spent on tourism by a tourist only 5 cents is available to provide a net benefit or net surplus. That is each $1 of gross benefit requires 95 cents to be spent to purchase labour and capital from other sectors of the economy leaving only 5cents as a net gain in Oz wealth.

March 2000 39
Net OZ gain from $1m Net OZ gain from $1m overseas promotionoverseas promotion
• $1m (which is really ‘costs’ $1.275m)
in promotion =
$40m in gross tourism revenue which =
$2m in net surplus (@5cents per $1 spent) +
$1.65m in additional foreign exchange effects (receiving additional foreign exchange is beneficial to
Australia but also has costs).• Therefore $1.275m in promotion = $3.65m in net
benefit (source see notes - Forsyth & Dwyer paper).
March 2000 40
Net Surplus AnalysisNet Surplus Analysis
• The previous analysis required ‘strong’ assumptions to be made by the writers.
• It illustrates the error in the approach of using gross measures to indicate benefits.
• It provides a ‘order of magnitude’ measure of the net gains to Australia from extra tourism revenue.
• Applied to the F1 QAGP it reveals that Australia gained only $7.59m in net benefit (surplus) in 2000 (see following table).

March 2000 41
Dwyer/Forsyth model applied to FI QAGPDwyer/Forsyth model applied to FI QAGPCalculating the net benefit for:
1. a dollar spent on promotion; and2. a dollar spent in gross tourism revenue.
1. According to Forsyth & Dywer (Professor Peter Forsyth, Head of the Economics Department at Monash University and Larry Dwyer from the Centre for Tourism and Hospitality at the University of Western Sydney.)(source: Dwyer, L., and Forsyth, P., Government Support for Inbound Tourism Promotion, Australian Economic Papers, December 1993, pg 369.
$1.275 spent on promotion leads to $3.65 in net benefit it can be assumed that $1 in promotion equals $x in net benefitThis implies that the following ratios 1.275: 3.65
1: x can be used to calculate the value of $x
therefore x = equals ($3.65 divided by $1.275) which is $2.863
That is $1 spent on promotion leads to $2.863 in net benefit (surplus) in Australia
2. According to Forsyth & Dywer (source: see above)$40,000,000 in tourism revenue leads to $3,650,000 in net benefits for Australia.This implies that $1,000,000 in tourism revenue generates $y in net benefits (surplus)
This implies that the following ratios $40,000,000:$3,650,000$1,000,000: y can be used to calculate the value of $y
therefore y= equals ($3.65m divided by $40m) which is $0.091250 million
That is $1m spent in tourism revenue leads to $91,250 in net benefit for Australia as a whole
On this basis, on GPEE2* data, the FI Grand Prix created a net surplus of $7.59m (see calculation below)Total GPEE2 direct expenditure value for F1 QAGP $m 83.20$
Net surplus per $1m of gross expenditure $m 0.09125$ Therefore net surplus created based on GPEE2 figures $m 7.59$
*GPEE2 = Grand Prix Economic Evaluation 2000 prepared by the Victorian Department of State Development

March 2000 42
Implications for QAGPImplications for QAGP
• Dwyer/Forsyth ‘back of the envelope’ estimates imply a net surplus of $7.59m from F1 QAGP (if we accept GPEE2 data - which we do not & assuming that all the $7.59m accrues to Victoria - which it will not!).
• The cost of the promotion is the net cost of the FI QAGP.
• The cost of the promotion in 2000 is the cost of staging F1 QAGP. We estimate a cost of $16.142m (AGPC estimates $3.996m).

March 2000 43
2000 F1 GP loses $8.552m2000 F1 GP loses $8.552m
• The 2000 F1 GP created $7.59m in net surplus based on AGPC data using the Forsyth model yet cost $16.142m to stage (gross revenue less staging costs).
• The net loss to the economy caused by the Grand Prix is the $7.59m minus $16.142m: that is $8.552m.

March 2000 44
QAGP a loserQAGP a loser
• It is our conclusion that the QAGP causes Victorians to be poorer when the analysis is conducted in a proper cost-benefit framework.
• Economic impact modelling has its place but needs to be integrated into a cost-benefit framework to measure the net benefit to the Victorian economy from government investments in tourism.
• The methodology chosen in GPEE2 is inappropriate and leads to misleading conclusions about the net benefits of QAGP.
March 2000 45
Economists@Large & AssociatesMelbourne, March 2001
Any commentary in this document is solely the responsibility of Economists@Large & Associates
Adding Value to Society

March 2000 46
ENDs Here Folks!
Related Documents