PRESENTED BY: Jeff Savage Realtor - CRS, E-Pro, SRES RE/MAX Grand Lake 2014 Grand Lake Area Real Estate Trends

Grand Lake 2014 Year End 10 year charts - Real Estate Trends
Jul 13, 2015
Welcome message from author
This document is posted to help you gain knowledge. Please leave a comment to let me know what you think about it! Share it to your friends and learn new things together.
Transcript

PRESENTED BY:
Jeff SavageRealtor - CRS, E-Pro, SRES
RE/MAX Grand Lake
2014 Grand Lake Area Real Estate Trends

2014 Grand Lake Area Real Estate Trends
www.SlideShare.net/JeffSavage01
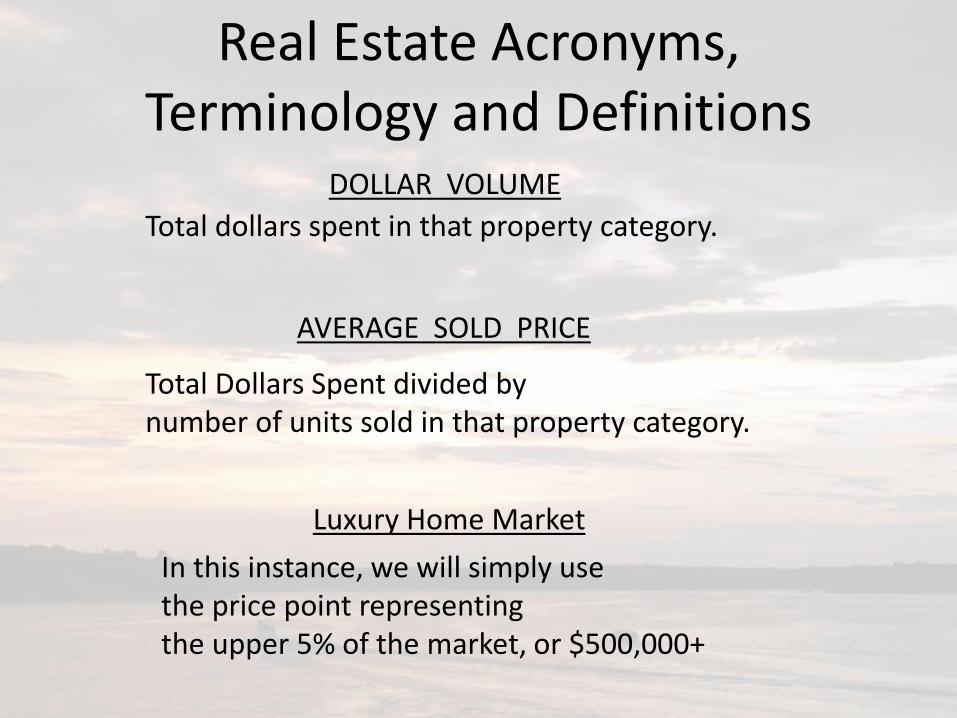
Total dollars spent in that property category.
Real Estate Acronyms, Terminology and Definitions
DOLLAR VOLUME
AVERAGE SOLD PRICE
Total Dollars Spent divided by number of units sold in that property category.
Luxury Home Market
In this instance, we will simply use the price point representing the upper 5% of the market, or $500,000+

Source of Information
For the period January 1, 2005
through December 31, 2014
• Based on information from the Northeast Oklahoma Board of Realtors®

Sales Volumes
• Represented as Dollar Volume in a Category

All Property Sales
2005 2006 2007 2008 2009 2010 2011 2012 2013 2014
$180,163,707
$215,513,432
$199,065,317
$171,559,949
$125,457,074$119,843,085
$127,567,682
$155,397,922$156,792,161
$173,198,120
Dollar Volume

Residential Sales
2005 2006 2007 2008 2009 2010 2011 2012 2013 2014
$137,028,272
$172,290,523
$154,400,339
$135,967,732
$106,391,858$102,288,460
$111,388,218
$127,524,518$137,025,450
$144,812,505
Dollar Volume

Residential Waterfront
2005 2006 2007 2008 2009 2010 2011 2012 2013 2014
$58,573,476
$78,829,160
$69,725,986$66,767,086
$46,299,150$49,067,635
$58,060,405
$69,526,355
$77,038,246$79,806,222
Dollar Volume

Residential (not Water Front)
2005 2006 2007 2008 2009 2010 2011 2012 2013 2014
$78,454,796
$93,461,363
$84,674,353
$69,200,646
$60,092,708$53,220,825 $53,327,813
$57,998,163$59,987,204$65,006,283
Dollar Volume

Luxury Home Market
2005 2006 2007 2008 2009 2010 2011 2012 2013 2014
$9,512,900
$28,720,161$26,832,200
$31,054,400
$15,868,500
$19,508,210
$23,839,600
$32,289,500 $32,502,971
$36,446,450
Dollar Volume

Water Front Lots
2005 2006 2007 2008 2009 2010 2011 2012 2013 2014
$8,793,551
$5,547,820
$14,374,950
$6,421,999
$2,808,850 $3,411,375$2,835,300
$5,995,737
$2,715,300
$4,737,500
Dollar Volume

Condos and Townhomes
2005 2006 2007 2008 2009 2010 2011 2012 2013 2014
$4,672,950
$6,088,450
$10,082,750
$7,011,516
$5,694,525$6,185,500
$7,108,232
$5,990,000
$8,203,600
$6,251,300
Dollar Volume

Farms and Ranches
2005 2006 2007 2008 2009 2010 2011 2012 2013 2014
$11,055,540
$15,272,494
$13,118,100
$7,817,380$7,995,861
$4,828,470$4,228,334
$11,467,820
$6,679,400
$11,918,905
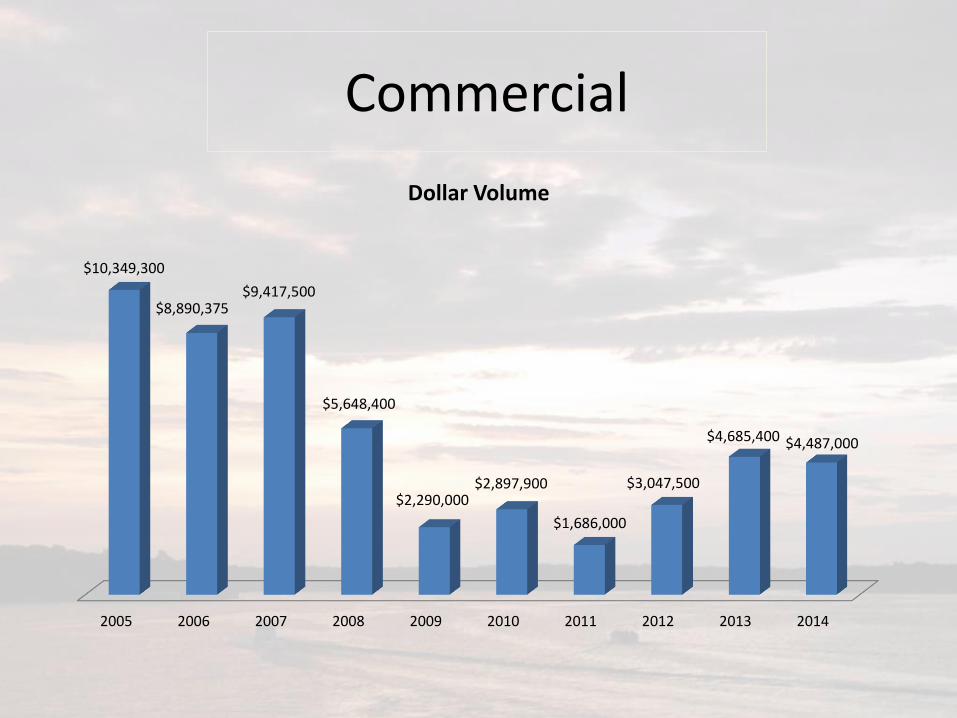
Commercial
2005 2006 2007 2008 2009 2010 2011 2012 2013 2014
$10,349,300
$8,890,375$9,417,500
$5,648,400
$2,290,000$2,897,900
$1,686,000
$3,047,500
$4,685,400 $4,487,000
Dollar Volume

Average Unit Price
• Represented as Dollar Volume / Units in a Category

Residential Waterfront
2005 2006 2007 2008 2009 2010 2011 2012 2013 2014
$251,388
$306,728 $311,277
$358,963
$291,190
$333,793 $335,609 $345,902 $342,392 $338,162
Average Sold Price

Residential (not Water Front)
2005 2006 2007 2008 2009 2010 2011 2012 2013 2014
$88,750
$97,968
$94,503
$96,380 $95,842
$106,018
$101,965 $101,751$100,989 $101,256
Average Sold Price

Luxury Home Market
2005 2006 2007 2008 2009 2010 2011 2012 2013 2014
$731,762
$718,004
$706,111
$796,267
$721,295
$780,328
$722,412
$750,919
$792,755 $792,314
Average Sold Price

Water Front Lots
2005 2006 2007 2008 2009 2010 2011 2012 2013 2014
$165,916
$108,781
$266,203
$173,568
$147,834$136,455
$166,782
$249,833
$104,435
$143,561
Average Sold Price

Financing Sources
• Represented as Residential Dollar Volume in a Source Category

All Residential Sales
2005 2006 2007 2008 2009 2010 2011 2012 2013 2014
$137,028,272
$172,290,523
$154,400,339
$135,967,732
$106,391,858$102,288,460
$111,388,218
$127,524,518
$137,025,450$144,812,505
Dollar Volume
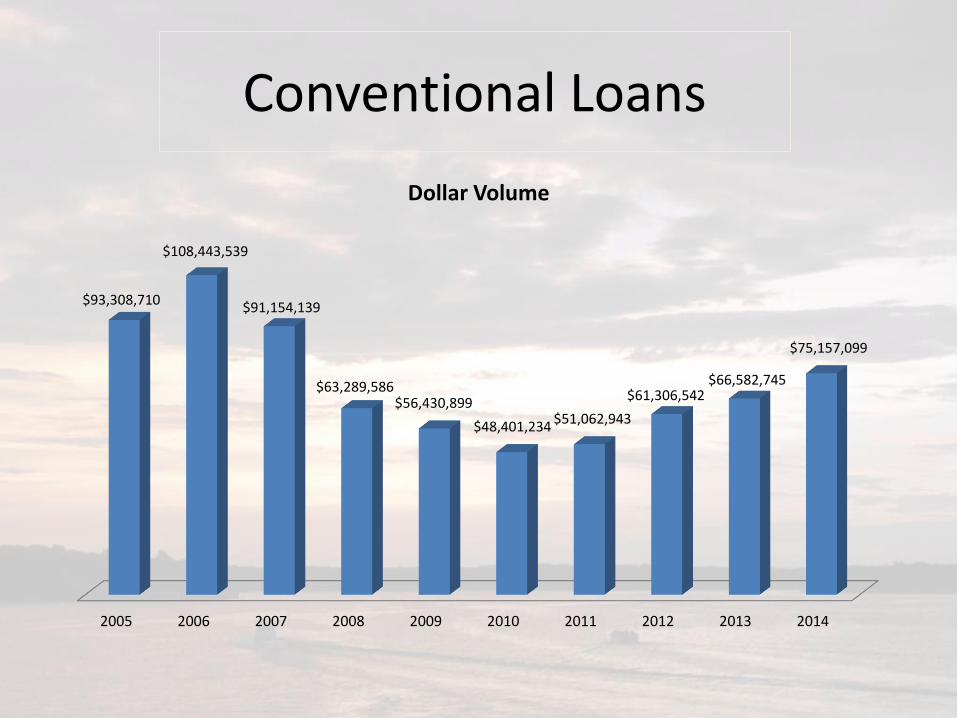
Conventional Loans
2005 2006 2007 2008 2009 2010 2011 2012 2013 2014
$93,308,710
$108,443,539
$91,154,139
$63,289,586$56,430,899
$48,401,234$51,062,943
$61,306,542$66,582,745
$75,157,099
Dollar Volume

Cash Sales
2005 2006 2007 2008 2009 2010 2011 2012 2013 2014
$30,126,964
$36,273,843
$28,711,604
$32,421,082
$26,034,680
$32,731,016$33,173,688
$34,857,391
$42,756,759
$55,987,281
Dollar Volume
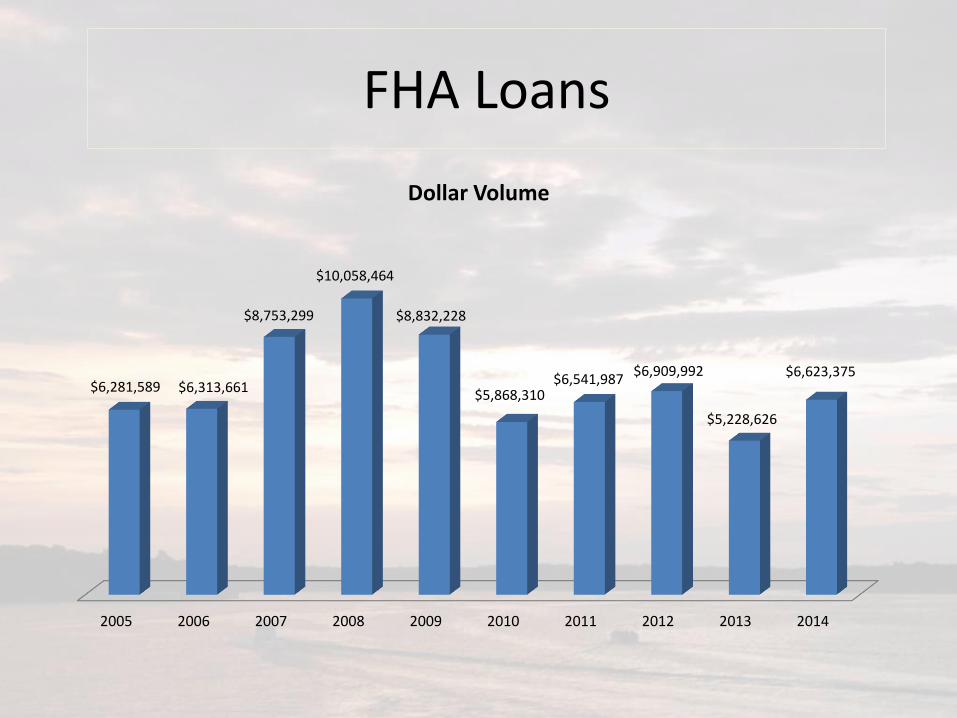
FHA Loans
2005 2006 2007 2008 2009 2010 2011 2012 2013 2014
$6,281,589 $6,313,661
$8,753,299
$10,058,464
$8,832,228
$5,868,310$6,541,987
$6,909,992
$5,228,626
$6,623,375
Dollar Volume

VA Loans
2005 2006 2007 2008 2009 2010 2011 2012 2013 2014
$401,550
$1,167,020
$528,151
$945,500
$1,456,800$1,695,800
$1,517,300
$1,975,900 $2,026,300
$4,427,010
Dollar Volume

Sales Counts
• Represented as Number of Units in a Category

All Property Listings
2005 2006 2007 2008 2009 2010 2011 2012 2013 2014
4,6274,847
5,1384,974
4,7694,484
4,379 4,232 4,266 4,085
Active Listings

All Property Sales
2005 2006 2007 2008 2009 2010 2011 2012 2013 2014
1,4641,574
1,424
1,159
969
803 830
957981
1,082
Total # Sales

Residential Sales
2005 2006 2007 2008 2009 2010 2011 2012 2013 2014
1,117
1,211
1,120
904
786
649696
771819
878
Total # Sales

Conventional Loans
2005 2006 2007 2008 2009 2010 2011 2012 2013 2014
649
727
602
383363
286 300327
337 371
Total # Sales

Cash Sales
2005 2006 2007 2008 2009 2010 2011 2012 2013 2014
282
249232 239
212194
225
250
316
378
Total # Sales

FHA Loans
2005 2006 2007 2008 2009 2010 2011 2012 2013 2014
10395
123 124
91
66 62 64
52
62
Total # Sales

VA Loans
2005 2006 2007 2008 2009 2010 2011 2012 2013 2014
5
9
6
910
1211
1314
30
Total # Sales

In Conclusion
• Water Front Homes bring buyers to Grand Lake, and continue to be the strongest
segment of the area market.
• The numbers show the
local real estate market is growing.
• Real estate is local, and Oklahomans are not buying or selling their homes
in a national housing market.

2014 Grand Lake Area Real Estate Trends
www.SlideShare.net/JeffSavage01

PRESENTED BY:
Jeff SavageRealtor - CRS, E-Pro, SRES
RE/MAX Grand Lake
2014 Grand LakeArea Real Estate Trends
Related Documents