GRAINS AND CEREALS Sub-Sector Skills Plan 2020-2021

Welcome message from author
This document is posted to help you gain knowledge. Please leave a comment to let me know what you think about it! Share it to your friends and learn new things together.
Transcript
GRAINS AND CEREALS
Sub-Sector Skills Plan
2020-2021
CONTENTS
ENABLING A SKILLED AND PROSPEROUS
AGRICULTURAL SECTOR
i
GENERAL INFORMATION
ABBREVIATIONS AND ACRONYMS ................................. ii
EXECUTIVE SUMMARY .............................................. iii
RESEARCH PROCESS AND METHODS .............................. iv
SUMMARY OF KEY FINDINGS ....................................... vi
CHAPTER 1: SECTOR PROFILE ....................1
1.1 INTRODUCTION ................................................ 2
1.2 SCOPE OF COVERAGE ......................................... 2
1.3 KEY ROLE-PLAYERS ............................................ 5
1.4 ECONOMIC PERFORMANCE ................................... 7
1.5 EMPLOYER PROFILE ........................................... 9
1.6 LABOUR MARKET PROFILE .................................... 10
1.7 CONCLUSION ................................................... 12
CHAPTER 2: KEY SKILLS ISSUES...................13
2.1 INTRODUCTION ................................................ 14
2.2 CHANGE DRIVERS .............................................. 14
2.3 ALIGNMENT OF SKILLS PLANNING TO NATIONAL ..........STRATEGY AND PLANS ........................................ 15
2.4 IMPLICATIONS FOR SKILLS PLANNING ....................... 17
2.5 CONCLUSION ................................................... 17
CHAPTER 3: OCCUPATIONAL SHORTAGES ......AND SKILLS GAPS ....................................19
3.1 INTRODUCTION ................................................ 20
3.2 EXTENT AND NATURE OF DEMAND ........................... 20
3.3 EXTENT AND NATURE OF SUPPLY ............................ 23
3.4 SECTORAL PRIORITY OCCUPATIONS (PIVOTAL) LIST ....... 26
3.5 CONCLUSION ................................................... 28
CHAPTER 4: PARTNERSHIPS .......................29
4.1 INTRODUCTION ................................................ 30
4.2 EXISTING PARTNERSHIPS ...................................... 30
4.3 EMERGING PARTNERSHIPS .................................... 31
4.4 CONCLUSION ................................................... 32
CHAPTER 5: SKILLS PRIORITY ACTIONS .........33
5.1 INTRODUCTION ................................................ 34
5.2 KEY FINDINGS FROM OTHER CHAPTERS .................... 34
5.3 RECOMMENDED ACTIONS ..................................... 34
5.4 CONCLUSION ................................................... 35
LIST OF REFERENCES ............................................... 36
ii
GRAINS AND CEREALS SUB-SECTOR SKILLS PLAN
AGRICULTURE SECTOR EDUCATION TRAINING AUTHORITY SUB-SECTOR SKILLS PLANii AGRICULTURE SECTOR EDUCATION TRAINING AUTHORITY SUB-SECTOR SKILLS PLAN
ABBREVIATIONS AND ACRONYMS
ABBREVIATION/ACRONYM
DESCRIPTION
AFASA African Farmers Association of South Africa
AGRISETA Agricultural Sector Education and Training Authority
ATR Annual Training Report
BMI Business Monitor International
*DAFF[DALRRD]
*Department of Agriculture, Fisheries and Forestry[changed to Department of Agriculture, Land Reform and Rural Development in June 2019]
*DHET[DHEST]
*Department of Higher Education and Training[was merged with Department of Science and Technology and became Department of Higher Education, Science and Technology in June 2019]
*DRDLR[DALRRD]
*Department of Rural Development and Land Reform[was merged into the Department of Agriculture, Land Reform and Rural Development in June 2019]
GCSA Grains and Cereals Association of South Africa
GDP Gross Domestic Product
HEMIS Higher Education Management Information System
HTFV Hard-To-Fill Vacancies
IGDP Integrated Growth Development Plan
IDP Integrated Development Plan
IPAP Industrial Policy Action Plan
KZN KwaZulu-Natal
NAFU National African Farmers Union
NDP National Development Plan
NGP New Growth Path
NSDP National Skills Development Plan
NSDS III National Skills Development Strategy III
SAAA South African Grains and Cereals Association
SACAU Southern African Confederation of African Unions
SAIVCET South African Institute for Vocational Continuing Education and Training
SARS South African Revenue Service
SDA Skills Development Act
SIC Standard Industrial Classification
SSP Sector Skills Plan
Stats SA Statistics South Africa
TVET Technical Vocational Education and Training
WSP Workplace Skills Plan
WTO World Trade Organization
* The references and information in the SSP was obtained before the merging and renaming of national government depart-ments in June 2019.
iii
GENERAL INFORMATION
There are eleven agricultural activities in the Grains and Cereals sub-sector, as set out in the Agricultural Product Standards Act, 1999 (Act 119 of 1990).
Grains consist of the following:• Cereals• Leguminous seeds• Oil seeds• Grass seeds• Processed grains
Cereals consist of:• Maize• Wheat• Grain sorghum• Barley• Millet
Production data on cereals relate to crops harvested for dry grain only. Cereal crops harvested for hay or harvested green for food, feed, or silage and those used for grazing are excluded. In 2017, cereal production for South Africa was 18.9 million metric tons (World Data Atlas, 2017).
Maize is a major staple food crop grown in diverse agro-ecological zones and farming systems, and consumed by people with varying food preferences and socio-economic backgrounds in South Africa. Sorghum is the second most important cereal after maize, followed by millets (pearl and finger). These are undoubtedly in high demand in the
country. The agricultural sector’s contribution to the GDP in 2018 was 2.3% while in the second quarter of 2019 the sector contributed 2.2% to the national GDP at the value of R74,158 billion as reported by BFAP (2019). The total volume of South African agriculture production for 2017 was estimated at 62.9 million tonnes which was a 24% increase compared to 2016.
The sector has been reported to contribute 5% of total employment in South Africa as of June 2019 (StatsSA, Q2: 2019). Notwithstanding the relatively small share of the total GDP, primary agriculture is an important sector in the South African economy. The value of primary agricultural production in South Africa was R273 544 million for the year ended 30 June 2018, a 2.1% increase from the previous year (DAFF, 2018). According to DAFF (2018), the gross income from field crops decreased by 9.8% from R63 557 million in 2017 to R57 329 million in December 2018 with maize contributing R23 517 million of the total income. The Grain and Cereals sub-sector represents 9,6% with a total of 2 453 employers of the total number of 26 181 employers on the AgriSETA. The total contribution to SDL by the sub-sector is R68 305 745 according to the 2019/20 WSP employer database.
The main factors that presently influence skills demand and supply in the Grains and Cereals sub-sector are consumer behaviour, technology and mechanisation, and climate change and drought.
EXECUTIVE SUMMARY
iv
GRAINS AND CEREALS SUB-SECTOR SKILLS PLAN
AGRICULTURE SECTOR EDUCATION TRAINING AUTHORITY SUB-SECTOR SKILLS PLANiv AGRICULTURE SECTOR EDUCATION TRAINING AUTHORITY SUB-SECTOR SKILLS PLAN
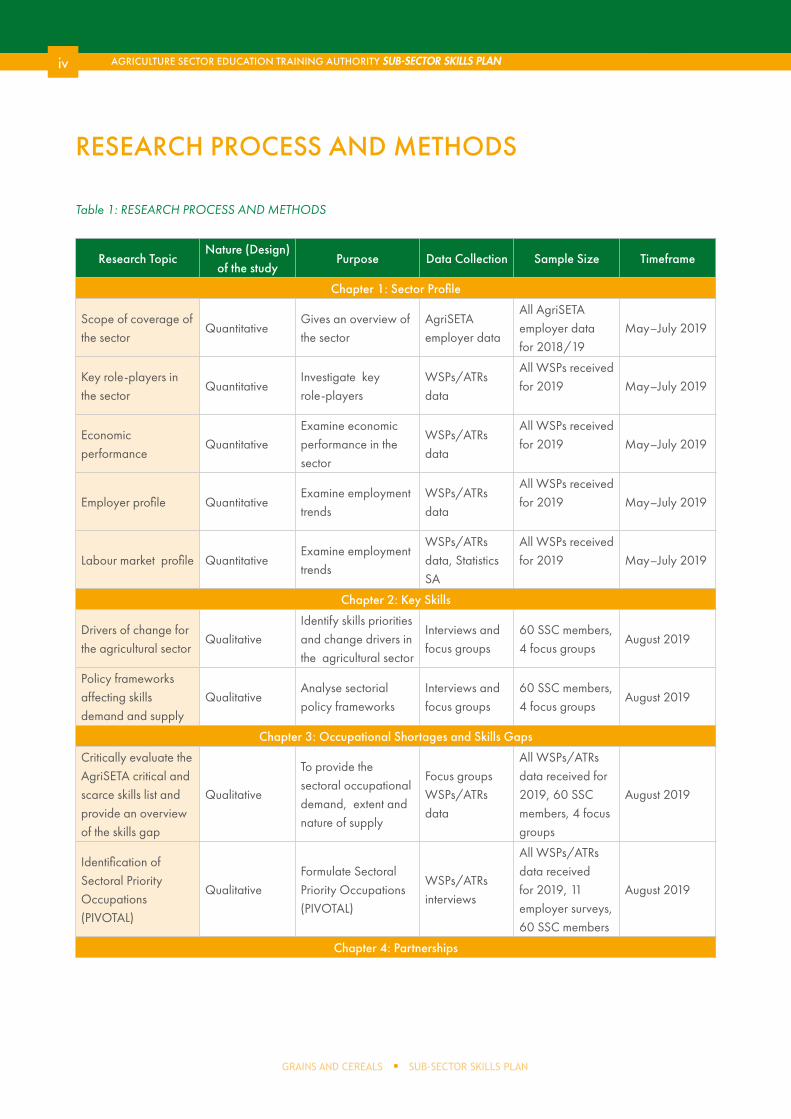
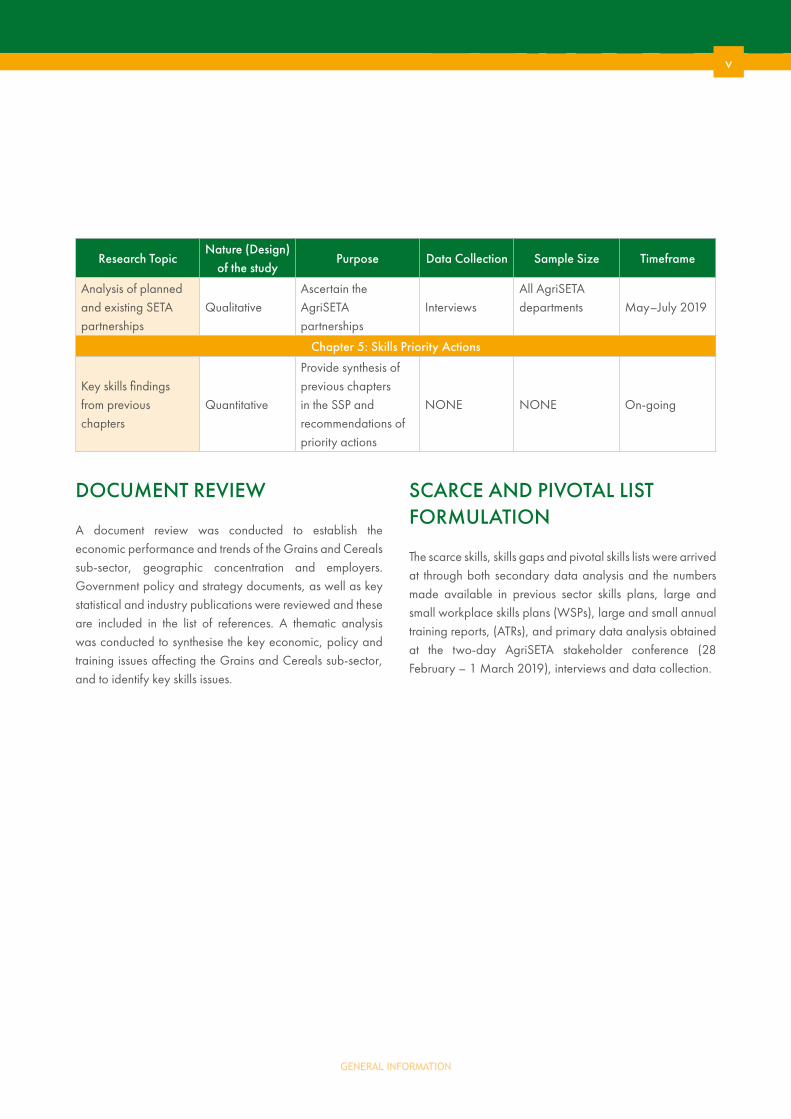
Table 1: RESEARCH PROCESS AND METHODS
Research TopicNature (Design)
of the studyPurpose Data Collection Sample Size Timeframe
Chapter 1: Sector Profile
Scope of coverage of the sector
Quantitative Gives an overview of the sector
AgriSETA employer data
All AgriSETA employer data for 2018/19
May–July 2019
Key role-players in the sector
QuantitativeInvestigate key role-players
WSPs/ATRs data
All WSPs receivedfor 2019 May–July 2019
Economic performance
QuantitativeExamine economic performance in the sector
WSPs/ATRs data
All WSPs receivedfor 2019 May–July 2019
Employer profile QuantitativeExamine employment trends
WSPs/ATRs data
All WSPs receivedfor 2019 May–July 2019
Labour market profile QuantitativeExamine employment trends
WSPs/ATRs data, Statistics SA
All WSPs receivedfor 2019 May–July 2019
Chapter 2: Key Skills
Drivers of change for the agricultural sector
QualitativeIdentify skills priorities and change drivers in the agricultural sector
Interviews andfocus groups
60 SSC members, 4 focus groups
August 2019
Policy frameworks affecting skills demand and supply
QualitativeAnalyse sectorial policy frameworks
Interviews andfocus groups
60 SSC members, 4 focus groups
August 2019
Chapter 3: Occupational Shortages and Skills Gaps
Critically evaluate the AgriSETA critical and scarce skills list and provide an overview of the skills gap
Qualitative
To provide the sectoral occupational demand, extent and nature of supply
Focus groups WSPs/ATRs data
All WSPs/ATRs data received for 2019, 60 SSC members, 4 focus groups
August 2019
Identification of Sectoral Priority Occupations(PIVOTAL)
QualitativeFormulate Sectoral Priority Occupations (PIVOTAL)
WSPs/ATRs interviews
All WSPs/ATRs data received for 2019, 11 employer surveys, 60 SSC members
August 2019
Chapter 4: Partnerships
RESEARCH PROCESS AND METHODS
v
GENERAL INFORMATION
Research TopicNature (Design)
of the studyPurpose Data Collection Sample Size Timeframe
Analysis of planned and existing SETA partnerships
QualitativeAscertain the AgriSETA partnerships
InterviewsAll AgriSETA departments May–July 2019
Chapter 5: Skills Priority Actions
Key skills findings from previous chapters
Quantitative
Provide synthesis of previous chapters in the SSP and recommendations of priority actions
NONE NONE On-going
DOCUMENT REVIEW
A document review was conducted to establish the economic performance and trends of the Grains and Cereals sub-sector, geographic concentration and employers. Government policy and strategy documents, as well as key statistical and industry publications were reviewed and these are included in the list of references. A thematic analysis was conducted to synthesise the key economic, policy and training issues affecting the Grains and Cereals sub-sector, and to identify key skills issues.
SCARCE AND PIVOTAL LIST FORMULATION
The scarce skills, skills gaps and pivotal skills lists were arrived at through both secondary data analysis and the numbers made available in previous sector skills plans, large and small workplace skills plans (WSPs), large and small annual training reports, (ATRs), and primary data analysis obtained at the two-day AgriSETA stakeholder conference (28 February – 1 March 2019), interviews and data collection.
vi
GRAINS AND CEREALS SUB-SECTOR SKILLS PLAN
AGRICULTURE SECTOR EDUCATION TRAINING AUTHORITY SUB-SECTOR SKILLS PLANvi AGRICULTURE SECTOR EDUCATION TRAINING AUTHORITY SUB-SECTOR SKILLS PLAN
SUMMARY OF KEY FINDINGS
Government should pay special attention to Grains and Cereals sub-sector because it is an integral part of food security in South Africa. The Grains and Cereals sub-sector accounts for about 30% of total gross agricultural production in the country. Reports are that the gross income from field crops decreased by 9.8% from R63 557 million in 2017 to R57 329 million in December 2018, with maize contributing R23 517 million of the total income.
The total contribution to SDL by the Grains and Cereals sub-sector is R68 305 745 from the 2019/20 WSP data. The AgriSETA should direct funding towards developing skills in the nine occupations identified as hard-to-fill vacancies: 1. Silo Manager2. Silo Operator3. Grain Grader4. Agriculture Technician5. Agri-Retail Branch Manager6. Grain Marketer and Trader7. Financial Manager and Administrator
8. Workshop Manager9. Grain Miller
The legislative and policy frameworks established by government coupled with the contextual change drivers and industry specific perspectives on skills development, point to the following skills implications that need to be addressed in the Grains and Cereals Sub-sector Skills Plan. 1. Practical skills transfer through mentoring and on-the-
job training. 2. Partnerships with Higher Education Institutions (HEIs)
for research and development into the sub-sector.3. Partnerships with key role-players in the industry for
farmer and farmworker development programmes.4. The development of green knowledge qualifications.
According to the 2019/20 WSP ATR submissions, a total of 15 209 training interventions were attended by employees in the Grains and Cereals sub-sector to ensure workplace skills development.
vii
GENERAL INFORMATION
LIST OF FIGURES
FIGURE 1: DISTRIBUTION OF AGRICULTURAL ENTITIES BY SUB-SECTOR 4FIGURE 2: CONTRIBUTION OF GRAINS AND CEREALS ENTITIES TO SKILLS DEVELOPMENT LEVIES 4FIGURE 3: CEREALS EXPORTS FORECASTS AND TRENDS 7FIGURE 4: VALUE OF IMPORTED AND EXPORTED GRAINS IN SOUTH AFRICA 8FIGURE 5: PROVINCIAL DISTRIBUTION OF GRAIN EMPLOYERS REGISTERED WITH AGRISETA 9FIGURE 6: PROVINCIAL BREAKDOWN – GRAINS & CEREALS EMPLOYEES 10FIGURE 7: DEMOGRAPHIC COMPOSITION OF EMPLOYEES 11FIGURE 8: OCCUPATIONAL CATEGORIES IN THE GRAINS AND CEREALS SUB-SECTOR 12FIGURE 9: PUBLIC UNIVERSITY GRADUATES BY MAJOR FIELD OF STUDY 24FIGURE 10: NUMBER OF ENROLMENT AND GRADUATES FROM PUBLIC UNIVERSITIES AND
TECHNIKONS BY CLASSIFICATION OF EDUCATIONAL SUBJECT MATTER (CESM) 2000–2016 24
LIST OF TABLES
TABLE 1: RESEARCH PROCESS AND METHODS ivTABLE 2: ACTIVITIES IN THE GRAINS AND CEREALS SUB-SECTOR BY STANDARD INDUSTRIAL
CLASSIFICATION 2TABLE 3: GRAINS AND CEREALS LIST OF DEFINITIONS 3TABLE 4: KEY AGRICULTURAL ROLE-PLAYERS 5TABLE 5: AREA PLANTED AND TONNES PRODUCED FOR GRAINS IN 2018 8 TABLE 6: PESTEL FOR THE GRAINS AND CEREALS SUB-SECTOR 16TABLE 7: SMALL EMERGING FARMERS AND CO-OPERATIVES HARD-TO-FILL VACANCIES 20TABLE 8: COMMERCIAL FARMERS HARD-TO-FILL VACANCIES 20TABLE 9: TOP HARD-TO-FILL VACANCIES (STAKEHOLDER ENGAGEMENT) 21TABLE 10: TOP EMERGING SUB-SECTOR SKILLS AND FUTURE OCCUPATIONAL SHORTAGES 21TABLE 11: SCARCE SKILLS AND SKILLS GAPS LIST 22TABLE 12: EMPLOYEES TRAINED BY OCCUPATIONAL CATEGORY AND GENDER 25TABLE 13: THE AGRISETA 2019/20 SECTORAL PRIORITY OCCUPATIONS (PIVOTAL) LIST 27TABLE 14: AGRISETA PARTNERSHIPS 30
1
GRAINS AND CEREALS SUB-SECTOR SKILLS PLAN
AGRICULTURE SECTOR EDUCATION TRAINING AUTHORITY SUB-SECTOR SKILLS PLAN
CHAPTER 1SECTOR PROFILE
1 AGRICULTURE SECTOR EDUCATION TRAINING AUTHORITY SUB-SECTOR SKILLS PLAN
2
CHAPTER 1 SECTOR PROFILE
1.1. INTRODUCTION
Chapter 1 of this report provides an overview of the agricultural sector, paying particular attention to the Grains and Cereals sub-sector in South Africa. The first section looks at the scope of the Grains and Cereals sub-sector’s coverage.
The second section outlines AgriSETA stakeholders and key role-players in the sector. The third section looks at the economic performance of the overall agricultural sector, zooming into the contribution of the Grains and Cereals sub-sector to the South African economy. The fourth section explores the employer profile, based on the AgriSETA WSP/ATR data submitted for 2019/20. The last section provides a labour market profile where the number and demographics of people employed in the sector is explored. Essentially, the chapter is intended to set the scene for the skills issues that are examined in the subsequent chapters.
1.2. SCOPE OF COVERAGE
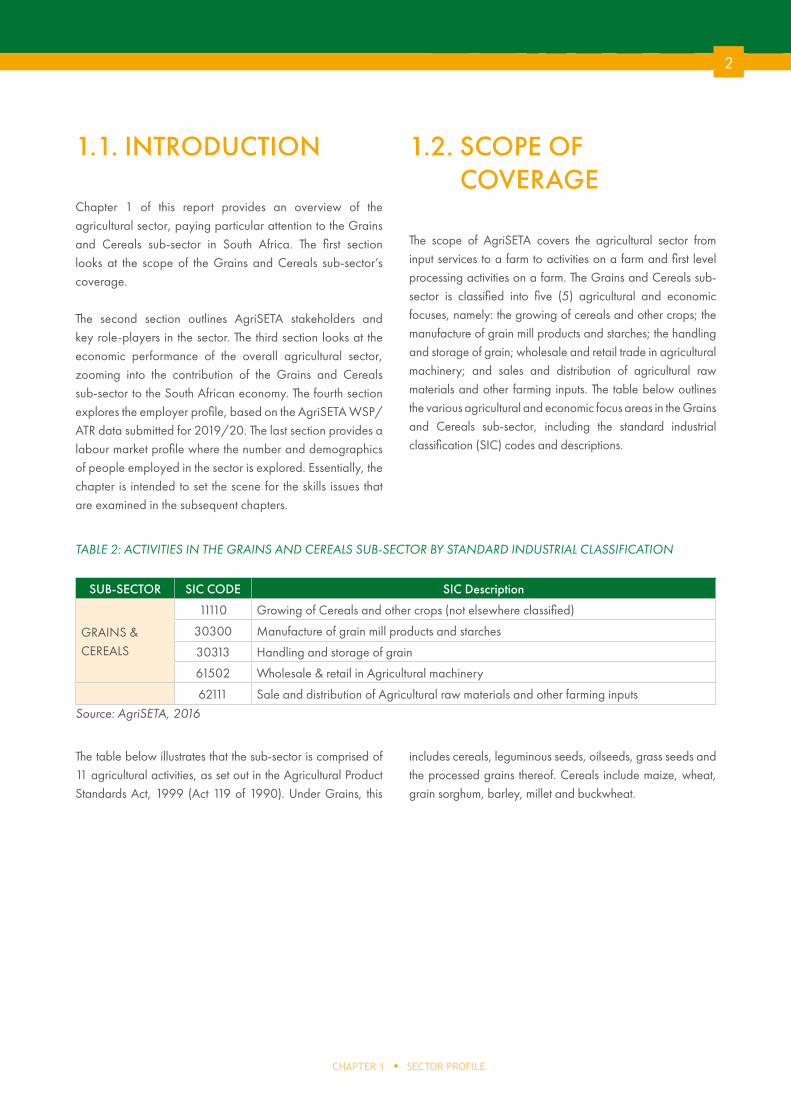
The scope of AgriSETA covers the agricultural sector from input services to a farm to activities on a farm and first level processing activities on a farm. The Grains and Cereals sub-sector is classified into five (5) agricultural and economic focuses, namely: the growing of cereals and other crops; the manufacture of grain mill products and starches; the handling and storage of grain; wholesale and retail trade in agricultural machinery; and sales and distribution of agricultural raw materials and other farming inputs. The table below outlines the various agricultural and economic focus areas in the Grains and Cereals sub-sector, including the standard industrial classification (SIC) codes and descriptions.
TABLE 2: ACTIVITIES IN THE GRAINS AND CEREALS SUB-SECTOR BY STANDARD INDUSTRIAL CLASSIFICATION
SUB-SECTOR SIC CODE SIC Description
GRAINS & CEREALS
11110 Growing of Cereals and other crops (not elsewhere classified)
30300 Manufacture of grain mill products and starches
30313 Handling and storage of grain
61502 Wholesale & retail in Agricultural machinery
62111 Sale and distribution of Agricultural raw materials and other farming inputsSource: AgriSETA, 2016
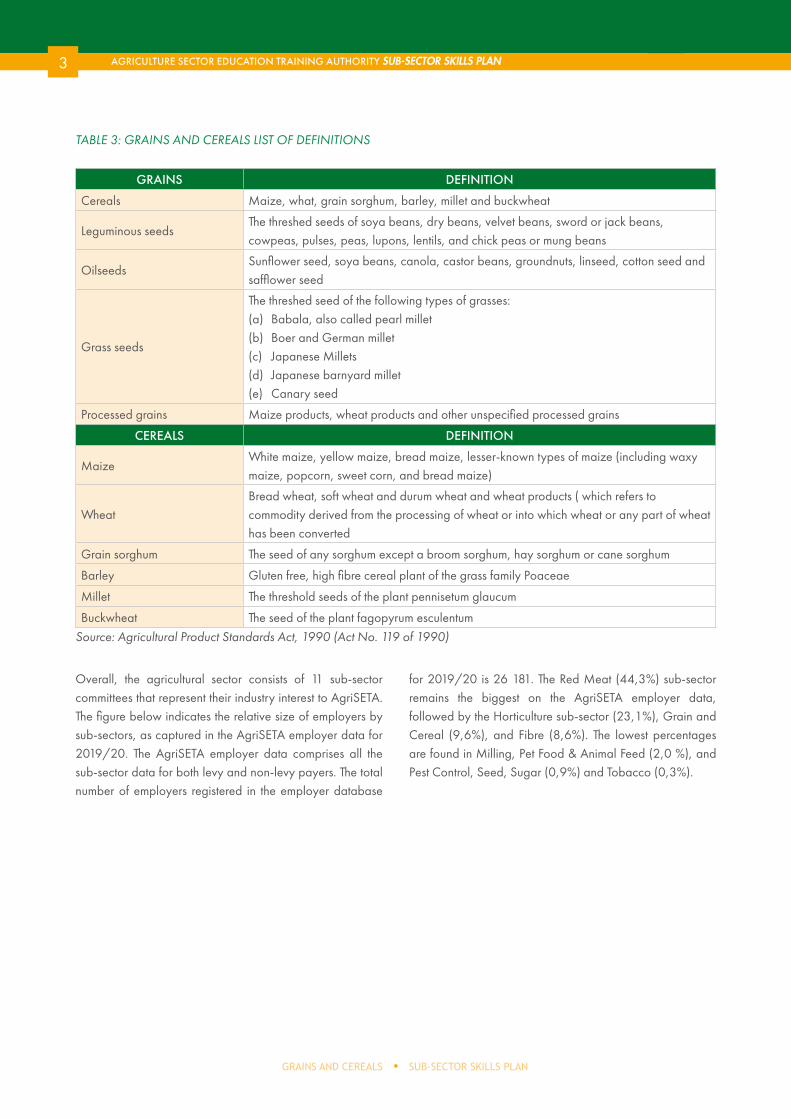
The table below illustrates that the sub-sector is comprised of 11 agricultural activities, as set out in the Agricultural Product Standards Act, 1999 (Act 119 of 1990). Under Grains, this
includes cereals, leguminous seeds, oilseeds, grass seeds and the processed grains thereof. Cereals include maize, wheat, grain sorghum, barley, millet and buckwheat.
3
GRAINS AND CEREALS SUB-SECTOR SKILLS PLAN
AGRICULTURE SECTOR EDUCATION TRAINING AUTHORITY SUB-SECTOR SKILLS PLAN
TABLE 3: GRAINS AND CEREALS LIST OF DEFINITIONS
GRAINS DEFINITION
Cereals Maize, what, grain sorghum, barley, millet and buckwheat
Leguminous seedsThe threshed seeds of soya beans, dry beans, velvet beans, sword or jack beans, cowpeas, pulses, peas, lupons, lentils, and chick peas or mung beans
OilseedsSunflower seed, soya beans, canola, castor beans, groundnuts, linseed, cotton seed and safflower seed
Grass seeds
The threshed seed of the following types of grasses: (a) Babala, also called pearl millet(b) Boer and German millet(c) Japanese Millets(d) Japanese barnyard millet(e) Canary seed
Processed grains Maize products, wheat products and other unspecified processed grains
CEREALS DEFINITION
MaizeWhite maize, yellow maize, bread maize, lesser-known types of maize (including waxy maize, popcorn, sweet corn, and bread maize)
WheatBread wheat, soft wheat and durum wheat and wheat products ( which refers to commodity derived from the processing of wheat or into which wheat or any part of wheat has been converted
Grain sorghum The seed of any sorghum except a broom sorghum, hay sorghum or cane sorghum
Barley Gluten free, high fibre cereal plant of the grass family Poaceae
Millet The threshold seeds of the plant pennisetum glaucum
Buckwheat The seed of the plant fagopyrum esculentumSource: Agricultural Product Standards Act, 1990 (Act No. 119 of 1990)
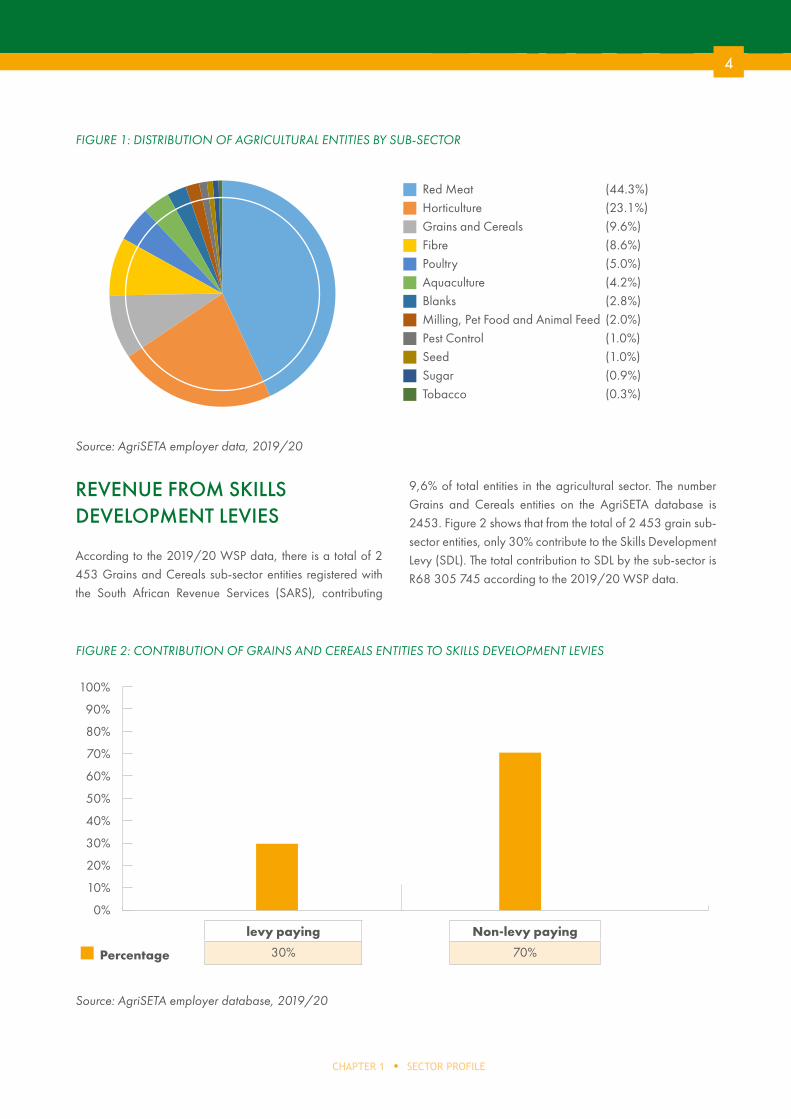
Overall, the agricultural sector consists of 11 sub-sector committees that represent their industry interest to AgriSETA. The figure below indicates the relative size of employers by sub-sectors, as captured in the AgriSETA employer data for 2019/20. The AgriSETA employer data comprises all the sub-sector data for both levy and non-levy payers. The total number of employers registered in the employer database
for 2019/20 is 26 181. The Red Meat (44,3%) sub-sector remains the biggest on the AgriSETA employer data, followed by the Horticulture sub-sector (23,1%), Grain and Cereal (9,6%), and Fibre (8,6%). The lowest percentages are found in Milling, Pet Food & Animal Feed (2,0 %), and Pest Control, Seed, Sugar (0,9%) and Tobacco (0,3%).
4
CHAPTER 1 SECTOR PROFILE
Source: AgriSETA employer data, 2019/20
Red Meat (44.3%)
Horticulture (23.1%)
Grains and Cereals (9.6%)
Fibre (8.6%)
Poultry (5.0%)
Aquaculture (4.2%)
Blanks (2.8%)
Milling, Pet Food and Animal Feed (2.0%)
Pest Control (1.0%)
Seed (1.0%)
Sugar (0.9%)
Tobacco (0.3%)
FIGURE 1: DISTRIBUTION OF AGRICULTURAL ENTITIES BY SUB-SECTOR
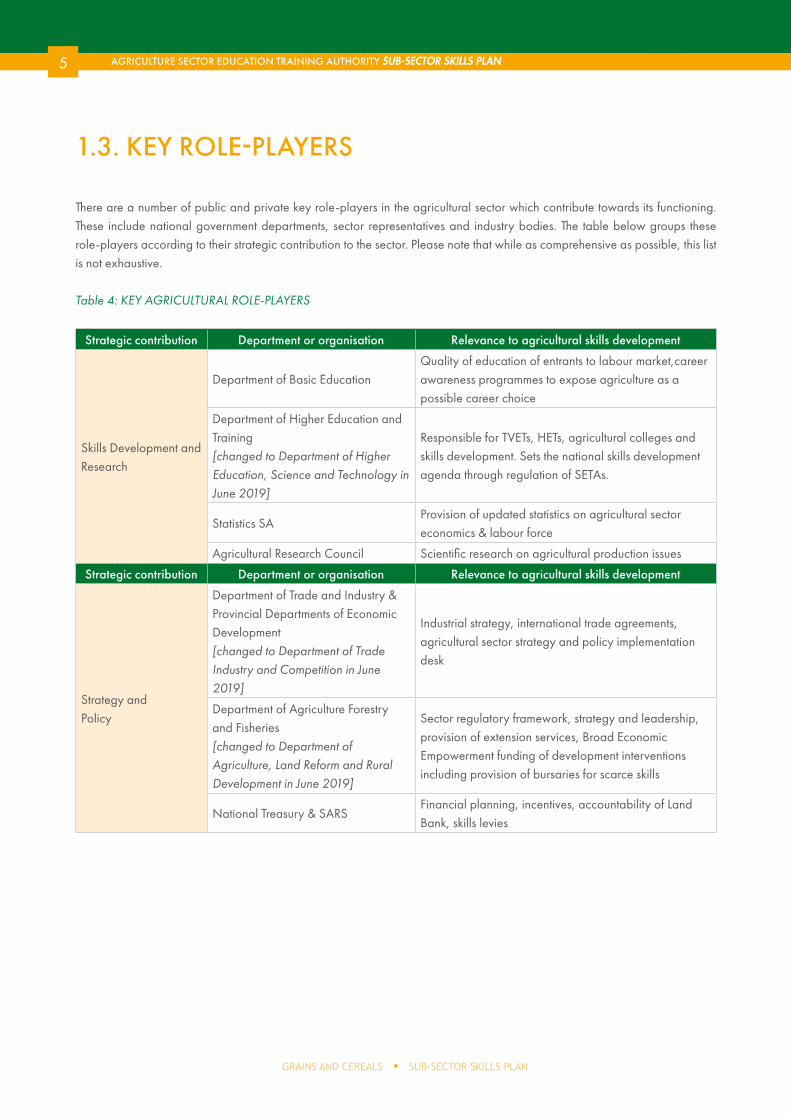
REVENUE FROM SKILLS DEVELOPMENT LEVIES
According to the 2019/20 WSP data, there is a total of 2 453 Grains and Cereals sub-sector entities registered with the South African Revenue Services (SARS), contributing
9,6% of total entities in the agricultural sector. The number Grains and Cereals entities on the AgriSETA database is 2453. Figure 2 shows that from the total of 2 453 grain sub-sector entities, only 30% contribute to the Skills Development Levy (SDL). The total contribution to SDL by the sub-sector is R68 305 745 according to the 2019/20 WSP data.
80%
70%
60%
50%
40%
30%
20%
10%
0%
levy paying Non-levy paying
Percentage 30% 70%
90%
100%
FIGURE 2: CONTRIBUTION OF GRAINS AND CEREALS ENTITIES TO SKILLS DEVELOPMENT LEVIES
Source: AgriSETA employer database, 2019/20
5
GRAINS AND CEREALS SUB-SECTOR SKILLS PLAN
AGRICULTURE SECTOR EDUCATION TRAINING AUTHORITY SUB-SECTOR SKILLS PLAN
1.3. KEY ROLE-PLAYERS
There are a number of public and private key role-players in the agricultural sector which contribute towards its functioning. These include national government departments, sector representatives and industry bodies. The table below groups these role-players according to their strategic contribution to the sector. Please note that while as comprehensive as possible, this list is not exhaustive.
Table 4: KEY AGRICULTURAL ROLE-PLAYERS
Strategic contribution Department or organisation Relevance to agricultural skills development
Skills Development and Research
Department of Basic Education Quality of education of entrants to labour market,career awareness programmes to expose agriculture as a possible career choice
Department of Higher Education and Training[changed to Department of Higher Education, Science and Technology in June 2019]
Responsible for TVETs, HETs, agricultural colleges and skills development. Sets the national skills development agenda through regulation of SETAs.
Statistics SAProvision of updated statistics on agricultural sector economics & labour force
Agricultural Research Council Scientific research on agricultural production issues
Strategic contribution Department or organisation Relevance to agricultural skills development
Strategy and Policy
Department of Trade and Industry & Provincial Departments of Economic Development[changed to Department of Trade Industry and Competition in June 2019]
Industrial strategy, international trade agreements, agricultural sector strategy and policy implementation desk
Department of Agriculture Forestry and Fisheries [changed to Department of Agriculture, Land Reform and Rural Development in June 2019]
Sector regulatory framework, strategy and leadership, provision of extension services, Broad Economic Empowerment funding of development interventions including provision of bursaries for scarce skills
National Treasury & SARSFinancial planning, incentives, accountability of Land Bank, skills levies
6
CHAPTER 1 SECTOR PROFILE
Strategic contribution Department or organisation Relevance to agricultural skills development
Planning
Department of LabourLabour legislation, wage determinations, employment equity
Department of Economic Development[changed to Department of Economic Development and Tourism]
Sector economic strategies
National Planning Commission Identify inter-departmental overlaps and gaps
Department of Environmental Affairs[changed to Department of Environment, Forestry and Fisheries in June 2019]
Policy and guidelines on environment protection and natural resource management, partner in environmental education
Department of Transport Planning for transport needs in rural areas.
Rural Development and Land Reform
Department of Rural Development and Land Reform[changed to Department of Agriculture, Land Reform and Rural Development in June 2019]
Partnering with AgriSETA in mobilising funds for capacity building of claimants
Department of Co-operative Governance and Traditional Affairs plus municipalities
Linking agricultural and rural development to IDPs and LED, infrastructure and services to agricultural enterprises
Services
Department of Water Affairs Water boards manage local irrigation schemes
Department of Energy Strategy to supply electricity to rural areas
South African Police ServiceCollaboration with agricultural community to address issues of farm security, including attacks, stock and property theft
Credit and assistance
Land and Agricultural Development Bank of South Africa
Financial services to commercial farming sector, agribusiness, and emerging farmers
Micro-Agricultural Financial Institutions of South Africa (MAFISA)
Production loans to smallholder operators.
Union and Sector representatives
Agri South Africa (AgriSA)Agricultural Union serving some 32 000 large and small commercial farmers
National African Farmers’ Union of South Africa (NAFU)
Represents black farmers to level the field in all agricultural matters
The African Farmers’ Association of South Africa (AFASA)
Represents commercial African farmers to bring black commercial farmers into mainstream agribusiness
Transvaal Agricultural Union South Africa (TAU SA)
A national agriculturalunion serving commercial farmers
Food and Allied Workers UnionRepresenting unionised agricultural and food processing workers.
Agribusiness
Agricultural Business Chamber Fosters a favorable agribusiness environment
Grain SAConglomerate organisation providing commodity strategic support and services to South African grain producers to support sustainability.
Source: 2015 GCIS Handbook, Agriculture and AgriSETA SSP 2011-2016
7
GRAINS AND CEREALS SUB-SECTOR SKILLS PLAN
AGRICULTURE SECTOR EDUCATION TRAINING AUTHORITY SUB-SECTOR SKILLS PLAN
1.4. ECONOMIC PERFORMANCE
OVERVIEW
According to Statistics South Africa (2018), the sector’s contribution to the GDP in 2018 was 2.3% while in the second quarter of 2019 the sector contributed 2.2% to the national GDP at the value of R74,158 billion as reported by BFAP (2019). The total volume of South African agriculture production for 2017 was estimated at 62.9 million tonnes which was a 24% increase compared to 2016. The sector has been reported to contribute 5% of total employment in South Africa as of June 2019 (StatsSA 2019). Notwithstanding the relatively small share of the total GDP, primary agriculture is an important sector in the South African economy. The value of primary agricultural production in South Africa was R273 544 million for the year ended 30 June 2018, a 2.1% increase from the previous year (DAFF, 2018).
According to DAFF (2018), the gross income from field crops decreased by 9.8% from R63 557 million in 2017 to R57 329 million in December 2018, with maize contributing R23 517 million of the total income.
The Grains and Cereal sub-sector accounts for about 30% of total gross agricultural production in the country (AgriSA, 2017). The grain industry (barley, maize, oats, sorghum and wheat) is one of the largest agricultural industries in South Africa. Maize remains the most prominent field crop in South Africa. The maize industry contributes 0.4% to the national GDP and the industry is interlinked with many industries in the manufacturing sector. Approximately 70% of agricultural output is used as intermediate products, which further illustrates that the sector is a key driver in the South African economy (AgriSA, 2017).
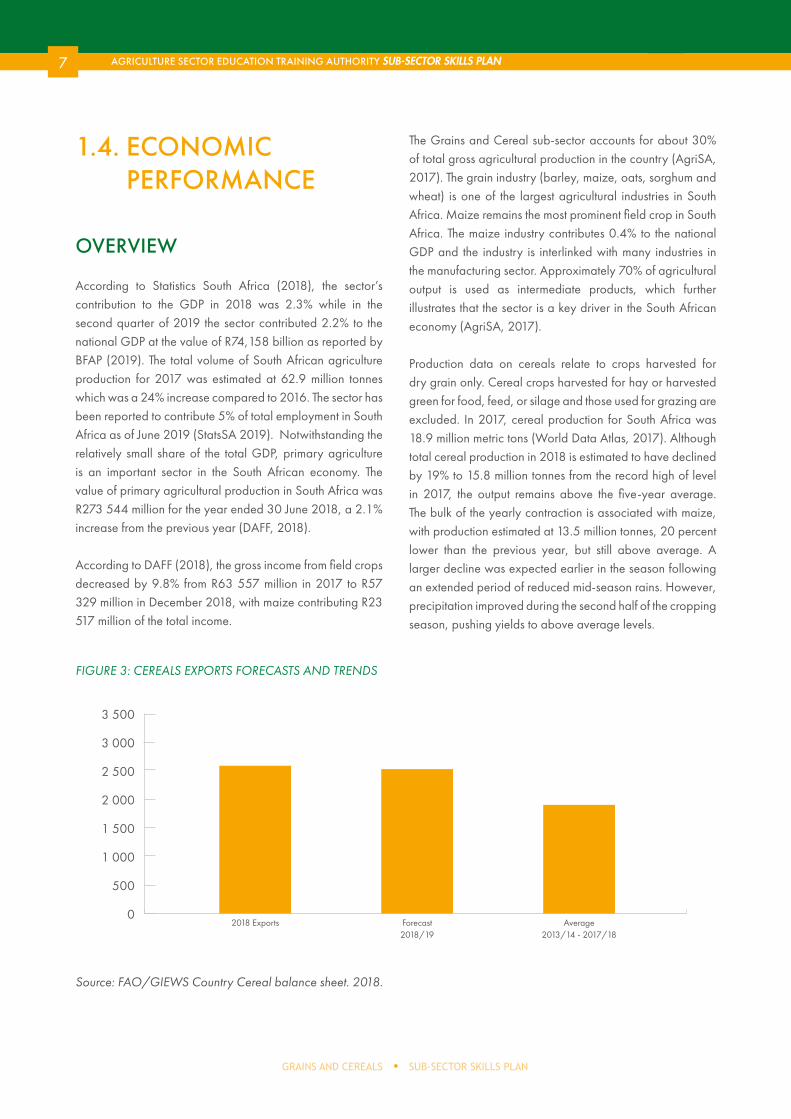
Production data on cereals relate to crops harvested for dry grain only. Cereal crops harvested for hay or harvested green for food, feed, or silage and those used for grazing are excluded. In 2017, cereal production for South Africa was 18.9 million metric tons (World Data Atlas, 2017). Although total cereal production in 2018 is estimated to have declined by 19% to 15.8 million tonnes from the record high of level in 2017, the output remains above the five-year average. The bulk of the yearly contraction is associated with maize, with production estimated at 13.5 million tonnes, 20 percent lower than the previous year, but still above average. A larger decline was expected earlier in the season following an extended period of reduced mid-season rains. However, precipitation improved during the second half of the cropping season, pushing yields to above average levels.
3 500
1 000
2 000
3 000
0
2 500
500
1 500
2018 Exports Forecast2018/19
Average 2013/14 - 2017/18
FIGURE 3: CEREALS EXPORTS FORECASTS AND TRENDS
Source: FAO/GIEWS Country Cereal balance sheet. 2018.
8
CHAPTER 1 SECTOR PROFILE
The graph above indicates the average exported cereal for the period of 2013/14 to 2017/18. The result indicated that during the mentioned period, the average of cereal exported is about 1 900 tonnes while in 2018, 2 600 cereals were exported from South Africa.
The animal feed industry is an important client and role-player in the grain supply chain as it consumes about 6.0
million tons of grain and 1.6 million tons of oil cake (from imported and locally produced sunflower and soybeans) for manufacturing animal feeds. Maize remains the most prominent field crop in South Africa with an average production of around 12 million tons per annum (Export.gov, 2019). The table below shows the total area which was planted and the total production for the four major crops under the Grains and Cereals sub-sector.
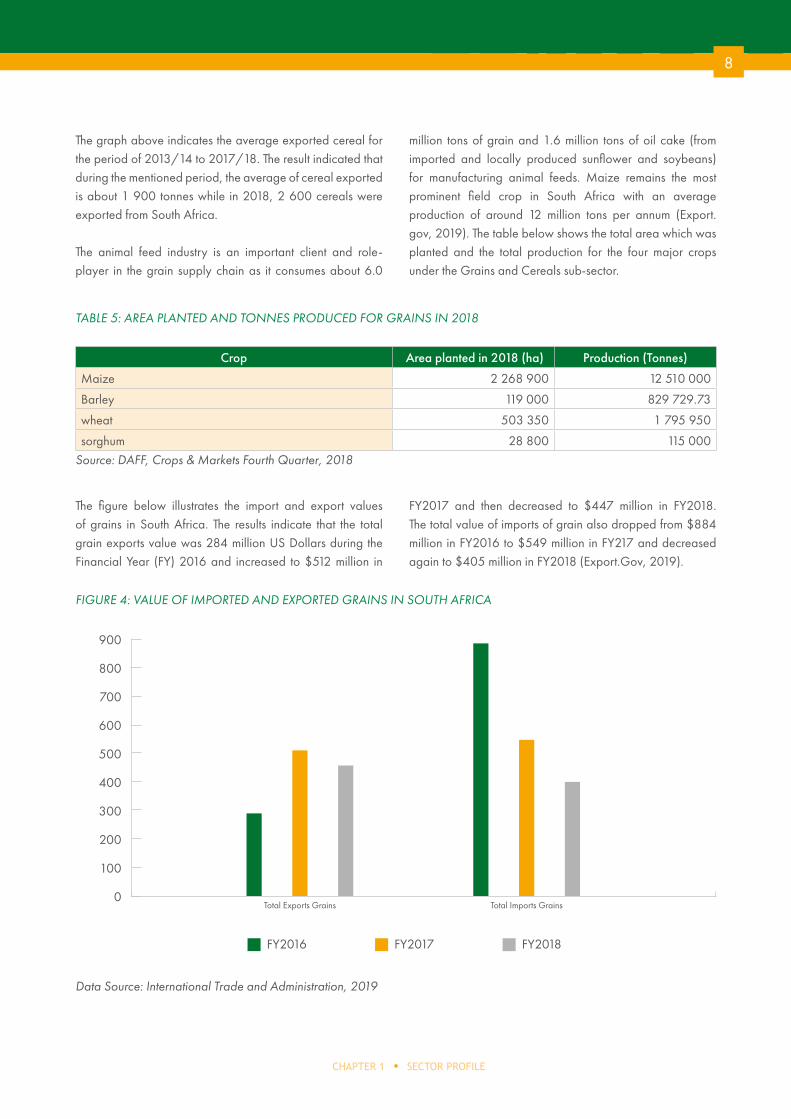
TABLE 5: AREA PLANTED AND TONNES PRODUCED FOR GRAINS IN 2018
Crop Area planted in 2018 (ha) Production (Tonnes)
Maize 2 268 900 12 510 000
Barley 119 000 829 729.73
wheat 503 350 1 795 950
sorghum 28 800 115 000Source: DAFF, Crops & Markets Fourth Quarter, 2018
FIGURE 4: VALUE OF IMPORTED AND EXPORTED GRAINS IN SOUTH AFRICA
The figure below illustrates the import and export values of grains in South Africa. The results indicate that the total grain exports value was 284 million US Dollars during the Financial Year (FY) 2016 and increased to $512 million in
FY2017 and then decreased to $447 million in FY2018. The total value of imports of grain also dropped from $884 million in FY2016 to $549 million in FY217 and decreased again to $405 million in FY2018 (Export.Gov, 2019).
700
900
200
400
600
0
500
800
100
300
Total Imports GrainsTotal Exports Grains
FY2016 FY2017 FY2018
Data Source: International Trade and Administration, 2019
9
GRAINS AND CEREALS SUB-SECTOR SKILLS PLAN
AGRICULTURE SECTOR EDUCATION TRAINING AUTHORITY SUB-SECTOR SKILLS PLAN
ECONOMIC OUTLOOK OF THE SUB-SECTOR
Similar to other agricultural sub-sectors, the Grains and Cereals sub-sector was affected by the drought conditions of the past few years, in particular of 2015-2016 which is considered the worst drought in 30 years. The weak rand, weather volatility and falling farm incomes are predicted to exert downward pressure on the market. However, in the longer term it is predicted that revenue in the sector will be boosted by growth of about 40% from food consumption due to the growth of the middle class and disposable income. Business Monitor International (BMI) estimates that annual food consumption revenue will reach over R609 billion in 2018. In 2019, a revenue of approximately R980 billion was
reported and it is estimated that annual food consumption revenue will reach R1 trillion by 2023. Worldwide (Statista, 2019). This is expected to have a huge impact on the Grains and Cereals industry as they form part of human staple foods.
1.5 EMPLOYER PROFILE
The Grains and Cereals sub-sector represents 9.6% with a total of 2 453 employers of the total number of 26 181 employers on the AgriSETA employer database representing all the sub-sectors in the agricultural sector.
The provincial distribution of Grains and Cereals employers registered with AgriSETA is reflected in the pie chart below.
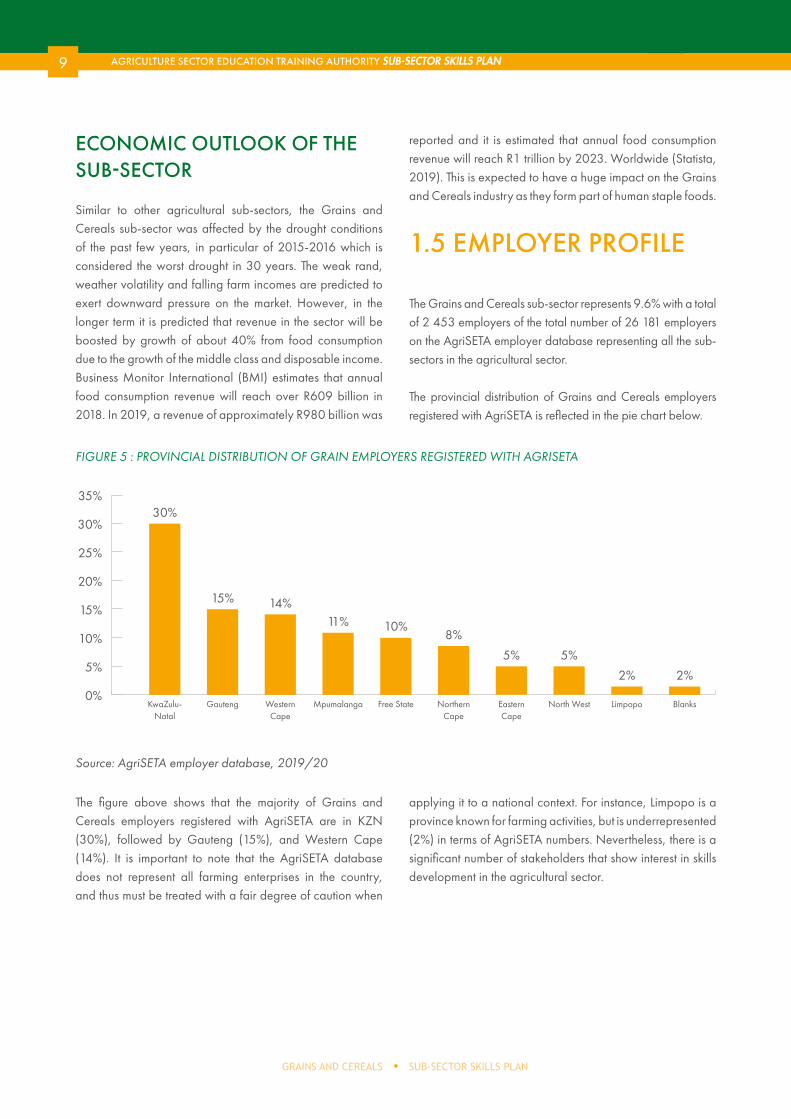
FIGURE 5 : PROVINCIAL DISTRIBUTION OF GRAIN EMPLOYERS REGISTERED WITH AGRISETA
35%
10%
20%
30%
0%
25%
5%
15%
KwaZulu-Natal
Gauteng Western Cape
Mpumalanga Free State Northern Cape
BlanksEastern Cape
North West Limpopo
30%
5%
11%8%
2%
15%
2%
10%
5%
14%
Source: AgriSETA employer database, 2019/20
The figure above shows that the majority of Grains and Cereals employers registered with AgriSETA are in KZN (30%), followed by Gauteng (15%), and Western Cape (14%). It is important to note that the AgriSETA database does not represent all farming enterprises in the country, and thus must be treated with a fair degree of caution when
applying it to a national context. For instance, Limpopo is a province known for farming activities, but is underrepresented (2%) in terms of AgriSETA numbers. Nevertheless, there is a significant number of stakeholders that show interest in skills development in the agricultural sector.
10
CHAPTER 1 SECTOR PROFILE
1.6 LABOUR MARKET PROFILE
PROVINCIAL DISTRIBUTION OF EMPLOYEES
The South African agricultural sector is one of the biggest employers in the country. In the first quarter of 2019, Stats SA reported that a total of 837 000 people were employed in the sector which is 5% of the total employment in the country.
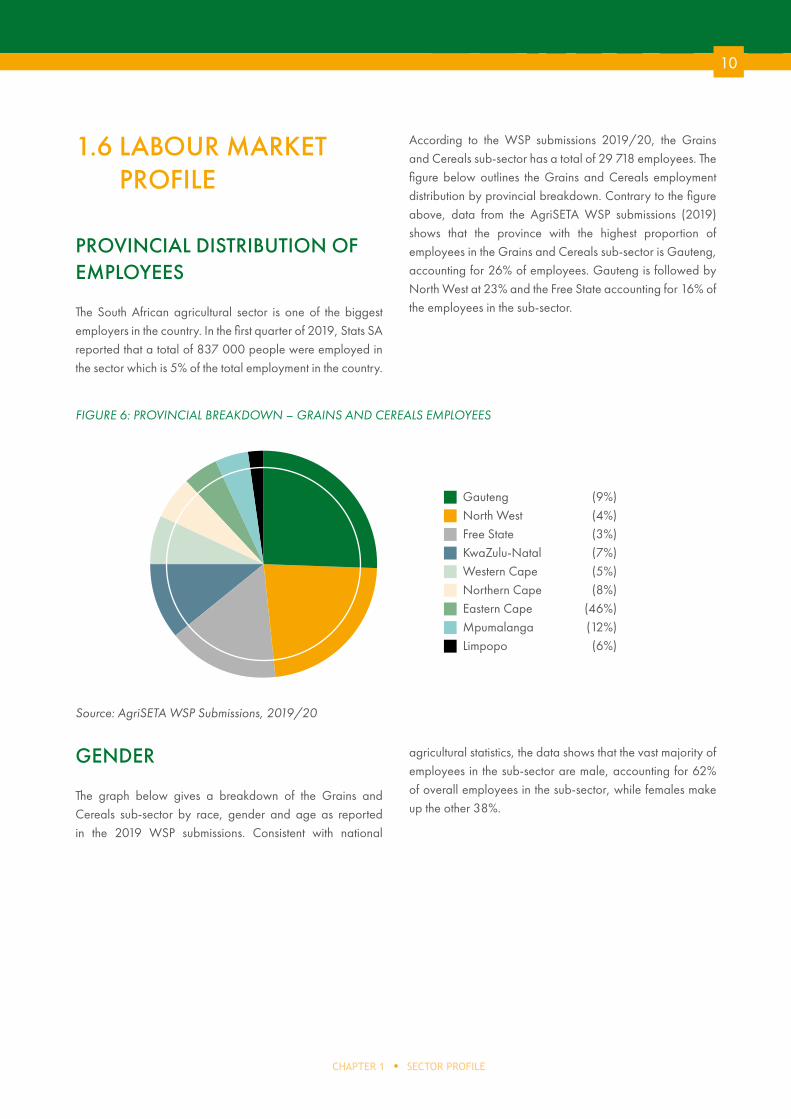
According to the WSP submissions 2019/20, the Grains and Cereals sub-sector has a total of 29 718 employees. The figure below outlines the Grains and Cereals employment distribution by provincial breakdown. Contrary to the figure above, data from the AgriSETA WSP submissions (2019) shows that the province with the highest proportion of employees in the Grains and Cereals sub-sector is Gauteng, accounting for 26% of employees. Gauteng is followed by North West at 23% and the Free State accounting for 16% of the employees in the sub-sector.
GENDER
The graph below gives a breakdown of the Grains and Cereals sub-sector by race, gender and age as reported in the 2019 WSP submissions. Consistent with national
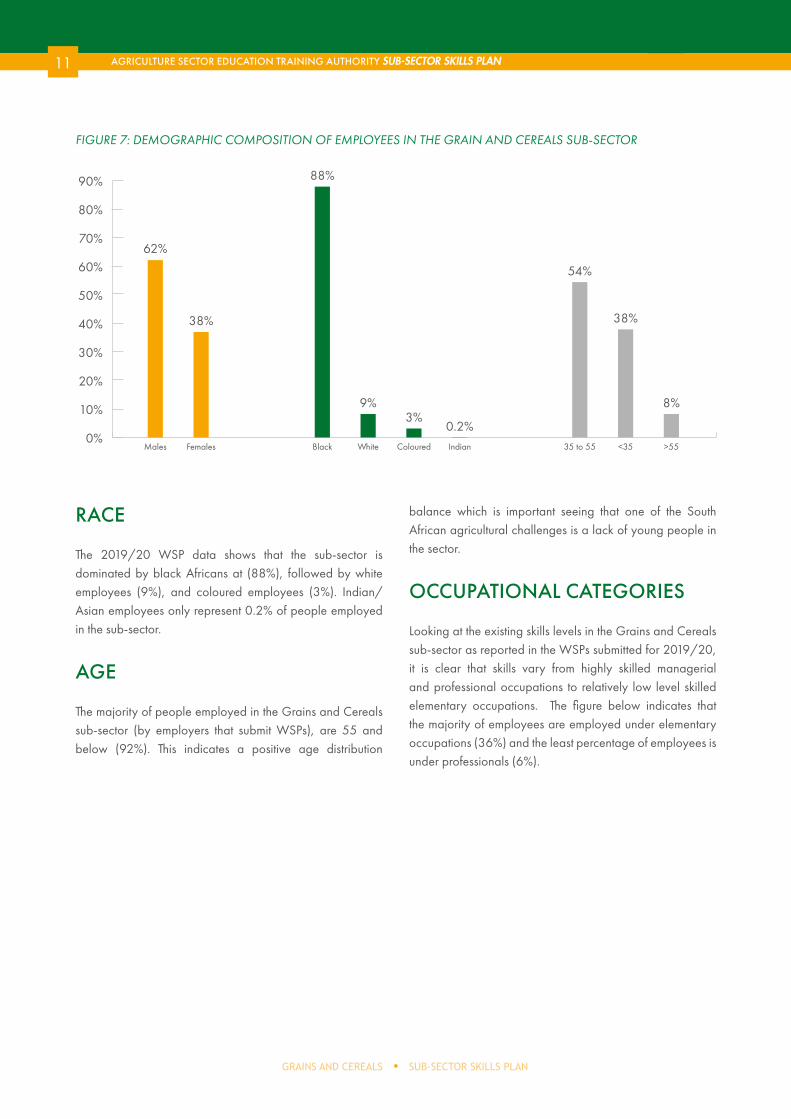
agricultural statistics, the data shows that the vast majority of employees in the sub-sector are male, accounting for 62% of overall employees in the sub-sector, while females make up the other 38%.
Gauteng (9%)
North West (4%)
Free State (3%)
KwaZulu-Natal (7%)
Western Cape (5%)
Northern Cape (8%)
Eastern Cape (46%)
Mpumalanga (12%)
Limpopo (6%)
FIGURE 6: PROVINCIAL BREAKDOWN – GRAINS AND CEREALS EMPLOYEES
Source: AgriSETA WSP Submissions, 2019/20
11
GRAINS AND CEREALS SUB-SECTOR SKILLS PLAN
AGRICULTURE SECTOR EDUCATION TRAINING AUTHORITY SUB-SECTOR SKILLS PLAN
FIGURE 7: DEMOGRAPHIC COMPOSITION OF EMPLOYEES IN THE GRAIN AND CEREALS SUB-SECTOR
RACE
The 2019/20 WSP data shows that the sub-sector is dominated by black Africans at (88%), followed by white employees (9%), and coloured employees (3%). Indian/Asian employees only represent 0.2% of people employed in the sub-sector.
AGE
The majority of people employed in the Grains and Cereals sub-sector (by employers that submit WSPs), are 55 and below (92%). This indicates a positive age distribution
balance which is important seeing that one of the South African agricultural challenges is a lack of young people in the sector.
OCCUPATIONAL CATEGORIES
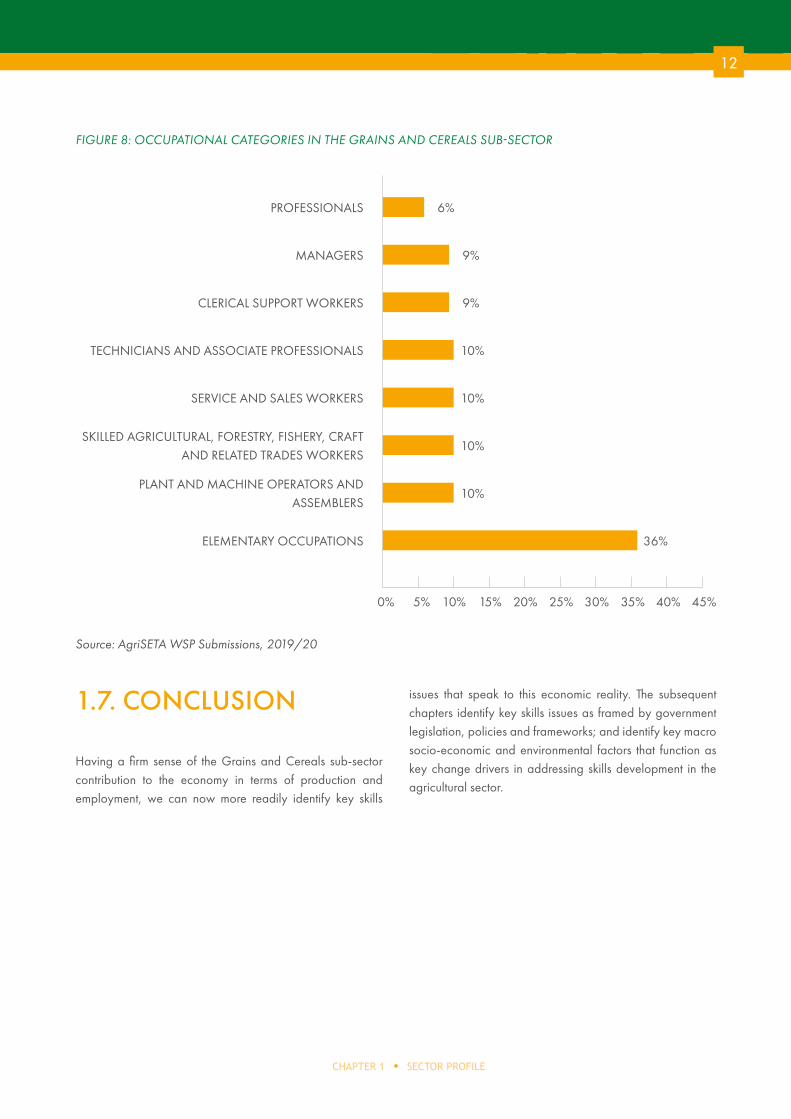
Looking at the existing skills levels in the Grains and Cereals sub-sector as reported in the WSPs submitted for 2019/20, it is clear that skills vary from highly skilled managerial and professional occupations to relatively low level skilled elementary occupations. The figure below indicates that the majority of employees are employed under elementary occupations (36%) and the least percentage of employees is under professionals (6%).
70%
90%
20%
40%
60%
0%
50%
80%
10%
30%
Males Black 35 to 55Coloured >55Females White <35Indian
62%
88%
54%
3%8%
38%
9%
38%
0.2%
12
CHAPTER 1 SECTOR PROFILE
1.7. CONCLUSION
Having a firm sense of the Grains and Cereals sub-sector contribution to the economy in terms of production and employment, we can now more readily identify key skills
issues that speak to this economic reality. The subsequent chapters identify key skills issues as framed by government legislation, policies and frameworks; and identify key macro socio-economic and environmental factors that function as key change drivers in addressing skills development in the agricultural sector.
35% 45%10% 20% 30%0% 25% 40%5% 15%
36%ELEMENTARY OCCUPATIONS
10%SKILLED AGRICULTURAL, FORESTRY, FISHERY, CRAFT
AND RELATED TRADES WORKERS
10%TECHNICIANS AND ASSOCIATE PROFESSIONALS
9%CLERICAL SUPPORT WORKERS
10%PLANT AND MACHINE OPERATORS AND
ASSEMBLERS
10%SERVICE AND SALES WORKERS
9%MANAGERS
6%PROFESSIONALS
FIGURE 8: OCCUPATIONAL CATEGORIES IN THE GRAINS AND CEREALS SUB-SECTOR
Source: AgriSETA WSP Submissions, 2019/20
13
SUB-SECTOR SKILLS PLANGRAINS AND CEREALS
AGRICULTURE SECTOR EDUCATION TRAINING AUTHORITY SUB-SECTOR SKILLS PLAN
CHAPTER 2KEY SKILLS ISSUES
13 AGRICULTURE SECTOR EDUCATION TRAINING AUTHORITY SUB-SECTOR SKILLS PLAN
14
CHAPTER 2 KEY SKILLS ISSUES
2.1. INTRODUCTION
This chapter is concerned with two specific areas that shape the key skills issues in the Grains and Cereals sub-sector. Firstly, the bulk of this chapter will be concerned with identifying factors that are driving change in the sub-sector; factors that are influencing the need for a particular skill set or rendering them irrelevant in an ever changing world.
Secondly, the alignment of sector skills planning to national strategies and plans will be analysed to provide a snapshot of the key policy and planning documents that shape skills planning in the Grains and Cereals sub-sector.
2.2. CHANGE DRIVERS
There are factors (consumer behaviour, technology and mechanisation, and climate change and drought) that presently influence skills demand and supply in the Grains and Cereals sub-sector. These were identified through thematic synthesis and triangulated through internal and external stakeholder engagement, desktop research and policy documents.
CONSUMER BEHAVIOR
The increase in population growth and rising disposable income and changing consumer habits have helped fuel domestic food consumption growth supporting local production. In addition to this, huge sums have been invested in the ‘Proudly South African’ food campaign, which is designed to encourage consumers to buy domestically grown and produced goods and advertise their quality. Euromonitor International (2017) says that optimism appears to have rebounded after a period of low consumer confidence and sluggish consumer spending growth. The growing number of single-person households is driving increased demand for products catering to single consumers, such as single-serve ready meals and other packaged food, and this is expected to continue in coming years. In addition, SA population growth has put pressure on the maize supply as more maize
is required for consumption, compared to previous years. What usually happens when prices go up is that people buy less, however that has not been the case with white maize since it is a staple food in the country. The demand for maize as animal feed is also at a higher level.
TECHNOLOGY AND MECHANISATION
Development and production enterprises in agriculture place an emphasis on technological advancement to increase productivity and keep up with increasing demands for food. However, there has not been a concomitant focus on advancing technological skills in the sector. BMI (2016) reported that, “the agricultural mechanisation rate in Africa is the lowest in the world”.
The threatening maxim of the sector is that “as agriculture becomes more mechanised, the unskilled labour force is replaced by a significantly smaller skilled labour force” (Employment Conditions Commission, 2013). Nevertheless, South Africa’s situation is somewhat different to the rest of Africa. For instance, South Africa, Morocco and Tunisia comprise the majority Africa’s new tractor sales (BMI, 2016). Thus, to remain competitive globally, skills training in agriculture needs to keep up with technological progress. Internal consultation with AgriSETA staff reveals that there is an increasing demand for artisans and technically qualified workers in response to increased mechanisation in the sector.
CLIMATE CHANGE AND DROUGHT
The 2015/16 drought, a result of the worldwide El Niño effect, is said to be the worst to hit the country since 1992, and has shifted the domestic maize market into a net important situation (BMI, 2016, GrainSA, 2015, AgriSA). Maize production is expected to decline by 38.8% year-on-year, while sugar production will decline by 20.2% 2015/16 (BMI, 2016). Whilst South Africa is food secure at national level, the country is still food insecure at household level as not all households have access to adequate food. Almost 20% of South African households had inadequate or
15
SUB-SECTOR SKILLS PLANGRAINS AND CEREALS
AGRICULTURE SECTOR EDUCATION TRAINING AUTHORITY SUB-SECTOR SKILLS PLAN
severe inadequate access to food in 2017 (Stats SA, 2017) and the drought could have further deleterious effects on food security. The drought, along with other challenging environmental factors, could act as a disincentive from pursuing an agricultural career. National food security depends on a “capital-intensive agricultural sector based on economies of scale” (Kane-Berman, 2016), and thus smaller producers are even more at risk during drought – a difficult economic and environmental climate in which to take risks. Subsistence and smaller commercial farms should be offered support, but equally commercial farms need to attract those with green knowledge skills to ensure food security for South Africans generally.
2.3 ALIGNMENT WITH NATIONAL STRATEGIES AND PLANS
The following section draws attention to the national strategy and planning documents that frame AgriSETA’s mandate for skills development. The legislative and policy frameworks speak to AgriSETA’s constitutional mandate as a public institution governed by the Public Finance Management Act to develop skills programmes in accordance with the Skills Development Act, (1998), the Skills Development Levies Act (1999), and the National Qualifications Framework Act (2008).
There are two seminal strategic documents that underpin AgriSETA’s mandate for skills planning, namely: the White Paper on Post School Education & Training (2013) and the National Skills Development Plan (2030). Both of these documents highlight the SETAs roles in developing clear, sector-specific linkages between education and the workplace through an analysis of the demand and supply of skills in their sector. These documents call for credible
institutional mechanisms for skills planning, programmes that are occupationally oriented, and responsive higher and further education and training institutions. Furthermore, attention should be given to the needs of local, community enterprises, co-operatives and the like, with a focus on developing their skills capacities to meet the needs of their particular environments, thereby closing the gap between the rural and urban South African economies.
NSDP is informed and guided by the following overarching government plans: • The National Skills Accord as one of the first outcomes
of the New Growth Path, the Industrial Policy Action Plan, 2013/14 – 2015/16 (IPAP).
• The Comprehensive Rural Development Programme, the Human Resources Development Strategy for South Africa 2030.
• The National Development Plan 2030 (NDP).• The Integrated Sustainable Rural Development
Strategy (ISRDS).
Collectively, these government plans and programmes recognise the need for correcting structural imbalances in the economy through “decent employment through inclusive growth”, “a skilled and capable workforce to support an inclusive growth path”, “vibrant equitable and sustainable rural communities contributing towards food security for all”, to “protect and enhance our environmental assets and natural resources”, with the support of “an efficient, effective and development-oriented public service” (NDP). These priorities speak to the need for relevant and targeted skills provision that promotes economic sustainability in the agricultural sector, as well as meeting the needs of all South African communities (rural and urban) in terms of food provision and sustainable livelihoods.
PESTEL
The latest political, economic, social, technological, environmental and legal (PESTEL) factors influencing skills development in the sector are summarised in the table below.
16
CHAPTER 2 KEY SKILLS ISSUES
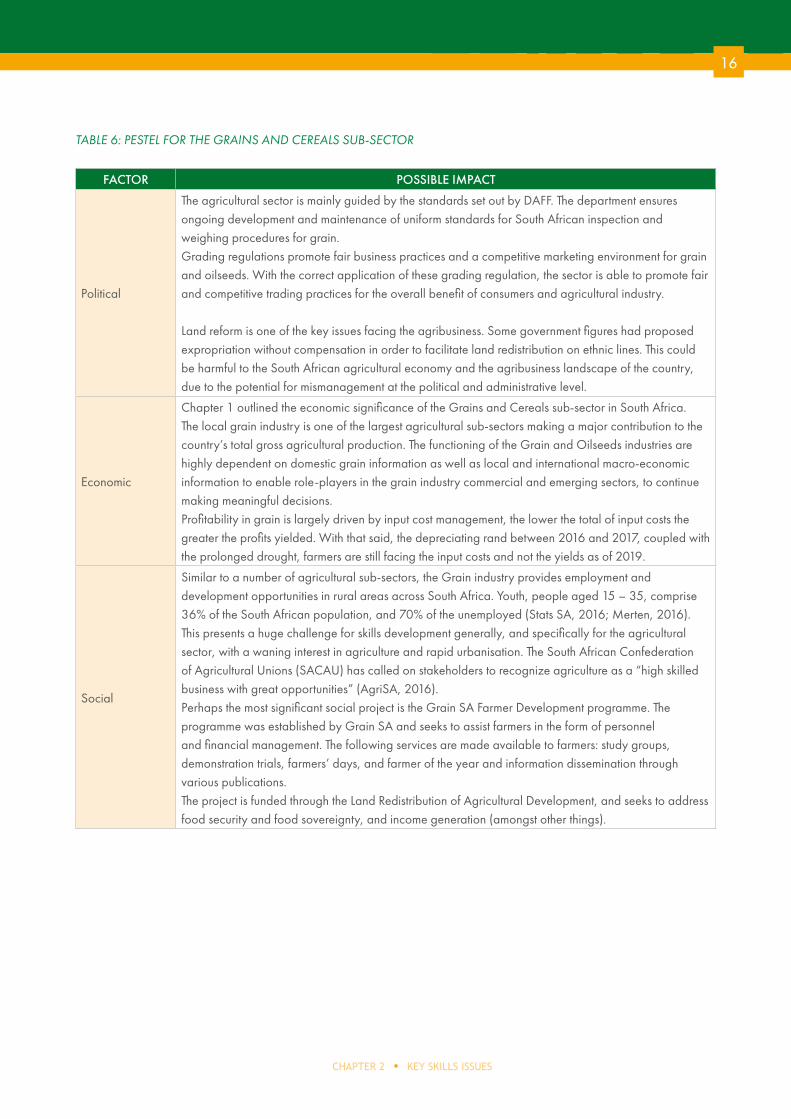
TABLE 6: PESTEL FOR THE GRAINS AND CEREALS SUB-SECTOR
FACTOR POSSIBLE IMPACT
Political
The agricultural sector is mainly guided by the standards set out by DAFF. The department ensures ongoing development and maintenance of uniform standards for South African inspection and weighing procedures for grain. Grading regulations promote fair business practices and a competitive marketing environment for grain and oilseeds. With the correct application of these grading regulation, the sector is able to promote fair and competitive trading practices for the overall benefit of consumers and agricultural industry.
Land reform is one of the key issues facing the agribusiness. Some government figures had proposed expropriation without compensation in order to facilitate land redistribution on ethnic lines. This could be harmful to the South African agricultural economy and the agribusiness landscape of the country, due to the potential for mismanagement at the political and administrative level.
Economic
Chapter 1 outlined the economic significance of the Grains and Cereals sub-sector in South Africa. The local grain industry is one of the largest agricultural sub-sectors making a major contribution to the country’s total gross agricultural production. The functioning of the Grain and Oilseeds industries are highly dependent on domestic grain information as well as local and international macro-economic information to enable role-players in the grain industry commercial and emerging sectors, to continue making meaningful decisions. Profitability in grain is largely driven by input cost management, the lower the total of input costs the greater the profits yielded. With that said, the depreciating rand between 2016 and 2017, coupled with the prolonged drought, farmers are still facing the input costs and not the yields as of 2019.
Social
Similar to a number of agricultural sub-sectors, the Grain industry provides employment and development opportunities in rural areas across South Africa. Youth, people aged 15 – 35, comprise 36% of the South African population, and 70% of the unemployed (Stats SA, 2016; Merten, 2016). This presents a huge challenge for skills development generally, and specifically for the agricultural sector, with a waning interest in agriculture and rapid urbanisation. The South African Confederation of Agricultural Unions (SACAU) has called on stakeholders to recognize agriculture as a “high skilled business with great opportunities” (AgriSA, 2016).Perhaps the most significant social project is the Grain SA Farmer Development programme. The programme was established by Grain SA and seeks to assist farmers in the form of personnel and financial management. The following services are made available to farmers: study groups, demonstration trials, farmers’ days, and farmer of the year and information dissemination through various publications. The project is funded through the Land Redistribution of Agricultural Development, and seeks to address food security and food sovereignty, and income generation (amongst other things).
17
SUB-SECTOR SKILLS PLANGRAINS AND CEREALS
AGRICULTURE SECTOR EDUCATION TRAINING AUTHORITY SUB-SECTOR SKILLS PLAN
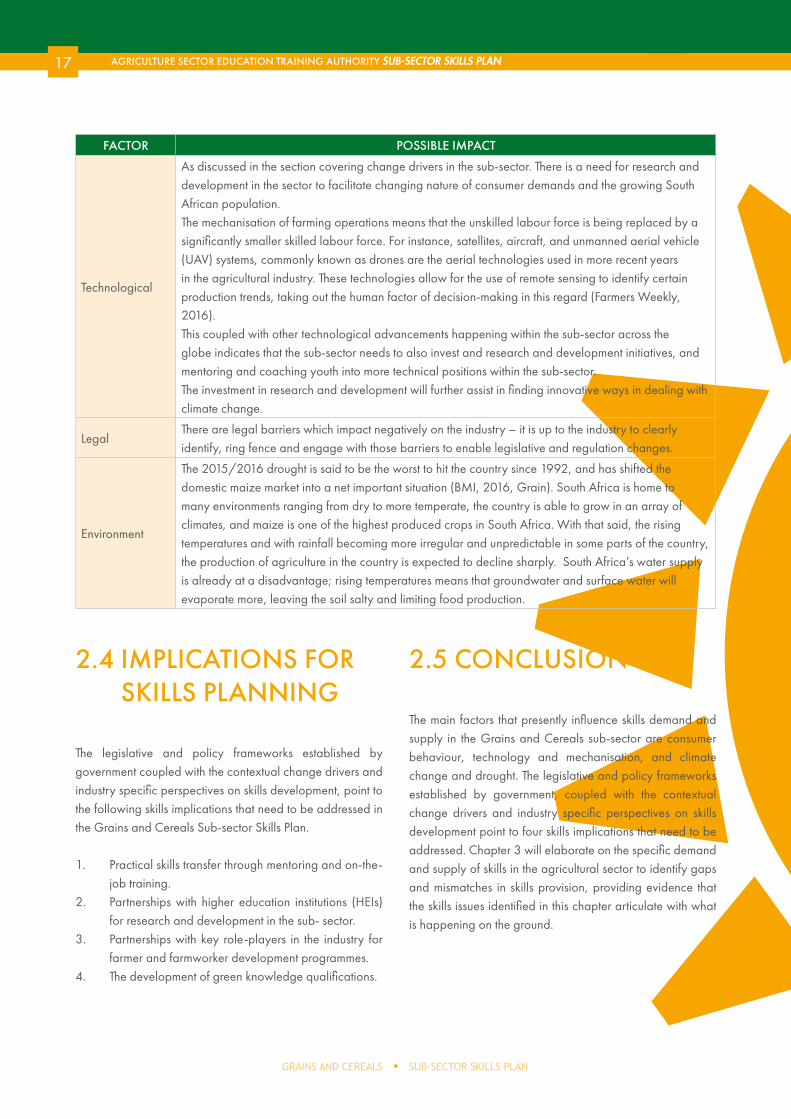
FACTOR POSSIBLE IMPACT
Technological
As discussed in the section covering change drivers in the sub-sector. There is a need for research and development in the sector to facilitate changing nature of consumer demands and the growing South African population.The mechanisation of farming operations means that the unskilled labour force is being replaced by a significantly smaller skilled labour force. For instance, satellites, aircraft, and unmanned aerial vehicle (UAV) systems, commonly known as drones are the aerial technologies used in more recent years in the agricultural industry. These technologies allow for the use of remote sensing to identify certain production trends, taking out the human factor of decision-making in this regard (Farmers Weekly, 2016). This coupled with other technological advancements happening within the sub-sector across the globe indicates that the sub-sector needs to also invest and research and development initiatives, and mentoring and coaching youth into more technical positions within the sub-sector.The investment in research and development will further assist in finding innovative ways in dealing with climate change.
LegalThere are legal barriers which impact negatively on the industry – it is up to the industry to clearly identify, ring fence and engage with those barriers to enable legislative and regulation changes.
Environment
The 2015/2016 drought is said to be the worst to hit the country since 1992, and has shifted the domestic maize market into a net important situation (BMI, 2016, Grain). South Africa is home to many environments ranging from dry to more temperate, the country is able to grow in an array of climates, and maize is one of the highest produced crops in South Africa. With that said, the rising temperatures and with rainfall becoming more irregular and unpredictable in some parts of the country, the production of agriculture in the country is expected to decline sharply. South Africa’s water supply is already at a disadvantage; rising temperatures means that groundwater and surface water will evaporate more, leaving the soil salty and limiting food production.
2.4 IMPLICATIONS FOR SKILLS PLANNING
The legislative and policy frameworks established by government coupled with the contextual change drivers and industry specific perspectives on skills development, point to the following skills implications that need to be addressed in the Grains and Cereals Sub-sector Skills Plan.
1. Practical skills transfer through mentoring and on-the-job training.
2. Partnerships with higher education institutions (HEIs) for research and development in the sub- sector.
3. Partnerships with key role-players in the industry for farmer and farmworker development programmes.
4. The development of green knowledge qualifications.
2.5 CONCLUSION
The main factors that presently influence skills demand and supply in the Grains and Cereals sub-sector are consumer behaviour, technology and mechanisation, and climate change and drought. The legislative and policy frameworks established by government, coupled with the contextual change drivers and industry specific perspectives on skills development point to four skills implications that need to be addressed. Chapter 3 will elaborate on the specific demand and supply of skills in the agricultural sector to identify gaps and mismatches in skills provision, providing evidence that the skills issues identified in this chapter articulate with what is happening on the ground.

18
CHAPTER 2 KEY SKILLS ISSUES
18
CHAPTER 2 KEY SKILLS ISSUES
19
SUB-SECTOR SKILLS PLANGRAINS AND CEREALS
AGRICULTURE SECTOR EDUCATION TRAINING AUTHORITY SUB-SECTOR SKILLS PLAN
CHAPTER 3OCCUPATIONAL SHORTAGES AND SKILLS GAPS
19 AGRICULTURE SECTOR EDUCATION TRAINING AUTHORITY SUB-SECTOR SKILLS PLAN
20
CHAPTER 3 OCCUPATIONAL SHORTAGES AND SKILLS GAPS
3.1. INTRODUCTION
Chapter 3 reflects the research completed on skills demand and supply in the Grains and Cereals sub-sector. The outcome is the result of an analysis of previous Sector Skills Plans, 2018/19 WSP data, as well as engagement with AgriSETA stakeholders. Engagements included interviews, surveys and limited focus groups with external partners, stakeholders and AgriSETA member companies, as well as consultation with internal stakeholders, conducted between 2015 and 2016. Effort was taken to ensure cross sectoral inputs were obtained by reaching out to large levy payers, industry bodies, government departments as well as emerging small scale entrants in the sector.
3.2. EXTENT AND NATURE OF DEMAND
OCCUPATONAL SHORTAGES AND SKILLS GAPS
Hard-to-fill Vacancies (HTFVs)
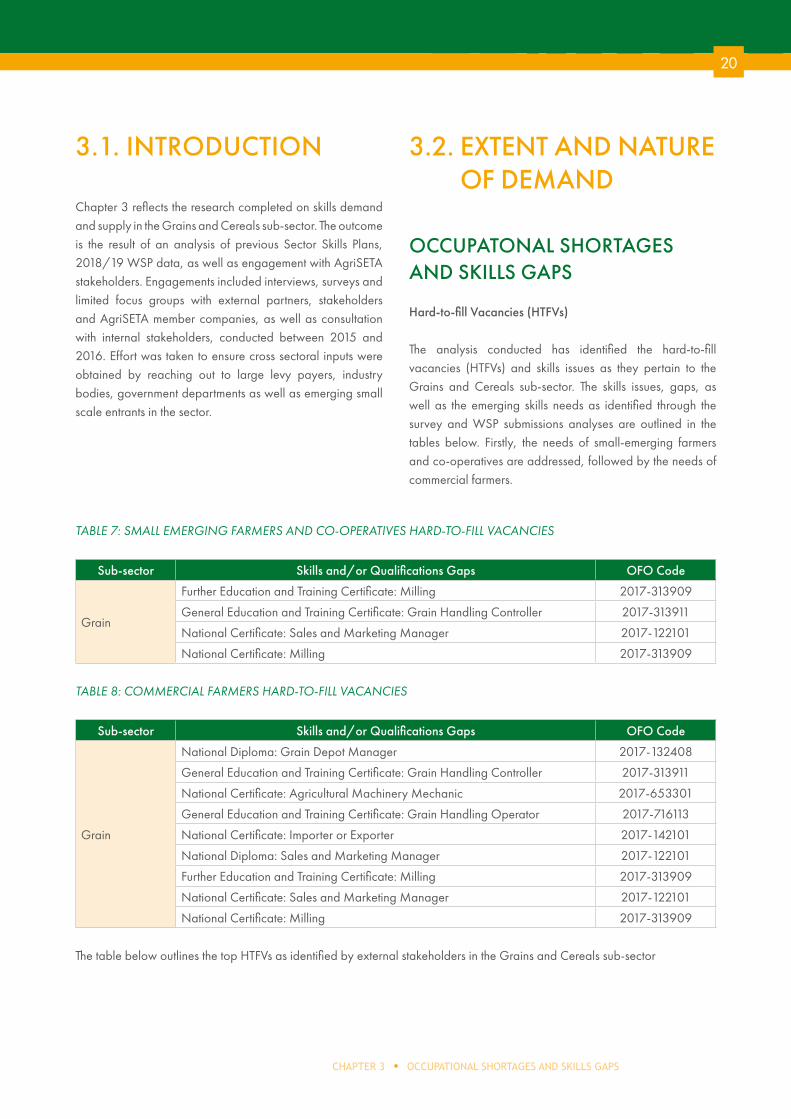
The analysis conducted has identified the hard-to-fill vacancies (HTFVs) and skills issues as they pertain to the Grains and Cereals sub-sector. The skills issues, gaps, as well as the emerging skills needs as identified through the survey and WSP submissions analyses are outlined in the tables below. Firstly, the needs of small-emerging farmers and co-operatives are addressed, followed by the needs of commercial farmers.
TABLE 7: SMALL EMERGING FARMERS AND CO-OPERATIVES HARD-TO-FILL VACANCIES
Sub-sector Skills and/or Qualifications Gaps OFO Code
Grain
Further Education and Training Certificate: Milling 2017-313909
General Education and Training Certificate: Grain Handling Controller 2017-313911
National Certificate: Sales and Marketing Manager 2017-122101
National Certificate: Milling 2017-313909
TABLE 8: COMMERCIAL FARMERS HARD-TO-FILL VACANCIES
Sub-sector Skills and/or Qualifications Gaps OFO Code
Grain
National Diploma: Grain Depot Manager 2017-132408
General Education and Training Certificate: Grain Handling Controller 2017-313911
National Certificate: Agricultural Machinery Mechanic 2017-653301
General Education and Training Certificate: Grain Handling Operator 2017-716113
National Certificate: Importer or Exporter 2017-142101
National Diploma: Sales and Marketing Manager 2017-122101
Further Education and Training Certificate: Milling 2017-313909
National Certificate: Sales and Marketing Manager 2017-122101
National Certificate: Milling 2017-313909
The table below outlines the top HTFVs as identified by external stakeholders in the Grains and Cereals sub-sector
21
SUB-SECTOR SKILLS PLANGRAINS AND CEREALS
AGRICULTURE SECTOR EDUCATION TRAINING AUTHORITY SUB-SECTOR SKILLS PLAN
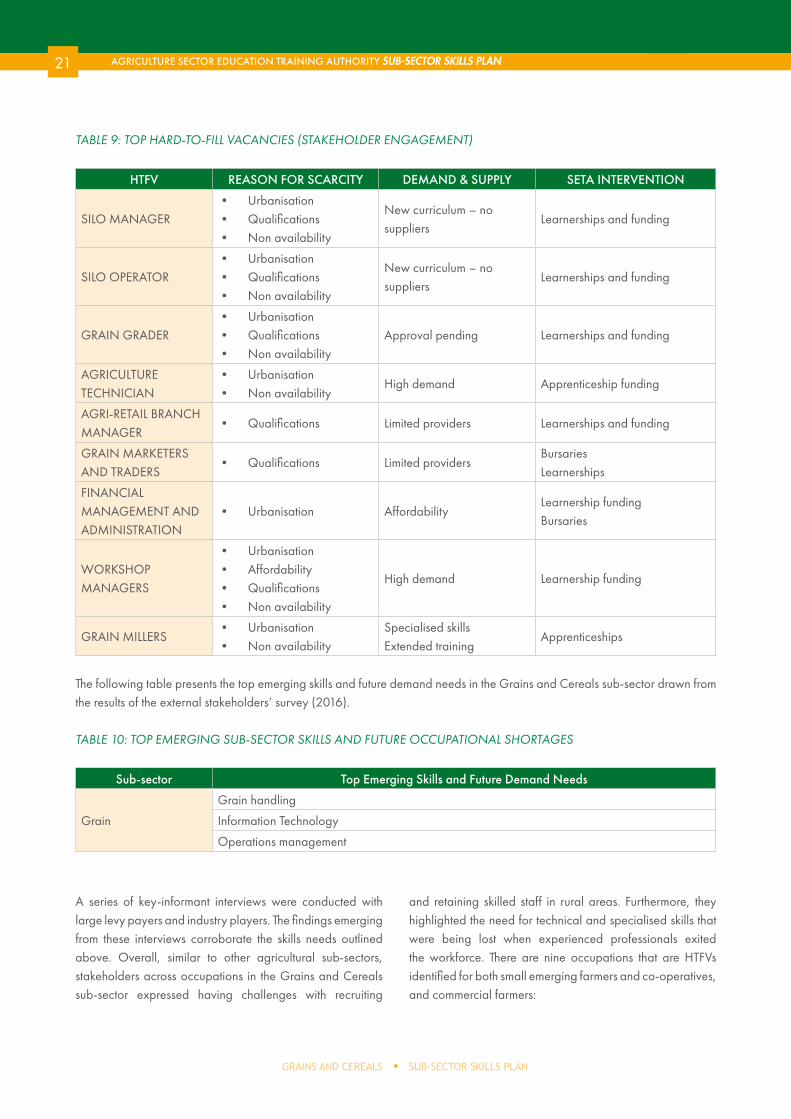
TABLE 9: TOP HARD-TO-FILL VACANCIES (STAKEHOLDER ENGAGEMENT)
HTFV REASON FOR SCARCITY DEMAND & SUPPLY SETA INTERVENTION
SILO MANAGER• Urbanisation• Qualifications• Non availability
New curriculum – no suppliers
Learnerships and funding
SILO OPERATOR• Urbanisation• Qualifications• Non availability
New curriculum – no suppliers
Learnerships and funding
GRAIN GRADER• Urbanisation• Qualifications• Non availability
Approval pending Learnerships and funding
AGRICULTURE TECHNICIAN
• Urbanisation• Non availability
High demand Apprenticeship funding
AGRI-RETAIL BRANCH MANAGER
• Qualifications Limited providers Learnerships and funding
GRAIN MARKETERS AND TRADERS
• Qualifications Limited providersBursariesLearnerships
FINANCIAL MANAGEMENT AND ADMINISTRATION
• Urbanisation AffordabilityLearnership fundingBursaries
WORKSHOP MANAGERS
• Urbanisation• Affordability• Qualifications• Non availability
High demand Learnership funding
GRAIN MILLERS• Urbanisation• Non availability
Specialised skillsExtended training
Apprenticeships
The following table presents the top emerging skills and future demand needs in the Grains and Cereals sub-sector drawn from the results of the external stakeholders’ survey (2016).
TABLE 10: TOP EMERGING SUB-SECTOR SKILLS AND FUTURE OCCUPATIONAL SHORTAGES
Sub-sector Top Emerging Skills and Future Demand Needs
Grain
Grain handling
Information Technology
Operations management
A series of key-informant interviews were conducted with large levy payers and industry players. The findings emerging from these interviews corroborate the skills needs outlined above. Overall, similar to other agricultural sub-sectors, stakeholders across occupations in the Grains and Cereals sub-sector expressed having challenges with recruiting
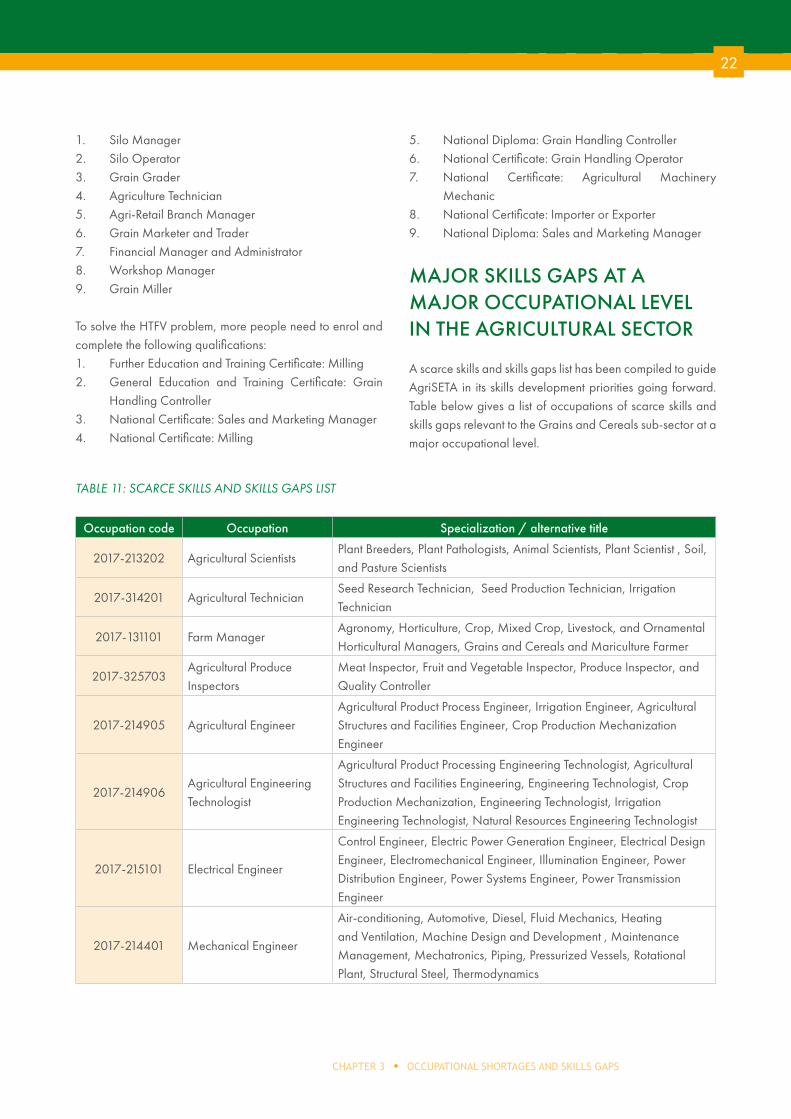
and retaining skilled staff in rural areas. Furthermore, they highlighted the need for technical and specialised skills that were being lost when experienced professionals exited the workforce. There are nine occupations that are HTFVs identified for both small emerging farmers and co-operatives, and commercial farmers:
22
CHAPTER 3 OCCUPATIONAL SHORTAGES AND SKILLS GAPS
1. Silo Manager2. Silo Operator3. Grain Grader4. Agriculture Technician5. Agri-Retail Branch Manager6. Grain Marketer and Trader7. Financial Manager and Administrator8. Workshop Manager9. Grain Miller
To solve the HTFV problem, more people need to enrol and complete the following qualifications:1. Further Education and Training Certificate: Milling 2. General Education and Training Certificate: Grain
Handling Controller 3. National Certificate: Sales and Marketing Manager4. National Certificate: Milling
5. National Diploma: Grain Handling Controller 6. National Certificate: Grain Handling Operator7. National Certificate: Agricultural Machinery
Mechanic8. National Certificate: Importer or Exporter9. National Diploma: Sales and Marketing Manager
MAJOR SKILLS GAPS AT A MAJOR OCCUPATIONAL LEVEL IN THE AGRICULTURAL SECTOR
A scarce skills and skills gaps list has been compiled to guide AgriSETA in its skills development priorities going forward. Table below gives a list of occupations of scarce skills and skills gaps relevant to the Grains and Cereals sub-sector at a major occupational level.
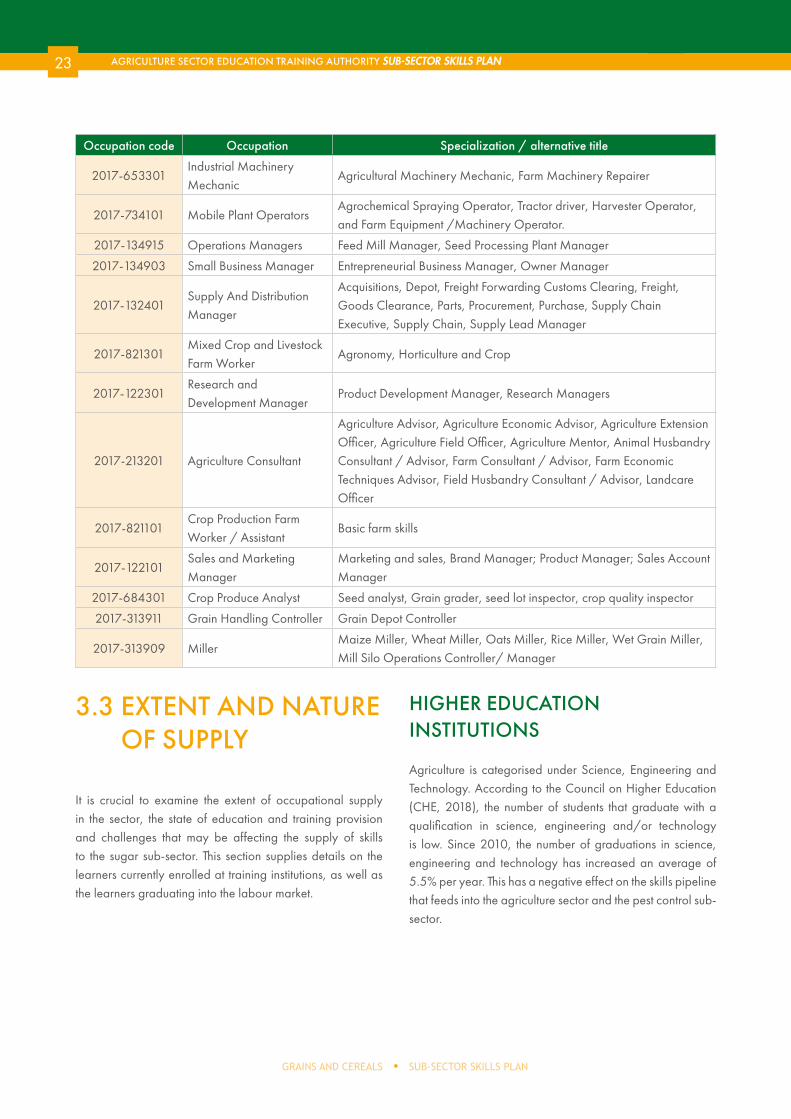
TABLE 11: SCARCE SKILLS AND SKILLS GAPS LIST
Occupation code Occupation Specialization / alternative title
2017-213202 Agricultural ScientistsPlant Breeders, Plant Pathologists, Animal Scientists, Plant Scientist , Soil, and Pasture Scientists
2017-314201 Agricultural TechnicianSeed Research Technician, Seed Production Technician, Irrigation Technician
2017-131101 Farm ManagerAgronomy, Horticulture, Crop, Mixed Crop, Livestock, and Ornamental Horticultural Managers, Grains and Cereals and Mariculture Farmer
2017-325703Agricultural Produce Inspectors
Meat Inspector, Fruit and Vegetable Inspector, Produce Inspector, and Quality Controller
2017-214905 Agricultural EngineerAgricultural Product Process Engineer, Irrigation Engineer, Agricultural Structures and Facilities Engineer, Crop Production Mechanization Engineer
2017-214906Agricultural Engineering Technologist
Agricultural Product Processing Engineering Technologist, Agricultural Structures and Facilities Engineering, Engineering Technologist, Crop Production Mechanization, Engineering Technologist, Irrigation Engineering Technologist, Natural Resources Engineering Technologist
2017-215101 Electrical Engineer
Control Engineer, Electric Power Generation Engineer, Electrical Design Engineer, Electromechanical Engineer, Illumination Engineer, Power Distribution Engineer, Power Systems Engineer, Power Transmission Engineer
2017-214401 Mechanical Engineer
Air-conditioning, Automotive, Diesel, Fluid Mechanics, Heating and Ventilation, Machine Design and Development , Maintenance Management, Mechatronics, Piping, Pressurized Vessels, Rotational Plant, Structural Steel, Thermodynamics
23
SUB-SECTOR SKILLS PLANGRAINS AND CEREALS
AGRICULTURE SECTOR EDUCATION TRAINING AUTHORITY SUB-SECTOR SKILLS PLAN
Occupation code Occupation Specialization / alternative title
2017-653301Industrial Machinery Mechanic
Agricultural Machinery Mechanic, Farm Machinery Repairer
2017-734101 Mobile Plant OperatorsAgrochemical Spraying Operator, Tractor driver, Harvester Operator, and Farm Equipment /Machinery Operator.
2017-134915 Operations Managers Feed Mill Manager, Seed Processing Plant Manager
2017-134903 Small Business Manager Entrepreneurial Business Manager, Owner Manager
2017-132401Supply And Distribution Manager
Acquisitions, Depot, Freight Forwarding Customs Clearing, Freight, Goods Clearance, Parts, Procurement, Purchase, Supply Chain Executive, Supply Chain, Supply Lead Manager
2017-821301Mixed Crop and Livestock Farm Worker
Agronomy, Horticulture and Crop
2017-122301Research and Development Manager
Product Development Manager, Research Managers
2017-213201 Agriculture Consultant
Agriculture Advisor, Agriculture Economic Advisor, Agriculture Extension Officer, Agriculture Field Officer, Agriculture Mentor, Animal Husbandry Consultant / Advisor, Farm Consultant / Advisor, Farm Economic Techniques Advisor, Field Husbandry Consultant / Advisor, Landcare Officer
2017-821101Crop Production Farm Worker / Assistant
Basic farm skills
2017-122101Sales and Marketing Manager
Marketing and sales, Brand Manager; Product Manager; Sales Account Manager
2017-684301 Crop Produce Analyst Seed analyst, Grain grader, seed lot inspector, crop quality inspector
2017-313911 Grain Handling Controller Grain Depot Controller
2017-313909 MillerMaize Miller, Wheat Miller, Oats Miller, Rice Miller, Wet Grain Miller, Mill Silo Operations Controller/ Manager
3.3 EXTENT AND NATURE OF SUPPLY
It is crucial to examine the extent of occupational supply in the sector, the state of education and training provision and challenges that may be affecting the supply of skills to the sugar sub-sector. This section supplies details on the learners currently enrolled at training institutions, as well as the learners graduating into the labour market.
HIGHER EDUCATION INSTITUTIONS
Agriculture is categorised under Science, Engineering and Technology. According to the Council on Higher Education (CHE, 2018), the number of students that graduate with a qualification in science, engineering and/or technology is low. Since 2010, the number of graduations in science, engineering and technology has increased an average of 5.5% per year. This has a negative effect on the skills pipeline that feeds into the agriculture sector and the pest control sub-sector.
24
CHAPTER 3 OCCUPATIONAL SHORTAGES AND SKILLS GAPS
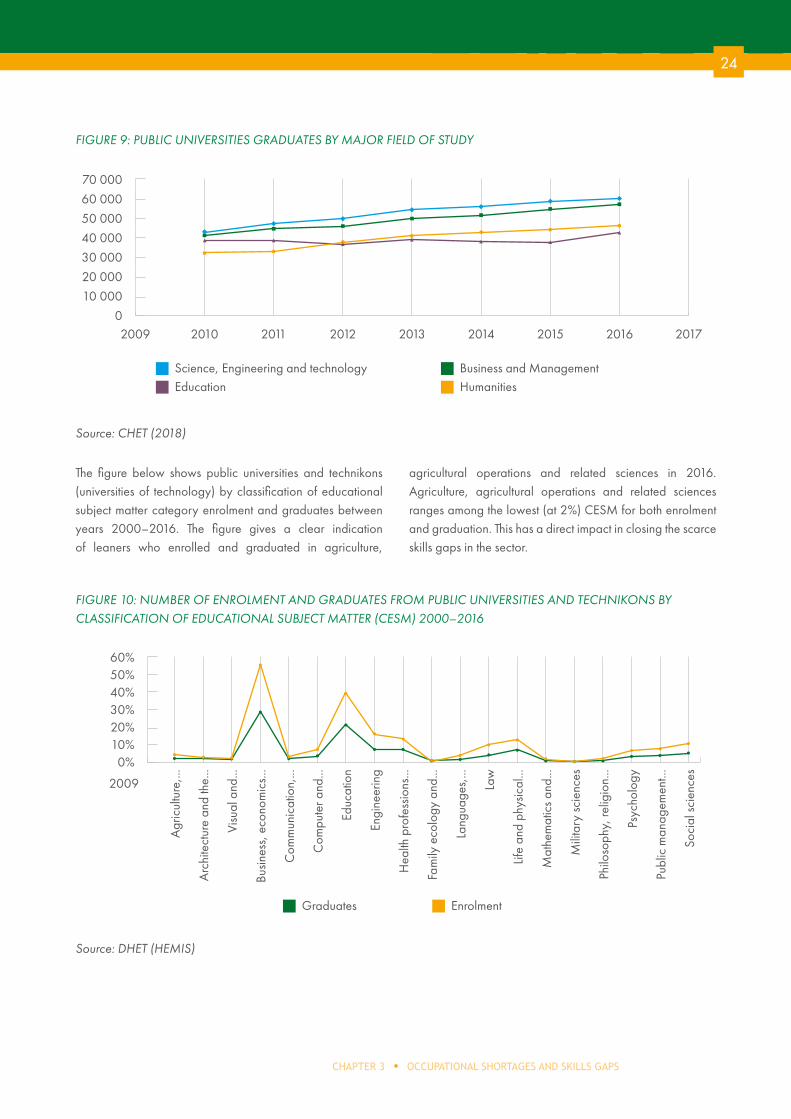
FIGURE 9: PUBLIC UNIVERSITIES GRADUATES BY MAJOR FIELD OF STUDY
Source: CHET (2018)
The figure below shows public universities and technikons (universities of technology) by classification of educational subject matter category enrolment and graduates between years 2000–2016. The figure gives a clear indication of leaners who enrolled and graduated in agriculture,
agricultural operations and related sciences in 2016. Agriculture, agricultural operations and related sciences ranges among the lowest (at 2%) CESM for both enrolment and graduation. This has a direct impact in closing the scarce skills gaps in the sector.
FIGURE 10: NUMBER OF ENROLMENT AND GRADUATES FROM PUBLIC UNIVERSITIES AND TECHNIKONS BY CLASSIFICATION OF EDUCATIONAL SUBJECT MATTER (CESM) 2000–2016
Source: DHET (HEMIS)
60%50%40%30%20%10%
0%
2009
Graduates Enrolment
Agr
icul
ture
,...
Arc
hite
ctur
e an
d th
e...
Educ
atio
n
Visu
al a
nd...
Busin
ess,
eco
nom
ics..
.
Com
mun
icat
ion,
...
Com
pute
r and
...
Hea
lth p
rofe
ssio
ns...
Fam
ily e
colo
gy a
nd...
Lang
uage
s,...
Life
and
phys
ical
...
Engi
neer
ing
Law
Mat
hem
atic
s and
...
Mili
tary
scie
nces
Philo
soph
y, re
ligio
n...
Psyc
holo
gy
Publ
ic m
anag
emen
t...
Soci
al sc
ienc
es
70 00060 00050 00040 00030 00020 00010 000
02009 2010 2011 2012 2013 2014 2015 2016 2017
Science, Engineering and technology
Education Business and Management
Humanities
25
SUB-SECTOR SKILLS PLANGRAINS AND CEREALS
AGRICULTURE SECTOR EDUCATION TRAINING AUTHORITY SUB-SECTOR SKILLS PLAN
SKILLS SUPPLY THROUGH MANDATORY GRANTS
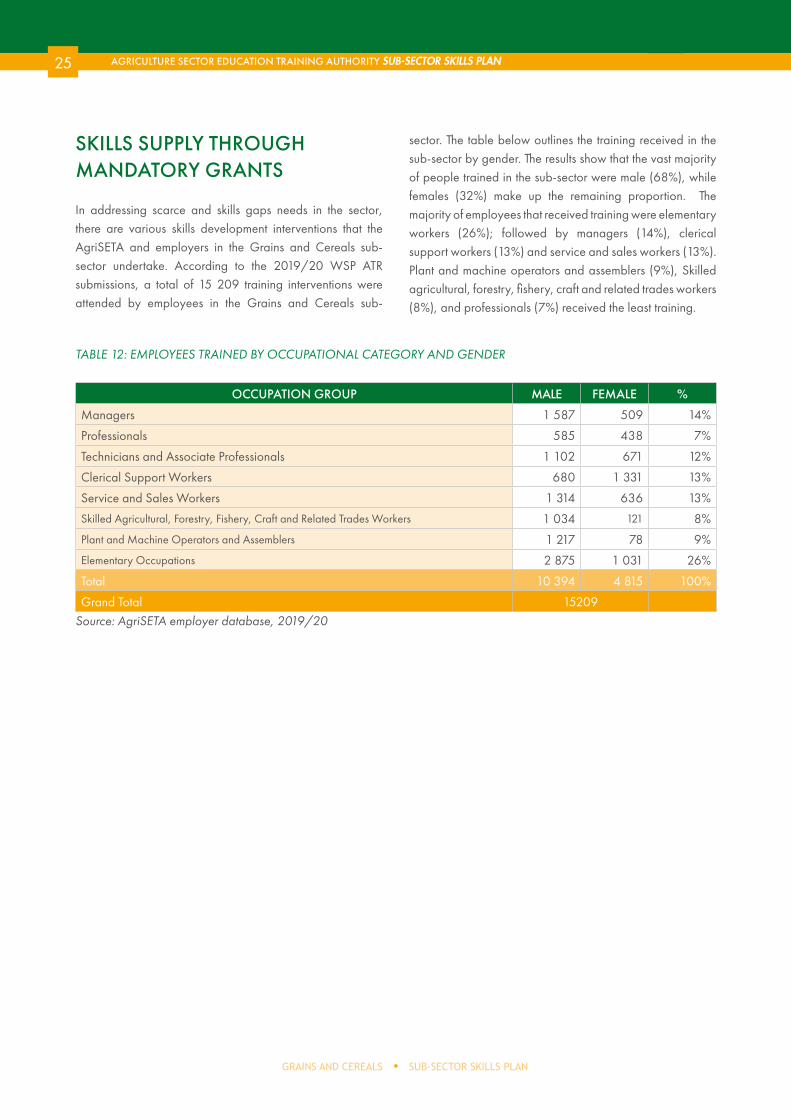
In addressing scarce and skills gaps needs in the sector, there are various skills development interventions that the AgriSETA and employers in the Grains and Cereals sub-sector undertake. According to the 2019/20 WSP ATR submissions, a total of 15 209 training interventions were attended by employees in the Grains and Cereals sub-
sector. The table below outlines the training received in the sub-sector by gender. The results show that the vast majority of people trained in the sub-sector were male (68%), while females (32%) make up the remaining proportion. The majority of employees that received training were elementary workers (26%); followed by managers (14%), clerical support workers (13%) and service and sales workers (13%). Plant and machine operators and assemblers (9%), Skilled agricultural, forestry, fishery, craft and related trades workers (8%), and professionals (7%) received the least training.
TABLE 12: EMPLOYEES TRAINED BY OCCUPATIONAL CATEGORY AND GENDER
OCCUPATION GROUP MALE FEMALE %
Managers 1 587 509 14%
Professionals 585 438 7%
Technicians and Associate Professionals 1 102 671 12%
Clerical Support Workers 680 1 331 13%
Service and Sales Workers 1 314 636 13%
Skilled Agricultural, Forestry, Fishery, Craft and Related Trades Workers 1 034 121 8%
Plant and Machine Operators and Assemblers 1 217 78 9%
Elementary Occupations 2 875 1 031 26%
Total 10 394 4 815 100%
Grand Total 15209Source: AgriSETA employer database, 2019/20
26
CHAPTER 3 OCCUPATIONAL SHORTAGES AND SKILLS GAPS
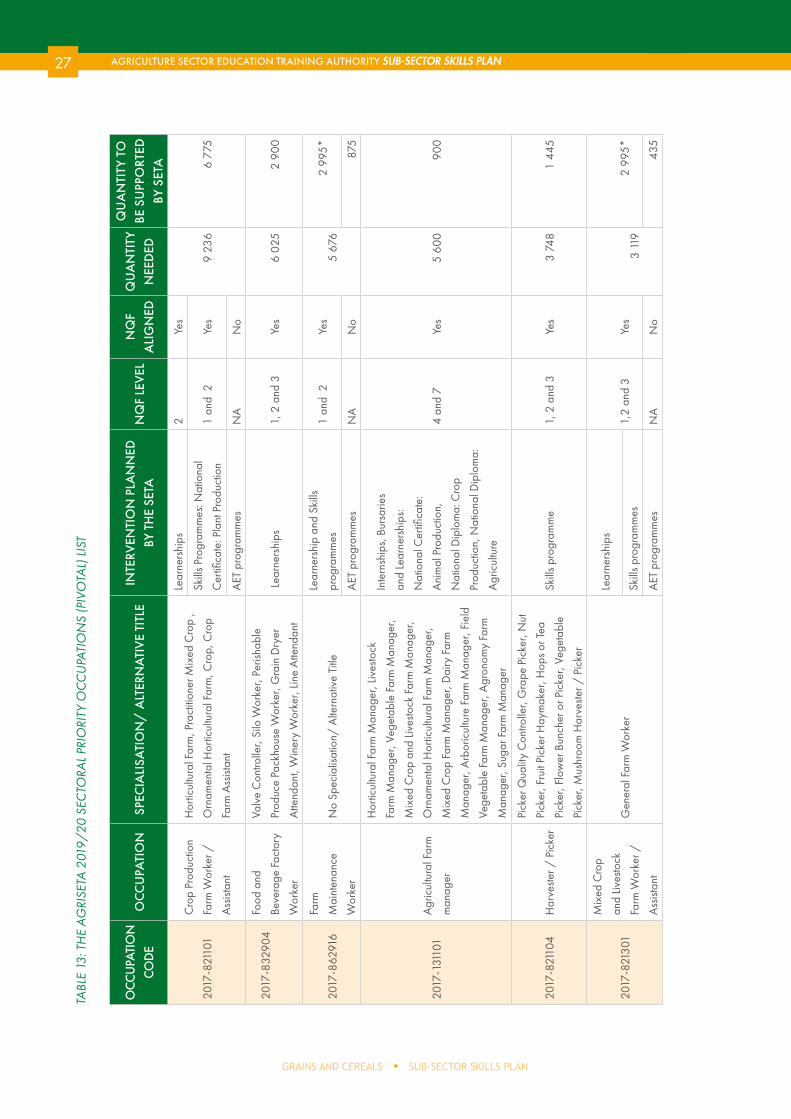
3.4. SECTORAL PRIORITY OCCUPATIONS (PIVOTAL) LIST
The Grant Regulations (DHET, 2012) defines PIVOTAL (Professional, Vocational, Technical and Academic Learning) as “programmes that result in qualifications or part qualifications on the National Qualifications Framework”. AgriSETA understands PIVOTAL programmes to be programmes that respond to the supply of identified skills demands. PIVOTAL programmes in the main respond to the scarce skills list.
Methods and interventions of arriving at the Sectoral Priority Occupations list are as follows:The AgriSETA’s Sectoral Priority Occupations list was derived through a number of measures. These included the list of scarce and skills gaps, the national list of occupations in high demand, analysis of performance information
and interaction with key stakeholders. A series of surveys were sent out and telephonic interviews were undertaken with major agriculture players, sub-sectors and industry representatives throughout all the provinces within South Africa to determine key skills gaps, future perceived skills gaps and to identify which programmes and models would best mitigate these gaps. The identification of the Sectoral Priority Occupations list was preceded by the identification of scarce and skills gaps lists, which, in turn, was informed by labour market demand analysis.
Interventions to implement the AgriSETA Sectoral Priority Occupations list are informed by the status of supply such as the existence of registered qualifications, the adequacy of accredited providers and appropriate or relevant learning interventions to address the qualifications and skills in demand.
The Sectoral Priority Occupations list is ranked in order of priority as per the scarce skills identified, WSP 2018-19 needs and the AgriSETA supportive interventions to develop these skills.
27
SUB-SECTOR SKILLS PLANGRAINS AND CEREALS
AGRICULTURE SECTOR EDUCATION TRAINING AUTHORITY SUB-SECTOR SKILLS PLAN
TABL
E 13
: TH
E A
GRI
SETA
201
9/20
SEC
TORA
L PR
IORI
TY O
CC
UPA
TIO
NS
(PIV
OTA
L) L
IST
OCC
UPA
TIO
N
COD
EO
CCU
PATI
ON
SPEC
IALI
SATI
ON
/ A
LTER
NA
TIVE
TIT
LEIN
TERV
ENTI
ON
PLA
NN
ED
BY T
HE
SETA
NQ
F LE
VEL
NQ
F A
LIG
NED
QU
AN
TITY
N
EED
ED
QU
AN
TITY
TO
BE
SU
PPO
RTED
BY
SET
A
2017
-821
101
Cro
p Pr
oduc
tion
Farm
Wor
ker /
Ass
istan
t
Hor
ticul
tura
l Far
m, P
ract
ition
er M
ixed
Cro
p ,
Orn
amen
tal H
ortic
ultu
ral F
arm
, Cro
p, C
rop
Farm
Ass
istan
t
Lear
ners
hips
2Ye
s
9 23
66
775
Skill
s Pro
gram
mes
: Nat
iona
l
Cer
tifica
te: P
lant
Pro
duct
ion
1
and
2Ye
s
AET
pro
gram
mes
NA
No
2017
-832
904
Food
and
Beve
rage
Fac
tory
Wor
ker
Valv
e C
ontro
ller,
Silo
Wor
ker,
Peris
habl
e
Prod
uce
Pack
hous
e W
orke
r, G
rain
Dry
er
Atte
ndan
t, W
iner
y W
orke
r, Lin
e A
ttend
ant
Lea
rner
ship
s
1, 2
and
3Ye
s6
025
2 90
0
2017
-862
916
Farm
Mai
nten
ance
Wor
ker
No
Spec
ialis
atio
n/ A
ltern
ativ
e Ti
tle
Lear
ners
hip
and
Skill
s
prog
ram
mes
1
and
2Ye
s5
676
2 99
5*
AET
pro
gram
mes
NA
No
875
2017
-131
101
Agr
icul
tura
l Far
m
man
ager
Hor
ticul
tura
l Far
m M
anag
er, L
ives
tock
Farm
Man
ager
, Veg
etab
le F
arm
Man
ager
,
Mix
ed C
rop
and
Lives
tock
Far
m M
anag
er,
Orn
amen
tal H
ortic
ultu
ral F
arm
Man
ager
,
Mix
ed C
rop
Farm
Man
ager
, Dai
ry F
arm
Man
ager
, Arb
oric
ultu
re F
arm
Man
ager
, Fie
ld
Vege
tabl
e Fa
rm M
anag
er, A
gron
omy
Farm
Man
ager
, Sug
ar F
arm
Man
ager
Inte
rnsh
ips,
Bur
sarie
s
and
Lear
ners
hips
:
Nat
iona
l Cer
tifica
te:
Ani
mal
Pro
duct
ion,
Nat
iona
l Dip
lom
a: C
rop
Prod
uctio
n, N
atio
nal D
iplo
ma:
Agr
icul
ture
4 an
d 7
Yes
5 60
090
0
2017
-821
104
Har
veste
r / P
icke
r
Pick
er Q
ualit
y C
ontro
ller,
Gra
pe P
icke
r, N
ut
Pick
er, F
ruit
Pick
er H
aym
aker
, Hop
s or T
ea
Pick
er, F
low
er B
unch
er o
r Pic
ker,
Vege
tabl
e
Pick
er, M
ushr
oom
Har
veste
r / P
icke
r
Skill
s pro
gram
me
1, 2
and
3Ye
s3
748
1 44
5
2017
-821
301
Mix
ed C
rop
and
Lives
tock
Farm
Wor
ker /
Ass
istan
t
Gen
eral
Far
m W
orke
r
Lear
ners
hips
1,2
and
3Ye
s3
119
2 99
5*Sk
ills p
rogr
amm
es
AET
pro
gram
mes
NA
No
435
28
CHAPTER 3 OCCUPATIONAL SHORTAGES AND SKILLS GAPS
OCC
UPA
TIO
N
COD
EO
CCU
PATI
ON
SPEC
IALI
SATI
ON
/ A
LTER
NA
TIVE
TIT
LEIN
TERV
ENTI
ON
PLA
NN
ED
BY T
HE
SETA
NQ
F LE
VEL
NQ
F A
LIG
NED
QU
AN
TITY
N
EED
ED
QU
AN
TITY
TO
BE
SU
PPO
RTED
BY
SET
A
2017
-213
202
Agr
icul
tura
l
Scie
ntist
Agr
onom
ists,
Pla
nt B
reed
ers,
Pla
nt
Path
olog
ists,
Ani
mal
Sci
entis
ts, P
lant
Sci
entis
t,
Soil,
and
Pas
ture
Sci
entis
ts
Gra
duat
e an
d Po
st G
radu
ate
Burs
arie
s and
Inte
rnsh
ips;
BSc
Agr
icul
ture
; BSc
Pla
nt B
reed
ing;
BTec
h: C
rop
Prod
uctio
n; B
Tech
:
Hor
ticul
ture
; BSc
Cro
p Sc
ienc
e;
MSc
Ani
mal
Hea
lth
6 to
8Ye
s1
759
980
2017
-611
202
Hor
ticul
tura
l
Farm
er
Hor
ticul
tura
l Pro
duct
ion
Supe
rviso
r,
Hor
ticul
tura
l Far
m F
orem
an
Lear
ners
hips
1 an
d 2
Yes
1 53
42
995
Skill
s pro
gram
me
2017
-671
202
Mill
wrig
ht
Win
der T
echn
icia
n, E
lect
rom
echa
nici
an,
Mac
hine
Tool
Mill
wrig
ht, G
roun
d
Elec
trom
echa
nici
an, M
illw
right
(Ele
ctro
mec
hani
cian
), Pr
inte
rs M
echa
nic
Arti
san
3Ye
s1
470
233
2017
-122
101
Sale
s and
Mar
ketin
g
Man
ager
Key
Acc
ount
Man
ager
, Bus
ines
s Dev
elop
men
t
Man
ager
, Bus
ines
s Sup
port
Man
ager
Gra
duat
e an
d Po
st G
radu
ate
Burs
arie
s and
Inte
rnsh
ips
6 to
8Ye
s1
447
1 44
5
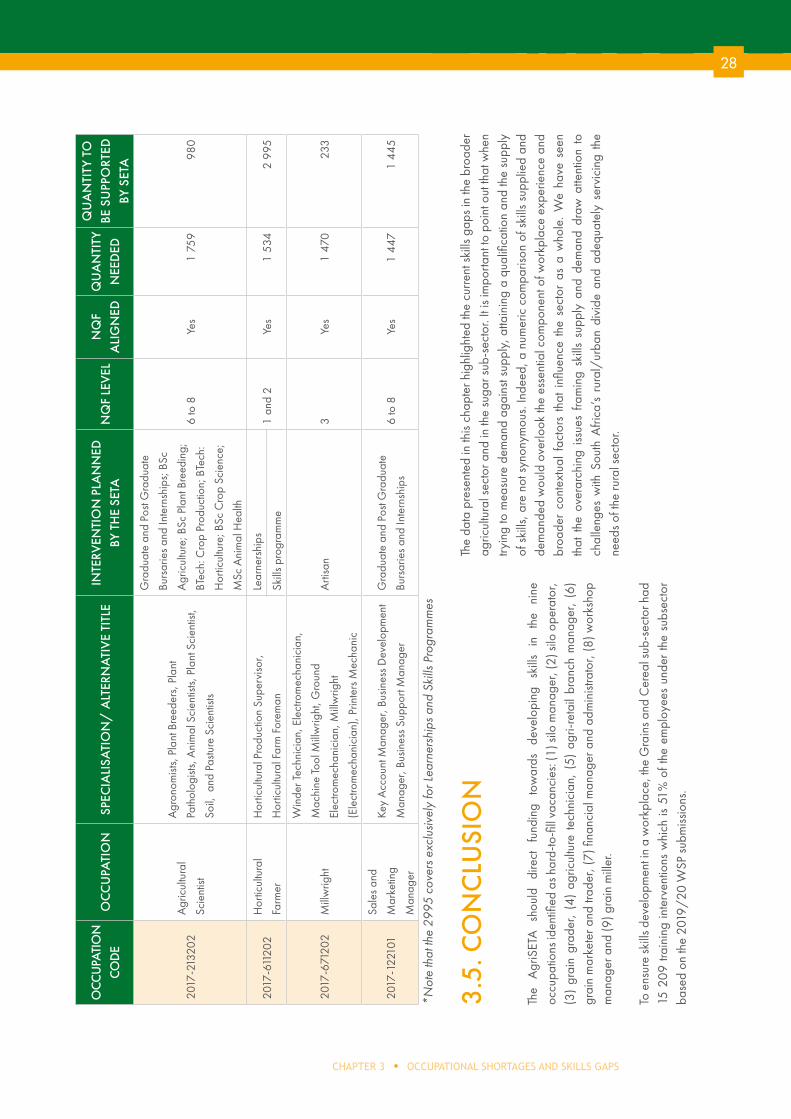
*Not
e th
at th
e 29
95 c
over
s exc
lusiv
ely
for L
earn
ersh
ips a
nd S
kills
Pro
gram
mes
3.5.
CO
NC
LUSI
ON
The
Agr
iSET
A
shou
ld
dire
ct
fund
ing
tow
ards
de
velo
ping
sk
ills
in
the
nine
oc
cupa
tions
iden
tified
as h
ard-
to-fi
ll va
canc
ies:
(1) s
ilo m
anag
er, (
2) si
lo o
pera
tor,
(3)
grai
n gr
ader
, (4
) ag
ricul
ture
tech
nici
an,
(5)
agri-
reta
il br
anch
man
ager
, (6
) gr
ain
mar
kete
r and
trad
er, (
7) fi
nanc
ial m
anag
er a
nd a
dmin
istra
tor,
(8) w
orks
hop
man
ager
and
(9) g
rain
mill
er.
To e
nsur
e sk
ills d
evel
opm
ent i
n a
wor
kpla
ce, t
he G
rain
s and
Cer
eal s
ub-s
ecto
r had
15
209
trai
ning
inte
rven
tions
whi
ch is
51%
of t
he e
mpl
oyee
s un
der
the
subs
ecto
r ba
sed
on th
e 20
19/
20 W
SP su
bmiss
ions
.
The
data
pre
sent
ed in
this
chap
ter h
ighl
ight
ed th
e cu
rrent
ski
lls g
aps
in th
e br
oade
r ag
ricul
tura
l sec
tor a
nd in
the
suga
r sub
-sec
tor.
It is
impo
rtant
to p
oint
out
that
whe
n try
ing
to m
easu
re d
eman
d ag
ains
t sup
ply,
atta
inin
g a
qual
ifica
tion
and
the
supp
ly
of s
kills
, are
not
syn
onym
ous.
Inde
ed, a
num
eric
com
paris
on o
f ski
lls s
uppl
ied
and
dem
ande
d w
ould
ove
rlook
the
esse
ntia
l com
pone
nt o
f wor
kpla
ce e
xper
ienc
e an
d br
oade
r co
ntex
tual
fac
tors
tha
t in
fluen
ce t
he s
ecto
r as
a w
hole
. W
e ha
ve s
een
that
the
ove
rarc
hing
iss
ues
fram
ing
skill
s su
pply
and
dem
and
draw
atte
ntio
n to
ch
alle
nges
with
Sou
th A
frica
’s ru
ral/
urba
n di
vide
and
ade
quat
ely
serv
icin
g th
e ne
eds o
f the
rura
l sec
tor.
29
SUB-SECTOR SKILLS PLANGRAINS AND CEREALS
AGRICULTURE SECTOR EDUCATION TRAINING AUTHORITY SUB-SECTOR SKILLS PLAN
CHAPTER 4PARTNERSHIPS
29 AGRICULTURE SECTOR EDUCATION TRAINING AUTHORITY SUB-SECTOR SKILLS PLAN
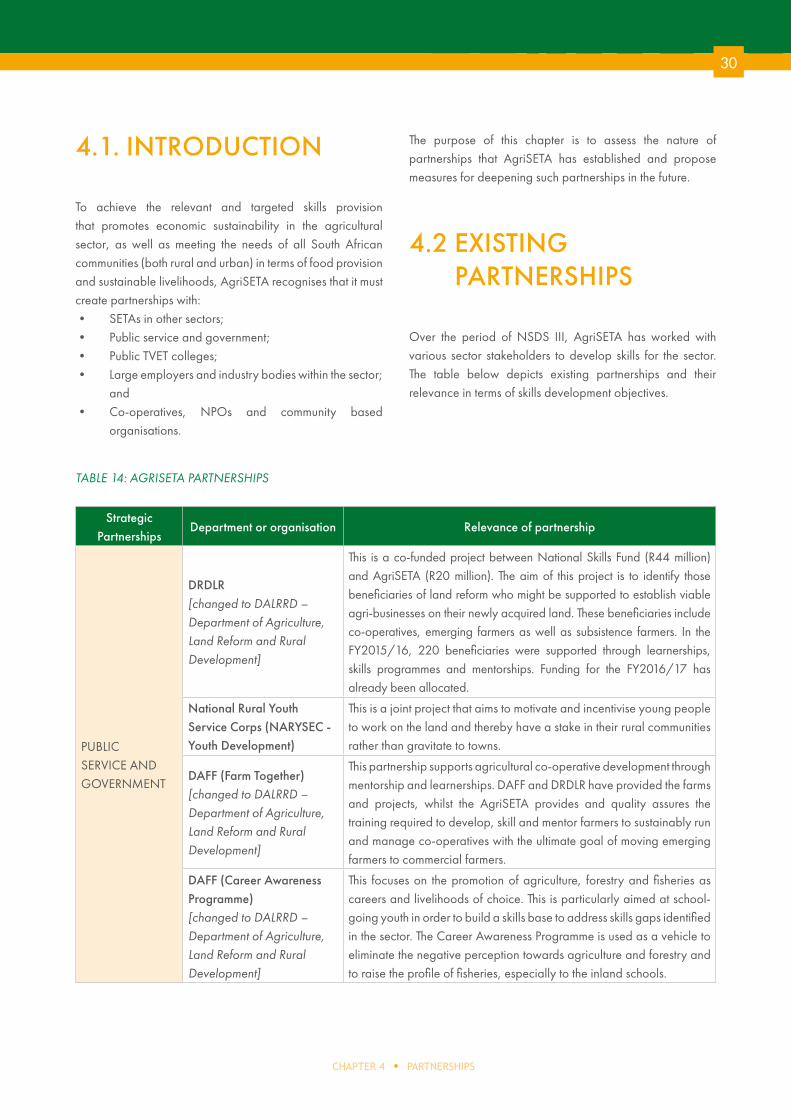
30
CHAPTER 4 PARTNERSHIPS
4.1. INTRODUCTION
To achieve the relevant and targeted skills provision that promotes economic sustainability in the agricultural sector, as well as meeting the needs of all South African communities (both rural and urban) in terms of food provision and sustainable livelihoods, AgriSETA recognises that it must create partnerships with:• SETAs in other sectors;• Public service and government; • Public TVET colleges; • Large employers and industry bodies within the sector;
and• Co-operatives, NPOs and community based
organisations.
The purpose of this chapter is to assess the nature of partnerships that AgriSETA has established and propose measures for deepening such partnerships in the future.
4.2 EXISTING PARTNERSHIPS
Over the period of NSDS III, AgriSETA has worked with various sector stakeholders to develop skills for the sector. The table below depicts existing partnerships and their relevance in terms of skills development objectives.
TABLE 14: AGRISETA PARTNERSHIPS
Strategic Partnerships
Department or organisation Relevance of partnership
PUBLIC SERVICE AND GOVERNMENT
DRDLR[changed to DALRRD – Department of Agriculture, Land Reform and Rural Development]
This is a co-funded project between National Skills Fund (R44 million) and AgriSETA (R20 million). The aim of this project is to identify those beneficiaries of land reform who might be supported to establish viable agri-businesses on their newly acquired land. These beneficiaries include co-operatives, emerging farmers as well as subsistence farmers. In the FY2015/16, 220 beneficiaries were supported through learnerships, skills programmes and mentorships. Funding for the FY2016/17 has already been allocated.
National Rural Youth Service Corps (NARYSEC - Youth Development)
This is a joint project that aims to motivate and incentivise young people to work on the land and thereby have a stake in their rural communities rather than gravitate to towns.
DAFF (Farm Together)[changed to DALRRD – Department of Agriculture,Land Reform and Rural Development]
This partnership supports agricultural co-operative development through mentorship and learnerships. DAFF and DRDLR have provided the farms and projects, whilst the AgriSETA provides and quality assures the training required to develop, skill and mentor farmers to sustainably run and manage co-operatives with the ultimate goal of moving emerging farmers to commercial farmers.
DAFF (Career Awareness Programme)[changed to DALRRD – Department of Agriculture,Land Reform and Rural Development]
This focuses on the promotion of agriculture, forestry and fisheries as careers and livelihoods of choice. This is particularly aimed at school-going youth in order to build a skills base to address skills gaps identified in the sector. The Career Awareness Programme is used as a vehicle to eliminate the negative perception towards agriculture and forestry and to raise the profile of fisheries, especially to the inland schools.
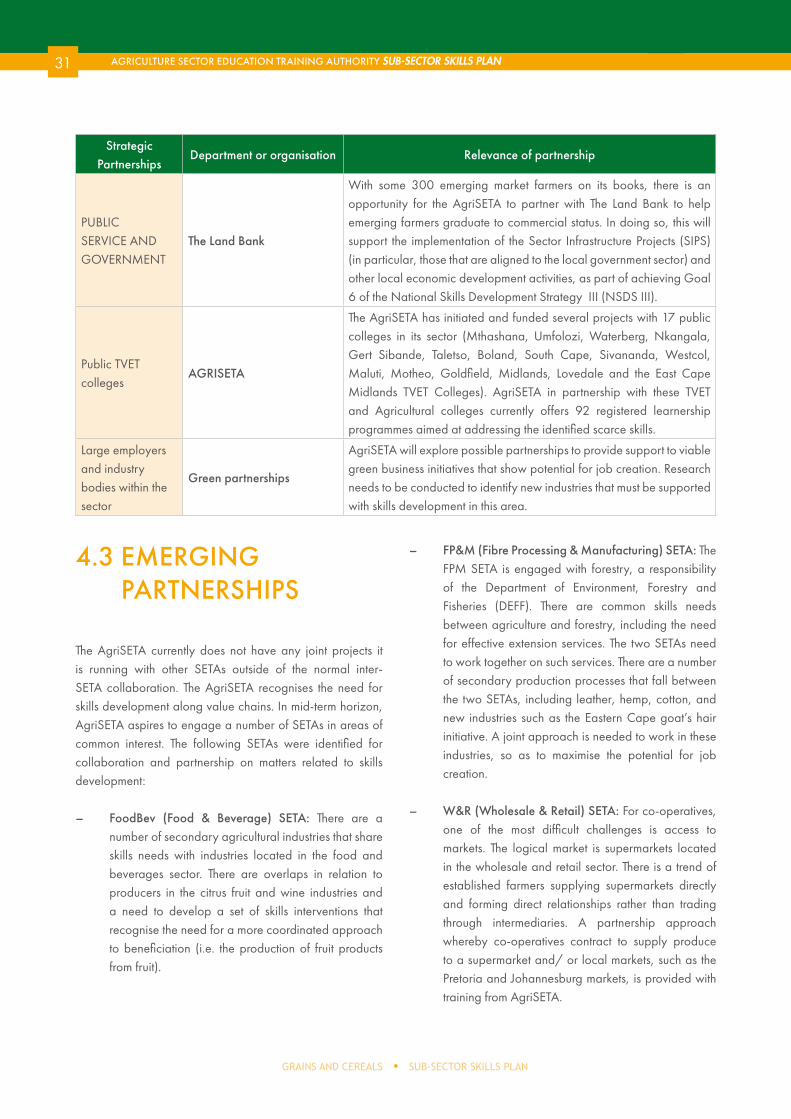
31
SUB-SECTOR SKILLS PLANGRAINS AND CEREALS
AGRICULTURE SECTOR EDUCATION TRAINING AUTHORITY SUB-SECTOR SKILLS PLAN
Strategic Partnerships
Department or organisation Relevance of partnership
PUBLIC SERVICE AND GOVERNMENT
The Land Bank
With some 300 emerging market farmers on its books, there is an opportunity for the AgriSETA to partner with The Land Bank to help emerging farmers graduate to commercial status. In doing so, this will support the implementation of the Sector Infrastructure Projects (SIPS) (in particular, those that are aligned to the local government sector) and other local economic development activities, as part of achieving Goal 6 of the National Skills Development Strategy III (NSDS III).
Public TVET colleges
AGRISETA
The AgriSETA has initiated and funded several projects with 17 public colleges in its sector (Mthashana, Umfolozi, Waterberg, Nkangala, Gert Sibande, Taletso, Boland, South Cape, Sivananda, Westcol, Maluti, Motheo, Goldfield, Midlands, Lovedale and the East Cape Midlands TVET Colleges). AgriSETA in partnership with these TVET and Agricultural colleges currently offers 92 registered learnership programmes aimed at addressing the identified scarce skills.
Large employers and industry bodies within the sector
Green partnerships
AgriSETA will explore possible partnerships to provide support to viable green business initiatives that show potential for job creation. Research needs to be conducted to identify new industries that must be supported with skills development in this area.
4.3 EMERGING PARTNERSHIPS
The AgriSETA currently does not have any joint projects it is running with other SETAs outside of the normal inter-SETA collaboration. The AgriSETA recognises the need for skills development along value chains. In mid-term horizon, AgriSETA aspires to engage a number of SETAs in areas of common interest. The following SETAs were identified for collaboration and partnership on matters related to skills development:
– FoodBev (Food & Beverage) SETA: There are a number of secondary agricultural industries that share skills needs with industries located in the food and beverages sector. There are overlaps in relation to producers in the citrus fruit and wine industries and a need to develop a set of skills interventions that recognise the need for a more coordinated approach to beneficiation (i.e. the production of fruit products from fruit).
– FP&M (Fibre Processing & Manufacturing) SETA: The FPM SETA is engaged with forestry, a responsibility of the Department of Environment, Forestry and Fisheries (DEFF). There are common skills needs between agriculture and forestry, including the need for effective extension services. The two SETAs need to work together on such services. There are a number of secondary production processes that fall between the two SETAs, including leather, hemp, cotton, and new industries such as the Eastern Cape goat’s hair initiative. A joint approach is needed to work in these industries, so as to maximise the potential for job creation.
– W&R (Wholesale & Retail) SETA: For co-operatives, one of the most difficult challenges is access to markets. The logical market is supermarkets located in the wholesale and retail sector. There is a trend of established farmers supplying supermarkets directly and forming direct relationships rather than trading through intermediaries. A partnership approach whereby co-operatives contract to supply produce to a supermarket and/ or local markets, such as the Pretoria and Johannesburg markets, is provided with training from AgriSETA.
32
CHAPTER 4 PARTNERSHIPS
4.4 CONCLUSION
The AgriSETA partners with national government departments, public TVET colleges and the Land Bank to address occupational shortages, skills gaps and HTFVs in the Grains and Cereals sub-sector. New partnerships especially with other SETAs and with large employers and industry players will be pursued to align the AgriSETA’s priority skills areas and Sectoral Priority Occupations (PIVOTAL) skills lists to national interests.
The SETA intends to report in future on partnerships that work and those that do not work. Best practice partnerships will be highlighted in future SSPs to benchmark partnership criteria with successful, effective and efficient partnership models. Ultimately, partnerships culminate in improvements in terms of efficiency, quality and impact of skills development and training which produces a skilled and capable workforce.
33
SUB-SECTOR SKILLS PLANGRAINS AND CEREALS
AGRICULTURE SECTOR EDUCATION TRAINING AUTHORITY SUB-SECTOR SKILLS PLAN
CHAPTER 5SKILLS PRIORITY ACTIONS
33 AGRICULTURE SECTOR EDUCATION TRAINING AUTHORITY SUB-SECTOR SKILLS PLAN
34
CHAPTER 5 SKILLS PRIORITY ACTIONS
5.1. INTRODUCTION
This chapter aims to synthesise the findings of the previous chapters and establish a set of skills priority actions for the Grains and Cereals sub-sector. The intention of recommended skills priority actions is that they articulate the micro concerns of the Grains and Cereals sub-sector.
These recommendations are founded on national policy and sectoral change drivers (Chapter 2), as well as the skills concerns identified by employers and training providers in terms of their skills needs (Chapter 3). This chapter is not a strategic or operational plan, but rather serves to identify priorities that should be taken forward and further developed in the AgriSETA Strategic Plan and Annual Performance Plan and to reflect the needs of the Grains and Cereals sub-sector.
5.2 KEY FINDINGS FROM PREVIOUS CHAPTERS
The Grains and Cereals sub-sector contributes significantly to the agricultural sector in South Africa and accounts for 30% of total agricultural production in the country. Maize remains the most prominent field crop. An analysis of data from the sub-sector shows that the majority of people employed in the sub-sector are in elementary occupations.
External stakeholder engagements identified changing consumer behavior, technology and mechanisation of the sub-sector; and climate change and drought as the key change drivers currently affecting the sub-sector. Based on the legislative and policy frameworks and identified change drivers, the four skills implication that need to be addressed are the following:- Practical skills transfer though mentoring and on-job
training.- Partnerships with HEIs for research and development
in the sub-sector.- Partnerships with key role-players.- Development of green knowledge qualifications for
innovative solutions to address climate change and the drought.
The AgriSETA should direct funding towards developing skills in the nine occupations identified as hard-to-fill vacancies for small emerging farmers and co-operatives as well as for commercial farmers: (1) silo manager, (2) silo operator, (3) grain grader, (4) agriculture technician, (5) agri-retail branch manager, (6) grain marketer and trader, (7) financial manager and administrator, (8) workshop manager and (9) grain miller.
In addressing scarce skills gaps needs in the sub-sector, there are various skills development interventions that AgriSETA and employees in the sector should undertake. In 2019/20, a total of 15 209 training interventions were attended by employees in the Grains and Cereals sub-sector, and the majority of employees that received this training were male. In line with the finding on chapter 1 that the majority of people employed in the sub-sector occupy Elementary positions, the majority of employees that received training were elementary workers.
AgriSETA has partnerships with public service and government, public TVET colleges, and large employers and industry bodies. AgriSETA currently does not have partnerships with other SETAs. AgriSETA recognises the need for skills development initiatives with other SETAs and has identified various SETAs aligned with the mandate and objectives of AgriSETA.
5.3 RECOMMENDED ACTIONS
It is imperative for the AgriSETA to align development initiatives with industry demands and further ensure relevant skills are available to the industry.
(1) Research agenda
It is recommended that AgriSETA commission research into climate change and drought onto its research agenda. This will ensure that the sub-sector is well prepared and finds innovative ways of dealing with the issues in the future.
35
SUB-SECTOR SKILLS PLANGRAINS AND CEREALS
AGRICULTURE SECTOR EDUCATION TRAINING AUTHORITY SUB-SECTOR SKILLS PLAN
(2) High level skills
At a commercial scale the SETA needs to be responsive to the changing nature of the sub-sector by recognising and investing in high level skill qualifications to address technological advancement and mechanisation of the sub-sector. Similarly, there is a need for research (beyond the level of the AgriSETA’s own research agenda). It is necessary that the AgriSETA engage with the sector to ensure that it funds post graduate bursaries aligned to the research needs of the Grains and Cereals sub-sector.
(3) Elementary occupations
AgriSETA initiatives should focus on reaching elementary employees in the Grains and Cereals sub-sector, to ensure equal opportunities to skills development initiatives and practical skills transfer through mentoring and on-the-job training experience.
5.4 CONCLUSION
After triangulating the findings of the qualitative and empirical data presented in the previous chapters, a set of skills priority actions was established for the AgriSETA and the Grains and Cereals sub-sector. The recommended skills priority actions articulate the macro and micro occupational shortages, skills gaps, Sectoral Priority Occupations (PIVOTAL) priorities and HTFVs of the agricultural sector.

36
CHAPTER 5 SKILLS PRIORITY ACTIONS
LIST OF REFERENCES
Agricultural Products Standards Act, 1990 (ACT No. 119 of 1990).
Agri SA (2017) Implications of a Carbon Tax and Offset System for Agriculture in South Africa. 2017.
https://www.agrisa.co.za/about-us/role-of-agriculture-in-sa/
Business Monitor International. (2016). Southern African Drought: Food Security and Inflation Consequences.http://www.bmiresearch.com/news-and-views/southern-african-drought-food-security-and-inflation consequences.
BFAP. 2019. Perspective on agriculture’s performance in Quater1 of 2019. Available online (Accessed on 15 July 2019)
Department of Agriculture, Forestry and Fisheries (2016) Economic Review of the South African Agriculture. 2016.http://www.daff.gov.za/Daffweb3/Portals/0/Statistics and Economic Analysis/Economic Analysis/Economic Review 2016.pdf
Department of Agriculture, Forestry and Fisheries. (2018). CROPS & MARKETS FOURTH QUARTER 2018 VOLUME 99 NO. 978. Available online at https://www.daff.gov.za/Daffweb3/Portals/0/Statistics%20and%20Economic%20Analysis/Statistical%20Information/Crops%20and%20Markets%204th%20Quarter%202018.pdf)
Department of Higher Education and Training. (2013). White Paper for Post-School Education & Training. Pretoria, South Africa.
Department of Higher Education and Training. (2011-2016). The National Skills Development Strategy III. Pretoria, South Africa.
Export.Gov (2017) South African Agricultural Sector (2017).https://www.export.gov/article?id=South-Africa-agricultural-equipment
Export.Gov (2019). South African Agricultural Sector (2018).Available onlinehttps://www.export.gov/article?id=South-Africa-agricultural-equipment Accessed on 15 July 2019
FAO. 2018. GIEWS - Global Information and Early Warning System. Available onlinehttp://www.fao.org/giews/countrybrief/country.jsp?code=ZAF (Accessed on 15 July 2019)
Kane-Berman, J. (2016). From Land to Farming: bringing land reform down to earth in Liberty. Johannesburg: Institute of Race Relations.
Kriel, G. (2016) Drones Can Take Precision Farming To The Next Level. Farmers Weekly (2016). https://www.farmersweekly.co.za/agri-technology/farming-for-tomorrow/drones-can-take-precision-farming-to-the-next-level/
37
SUB-SECTOR SKILLS PLANGRAINS AND CEREALS
AGRICULTURE SECTOR EDUCATION TRAINING AUTHORITY SUB-SECTOR SKILLS PLAN37 AGRICULTURE SECTOR EDUCATION TRAINING AUTHORITY SECTOR SKILLS PLAN
Statistics South Africa (2017) Quarterly Labour Force Survey.http://www.Stats SA.gov.za/publications/P0211/P02111stQuarter2017.pdf
Statista (2019). Food and Beverages revenuehttps://www.statista.com/outlook/253/100/food-beverages/worldwide (accessed on 25 September 2019)
World Trade Atlas. 2017. South Africa-Cereal Production. Available online.https://knoema.com/atlas/South-Africa/Cereal-production (Accessed on 15 July 2019)
REFERENCE OF PICTURES USED IN THIS DOCUMENT
Content: shalitha-dissanayaka-wqb_dTZCNys-unsplash
Chapter 1 Image by PublicDomainPictures from Pixabay
Chapter 2 Image by Pavlofox from Pixabay Image by Myriam Zilles from Pixabay
Chapter 3 Image by Hans Braxmeier from Pixabay
Chapter 4 Image by John Hain from Pixabay
Chapter 5 Image by gillpoh from Pixabay
38
GRAINS AND CEREALS SUB-SECTOR SKILLS PLAN
AGRICULTURE SECTOR EDUCATION TRAINING AUTHORITY SUB-SECTOR SKILLS PLAN38 AGRICULTURE SECTOR EDUCATION TRAINING AUTHORITY SUB-SECTOR SKILLS PLAN
AgriSETA House529 Belvedere RoadArcadia0083
+ 27 (0) 12 301 5600
+ 27 (0) 12 325 1677 / 325 1624
www.agriseta.co.za
Related Documents