A weekly publication of the Agricultural Marketing Service www.ams.usda.gov/GTR December 8, 2016 Contents Article/ Calendar Grain Transportation Indicators Rail Barge Truck Exports Ocean Brazil Mexico Grain Truck/Ocean Rate Advisory Data Links Specialists Subscription Information -------------- The next release is Dec 15, 2016 Preferred citation: U.S. Dept. of Agriculture, Agricultural Marketing Service. Grain Transportation Report. December 8, 2016. Web: http://dx.doi.org/10.9752/TS056.12-08-2016 Grain Transportation Report WEEKLY HIGHLIGHTS Grain Vessel Loading Activity Remains Strong as Ocean Freight Rates Tick Up Ocean-going grain vessel loading activity remained strong in the U.S. Gulf (Gulf) and the Pacific Northwest (PNW) despite an increase in the ocean freight rates for shipping bulk commodities, including grains. During the 4-week period beginning November 10 and ending December 1, an average of 50 vessels were loaded in the Gulf, with 77 vessels expected within the next 10 days. During the same period, 21 vessels were at berth in the PNW. Meanwhile, the ocean freight rate for shipping bulk grain from the Gulf to Japan was $37 per metric ton (mt) during the week ending December 1, a 16 percent increase over the week ending November 10. The cost of shipping from the PNW to Japan was $20 per mt, a 13 percent increase compared to November 10. According to a December 1 Transportation and Export report by O’Neil Commodity Consulting, increased iron ore and coal shipments to China caused the rate increase. Those imports have both increased 9 and 12 percent year to year, respectively. However, it is unlikely that the rate hike is sustainable, as excess vessel supply still exists in the market. STB Final Decision on Performance Data Reporting On November 30, the Surface Transportation Board (STB) adopted a final rule requiring all Class I railroads to report certain service performance metrics on a weekly, semiannual, and occasional basis. STB first opened the proceeding (EP 724) with a public hearing in April 2014 to understand issues pertaining to the rail service problems emerging in late 2013. In October 2014, STB issued an interim data collection order and then examined new regulations for permanent reporting over the next 2 years. As described in the recent decision, “The primary purpose of this rulemaking has been to develop a set of performance data that will allow the agency to monitor current service conditions in the industry and to identify trends or aberrations, which may indicate problems. … A corollary benefit is that shippers and other stakeholders will have access to the reported data to assist in their business decisions and supply- chain planning.” The rule becomes effective January 29, 2017, with reporting to begin February 8. Boost in Pacific Northwest Grain Inspections Help Total For the week ending December 1, total inspections of grain (corn, wheat, and soybeans) for export from major U.S. export regions reached 3.56 million metric tons (mmt), up 6 percent from the previous week, up 41 percent from last year, and 16 percent above the 3-year average. Inspections of wheat and corn jumped 85 and 39 percent from the previous week, but soybean inspections dropped 15 percent from the past week. PNW grain inspections increased 57 percent from the previous week as shipments increased to China, Japan, and the Philippines. Mississippi Gulf inspections, however, decreased 8 percent from the previous week. Outstanding export sales (unshipped) were up for wheat but down for corn and soybeans. Snapshots by Sector Export Sales During the week ending November 24, unshipped balances of wheat, corn, and soybeans totaled 42.3 mmt, up 50 percent from the same time last year. Net weekly wheat export sales were .482 mmt, down 32 percent from the previous week. Net corn export sales were .747 mmt, down 55 percent from the previous week, and net soybean export sales were 1.40 mmt, down 25 percent from the past week. Rail U.S. Class I railroads originated 22,438 grain carloads for the week ending November 26, down 13 percent from the previous week, up 20 percent from last year, and up 10 percent from the 3-year average. Average December shuttle secondary railcar bids/offers per car were $33 below tariff for the week ending December 1, up $18 from last week, and $192 higher than last year. Average non-shuttle secondary railcar bids/offers per car were $109 below tariff, down $26 from last week, and $28 higher than last year. Barge For the week ending December 3, barge grain movements totaled 1,058,591 tons, 15 percent lower than last week, and up 35 percent from the same period last year. For the week ending December 3, 683 grain barges moved down river, down 15 percent from last week, 1,007 grain barges were unloaded in New Orleans, down 3 percent from the previous week. Ocean For the week ending December 1, 50 ocean-going grain vessels were loaded in the Gulf, 19 percent more than the same period last year. Seventy-five vessels are expected to be loaded within the next 10 days, 9 percent more than the same period last year. For the week ending December 1, the ocean freight rate for shipping bulk grain from the Gulf to Japan was $37 per metric ton, 4 percent more than the previous week. The cost of shipping from the PNW to Japan was $20 per metric ton, 4 percent more than the previous week. Fuel During the week ending December 5, U.S. average diesel fuel prices were up 6 cents from the previous week at $2.48 per gallon, 10 cents higher than the same week last year. Contact Us

Welcome message from author
This document is posted to help you gain knowledge. Please leave a comment to let me know what you think about it! Share it to your friends and learn new things together.
Transcript
A weekly publication of the Agricultural Marketing Service
www.ams.usda.gov/GTR
December 8, 2016
Contents
Article/
Calendar
Grain
Transportation
Indicators
Rail
Barge
Truck
Exports
Ocean
Brazil
Mexico
Grain Truck/Ocean
Rate Advisory
Data Links
Specialists
Subscription
Information
--------------
The next
release is Dec 15, 2016
Preferred citation: U.S. Dept. of Agriculture, Agricultural Marketing Service. Grain Transportation Report. December 8, 2016.
Web: http://dx.doi.org/10.9752/TS056.12-08-2016
Grain Transportation Report
WEEKLY HIGHLIGHTS
Grain Vessel Loading Activity Remains Strong as Ocean Freight Rates Tick Up
Ocean-going grain vessel loading activity remained strong in the U.S. Gulf (Gulf) and the Pacific Northwest (PNW) despite an
increase in the ocean freight rates for shipping bulk commodities, including grains. During the 4-week period beginning November 10
and ending December 1, an average of 50 vessels were loaded in the Gulf, with 77 vessels expected within the next 10 days. During
the same period, 21 vessels were at berth in the PNW. Meanwhile, the ocean freight rate for shipping bulk grain from the Gulf to
Japan was $37 per metric ton (mt) during the week ending December 1, a 16 percent increase over the week ending November 10. The
cost of shipping from the PNW to Japan was $20 per mt, a 13 percent increase compared to November 10. According to a December 1
Transportation and Export report by O’Neil Commodity Consulting, increased iron ore and coal shipments to China caused the rate
increase. Those imports have both increased 9 and 12 percent year to year, respectively. However, it is unlikely that the rate hike is
sustainable, as excess vessel supply still exists in the market.
STB Final Decision on Performance Data Reporting On November 30, the Surface Transportation Board (STB) adopted a final rule requiring all Class I railroads to report certain service
performance metrics on a weekly, semiannual, and occasional basis. STB first opened the proceeding (EP 724) with a public hearing
in April 2014 to understand issues pertaining to the rail service problems emerging in late 2013. In October 2014, STB issued an
interim data collection order and then examined new regulations for permanent reporting over the next 2 years. As described in the
recent decision, “The primary purpose of this rulemaking has been to develop a set of performance data that will allow the agency to
monitor current service conditions in the industry and to identify trends or aberrations, which may indicate problems. … A corollary
benefit is that shippers and other stakeholders will have access to the reported data to assist in their business decisions and supply-
chain planning.” The rule becomes effective January 29, 2017, with reporting to begin February 8.
Boost in Pacific Northwest Grain Inspections Help Total For the week ending December 1, total inspections of grain (corn, wheat, and soybeans) for export from major U.S. export regions
reached 3.56 million metric tons (mmt), up 6 percent from the previous week, up 41 percent from last year, and 16 percent above the
3-year average. Inspections of wheat and corn jumped 85 and 39 percent from the previous week, but soybean inspections dropped 15
percent from the past week. PNW grain inspections increased 57 percent from the previous week as shipments increased to China,
Japan, and the Philippines. Mississippi Gulf inspections, however, decreased 8 percent from the previous week. Outstanding export
sales (unshipped) were up for wheat but down for corn and soybeans.
Snapshots by Sector
Export Sales
During the week ending November 24, unshipped balances of wheat, corn, and soybeans totaled 42.3 mmt, up 50 percent from the
same time last year. Net weekly wheat export sales were .482 mmt, down 32 percent from the previous week. Net corn export sales
were .747 mmt, down 55 percent from the previous week, and net soybean export sales were 1.40 mmt, down 25 percent from the
past week.
Rail
U.S. Class I railroads originated 22,438 grain carloads for the week ending November 26, down 13 percent from the previous week,
up 20 percent from last year, and up 10 percent from the 3-year average.
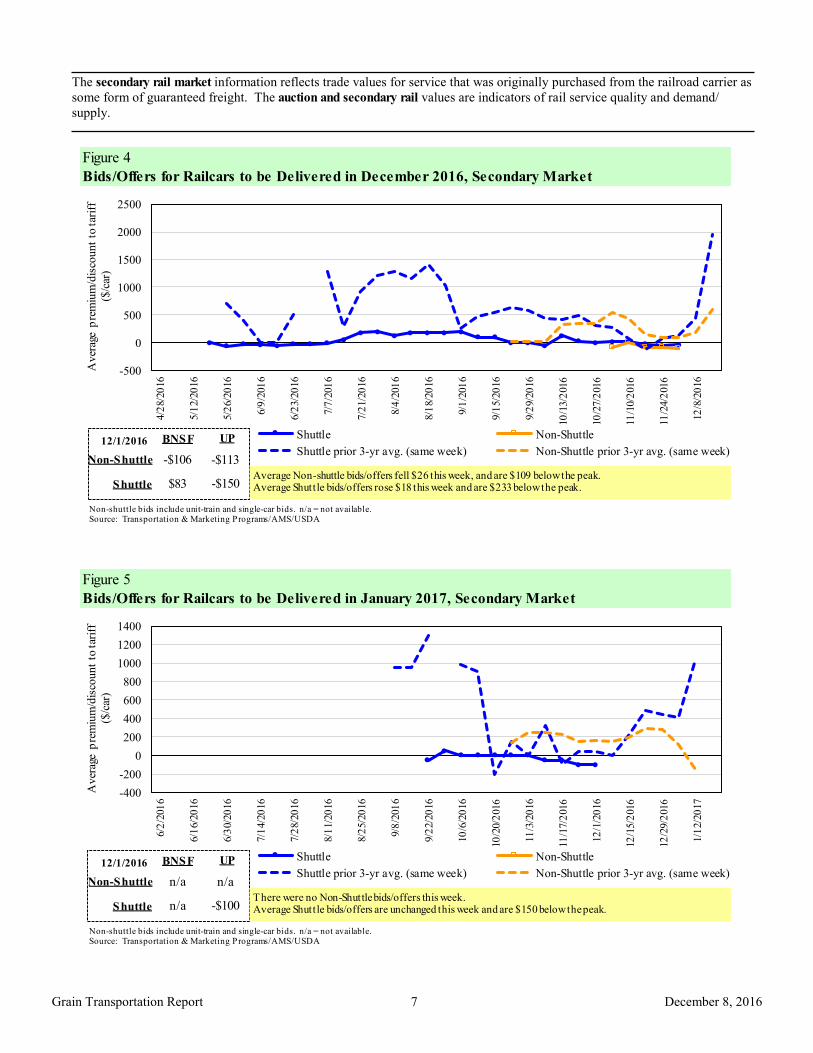
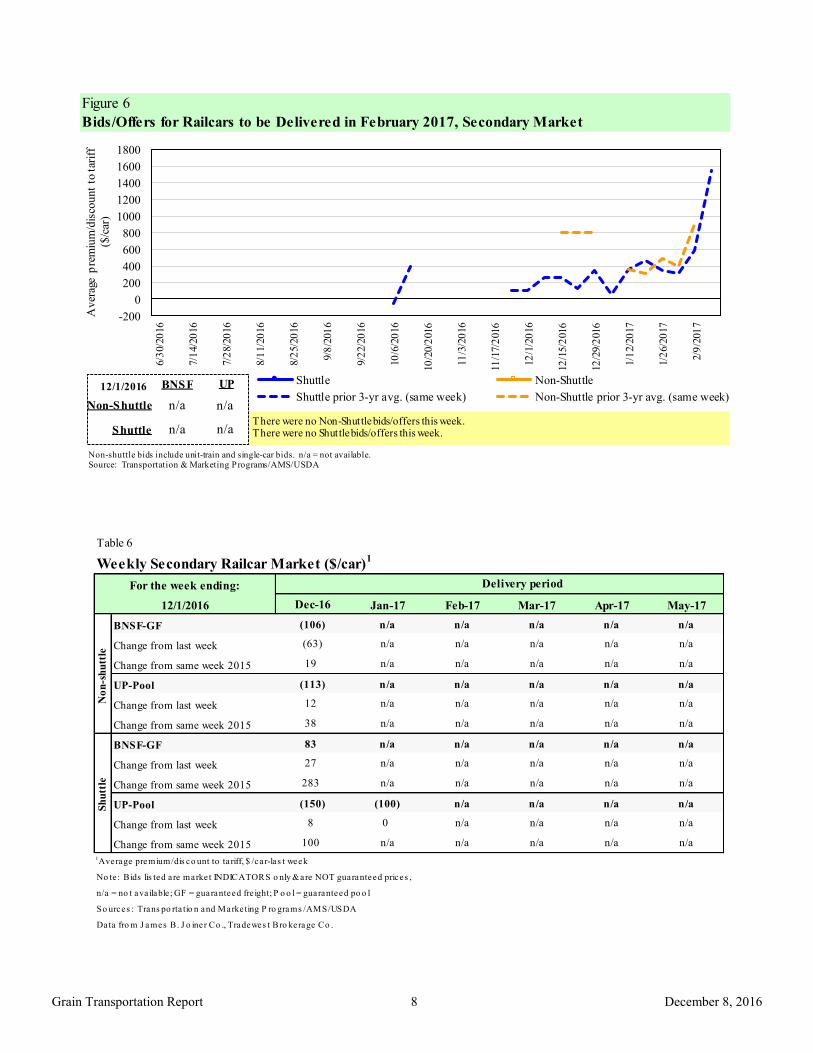
Average December shuttle secondary railcar bids/offers per car were $33 below tariff for the week ending December 1, up $18 from
last week, and $192 higher than last year. Average non-shuttle secondary railcar bids/offers per car were $109 below tariff, down $26
from last week, and $28 higher than last year.
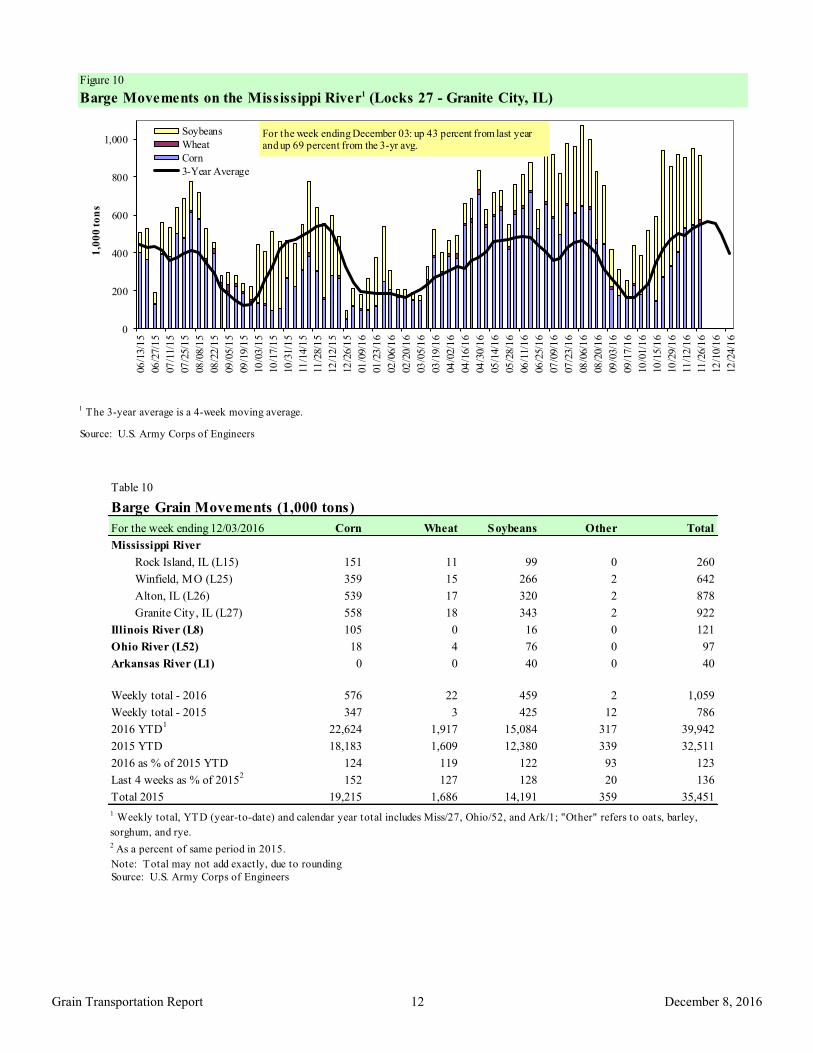
Barge For the week ending December 3, barge grain movements totaled 1,058,591 tons, 15 percent lower than last week, and up 35 percent
from the same period last year.
For the week ending December 3, 683 grain barges moved down river, down 15 percent from last week, 1,007 grain barges were
unloaded in New Orleans, down 3 percent from the previous week.
Ocean
For the week ending December 1, 50 ocean-going grain vessels were loaded in the Gulf, 19 percent more than the same period last
year. Seventy-five vessels are expected to be loaded within the next 10 days, 9 percent more than the same period last year.
For the week ending December 1, the ocean freight rate for shipping bulk grain from the Gulf to Japan was $37 per metric ton, 4
percent more than the previous week. The cost of shipping from the PNW to Japan was $20 per metric ton, 4 percent more than the
previous week.
Fuel
During the week ending December 5, U.S. average diesel fuel prices were up 6 cents from the previous week at $2.48 per gallon, 10
cents higher than the same week last year.
Contact Us
December 8, 2016
Grain Transportation Report 2
Feature Article/Calendar
Transportation of Fertilizer: 2016 Update
Fertilizer is an essential input for profitable agricultural production that relies upon a vast transportation system for
farmers to get the fertilizer they need, when and where they need it. Fertilizer is transported in solid or liquid form
from its point of origin or production location. Before arriving at the farm, fertilizer products will likely have been
transported by more than one mode of transportation. It is transported by rail cars, river barges, trucks, or as gas or
liquid in pipelines. This article updates the data and analysis of fertilizer movements by rail and barges from a
previous article published in April 18, 2013 edition of the Grain Transportation Report.
The United States is one of the world’s largest importers of fertilizers, which helps supplement its domestic use of
nitrogen and potash.1 Canada has been the largest originating country for U.S. fertilizer imports for more than 20
years. In 2012, the value of major U.S. fertilizer products imported was about $13 billion. About $5 billion that total
were imported from Canada. The United States also imports from Egypt, Chile, Kuwait, and China.2
Rail
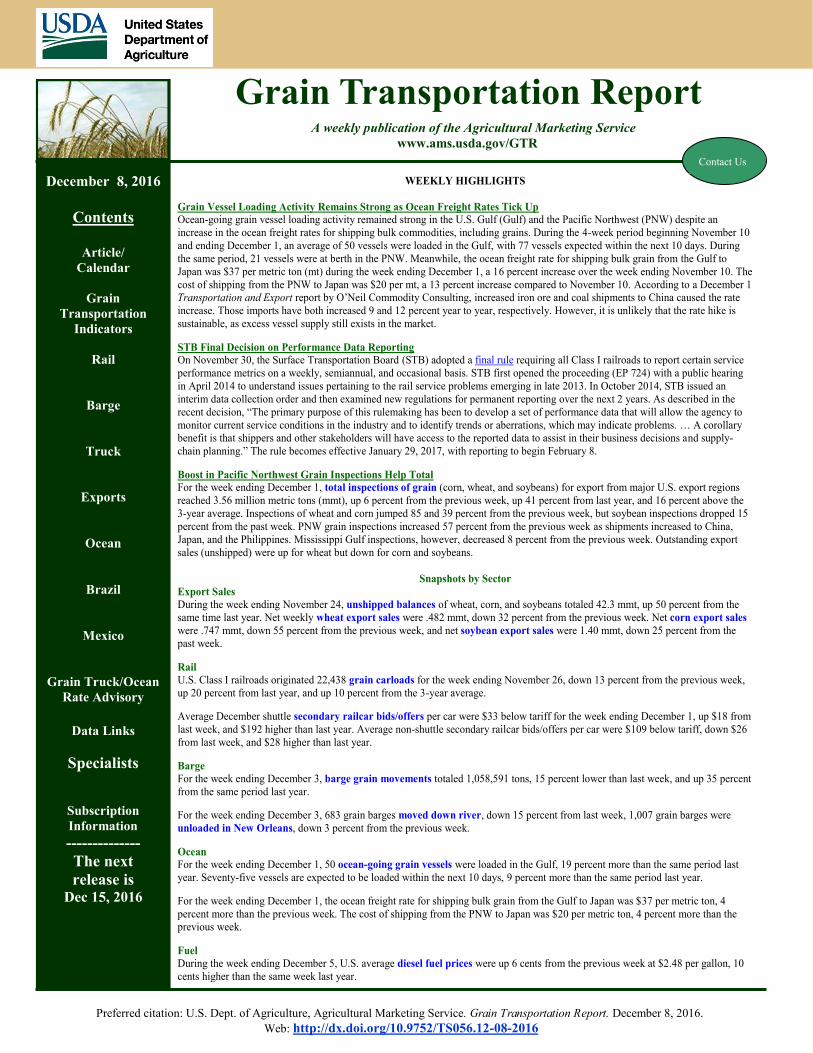
Table 1 shows railroads hauled an annual average of 58 million tons of fertilizer and fertilizer ingredients per year
from 2005 to 2014. Over the 10-year period, total fertilizer shipments fluctuated between 49 million and 66 million
tons annually, with a slight downward trend. Fertilizer ingredient shipments increased from 54 percent of the total in
2005 to 58 percent in 2014. Liquid fertilizer shipments increased from 19 percent of the total in 2005 to 22 percent
in 2014. On the other hand, rail movements of anhydrous ammonia, a toxic-by-inhalation hazardous material,
decreased from
3.7 million tons
to 1.4 million
tons (6 percent
to 2 percent of
the total) during
the same time
period. Dry
fertilizer
shipments also
dropped from
13.8 million
tons (22 percent
of the total) in
2005 to 9.9
million tons (17
percent) in
2014.
Barge
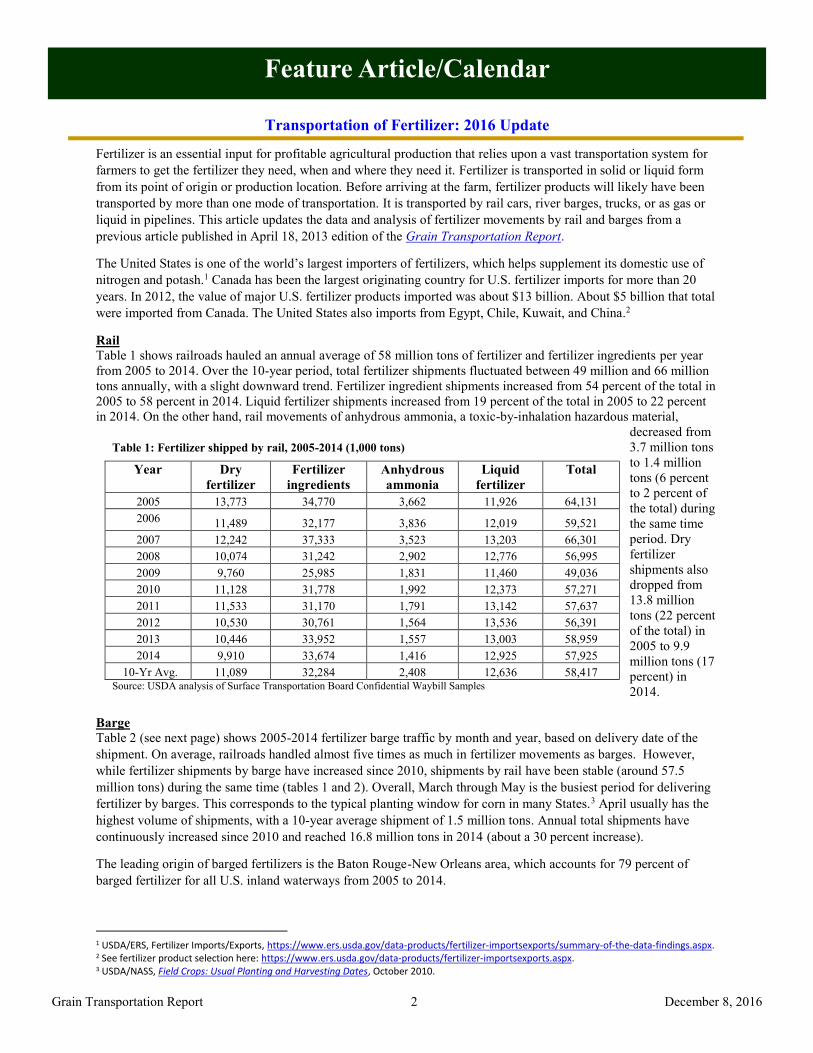
Table 2 (see next page) shows 2005-2014 fertilizer barge traffic by month and year, based on delivery date of the
shipment. On average, railroads handled almost five times as much in fertilizer movements as barges. However,
while fertilizer shipments by barge have increased since 2010, shipments by rail have been stable (around 57.5
million tons) during the same time (tables 1 and 2). Overall, March through May is the busiest period for delivering
fertilizer by barges. This corresponds to the typical planting window for corn in many States.3 April usually has the
highest volume of shipments, with a 10-year average shipment of 1.5 million tons. Annual total shipments have
continuously increased since 2010 and reached 16.8 million tons in 2014 (about a 30 percent increase).
The leading origin of barged fertilizers is the Baton Rouge-New Orleans area, which accounts for 79 percent of
barged fertilizer for all U.S. inland waterways from 2005 to 2014.
1 USDA/ERS, Fertilizer Imports/Exports, https://www.ers.usda.gov/data-products/fertilizer-importsexports/summary-of-the-data-findings.aspx. 2 See fertilizer product selection here: https://www.ers.usda.gov/data-products/fertilizer-importsexports.aspx. 3 USDA/NASS, Field Crops: Usual Planting and Harvesting Dates, October 2010.
Table 1: Fertilizer shipped by rail, 2005-2014 (1,000 tons)
Year Dry
fertilizer
Fertilizer
ingredients
Anhydrous
ammonia
Liquid
fertilizer
Total
2005 13,773 34,770 3,662 11,926 64,131
2006 11,489 32,177 3,836 12,019 59,521
2007 12,242 37,333 3,523 13,203 66,301
2008 10,074 31,242 2,902 12,776 56,995
2009 9,760 25,985 1,831 11,460 49,036
2010 11,128 31,778 1,992 12,373 57,271
2011 11,533 31,170 1,791 13,142 57,637
2012 10,530 30,761 1,564 13,536 56,391
2013 10,446 33,952 1,557 13,003 58,959
2014 9,910 33,674 1,416 12,925 57,925
10-Yr Avg. 11,089 32,284 2,408 12,636 58,417 Source: USDA analysis of Surface Transportation Board Confidential Waybill Samples
December 8, 2016
Grain Transportation Report 3
Baton Rouge-New Orleans often receives fertilizers via Florida, which are either domestically produced or imported
to Florida from foreign origins. Also, Baton Rouge-New Orleans receives imports directly from foreign origins.
The leading fertilizer shipped up-bound from New Orleans by barge is urea (about 41 percent). About 20 percent of
barged fertilizers are delivered to the Upper Mississippi River (above St. Louis, MO), which is the leading
destination for barged fertilizer. Fertilizers can use the same barge as down-bound grain and are often a backhaul
commodity instead of sending an empty barge up-bound. The second leading river area for fertilizer deliveries is the
Ohio River, with about 19 percent of all deliveries. Other important delivery points are the McClellan-Kerr
Arkansas River System, and the Lower Mississippi (e.g., Cairo, IL, and other points south).
Table 2: Average monthly barge fertilizer movements, by month, 2005-2014, 10-year average (1,000 tons)
2005 2006 2007 2008 2009 2010 2011 2012 2013 2014 10-Yr. Avg.
Jan 888 1,028 919 963 754 822 1,073 1,072 1,174 1,049 974
Feb 791 809 785 867 944 895 700 1,087 1,171 1,061 911
Mar 1,350 1,158 1,451 1,005 956 1,040 1,386 1,547 1,462 1,538 1,289
Apr 1,510 1,362 1,465 1,154 1,178 1,624 1,553 1,709 1,696 2,023 1,527
May 1,395 1,191 1,472 1,333 900 1,124 1,337 1,383 1,745 2,175 1,405
Jun 969 806 911 1,039 841 907 1,189 759 1,082 1,003 951
Jul 766 672 816 997 734 714 897 758 924 768 805
Aug 771 590 858 989 750 893 998 842 955 1,183 883
Sep 702 796 918 782 779 888 931 1,106 1,021 1,563 949
Oct 761 846 1,231 948 739 1,381 1,389 1,641 1,489 1,780 1,220
Nov 1,099 913 1,061 719 987 1,349 1,280 1,420 1,583 1,429 1,184
Dec 816 717 952 523 867 1,258 937 1,155 1,039 1,280 954
Annual 11,816 10,887 12,838 11,319 10,429 12,896 13,671 14,480 15,341 16,850 13,053
Source: Detailed Origin-Destination Waterborne Commerce Statistics, U.S. Army Corps of Engineers
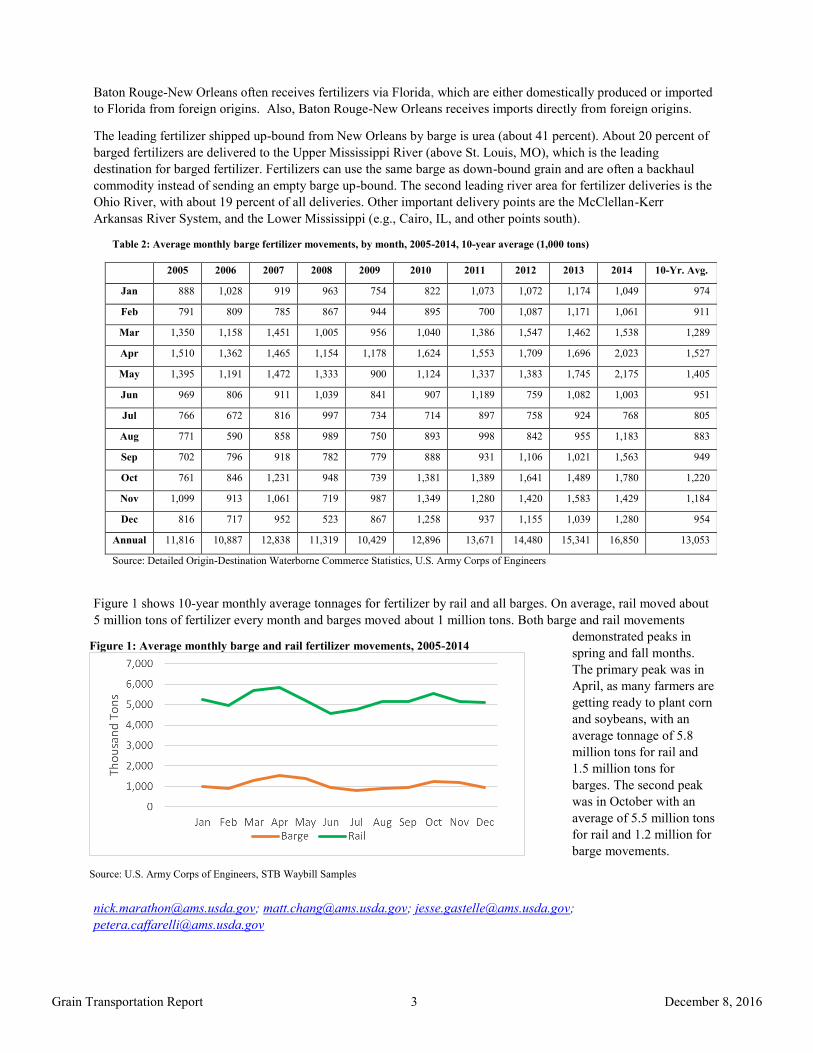
Figure 1 shows 10-year monthly average tonnages for fertilizer by rail and all barges. On average, rail moved about
5 million tons of fertilizer every month and barges moved about 1 million tons. Both barge and rail movements
demonstrated peaks in
spring and fall months.
The primary peak was in
April, as many farmers are
getting ready to plant corn
and soybeans, with an
average tonnage of 5.8
million tons for rail and
1.5 million tons for
barges. The second peak
was in October with an
average of 5.5 million tons
for rail and 1.2 million for
barge movements.
[email protected]; [email protected]; [email protected];
Figure 1: Average monthly barge and rail fertilizer movements, 2005-2014
Source: U.S. Army Corps of Engineers, STB Waybill Samples
December 8, 2016
Grain Transportation Report 4
Grain Transportation Indicators
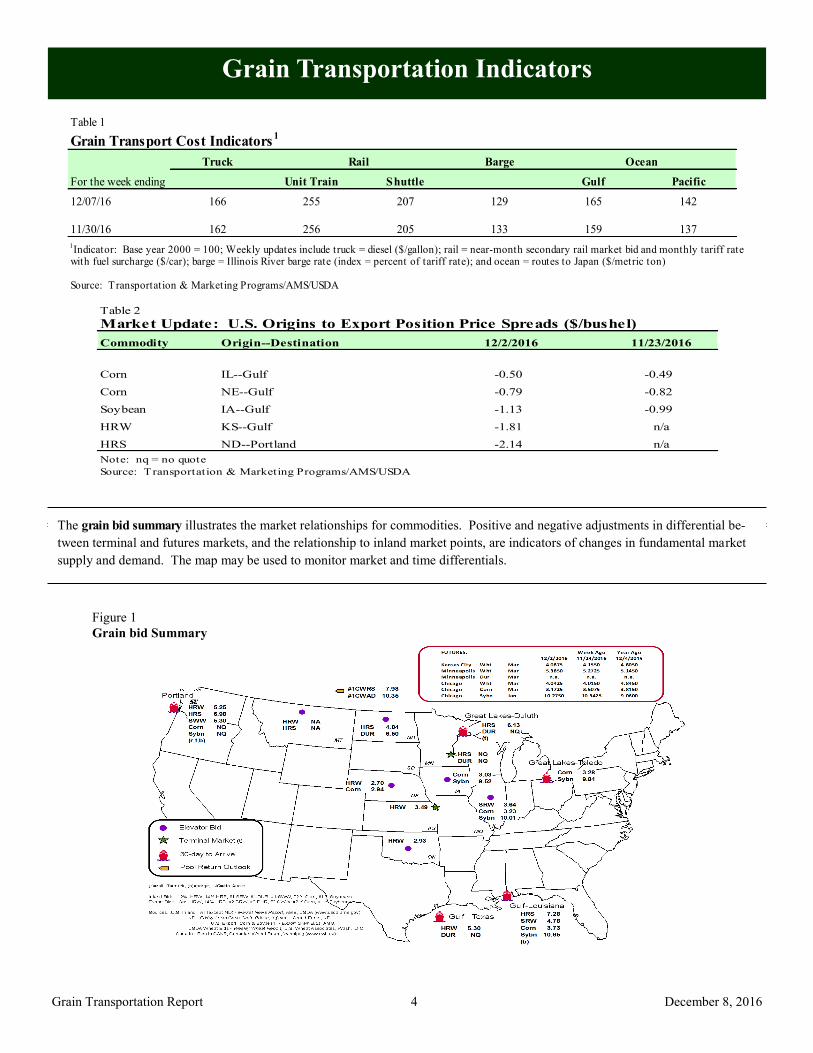
The grain bid summary illustrates the market relationships for commodities. Positive and negative adjustments in differential be-
tween terminal and futures markets, and the relationship to inland market points, are indicators of changes in fundamental market
supply and demand. The map may be used to monitor market and time differentials.
Table 2
Market Update: U.S. Origins to Export Position Price Spreads ($/bushel)
Commodity Origin--Destination 12/2/2016 11/23/2016
Corn IL--Gulf -0.50 -0.49
Corn NE--Gulf -0.79 -0.82
Soybean IA--Gulf -1.13 -0.99
HRW KS--Gulf -1.81 n/a
HRS ND--Portland -2.14 n/a
Note: nq = no quote
Source: Transportation & Marketing Programs/AMS/USDA
Table 1
Grain Transport Cost Indicators1
Truck Barge Ocean
For the week ending Unit Train Shuttle Gulf Pacific
12/07/16 166 255 207 129 165 1422 % 3 1% - 3 % 4 % 4 %
11/30/16 162 256 205 133 159 137
1Indicator: Base year 2000 = 100; Weekly updates include truck = diesel ($/gallon); rail = near-month secondary rail market bid and monthly tariff rate
with fuel surcharge ($/car); barge = Illinois River barge rate (index = percent of tariff rate); and ocean = routes to Japan ($/metric ton)
Source: Transportation & Marketing Programs/AMS/USDA
Rail
Figure 1
Grain bid Summary
December 8, 2016
Grain Transportation Report 5
Rail Transportation
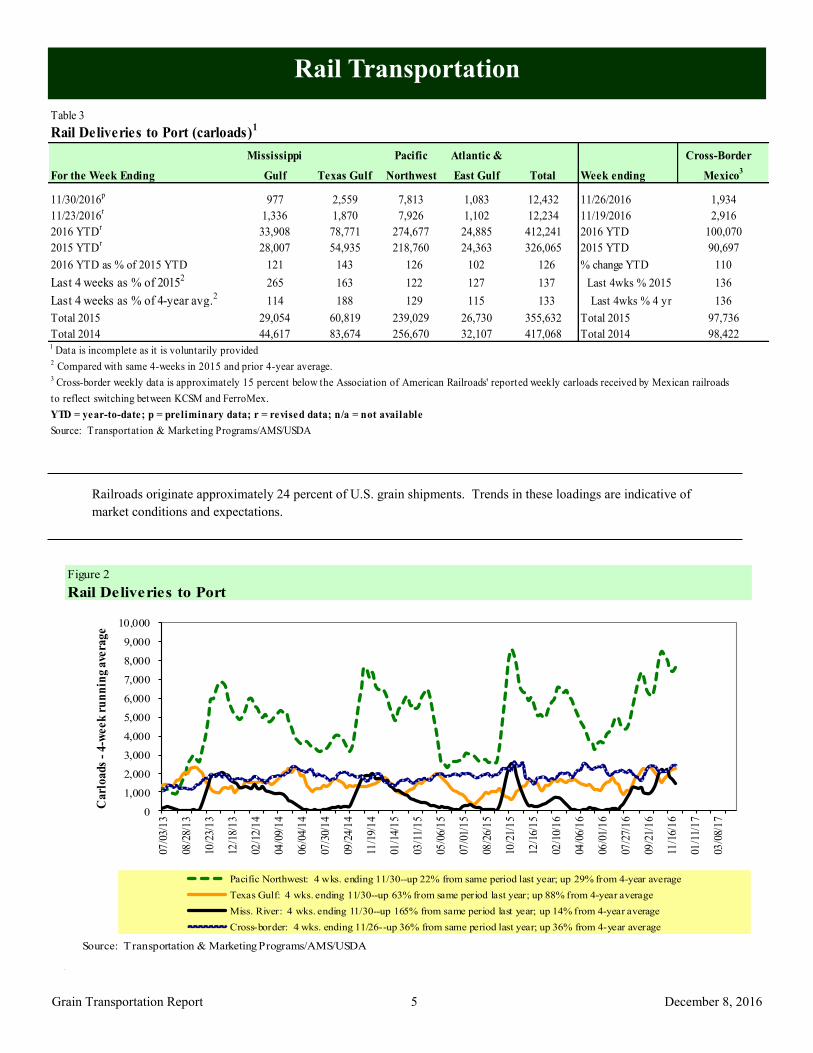
Railroads originate approximately 24 percent of U.S. grain shipments. Trends in these loadings are indicative of
market conditions and expectations.
Figure 2
Rail Deliveries to Port
0
1,000
2,000
3,000
4,000
5,000
6,000
7,000
8,000
9,000
10,000
07/0
3/1
3
08/2
8/1
3
10/2
3/1
3
12/1
8/1
3
02/1
2/1
4
04/0
9/1
4
06/0
4/1
4
07/3
0/1
4
09/2
4/1
4
11/1
9/1
4
01/1
4/1
5
03/1
1/1
5
05/0
6/1
5
07/0
1/1
5
08/2
6/1
5
10/2
1/1
5
12/1
6/1
5
02/1
0/1
6
04/0
6/1
6
06/0
1/1
6
07/2
7/1
6
09/2
1/1
6
11/1
6/1
6
01/1
1/1
7
03/0
8/1
7
Carl
oa
ds
-4
-we
ek
ru
nn
ing a
vera
ge
Pacific Northwest: 4 wks. ending 11/30--up 22% from same period last year; up 29% from 4-year average
Texas Gulf: 4 wks. ending 11/30--up 63% from same period last year; up 88% from 4-year average
Miss. River: 4 wks. ending 11/30--up 165% from same period last year; up 14% from 4-year average
Cross-border: 4 wks. ending 11/26--up 36% from same period last year; up 36% from 4-year average
Source: T ransportation & Marketing Programs/AMS/USDA
Table 3
Rail Deliveries to Port (carloads)1
Mississippi Pacific Atlantic & Cross-Border
For the Week Ending Gulf Texas Gulf Northwest East Gulf Total Week ending Mexico3
11/30/2016p
977 2,559 7,813 1,083 12,432 11/26/2016 1,934
11/23/2016r
1,336 1,870 7,926 1,102 12,234 11/19/2016 2,916
2016 YTDr
33,908 78,771 274,677 24,885 412,241 2016 YTD 100,070
2015 YTDr
28,007 54,935 218,760 24,363 326,065 2015 YTD 90,697
2016 YTD as % of 2015 YTD 121 143 126 102 126 % change YTD 110
Last 4 weeks as % of 20152
265 163 122 127 137 Last 4wks % 2015 136
Last 4 weeks as % of 4-year avg.2
114 188 129 115 133 Last 4wks % 4 yr 136
Total 2015 29,054 60,819 239,029 26,730 355,632 Total 2015 97,736
Total 2014 44,617 83,674 256,670 32,107 417,068 Total 2014 98,4221 Data is incomplete as it is voluntarily provided2 Compared with same 4-weeks in 2015 and prior 4-year average.
3 Cross-border weekly data is approximately 15 percent below the Association of American Railroads' reported weekly carloads received by Mexican railroads
to reflect switching between KCSM and FerroMex.
YTD = year-to-date; p = preliminary data; r = revised data; n/a = not available
Source: Transportation & Marketing Programs/AMS/USDA
December 8, 2016
Grain Transportation Report 6
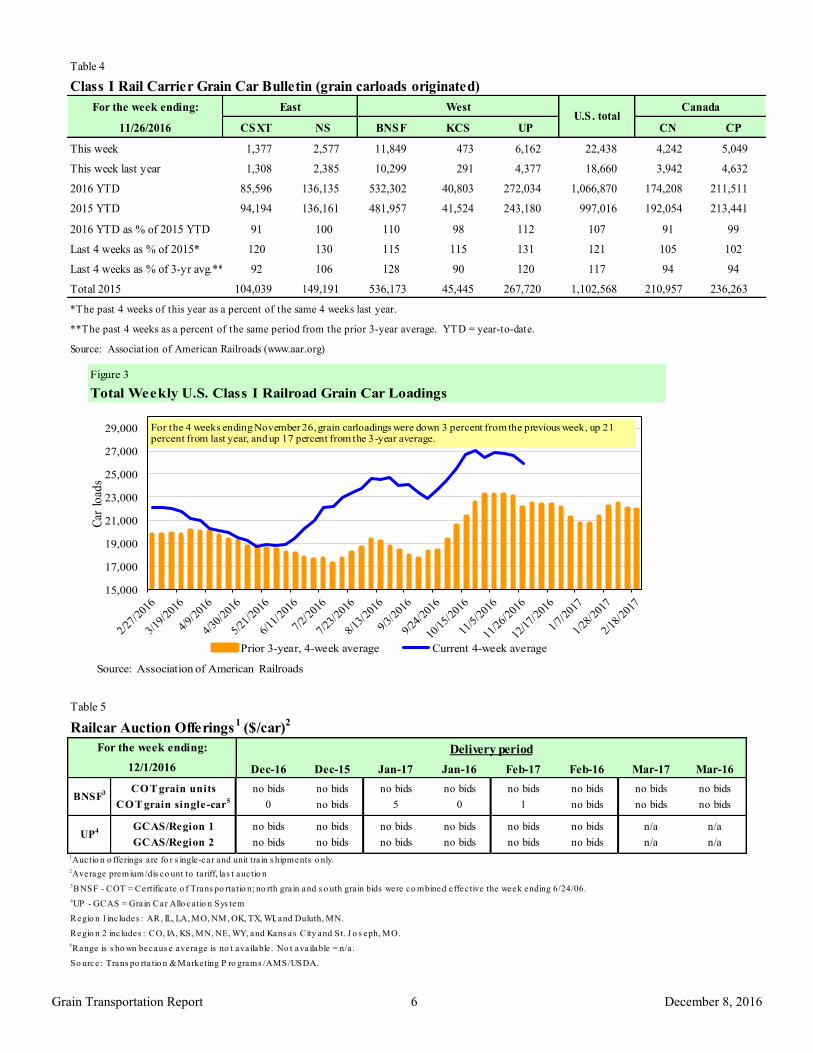
Table 5
Railcar Auction Offerings1
($/car)2
Dec-16 Dec-15 Jan-17 Jan-16 Feb-17 Feb-16 Mar-17 Mar-16
CO T grain units no bids no bids no bids no bids no bids no bids no bids no bids
CO T grain single-car5 0 no bids 5 0 1 no bids no bids no bids
GCAS/Region 1 no bids no bids no bids no bids no bids no bids n/a n/a
GCAS/Region 2 no bids no bids no bids no bids no bids no bids n/a n/a
1Auctio n o fferings a re fo r s ingle-car and unit tra in s hipments o nly.2Average premium/dis co unt to ta riff, las t auc tio n
3BNSF - COT = Certifica te o f Trans po rta tio n; no rth gra in and s o uth gra in bids were co mbined effec tive the week ending 6/24/06.
4UP - GCAS = Grain Car Allo ca tio n Sys tem
Regio n 1 inc ludes : AR, IL, LA, MO, NM, OK, TX, WI, and Duluth, MN.
Regio n 2 inc ludes : CO, IA, KS, MN, NE, WY, and Kans as City and St. J o s eph, MO.
5Range is s ho wn becaus e average is no t ava ilable . No t ava ilable = n/a .
So urce : Trans po rta tio n & Marketing P ro grams /AMS/USDA.
UP4
Delivery period
BNSF3
For the week ending:
12/1/2016
Table 4
Class I Rail Carrier Grain Car Bulletin (grain carloads originated)
For the week ending:
11/26/2016 CSXT NS BNSF KCS UP CN CP
This week 1,377 2,577 11,849 473 6,162 22,438 4,242 5,049
This week last year 1,308 2,385 10,299 291 4,377 18,660 3,942 4,632
2016 YTD 85,596 136,135 532,302 40,803 272,034 1,066,870 174,208 211,511
2015 YTD 94,194 136,161 481,957 41,524 243,180 997,016 192,054 213,441
2016 YTD as % of 2015 YTD 91 100 110 98 112 107 91 99
Last 4 weeks as % of 2015* 120 130 115 115 131 121 105 102
Last 4 weeks as % of 3-yr avg.** 92 106 128 90 120 117 94 94
Total 2015 104,039 149,191 536,173 45,445 267,720 1,102,568 210,957 236,263
*The past 4 weeks of this year as a percent of the same 4 weeks last year.
**The past 4 weeks as a percent of the same period from the prior 3-year average. YTD = year-to-date.
Source: Association of American Railroads (www.aar.org)
East WestU.S. total
Canada
Figure 3
Total Weekly U.S. Class I Railroad Grain Car Loadings
15,000
17,000
19,000
21,000
23,000
25,000
27,000
29,000
Car
lo
ads
Prior 3-year, 4-week average Current 4-week average
For the 4 weeks ending November 26, grain carloadings were down 3 percent from the previous week, up 21 percent from last year, and up 17 percent from the 3-year average.
Source: Association of American Railroads
December 8, 2016
Grain Transportation Report 7
The secondary rail market information reflects trade values for service that was originally purchased from the railroad carrier as
some form of guaranteed freight. The auction and secondary rail values are indicators of rail service quality and demand/
supply.
Figure 4
Bids/Offers for Railcars to be Delivered in December 2016, Secondary Market
-500
0
500
1000
1500
2000
2500
4/2
8/2
016
5/1
2/2
016
5/2
6/2
016
6/9
/201
6
6/2
3/2
016
7/7
/201
6
7/2
1/2
016
8/4
/201
6
8/1
8/2
016
9/1
/201
6
9/1
5/2
016
9/2
9/2
016
10/1
3/2
016
10/2
7/2
016
11/1
0/2
016
11/2
4/2
016
12
/8/2
016
Aver
age
pre
miu
m/d
isco
unt
to tar
iff
($/c
ar)
Shuttle Non-Shuttle
Shuttle prior 3-yr avg. (same week) Non-Shuttle prior 3-yr avg. (same week)12/1/2016
Non-shuttle bids include unit-train and single-car bids. n/a = not available.Source: Transportation & Marketing Programs/AMS/USDA
-$106
UPBNSF
$83
-$113
-$150Shuttle
Non-Shuttle
Average Non-shuttle bids/offers fell $26 this week, and are $109 below the peak.Average Shuttle bids/offers rose $18 this week and are $233 below the peak.
Figure 5
Bids/Offers for Railcars to be Delivered in January 2017, Secondary Market
-400
-200
0
200
400
600
800
1000
1200
1400
6/2
/201
6
6/1
6/2
016
6/3
0/2
016
7/1
4/2
016
7/2
8/2
016
8/1
1/2
016
8/2
5/2
016
9/8
/201
6
9/2
2/2
016
10
/6/2
016
10/2
0/2
016
11
/3/2
016
11/1
7/2
016
12
/1/2
016
12/1
5/2
016
12/2
9/2
016
1/1
2/2
017
Aver
age
pre
miu
m/d
isco
unt
to tar
iff
($/c
ar)
Shuttle Non-Shuttle
Shuttle prior 3-yr avg. (same week) Non-Shuttle prior 3-yr avg. (same week)12/1/2016
Non-shuttle bids include unit-train and single-car bids. n/a = not available.Source: Transportation & Marketing Programs/AMS/USDA
n/a
UPBNSF
n/a
n/a
-$100Shuttle
Non-Shuttle
There were no Non-Shuttle bids/offers this week.Average Shuttle bids/offers are unchanged this week and are $150 below the peak.
December 8, 2016
Grain Transportation Report 8
Figure 6
Bids/Offers for Railcars to be Delivered in February 2017, Secondary Market
-200
0
200
400
600
800
1000
1200
1400
1600
18006/3
0/2
016
7/1
4/2
016
7/2
8/2
016
8/1
1/2
016
8/2
5/2
016
9/8
/201
6
9/2
2/2
016
10
/6/2
016
10/2
0/2
016
11
/3/2
016
11/1
7/2
016
12
/1/2
016
12/1
5/2
016
12/2
9/2
016
1/1
2/2
017
1/2
6/2
017
2/9
/201
7
Aver
age
pre
miu
m/d
isco
unt
to tar
iff
($/c
ar)
Shuttle Non-Shuttle
Shuttle prior 3-yr avg. (same week) Non-Shuttle prior 3-yr avg. (same week)12/1/2016
Non-shuttle bids include unit-train and single-car bids. n/a = not available.Source: Transportation & Marketing Programs/AMS/USDA
n/a
UPBNSF
n/a
n/a
n/aShuttle
Non-Shuttle
There were no Non-Shuttle bids/offers this week.There were no Shuttle bids/offers this week.
Table 6
Weekly Secondary Railcar Market ($/car)1
Dec-16 Jan-17 Feb-17 Mar-17 Apr-17 May-17
BNSF-GF (106) n/a n/a n/a n/a n/a
Change from last week (63) n/a n/a n/a n/a n/a
Change from same week 2015 19 n/a n/a n/a n/a n/a
UP-Pool (113) n/a n/a n/a n/a n/a
Change from last week 12 n/a n/a n/a n/a n/a
Change from same week 2015 38 n/a n/a n/a n/a n/a
BNSF-GF 83 n/a n/a n/a n/a n/a
Change from last week 27 n/a n/a n/a n/a n/a
Change from same week 2015 283 n/a n/a n/a n/a n/a
UP-Pool (150) (100) n/a n/a n/a n/a
Change from last week 8 0 n/a n/a n/a n/a
Change from same week 2015 100 n/a n/a n/a n/a n/a
1Average premium/dis co unt to ta riff, $ /car-las t week
No te : Bids lis ted are market INDICATORS o nly & are NOT guaranteed prices ,
n/a = no t ava ilable ; GF = guaranteed fre ight; P o o l = guaranteed po o l
So urces : Trans po rta tio n and Marketing P ro grams /AMS/USDA
Data fro m J ames B. J o iner Co ., Tradewes t Bro kerage Co .
No
n-s
hu
ttle
For the week ending:
12/1/2016
Sh
utt
le
Delivery period
December 8, 2016
Grain Transportation Report 9
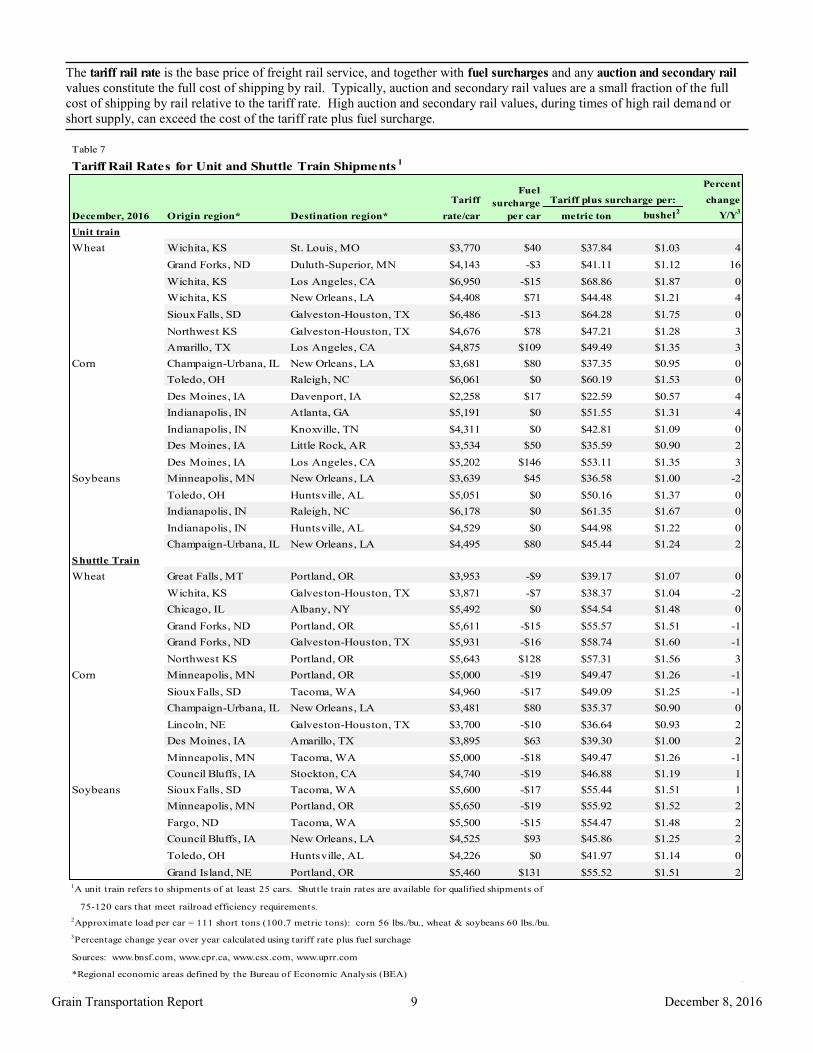
Table 7
Tariff Rail Rates for Unit and Shuttle Train Shipments1
Percent
Tariff change
December, 2016 Origin region* Destination region* rate/car metric ton bushel2
Y/Y3
Unit train
Wheat Wichita, KS St. Louis, MO $3,770 $40 $37.84 $1.03 4
Grand Forks, ND Duluth-Superior, MN $4,143 -$3 $41.11 $1.12 16
Wichita, KS Los Angeles, CA $6,950 -$15 $68.86 $1.87 0
Wichita, KS New Orleans, LA $4,408 $71 $44.48 $1.21 4
Sioux Falls, SD Galveston-Houston, TX $6,486 -$13 $64.28 $1.75 0
Northwest KS Galveston-Houston, TX $4,676 $78 $47.21 $1.28 3
Amarillo, TX Los Angeles, CA $4,875 $109 $49.49 $1.35 3
Corn Champaign-Urbana, IL New Orleans, LA $3,681 $80 $37.35 $0.95 0
Toledo, OH Raleigh, NC $6,061 $0 $60.19 $1.53 0
Des Moines, IA Davenport, IA $2,258 $17 $22.59 $0.57 4
Indianapolis, IN Atlanta, GA $5,191 $0 $51.55 $1.31 4
Indianapolis, IN Knoxville, TN $4,311 $0 $42.81 $1.09 0
Des Moines, IA Little Rock, AR $3,534 $50 $35.59 $0.90 2
Des Moines, IA Los Angeles, CA $5,202 $146 $53.11 $1.35 3
Soybeans Minneapolis, MN New Orleans, LA $3,639 $45 $36.58 $1.00 -2
Toledo, OH Huntsville, AL $5,051 $0 $50.16 $1.37 0
Indianapolis, IN Raleigh, NC $6,178 $0 $61.35 $1.67 0
Indianapolis, IN Huntsville, AL $4,529 $0 $44.98 $1.22 0
Champaign-Urbana, IL New Orleans, LA $4,495 $80 $45.44 $1.24 2
Shuttle Train
Wheat Great Falls, MT Portland, OR $3,953 -$9 $39.17 $1.07 0
Wichita, KS Galveston-Houston, TX $3,871 -$7 $38.37 $1.04 -2
Chicago, IL Albany, NY $5,492 $0 $54.54 $1.48 0
Grand Forks, ND Portland, OR $5,611 -$15 $55.57 $1.51 -1
Grand Forks, ND Galveston-Houston, TX $5,931 -$16 $58.74 $1.60 -1
Northwest KS Portland, OR $5,643 $128 $57.31 $1.56 3
Corn Minneapolis, MN Portland, OR $5,000 -$19 $49.47 $1.26 -1
Sioux Falls, SD Tacoma, WA $4,960 -$17 $49.09 $1.25 -1
Champaign-Urbana, IL New Orleans, LA $3,481 $80 $35.37 $0.90 0
Lincoln, NE Galveston-Houston, TX $3,700 -$10 $36.64 $0.93 2
Des Moines, IA Amarillo, TX $3,895 $63 $39.30 $1.00 2
Minneapolis, MN Tacoma, WA $5,000 -$18 $49.47 $1.26 -1
Council Bluffs, IA Stockton, CA $4,740 -$19 $46.88 $1.19 1
Soybeans Sioux Falls, SD Tacoma, WA $5,600 -$17 $55.44 $1.51 1
Minneapolis, MN Portland, OR $5,650 -$19 $55.92 $1.52 2
Fargo, ND Tacoma, WA $5,500 -$15 $54.47 $1.48 2
Council Bluffs, IA New Orleans, LA $4,525 $93 $45.86 $1.25 2
Toledo, OH Huntsville, AL $4,226 $0 $41.97 $1.14 0
Grand Island, NE Portland, OR $5,460 $131 $55.52 $1.51 2
1A unit train refers to shipments of at least 25 cars. Shuttle train rates are available for qualified shipments of
75-120 cars that meet railroad efficiency requirements.
2Approximate load per car = 111 short tons (100.7 metric tons): corn 56 lbs./bu., wheat & soybeans 60 lbs./bu.
3Percentage change year over year calculated using tariff rate plus fuel surchage
Sources: www.bnsf.com, www.cpr.ca, www.csx.com, www.uprr.com
*Regional economic areas defined by the Bureau of Economic Analysis (BEA)
Tariff plus surcharge per:Fuel
surcharge
per car
The tariff rail rate is the base price of freight rail service, and together with fuel surcharges and any auction and secondary rail
values constitute the full cost of shipping by rail. Typically, auction and secondary rail values are a small fraction of the full
cost of shipping by rail relative to the tariff rate. High auction and secondary rail values, during times of high rail demand or
short supply, can exceed the cost of the tariff rate plus fuel surcharge.
December 8, 2016
Grain Transportation Report 10
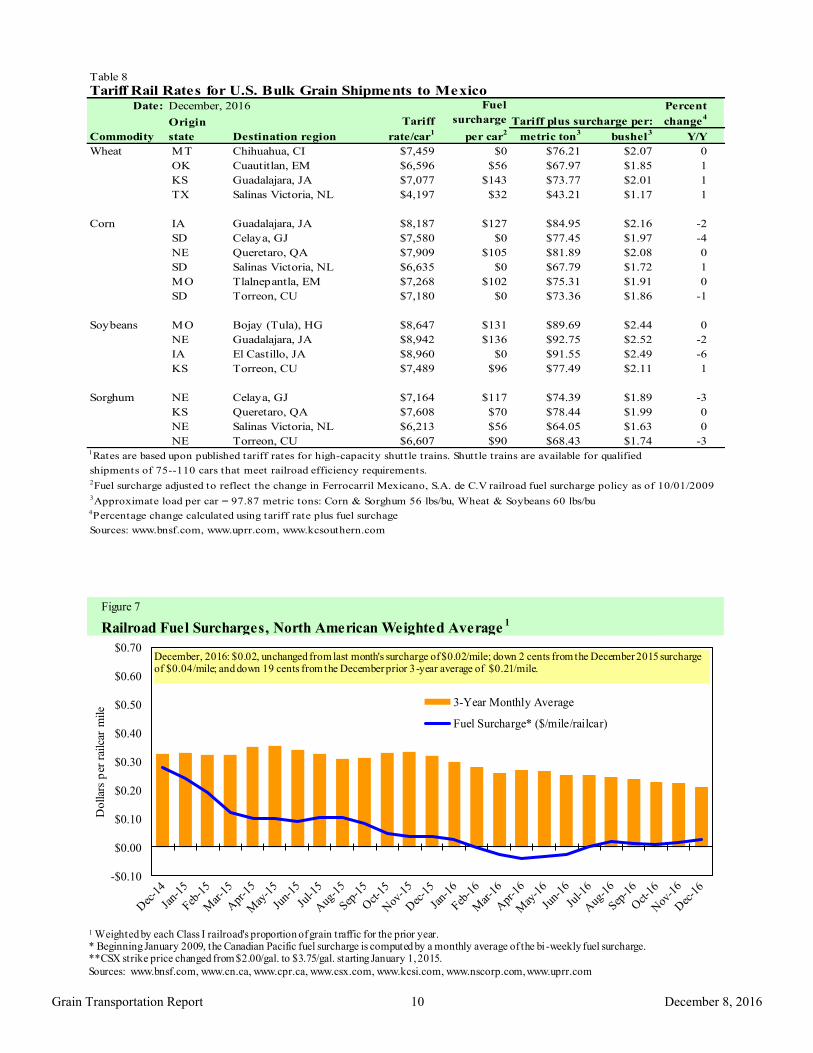
Table 8
Tariff Rail Rates for U.S. Bulk Grain Shipments to MexicoDate: Percent
Tariff change4
Commodity Destination region rate/car1
metric ton3 bushel
3Y/Y
Wheat MT Chihuahua, CI $7,459 $0 $76.21 $2.07 0
OK Cuautitlan, EM $6,596 $56 $67.97 $1.85 1
KS Guadalajara, JA $7,077 $143 $73.77 $2.01 1
TX Salinas Victoria, NL $4,197 $32 $43.21 $1.17 1
Corn IA Guadalajara, JA $8,187 $127 $84.95 $2.16 -2
SD Celaya, GJ $7,580 $0 $77.45 $1.97 -4
NE Queretaro, QA $7,909 $105 $81.89 $2.08 0
SD Salinas Victoria, NL $6,635 $0 $67.79 $1.72 1
MO Tlalnepantla, EM $7,268 $102 $75.31 $1.91 0
SD Torreon, CU $7,180 $0 $73.36 $1.86 -1
Soybeans MO Bojay (Tula), HG $8,647 $131 $89.69 $2.44 0
NE Guadalajara, JA $8,942 $136 $92.75 $2.52 -2
IA El Castillo, JA $8,960 $0 $91.55 $2.49 -6
KS Torreon, CU $7,489 $96 $77.49 $2.11 1
Sorghum NE Celaya, GJ $7,164 $117 $74.39 $1.89 -3
KS Queretaro, QA $7,608 $70 $78.44 $1.99 0
NE Salinas Victoria, NL $6,213 $56 $64.05 $1.63 0
NE Torreon, CU $6,607 $90 $68.43 $1.74 -31Rates are based upon published tariff rates for high-capacity shuttle trains. Shuttle trains are available for qualified
shipments of 75--110 cars that meet railroad efficiency requirements.2Fuel surcharge adjusted to reflect the change in Ferrocarril Mexicano, S.A. de C.V railroad fuel surcharge policy as of 10/01/20093Approximate load per car = 97.87 metric tons: Corn & Sorghum 56 lbs/bu, Wheat & Soybeans 60 lbs/bu4Percentage change calculated using tariff rate plus fuel surchage
Sources: www.bnsf.com, www.uprr.com, www.kcsouthern.com
Fuel
surcharge
per car2
Tariff plus surcharge per:Origin
state
December, 2016
Figure 7
Railroad Fuel Surcharges, North American Weighted Average1
-$0.10
$0.00
$0.10
$0.20
$0.30
$0.40
$0.50
$0.60
$0.70
Dollar
s p
er r
ailc
ar m
ile
3-Year Monthly Average
Fuel Surcharge* ($/mile/railcar)
December, 2016: $0.02, unchanged from last month's surcharge of $0.02/mile; down 2 cents from the December 2015 surcharge of $0.04/mile; and down 19 cents from the December prior 3-year average of $0.21/mile.
1 Weighted by each Class I railroad's proportion of grain traffic for the prior year. * Beginning January 2009, the Canadian Pacific fuel surcharge is computed by a monthly average of the bi -weekly fuel surcharge.**CSX strike price changed from $2.00/gal. to $3.75/gal. starting January 1, 2015.
Sources: www.bnsf.com, www.cn.ca, www.cpr.ca, www.csx.com, www.kcsi.com, www.nscorp.com, www.uprr.com

December 8, 2016
Grain Transportation Report 11
Barge Transportation
Figure 8
Illinois River Barge Freight Rate1,2
1Rate = percent of 1976 tariff benchmark index (1976 = 100 percent); 24-week moving average of the 3-year average.
Source: Transportation & Marketing Programs/AMS/USDA
0
200
400
600
800
1000
1200
12/0
8/15
12/2
2/15
01/0
5/16
01/1
9/16
02/0
2/16
02/1
6/16
03/0
1/16
03/1
5/16
03/2
9/16
04/1
2/16
04/2
6/16
05/1
0/16
05/2
4/16
06/0
7/16
06/2
1/16
07/0
5/16
07/1
9/16
08/0
2/16
08/1
6/16
08/3
0/16
09/1
3/16
09/2
7/16
10/1
1/16
10/2
5/16
11/0
8/16
11/2
2/16
12/0
6/16
Per
cen
t of
tar
iff
Weekly rate
3-year avg. for
the week
For the week ending December 6: 3 percent lower than last week, 17 percent lower than last year,and 51 percent lower than the 3-year average.
Table 9
Weekly Barge Freight Rates: Southbound Only
Twin
Cities
Mid-
Mississippi
Lower
Illinois
River St. Louis Cincinnati
Lower
Ohio
Cairo-
Memphis
Rate1
12/6/2016 - - 233 180 190 190 153
11/29/2016 - - 240 183 200 200 163
$/ton 12/6/2016 - - 10.81 7.18 8.91 7.68 4.80
11/29/2016 - - 11.14 7.30 9.38 8.08 5.12
Current week % change from the same week:
Last year - - -17 0 4 4 -9
3-year avg. 2
- - -51 -52 -56 -56 -52-2 6 6
Rate1
January - - 258 190 190 190 153
March - 273 250 185 190 190 153
Source: Transportation & Marketing Programs/AMS/USDA
1Rate = percent of 1976 tariff benchmark index (1976 = 100 percent);
24-week moving average; ton = 2,000 pounds; - closed for winter
Figure 9
Benchmark tariff rates
Calculating barge rate per ton:
(Rate * 1976 tariff benchmark rate per ton)/100
Select applicable index from market quotes included in
tables on this page. The 1976 benchmark rates per ton
are provided in map.
Twin Cities 6.19
Mid-Mississippi 5.32
St. Louis 3.99
Cairo-Memphis 3.14
Illinois 4.64 Cincinnati 4.69
Lower Ohio 4.04
December 8, 2016
Grain Transportation Report 12
Figure 10
Barge Movements on the Mississippi River1 (Locks 27 - Granite City, IL)
1 The 3-year average is a 4-week moving average.
Source: U.S. Army Corps of Engineers
0
200
400
600
800
1,00006
/13/1
5
06
/27/1
5
07
/11/1
5
07
/25/1
5
08
/08/1
5
08
/22/1
5
09
/05/1
5
09
/19/1
5
10
/03/1
5
10
/17/1
5
10
/31/1
5
11
/14/1
5
11
/28/1
5
12
/12/1
5
12
/26/1
5
01
/09/1
6
01
/23/1
6
02
/06/1
6
02
/20/1
6
03
/05/1
6
03
/19/1
6
04
/02/1
6
04
/16/1
6
04
/30/1
6
05
/14/1
6
05
/28/1
6
06
/11/1
6
06
/25/1
6
07
/09/1
6
07
/23/1
6
08
/06/1
6
08
/20/1
6
09
/03/1
6
09
/17/1
6
10
/01/1
6
10
/15/1
6
10
/29/1
6
11
/12/1
6
11
/26/1
6
12
/10/1
6
12
/24/1
6
1,0
00
to
ns
Soybeans
Wheat
Corn
3-Year Average
For the week ending December 03: up 43 percent from last yearand up 69 percent from the 3-yr avg.
Table 10
Barge Grain Movements (1,000 tons)
For the week ending 12/03/2016 Corn Wheat Soybeans Other Total
Mississippi River
Rock Island, IL (L15) 151 11 99 0 260
Winfield, MO (L25) 359 15 266 2 642
Alton, IL (L26) 539 17 320 2 878
Granite City, IL (L27) 558 18 343 2 922
Illinois River (L8) 105 0 16 0 121
Ohio River (L52) 18 4 76 0 97
Arkansas River (L1) 0 0 40 0 40
Weekly total - 2016 576 22 459 2 1,059
Weekly total - 2015 347 3 425 12 786
2016 YTD1
22,624 1,917 15,084 317 39,942
2015 YTD 18,183 1,609 12,380 339 32,511
2016 as % of 2015 YTD 124 119 122 93 123
Last 4 weeks as % of 20152
152 127 128 20 136
Total 2015 19,215 1,686 14,191 359 35,451
2 As a percent of same period in 2015.
Source: U.S. Army Corps of Engineers
Note: Total may not add exactly, due to rounding
1 Weekly total, YTD (year-to-date) and calendar year total includes Miss/27, Ohio/52, and Ark/1; "Other" refers to oats, barley,
sorghum, and rye.
December 8, 2016
Grain Transportation Report 13
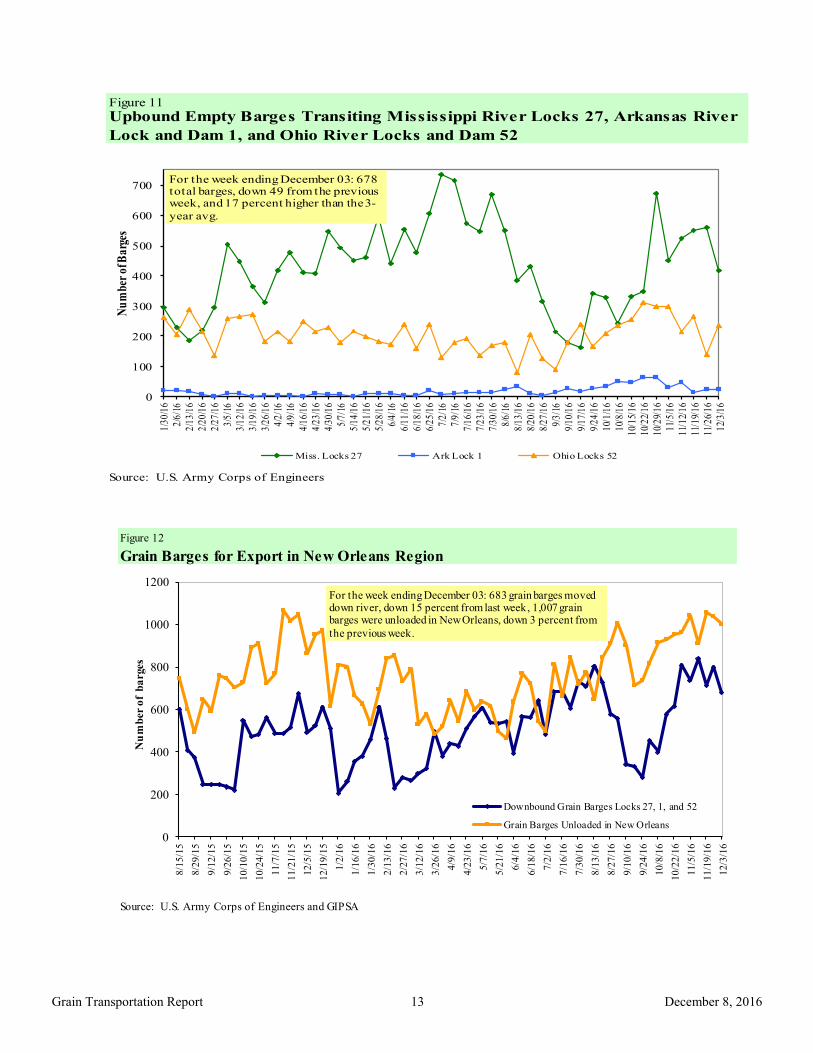
Figure 11
Source: U.S. Army Corps of Engineers
Upbound Empty Barges Transiting Mississippi River Locks 27, Arkansas River
Lock and Dam 1, and Ohio River Locks and Dam 52
0
100
200
300
400
500
600
700
1/3
0/1
6
2/6
/16
2/1
3/1
6
2/2
0/1
6
2/2
7/1
6
3/5
/16
3/1
2/1
6
3/1
9/1
6
3/2
6/1
6
4/2
/16
4/9
/16
4/1
6/1
6
4/2
3/1
6
4/3
0/1
6
5/7
/16
5/1
4/1
6
5/2
1/1
6
5/2
8/1
6
6/4
/16
6/1
1/1
6
6/1
8/1
6
6/2
5/1
6
7/2
/16
7/9
/16
7/1
6/1
6
7/2
3/1
6
7/3
0/1
6
8/6
/16
8/1
3/1
6
8/2
0/1
6
8/2
7/1
6
9/3
/16
9/1
0/1
6
9/1
7/1
6
9/2
4/1
6
10/
1/1
6
10/
8/1
6
10/
15/
16
10/
22/
16
10/
29/
16
11/
5/1
6
11/
12/
16
11/
19/
16
11/
26/
16
12/
3/1
6
Nu
mb
er o
f Ba
rges
Miss. Locks 27 Ark Lock 1 Ohio Locks 52
For the week ending December 03: 678 total barges, down 49 from the previous week, and 17 percent higher than the 3-
year avg.
Figure 12
Grain Barges for Export in New Orleans Region
Source: U.S. Army Corps of Engineers and GIPSA
0
200
400
600
800
1000
1200
8/1
5/1
5
8/2
9/1
5
9/1
2/1
5
9/2
6/1
5
10
/10
/15
10
/24
/15
11/7
/15
11
/21
/15
12/5
/15
12
/19
/15
1/2
/16
1/1
6/1
6
1/3
0/1
6
2/1
3/1
6
2/2
7/1
6
3/1
2/1
6
3/2
6/1
6
4/9
/16
4/2
3/1
6
5/7
/16
5/2
1/1
6
6/4
/16
6/1
8/1
6
7/2
/16
7/1
6/1
6
7/3
0/1
6
8/1
3/1
6
8/2
7/1
6
9/1
0/1
6
9/2
4/1
6
10/8
/16
10
/22
/16
11/5
/16
11
/19
/16
12/3
/16
Downbound Grain Barges Locks 27, 1, and 52
Grain Barges Unloaded in New Orleans
Nu
mb
er o
f b
arges
For the week ending December 03: 683 grain barges moved down river, down 15 percent from last week, 1,007 grain barges were unloaded in New Orleans, down 3 percent from
the previous week.
December 8, 2016
Grain Transportation Report 14
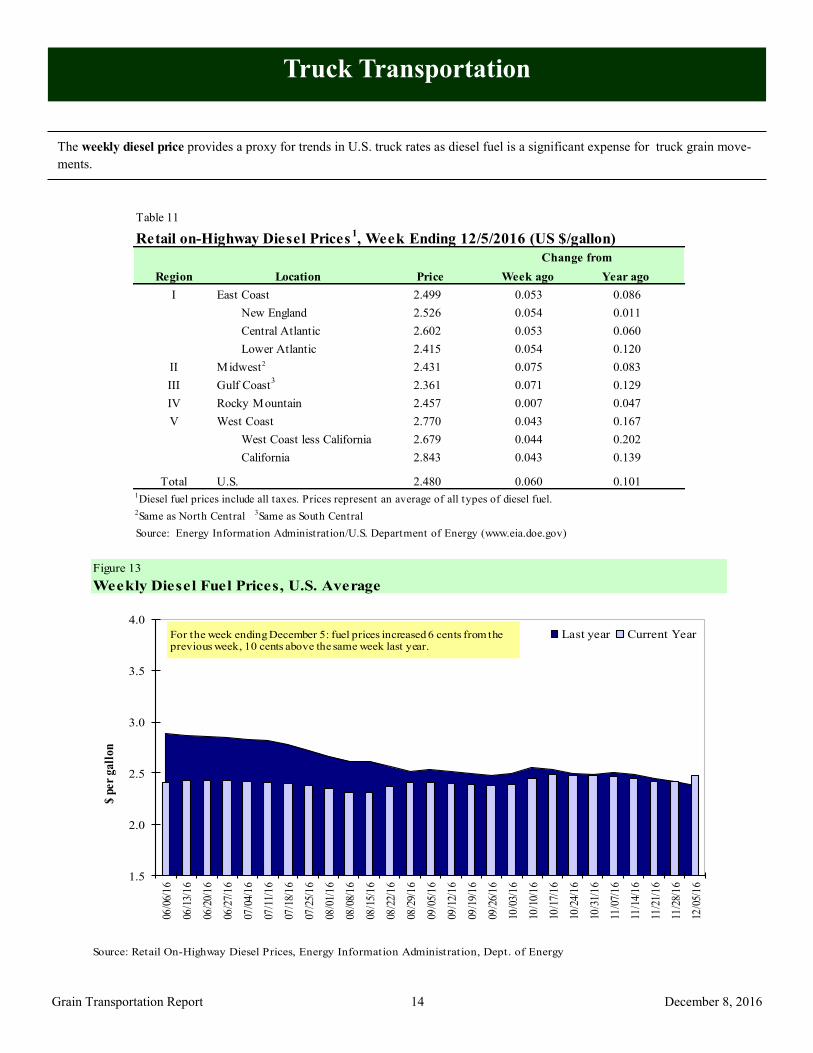
The weekly diesel price provides a proxy for trends in U.S. truck rates as diesel fuel is a significant expense for truck grain move-
ments.
Truck Transportation
Figure 13
Weekly Diesel Fuel Prices, U.S. Average
Source: Retail On-Highway Diesel Prices, Energy Information Administration, Dept. of Energy
1.5
2.0
2.5
3.0
3.5
4.0
06/0
6/1
6
06/1
3/1
6
06/2
0/1
6
06/2
7/1
6
07/0
4/1
6
07/1
1/1
6
07/1
8/1
6
07/2
5/1
6
08/0
1/1
6
08/0
8/1
6
08/1
5/1
6
08/2
2/1
6
08/2
9/1
6
09/0
5/1
6
09/1
2/1
6
09/1
9/1
6
09/2
6/1
6
10/0
3/1
6
10/1
0/1
6
10/1
7/1
6
10/2
4/1
6
10/3
1/1
6
11/0
7/1
6
11/1
4/1
6
11/2
1/1
6
11/2
8/1
6
12/0
5/1
6
Last year Current Year
$ p
er
gall
on
For the week ending December 5: fuel prices increased 6 cents from theprevious week, 10 cents above the same week last year.
Table 11
Change from
Region Location Price Week ago Year ago
I East Coast 2.499 0.053 0.086
New England 2.526 0.054 0.011
Central Atlantic 2.602 0.053 0.060
Lower Atlantic 2.415 0.054 0.120
II Midwest2 2.431 0.075 0.083
III Gulf Coast3
2.361 0.071 0.129
IV Rocky Mountain 2.457 0.007 0.047
V West Coast 2.770 0.043 0.167
West Coast less California 2.679 0.044 0.202
California 2.843 0.043 0.139
Total U.S. 2.480 0.060 0.1011Diesel fuel prices include all taxes. Prices represent an average of all types of diesel fuel.
2Same as North Central 3Same as South Central
Source: Energy Information Administration/U.S. Department of Energy (www.eia.doe.gov)
Retail on-Highway Diesel Prices1, Week Ending 12/5/2016 (US $/gallon)
December 8, 2016
Grain Transportation Report 15
Grain Exports
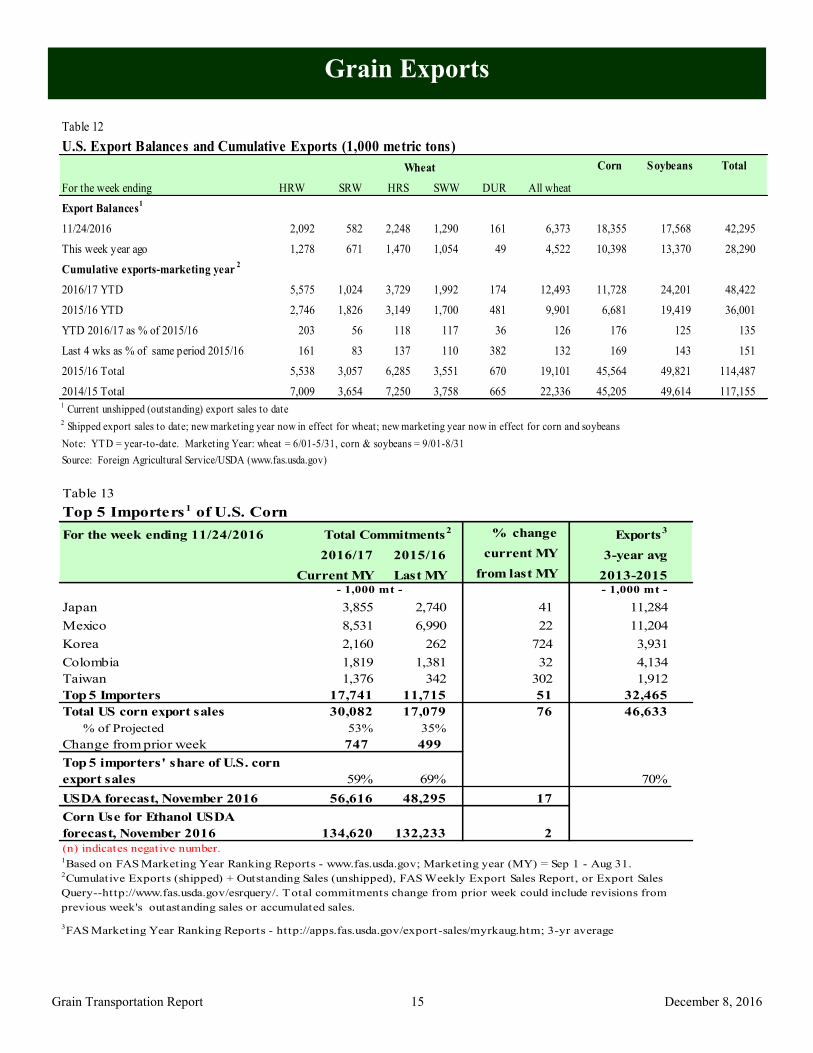
Table 12
U.S. Export Balances and Cumulative Exports (1,000 metric tons)
Wheat Corn Soybeans Total
For the week ending HRW SRW HRS SWW DUR All wheat
Export Balances1
11/24/2016 2,092 582 2,248 1,290 161 6,373 18,355 17,568 42,295
This week year ago 1,278 671 1,470 1,054 49 4,522 10,398 13,370 28,290
Cumulative exports-marketing year 2
2016/17 YTD 5,575 1,024 3,729 1,992 174 12,493 11,728 24,201 48,422
2015/16 YTD 2,746 1,826 3,149 1,700 481 9,901 6,681 19,419 36,001
YTD 2016/17 as % of 2015/16 203 56 118 117 36 126 176 125 135
Last 4 wks as % of same period 2015/16 161 83 137 110 382 132 169 143 151
2015/16 Total 5,538 3,057 6,285 3,551 670 19,101 45,564 49,821 114,487
2014/15 Total 7,009 3,654 7,250 3,758 665 22,336 45,205 49,614 117,1551 Current unshipped (outstanding) export sales to date
2 Shipped export sales to date; new marketing year now in effect for wheat; new marketing year now in effect for corn and soybeans
Note: YTD = year-to-date. Marketing Year: wheat = 6/01-5/31, corn & soybeans = 9/01-8/31
Source: Foreign Agricultural Service/USDA (www.fas.usda.gov)
Table 13
Top 5 Importers 1 of U.S. Corn
For the week ending 11/24/2016 % change Exports3
2016/17 2015/16 current MY 3-year avg
Current MY Last MY from last MY 2013-2015 - 1,000 mt -
Japan 3,855 2,740 41 11,284
Mexico 8,531 6,990 22 11,204
Korea 2,160 262 724 3,931
Colombia 1,819 1,381 32 4,134
Taiwan 1,376 342 302 1,912
Top 5 Importers 17,741 11,715 51 32,465
Total US corn export sales 30,082 17,079 76 46,633
% of Projected 53% 35%
Change from prior week 747 499
Top 5 importers' share of U.S. corn
export sales 59% 69% 70%
USDA forecast, November 2016 56,616 48,295 17
Corn Use for Ethanol USDA
forecast, November 2016 134,620 132,233 2
1Based on FAS Marketing Year Ranking Reports - www.fas.usda.gov; Marketing year (MY) = Sep 1 - Aug 31.
Total Commitments2
- 1,000 mt -
3FAS Marketing Year Ranking Reports - http://apps.fas.usda.gov/export-sales/myrkaug.htm; 3-yr average
2Cumulative Exports (shipped) + Outstanding Sales (unshipped), FAS Weekly Export Sales Report, or Export Sales
Query--http://www.fas.usda.gov/esrquery/. Total commitments change from prior week could include revisions from
previous week's outastanding sales or accumulated sales.
(n) indicates negative number.
December 8, 2016
Grain Transportation Report 16
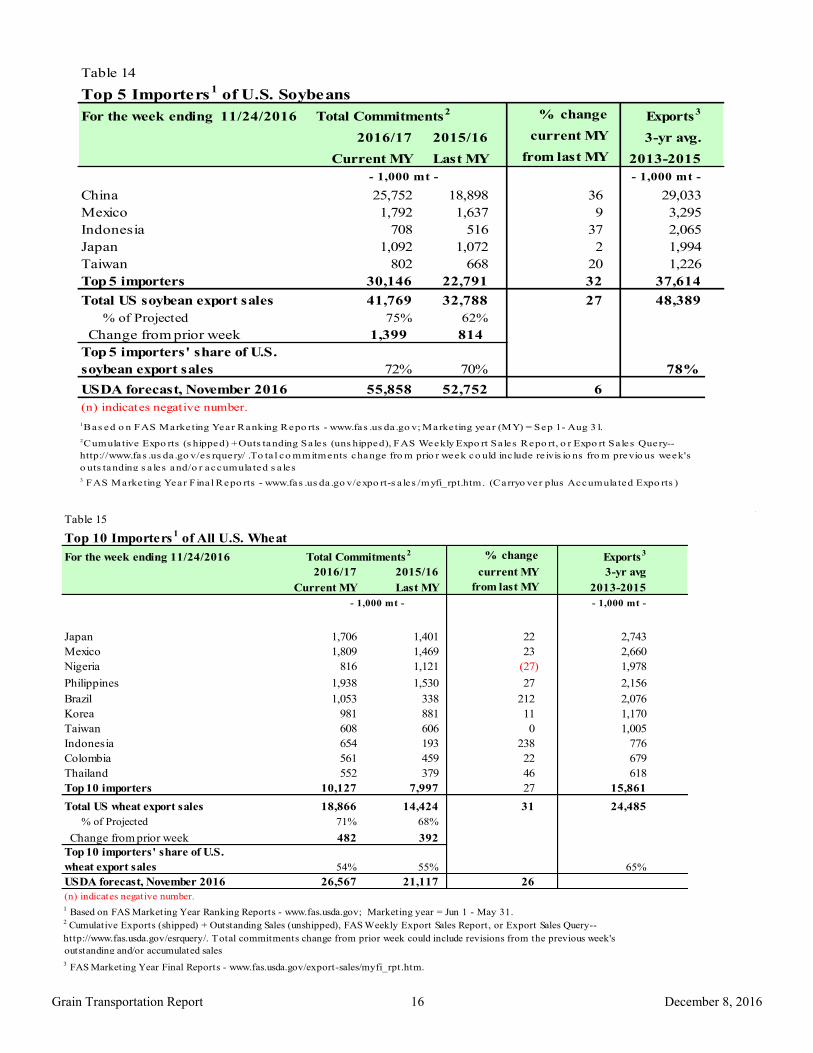
Table 15
Top 10 Importers1 of All U.S. Wheat
For the week ending 11/24/2016 % change Exports3
2016/17 2015/16 current MY 3-yr avg
Current MY Last MY from last MY 2013-2015
- 1,000 mt -
Japan 1,706 1,401 22 2,743
Mexico 1,809 1,469 23 2,660
Nigeria 816 1,121 (27) 1,978
Philippines 1,938 1,530 27 2,156
Brazil 1,053 338 212 2,076
Korea 981 881 11 1,170
Taiwan 608 606 0 1,005
Indonesia 654 193 238 776
Colombia 561 459 22 679
Thailand 552 379 46 618
Top 10 importers 10,127 7,997 27 15,861
Total US wheat export sales 18,866 14,424 31 24,485
% of Projected 71% 68%
Change from prior week 482 392
Top 10 importers' share of U.S.
wheat export sales 54% 55% 65%
USDA forecast, November 2016 26,567 21,117 26
1 Based on FAS Marketing Year Ranking Reports - www.fas.usda.gov; Marketing year = Jun 1 - May 31.
outstanding and/or accumulated sales
Total Commitments2
3 FAS Marketing Year Final Reports - www.fas.usda.gov/export-sales/myfi_rpt.htm.
(n) indicates negative number.
2 Cumulative Exports (shipped) + Outstanding Sales (unshipped), FAS Weekly Export Sales Report, or Export Sales Query--
http://www.fas.usda.gov/esrquery/. Total commitments change from prior week could include revisions from the previous week's
- 1,000 mt -
Table 14
Top 5 Importers1 of U.S. Soybeans
For the week ending 11/24/2016 % change
Exports3
2016/17 2015/16 current MY 3-yr avg.
Current MY Last MY from last MY 2013-2015
- 1,000 mt -
China 25,752 18,898 36 29,033
Mexico 1,792 1,637 9 3,295
Indonesia 708 516 37 2,065
Japan 1,092 1,072 2 1,994
Taiwan 802 668 20 1,226
Top 5 importers 30,146 22,791 32 37,614
Total US soybean export sales 41,769 32,788 27 48,389
% of Projected 75% 62%
Change from prior week 1,399 814
Top 5 importers' share of U.S.
soybean export sales 72% 70% 78%
USDA forecast, November 2016 55,858 52,752 6
1Bas ed o n FAS Marketing Year Ranking Repo rts - www.fas .us da .go v; Marketing year (MY) = Sep 1 - Aug 31.
Total Commitments2
- 1,000 mt -
3 FAS Marketing Year Fina l Repo rts - www.fas .us da .go v/expo rt-s a les /myfi_rpt.htm. (Carryo ver plus Accumula ted Expo rts )
(n) indicates negative number.
2Cumula tive Expo rts (s hipped) + Outs tanding Sales (uns hipped), FAS Weekly Expo rt Sa les Repo rt, o r Expo rt Sa les Query--
http://www.fas .us da .go v/es rquery/ .To ta l co mmitments change fro m prio r week co uld inc lude re ivis io ns fro m previo us week's
o uts tanding s a les and/o r accumula ted s a les
December 8, 2016
Grain Transportation Report 17
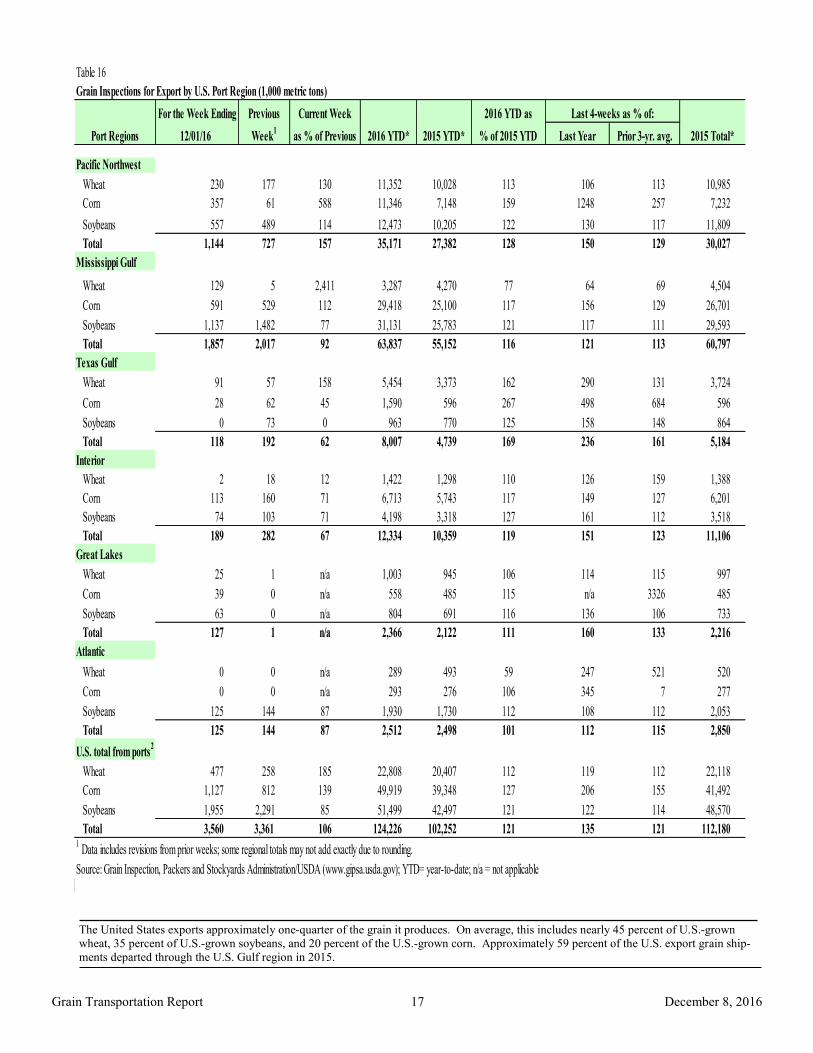
The United States exports approximately one-quarter of the grain it produces. On average, this includes nearly 45 percent of U.S.-grown
wheat, 35 percent of U.S.-grown soybeans, and 20 percent of the U.S.-grown corn. Approximately 59 percent of the U.S. export grain ship-
ments departed through the U.S. Gulf region in 2015.
Table 16
Grain Inspections for Export by U.S. Port Region (1,000 metric tons)
For the Week Ending Previous Current Week 2016 YTD as
12/01/16 Week1
as % of Previous 2015 YTD* % of 2015 YTD Last Year Prior 3-yr. avg.
Pacific Northwest
Wheat 230 177 130 11,352 10,028 113 106 113 10,985
Corn 357 61 588 11,346 7,148 159 1248 257 7,232
Soybeans 557 489 114 12,473 10,205 122 130 117 11,809
Total 1,144 727 157 35,171 27,382 128 150 129 30,027
Mississippi Gulf
Wheat 129 5 2,411 3,287 4,270 77 64 69 4,504
Corn 591 529 112 29,418 25,100 117 156 129 26,701
Soybeans 1,137 1,482 77 31,131 25,783 121 117 111 29,593
Total 1,857 2,017 92 63,837 55,152 116 121 113 60,797
Texas Gulf
Wheat 91 57 158 5,454 3,373 162 290 131 3,724
Corn 28 62 45 1,590 596 267 498 684 596
Soybeans 0 73 0 963 770 125 158 148 864
Total 118 192 62 8,007 4,739 169 236 161 5,184
Interior
Wheat 2 18 12 1,422 1,298 110 126 159 1,388
Corn 113 160 71 6,713 5,743 117 149 127 6,201
Soybeans 74 103 71 4,198 3,318 127 161 112 3,518
Total 189 282 67 12,334 10,359 119 151 123 11,106
Great Lakes
Wheat 25 1 n/a 1,003 945 106 114 115 997
Corn 39 0 n/a 558 485 115 n/a 3326 485
Soybeans 63 0 n/a 804 691 116 136 106 733
Total 127 1 n/a 2,366 2,122 111 160 133 2,216
Atlantic
Wheat 0 0 n/a 289 493 59 247 521 520
Corn 0 0 n/a 293 276 106 345 7 277
Soybeans 125 144 87 1,930 1,730 112 108 112 2,053
Total 125 144 87 2,512 2,498 101 112 115 2,850
U.S. total from ports2
Wheat 477 258 185 22,808 20,407 112 119 112 22,118
Corn 1,127 812 139 49,919 39,348 127 206 155 41,492
Soybeans 1,955 2,291 85 51,499 42,497 121 122 114 48,570
Total 3,560 3,361 106 124,226 102,252 121 135 121 112,1801 Data includes revisions from prior weeks; some regional totals may not add exactly due to rounding.
Source: Grain Inspection, Packers and Stockyards Administration/USDA (www.gipsa.usda.gov); YTD= year-to-date; n/a = not applicable
Last 4-weeks as % of:
Port Regions 2015 Total*2016 YTD*
December 8, 2016
Grain Transportation Report 18
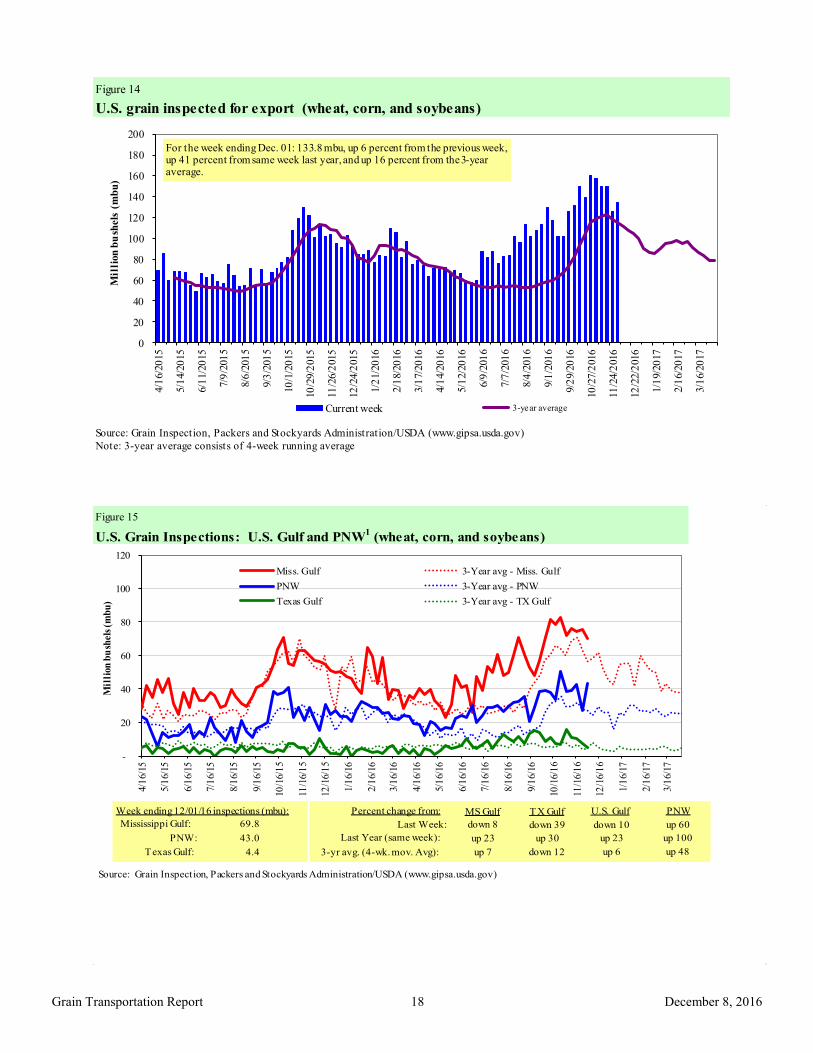
Figure 14
U.S. grain inspected for export (wheat, corn, and soybeans)
Source: Grain Inspection, Packers and Stockyards Administration/USDA (www.gipsa.usda.gov)
Note: 3-year average consists of 4-week running average
0
20
40
60
80
100
120
140
160
180
200
4/1
6/20
15
5/1
4/20
15
6/1
1/20
15
7/9
/201
5
8/6
/201
5
9/3
/201
5
10/1
/20
15
10
/29/2
015
11
/26/2
015
12
/24/2
015
1/2
1/20
16
2/1
8/20
16
3/1
7/20
16
4/1
4/20
16
5/1
2/20
16
6/9
/201
6
7/7
/201
6
8/4
/201
6
9/1
/201
6
9/2
9/20
16
10
/27/2
016
11
/24/2
016
12
/22/2
016
1/1
9/20
17
2/1
6/20
17
3/1
6/20
17
Mil
lion
bu
shels
(m
bu
)
Current week 3-year average
For the week ending Dec. 01: 133.8 mbu, up 6 percent from the previous week, up 41 percent from same week last year, and up 16 percent from the 3-year average.
Figure 15
U.S. Grain Inspections: U.S. Gulf and PNW1 (wheat, corn, and soybeans)
-
20
40
60
80
100
120
4/1
6/15
5/1
6/15
6/1
6/15
7/1
6/15
8/1
6/15
9/1
6/15
10/1
6/1
5
11/1
6/1
5
12/1
6/1
5
1/1
6/16
2/1
6/16
3/1
6/16
4/1
6/16
5/1
6/16
6/1
6/16
7/1
6/16
8/1
6/16
9/1
6/16
10/1
6/1
6
11/1
6/1
6
12/1
6/1
6
1/1
6/17
2/1
6/17
3/1
6/17
Mil
lion
bu
shel
s (m
bu
)
Miss. Gulf 3-Year avg - Miss. Gulf
PNW 3-Year avg - PNW
Texas Gulf 3-Year avg - TX Gulf
Source: Grain Inspection, Packers and Stockyards Administration/USDA (www.gipsa.usda.gov)
Last Week:
Last Year (same week):
3-yr avg. (4-wk. mov. Avg):
MS Gulf TX Gulf U.S. Gulf PNW
down 8
up 23
up 7
down 39
up 30
down 12
down 10
up 23
up 6
up 60
up 100
up 48
Percent change from:Week ending 12/01/16 inspections (mbu):
Mississippi Gulf:
PNW:
Texas Gulf:
69.8
43.0
4.4

December 8, 2016
Grain Transportation Report 19
Ocean Transportation
Table 17
Weekly Port Region Grain Ocean Vessel Activity (number of vessels)
Pacific Vancouver
Gulf Northwest B.C.
Loaded Due next
Date In port 7-days 10-days In port In port
12/1/2016 47 50 75 27 n/a
11/24/2016 39 51 79 n/a n/a
2015 range (25..54) (28..54) (36..80) (3..26) n/a
2015 avg. 42 38 56 11 n/a
Source: Transportation & Marketing Programs/AMS/USDA
Figure 16
U.S. Gulf Vessel Loading Activity
0
10
20
30
40
50
60
70
80
90
100
7/1
4/2
016
7/2
1/2
01
6
7/2
8/2
01
6
8/0
4/2
016
8/1
1/2
016
8/1
8/2
016
8/2
5/2
01
6
9/0
1/2
016
9/0
8/2
016
9/1
5/2
016
9/2
2/2
016
9/2
9/2
01
6
10
/06
/20
16
10
/13
/20
16
10
/20
/20
16
10
/27
/20
16
11
/03
/20
16
11
/10
/20
16
11
/17
/20
16
11
/24
/20
16
12
/01
/20
16
Nu
mb
er
of
ve
ssel
s
Loaded Last 7 Days Due Next 10 days Loaded 4 Year Average
Source:Transportation & Marketing Programs/AMS/USDA1U.S. Gulf includes Mississippi, Texas, and East Gulf.
For the week ending December 1 Loaded Due Change from last year 19.0% 8.7%
Change from 4-year avg. 15.6% 23.5%
December 8, 2016
Grain Transportation Report 20
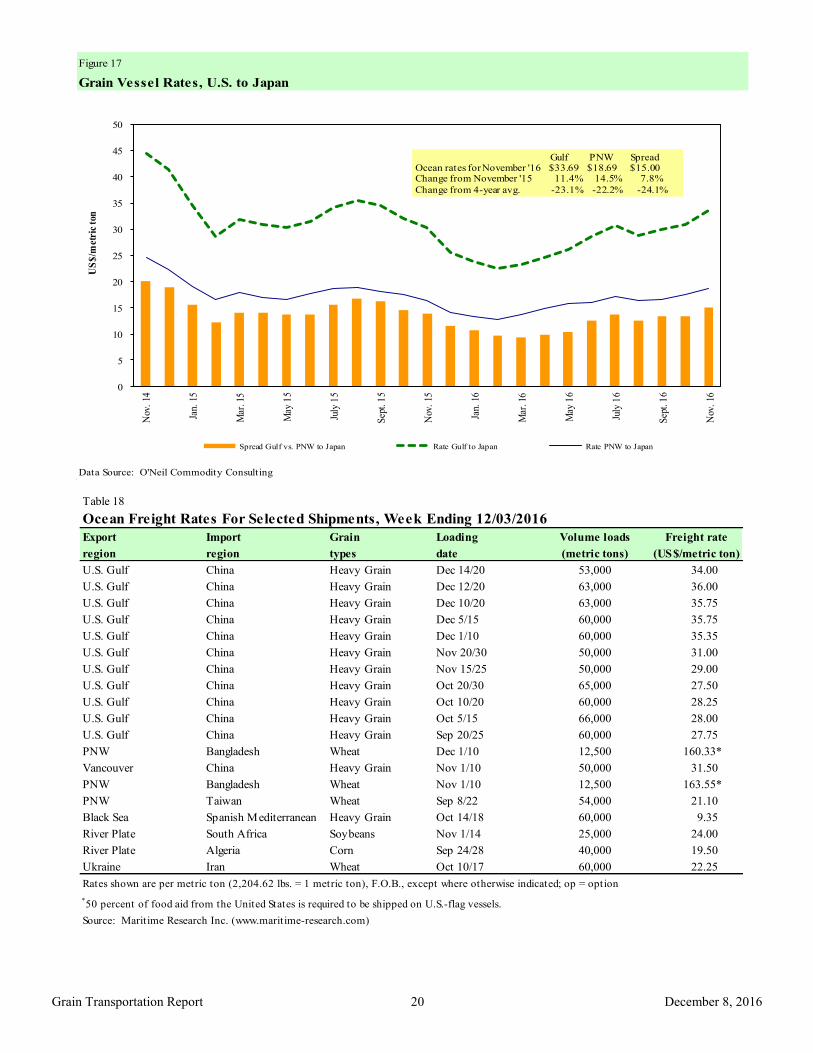
Figure 17
Grain Vessel Rates, U.S. to Japan
Data Source: O'Neil Commodity Consulting
0
5
10
15
20
25
30
35
40
45
50
Nov
. 14
Jan.
15
Mar
. 15
May
15
July
15
Sep
t. 1
5
Nov
. 15
Jan.
16
Mar
. 16
May
16
July
16
Sep
t. 1
6
Nov
. 16
US
$/m
etri
c to
n
Spread Gulf vs. PNW to Japan Rate Gulf to Japan Rate PNW to Japan
Gulf PNW Spread Ocean rates for November '16 $33.69 $18.69 $15.00 Change from November '15 11.4% 14.5% 7.8%
Change from 4-year avg. -23.1% -22.2% -24.1%
Table 18
Ocean Freight Rates For Selected Shipments, Week Ending 12/03/2016
Export Import Grain Loading Volume loads Freight rate
region region types date (metric tons) (US$/metric ton)
U.S. Gulf China Heavy Grain Dec 14/20 53,000 34.00
U.S. Gulf China Heavy Grain Dec 12/20 63,000 36.00
U.S. Gulf China Heavy Grain Dec 10/20 63,000 35.75
U.S. Gulf China Heavy Grain Dec 5/15 60,000 35.75
U.S. Gulf China Heavy Grain Dec 1/10 60,000 35.35
U.S. Gulf China Heavy Grain Nov 20/30 50,000 31.00
U.S. Gulf China Heavy Grain Nov 15/25 50,000 29.00
U.S. Gulf China Heavy Grain Oct 20/30 65,000 27.50
U.S. Gulf China Heavy Grain Oct 10/20 60,000 28.25
U.S. Gulf China Heavy Grain Oct 5/15 66,000 28.00
U.S. Gulf China Heavy Grain Sep 20/25 60,000 27.75
PNW Bangladesh Wheat Dec 1/10 12,500 160.33*
Vancouver China Heavy Grain Nov 1/10 50,000 31.50
PNW Bangladesh Wheat Nov 1/10 12,500 163.55*
PNW Taiwan Wheat Sep 8/22 54,000 21.10
Black Sea Spanish Mediterranean Heavy Grain Oct 14/18 60,000 9.35
River Plate South Africa Soybeans Nov 1/14 25,000 24.00
River Plate Algeria Corn Sep 24/28 40,000 19.50
Ukraine Iran Wheat Oct 10/17 60,000 22.25
Rates shown are per metric ton (2,204.62 lbs. = 1 metric ton), F.O.B., except where otherwise indicated; op = option
*50 percent of food aid from the United States is required to be shipped on U.S.-flag vessels.
Source: Maritime Research Inc. (www.maritime-research.com)
December 8, 2016
Grain Transportation Report 21
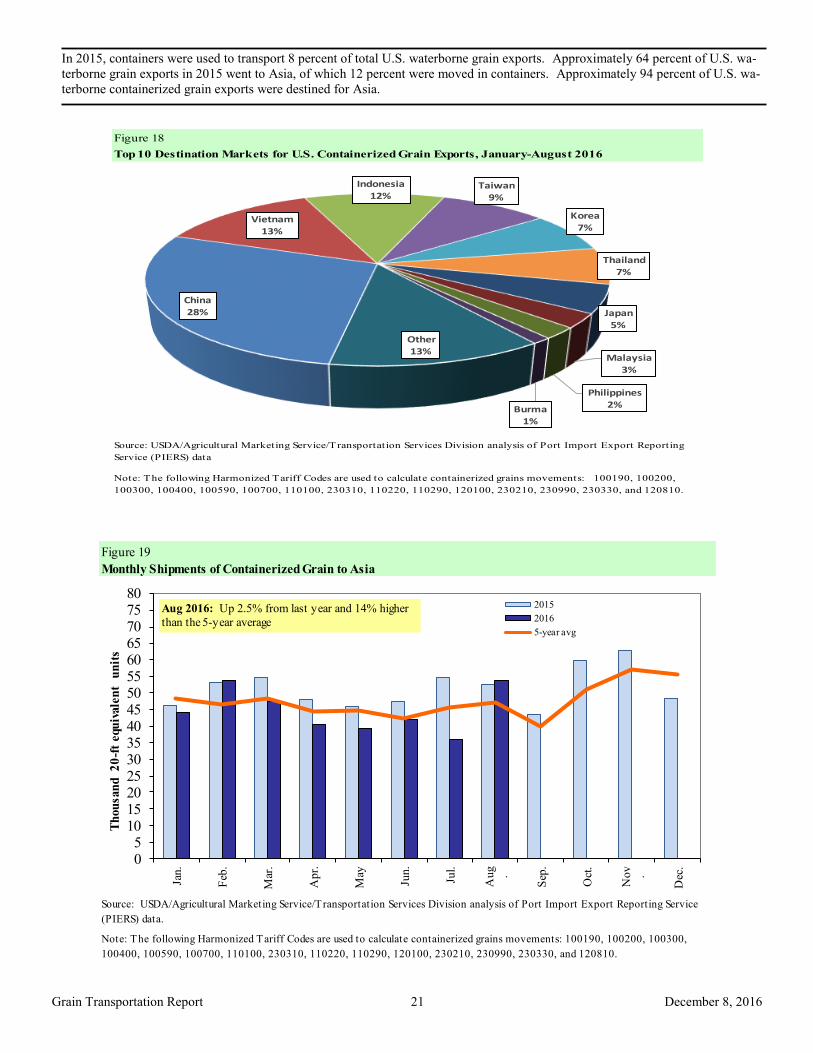
In 2015, containers were used to transport 8 percent of total U.S. waterborne grain exports. Approximately 64 percent of U.S. wa-
terborne grain exports in 2015 went to Asia, of which 12 percent were moved in containers. Approximately 94 percent of U.S. wa-
terborne containerized grain exports were destined for Asia.
Figure 18
Top 10 Destination Markets for U.S. Containerized Grain Exports, January-August 2016
Source: USDA/Agricultural Marketing Service/Transportation Services Division analysis of Port Import Export Reporting
Service (PIERS) data
Note: The following Harmonized Tariff Codes are used to calculate containerized grains movements: 100190, 100200,
100300, 100400, 100590, 100700, 110100, 230310, 110220, 110290, 120100, 230210, 230990, 230330, and 120810.
China28%
Vietnam13%
Indonesia12%
Taiwan9%
Korea7%
Thailand7%
Japan5%
Malaysia3%
Philippines2%Burma
1%
Other13%
Figure 19
Monthly Shipments of Containerized Grain to Asia
Source: USDA/Agricultural Marketing Service/Transportation Services Division analysis of Port Import Export Reporting Service
(PIERS) data.
Note: The following Harmonized Tariff Codes are used to calculate containerized grains movements: 100190, 100200, 100300,
100400, 100590, 100700, 110100, 230310, 110220, 110290, 120100, 230210, 230990, 230330, and 120810.
05
101520253035404550556065707580
Jan
.
Feb
.
Mar
.
Ap
r.
May
Jun
.
Jul.
Aug
.
Sep
.
Oct
.
Nov
.
Dec
.
Th
ou
san
d
20
-ft
equ
ivale
nt
un
its
2015
2016
5-year avg
Aug 2016: Up 2.5% from last year and 14% higher
than the 5-year average
December 8, 2016
Grain Transportation Report 22
Coordinators
Surajudeen (Deen) Olowolayemo [email protected] (202) 720 - 0119
Pierre Bahizi [email protected] (202) 690 - 0992
Weekly Highlight Editors
Surajudeen (Deen) Olowolayemo [email protected] (202) 720 - 0119
April Taylor [email protected] (202) 720 - 7880
Nicholas Marathon [email protected] (202) 690 - 4430
Grain Transportation Indicators
Surajudeen (Deen) Olowolayemo [email protected] (202) 720 - 0119
Rail Transportation
Johnny Hill [email protected] (202) 690 - 3295
Jesse Gastelle [email protected] (202) 690 - 1144
Peter Caffarelli [email protected] (202) 690 - 3244
Barge Transportation
Nicholas Marathon [email protected] (202) 690 - 4430
April Taylor [email protected] (202) 720 - 7880
Matt Chang [email protected] (202) 720 - 0299
Truck Transportation
April Taylor [email protected] (202) 720 - 7880
Grain Exports
Johnny Hill [email protected] (202) 690 - 3295
Ocean Transportation
Surajudeen (Deen) Olowolayemo [email protected] (202) 720 - 0119
(Freight rates and vessels)
April Taylor [email protected] (202) 720 - 7880
(Container movements)
Contributing Analysts
Sergio Sotelo [email protected] (202) 756 - 2577
Subscription Information: Send relevant information to [email protected] for an electronic copy
(printed copies are also available upon request).
Preferred citation: U.S. Dept. of Agriculture, Agricultural Marketing Service. Grain Transportation Report.
December 8, 2016. Web: http://dx.doi.org/10.9752/TS056.12-08-2016
Contacts and Links
In accordance with Federal civil rights law and U.S. Department of Agriculture (USDA) civil rights regulations and policies, the USDA, its
Agencies, offices, and employees, and institutions participating in or administering USDA programs are prohibited from discriminating based on
race, color, national origin, religion, sex, gender identity (including gender expression), sexual orientation, disability, age, marital status, family/
parental status, income derived from a public assistance program, political beliefs, or reprisal or retaliation for prior civil rights activity, in any
program or activity conducted or funded by USDA (not all bases apply to all programs). Remedies and complaint filing deadlines vary by pro-
gram or incident.
Persons with disabilities who require alternative means of communication for program information (e.g., Braille, large print, audiotape, American
Sign Language, etc.) should contact the responsible Agency or USDA's TARGET Center at (202) 720-2600 (voice and TTY) or contact USDA
through the Federal Relay Service at (800) 877-8339. Additionally, program information may be made available in languages other than English.
To file a program discrimination complaint, complete the USDA Program Discrimination Complaint Form, AD-3027, found online at How to
File a Program Discrimination Complaint and at any USDA office or write a letter addressed to USDA and provide in the letter all of the infor-
mation requested in the form. To request a copy of the complaint form, call (866) 632-9992. Submit your completed form or letter to USDA by:
(1) mail: U.S. Department of Agriculture, Office of the Assistant Secretary for Civil Rights, 1400 Independence Avenue, SW, Washington, D.C.
20250-9410; (2) fax: (202) 690-7442; or (3) email: [email protected].
USDA is an equal opportunity provider, employer, and lender.
Related Documents