Grain composition of Virginia winter barley and implications for use in feed, food, and biofuels production Carl Griffey a, * , Wynse Brooks a , Michael Kurantz b , Wade Thomason a , Frank Taylor b , Don Obert c , Robert Moreau b , Rolando Flores d , Miryeong Sohn e , Kevin Hicks b a Virginia Polytechnic Institute and State University, 330 Smyth Hall, Blacksburg, VA 24061, USA b Eastern Regional Research Center, ARS, USDA, Wyndmoor, PA 19038, USA c National Small Grains Research Facility, ARS, USDA, Aberdeen, ID 83210, USA d Department of Food Science and Technology, University of Nebraska, Lincoln, NE 68583, USA e Richard B. Russell Agricultural Research Center, USDA-ARS, P.O. Box 5677, Athens, GA 30605, USA article info Article history: Received 28 May 2009 Received in revised form 25 September 2009 Accepted 28 September 2009 Keywords: Barley Hulless barley Protein Starch Beta-glucan Grain quality Ethanol abstract Grain compositional components impacting barley (Hordeum vulgare L.) use in food, feed and fuel products, must be combined with improved agronomic traits to produce a commercially viable barley cultivar. Little current information is available on grain composition and variability among winter barley genotypes. This study was conducted to determine the variability among modern hulled and hulless winter barley genotypes in grain composition. Barley types varied significantly in grain and kernel weight, starch, beta-glucan, oil and ash content, but not in protein concentration. Hulless barley had significantly higher grain test weight and starch concentration than hulled and malting types, and significantly higher beta-glucan than malting barley. Hulless barley had significantly lower kernel weights, oil, and ash concentrations than hulled and malting types. Higher starch and lower fiber and ash in grain of hulless barley versus hulled feed or malting type barley are characteristics that increase hulless barley desirability. Selection for high starch concentration among all barley types is feasible and will facilitate development of barley cultivars better suited for use in feed, malt, and ethanol production. Ó 2009 Elsevier Ltd. All rights reserved. 1. Introduction Barley (Hordeum vulgare L.) ranks fourth among the most important grain crops grown in the United States following wheat (Triticum aestivum), corn (Zea mays) and sorghum (Sorghum bicolor (L.) Moench) (Magness et al., 1971). Approximately 66% of the barley grain produced in the U.S. is used in food and beverage (primarily as malt) and industrial products, while 22% is used in feed and byproducts, and 12% is exported (U.S. Grains Council, www.grains. org). Considerable potential exists for increased use of barley grain in the manufacturing of feed, food, and biofuel products. Historically, winter barley has been produced and used primarily for animal feed in the U.S. with little emphasis placed on improve- ments in specific nutritive components. Therefore, little is known about the genetic diversity among modern day winter barley cultivars and elite breeding lines for grain composition, nutrition, and energy components. Genetic and varietal differences have been reported for level and availability of these components in grains (Gill et al., 2002; Vasanthan et al., 2002), but in a limited number of lines and primarily in spring barley. Compared to spring barley types, winter barley has been reported to have lower protein and crude fiber (Batal and Dale, 2009) and higher total fatty acid (Robert, 1975) content. Barley genotypes can be classified as hulless or hulled. Hulless or naked barley differs from traditional hulled barley in that the loose husk covering the caryopses is easily removed during combine threshing and cleaning of the grain. The feed and energy value of hulled barley is low due to its high fiber concentration, while that of hulless barley is closer to those of wheat and corn (Bhatty, 1993; Wang et al., 1997). On average, corn has 72% starch content, whereas, traditional hulled barley has between 50 and 55% starch content (Sohn et al., 2007). Hulless barley grain has been reported to contain 61% starch, 19% fiber, and 6% beta-glucans (Huth et al., 2002). Hulless barley has higher nutritional value than hulled barley (Wang et al., 1997) and 8–14% higher digestible energy than hulled barley (Bhatty Abbreviations: DDGS, distiller’s dry grains with solubles; TW, test weight; TKW, thousand kernel weight. * Corresponding author. Tel: þ1 540 231 9789; fax: þ1 540 231 3431. E-mail address: [email protected] (C. Griffey). Contents lists available at ScienceDirect Journal of Cereal Science journal homepage: www.elsevier.com/locate/jcs 0733-5210/$ – see front matter Ó 2009 Elsevier Ltd. All rights reserved. doi:10.1016/j.jcs.2009.09.004 Journal of Cereal Science 51 (2010) 41–49

Welcome message from author
This document is posted to help you gain knowledge. Please leave a comment to let me know what you think about it! Share it to your friends and learn new things together.
Transcript

lable at ScienceDirect
Journal of Cereal Science 51 (2010) 41–49
Contents lists avai
Journal of Cereal Science
journal homepage: www.elsevier .com/locate/ jcs
Grain composition of Virginia winter barley and implications for usein feed, food, and biofuels production
Carl Griffey a,*, Wynse Brooks a, Michael Kurantz b, Wade Thomason a, Frank Taylor b, Don Obert c,Robert Moreau b, Rolando Flores d, Miryeong Sohn e, Kevin Hicks b
a Virginia Polytechnic Institute and State University, 330 Smyth Hall, Blacksburg, VA 24061, USAb Eastern Regional Research Center, ARS, USDA, Wyndmoor, PA 19038, USAc National Small Grains Research Facility, ARS, USDA, Aberdeen, ID 83210, USAd Department of Food Science and Technology, University of Nebraska, Lincoln, NE 68583, USAe Richard B. Russell Agricultural Research Center, USDA-ARS, P.O. Box 5677, Athens, GA 30605, USA
a r t i c l e i n f o
Article history:Received 28 May 2009Received in revised form25 September 2009Accepted 28 September 2009
Keywords:BarleyHulless barleyProteinStarchBeta-glucanGrain qualityEthanol
Abbreviations: DDGS, distiller’s dry grains with solthousand kernel weight.
* Corresponding author. Tel: þ1 540 231 9789; fax:E-mail address: [email protected] (C. Griffey).
0733-5210/$ – see front matter � 2009 Elsevier Ltd.doi:10.1016/j.jcs.2009.09.004
a b s t r a c t
Grain compositional components impacting barley (Hordeum vulgare L.) use in food, feed and fuelproducts, must be combined with improved agronomic traits to produce a commercially viable barleycultivar. Little current information is available on grain composition and variability among winter barleygenotypes. This study was conducted to determine the variability among modern hulled and hullesswinter barley genotypes in grain composition. Barley types varied significantly in grain and kernelweight, starch, beta-glucan, oil and ash content, but not in protein concentration. Hulless barley hadsignificantly higher grain test weight and starch concentration than hulled and malting types, andsignificantly higher beta-glucan than malting barley. Hulless barley had significantly lower kernelweights, oil, and ash concentrations than hulled and malting types. Higher starch and lower fiber and ashin grain of hulless barley versus hulled feed or malting type barley are characteristics that increasehulless barley desirability. Selection for high starch concentration among all barley types is feasible andwill facilitate development of barley cultivars better suited for use in feed, malt, and ethanol production.
� 2009 Elsevier Ltd. All rights reserved.
1. Introduction
Barley (Hordeum vulgare L.) ranks fourth among the mostimportant grain crops grown in the United States following wheat(Triticum aestivum), corn (Zea mays) and sorghum (Sorghum bicolor(L.) Moench) (Magness et al., 1971). Approximately 66% of the barleygrain produced in the U.S. is used in food and beverage (primarily asmalt) and industrial products, while 22% is used in feed andbyproducts, and 12% is exported (U.S. Grains Council, www.grains.org). Considerable potential exists for increased use of barley grainin the manufacturing of feed, food, and biofuel products.
Historically, winter barley has been produced and used primarilyfor animal feed in the U.S. with little emphasis placed on improve-ments in specific nutritive components. Therefore, little is knownabout the genetic diversity among modern day winter barley
ubles; TW, test weight; TKW,
þ1 540 231 3431.
All rights reserved.
cultivars and elite breeding lines for grain composition, nutrition, andenergy components. Genetic and varietal differences have beenreported for level and availability of these components in grains (Gillet al., 2002; Vasanthan et al., 2002), but in a limited number of linesand primarily in spring barley. Compared to spring barley types,winter barley has been reported to have lower protein and crudefiber (Batal and Dale, 2009) and higher total fatty acid (Robert, 1975)content.
Barley genotypes can be classified as hulless or hulled. Hulless ornaked barley differs from traditional hulled barley in that the loosehusk covering the caryopses is easily removed during combinethreshing and cleaning of the grain. The feed and energy value ofhulled barley is low due to its high fiber concentration, while that ofhulless barley is closer to those of wheat and corn (Bhatty, 1993;Wang et al.,1997). On average, corn has 72% starch content, whereas,traditional hulled barley has between 50 and 55% starch content(Sohn et al., 2007). Hulless barley grain has been reported to contain61% starch,19% fiber, and 6% beta-glucans (Huth et al., 2002). Hullessbarley has higher nutritional value than hulled barley (Wang et al.,1997) and 8–14% higher digestible energy than hulled barley (Bhatty

C. Griffey et al. / Journal of Cereal Science 51 (2010) 41–4942
et al., 1979), due to its elevated starch and reduced fiber concentra-tion (Ingledew, 1993). Therefore, development and production ofhulless barley cultivars offers unique opportunities for end users.
Cereal grains such as barley and oats (Avena sativa L.) containconsiderable levels of soluble and insoluble fibers that are beneficialin the prevention and management of various dietary relateddiseases, such as diabetes, cardiovascular disease and colorectalcancer (Jenkins et al., 2000). Phytochemicals in barley includeseveral types of antioxidants, which are often associated with cancerprevention (Wood et al., 2002). In addition, beta-glucans in the branof whole grains such as barley and oats are known to have choles-terol-lowering effects (McIntosh et al., 1991; Newman et al., 1991;Wang et al., 1997). Because of their minimal digestibility in humans,beta-glucans result in a lowering of the glycemic peak and mitiga-tion of post-prandial insulin response (Wood et al., 2002). The U.S.Food and Drug Administration (FDA) recently approved a healthclaim petition documenting that barley contains high levels ofsoluble fiber (beta-glucans) that when consumed by humans helpsprevent coronary heart disease. Beta-glucans also exhibit the abilityto stimulate anti-tumor and anti-microbial properties (Brown andGordon, 2001). Barley genotypes having waxy seed often have a highconcentration of beta-glucans (Fox, 1981). Waxy barley starchconsists of 97–100% amylopectin, while non-waxy or normal barleystarch contains 15– 25% amylose and 75–85% amylopectin (Fox,1981). While low beta-glucan concentration is desired in barley usedin monogastric animal feeds and for industrial purposes such asethanol production, high-beta-glucan concentration and waxystarch is desirable in production of health beneficial foods. Beta-glucan concentration among barley genotypes generally rangesfrom 3 to 7% (Aman and Newman, 1986; Kalra and Jood, 2000; Xueet al., 1997), with some waxy hulless types having 6–11% (Aman andNewman, 1986; Andersson et al., 1999; Oscarsson et al., 1996).Diversity in grain composition among barley genotypes potentiallyfacilitates its use in a vast array of products having numerousbeneficial and desirable characteristics. Knowledge of diversityamong barley genotypes in grain composition including nutritionaland energy components will facilitate breeding of barley for specificend uses such as malt, feed, food, or fuel.
Prior interest and emphasis on production of fuel ethanol fromgrain in the United States has focused primarily on corn as a feed-stock. Increased demand and price for grain resulting fromexpanded ethanol production has extended well beyond the cornsector, and has kindled interest in use of alternative grains such asbarley for ethanol production. Use of barley as a feedstock for fuelethanol production has several potential advantages over wheat orcorn. The relative price of feed barley is typically lower than both ofthese crops and it has the potential of producing a distiller’s drygrains soluble (DDGS) product with higher protein and lysinecontent for livestock feed than that from corn. To date, use oftraditional hulled barley as an alternative to corn in ethanolproduction has been limited by its lower starch concentration,higher fiber concentration, abrasive nature of the hull containingsilica, which causes excessive wear on equipment, and the presenceof beta-glucans, which result in viscosity problems in the mash(Hicks et al., 2005). Research currently being conducted at the USDA-ARS Eastern Regional Research Center in Wyndmoor, Pennsylvaniausing hulless barley and beta-glucanase enzymes offers a means tofacilitate and enhance ethanol production using barley. Also,researchers are developing processing and extraction technologiesto improve the efficiency of barley utilization in ethanol production.
Development, targeted production, and marketing of barleycultivars to meet a wide array of diverse end uses require theavailability and use of grain compositional information in selectionof parents and cultivars. Grain compositional componentsimpacting barley use in food, feed and fuel products, including fiber,
starch, protein, lipids and beta-glucan must be combined witha complex array of other agronomic traits required in a commer-cially viable barley cultivar. Little current information is available ongrain composition and variability among winter barley genotypes.Therefore, cultivars and breeding lines selected for this studyrepresent genetic diversity among hulled, hulless, and malting typewinter barley genotypes. The current study was conducted todetermine the variability among modern hulled and hulless winterbarley genotypes for grain compositional components that are ofcritical importance in feed, food, and/or ethanol production.
2. Experimental
2.1. Plant materials
Six hulled and 37 hulless winter feed barley cultivars andadvanced lines were selected from the Virginia Tech breedingprogram. The eight hulled winter malting barley genotypes evalu-ated in the study included five lines (92Ab1841, 94Ab1261, ‘Charles’,94Ab1347, and ‘Endeavor’) from the USDA-ARS Small Grains andPotato Germplasm Research Unit in Aberdeen, Idaho, two cultivars(‘Novosadski 183’ and ‘Novosadski 293’) from the Institute of Fieldand Vegetable Crops in Novi Sad, Serbia, and the French cultivar‘Plaisant’ from Groupement Agricole Essonnois, Maisse, Ville-de-Paris, France. Of these lines, six have potential malting quality asCharles was recently added to the American Malting Barley Asso-ciation (AMBA) recommended list (2009), Endeavor passed thethree year pilot-scale evaluation and was advanced to plant-scale,Plaisant, has been used for malting purposes in Europe, and theremainder have shown good malting potential in multiple years oftesting. These lines are referred to as malting types in the manu-script in order to differentiate between those developed specificallyfor malting versus those developed for feed purposes. We do notinfer that all are, or will be recognized as malting types. Chemicalanalyses of barley grain compositional components were con-ducted at the USDA-ARS Eastern Regional Research Center inWyndmoor, Pennsylvania. Barley genotypes were grown in repli-cated yield trials using a randomized complete block design inVirginia using recommended standard management protocols(Brann et al., 2000). Total nitrogen fertilizer applied was 98 kg ha�1
in 2003 and 2005 and 107 kg ha�1 in 2002 and 2004. Six hulled and18 hulless genotypes derived in 2000 and 2001 (set 1) were eval-uated in four crop years (2002–2005), eight malting barley lineswere evaluated in three crop years (2002–2004), and 19 newerhulless lines derived in 2003 (set 2) were evaluated in three cropyears (2003–2005).
2.2. Grain physical properties
Grain samples from all replications were combined to producea single sample for each line, each year, for physical and chemicalanalysis. A test weight (TW) Grading Scale model 8800SS and 151filling hopper (Seedburo Equipment Company, Chicago, Illinois)were used with either a one quart or 99 mL sampling cup to obtainthe test weights of each barley sample (Approved Method 55-10)(AACC International, 2000). Thousand kernel weights (TKWs) wereobtained using an FMC Technologies Syntron Magnetic partsfeeder, Model EB-00-D (Seedburo Equipment Company, Chicago,Illinois) with a sample size of 40 g used to obtain the TKW data(Approved Method 55-31) (AACC International, 2000).
2.3. Grain and flour chemical analysis
Moisture content of whole barley kernels was determined bydrying 10 g of barley at 130 �C for 20 h (Standard S352.2) (ASABE

C. Griffey et al. / Journal of Cereal Science 51 (2010) 41–49 43
International, 2000). Moisture values of barley flour were deter-mined by drying 2 g samples at 135 �C for 2 h (Approved Method44-19) (AACC International, 2000). Starch concentration wasassessed by grinding grain samples in a cyclone mill fitted witha 0.5 mm screen (Udy, Ft. Collins, CO) and analyzing the flour usinga starch determination kit (Megazyme International Ireland Ltd.,Bray Business Park, Bray, Co. Wicklow, Ireland) (Approved Method32-32) (Approved Method 46-30) (AACC International, 2000; AOACInternational, 2000). This method was modified by use of an YSI2700 Analyzer (YSI Incorporated, Yellow Springs, Ohio) fitted withan YSI 2710 turntable for automated glucose determination ofenzymatically hydrolyzed starch containing samples. Proteinconcentration of barley flour samples was determined in accor-dance with standard methods (Approved Method 990.03)(Approved Method 46-30) (AACC International, 2000; AOAC Inter-national, 2000), which outline the procedure for use of a combus-tion instrument and subsequent thermal conductivity detection ofnitrogen for the estimation of protein using a conversion factor of6.25. A Flash EA 1112 Elemental Analyzer (CE Elantech Inc., 170Oberlin Ave., Lakewood, NJ), calibrated with aspartic acid (%N¼ /�10.52) was used for the protein determinations. Samples sizes of50–100 mg of barley flour were run and the conversion factor usedto obtain protein values for barley was 6.25 (Approved Method14.067) (AOAC International, 2000). Barley beta-glucan concen-tration was analyzed using a kit (ICC Standard Method 168)(ICC International, 2008) (Megazyme International Ireland Ltd.,Bray Business Park, Bray, Co. Wickow, Ireland) and instructions forthe ‘‘streamlined method’’ provided by the manufacturer. Thismethod conforms to standard methods (Approved Method 32-23)(Approved Method 995.16) (AACC International, 2000; AOACInternational, 2000). Oil concentration of the grain was estimatedbased on standard procedure (Moreau et al., 2003). Barley sampleswere ground in a Wiley Mill fitted with a 20 mesh screen and 4 gsamples were extracted with hexane in an Accelerated SolventExtractor (Dionex Corporation, Sunnyvale, CA). The instrument wasoperated at 1000 psi and a temperature of 100 �C for three 10 min
Table 1Analysis of variance and means of grain characteristics for: (a) hulled and hulless lines te(set 2).
Source of variation df Test weight TKW %
F
(a)Year 3 244.86** 12.99** 2Type 1 1741.24** 220.32**Type (Line) 22 104.15** 165.26** 1
Barley type n Means
Test weight, kg m�3 TKW, g P
Hulled feed 6 629.86 36.61Hulless feed 18 756.37 31.45
Contrast dfHull vs. hulless 1 <0.01 <0.01 n
(b)
Year 2 341.30** 565.88** 3Type 1 1018.13** 358.31**Type (Line) 25 207.75** 254.44** 2
Barley type n Means
Test weight, kg m�3 TKW, g P
Hulless feed 19 741.70 30.34Malt 8 641.70 40.69
Contrast dfMalt vs. hulless 1 <0.01 <0.01 n
cycles after which the hexane extract obtained was dried undera stream of nitrogen and lipid concentration determined gravi-metrically. Ash concentration was determined in accordance withstandard methods (Approved Method 08-01) (AACC International,2000), by heating barley flour in a muffle furnace at 550 �C untila light gray ash was obtained (16–20 h).
2.4. Statistical analysis
Data were analyzed by type and over types (malting, hulledfeed, or hulless feed barley) using the GLM procedure in SAS(SAS Inst., 2004). Years were treated as replications in this analysis.Effects from ANOVA were used to test the impact of barley type.Means for grain composition characteristics were calculated bybarley type over years. The mean and standard deviation formeasured parameters for each line were also calculated over years.For lines that appeared in both 2003 and 2004, means, maximum,minimum and standard errors were calculated by barley type.Simple correlation analysis was performed between grain and flourphysical and chemical properties on hulled and hulless barley typescombined over years with SAS, PROC CORR. Means over years werecomputed and correlations performed on these to better assessgenotypic variation. Pearson correlation coefficients were consid-ered significant if the probability was significant at P� 0.05.
3. Results and discussion
3.1. Grain and kernel weight
Test weight and TKW varied significantly by year, barley type,and individual line (P< 0.01) (Table 1). The highest test weightmeans for hulless (782 kg m�3) and hulled (661 kg m�3) barleytypes in set one were obtained in 2005, and the lowest means723 kg m�3 (hulless) and 578 kg m�3 (hulled) were noted in 2003(Table 2). In 2005, the average daily temperatures during Marchthrough May were 5 �C below the 30-year means (Fig. 1). Lower
sted over four years (set 1) and (b) hulless and malting lines tested over three years
Protein %Starch %Beta-glucan %Oil %Ash
3.74** 224.37** 19.75** 4.22** 2.53**0.15 449.78** 0.54 0.18** 2.45**5.59* 198.90** 16.87** 0.45** 0.28
rotein% Starch% Beta-glucan% Oil% Ash%
8.95 56.45 4.17 2.29 2.239.04 61.45 4.34 2.43 1.81
s <0.01 ns <0.05 <0.01
2.42** 57.98** 0.26 12.75** 2.81**0.01 119.73** 4.17** 14.74** 3.81**2.09 147.88 19.30** 0.40 0.93
rotein% Starch% Beta-glucan% Oil% Ash%
8.98 62.03 4.42 1.83 2.428.96 59.37 3.92 2.76 2.30
s <0.01 <0.05 <0.01 <0.05
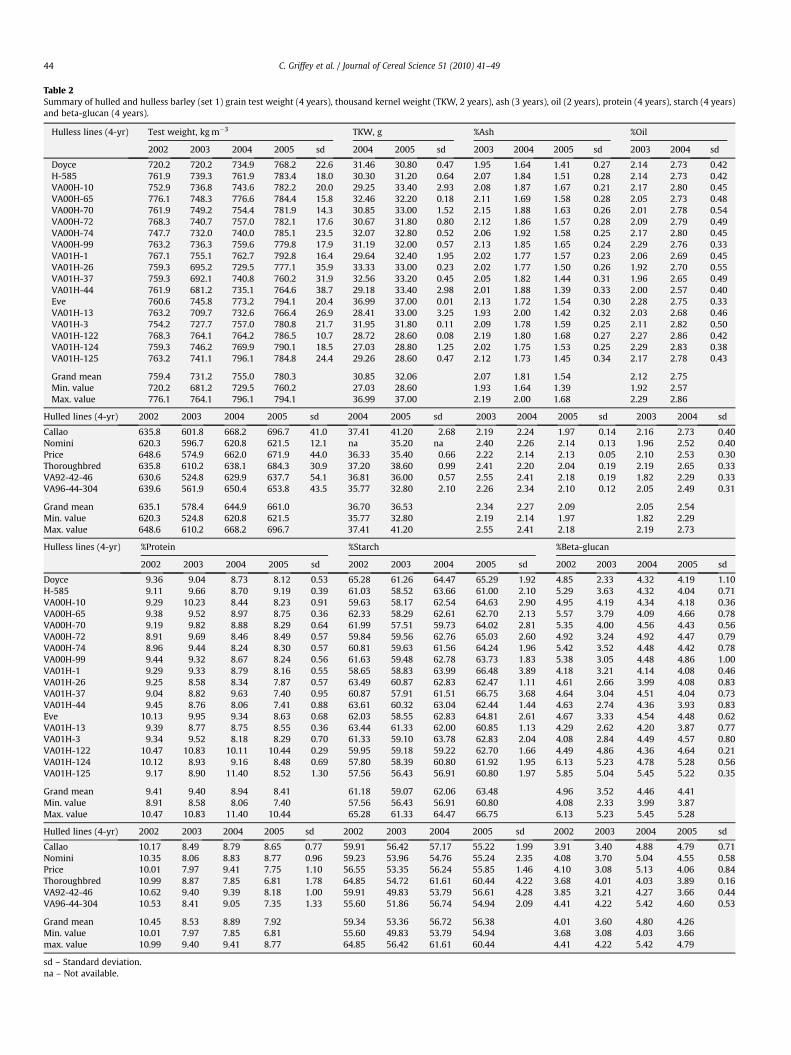
Table 2Summary of hulled and hulless barley (set 1) grain test weight (4 years), thousand kernel weight (TKW, 2 years), ash (3 years), oil (2 years), protein (4 years), starch (4 years)and beta-glucan (4 years).
Hulless lines (4-yr) Test weight, kg m�3 TKW, g %Ash %Oil
2002 2003 2004 2005 sd 2004 2005 sd 2003 2004 2005 sd 2003 2004 sd
Doyce 720.2 720.2 734.9 768.2 22.6 31.46 30.80 0.47 1.95 1.64 1.41 0.27 2.14 2.73 0.42H-585 761.9 739.3 761.9 783.4 18.0 30.30 31.20 0.64 2.07 1.84 1.51 0.28 2.14 2.73 0.42VA00H-10 752.9 736.8 743.6 782.2 20.0 29.25 33.40 2.93 2.08 1.87 1.67 0.21 2.17 2.80 0.45VA00H-65 776.1 748.3 776.6 784.4 15.8 32.46 32.20 0.18 2.11 1.69 1.58 0.28 2.05 2.73 0.48VA00H-70 761.9 749.2 754.4 781.9 14.3 30.85 33.00 1.52 2.15 1.88 1.63 0.26 2.01 2.78 0.54VA00H-72 768.3 740.7 757.0 782.1 17.6 30.67 31.80 0.80 2.12 1.86 1.57 0.28 2.09 2.79 0.49VA00H-74 747.7 732.0 740.0 785.1 23.5 32.07 32.80 0.52 2.06 1.92 1.58 0.25 2.17 2.80 0.45VA00H-99 763.2 736.3 759.6 779.8 17.9 31.19 32.00 0.57 2.13 1.85 1.65 0.24 2.29 2.76 0.33VA01H-1 767.1 755.1 762.7 792.8 16.4 29.64 32.40 1.95 2.02 1.77 1.57 0.23 2.06 2.69 0.45VA01H-26 759.3 695.2 729.5 777.1 35.9 33.33 33.00 0.23 2.02 1.77 1.50 0.26 1.92 2.70 0.55VA01H-37 759.3 692.1 740.8 760.2 31.9 32.56 33.20 0.45 2.05 1.82 1.44 0.31 1.96 2.65 0.49VA01H-44 761.9 681.2 735.1 764.6 38.7 29.18 33.40 2.98 2.01 1.88 1.39 0.33 2.00 2.57 0.40Eve 760.6 745.8 773.2 794.1 20.4 36.99 37.00 0.01 2.13 1.72 1.54 0.30 2.28 2.75 0.33VA01H-13 763.2 709.7 732.6 766.4 26.9 28.41 33.00 3.25 1.93 2.00 1.42 0.32 2.03 2.68 0.46VA01H-3 754.2 727.7 757.0 780.8 21.7 31.95 31.80 0.11 2.09 1.78 1.59 0.25 2.11 2.82 0.50VA01H-122 768.3 764.1 764.2 786.5 10.7 28.72 28.60 0.08 2.19 1.80 1.68 0.27 2.27 2.86 0.42VA01H-124 759.3 746.2 769.9 790.1 18.5 27.03 28.80 1.25 2.02 1.75 1.53 0.25 2.29 2.83 0.38VA01H-125 763.2 741.1 796.1 784.8 24.4 29.26 28.60 0.47 2.12 1.73 1.45 0.34 2.17 2.78 0.43
Grand mean 759.4 731.2 755.0 780.3 30.85 32.06 2.07 1.81 1.54 2.12 2.75Min. value 720.2 681.2 729.5 760.2 27.03 28.60 1.93 1.64 1.39 1.92 2.57Max. value 776.1 764.1 796.1 794.1 36.99 37.00 2.19 2.00 1.68 2.29 2.86
Hulled lines (4-yr) 2002 2003 2004 2005 sd 2004 2005 sd 2003 2004 2005 sd 2003 2004 sd
Callao 635.8 601.8 668.2 696.7 41.0 37.41 41.20 2.68 2.19 2.24 1.97 0.14 2.16 2.73 0.40Nomini 620.3 596.7 620.8 621.5 12.1 na 35.20 na 2.40 2.26 2.14 0.13 1.96 2.52 0.40Price 648.6 574.9 662.0 671.9 44.0 36.33 35.40 0.66 2.22 2.14 2.13 0.05 2.10 2.53 0.30Thoroughbred 635.8 610.2 638.1 684.3 30.9 37.20 38.60 0.99 2.41 2.20 2.04 0.19 2.19 2.65 0.33VA92-42-46 630.6 524.8 629.9 637.7 54.1 36.81 36.00 0.57 2.55 2.41 2.18 0.19 1.82 2.29 0.33VA96-44-304 639.6 561.9 650.4 653.8 43.5 35.77 32.80 2.10 2.26 2.34 2.10 0.12 2.05 2.49 0.31
Grand mean 635.1 578.4 644.9 661.0 36.70 36.53 2.34 2.27 2.09 2.05 2.54Min. value 620.3 524.8 620.8 621.5 35.77 32.80 2.19 2.14 1.97 1.82 2.29Max. value 648.6 610.2 668.2 696.7 37.41 41.20 2.55 2.41 2.18 2.19 2.73
Hulless lines (4-yr) %Protein %Starch %Beta-glucan
2002 2003 2004 2005 sd 2002 2003 2004 2005 sd 2002 2003 2004 2005 sd
Doyce 9.36 9.04 8.73 8.12 0.53 65.28 61.26 64.47 65.29 1.92 4.85 2.33 4.32 4.19 1.10H-585 9.11 9.66 8.70 9.19 0.39 61.03 58.52 63.66 61.00 2.10 5.29 3.63 4.32 4.04 0.71VA00H-10 9.29 10.23 8.44 8.23 0.91 59.63 58.17 62.54 64.63 2.90 4.95 4.19 4.34 4.18 0.36VA00H-65 9.38 9.52 8.97 8.75 0.36 62.33 58.29 62.61 62.70 2.13 5.57 3.79 4.09 4.66 0.78VA00H-70 9.19 9.82 8.88 8.29 0.64 61.99 57.51 59.73 64.02 2.81 5.35 4.00 4.56 4.43 0.56VA00H-72 8.91 9.69 8.46 8.49 0.57 59.84 59.56 62.76 65.03 2.60 4.92 3.24 4.92 4.47 0.79VA00H-74 8.96 9.44 8.24 8.30 0.57 60.81 59.63 61.56 64.24 1.96 5.42 3.52 4.48 4.42 0.78VA00H-99 9.44 9.32 8.67 8.24 0.56 61.63 59.48 62.78 63.73 1.83 5.38 3.05 4.48 4.86 1.00VA01H-1 9.29 9.33 8.79 8.16 0.55 58.65 58.83 63.99 66.48 3.89 4.18 3.21 4.14 4.08 0.46VA01H-26 9.25 8.58 8.34 7.87 0.57 63.49 60.87 62.83 62.47 1.11 4.61 2.66 3.99 4.08 0.83VA01H-37 9.04 8.82 9.63 7.40 0.95 60.87 57.91 61.51 66.75 3.68 4.64 3.04 4.51 4.04 0.73VA01H-44 9.45 8.76 8.06 7.41 0.88 63.61 60.32 63.04 62.44 1.44 4.63 2.74 4.36 3.93 0.83Eve 10.13 9.95 9.34 8.63 0.68 62.03 58.55 62.83 64.81 2.61 4.67 3.33 4.54 4.48 0.62VA01H-13 9.39 8.77 8.75 8.55 0.36 63.44 61.33 62.00 60.85 1.13 4.29 2.62 4.20 3.87 0.77VA01H-3 9.34 9.52 8.18 8.29 0.70 61.33 59.10 63.78 62.83 2.04 4.08 2.84 4.49 4.57 0.80VA01H-122 10.47 10.83 10.11 10.44 0.29 59.95 59.18 59.22 62.70 1.66 4.49 4.86 4.36 4.64 0.21VA01H-124 10.12 8.93 9.16 8.48 0.69 57.80 58.39 60.80 61.92 1.95 6.13 5.23 4.78 5.28 0.56VA01H-125 9.17 8.90 11.40 8.52 1.30 57.56 56.43 56.91 60.80 1.97 5.85 5.04 5.45 5.22 0.35
Grand mean 9.41 9.40 8.94 8.41 61.18 59.07 62.06 63.48 4.96 3.52 4.46 4.41Min. value 8.91 8.58 8.06 7.40 57.56 56.43 56.91 60.80 4.08 2.33 3.99 3.87Max. value 10.47 10.83 11.40 10.44 65.28 61.33 64.47 66.75 6.13 5.23 5.45 5.28
Hulled lines (4-yr) 2002 2003 2004 2005 sd 2002 2003 2004 2005 sd 2002 2003 2004 2005 sd
Callao 10.17 8.49 8.79 8.65 0.77 59.91 56.42 57.17 55.22 1.99 3.91 3.40 4.88 4.79 0.71Nomini 10.35 8.06 8.83 8.77 0.96 59.23 53.96 54.76 55.24 2.35 4.08 3.70 5.04 4.55 0.58Price 10.01 7.97 9.41 7.75 1.10 56.55 53.35 56.24 55.85 1.46 4.10 3.08 5.13 4.06 0.84Thoroughbred 10.99 8.87 7.85 6.81 1.78 64.85 54.72 61.61 60.44 4.22 3.68 4.01 4.03 3.89 0.16VA92-42-46 10.62 9.40 9.39 8.18 1.00 59.91 49.83 53.79 56.61 4.28 3.85 3.21 4.27 3.66 0.44VA96-44-304 10.53 8.41 9.05 7.35 1.33 55.60 51.86 56.74 54.94 2.09 4.41 4.22 5.42 4.60 0.53
Grand mean 10.45 8.53 8.89 7.92 59.34 53.36 56.72 56.38 4.01 3.60 4.80 4.26Min. value 10.01 7.97 7.85 6.81 55.60 49.83 53.79 54.94 3.68 3.08 4.03 3.66max. value 10.99 9.40 9.41 8.77 64.85 56.42 61.61 60.44 4.41 4.22 5.42 4.79
sd – Standard deviation.na – Not available.
C. Griffey et al. / Journal of Cereal Science 51 (2010) 41–4944

Fig. 1. Mean daily temperature and cumulative monthly rainfall at EVAREC, Warsaw,VA over the preceding 30 years and for each of the study years.
Fig. 2. Barley grain test weight, oil concentration, ash concentration, grain protein, starch, anot appearing in both years are not included. Outer lines represent the standard deviation,
C. Griffey et al. / Journal of Cereal Science 51 (2010) 41–49 45
temperatures provide favorable grain fill conditions and oftenresult in higher grain test weight (Bruckner and Frohberg, 1987).Precipitation received during grain maturation to harvest was3.1 cm lower in June 2005 and 5.1 cm higher in June 2003 than the30-year mean (Fig. 1). The notable contrast in test weights in 2005versus 2003 likely is due largely to differences in precipitationreceived in June and the extent of grain weathering due to wettingand drying cycles. This phenomenon is common in the mid-Atlanticregion (Farrer et al., 2006). Mean and standard deviation for barleygrain test weight, ash concentration, oil concentration, grainprotein, starch, and beta-glucan concentration by barley type,tested in 2003–2004 are presented in Fig. 2. Lines not evaluated inboth years are not included. The average test weight of hulless lines(731 kg m�3) was 13% and 16% higher than those of malting(639 kg m�3) and hulled feed (612 kg m�3) types, respectively(Fig. 2). These differences are similar to those reported byRameshbabu et al. (1996) in Canada and Thomason et al. (2009) inthe eastern USA.
Test weight means over the 18 hulless lines in set 1 evaluatedduring four years varied from a low of 731 kg m�3 in 2003 to a highof 780 kg m�3 in 2005 with an over years mean of 756 kg m�3
nd beta-glucan concentration by type (dm basis), means by cultivar, 2003–2004. Lineswhile the center line indicates the mean of the population.
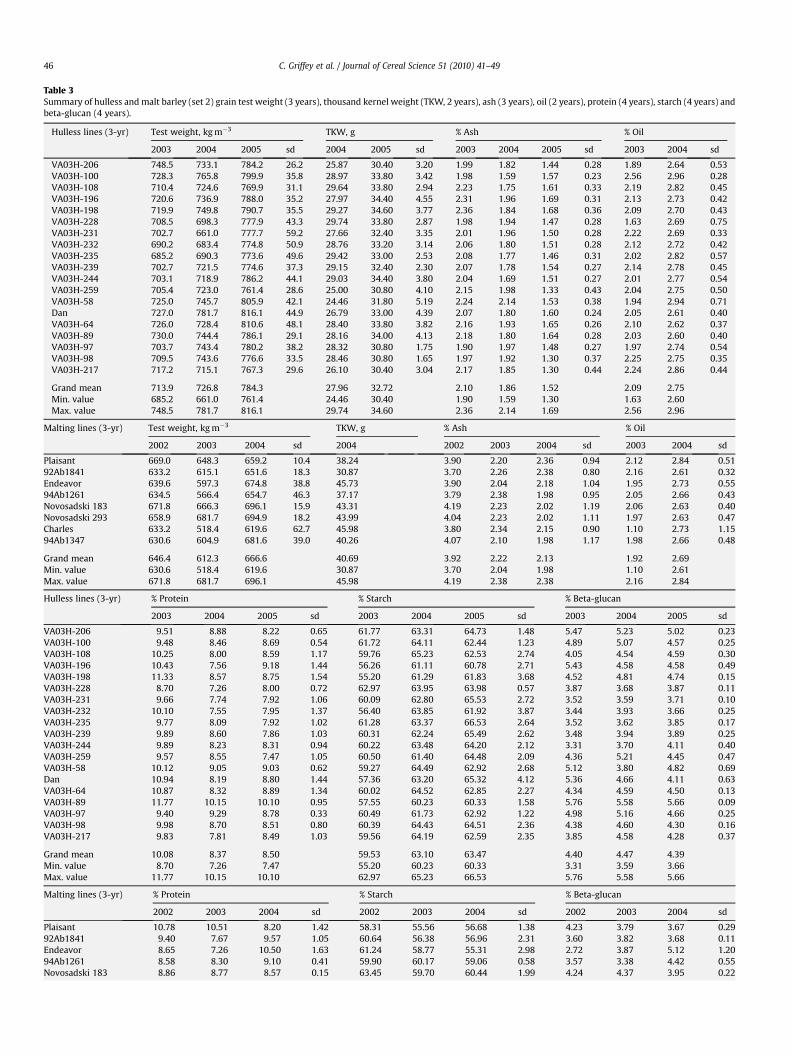
Table 3Summary of hulless and malt barley (set 2) grain test weight (3 years), thousand kernel weight (TKW, 2 years), ash (3 years), oil (2 years), protein (4 years), starch (4 years) andbeta-glucan (4 years).
Hulless lines (3-yr) Test weight, kg m�3 TKW, g % Ash % Oil
2003 2004 2005 sd 2004 2005 sd 2003 2004 2005 sd 2003 2004 sd
VA03H-206 748.5 733.1 784.2 26.2 25.87 30.40 3.20 1.99 1.82 1.44 0.28 1.89 2.64 0.53VA03H-100 728.3 765.8 799.9 35.8 28.97 33.80 3.42 1.98 1.59 1.57 0.23 2.56 2.96 0.28VA03H-108 710.4 724.6 769.9 31.1 29.64 33.80 2.94 2.23 1.75 1.61 0.33 2.19 2.82 0.45VA03H-196 720.6 736.9 788.0 35.2 27.97 34.40 4.55 2.31 1.96 1.69 0.31 2.13 2.73 0.42VA03H-198 719.9 749.8 790.7 35.5 29.27 34.60 3.77 2.36 1.84 1.68 0.36 2.09 2.70 0.43VA03H-228 708.5 698.3 777.9 43.3 29.74 33.80 2.87 1.98 1.94 1.47 0.28 1.63 2.69 0.75VA03H-231 702.7 661.0 777.7 59.2 27.66 32.40 3.35 2.01 1.96 1.50 0.28 2.22 2.69 0.33VA03H-232 690.2 683.4 774.8 50.9 28.76 33.20 3.14 2.06 1.80 1.51 0.28 2.12 2.72 0.42VA03H-235 685.2 690.3 773.6 49.6 29.42 33.00 2.53 2.08 1.77 1.46 0.31 2.02 2.82 0.57VA03H-239 702.7 721.5 774.6 37.3 29.15 32.40 2.30 2.07 1.78 1.54 0.27 2.14 2.78 0.45VA03H-244 703.1 718.9 786.2 44.1 29.03 34.40 3.80 2.04 1.69 1.51 0.27 2.01 2.77 0.54VA03H-259 705.4 723.0 761.4 28.6 25.00 30.80 4.10 2.15 1.98 1.33 0.43 2.04 2.75 0.50VA03H-58 725.0 745.7 805.9 42.1 24.46 31.80 5.19 2.24 2.14 1.53 0.38 1.94 2.94 0.71Dan 727.0 781.7 816.1 44.9 26.79 33.00 4.39 2.07 1.80 1.60 0.24 2.05 2.61 0.40VA03H-64 726.0 728.4 810.6 48.1 28.40 33.80 3.82 2.16 1.93 1.65 0.26 2.10 2.62 0.37VA03H-89 730.0 744.4 786.1 29.1 28.16 34.00 4.13 2.18 1.80 1.64 0.28 2.03 2.60 0.40VA03H-97 703.7 743.4 780.2 38.2 28.32 30.80 1.75 1.90 1.97 1.48 0.27 1.97 2.74 0.54VA03H-98 709.5 743.6 776.6 33.5 28.46 30.80 1.65 1.97 1.92 1.30 0.37 2.25 2.75 0.35VA03H-217 717.2 715.1 767.3 29.6 26.10 30.40 3.04 2.17 1.85 1.30 0.44 2.24 2.86 0.44
Grand mean 713.9 726.8 784.3 27.96 32.72 2.10 1.86 1.52 2.09 2.75Min. value 685.2 661.0 761.4 24.46 30.40 1.90 1.59 1.30 1.63 2.60Max. value 748.5 781.7 816.1 29.74 34.60 2.36 2.14 1.69 2.56 2.96
Malting lines (3-yr) Test weight, kg m�3 TKW, g % Ash % Oil
2002 2003 2004 sd 2004 2002 2003 2004 sd 2003 2004 sd
Plaisant 669.0 648.3 659.2 10.4 38.24 3.90 2.20 2.36 0.94 2.12 2.84 0.5192Ab1841 633.2 615.1 651.6 18.3 30.87 3.70 2.26 2.38 0.80 2.16 2.61 0.32Endeavor 639.6 597.3 674.8 38.8 45.73 3.90 2.04 2.18 1.04 1.95 2.73 0.5594Ab1261 634.5 566.4 654.7 46.3 37.17 3.79 2.38 1.98 0.95 2.05 2.66 0.43Novosadski 183 671.8 666.3 696.1 15.9 43.31 4.19 2.23 2.02 1.19 2.06 2.63 0.40Novosadski 293 658.9 681.7 694.9 18.2 43.99 4.04 2.23 2.02 1.11 1.97 2.63 0.47Charles 633.2 518.4 619.6 62.7 45.98 3.80 2.34 2.15 0.90 1.10 2.73 1.1594Ab1347 630.6 604.9 681.6 39.0 40.26 4.07 2.10 1.98 1.17 1.98 2.66 0.48
Grand mean 646.4 612.3 666.6 40.69 3.92 2.22 2.13 1.92 2.69Min. value 630.6 518.4 619.6 30.87 3.70 2.04 1.98 1.10 2.61Max. value 671.8 681.7 696.1 45.98 4.19 2.38 2.38 2.16 2.84
Hulless lines (3-yr) % Protein % Starch % Beta-glucan
2003 2004 2005 sd 2003 2004 2005 sd 2003 2004 2005 sd
VA03H-206 9.51 8.88 8.22 0.65 61.77 63.31 64.73 1.48 5.47 5.23 5.02 0.23VA03H-100 9.48 8.46 8.69 0.54 61.72 64.11 62.44 1.23 4.89 5.07 4.57 0.25VA03H-108 10.25 8.00 8.59 1.17 59.76 65.23 62.53 2.74 4.05 4.54 4.59 0.30VA03H-196 10.43 7.56 9.18 1.44 56.26 61.11 60.78 2.71 5.43 4.58 4.58 0.49VA03H-198 11.33 8.57 8.75 1.54 55.20 61.29 61.83 3.68 4.52 4.81 4.74 0.15VA03H-228 8.70 7.26 8.00 0.72 62.97 63.95 63.98 0.57 3.87 3.68 3.87 0.11VA03H-231 9.66 7.74 7.92 1.06 60.09 62.80 65.53 2.72 3.52 3.59 3.71 0.10VA03H-232 10.10 7.55 7.95 1.37 56.40 63.85 61.92 3.87 3.44 3.93 3.66 0.25VA03H-235 9.77 8.09 7.92 1.02 61.28 63.37 66.53 2.64 3.52 3.62 3.85 0.17VA03H-239 9.89 8.60 7.86 1.03 60.31 62.24 65.49 2.62 3.48 3.94 3.89 0.25VA03H-244 9.89 8.23 8.31 0.94 60.22 63.48 64.20 2.12 3.31 3.70 4.11 0.40VA03H-259 9.57 8.55 7.47 1.05 60.50 61.40 64.48 2.09 4.36 5.21 4.45 0.47VA03H-58 10.12 9.05 9.03 0.62 59.27 64.49 62.92 2.68 5.12 3.80 4.82 0.69Dan 10.94 8.19 8.80 1.44 57.36 63.20 65.32 4.12 5.36 4.66 4.11 0.63VA03H-64 10.87 8.32 8.89 1.34 60.02 64.52 62.85 2.27 4.34 4.59 4.50 0.13VA03H-89 11.77 10.15 10.10 0.95 57.55 60.23 60.33 1.58 5.76 5.58 5.66 0.09VA03H-97 9.40 9.29 8.78 0.33 60.49 61.73 62.92 1.22 4.98 5.16 4.66 0.25VA03H-98 9.98 8.70 8.51 0.80 60.39 64.43 64.51 2.36 4.38 4.60 4.30 0.16VA03H-217 9.83 7.81 8.49 1.03 59.56 64.19 62.59 2.35 3.85 4.58 4.28 0.37
Grand mean 10.08 8.37 8.50 59.53 63.10 63.47 4.40 4.47 4.39Min. value 8.70 7.26 7.47 55.20 60.23 60.33 3.31 3.59 3.66Max. value 11.77 10.15 10.10 62.97 65.23 66.53 5.76 5.58 5.66
Malting lines (3-yr) % Protein % Starch % Beta-glucan
2002 2003 2004 sd 2002 2003 2004 sd 2002 2003 2004 sd
Plaisant 10.78 10.51 8.20 1.42 58.31 55.56 56.68 1.38 4.23 3.79 3.67 0.2992Ab1841 9.40 7.67 9.57 1.05 60.64 56.38 56.96 2.31 3.60 3.82 3.68 0.11Endeavor 8.65 7.26 10.50 1.63 61.24 58.77 55.31 2.98 2.72 3.87 5.12 1.2094Ab1261 8.58 8.30 9.10 0.41 59.90 60.17 59.06 0.58 3.57 3.38 4.42 0.55Novosadski 183 8.86 8.77 8.57 0.15 63.45 59.70 60.44 1.99 4.24 4.37 3.95 0.22
C. Griffey et al. / Journal of Cereal Science 51 (2010) 41–4946
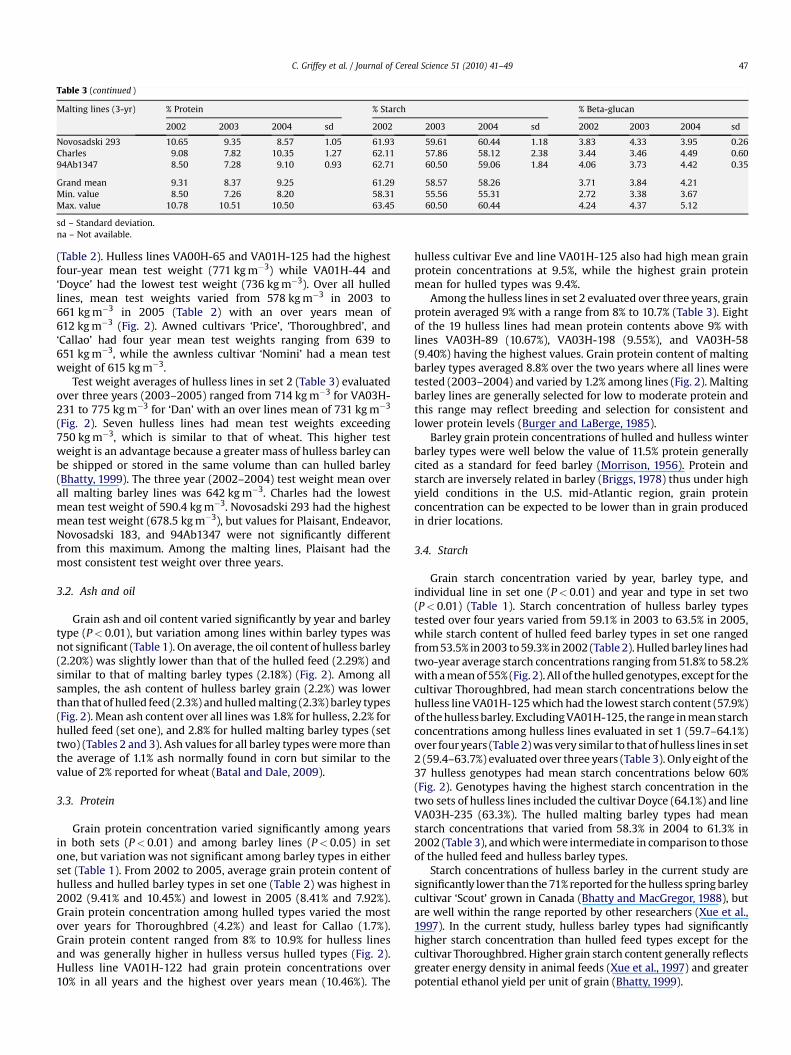
Table 3 (continued )
Malting lines (3-yr) % Protein % Starch % Beta-glucan
2002 2003 2004 sd 2002 2003 2004 sd 2002 2003 2004 sd
Novosadski 293 10.65 9.35 8.57 1.05 61.93 59.61 60.44 1.18 3.83 4.33 3.95 0.26Charles 9.08 7.82 10.35 1.27 62.11 57.86 58.12 2.38 3.44 3.46 4.49 0.6094Ab1347 8.50 7.28 9.10 0.93 62.71 60.50 59.06 1.84 4.06 3.73 4.42 0.35
Grand mean 9.31 8.37 9.25 61.29 58.57 58.26 3.71 3.84 4.21Min. value 8.50 7.26 8.20 58.31 55.56 55.31 2.72 3.38 3.67Max. value 10.78 10.51 10.50 63.45 60.50 60.44 4.24 4.37 5.12
sd – Standard deviation.na – Not available.
C. Griffey et al. / Journal of Cereal Science 51 (2010) 41–49 47
(Table 2). Hulless lines VA00H-65 and VA01H-125 had the highestfour-year mean test weight (771 kg m�3) while VA01H-44 and‘Doyce’ had the lowest test weight (736 kg m�3). Over all hulledlines, mean test weights varied from 578 kg m�3 in 2003 to661 kg m�3 in 2005 (Table 2) with an over years mean of612 kg m�3 (Fig. 2). Awned cultivars ‘Price’, ‘Thoroughbred’, and‘Callao’ had four year mean test weights ranging from 639 to651 kg m�3, while the awnless cultivar ‘Nomini’ had a mean testweight of 615 kg m�3.
Test weight averages of hulless lines in set 2 (Table 3) evaluatedover three years (2003–2005) ranged from 714 kg m�3 for VA03H-231 to 775 kg m�3 for ‘Dan’ with an over lines mean of 731 kg m�3
(Fig. 2). Seven hulless lines had mean test weights exceeding750 kg m�3, which is similar to that of wheat. This higher testweight is an advantage because a greater mass of hulless barley canbe shipped or stored in the same volume than can hulled barley(Bhatty, 1999). The three year (2002–2004) test weight mean overall malting barley lines was 642 kg m�3. Charles had the lowestmean test weight of 590.4 kg m�3. Novosadski 293 had the highestmean test weight (678.5 kg m�3), but values for Plaisant, Endeavor,Novosadski 183, and 94Ab1347 were not significantly differentfrom this maximum. Among the malting lines, Plaisant had themost consistent test weight over three years.
3.2. Ash and oil
Grain ash and oil content varied significantly by year and barleytype (P< 0.01), but variation among lines within barley types wasnot significant (Table 1). On average, the oil content of hulless barley(2.20%) was slightly lower than that of the hulled feed (2.29%) andsimilar to that of malting barley types (2.18%) (Fig. 2). Among allsamples, the ash content of hulless barley grain (2.2%) was lowerthan that of hulled feed (2.3%) and hulled malting (2.3%) barley types(Fig. 2). Mean ash content over all lines was 1.8% for hulless, 2.2% forhulled feed (set one), and 2.8% for hulled malting barley types (settwo) (Tables 2 and 3). Ash values for all barley types were more thanthe average of 1.1% ash normally found in corn but similar to thevalue of 2% reported for wheat (Batal and Dale, 2009).
3.3. Protein
Grain protein concentration varied significantly among yearsin both sets (P< 0.01) and among barley lines (P< 0.05) in setone, but variation was not significant among barley types in eitherset (Table 1). From 2002 to 2005, average grain protein content ofhulless and hulled barley types in set one (Table 2) was highest in2002 (9.41% and 10.45%) and lowest in 2005 (8.41% and 7.92%).Grain protein concentration among hulled types varied the mostover years for Thoroughbred (4.2%) and least for Callao (1.7%).Grain protein content ranged from 8% to 10.9% for hulless linesand was generally higher in hulless versus hulled types (Fig. 2).Hulless line VA01H-122 had grain protein concentrations over10% in all years and the highest over years mean (10.46%). The
hulless cultivar Eve and line VA01H-125 also had high mean grainprotein concentrations at 9.5%, while the highest grain proteinmean for hulled types was 9.4%.
Among the hulless lines in set 2 evaluated over three years, grainprotein averaged 9% with a range from 8% to 10.7% (Table 3). Eightof the 19 hulless lines had mean protein contents above 9% withlines VA03H-89 (10.67%), VA03H-198 (9.55%), and VA03H-58(9.40%) having the highest values. Grain protein content of maltingbarley types averaged 8.8% over the two years where all lines weretested (2003–2004) and varied by 1.2% among lines (Fig. 2). Maltingbarley lines are generally selected for low to moderate protein andthis range may reflect breeding and selection for consistent andlower protein levels (Burger and LaBerge, 1985).
Barley grain protein concentrations of hulled and hulless winterbarley types were well below the value of 11.5% protein generallycited as a standard for feed barley (Morrison, 1956). Protein andstarch are inversely related in barley (Briggs, 1978) thus under highyield conditions in the U.S. mid-Atlantic region, grain proteinconcentration can be expected to be lower than in grain producedin drier locations.
3.4. Starch
Grain starch concentration varied by year, barley type, andindividual line in set one (P< 0.01) and year and type in set two(P< 0.01) (Table 1). Starch concentration of hulless barley typestested over four years varied from 59.1% in 2003 to 63.5% in 2005,while starch content of hulled feed barley types in set one rangedfrom 53.5% in 2003 to 59.3% in 2002 (Table 2). Hulled barley lines hadtwo-year average starch concentrations ranging from 51.8% to 58.2%with a mean of 55% (Fig. 2). All of the hulled genotypes, except for thecultivar Thoroughbred, had mean starch concentrations below thehulless line VA01H-125 which had the lowest starch content (57.9%)of the hulless barley. Excluding VA01H-125, the range in mean starchconcentrations among hulless lines evaluated in set 1 (59.7–64.1%)over four years (Table 2) was very similar to that of hulless lines in set2 (59.4–63.7%) evaluated over three years (Table 3). Only eight of the37 hulless genotypes had mean starch concentrations below 60%(Fig. 2). Genotypes having the highest starch concentration in thetwo sets of hulless lines included the cultivar Doyce (64.1%) and lineVA03H-235 (63.3%). The hulled malting barley types had meanstarch concentrations that varied from 58.3% in 2004 to 61.3% in2002 (Table 3), and which were intermediate in comparison to thoseof the hulled feed and hulless barley types.
Starch concentrations of hulless barley in the current study aresignificantly lower than the 71% reported for the hulless spring barleycultivar ‘Scout’ grown in Canada (Bhatty and MacGregor, 1988), butare well within the range reported by other researchers (Xue et al.,1997). In the current study, hulless barley types had significantlyhigher starch concentration than hulled feed types except for thecultivar Thoroughbred. Higher grain starch content generally reflectsgreater energy density in animal feeds (Xue et al., 1997) and greaterpotential ethanol yield per unit of grain (Bhatty, 1999).

Table 4Pearson correlation coefficients and significance of correlation for grain composi-tional components in hulless and hulled barley (set 1) over 4 years.
Test weight TKW Protein Starch Beta-glucan Oil
Hulless barleyTKW 0.28*Protein �0.10 �0.21Starch 0.38** 028* �0.64**Beta-glucan 0.49** �0.03 0.18 �0.02Oil 0.63** �0.01 �0.02 0.60** 0.68**Ash �0.67** �0.02 0.57** �0.73** �0.36** �0.80*
Hulled barleyTKW 0.48Protein �0.10 0.11Starch 0.51** 0.23 0.28Beta-glucan 0.55** 0.01 0.03 �0.01Oil 0.90** 0.42 0.06 0.80** 0.75**Ash �0.71** �0.28 0.53* �0.54* �0.26 �0.59*
*, **: Significant at the 0.05 and 0.01 level, respectively.
C. Griffey et al. / Journal of Cereal Science 51 (2010) 41–4948
3.5. Beta-glucan
Beta-glucan content varied significantly by year, barley type,and line (Table 1). Over all samples where all lines were tested,mean beta-glucan concentration only varied by 0.2% among thethree barley types being lowest in malting (4.0%) and highest inhulless (4.2%) types (Fig. 2). Previously published values for thebeta-glucan content in non-waxy barley have ranged from 3% to 7%(Xue et al., 1997). Beta-glucan content of hulless lines in set 1 testedover four years ranged from 3.75% for VA01H-13 to 5.39% forVA01H-125, and hulled lines had means ranging from 3.75% to4.66% (Table 2). Hulless lines in set 2 tested over three years hadsimilar average beta-glucan concentrations ranging from 3.71% to5.24% (Table 3). Malting barley lines had mean beta-glucanconcentrations ranging from 3.70% to 4.19%. Han et al. (1995)reported similar beta-glucan content in malting barley.
3.6. Associations among grain components
Hulless barley test weight was positively correlated with TKW,starch, beta-glucan and oil, and negatively correlated with ash(Table 4). Hulled barley test weight was positively correlated withstarch, beta-glucan and oil, and negatively correlated with ash(Table 4). Grain protein of hulled and hulless types of barley waspositively correlated with ash (Table 4), while hulless barley proteinwas negatively correlated with starch (Table 4). This relationshiphas been reported by a number of other researchers in diverseenvironments (Briggs, 1978; Cox et al., 1985; Terman et al., 1969).Beta-glucan content in hulless lines was positively correlated withoil but had a significant negative relationship with ash (Table 4).Similarly, beta-glucan in hulled lines was positively related to oilcontent (Table 4).
4. Summary and conclusions
Analysis over all barley genotypes evaluated in the current studyindicates that variation among hulless, hulled, and malting types ishighly significant (P� 0.01) for grain and kernel weight, starch,beta-glucan, oil and ash content, but non-significant (P� 0.05) forprotein concentration (Table 1). Variation among barley lines washighly significant for grain and kernel weight, and starch concen-tration, significant (P� 0.05) for beta-glucan concentration, butnon-significant for protein, oil, and ash content. Hulless barley hadsignificantly higher grain test weight and starch concentration thanhulled and malting types, and significantly higher beta-glucan thanmalting barley. Hulless barley had significantly lower kernel
weights, oil, and ash concentrations than hulled and malting types.Higher starch and lower fiber and ash concentrations in grain ofhulless barley versus hulled feed or malting type barley are char-acteristics that make hulless barley more desirable and similar towheat and corn for use in food, feed, and biofuels production. Allbut five of the 37 hulless lines had mean starch concentrationsabove 60% (Tables 2 and 3). Genetic variation for starch concen-tration among lines in all three barley types makes it feasible tobreed and select genotypes having high starch content. Three of theeight malting barley lines and the hulled cultivar Thoroughbred,whose parentage includes the malting cultivar Plaisant, had meanstarch concentrations above 60%.
Over three years (2003–2005) the 37 hulless lines had meangrain protein concentrations ranging from 8.0% to 10.7% and starchconcentrations from 58.0% to 63.7%. Hulless lines VA01H-122 andVA03H-89 had grain protein concentrations above 10% in all threeyears. A significant negative correlation (r¼�0.64) was obtainedbetween starch and protein concentrations among hulless lines(Table 4). While this negative association was observed amonga majority of hulless lines, the cultivar ‘Eve’ had the second highestmean protein (9.51%) and fourth highest mean starch (62.1%)concentrations. While both environment and genotype affected thevariation in grain compositional components, genetic variationtended to be more important among hulless and malting barleytypes in determining protein and starch concentration whileenvironment tended to be more important for ash and oilconcentration. In contrast, variation in grain composition amonghulled barley genotypes tended to be affected more by environ-ment than genetic background, which may be attributed to themuch smaller sample size. Selection for high starch concentrationamong all barley types is feasible and will facilitate development ofbarley cultivars better suited for use in feed, malting, and ethanolproduction. Selection for genotypes such as Eve, having both highstarch and protein content, while more difficult, is feasible andwould further improve end use quality of barley grain or byprod-ucts such as DDGS used in feed or food production. Genetic diver-sity for beta-glucan and oil concentration among the winter barleytypes evaluated in this study is relatively low, thus more diversegermplasm would need to be incorporated into the breedingprogram to significantly alter these traits in future cultivars. Awinter barley cultivar having high starch and protein and low fiberand beta-glucan concentration would be ideal for both feed andethanol production; whereas, a cultivar with high starch, protein,soluble fiber, and beta-glucan concentration would be ideal forproduction of health beneficial foods.
References
AACC International, 2000. Approved Methods of the American Association of CerealChemists. Methods 08-01, 32-23, 32-32, 44-19, 46-30, 55-10, 55-31, 10th ed.The Association, St. Paul, MN.
AOAC International, 2000. Official Methods of Analysis of AOAC International, 17thed. AOAC International, Gaithersburg, MD, USA. Official Methods 14.067, 990.03,995.16.
ASABE International, 2000. ASABE Standards. ASABE International, St. Joseph, MI.Standard S352.2.
Aman, P., Newman, C.W., 1986. Chemical composition of some different types ofbarley grown in Montana, USA. J. Cereal Sci. 4, 133–141.
Andersson, A.A.M., Elfverson, C., Andersson, R., Regner, S., Aman, P., 1999. Chemicaland physical characteristics of different barley samples. J. Sci. Food Agric. 79,979–986.
Batal, A., Dale, N., September 10, 2009. Ingredient analysis table. Feedstuffs 2009 ed.Bhatty, R.S., 1993. Physicochemical properties of roller-milled barley bran and flour.
Cereal Chem. 70, 397–402.Bhatty, R.S., 1999. The potential of hull-less barley. Cereal Chem. 76, 589–599.Bhatty, R.S., MacGregor, A.W., 1988. Gamma irradiation of hulless barley: effect on
grain composition, beta-glucans, and starch. Cereal Chem. 65, 463–470.Bhatty, R.S., Christison, G.I., Rossnagel, B.G., 1979. Energy and protein digestibilities
of hulled and hulless barley determined by swine feeding. Can. J. Anim. Sci. 59,585–588.

C. Griffey et al. / Journal of Cereal Science 51 (2010) 41–49 49
Brann, D.E., Holshouser, D.L., Mullins, G.L., 2000. Agronomy Handbook. VirginiaCoop. Ext., Blacksburg, VA. Pub. No. 424-100.
Briggs, D.E., 1978. Barley. Chapman and Hall, New York, NY.Brown, G.D., Gordon, S., 2001. Immune recognition. A new receptor for beta-
glucans. Nature 413, 36–37.Bruckner, P.L., Frohberg, R.C., 1987. Rate and duration of grain fill in spring wheat.
Crop Sci. 27, 451–455.Burger, W.C., LaBerge, D.E., 1985. Malting and brewing quality. In: Rasmusson, D.C.
(Ed.), Barley. ASA, Madison, WI, p. 379.Cox, M.C., Rains, D.W., Qualset, C.O., 1985. Genetic variation for nitrogen assimila-
tion and translocation in wheat. II. Nitrogen assimilation in relation to grainyield and protein. Crop Sci. 25, 435–440.
Farrer, D., Weisz, R., Heiniger, R., Murphy, J.P., Pate, M.H., 2006. Delayed harvesteffect on soft red winter wheat in the Southeastern USA. Agron. J. 98,588–595.
Fox J. 1981. The effect of the waxy endosperm, short arm and hulless seed genesupon biochemical and physiological seed characteristics important in barley(Hordeum vulgare L.) utilization. Montana State University, Bozeman (Diss Abstr.DE 082-14646).
Gill, S., Vasnathan, T., Ooraikul, B., Rossnagel, B., 2002. Wheat bread quality asinfluenced by the substitution of waxy and regular barley flours in their nativeand extruded forms. J. Cereal Sci. 36, 219–237.
Han, F., Ullrich, S.E., Chirat, S., Menteur, S., Jestin, L., Sarrafi, A., Hayes, P.M.,Jones, B.L., Blake, T.K., Wesenberg, D.M., Kleinhofs, A., Kilian, A., 1995. Mappingof b-glucan content and b-glucanase activity loci in barley grain and malt.Theor. Appl. Genet. 91, 921–927.
Hicks K.B., Flores R.A., Taylor F., Mcaloon A.J., Moreau R.A., Johnston D., Senske G.E.,Brooks W.S., Griffey C.A., 2005. Hulless barley – a new feedstock for fuelethanol?. Proceedings of the 15th Annual EPAC Ethanol l Conference, Cody, WY,June 12–14.
Huth, M., Dongowski, G., Gebhart, E., Flamme, W., 2002. Functional properties ofdietary fiber enriched exturdate from barley. J. Cereal Sci. 32, 115–117.
ICC International, 2008. General Principles of the Available ICC Standard Methods.ICC International, Vienna, Austria. Standard 168.
Ingledew, W.M., 1993. Yeasts for the production of fuel alcohol. In: Rose, A.H.,Harrison, J.S. (Eds.), The Yeasts, vol. 5. Academic Press, New York, pp. 245–291.2nd ed.
Jenkins, D.J.A., Axelsen, M., Kendall, C.W.C., Augustin, L.S.A., Vuksan, V., Smith, U.,2000. Dietary fiber, lente carbohydrates and the insulin resistant diseases. Br. J.Nutr. 83, 157–163.
Kalra, S., Jood, S., 2000. Effect of dietary barley b-glucan on cholesterol and lipo-protein fractions in rats. J. Cereal Sci. 31, 141–145.
Magness, J.R., Markle, G.M., Compton, C.C., 1971. Food and Feed Crops of the UnitedStates. Interregional Research Project IR-4, IR Bul. 1, Bul. 828. New JerseyAgricultural Experiment Station.
McIntosh, G.H., Whyte, J., McArthur, R., Nestel, P.J., 1991. Barley and wheat foods:influence on plasma cholesterol concentrations in hypercholesterolemic men.Am. J. Clin. Nutr. 53, 1205–1209.
Moreau, R.A., Powell, M.J., Singh, V., 2003. Pressurized liquid extraction of polar andnonpolar lipids in corn and oats with hexane, methylene chloride, isopropanol,and ethanol. J. Am. Oil Chem. Soc. 80, 1063–1067.
Morrison, F.B., 1956. Feeds and Feeding. Morrison Pub. Co., Ithaca, N.Y.Newman, R.K., Newman, C.W., Hofer, P.J., Barnes, A.E., 1991. Growth and lipid
metabolism as affected by feeding of hull-less barleys with and withoutsupplemental b-glucanase. Plant Food Human Nutr. 24, 42.
Oscarsson, M., Andersson, R., Salomonsson, A.C., Aman, P.,1996. Chemical compositionof barley samples focusing on dietary fibre components. J. Cereal Sci. 24, 161–170.
Rameshbabu, M., Jayas, D.S., Muir, W.E., White, N.D.G., Mills, J.T., 1996. Bulk andhandling properties of hulless barley. Can. Agric. Eng. 38, 31–35.
Robert, W.W., 1975. Fatty acid composition of grain from winter and spring sownoats, barley and wheat. J. Sci. Food Agric. 26, 429–435.
SAS Inst., 2004. SAS/STAT 9.1 Users Guide. SAS Inst, Cary, NC.Sohn, M., Himmelsbach, D.S., Barton II, F.E., Griffey, C.A., Brooks, W.S., Hicks, K.B.,
2007. Near-infrared analysis of ground barley for use as a feedstock for fuelethanol production. Appl. Spectroscopy 61, 1178–1183.
Terman, G.L., Ramig, R.E., Dreier, A.F., Olson, R.A., 1969. Yield–protein relationshipsin wheat grain, as affected by N and water. Agron. J. 61, 755–759.
Thomason, W.E., Brooks, W.S., Griffey, C.A., Vaughn, M.E., 2009. Hulless barleyseeding rate effects on grain yield and yield components. Crop Sci. 49, 342–346.
Vasanthan, T., Gaosong, J., Yeung, J., Li, J., 2002. Dietary fiber profile of barley flour asaffected by extrusion cooking. Food Chem. 77, 35–40.
Wang, L., Behr, S.R., Rosemary, K., Newman, R.D., Newman, C.W., 1997. Comparativecholesterol-lowering effects of barley b-glucan and barley oil in golden syrianhamsters. Nutr. Res. 17, 77–88.
Wood, P.J., Beer, M.U., Butler, G., 2002. Evaluation of role of concentration andmolecular weight of oat beta-glucan in determining effect of viscosity onplasma glucose and insulin following an oral glucose load. Br. J. Nutr. 84, 19–23.
Xue, Q., Wang, L., Newman, R.K., Newman, C.W., Graham, H., 1997. Influence of thehulless, waxy starch and short-awn genes on the composition of barleys. J.Cereal Sci. 26, 251–257.
Related Documents