GRADUATE & PROFESSIONAL STUDENT Reference Group Data Report Spring 2019 The ACHA-NCHA II supports the health of the campus community by fulfilling the academic mission, supporting short- and long-term healthy behaviors, and gaining a current profile of health trends within the campus community. Copyright 2019 All Rights Reserved Suggested citation for this document: American College Health Association. American College Health Association-National College Health Assessment II: Graduate & Professional Student Reference Group Data Report Spring 2019. Silver Spring, MD: American College Health Association; 2019.

Welcome message from author
This document is posted to help you gain knowledge. Please leave a comment to let me know what you think about it! Share it to your friends and learn new things together.
Transcript
GRADUATE & PROFESSIONAL STUDENT
Reference Group
Data Report Spring 2019
The ACHA-NCHA II supports the health of the campus community by fulfilling the academic mission, supporting short- and long-term healthy behaviors,
and gaining a current profile of health trends within the campus community.
Copyright 2019 All Rights Reserved
Suggested citation for this document: American College Health Association. American College He alth Association-National College Health Assessment II: Graduate & Professional Student Reference Group Data Report Spring 2019. S ilver Spring, MD: American College Health Association; 2019.
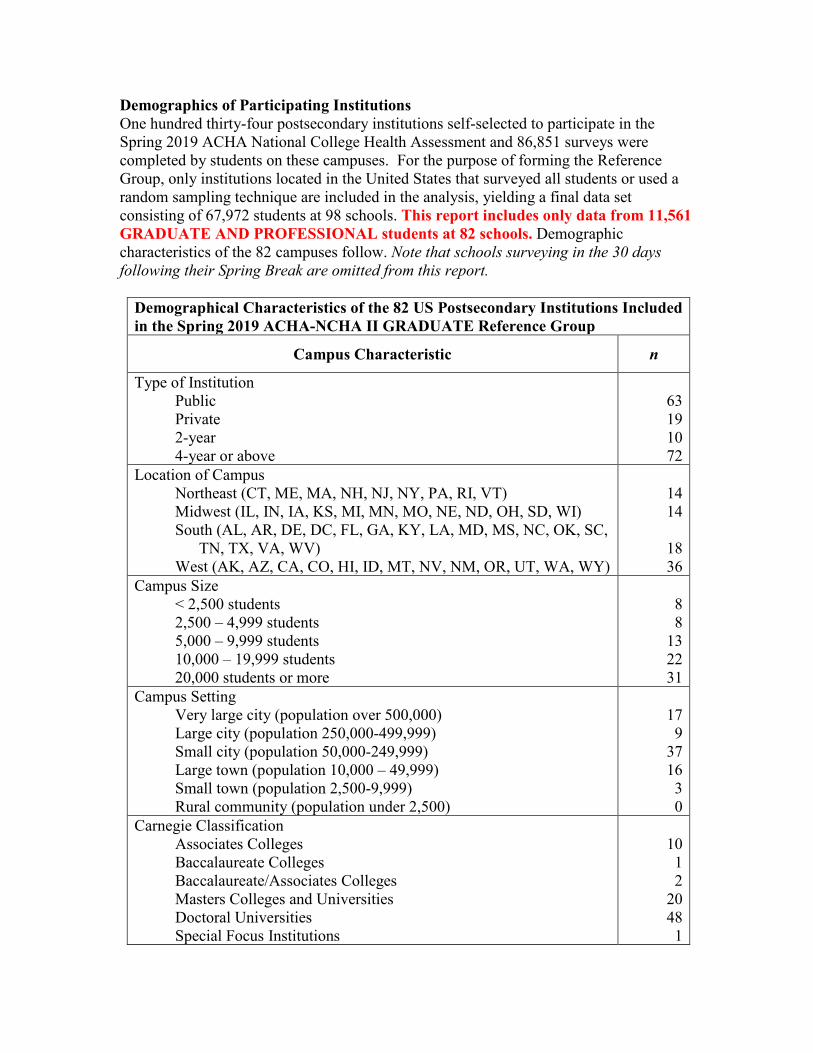
Demographics of Participating Institutions One hundred thirty-four postsecondary institutions self-selected to participate in the Spring 2019 ACHA National College Health Assessment and 86,851 surveys were completed by students on these campuses. For the purpose of forming the Reference Group, only institutions located in the United States that surveyed all students or used a random sampling technique are included in the analysis, yielding a final data set consisting of 67,972 students at 98 schools. This report includes only data from 11,561 GRADUATE AND PROFESSIONAL students at 82 schools. Demographic characteristics of the 82 campuses follow. Note that schools surveying in the 30 days following their Spring Break are omitted from this report.
Demographical Characteristics of the 82 US Postsecondary Institutions Included in the Spring 2019 ACHA-NCHA II GRADUATE Reference Group
Campus Characteristic n
Type of Institution Public Private 2-year4-year or above
63 19 10 72
Location of Campus Northeast (CT, ME, MA, NH, NJ, NY, PA, RI, VT) Midwest (IL, IN, IA, KS, MI, MN, MO, NE, ND, OH, SD, WI) South (AL, AR, DE, DC, FL, GA, KY, LA, MD, MS, NC, OK, SC,
TN, TX, VA, WV) West (AK, AZ, CA, CO, HI, ID, MT, NV, NM, OR, UT, WA, WY)
14 14
18 36
Campus Size < 2,500 students 2,500 – 4,999 students 5,000 – 9,999 students 10,000 – 19,999 students 20,000 students or more
8 8
13 22 31
Campus Setting Very large city (population over 500,000) Large city (population 250,000-499,999) Small city (population 50,000-249,999) Large town (population 10,000 – 49,999) Small town (population 2,500-9,999) Rural community (population under 2,500)
17 9
37 16 3 0
Carnegie Classification Associates Colleges Baccalaureate Colleges Baccalaureate/Associates Colleges Masters Colleges and Universities Doctoral Universities Special Focus Institutions
10 1 2
20 48 1

Demographical Characteristics of the 82 US Postsecondary Institutions Included in the Spring 2019 ACHA-NCHA II GRADUATE Reference Group
Campus Characteristic n
ACHA Membership Status Institutional Member Nonmember
82 0
Religious Affiliation No Yes If yes: Catholic Protestant or Other Christian
72 10
8 2
Postsecondary Minority Institution (US Department of Education) No Yes
*If yes:Postsecondary Minority InstitutionHistorically Black College or University (HBCU)High Hispanic EnrollmentHispanic-serving Institution (HSI)Tribal College or UniversityPredominately Black InstitutionAsian American and Native American Pacific Islander-servingAlaska Native-serving or Native Hawaiian-serving InstitutionNative American-serving Nontribal Institution
*institutions may hold more than one type of minority status
65 17
0 0 5
15 0 0 5 0 0
GRADUATE STUDENTS All Spring
2019 Institutions
Paper Survey Administration
Web Survey Administration
Number of institutions 82* 9 74
Number of students 11,561 143 11,418
Mean response proportion** 23% 86% 15%
Median response proportion** 13% 91% 13% *The number of paper and web institutions sum to more than the total number of participating institutionsas some schools administered both paper and web surveys. Sample size and response proportion for theseschools are reported separately for each survey method.**Calculation of response proportion is based all students surveyed at the institution, and not limited toonly graduate and professional student responses.
Reference Group Data Report - Spring 2019
American College Health Association
8455 Colesville Road, Suite 740
Silver Spring, MD 20910 FREQUENCY REPORT
(410) 859-1500 Number of Surveys (n) = 11561 P & W Surveys
www.acha.org
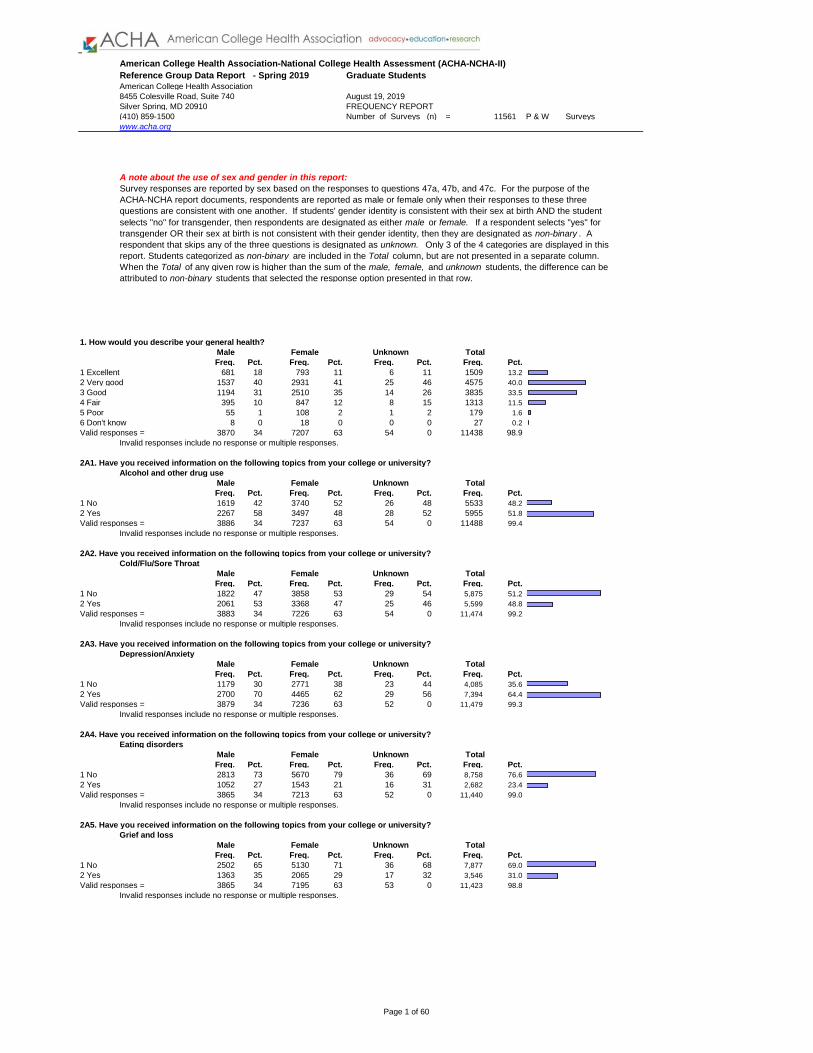
A note about the use of sex and gender in this report:
Survey responses are reported by sex based on the responses to questions 47a, 47b, and 47c. For the purpose of the
ACHA-NCHA report documents, respondents are reported as male or female only when their responses to these three
questions are consistent with one another. If students' gender identity is consistent with their sex at birth AND the student
selects "no" for transgender, then respondents are designated as either male or female. If a respondent selects "yes" for
transgender OR their sex at birth is not consistent with their gender identity, then they are designated as non-binary . A
respondent that skips any of the three questions is designated as unknown. Only 3 of the 4 categories are displayed in this
report. Students categorized as non-binary are included in the Total column, but are not presented in a separate column.
When the Total of any given row is higher than the sum of the male, female, and unknown students, the difference can be
attributed to non-binary students that selected the response option presented in that row.
1. How would you describe your general health?
Male Female Unknown Total
Freq. Pct. Freq. Pct. Freq. Pct. Freq. Pct.
1 Excellent 681 18 793 11 6 11 1509 13.2
2 Very good 1537 40 2931 41 25 46 4575 40.0
3 Good 1194 31 2510 35 14 26 3835 33.5
4 Fair 395 10 847 12 8 15 1313 11.5
5 Poor 55 1 108 2 1 2 179 1.6
6 Don't know 8 0 18 0 0 0 27 0.2
Valid responses = 3870 34 7207 63 54 0 11438 98.9
Invalid responses include no response or multiple responses.
2A1. Have you received information on the following topics from your college or university?
Alcohol and other drug use
Male Female Unknown Total
Freq. Pct. Freq. Pct. Freq. Pct. Freq. Pct.
1 No 1619 42 3740 52 26 48 5533 48.2
2 Yes 2267 58 3497 48 28 52 5955 51.8
Valid responses = 3886 34 7237 63 54 0 11488 99.4
Invalid responses include no response or multiple responses.
2A2. Have you received information on the following topics from your college or university?
Cold/Flu/Sore Throat
Male Female Unknown Total
Freq. Pct. Freq. Pct. Freq. Pct. Freq. Pct.
1 No 1822 47 3858 53 29 54 5,875 51.2
2 Yes 2061 53 3368 47 25 46 5,599 48.8
Valid responses = 3883 34 7226 63 54 0 11,474 99.2
Invalid responses include no response or multiple responses.
2A3. Have you received information on the following topics from your college or university?
Depression/Anxiety
Male Female Unknown Total
Freq. Pct. Freq. Pct. Freq. Pct. Freq. Pct.
1 No 1179 30 2771 38 23 44 4,085 35.6
2 Yes 2700 70 4465 62 29 56 7,394 64.4
Valid responses = 3879 34 7236 63 52 0 11,479 99.3
Invalid responses include no response or multiple responses.
2A4. Have you received information on the following topics from your college or university?
Eating disorders
Male Female Unknown Total
Freq. Pct. Freq. Pct. Freq. Pct. Freq. Pct.
1 No 2813 73 5670 79 36 69 8,758 76.6
2 Yes 1052 27 1543 21 16 31 2,682 23.4
Valid responses = 3865 34 7213 63 52 0 11,440 99.0
Invalid responses include no response or multiple responses.
2A5. Have you received information on the following topics from your college or university?
Grief and loss
Male Female Unknown Total
Freq. Pct. Freq. Pct. Freq. Pct. Freq. Pct.
1 No 2502 65 5130 71 36 68 7,877 69.0
2 Yes 1363 35 2065 29 17 32 3,546 31.0
Valid responses = 3865 34 7195 63 53 0 11,423 98.8
Invalid responses include no response or multiple responses.
American College Health Association-National College Health Assessment (ACHA-NCHA-II)
Graduate Students
August 19, 2019
Page 1 of 60
Reference Group Data Report - Spring 2019
American College Health Association
8455 Colesville Road, Suite 740
Silver Spring, MD 20910 FREQUENCY REPORT
(410) 859-1500 Number of Surveys (n) = 11561 P & W Surveys
www.acha.org
American College Health Association-National College Health Assessment (ACHA-NCHA-II)
Graduate Students
August 19, 2019
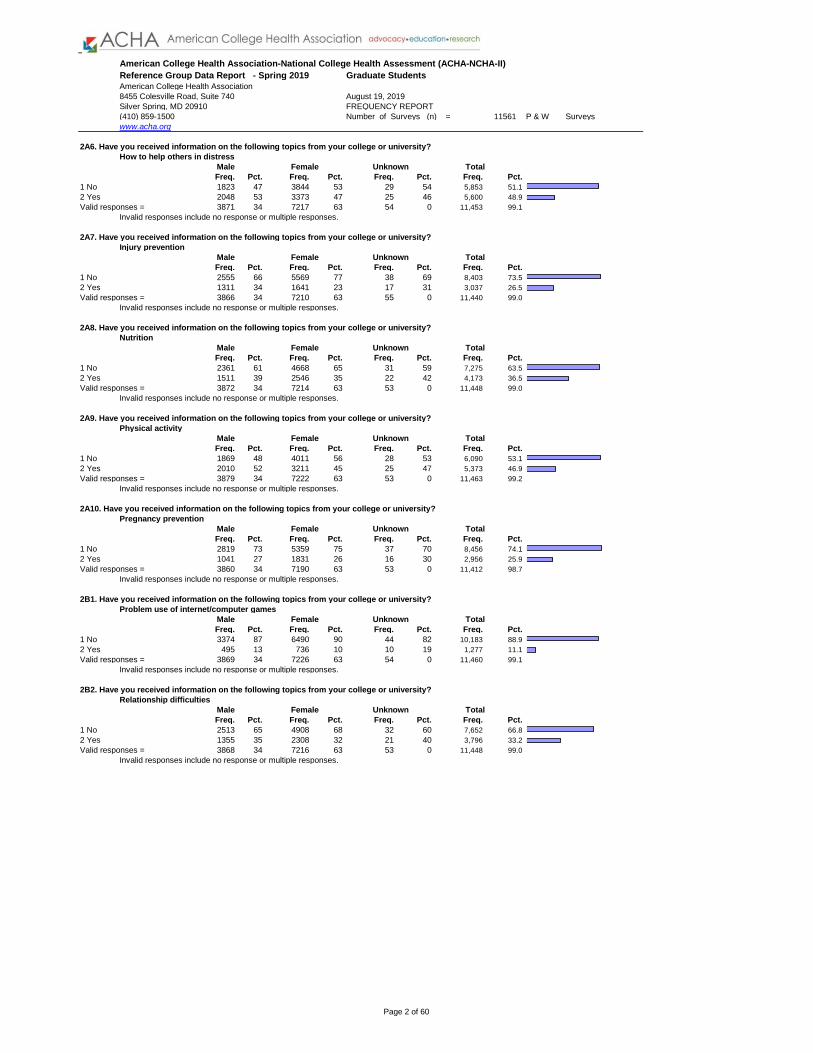
2A6. Have you received information on the following topics from your college or university?
How to help others in distress
Male Female Unknown Total
Freq. Pct. Freq. Pct. Freq. Pct. Freq. Pct.
1 No 1823 47 3844 53 29 54 5,853 51.1
2 Yes 2048 53 3373 47 25 46 5,600 48.9
Valid responses = 3871 34 7217 63 54 0 11,453 99.1
Invalid responses include no response or multiple responses.
2A7. Have you received information on the following topics from your college or university?
Injury prevention
Male Female Unknown Total
Freq. Pct. Freq. Pct. Freq. Pct. Freq. Pct.
1 No 2555 66 5569 77 38 69 8,403 73.5
2 Yes 1311 34 1641 23 17 31 3,037 26.5
Valid responses = 3866 34 7210 63 55 0 11,440 99.0
Invalid responses include no response or multiple responses.
2A8. Have you received information on the following topics from your college or university?
Nutrition
Male Female Unknown Total
Freq. Pct. Freq. Pct. Freq. Pct. Freq. Pct.
1 No 2361 61 4668 65 31 59 7,275 63.5
2 Yes 1511 39 2546 35 22 42 4,173 36.5
Valid responses = 3872 34 7214 63 53 0 11,448 99.0
Invalid responses include no response or multiple responses.
2A9. Have you received information on the following topics from your college or university?
Physical activity
Male Female Unknown Total
Freq. Pct. Freq. Pct. Freq. Pct. Freq. Pct.
1 No 1869 48 4011 56 28 53 6,090 53.1
2 Yes 2010 52 3211 45 25 47 5,373 46.9
Valid responses = 3879 34 7222 63 53 0 11,463 99.2
Invalid responses include no response or multiple responses.
2A10. Have you received information on the following topics from your college or university?
Pregnancy prevention
Male Female Unknown Total
Freq. Pct. Freq. Pct. Freq. Pct. Freq. Pct.
1 No 2819 73 5359 75 37 70 8,456 74.1
2 Yes 1041 27 1831 26 16 30 2,956 25.9
Valid responses = 3860 34 7190 63 53 0 11,412 98.7
Invalid responses include no response or multiple responses.
2B1. Have you received information on the following topics from your college or university?
Problem use of internet/computer games
Male Female Unknown Total
Freq. Pct. Freq. Pct. Freq. Pct. Freq. Pct.
1 No 3374 87 6490 90 44 82 10,183 88.9
2 Yes 495 13 736 10 10 19 1,277 11.1
Valid responses = 3869 34 7226 63 54 0 11,460 99.1
Invalid responses include no response or multiple responses.
2B2. Have you received information on the following topics from your college or university?
Relationship difficulties
Male Female Unknown Total
Freq. Pct. Freq. Pct. Freq. Pct. Freq. Pct.
1 No 2513 65 4908 68 32 60 7,652 66.8
2 Yes 1355 35 2308 32 21 40 3,796 33.2
Valid responses = 3868 34 7216 63 53 0 11,448 99.0
Invalid responses include no response or multiple responses.
Page 2 of 60
Reference Group Data Report - Spring 2019
American College Health Association
8455 Colesville Road, Suite 740
Silver Spring, MD 20910 FREQUENCY REPORT
(410) 859-1500 Number of Surveys (n) = 11561 P & W Surveys
www.acha.org
American College Health Association-National College Health Assessment (ACHA-NCHA-II)
Graduate Students
August 19, 2019
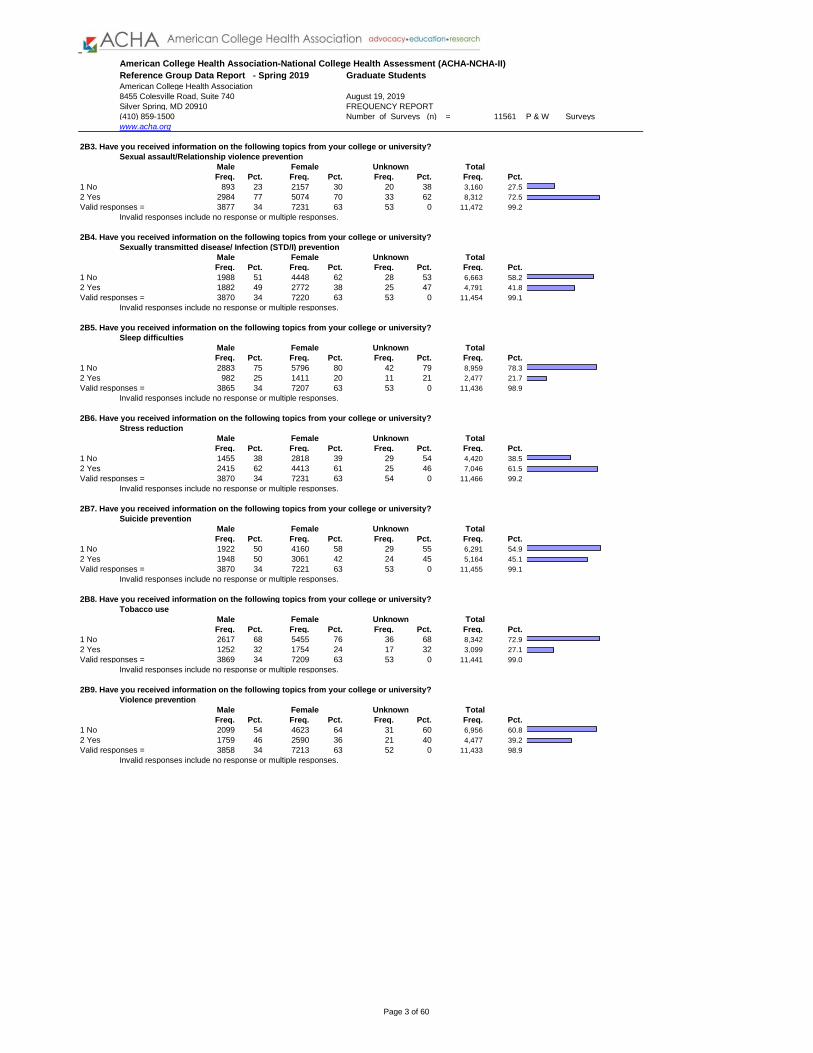
2B3. Have you received information on the following topics from your college or university?
Sexual assault/Relationship violence prevention
Male Female Unknown Total
Freq. Pct. Freq. Pct. Freq. Pct. Freq. Pct.
1 No 893 23 2157 30 20 38 3,160 27.5
2 Yes 2984 77 5074 70 33 62 8,312 72.5
Valid responses = 3877 34 7231 63 53 0 11,472 99.2
Invalid responses include no response or multiple responses.
2B4. Have you received information on the following topics from your college or university?
Sexually transmitted disease/ Infection (STD/I) prevention
Male Female Unknown Total
Freq. Pct. Freq. Pct. Freq. Pct. Freq. Pct.
1 No 1988 51 4448 62 28 53 6,663 58.2
2 Yes 1882 49 2772 38 25 47 4,791 41.8
Valid responses = 3870 34 7220 63 53 0 11,454 99.1
Invalid responses include no response or multiple responses.
2B5. Have you received information on the following topics from your college or university?
Sleep difficulties
Male Female Unknown Total
Freq. Pct. Freq. Pct. Freq. Pct. Freq. Pct.
1 No 2883 75 5796 80 42 79 8,959 78.3
2 Yes 982 25 1411 20 11 21 2,477 21.7
Valid responses = 3865 34 7207 63 53 0 11,436 98.9
Invalid responses include no response or multiple responses.
2B6. Have you received information on the following topics from your college or university?
Stress reduction
Male Female Unknown Total
Freq. Pct. Freq. Pct. Freq. Pct. Freq. Pct.
1 No 1455 38 2818 39 29 54 4,420 38.5
2 Yes 2415 62 4413 61 25 46 7,046 61.5
Valid responses = 3870 34 7231 63 54 0 11,466 99.2
Invalid responses include no response or multiple responses.
2B7. Have you received information on the following topics from your college or university?
Suicide prevention
Male Female Unknown Total
Freq. Pct. Freq. Pct. Freq. Pct. Freq. Pct.
1 No 1922 50 4160 58 29 55 6,291 54.9
2 Yes 1948 50 3061 42 24 45 5,164 45.1
Valid responses = 3870 34 7221 63 53 0 11,455 99.1
Invalid responses include no response or multiple responses.
2B8. Have you received information on the following topics from your college or university?
Tobacco use
Male Female Unknown Total
Freq. Pct. Freq. Pct. Freq. Pct. Freq. Pct.
1 No 2617 68 5455 76 36 68 8,342 72.9
2 Yes 1252 32 1754 24 17 32 3,099 27.1
Valid responses = 3869 34 7209 63 53 0 11,441 99.0
Invalid responses include no response or multiple responses.
2B9. Have you received information on the following topics from your college or university?
Violence prevention
Male Female Unknown Total
Freq. Pct. Freq. Pct. Freq. Pct. Freq. Pct.
1 No 2099 54 4623 64 31 60 6,956 60.8
2 Yes 1759 46 2590 36 21 40 4,477 39.2
Valid responses = 3858 34 7213 63 52 0 11,433 98.9
Invalid responses include no response or multiple responses.
Page 3 of 60

Reference Group Data Report - Spring 2019
American College Health Association
8455 Colesville Road, Suite 740
Silver Spring, MD 20910 FREQUENCY REPORT
(410) 859-1500 Number of Surveys (n) = 11561 P & W Surveys
www.acha.org
American College Health Association-National College Health Assessment (ACHA-NCHA-II)
Graduate Students
August 19, 2019
3A1. Are you interested in receiving information on the following topics from your college or university?
Alcohol and other drug use
Male Female Unknown Total
Freq. Pct. Freq. Pct. Freq. Pct. Freq. Pct.
1 No 2716 70 5320 74 43 80 8,298 72.8
2 Yes 1140 30 1852 26 11 20 3,093 27.2
Valid responses = 3856 34 7172 63 54 0 11,391 98.5
Invalid responses include no response or multiple responses.
3A2. Are you interested in receiving information on the following topics from your college or university?
Cold/Flu/Sore throat
Male Female Unknown Total
Freq. Pct. Freq. Pct. Freq. Pct. Freq. Pct.
1 No 2290 59 4342 61 30 58 6,854 60.2
2 Yes 1562 41 2832 40 22 42 4,532 39.8
Valid responses = 3852 34 7174 63 52 0 11,386 98.5
Invalid responses include no response or multiple responses.
3A3. Are you interested in receiving information on the following topics from your college or university?
Depression/Anxiety
Male Female Unknown Total
Freq. Pct. Freq. Pct. Freq. Pct. Freq. Pct.
1 No 1637 43 2641 37 31 59 4,430 38.8
2 Yes 2219 58 4556 63 22 42 6,984 61.2
Valid responses = 3856 34 7197 63 53 0 11,414 98.7
Invalid responses include no response or multiple responses.
3A4. Are you interested in receiving information on the following topics from your college or university?
Eating disorders
Male Female Unknown Total
Freq. Pct. Freq. Pct. Freq. Pct. Freq. Pct.
1 No 2550 66 4622 65 38 73 7,406 65.1
2 Yes 1294 34 2543 36 14 27 3,962 34.9
Valid responses = 3844 34 7165 63 52 0 11,368 98.3
Invalid responses include no response or multiple responses.
3A5. Are you interested in receiving information on the following topics from your college or university?
Grief and loss
Male Female Unknown Total
Freq. Pct. Freq. Pct. Freq. Pct. Freq. Pct.
1 No 2215 58 3819 53 39 72 6,236 54.9
2 Yes 1620 42 3337 47 15 28 5,116 45.1
Valid responses = 3835 34 7156 63 54 0 11,352 98.2
Invalid responses include no response or multiple responses.
3A6. Are you interested in receiving information on the following topics from your college or university?
How to help others in distress
Male Female Unknown Total
Freq. Pct. Freq. Pct. Freq. Pct. Freq. Pct.
1 No 1491 39 2405 33 23 43 4,021 35.2
2 Yes 2365 61 4786 67 30 57 7,388 64.8
Valid responses = 3856 34 7191 63 53 0 11,409 98.7
Invalid responses include no response or multiple responses.
3A7. Are you interested in receiving information on the following topics from your college or university?
Injury prevention
Male Female Unknown Total
Freq. Pct. Freq. Pct. Freq. Pct. Freq. Pct.
1 No 2166 56 4114 58 35 65 6,485 57.1
2 Yes 1676 44 3040 43 19 35 4,874 42.9
Valid responses = 3842 34 7154 63 54 0 11,359 98.3
Invalid responses include no response or multiple responses.
Page 4 of 60
Reference Group Data Report - Spring 2019
American College Health Association
8455 Colesville Road, Suite 740
Silver Spring, MD 20910 FREQUENCY REPORT
(410) 859-1500 Number of Surveys (n) = 11561 P & W Surveys
www.acha.org
American College Health Association-National College Health Assessment (ACHA-NCHA-II)
Graduate Students
August 19, 2019
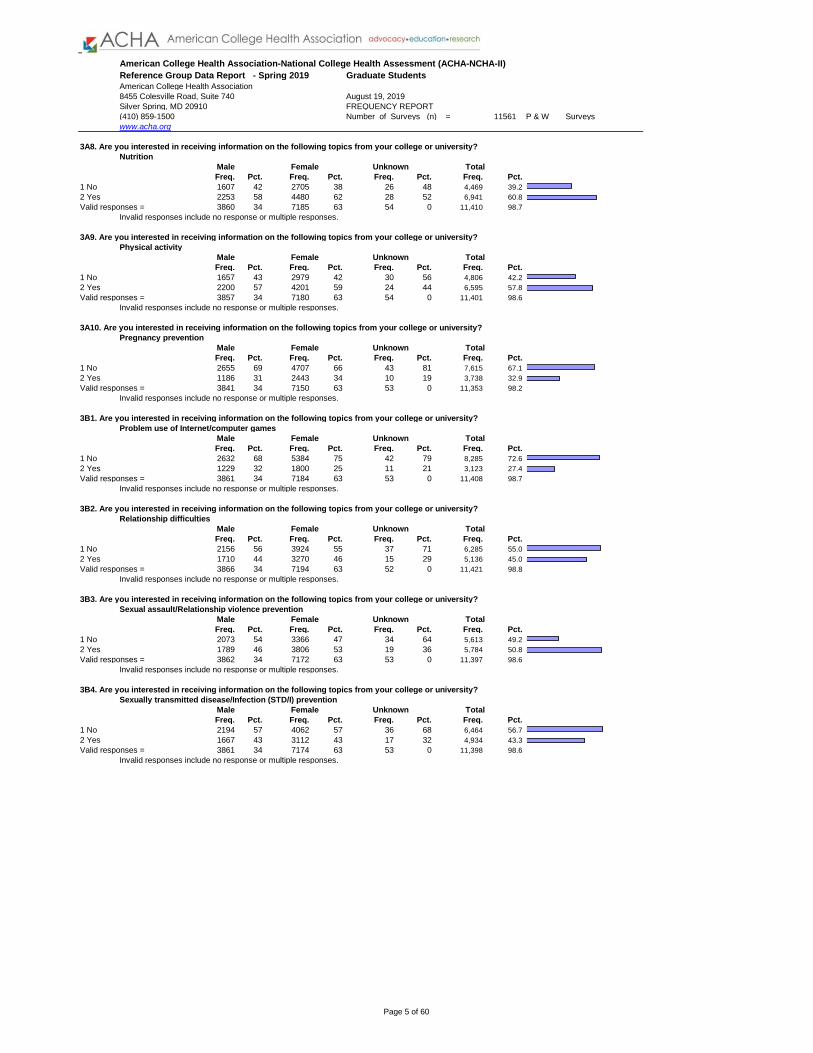
3A8. Are you interested in receiving information on the following topics from your college or university?
Nutrition
Male Female Unknown Total
Freq. Pct. Freq. Pct. Freq. Pct. Freq. Pct.
1 No 1607 42 2705 38 26 48 4,469 39.2
2 Yes 2253 58 4480 62 28 52 6,941 60.8
Valid responses = 3860 34 7185 63 54 0 11,410 98.7
Invalid responses include no response or multiple responses.
3A9. Are you interested in receiving information on the following topics from your college or university?
Physical activity
Male Female Unknown Total
Freq. Pct. Freq. Pct. Freq. Pct. Freq. Pct.
1 No 1657 43 2979 42 30 56 4,806 42.2
2 Yes 2200 57 4201 59 24 44 6,595 57.8
Valid responses = 3857 34 7180 63 54 0 11,401 98.6
Invalid responses include no response or multiple responses.
3A10. Are you interested in receiving information on the following topics from your college or university?
Pregnancy prevention
Male Female Unknown Total
Freq. Pct. Freq. Pct. Freq. Pct. Freq. Pct.
1 No 2655 69 4707 66 43 81 7,615 67.1
2 Yes 1186 31 2443 34 10 19 3,738 32.9
Valid responses = 3841 34 7150 63 53 0 11,353 98.2
Invalid responses include no response or multiple responses.
3B1. Are you interested in receiving information on the following topics from your college or university?
Problem use of Internet/computer games
Male Female Unknown Total
Freq. Pct. Freq. Pct. Freq. Pct. Freq. Pct.
1 No 2632 68 5384 75 42 79 8,285 72.6
2 Yes 1229 32 1800 25 11 21 3,123 27.4
Valid responses = 3861 34 7184 63 53 0 11,408 98.7
Invalid responses include no response or multiple responses.
3B2. Are you interested in receiving information on the following topics from your college or university?
Relationship difficulties
Male Female Unknown Total
Freq. Pct. Freq. Pct. Freq. Pct. Freq. Pct.
1 No 2156 56 3924 55 37 71 6,285 55.0
2 Yes 1710 44 3270 46 15 29 5,136 45.0
Valid responses = 3866 34 7194 63 52 0 11,421 98.8
Invalid responses include no response or multiple responses.
3B3. Are you interested in receiving information on the following topics from your college or university?
Sexual assault/Relationship violence prevention
Male Female Unknown Total
Freq. Pct. Freq. Pct. Freq. Pct. Freq. Pct.
1 No 2073 54 3366 47 34 64 5,613 49.2
2 Yes 1789 46 3806 53 19 36 5,784 50.8
Valid responses = 3862 34 7172 63 53 0 11,397 98.6
Invalid responses include no response or multiple responses.
3B4. Are you interested in receiving information on the following topics from your college or university?
Sexually transmitted disease/Infection (STD/I) prevention
Male Female Unknown Total
Freq. Pct. Freq. Pct. Freq. Pct. Freq. Pct.
1 No 2194 57 4062 57 36 68 6,464 56.7
2 Yes 1667 43 3112 43 17 32 4,934 43.3
Valid responses = 3861 34 7174 63 53 0 11,398 98.6
Invalid responses include no response or multiple responses.
Page 5 of 60
Reference Group Data Report - Spring 2019
American College Health Association
8455 Colesville Road, Suite 740
Silver Spring, MD 20910 FREQUENCY REPORT
(410) 859-1500 Number of Surveys (n) = 11561 P & W Surveys
www.acha.org
American College Health Association-National College Health Assessment (ACHA-NCHA-II)
Graduate Students
August 19, 2019
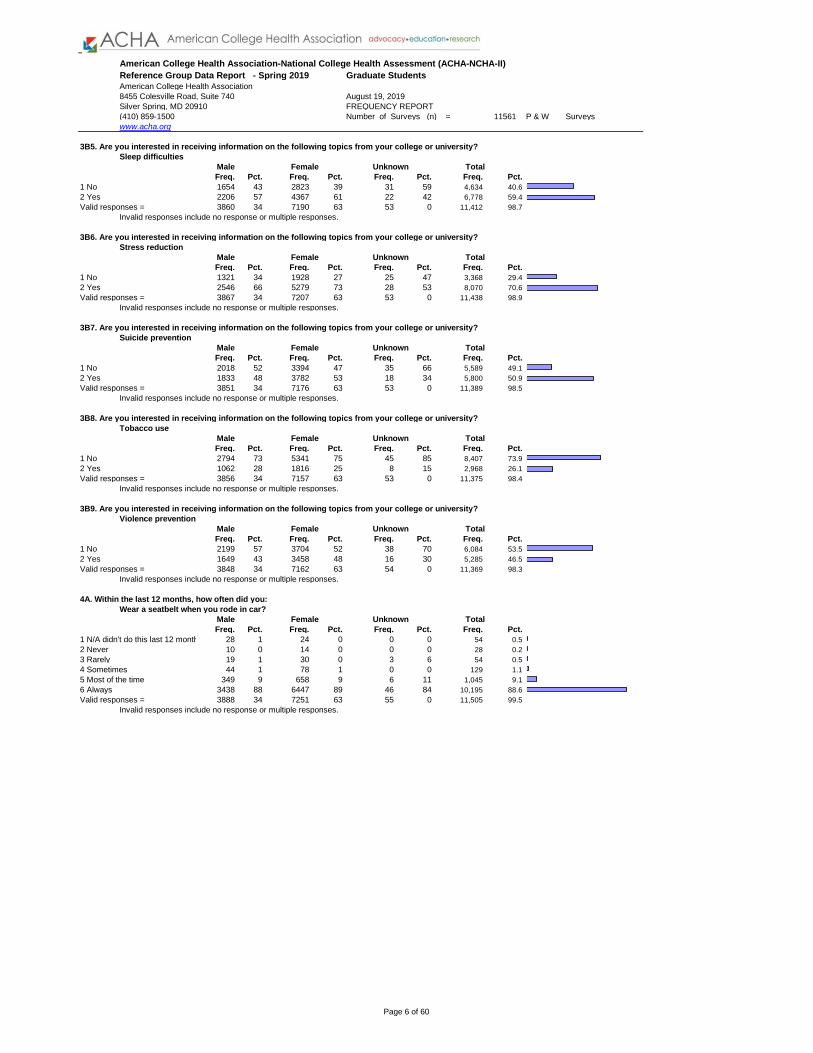
3B5. Are you interested in receiving information on the following topics from your college or university?
Sleep difficulties
Male Female Unknown Total
Freq. Pct. Freq. Pct. Freq. Pct. Freq. Pct.
1 No 1654 43 2823 39 31 59 4,634 40.6
2 Yes 2206 57 4367 61 22 42 6,778 59.4
Valid responses = 3860 34 7190 63 53 0 11,412 98.7
Invalid responses include no response or multiple responses.
3B6. Are you interested in receiving information on the following topics from your college or university?
Stress reduction
Male Female Unknown Total
Freq. Pct. Freq. Pct. Freq. Pct. Freq. Pct.
1 No 1321 34 1928 27 25 47 3,368 29.4
2 Yes 2546 66 5279 73 28 53 8,070 70.6
Valid responses = 3867 34 7207 63 53 0 11,438 98.9
Invalid responses include no response or multiple responses.
3B7. Are you interested in receiving information on the following topics from your college or university?
Suicide prevention
Male Female Unknown Total
Freq. Pct. Freq. Pct. Freq. Pct. Freq. Pct.
1 No 2018 52 3394 47 35 66 5,589 49.1
2 Yes 1833 48 3782 53 18 34 5,800 50.9
Valid responses = 3851 34 7176 63 53 0 11,389 98.5
Invalid responses include no response or multiple responses.
3B8. Are you interested in receiving information on the following topics from your college or university?
Tobacco use
Male Female Unknown Total
Freq. Pct. Freq. Pct. Freq. Pct. Freq. Pct.
1 No 2794 73 5341 75 45 85 8,407 73.9
2 Yes 1062 28 1816 25 8 15 2,968 26.1
Valid responses = 3856 34 7157 63 53 0 11,375 98.4
Invalid responses include no response or multiple responses.
3B9. Are you interested in receiving information on the following topics from your college or university?
Violence prevention
Male Female Unknown Total
Freq. Pct. Freq. Pct. Freq. Pct. Freq. Pct.
1 No 2199 57 3704 52 38 70 6,084 53.5
2 Yes 1649 43 3458 48 16 30 5,285 46.5
Valid responses = 3848 34 7162 63 54 0 11,369 98.3
Invalid responses include no response or multiple responses.
4A. Within the last 12 months, how often did you:
Wear a seatbelt when you rode in car?
Male Female Unknown Total
Freq. Pct. Freq. Pct. Freq. Pct. Freq. Pct.
1 N/A didn't do this last 12 months 28 1 24 0 0 0 54 0.5
2 Never 10 0 14 0 0 0 28 0.2
3 Rarely 19 1 30 0 3 6 54 0.5
4 Sometimes 44 1 78 1 0 0 129 1.1
5 Most of the time 349 9 658 9 6 11 1,045 9.1
6 Always 3438 88 6447 89 46 84 10,195 88.6
Valid responses = 3888 34 7251 63 55 0 11,505 99.5
Invalid responses include no response or multiple responses.
Page 6 of 60

Reference Group Data Report - Spring 2019
American College Health Association
8455 Colesville Road, Suite 740
Silver Spring, MD 20910 FREQUENCY REPORT
(410) 859-1500 Number of Surveys (n) = 11561 P & W Surveys
www.acha.org
American College Health Association-National College Health Assessment (ACHA-NCHA-II)
Graduate Students
August 19, 2019
4B. Within the last 12 months, how often did you:
Wear a helmet when you rode a bicycle?
Male Female Unknown Total
Freq. Pct. Freq. Pct. Freq. Pct. Freq. Pct.
1 N/A didn't do this last 12 months 1541 40 3610 50 27 52 5,317 46.3
2 Never 639 17 734 10 5 10 1,410 12.3
3 Rarely 223 6 377 5 2 4 608 5.3
4 Sometimes 230 6 304 4 4 8 549 4.8
5 Most of the time 302 8 495 7 3 6 826 7.2
6 Always 948 24 1722 24 11 21 2,778 24.2
Valid responses = 3883 34 7242 63 52 0 11,488 99.4
Invalid responses include no response or multiple responses.
4C. Within the last 12 months, how often did you:
Wear a helmet when you rode a motorcycle?
Male Female Unknown Total
Freq. Pct. Freq. Pct. Freq. Pct. Freq. Pct.
1 N/A didn't do this last 12 months 3333 86 6439 89 43 80 10,083 87.8
2 Never 39 1 43 1 1 2 86 0.7
3 Rarely 17 0 28 0 0 0 46 0.4
4 Sometimes 25 1 33 1 0 0 58 0.5
5 Most of the time 49 1 44 1 2 4 96 0.8
6 Always 416 11 652 9 8 15 1,114 9.7
Valid responses = 3879 34 7239 63 54 0 11,483 99.3
Invalid responses include no response or multiple responses.
4D. Within the last 12 months, how often did you:
Wear a helmet when you were inline skating?
Male Female Unknown Total
Freq. Pct. Freq. Pct. Freq. Pct. Freq. Pct.
1 N/A didn't do this last 12 months 3413 88 6497 90 41 76 10,219 89.0
2 Never 142 4 305 4 2 4 466 4.1
3 Rarely 37 1 58 1 0 0 99 0.9
4 Sometimes 34 1 50 1 2 4 88 0.8
5 Most of the time 32 1 33 1 3 6 69 0.6
6 Always 218 6 297 4 6 11 540 4.7
Valid responses = 3876 34 7240 63 54 0 11,481 99.3
Invalid responses include no response or multiple responses.
5A. Within the last 12 months:
Were you in a physical fight?
Male Female Unknown Total
Freq. Pct. Freq. Pct. Freq. Pct. Freq. Pct.
1 No 3792 98 7156 99 54 100 11,298 98.3
2 Yes 92 2 86 1 0 0 193 1.7
Valid responses = 3884 34 7242 63 54 0 11,491 99.4
Invalid responses include no response or multiple responses.
5B. Within the last 12 months:
Were you physically assaulted (do not include sexual assault)?
Male Female Unknown Total
Freq. Pct. Freq. Pct. Freq. Pct. Freq. Pct.
1 No 3821 98 7109 98 52 96 11,278 98.0
2 Yes 69 2 145 2 2 4 232 2.0
Valid responses = 3890 34 7254 63 54 0 11,510 99.6
Invalid responses include no response or multiple responses.
Page 7 of 60

Reference Group Data Report - Spring 2019
American College Health Association
8455 Colesville Road, Suite 740
Silver Spring, MD 20910 FREQUENCY REPORT
(410) 859-1500 Number of Surveys (n) = 11561 P & W Surveys
www.acha.org
American College Health Association-National College Health Assessment (ACHA-NCHA-II)
Graduate Students
August 19, 2019
5C.Within the last 12 months:
Were you verbally threatened?
Male Female Unknown Total
Freq. Pct. Freq. Pct. Freq. Pct. Freq. Pct.
1 No 3382 87 6351 88 46 87 10,004 87.0
2 Yes 504 13 898 12 7 13 1,495 13.0
Valid responses = 3886 34 7249 63 53 0 11,499 99.5
Invalid responses include no response or multiple responses.
5D. Within the last 12 months:
Were you sexually touched without your consent?
Male Female Unknown Total
Freq. Pct. Freq. Pct. Freq. Pct. Freq. Pct.
1 No 3766 97 6697 92 49 93 10,783 93.8
2 Yes 120 3 549 8 4 8 712 6.2
Valid responses = 3886 34 7246 63 53 0 11,495 99.4
Invalid responses include no response or multiple responses.
5E. Within the last 12 months:
Was sexual penetration attempted (vaginal, anal, oral) without your consent?
Male Female Unknown Total
Freq. Pct. Freq. Pct. Freq. Pct. Freq. Pct.
1 No 3860 99 7062 97 53 100 11,272 98.0
2 Yes 30 1 188 3 0 0 232 2.0
Valid responses = 3890 34 7250 63 53 0 11,504 99.5
Invalid responses include no response or multiple responses.
5F. Within the last 12 months:
Were you sexually penetrated (vaginal, anal, oral) without your consent?
Male Female Unknown Total
Freq. Pct. Freq. Pct. Freq. Pct. Freq. Pct.
1 No 3873 100 7117 98 51 98 11,345 98.6
2 Yes 15 0 135 2 1 2 158 1.4
Valid responses = 3888 34 7252 63 52 0 11,503 99.5
Invalid responses include no response or multiple responses.
5G. Within the last 12 months:
Were you a victim of stalking (e.g., waiting for you outside your classroom, residence hall, or office:
repeated emails/phone calls)?
Male Female Unknown Total
Freq. Pct. Freq. Pct. Freq. Pct. Freq. Pct.
1 No 3813 98 6930 96 51 96 11,079 96.4
2 Yes 70 2 321 4 2 4 418 3.6
Valid responses = 3883 34 7251 63 53 0 11,497 99.4
Invalid responses include no response or multiple responses.
6A. Within the last 12 months, have you been in an intimate (coupled/partnered) relationship that was:
Emotionally abusive? (e.g., called derogatory names, yelled at, ridiculed)
Male Female Unknown Total
Freq. Pct. Freq. Pct. Freq. Pct. Freq. Pct.
1 No 3670 95 6680 92 51 94 10,661 92.7
2 Yes 212 6 572 8 3 6 839 7.3
Valid responses = 3882 34 7252 63 54 0 11,500 99.5
Invalid responses include no response or multiple responses.
6B. Within the last 12 months, have you been in an intimate (coupled / partnered) relationship that was:
Physically abusive? (e.g., kicked, slapped, punched)
Male Female Unknown Total
Freq. Pct. Freq. Pct. Freq. Pct. Freq. Pct.
1 No 3837 99 7166 99 53 98 11,362 98.8
2 Yes 45 1 82 1 1 2 134 1.2
Valid responses = 3882 34 7248 63 54 0 11,496 99.4
Invalid responses include no response or multiple responses.
Page 8 of 60
Reference Group Data Report - Spring 2019
American College Health Association
8455 Colesville Road, Suite 740
Silver Spring, MD 20910 FREQUENCY REPORT
(410) 859-1500 Number of Surveys (n) = 11561 P & W Surveys
www.acha.org
American College Health Association-National College Health Assessment (ACHA-NCHA-II)
Graduate Students
August 19, 2019
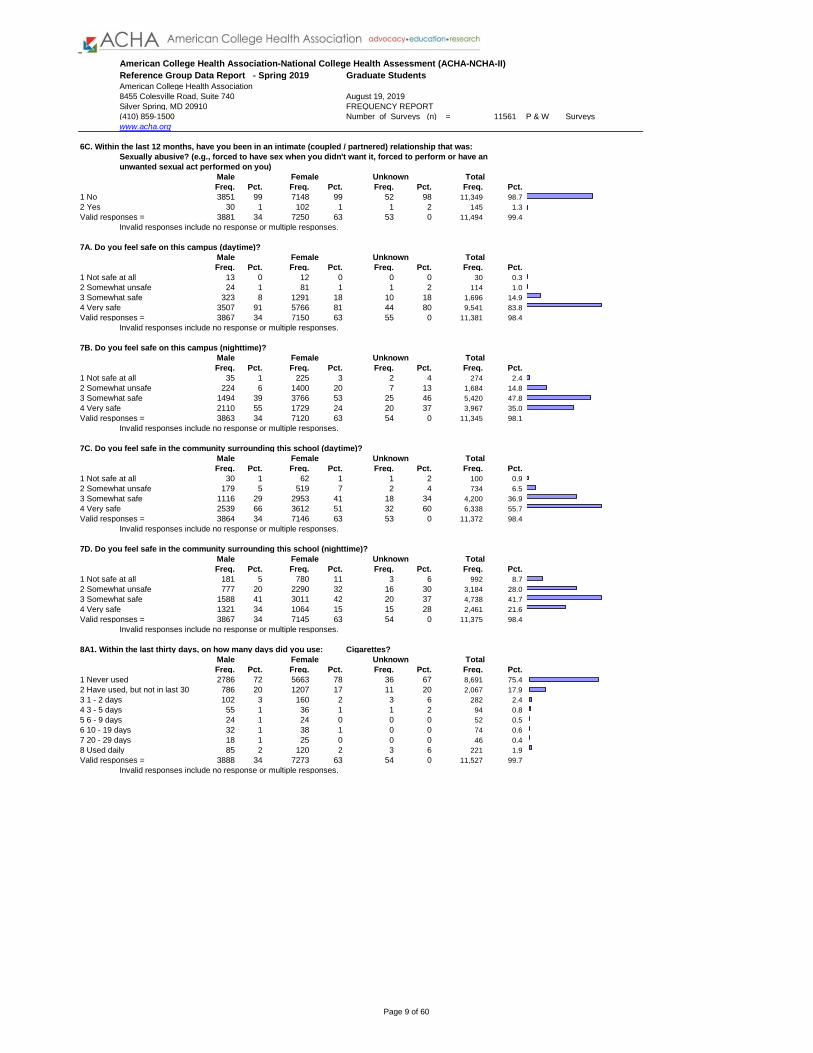
6C. Within the last 12 months, have you been in an intimate (coupled / partnered) relationship that was:
Sexually abusive? (e.g., forced to have sex when you didn't want it, forced to perform or have an
unwanted sexual act performed on you)
Male Female Unknown Total
Freq. Pct. Freq. Pct. Freq. Pct. Freq. Pct.
1 No 3851 99 7148 99 52 98 11,349 98.7
2 Yes 30 1 102 1 1 2 145 1.3
Valid responses = 3881 34 7250 63 53 0 11,494 99.4
Invalid responses include no response or multiple responses.
7A. Do you feel safe on this campus (daytime)?
Male Female Unknown Total
Freq. Pct. Freq. Pct. Freq. Pct. Freq. Pct.
1 Not safe at all 13 0 12 0 0 0 30 0.3
2 Somewhat unsafe 24 1 81 1 1 2 114 1.0
3 Somewhat safe 323 8 1291 18 10 18 1,696 14.9
4 Very safe 3507 91 5766 81 44 80 9,541 83.8
Valid responses = 3867 34 7150 63 55 0 11,381 98.4
Invalid responses include no response or multiple responses.
7B. Do you feel safe on this campus (nighttime)?
Male Female Unknown Total
Freq. Pct. Freq. Pct. Freq. Pct. Freq. Pct.
1 Not safe at all 35 1 225 3 2 4 274 2.4
2 Somewhat unsafe 224 6 1400 20 7 13 1,684 14.8
3 Somewhat safe 1494 39 3766 53 25 46 5,420 47.8
4 Very safe 2110 55 1729 24 20 37 3,967 35.0
Valid responses = 3863 34 7120 63 54 0 11,345 98.1
Invalid responses include no response or multiple responses.
7C. Do you feel safe in the community surrounding this school (daytime)?
Male Female Unknown Total
Freq. Pct. Freq. Pct. Freq. Pct. Freq. Pct.
1 Not safe at all 30 1 62 1 1 2 100 0.9
2 Somewhat unsafe 179 5 519 7 2 4 734 6.5
3 Somewhat safe 1116 29 2953 41 18 34 4,200 36.9
4 Very safe 2539 66 3612 51 32 60 6,338 55.7
Valid responses = 3864 34 7146 63 53 0 11,372 98.4
Invalid responses include no response or multiple responses.
7D. Do you feel safe in the community surrounding this school (nighttime)?
Male Female Unknown Total
Freq. Pct. Freq. Pct. Freq. Pct. Freq. Pct.
1 Not safe at all 181 5 780 11 3 6 992 8.7
2 Somewhat unsafe 777 20 2290 32 16 30 3,184 28.0
3 Somewhat safe 1588 41 3011 42 20 37 4,738 41.7
4 Very safe 1321 34 1064 15 15 28 2,461 21.6
Valid responses = 3867 34 7145 63 54 0 11,375 98.4
Invalid responses include no response or multiple responses.
8A1. Within the last thirty days, on how many days did you use: Cigarettes?
Male Female Unknown Total
Freq. Pct. Freq. Pct. Freq. Pct. Freq. Pct.
1 Never used 2786 72 5663 78 36 67 8,691 75.4
2 Have used, but not in last 30 786 20 1207 17 11 20 2,067 17.9
3 1 - 2 days 102 3 160 2 3 6 282 2.4
4 3 - 5 days 55 1 36 1 1 2 94 0.8
5 6 - 9 days 24 1 24 0 0 0 52 0.5
6 10 - 19 days 32 1 38 1 0 0 74 0.6
7 20 - 29 days 18 1 25 0 0 0 46 0.4
8 Used daily 85 2 120 2 3 6 221 1.9
Valid responses = 3888 34 7273 63 54 0 11,527 99.7
Invalid responses include no response or multiple responses.
Page 9 of 60
Reference Group Data Report - Spring 2019
American College Health Association
8455 Colesville Road, Suite 740
Silver Spring, MD 20910 FREQUENCY REPORT
(410) 859-1500 Number of Surveys (n) = 11561 P & W Surveys
www.acha.org
American College Health Association-National College Health Assessment (ACHA-NCHA-II)
Graduate Students
August 19, 2019
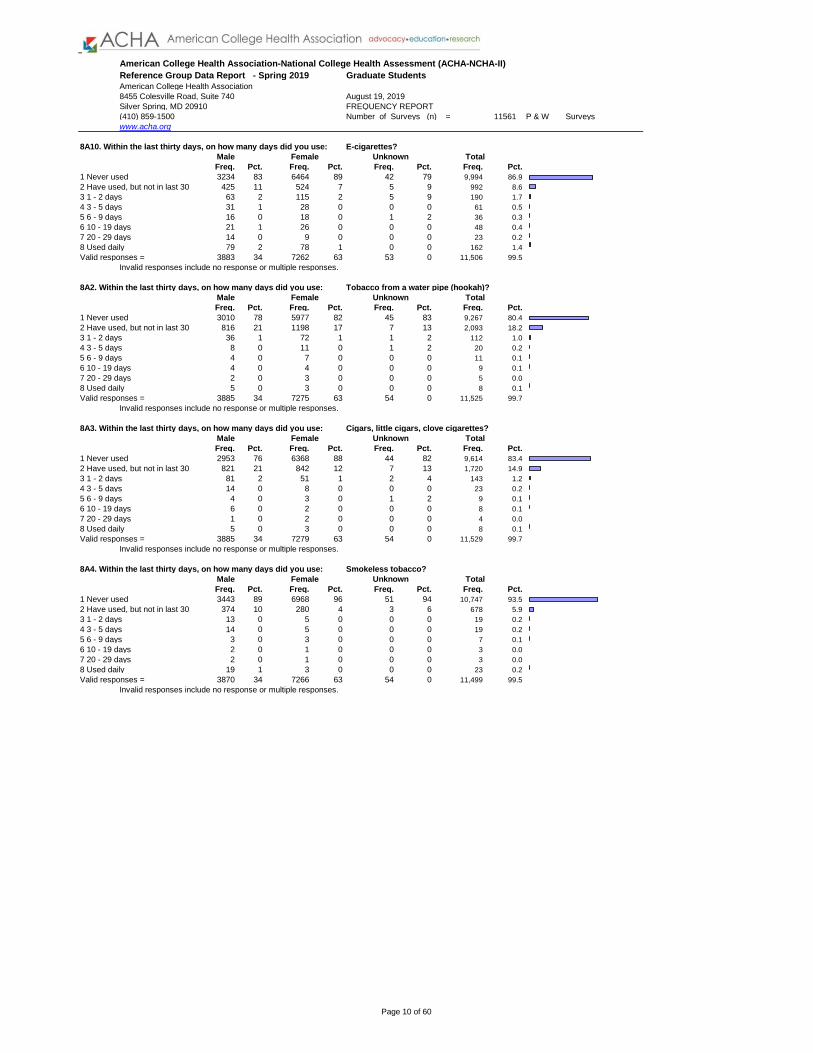
8A10. Within the last thirty days, on how many days did you use: E-cigarettes?
Male Female Unknown Total
Freq. Pct. Freq. Pct. Freq. Pct. Freq. Pct.
1 Never used 3234 83 6464 89 42 79 9,994 86.9
2 Have used, but not in last 30 425 11 524 7 5 9 992 8.6
3 1 - 2 days 63 2 115 2 5 9 190 1.7
4 3 - 5 days 31 1 28 0 0 0 61 0.5
5 6 - 9 days 16 0 18 0 1 2 36 0.3
6 10 - 19 days 21 1 26 0 0 0 48 0.4
7 20 - 29 days 14 0 9 0 0 0 23 0.2
8 Used daily 79 2 78 1 0 0 162 1.4
Valid responses = 3883 34 7262 63 53 0 11,506 99.5
Invalid responses include no response or multiple responses.
8A2. Within the last thirty days, on how many days did you use: Tobacco from a water pipe (hookah)?
Male Female Unknown Total
Freq. Pct. Freq. Pct. Freq. Pct. Freq. Pct.
1 Never used 3010 78 5977 82 45 83 9,267 80.4
2 Have used, but not in last 30 816 21 1198 17 7 13 2,093 18.2
3 1 - 2 days 36 1 72 1 1 2 112 1.0
4 3 - 5 days 8 0 11 0 1 2 20 0.2
5 6 - 9 days 4 0 7 0 0 0 11 0.1
6 10 - 19 days 4 0 4 0 0 0 9 0.1
7 20 - 29 days 2 0 3 0 0 0 5 0.0
8 Used daily 5 0 3 0 0 0 8 0.1
Valid responses = 3885 34 7275 63 54 0 11,525 99.7
Invalid responses include no response or multiple responses.
8A3. Within the last thirty days, on how many days did you use: Cigars, little cigars, clove cigarettes?
Male Female Unknown Total
Freq. Pct. Freq. Pct. Freq. Pct. Freq. Pct.
1 Never used 2953 76 6368 88 44 82 9,614 83.4
2 Have used, but not in last 30 821 21 842 12 7 13 1,720 14.9
3 1 - 2 days 81 2 51 1 2 4 143 1.2
4 3 - 5 days 14 0 8 0 0 0 23 0.2
5 6 - 9 days 4 0 3 0 1 2 9 0.1
6 10 - 19 days 6 0 2 0 0 0 8 0.1
7 20 - 29 days 1 0 2 0 0 0 4 0.0
8 Used daily 5 0 3 0 0 0 8 0.1
Valid responses = 3885 34 7279 63 54 0 11,529 99.7
Invalid responses include no response or multiple responses.
8A4. Within the last thirty days, on how many days did you use: Smokeless tobacco?
Male Female Unknown Total
Freq. Pct. Freq. Pct. Freq. Pct. Freq. Pct.
1 Never used 3443 89 6968 96 51 94 10,747 93.5
2 Have used, but not in last 30 374 10 280 4 3 6 678 5.9
3 1 - 2 days 13 0 5 0 0 0 19 0.2
4 3 - 5 days 14 0 5 0 0 0 19 0.2
5 6 - 9 days 3 0 3 0 0 0 7 0.1
6 10 - 19 days 2 0 1 0 0 0 3 0.0
7 20 - 29 days 2 0 1 0 0 0 3 0.0
8 Used daily 19 1 3 0 0 0 23 0.2
Valid responses = 3870 34 7266 63 54 0 11,499 99.5
Invalid responses include no response or multiple responses.
Page 10 of 60

Reference Group Data Report - Spring 2019
American College Health Association
8455 Colesville Road, Suite 740
Silver Spring, MD 20910 FREQUENCY REPORT
(410) 859-1500 Number of Surveys (n) = 11561 P & W Surveys
www.acha.org
American College Health Association-National College Health Assessment (ACHA-NCHA-II)
Graduate Students
August 19, 2019
8A5. Within the last thirty days, on how many days did you use: Alcohol (beer, wine, liquor)?
Male Female Unknown Total
Freq. Pct. Freq. Pct. Freq. Pct. Freq. Pct.
1 Never used 722 19 861 12 11 21 1,641 14.2
2 Have used, but not in last 30 491 13 988 14 7 13 1,543 13.4
3 1 - 2 days 660 17 1559 21 11 21 2,291 19.9
4 3 - 5 days 664 17 1419 20 9 17 2,148 18.6
5 6 - 9 days 591 15 1166 16 7 13 1,800 15.6
6 10 - 19 days 512 13 895 12 5 9 1,443 12.5
7 20 - 29 days 165 4 296 4 3 6 480 4.2
8 Used daily 84 2 90 1 0 0 182 1.6
Valid responses = 3889 34 7274 63 53 0 11,528 99.7
Invalid responses include no response or multiple responses.
8A6. Within the last thirty days, on how many days did you use: Marijuana (pot, weed, hashish, hash oil)?
Male Female Unknown Total
Freq. Pct. Freq. Pct. Freq. Pct. Freq. Pct.
1 Never used 2327 60 4184 58 35 66 6,682 58.0
2 Have used, but not in last 30 868 22 1841 25 6 11 2,804 24.3
3 1 - 2 days 234 6 520 7 4 8 786 6.8
4 3 - 5 days 126 3 210 3 1 2 359 3.1
5 6 - 9 days 66 2 131 2 1 2 204 1.8
6 10 - 19 days 85 2 136 2 2 4 234 2.0
7 20 - 29 days 80 2 99 1 2 4 187 1.6
8 Used daily 98 3 152 2 2 4 266 2.3
Valid responses = 3884 34 7273 63 53 0 11,522 99.7
Invalid responses include no response or multiple responses.
8A7. Within the last thirty days, on how many days did you use: Cocaine (crack, rock, freebase)?
Male Female Unknown Total
Freq. Pct. Freq. Pct. Freq. Pct. Freq. Pct.
1 Never used 3526 91 6702 92 51 96 10,542 91.5
2 Have used, but not in last 30 311 8 495 7 2 4 848 7.4
3 1 - 2 days 34 1 43 1 0 0 83 0.7
4 3 - 5 days 9 0 19 0 0 0 30 0.3
5 6 - 9 days 2 0 6 0 0 0 8 0.1
6 10 - 19 days 0 0 4 0 0 0 5 0.0
7 20 - 29 days 1 0 2 0 0 0 3 0.0
8 Used daily 1 0 0 0 0 0 1 0.0
Valid responses = 3884 34 7271 63 53 0 11,520 99.6
Invalid responses include no response or multiple responses.
8A8. Within the last thirty days, on how many days did you use: Methamphetamine (crystal, meth, ice, crank)?
Male Female Unknown Total
Freq. Pct. Freq. Pct. Freq. Pct. Freq. Pct.
1 Never used 3795 98 7156 99 52 98 11,304 98.2
2 Have used, but not in last 30 86 2 102 1 1 2 196 1.7
3 1 - 2 days 1 0 2 0 0 0 6 0.1
4 3 - 5 days 1 0 5 0 0 0 6 0.1
5 6 - 9 days 0 0 0 0 0 0 1 0.0
6 10 - 19 days 0 0 0 0 0 0 0 0.0
7 20 - 29 days 1 0 0 0 0 0 1 0.0
8 Used daily 1 0 1 0 0 0 2 0.0
Valid responses = 3885 34 7266 63 53 0 11,516 99.6
Invalid responses include no response or multiple responses.
Page 11 of 60
Reference Group Data Report - Spring 2019
American College Health Association
8455 Colesville Road, Suite 740
Silver Spring, MD 20910 FREQUENCY REPORT
(410) 859-1500 Number of Surveys (n) = 11561 P & W Surveys
www.acha.org
American College Health Association-National College Health Assessment (ACHA-NCHA-II)
Graduate Students
August 19, 2019
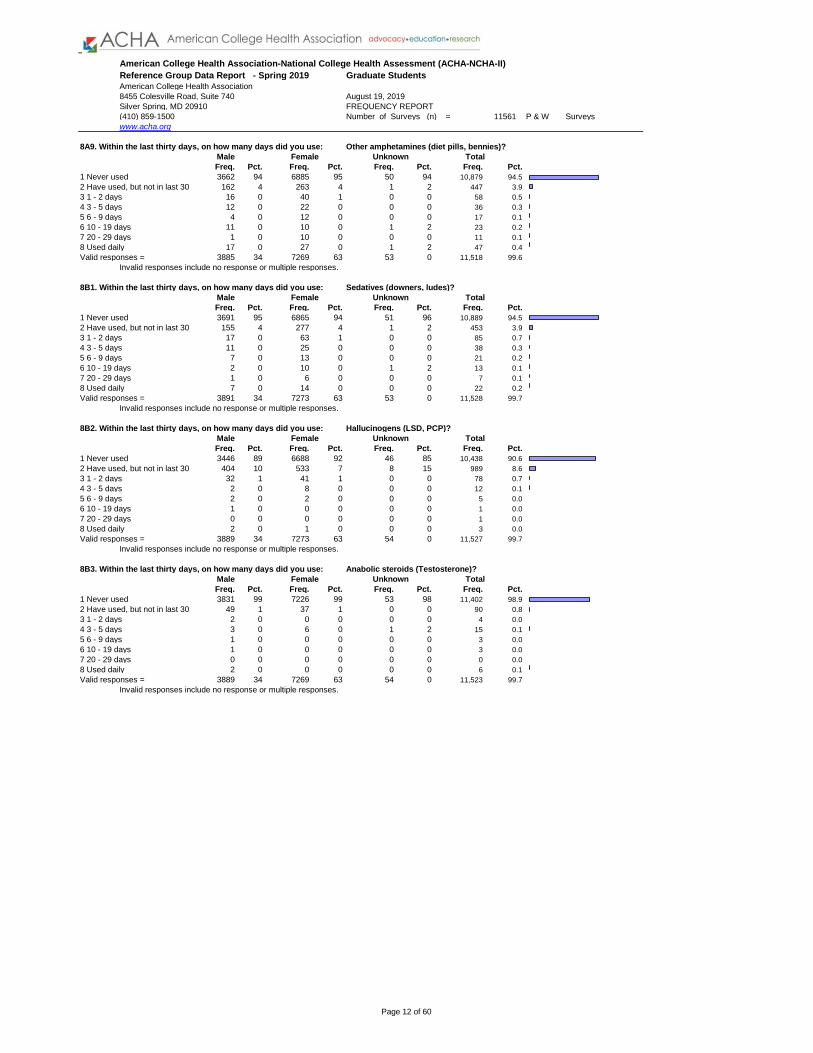
8A9. Within the last thirty days, on how many days did you use: Other amphetamines (diet pills, bennies)?
Male Female Unknown Total
Freq. Pct. Freq. Pct. Freq. Pct. Freq. Pct.
1 Never used 3662 94 6885 95 50 94 10,879 94.5
2 Have used, but not in last 30 162 4 263 4 1 2 447 3.9
3 1 - 2 days 16 0 40 1 0 0 58 0.5
4 3 - 5 days 12 0 22 0 0 0 36 0.3
5 6 - 9 days 4 0 12 0 0 0 17 0.1
6 10 - 19 days 11 0 10 0 1 2 23 0.2
7 20 - 29 days 1 0 10 0 0 0 11 0.1
8 Used daily 17 0 27 0 1 2 47 0.4
Valid responses = 3885 34 7269 63 53 0 11,518 99.6
Invalid responses include no response or multiple responses.
8B1. Within the last thirty days, on how many days did you use: Sedatives (downers, ludes)?
Male Female Unknown Total
Freq. Pct. Freq. Pct. Freq. Pct. Freq. Pct.
1 Never used 3691 95 6865 94 51 96 10,889 94.5
2 Have used, but not in last 30 155 4 277 4 1 2 453 3.9
3 1 - 2 days 17 0 63 1 0 0 85 0.7
4 3 - 5 days 11 0 25 0 0 0 38 0.3
5 6 - 9 days 7 0 13 0 0 0 21 0.2
6 10 - 19 days 2 0 10 0 1 2 13 0.1
7 20 - 29 days 1 0 6 0 0 0 7 0.1
8 Used daily 7 0 14 0 0 0 22 0.2
Valid responses = 3891 34 7273 63 53 0 11,528 99.7
Invalid responses include no response or multiple responses.
8B2. Within the last thirty days, on how many days did you use: Hallucinogens (LSD, PCP)?
Male Female Unknown Total
Freq. Pct. Freq. Pct. Freq. Pct. Freq. Pct.
1 Never used 3446 89 6688 92 46 85 10,438 90.6
2 Have used, but not in last 30 404 10 533 7 8 15 989 8.6
3 1 - 2 days 32 1 41 1 0 0 78 0.7
4 3 - 5 days 2 0 8 0 0 0 12 0.1
5 6 - 9 days 2 0 2 0 0 0 5 0.0
6 10 - 19 days 1 0 0 0 0 0 1 0.0
7 20 - 29 days 0 0 0 0 0 0 1 0.0
8 Used daily 2 0 1 0 0 0 3 0.0
Valid responses = 3889 34 7273 63 54 0 11,527 99.7
Invalid responses include no response or multiple responses.
8B3. Within the last thirty days, on how many days did you use: Anabolic steroids (Testosterone)?
Male Female Unknown Total
Freq. Pct. Freq. Pct. Freq. Pct. Freq. Pct.
1 Never used 3831 99 7226 99 53 98 11,402 98.9
2 Have used, but not in last 30 49 1 37 1 0 0 90 0.8
3 1 - 2 days 2 0 0 0 0 0 4 0.0
4 3 - 5 days 3 0 6 0 1 2 15 0.1
5 6 - 9 days 1 0 0 0 0 0 3 0.0
6 10 - 19 days 1 0 0 0 0 0 3 0.0
7 20 - 29 days 0 0 0 0 0 0 0 0.0
8 Used daily 2 0 0 0 0 0 6 0.1
Valid responses = 3889 34 7269 63 54 0 11,523 99.7
Invalid responses include no response or multiple responses.
Page 12 of 60

Reference Group Data Report - Spring 2019
American College Health Association
8455 Colesville Road, Suite 740
Silver Spring, MD 20910 FREQUENCY REPORT
(410) 859-1500 Number of Surveys (n) = 11561 P & W Surveys
www.acha.org
American College Health Association-National College Health Assessment (ACHA-NCHA-II)
Graduate Students
August 19, 2019
8B4. Within the last thirty days, on how many days did you use: Opiates (heroin, smack)?
Male Female Unknown Total
Freq. Pct. Freq. Pct. Freq. Pct. Freq. Pct.
1 Never used 3778 97 7159 99 53 98 11,287 98.0
2 Have used, but not in last 30 102 3 100 1 0 0 210 1.8
3 1 - 2 days 4 0 1 0 0 0 8 0.1
4 3 - 5 days 2 0 6 0 0 0 9 0.1
5 6 - 9 days 1 0 0 0 0 0 1 0.0
6 10 - 19 days 0 0 0 0 1 2 2 0.0
7 20 - 29 days 0 0 1 0 0 0 1 0.0
8 Used daily 1 0 1 0 0 0 2 0.0
Valid responses = 3888 34 7268 63 54 0 11,520 99.6
Invalid responses include no response or multiple responses.
8B5.. Within the last thirty days, on how many days did you use: Inhalants (glue, solvents, gas)?
Male Female Unknown Total
Freq. Pct. Freq. Pct. Freq. Pct. Freq. Pct.
1 Never used 3777 97 7155 98 52 98 11,273 97.8
2 Have used, but not in last 30 90 2 105 1 1 2 213 1.8
3 1 - 2 days 7 0 8 0 0 0 17 0.1
4 3 - 5 days 7 0 6 0 0 0 13 0.1
5 6 - 9 days 2 0 2 0 0 0 5 0.0
6 10 - 19 days 0 0 0 0 0 0 0 0.0
7 20 - 29 days 0 0 0 0 0 0 1 0.0
8 Used daily 2 0 0 0 0 0 3 0.0
Valid responses = 3885 34 7276 63 53 0 11,525 99.7
Invalid responses include no response or multiple responses.
8B6. Within the last thirty days, on how many days did you use: MDMA (Ecstasy)?
Male Female Unknown Total
Freq. Pct. Freq. Pct. Freq. Pct. Freq. Pct.
1 Never used 3507 90 6628 91 51 96 10,437 90.6
2 Have used, but not in last 30 341 9 604 8 2 4 998 8.7
3 1 - 2 days 27 1 26 0 0 0 58 0.5
4 3 - 5 days 5 0 9 0 0 0 16 0.1
5 6 - 9 days 1 0 1 0 0 0 2 0.0
6 10 - 19 days 0 0 1 0 0 0 3 0.0
7 20 - 29 days 0 0 0 0 0 0 0 0.0
8 Used daily 2 0 0 0 0 0 2 0.0
Valid responses = 3883 34 7269 63 53 0 11,516 99.6
Invalid responses include no response or multiple responses.
8B7. Within the last thirty days, on how many days did you use: Other club drugs (GHB, Ketamine, Rohypnol)?
Male Female Unknown Total
Freq. Pct. Freq. Pct. Freq. Pct. Freq. Pct.
1 Never used 3762 97 7108 98 53 100 11,214 97.3
2 Have used, but not in last 30 109 3 154 2 0 0 276 2.4
3 1 - 2 days 8 0 4 0 0 0 15 0.1
4 3 - 5 days 2 0 4 0 0 0 8 0.1
5 6 - 9 days 3 0 1 0 0 0 4 0.0
6 10 - 19 days 0 0 0 0 0 0 1 0.0
7 20 - 29 days 0 0 0 0 0 0 1 0.0
8 Used daily 2 0 1 0 0 0 3 0.0
Valid responses = 3886 34 7272 63 53 0 11,522 99.7
Invalid responses include no response or multiple responses.
Page 13 of 60

Reference Group Data Report - Spring 2019
American College Health Association
8455 Colesville Road, Suite 740
Silver Spring, MD 20910 FREQUENCY REPORT
(410) 859-1500 Number of Surveys (n) = 11561 P & W Surveys
www.acha.org
American College Health Association-National College Health Assessment (ACHA-NCHA-II)
Graduate Students
August 19, 2019
8B8. Within the last thirty days, on how many days did you use: Other illegal drugs?
Male Female Unknown Total
Freq. Pct. Freq. Pct. Freq. Pct. Freq. Pct.
1 Never used 3673 95 6995 96 52 98 11,001 95.5
2 Have used, but not in last 30 192 5 254 4 1 2 474 4.1
3 1 - 2 days 9 0 8 0 0 0 17 0.1
4 3 - 5 days 1 0 9 0 0 0 11 0.1
5 6 - 9 days 2 0 0 0 0 0 3 0.0
6 10 - 19 days 1 0 1 0 0 0 2 0.0
7 20 - 29 days 1 0 1 0 0 0 2 0.0
8 Used daily 1 0 2 0 0 0 4 0.0
Valid responses = 3880 34 7270 63 53 0 11,514 99.6
Invalid responses include no response or multiple responses.
9A1. Within the last thirty days, how often do you think the typical student at your school used:
Cigarettes?
Male Female Unknown Total
Freq. Pct. Freq. Pct. Freq. Pct. Freq. Pct.
1 Never used 693 18 924 13 9 18 1,677 14.8
2 Have used, but not in last 30 814 21 1324 19 11 22 2,202 19.4
3 1 - 2 days 753 20 1284 18 7 14 2,094 18.5
4 3 - 5 days 607 16 1094 15 7 14 1,769 15.6
5 6 - 9 days 391 10 877 12 5 10 1,307 11.5
6 10 - 19 days 289 8 782 11 4 8 1,101 9.7
7 20 - 29 days 84 2 248 4 2 4 341 3.0
8 Used daily 213 6 616 9 5 10 856 7.5
Valid responses = 3844 34 7149 63 50 0 11,347 98.1
Invalid responses include no response or multiple responses.
9A10. Within the last thirty days, how often do you think the typical student at your school used:
E-cigarettes?
Male Female Unknown Total
Freq. Pct. Freq. Pct. Freq. Pct. Freq. Pct.
1 Never used 659 17 851 12 8 16 1,566 13.8
2 Have used, but not in last 30 533 14 765 11 8 16 1,338 11.8
3 1 - 2 days 530 14 1051 15 4 8 1,629 14.4
4 3 - 5 days 596 16 1029 14 8 16 1,684 14.9
5 6 - 9 days 490 13 939 13 9 18 1,484 13.1
6 10 - 19 days 495 13 1136 16 4 8 1,675 14.8
7 20 - 29 days 211 6 491 7 2 4 717 6.3
8 Used daily 317 8 865 12 7 14 1,218 10.8
Valid responses = 3831 34 7127 63 50 0 11,311 97.8
Invalid responses include no response or multiple responses.
9A2. Within the last thirty days, how often do you think the typical student at your school used:
Tobacco from a water pipe (hookah)?
Male Female Unknown Total
Freq. Pct. Freq. Pct. Freq. Pct. Freq. Pct.
1 Never used 989 26 1332 19 14 28 2,408 21.3
2 Have used, but not in last 30 1015 27 1657 23 12 24 2,754 24.4
3 1 - 2 days 863 23 1682 24 10 20 2,627 23.2
4 3 - 5 days 456 12 1006 14 7 14 1,517 13.4
5 6 - 9 days 247 6 683 10 5 10 951 8.4
6 10 - 19 days 137 4 437 6 0 0 587 5.2
7 20 - 29 days 64 2 154 2 0 0 224 2.0
8 Used daily 60 2 167 2 2 4 236 2.1
Valid responses = 3831 34 7118 63 50 0 11,304 97.8
Invalid responses include no response or multiple responses.
Page 14 of 60
Reference Group Data Report - Spring 2019
American College Health Association
8455 Colesville Road, Suite 740
Silver Spring, MD 20910 FREQUENCY REPORT
(410) 859-1500 Number of Surveys (n) = 11561 P & W Surveys
www.acha.org
American College Health Association-National College Health Assessment (ACHA-NCHA-II)
Graduate Students
August 19, 2019
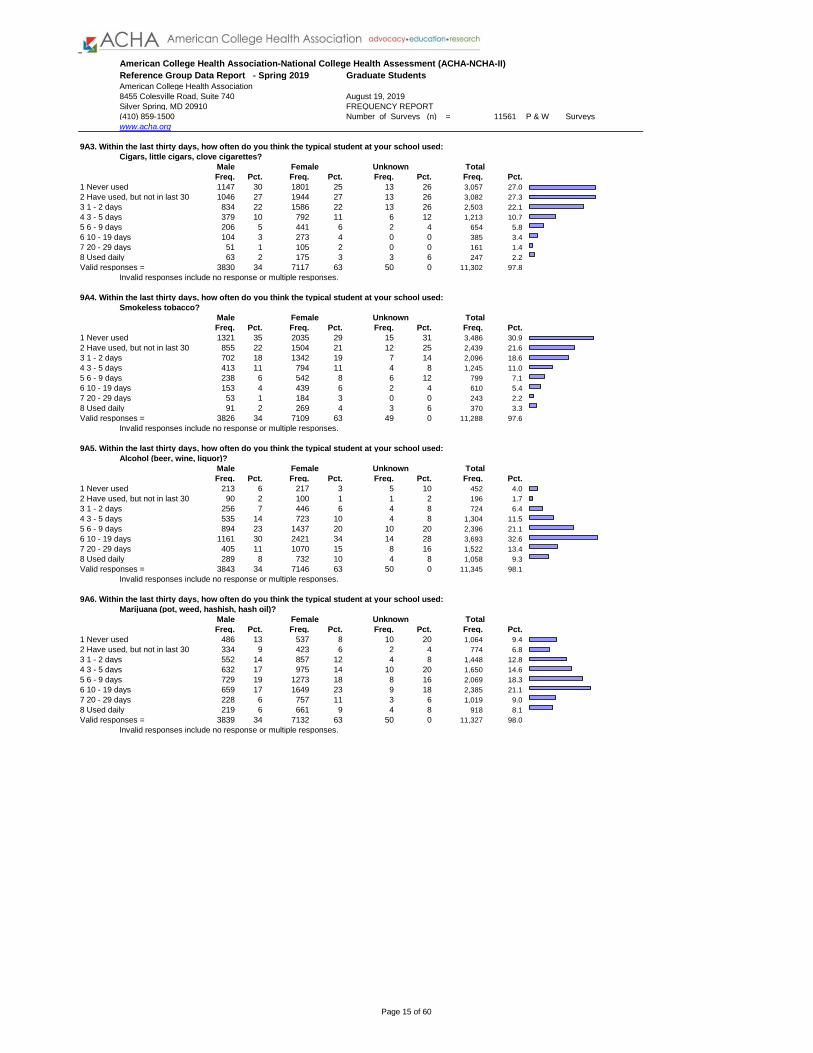
9A3. Within the last thirty days, how often do you think the typical student at your school used:
Cigars, little cigars, clove cigarettes?
Male Female Unknown Total
Freq. Pct. Freq. Pct. Freq. Pct. Freq. Pct.
1 Never used 1147 30 1801 25 13 26 3,057 27.0
2 Have used, but not in last 30 1046 27 1944 27 13 26 3,082 27.3
3 1 - 2 days 834 22 1586 22 13 26 2,503 22.1
4 3 - 5 days 379 10 792 11 6 12 1,213 10.7
5 6 - 9 days 206 5 441 6 2 4 654 5.8
6 10 - 19 days 104 3 273 4 0 0 385 3.4
7 20 - 29 days 51 1 105 2 0 0 161 1.4
8 Used daily 63 2 175 3 3 6 247 2.2
Valid responses = 3830 34 7117 63 50 0 11,302 97.8
Invalid responses include no response or multiple responses.
9A4. Within the last thirty days, how often do you think the typical student at your school used:
Smokeless tobacco?
Male Female Unknown Total
Freq. Pct. Freq. Pct. Freq. Pct. Freq. Pct.
1 Never used 1321 35 2035 29 15 31 3,486 30.9
2 Have used, but not in last 30 855 22 1504 21 12 25 2,439 21.6
3 1 - 2 days 702 18 1342 19 7 14 2,096 18.6
4 3 - 5 days 413 11 794 11 4 8 1,245 11.0
5 6 - 9 days 238 6 542 8 6 12 799 7.1
6 10 - 19 days 153 4 439 6 2 4 610 5.4
7 20 - 29 days 53 1 184 3 0 0 243 2.2
8 Used daily 91 2 269 4 3 6 370 3.3
Valid responses = 3826 34 7109 63 49 0 11,288 97.6
Invalid responses include no response or multiple responses.
9A5. Within the last thirty days, how often do you think the typical student at your school used:
Alcohol (beer, wine, liquor)?
Male Female Unknown Total
Freq. Pct. Freq. Pct. Freq. Pct. Freq. Pct.
1 Never used 213 6 217 3 5 10 452 4.0
2 Have used, but not in last 30 90 2 100 1 1 2 196 1.7
3 1 - 2 days 256 7 446 6 4 8 724 6.4
4 3 - 5 days 535 14 723 10 4 8 1,304 11.5
5 6 - 9 days 894 23 1437 20 10 20 2,396 21.1
6 10 - 19 days 1161 30 2421 34 14 28 3,693 32.6
7 20 - 29 days 405 11 1070 15 8 16 1,522 13.4
8 Used daily 289 8 732 10 4 8 1,058 9.3
Valid responses = 3843 34 7146 63 50 0 11,345 98.1
Invalid responses include no response or multiple responses.
9A6. Within the last thirty days, how often do you think the typical student at your school used:
Marijuana (pot, weed, hashish, hash oil)?
Male Female Unknown Total
Freq. Pct. Freq. Pct. Freq. Pct. Freq. Pct.
1 Never used 486 13 537 8 10 20 1,064 9.4
2 Have used, but not in last 30 334 9 423 6 2 4 774 6.8
3 1 - 2 days 552 14 857 12 4 8 1,448 12.8
4 3 - 5 days 632 17 975 14 10 20 1,650 14.6
5 6 - 9 days 729 19 1273 18 8 16 2,069 18.3
6 10 - 19 days 659 17 1649 23 9 18 2,385 21.1
7 20 - 29 days 228 6 757 11 3 6 1,019 9.0
8 Used daily 219 6 661 9 4 8 918 8.1
Valid responses = 3839 34 7132 63 50 0 11,327 98.0
Invalid responses include no response or multiple responses.
Page 15 of 60
Reference Group Data Report - Spring 2019
American College Health Association
8455 Colesville Road, Suite 740
Silver Spring, MD 20910 FREQUENCY REPORT
(410) 859-1500 Number of Surveys (n) = 11561 P & W Surveys
www.acha.org
American College Health Association-National College Health Assessment (ACHA-NCHA-II)
Graduate Students
August 19, 2019
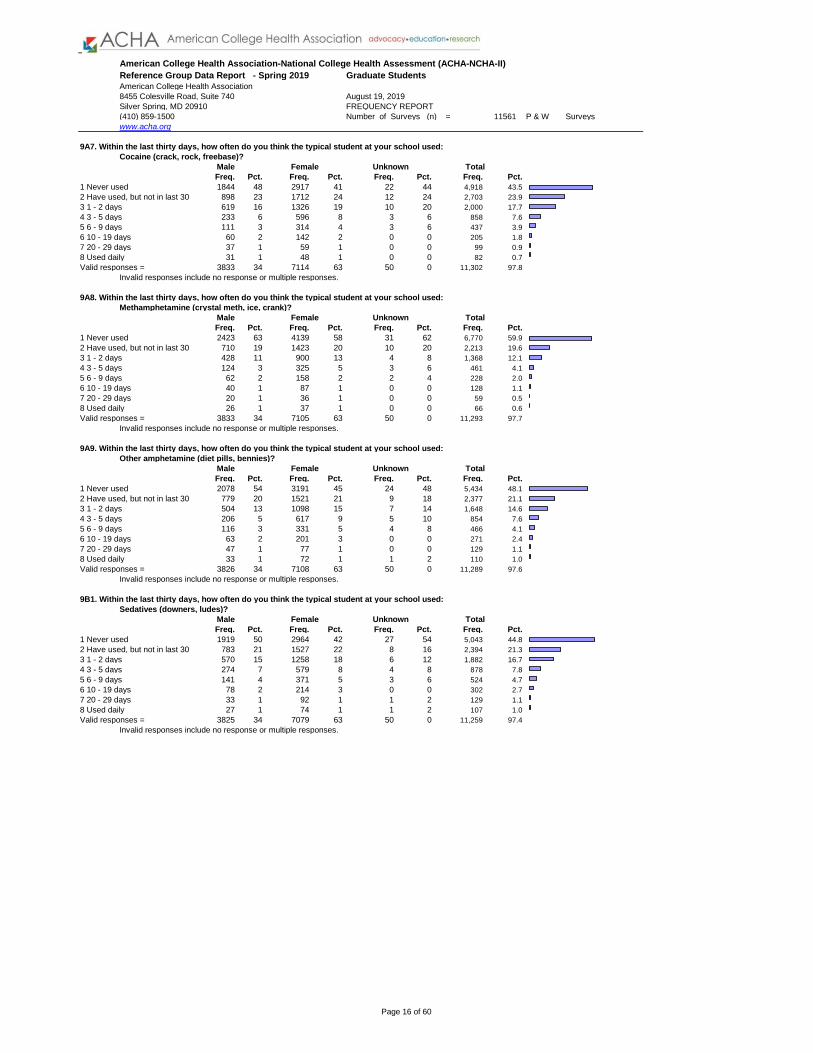
9A7. Within the last thirty days, how often do you think the typical student at your school used:
Cocaine (crack, rock, freebase)?
Male Female Unknown Total
Freq. Pct. Freq. Pct. Freq. Pct. Freq. Pct.
1 Never used 1844 48 2917 41 22 44 4,918 43.5
2 Have used, but not in last 30 898 23 1712 24 12 24 2,703 23.9
3 1 - 2 days 619 16 1326 19 10 20 2,000 17.7
4 3 - 5 days 233 6 596 8 3 6 858 7.6
5 6 - 9 days 111 3 314 4 3 6 437 3.9
6 10 - 19 days 60 2 142 2 0 0 205 1.8
7 20 - 29 days 37 1 59 1 0 0 99 0.9
8 Used daily 31 1 48 1 0 0 82 0.7
Valid responses = 3833 34 7114 63 50 0 11,302 97.8
Invalid responses include no response or multiple responses.
9A8. Within the last thirty days, how often do you think the typical student at your school used:
Methamphetamine (crystal meth, ice, crank)?
Male Female Unknown Total
Freq. Pct. Freq. Pct. Freq. Pct. Freq. Pct.
1 Never used 2423 63 4139 58 31 62 6,770 59.9
2 Have used, but not in last 30 710 19 1423 20 10 20 2,213 19.6
3 1 - 2 days 428 11 900 13 4 8 1,368 12.1
4 3 - 5 days 124 3 325 5 3 6 461 4.1
5 6 - 9 days 62 2 158 2 2 4 228 2.0
6 10 - 19 days 40 1 87 1 0 0 128 1.1
7 20 - 29 days 20 1 36 1 0 0 59 0.5
8 Used daily 26 1 37 1 0 0 66 0.6
Valid responses = 3833 34 7105 63 50 0 11,293 97.7
Invalid responses include no response or multiple responses.
9A9. Within the last thirty days, how often do you think the typical student at your school used:
Other amphetamine (diet pills, bennies)?
Male Female Unknown Total
Freq. Pct. Freq. Pct. Freq. Pct. Freq. Pct.
1 Never used 2078 54 3191 45 24 48 5,434 48.1
2 Have used, but not in last 30 779 20 1521 21 9 18 2,377 21.1
3 1 - 2 days 504 13 1098 15 7 14 1,648 14.6
4 3 - 5 days 206 5 617 9 5 10 854 7.6
5 6 - 9 days 116 3 331 5 4 8 466 4.1
6 10 - 19 days 63 2 201 3 0 0 271 2.4
7 20 - 29 days 47 1 77 1 0 0 129 1.1
8 Used daily 33 1 72 1 1 2 110 1.0
Valid responses = 3826 34 7108 63 50 0 11,289 97.6
Invalid responses include no response or multiple responses.
9B1. Within the last thirty days, how often do you think the typical student at your school used:
Sedatives (downers, ludes)?
Male Female Unknown Total
Freq. Pct. Freq. Pct. Freq. Pct. Freq. Pct.
1 Never used 1919 50 2964 42 27 54 5,043 44.8
2 Have used, but not in last 30 783 21 1527 22 8 16 2,394 21.3
3 1 - 2 days 570 15 1258 18 6 12 1,882 16.7
4 3 - 5 days 274 7 579 8 4 8 878 7.8
5 6 - 9 days 141 4 371 5 3 6 524 4.7
6 10 - 19 days 78 2 214 3 0 0 302 2.7
7 20 - 29 days 33 1 92 1 1 2 129 1.1
8 Used daily 27 1 74 1 1 2 107 1.0
Valid responses = 3825 34 7079 63 50 0 11,259 97.4
Invalid responses include no response or multiple responses.
Page 16 of 60

Reference Group Data Report - Spring 2019
American College Health Association
8455 Colesville Road, Suite 740
Silver Spring, MD 20910 FREQUENCY REPORT
(410) 859-1500 Number of Surveys (n) = 11561 P & W Surveys
www.acha.org
American College Health Association-National College Health Assessment (ACHA-NCHA-II)
Graduate Students
August 19, 2019
9B2. Within the last thirty days, how often do you think the typical student at your school used:
Hallucinogens (LSD, PCP)?
Male Female Unknown Total
Freq. Pct. Freq. Pct. Freq. Pct. Freq. Pct.
1 Never used 1805 47 2844 40 27 54 4,798 42.6
2 Have used, but not in last 30 983 26 1938 27 9 18 3,018 26.8
3 1 - 2 days 629 17 1335 19 7 14 2,028 18.0
4 3 - 5 days 220 6 459 7 3 6 699 6.2
5 6 - 9 days 97 3 291 4 3 6 398 3.5
6 10 - 19 days 45 1 117 2 0 0 167 1.5
7 20 - 29 days 22 1 59 1 1 2 87 0.8
8 Used daily 20 1 31 0 0 0 55 0.5
Valid responses = 3821 34 7074 63 50 0 11,250 97.3
Invalid responses include no response or multiple responses.
9B3. Within the last thirty days, how often do you think the typical student at your school used:
Anabolic steroids (Testosterone)?
Male Female Unknown Total
Freq. Pct. Freq. Pct. Freq. Pct. Freq. Pct.
1 Never used 2265 59 3674 52 29 58 6,139 54.6
2 Have used, but not in last 30 669 18 1374 19 8 16 2,109 18.7
3 1 - 2 days 462 12 1013 14 6 12 1,519 13.5
4 3 - 5 days 207 5 424 6 4 8 649 5.8
5 6 - 9 days 94 3 317 5 2 4 423 3.8
6 10 - 19 days 67 2 158 2 1 2 232 2.1
7 20 - 29 days 33 1 70 1 0 0 106 0.9
8 Used daily 23 1 46 1 0 0 74 0.7
Valid responses = 3820 34 7076 63 50 0 11,251 97.3
Invalid responses include no response or multiple responses.
9B4. Within the last thirty days, how often do you think the typical student at your school used:
Opiates (heroine, smack)?
Male Female Unknown Total
Freq. Pct. Freq. Pct. Freq. Pct. Freq. Pct.
1 Never used 2418 63 4049 57 33 66 6,678 59.4
2 Have used, but not in last 30 658 17 1362 19 7 14 2,089 18.6
3 1 - 2 days 425 11 931 13 6 12 1,395 12.4
4 3 - 5 days 163 4 357 5 2 4 532 4.7
5 6 - 9 days 75 2 203 3 1 2 287 2.6
6 10 - 19 days 40 1 94 1 1 2 141 1.3
7 20 - 29 days 20 1 46 1 0 0 69 0.6
8 Used daily 21 1 31 0 0 0 56 0.5
Valid responses = 3820 34 7073 63 50 0 11,247 97.3
Invalid responses include no response or multiple responses.
9B5. Within the last thirty days, how often do you think the typical student at your school used:
Inhalants (glue, solvents, gas)?
Male Female Unknown Total
Freq. Pct. Freq. Pct. Freq. Pct. Freq. Pct.
1 Never used 2441 64 4050 57 32 64 6,711 59.6
2 Have used, but not in last 30 716 19 1585 22 8 16 2,378 21.1
3 1 - 2 days 408 11 899 13 6 12 1,342 11.9
4 3 - 5 days 127 3 280 4 2 4 417 3.7
5 6 - 9 days 67 2 144 2 1 2 213 1.9
6 10 - 19 days 27 1 58 1 1 2 89 0.8
7 20 - 29 days 19 1 39 1 0 0 61 0.5
8 Used daily 18 1 26 0 0 0 48 0.4
Valid responses = 3823 34 7081 63 50 0 11,259 97.4
Invalid responses include no response or multiple responses.
Page 17 of 60
Reference Group Data Report - Spring 2019
American College Health Association
8455 Colesville Road, Suite 740
Silver Spring, MD 20910 FREQUENCY REPORT
(410) 859-1500 Number of Surveys (n) = 11561 P & W Surveys
www.acha.org
American College Health Association-National College Health Assessment (ACHA-NCHA-II)
Graduate Students
August 19, 2019
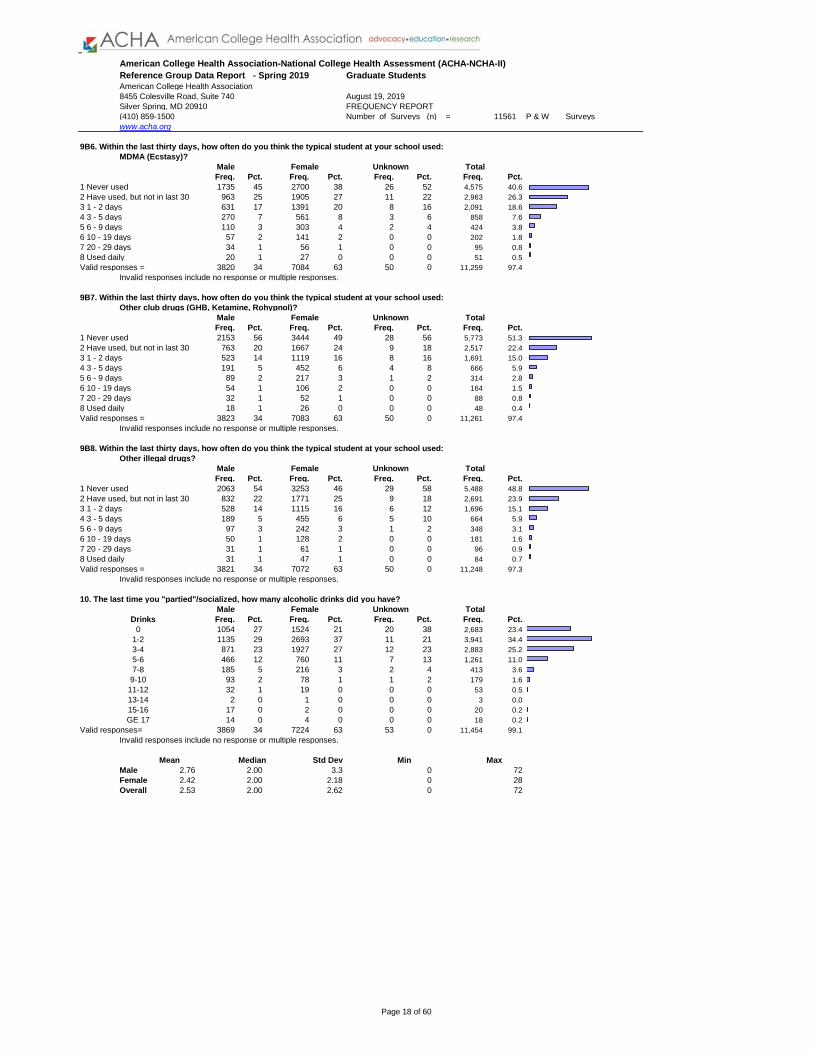
9B6. Within the last thirty days, how often do you think the typical student at your school used:
MDMA (Ecstasy)?
Male Female Unknown Total
Freq. Pct. Freq. Pct. Freq. Pct. Freq. Pct.
1 Never used 1735 45 2700 38 26 52 4,575 40.6
2 Have used, but not in last 30 963 25 1905 27 11 22 2,963 26.3
3 1 - 2 days 631 17 1391 20 8 16 2,091 18.6
4 3 - 5 days 270 7 561 8 3 6 858 7.6
5 6 - 9 days 110 3 303 4 2 4 424 3.8
6 10 - 19 days 57 2 141 2 0 0 202 1.8
7 20 - 29 days 34 1 56 1 0 0 95 0.8
8 Used daily 20 1 27 0 0 0 51 0.5
Valid responses = 3820 34 7084 63 50 0 11,259 97.4
Invalid responses include no response or multiple responses.
9B7. Within the last thirty days, how often do you think the typical student at your school used:
Other club drugs (GHB, Ketamine, Rohypnol)?
Male Female Unknown Total
Freq. Pct. Freq. Pct. Freq. Pct. Freq. Pct.
1 Never used 2153 56 3444 49 28 56 5,773 51.3
2 Have used, but not in last 30 763 20 1667 24 9 18 2,517 22.4
3 1 - 2 days 523 14 1119 16 8 16 1,691 15.0
4 3 - 5 days 191 5 452 6 4 8 666 5.9
5 6 - 9 days 89 2 217 3 1 2 314 2.8
6 10 - 19 days 54 1 106 2 0 0 164 1.5
7 20 - 29 days 32 1 52 1 0 0 88 0.8
8 Used daily 18 1 26 0 0 0 48 0.4
Valid responses = 3823 34 7083 63 50 0 11,261 97.4
Invalid responses include no response or multiple responses.
9B8. Within the last thirty days, how often do you think the typical student at your school used:
Other illegal drugs?
Male Female Unknown Total
Freq. Pct. Freq. Pct. Freq. Pct. Freq. Pct.
1 Never used 2063 54 3253 46 29 58 5,488 48.8
2 Have used, but not in last 30 832 22 1771 25 9 18 2,691 23.9
3 1 - 2 days 528 14 1115 16 6 12 1,696 15.1
4 3 - 5 days 189 5 455 6 5 10 664 5.9
5 6 - 9 days 97 3 242 3 1 2 348 3.1
6 10 - 19 days 50 1 128 2 0 0 181 1.6
7 20 - 29 days 31 1 61 1 0 0 96 0.9
8 Used daily 31 1 47 1 0 0 84 0.7
Valid responses = 3821 34 7072 63 50 0 11,248 97.3
Invalid responses include no response or multiple responses.
10. The last time you "partied"/socialized, how many alcoholic drinks did you have?
Male Female Unknown Total
Drinks Freq. Pct. Freq. Pct. Freq. Pct. Freq. Pct.
0 1054 27 1524 21 20 38 2,683 23.4
1-2 1135 29 2693 37 11 21 3,941 34.4
3-4 871 23 1927 27 12 23 2,883 25.2
5-6 466 12 760 11 7 13 1,261 11.0
7-8 185 5 216 3 2 4 413 3.6
9-10 93 2 78 1 1 2 179 1.6
11-12 32 1 19 0 0 0 53 0.5
13-14 2 0 1 0 0 0 3 0.0
15-16 17 0 2 0 0 0 20 0.2
GE 17 14 0 4 0 0 0 18 0.2
Valid responses= 3869 34 7224 63 53 0 11,454 99.1
Invalid responses include no response or multiple responses.
Mean Median Std Dev Min Max
Male 2.76 2.00 3.3 0 72
Female 2.42 2.00 2.18 0 28
Overall 2.53 2.00 2.62 0 72
Page 18 of 60
Reference Group Data Report - Spring 2019
American College Health Association
8455 Colesville Road, Suite 740
Silver Spring, MD 20910 FREQUENCY REPORT
(410) 859-1500 Number of Surveys (n) = 11561 P & W Surveys
www.acha.org
American College Health Association-National College Health Assessment (ACHA-NCHA-II)
Graduate Students
August 19, 2019
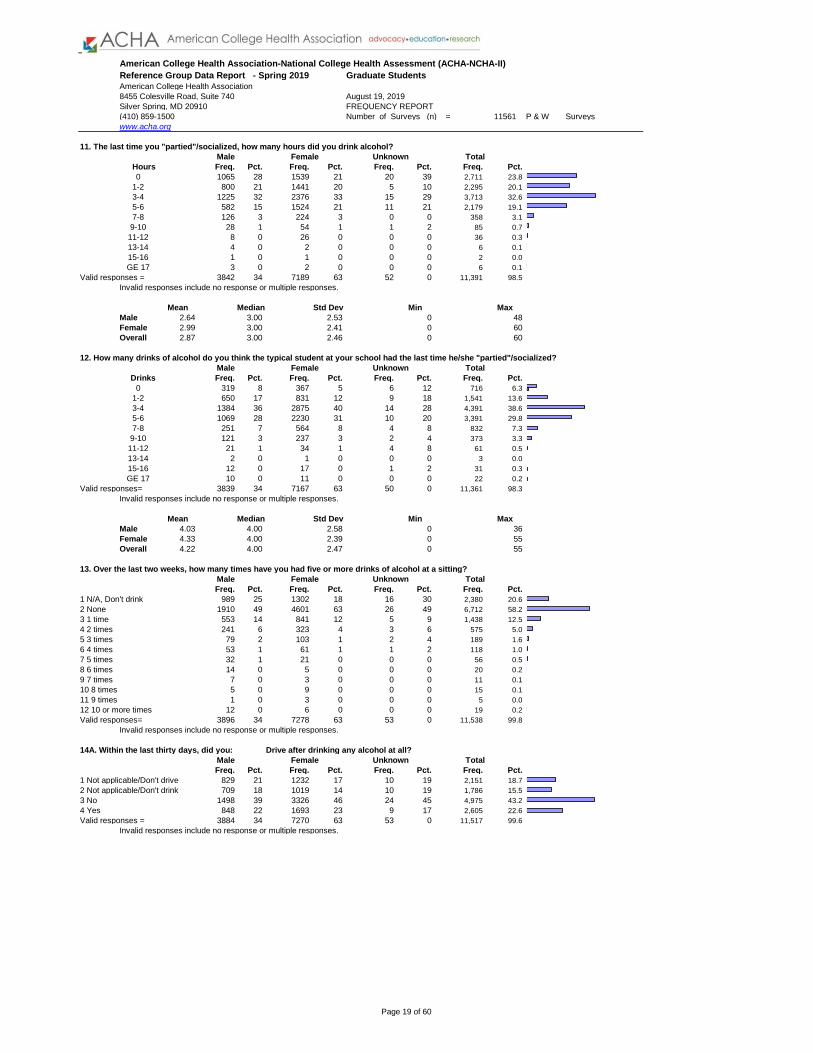
11. The last time you "partied"/socialized, how many hours did you drink alcohol?
Male Female Unknown Total
Hours Freq. Pct. Freq. Pct. Freq. Pct. Freq. Pct.
0 1065 28 1539 21 20 39 2,711 23.8
1-2 800 21 1441 20 5 10 2,295 20.1
3-4 1225 32 2376 33 15 29 3,713 32.6
5-6 582 15 1524 21 11 21 2,179 19.1
7-8 126 3 224 3 0 0 358 3.1
9-10 28 1 54 1 1 2 85 0.7
11-12 8 0 26 0 0 0 36 0.3
13-14 4 0 2 0 0 0 6 0.1
15-16 1 0 1 0 0 0 2 0.0
GE 17 3 0 2 0 0 0 6 0.1
Valid responses = 3842 34 7189 63 52 0 11,391 98.5
Invalid responses include no response or multiple responses.
Mean Median Std Dev Min Max
Male 2.64 3.00 2.53 0 48
Female 2.99 3.00 2.41 0 60
Overall 2.87 3.00 2.46 0 60
12. How many drinks of alcohol do you think the typical student at your school had the last time he/she "partied"/socialized?
Male Female Unknown Total
Drinks Freq. Pct. Freq. Pct. Freq. Pct. Freq. Pct.
0 319 8 367 5 6 12 716 6.3
1-2 650 17 831 12 9 18 1,541 13.6
3-4 1384 36 2875 40 14 28 4,391 38.6
5-6 1069 28 2230 31 10 20 3,391 29.8
7-8 251 7 564 8 4 8 832 7.3
9-10 121 3 237 3 2 4 373 3.3
11-12 21 1 34 1 4 8 61 0.5
13-14 2 0 1 0 0 0 3 0.0
15-16 12 0 17 0 1 2 31 0.3
GE 17 10 0 11 0 0 0 22 0.2
Valid responses= 3839 34 7167 63 50 0 11,361 98.3
Invalid responses include no response or multiple responses.
Mean Median Std Dev Min Max
Male 4.03 4.00 2.58 0 36
Female 4.33 4.00 2.39 0 55
Overall 4.22 4.00 2.47 0 55
13. Over the last two weeks, how many times have you had five or more drinks of alcohol at a sitting?
Male Female Unknown Total
Freq. Pct. Freq. Pct. Freq. Pct. Freq. Pct.
1 N/A, Don't drink 989 25 1302 18 16 30 2,380 20.6
2 None 1910 49 4601 63 26 49 6,712 58.2
3 1 time 553 14 841 12 5 9 1,438 12.5
4 2 times 241 6 323 4 3 6 575 5.0
5 3 times 79 2 103 1 2 4 189 1.6
6 4 times 53 1 61 1 1 2 118 1.0
7 5 times 32 1 21 0 0 0 56 0.5
8 6 times 14 0 5 0 0 0 20 0.2
9 7 times 7 0 3 0 0 0 11 0.1
10 8 times 5 0 9 0 0 0 15 0.1
11 9 times 1 0 3 0 0 0 5 0.0
12 10 or more times 12 0 6 0 0 0 19 0.2
Valid responses= 3896 34 7278 63 53 0 11,538 99.8
Invalid responses include no response or multiple responses.
14A. Within the last thirty days, did you: Drive after drinking any alcohol at all?
Male Female Unknown Total
Freq. Pct. Freq. Pct. Freq. Pct. Freq. Pct.
1 Not applicable/Don't drive 829 21 1232 17 10 19 2,151 18.7
2 Not applicable/Don't drink 709 18 1019 14 10 19 1,786 15.5
3 No 1498 39 3326 46 24 45 4,975 43.2
4 Yes 848 22 1693 23 9 17 2,605 22.6
Valid responses = 3884 34 7270 63 53 0 11,517 99.6
Invalid responses include no response or multiple responses.
Page 19 of 60
Reference Group Data Report - Spring 2019
American College Health Association
8455 Colesville Road, Suite 740
Silver Spring, MD 20910 FREQUENCY REPORT
(410) 859-1500 Number of Surveys (n) = 11561 P & W Surveys
www.acha.org
American College Health Association-National College Health Assessment (ACHA-NCHA-II)
Graduate Students
August 19, 2019
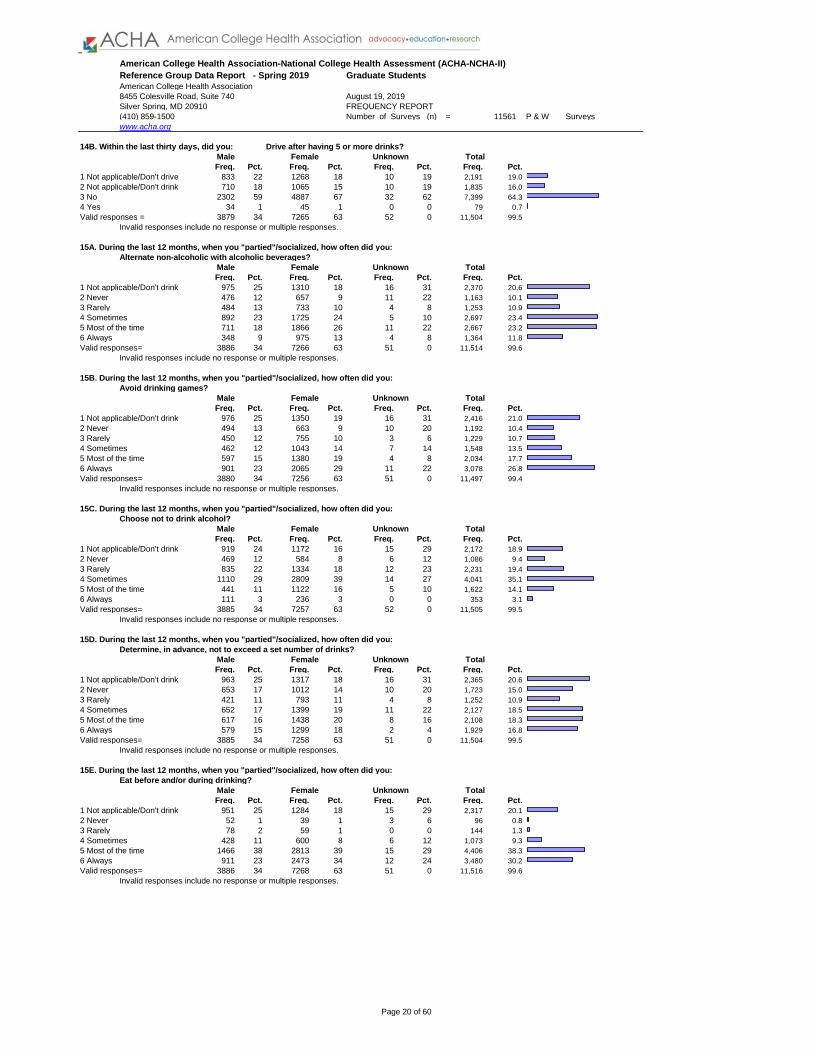
14B. Within the last thirty days, did you: Drive after having 5 or more drinks?
Male Female Unknown Total
Freq. Pct. Freq. Pct. Freq. Pct. Freq. Pct.
1 Not applicable/Don't drive 833 22 1268 18 10 19 2,191 19.0
2 Not applicable/Don't drink 710 18 1065 15 10 19 1,835 16.0
3 No 2302 59 4887 67 32 62 7,399 64.3
4 Yes 34 1 45 1 0 0 79 0.7
Valid responses = 3879 34 7265 63 52 0 11,504 99.5
Invalid responses include no response or multiple responses.
15A. During the last 12 months, when you "partied"/socialized, how often did you:
Alternate non-alcoholic with alcoholic beverages?
Male Female Unknown Total
Freq. Pct. Freq. Pct. Freq. Pct. Freq. Pct.
1 Not applicable/Don't drink 975 25 1310 18 16 31 2,370 20.6
2 Never 476 12 657 9 11 22 1,163 10.1
3 Rarely 484 13 733 10 4 8 1,253 10.9
4 Sometimes 892 23 1725 24 5 10 2,697 23.4
5 Most of the time 711 18 1866 26 11 22 2,667 23.2
6 Always 348 9 975 13 4 8 1,364 11.8
Valid responses= 3886 34 7266 63 51 0 11,514 99.6
Invalid responses include no response or multiple responses.
15B. During the last 12 months, when you "partied"/socialized, how often did you:
Avoid drinking games?
Male Female Unknown Total
Freq. Pct. Freq. Pct. Freq. Pct. Freq. Pct.
1 Not applicable/Don't drink 976 25 1350 19 16 31 2,416 21.0
2 Never 494 13 663 9 10 20 1,192 10.4
3 Rarely 450 12 755 10 3 6 1,229 10.7
4 Sometimes 462 12 1043 14 7 14 1,548 13.5
5 Most of the time 597 15 1380 19 4 8 2,034 17.7
6 Always 901 23 2065 29 11 22 3,078 26.8
Valid responses= 3880 34 7256 63 51 0 11,497 99.4
Invalid responses include no response or multiple responses.
15C. During the last 12 months, when you "partied"/socialized, how often did you:
Choose not to drink alcohol?
Male Female Unknown Total
Freq. Pct. Freq. Pct. Freq. Pct. Freq. Pct.
1 Not applicable/Don't drink 919 24 1172 16 15 29 2,172 18.9
2 Never 469 12 584 8 6 12 1,086 9.4
3 Rarely 835 22 1334 18 12 23 2,231 19.4
4 Sometimes 1110 29 2809 39 14 27 4,041 35.1
5 Most of the time 441 11 1122 16 5 10 1,622 14.1
6 Always 111 3 236 3 0 0 353 3.1
Valid responses= 3885 34 7257 63 52 0 11,505 99.5
Invalid responses include no response or multiple responses.
15D. During the last 12 months, when you "partied"/socialized, how often did you:
Determine, in advance, not to exceed a set number of drinks?
Male Female Unknown Total
Freq. Pct. Freq. Pct. Freq. Pct. Freq. Pct.
1 Not applicable/Don't drink 963 25 1317 18 16 31 2,365 20.6
2 Never 653 17 1012 14 10 20 1,723 15.0
3 Rarely 421 11 793 11 4 8 1,252 10.9
4 Sometimes 652 17 1399 19 11 22 2,127 18.5
5 Most of the time 617 16 1438 20 8 16 2,108 18.3
6 Always 579 15 1299 18 2 4 1,929 16.8
Valid responses= 3885 34 7258 63 51 0 11,504 99.5
Invalid responses include no response or multiple responses.
15E. During the last 12 months, when you "partied"/socialized, how often did you:
Eat before and/or during drinking?
Male Female Unknown Total
Freq. Pct. Freq. Pct. Freq. Pct. Freq. Pct.
1 Not applicable/Don't drink 951 25 1284 18 15 29 2,317 20.1
2 Never 52 1 39 1 3 6 96 0.8
3 Rarely 78 2 59 1 0 0 144 1.3
4 Sometimes 428 11 600 8 6 12 1,073 9.3
5 Most of the time 1466 38 2813 39 15 29 4,406 38.3
6 Always 911 23 2473 34 12 24 3,480 30.2
Valid responses= 3886 34 7268 63 51 0 11,516 99.6
Invalid responses include no response or multiple responses.
Page 20 of 60
Reference Group Data Report - Spring 2019
American College Health Association
8455 Colesville Road, Suite 740
Silver Spring, MD 20910 FREQUENCY REPORT
(410) 859-1500 Number of Surveys (n) = 11561 P & W Surveys
www.acha.org
American College Health Association-National College Health Assessment (ACHA-NCHA-II)
Graduate Students
August 19, 2019
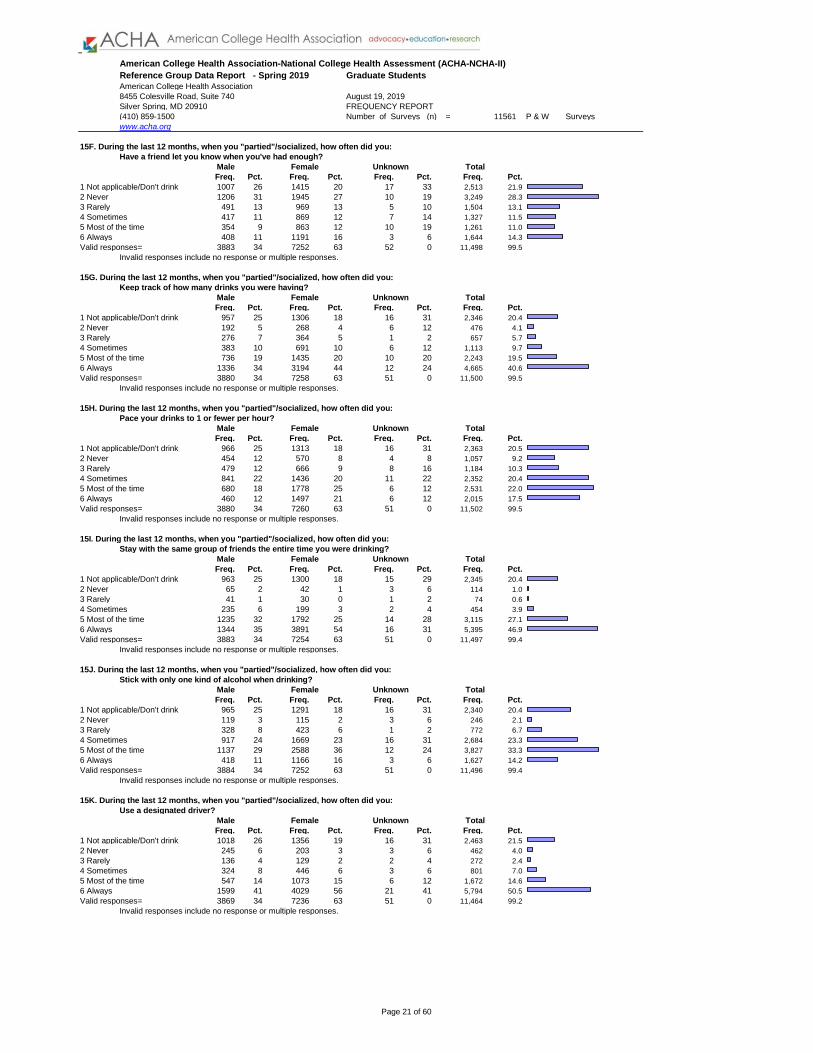
15F. During the last 12 months, when you "partied"/socialized, how often did you:
Have a friend let you know when you've had enough?
Male Female Unknown Total
Freq. Pct. Freq. Pct. Freq. Pct. Freq. Pct.
1 Not applicable/Don't drink 1007 26 1415 20 17 33 2,513 21.9
2 Never 1206 31 1945 27 10 19 3,249 28.3
3 Rarely 491 13 969 13 5 10 1,504 13.1
4 Sometimes 417 11 869 12 7 14 1,327 11.5
5 Most of the time 354 9 863 12 10 19 1,261 11.0
6 Always 408 11 1191 16 3 6 1,644 14.3
Valid responses= 3883 34 7252 63 52 0 11,498 99.5
Invalid responses include no response or multiple responses.
15G. During the last 12 months, when you "partied"/socialized, how often did you:
Keep track of how many drinks you were having?
Male Female Unknown Total
Freq. Pct. Freq. Pct. Freq. Pct. Freq. Pct.
1 Not applicable/Don't drink 957 25 1306 18 16 31 2,346 20.4
2 Never 192 5 268 4 6 12 476 4.1
3 Rarely 276 7 364 5 1 2 657 5.7
4 Sometimes 383 10 691 10 6 12 1,113 9.7
5 Most of the time 736 19 1435 20 10 20 2,243 19.5
6 Always 1336 34 3194 44 12 24 4,665 40.6
Valid responses= 3880 34 7258 63 51 0 11,500 99.5
Invalid responses include no response or multiple responses.
15H. During the last 12 months, when you "partied"/socialized, how often did you:
Pace your drinks to 1 or fewer per hour?
Male Female Unknown Total
Freq. Pct. Freq. Pct. Freq. Pct. Freq. Pct.
1 Not applicable/Don't drink 966 25 1313 18 16 31 2,363 20.5
2 Never 454 12 570 8 4 8 1,057 9.2
3 Rarely 479 12 666 9 8 16 1,184 10.3
4 Sometimes 841 22 1436 20 11 22 2,352 20.4
5 Most of the time 680 18 1778 25 6 12 2,531 22.0
6 Always 460 12 1497 21 6 12 2,015 17.5
Valid responses= 3880 34 7260 63 51 0 11,502 99.5
Invalid responses include no response or multiple responses.
15I. During the last 12 months, when you "partied"/socialized, how often did you:
Stay with the same group of friends the entire time you were drinking?
Male Female Unknown Total
Freq. Pct. Freq. Pct. Freq. Pct. Freq. Pct.
1 Not applicable/Don't drink 963 25 1300 18 15 29 2,345 20.4
2 Never 65 2 42 1 3 6 114 1.0
3 Rarely 41 1 30 0 1 2 74 0.6
4 Sometimes 235 6 199 3 2 4 454 3.9
5 Most of the time 1235 32 1792 25 14 28 3,115 27.1
6 Always 1344 35 3891 54 16 31 5,395 46.9
Valid responses= 3883 34 7254 63 51 0 11,497 99.4
Invalid responses include no response or multiple responses.
15J. During the last 12 months, when you "partied"/socialized, how often did you:
Stick with only one kind of alcohol when drinking?
Male Female Unknown Total
Freq. Pct. Freq. Pct. Freq. Pct. Freq. Pct.
1 Not applicable/Don't drink 965 25 1291 18 16 31 2,340 20.4
2 Never 119 3 115 2 3 6 246 2.1
3 Rarely 328 8 423 6 1 2 772 6.7
4 Sometimes 917 24 1669 23 16 31 2,684 23.3
5 Most of the time 1137 29 2588 36 12 24 3,827 33.3
6 Always 418 11 1166 16 3 6 1,627 14.2
Valid responses= 3884 34 7252 63 51 0 11,496 99.4
Invalid responses include no response or multiple responses.
15K. During the last 12 months, when you "partied"/socialized, how often did you:
Use a designated driver?
Male Female Unknown Total
Freq. Pct. Freq. Pct. Freq. Pct. Freq. Pct.
1 Not applicable/Don't drink 1018 26 1356 19 16 31 2,463 21.5
2 Never 245 6 203 3 3 6 462 4.0
3 Rarely 136 4 129 2 2 4 272 2.4
4 Sometimes 324 8 446 6 3 6 801 7.0
5 Most of the time 547 14 1073 15 6 12 1,672 14.6
6 Always 1599 41 4029 56 21 41 5,794 50.5
Valid responses= 3869 34 7236 63 51 0 11,464 99.2
Invalid responses include no response or multiple responses.
Page 21 of 60

Reference Group Data Report - Spring 2019
American College Health Association
8455 Colesville Road, Suite 740
Silver Spring, MD 20910 FREQUENCY REPORT
(410) 859-1500 Number of Surveys (n) = 11561 P & W Surveys
www.acha.org
American College Health Association-National College Health Assessment (ACHA-NCHA-II)
Graduate Students
August 19, 2019
16A. Within the last 12 months, have you experienced any of the following when drinking alcohol:
Did something you later regretted?
Male Female Unknown Total
Freq. Pct. Freq. Pct. Freq. Pct. Freq. Pct.
1 N/A, Don't drink 978 25 1323 18 15 28 2,382 20.7
2 No 2194 56 4464 61 28 53 6,874 59.6
3 Yes 717 18 1485 20 10 19 2,270 19.7
Valid responses = 3889 34 7272 63 53 0 11,526 99.7
Invalid responses include no response or multiple responses.
16B. Within the last 12 months, have you experienced any of the following when drinking alcohol:
Forgot where you were or what you did?
Male Female Unknown Total
Freq. Pct. Freq. Pct. Freq. Pct. Freq. Pct.
1 N/A, Don't drink 979 25 1316 18 16 31 2,378 20.6
2 No 2419 62 4932 68 30 58 7,590 65.9
3 Yes 489 13 1018 14 6 12 1,548 13.4
Valid responses = 3887 34 7266 63 52 0 11,516 99.6
Invalid responses include no response or multiple responses.
16C. Within the last 12 months, have you experienced any of the following when drinking alcohol:
Got in trouble with the police?
Male Female Unknown Total
Freq. Pct. Freq. Pct. Freq. Pct. Freq. Pct.
1 N/A, Don't drink 980 25 1319 18 16 31 2,381 20.7
2 No 2885 74 5908 82 36 69 9,074 78.9
3 Yes 20 1 26 0 0 0 47 0.4
Valid responses = 3885 34 7253 63 52 0 11,502 99.5
Invalid responses include no response or multiple responses.
16D. Within the last 12 months, have you experienced any of the following when drinking alcohol:
Someone had sex with me without my consent?
Male Female Unknown Total
Freq. Pct. Freq. Pct. Freq. Pct. Freq. Pct.
1 N/A, Don't drink 977 25 1323 18 16 31 2,382 20.7
2 No 2888 74 5847 81 36 69 9,012 78.3
3 Yes 19 1 94 1 0 0 117 1.0
Valid responses = 3884 34 7264 63 52 0 11,511 99.6
Invalid responses include no response or multiple responses.
16E. Within the last 12 months, have you experienced any of the following when drinking alcohol:
Had sex with someone without their consent?
Male Female Unknown Total
Freq. Pct. Freq. Pct. Freq. Pct. Freq. Pct.
1 N/A, Don't drink 974 25 1319 18 16 31 2,375 20.6
2 No 2904 75 5930 82 35 69 9,113 79.2
3 Yes 4 0 10 0 0 0 15 0.1
Valid responses = 3882 34 7259 63 51 0 11,503 99.5
Invalid responses include no response or multiple responses.
16F. Within the last 12 months, have you experienced any of the following when drinking alcohol:
Had unprotected sex?
Male Female Unknown Total
Freq. Pct. Freq. Pct. Freq. Pct. Freq. Pct.
1 N/A, Don't drink 976 25 1322 18 14 27 2,378 20.6
2 No 2326 60 4987 69 35 67 7,556 65.6
3 Yes 585 15 960 13 3 6 1,585 13.8
Valid responses = 3887 34 7269 63 52 0 11,519 99.6
Invalid responses include no response or multiple responses.
16G. Within the last 12 months, have you experienced any of the following when drinking alcohol:
Physically injured yourself?
Male Female Unknown Total
Freq. Pct. Freq. Pct. Freq. Pct. Freq. Pct.
1 N/A, Don't drink 977 25 1319 18 14 27 2,375 20.6
2 No 2718 70 5589 77 35 67 8,566 74.4
3 Yes 192 5 355 5 3 6 573 5.0
Valid responses = 3887 34 7263 63 52 0 11,514 99.6
Invalid responses include no response or multiple responses.
16H. Within the last 12 months, have you experienced any of the following when drinking alcohol:
Physically injured another person?
Male Female Unknown Total
Freq. Pct. Freq. Pct. Freq. Pct. Freq. Pct.
1 N/A, Don't drink 976 25 1320 18 14 27 2,376 20.6
2 No 2907 75 5927 82 37 71 9,115 79.1
3 Yes 7 0 20 0 1 2 30 0.3
Valid responses = 3890 34 7267 63 52 0 11,521 99.7
Invalid responses include no response or multiple responses.
Page 22 of 60

Reference Group Data Report - Spring 2019
American College Health Association
8455 Colesville Road, Suite 740
Silver Spring, MD 20910 FREQUENCY REPORT
(410) 859-1500 Number of Surveys (n) = 11561 P & W Surveys
www.acha.org
American College Health Association-National College Health Assessment (ACHA-NCHA-II)
Graduate Students
August 19, 2019
16I. Within the last 12 months, have you experienced any of the following when drinking alcohol:
Seriously considered suicide?
Male Female Unknown Total
Freq. Pct. Freq. Pct. Freq. Pct. Freq. Pct.
1 N/A, Don't drink 976 25 1319 18 15 29 2,375 20.6
2 No 2826 73 5799 80 35 67 8,893 77.2
3 Yes 88 2 148 2 2 4 252 2.2
Valid responses = 3890 34 7266 63 52 0 11,520 99.6
Invalid responses include no response or multiple responses.
17A. Within the last 30 days, what percent of students at your school used cigarettes? State your best estimate.
Male Female Unknown Total
Percent Freq. Pct. Freq. Pct. Freq. Pct. Freq. Pct.
0 120 3 137 2 2 4 266 2.4
1-10 1753 46 2220 31 12 25 4,098 36.3
11-20 925 24 1718 24 14 29 2,722 24.1
21-30 514 13 1259 18 7 14 1,835 16.3
31-40 201 5 569 8 6 12 807 7.1
41-50 169 4 629 9 4 8 818 7.2
51-60 59 2 231 3 2 4 304 2.7
61-70 39 1 164 2 1 2 206 1.8
71-80 37 1 142 2 0 0 181 1.6
81-90 12 0 30 0 1 2 45 0.4
91-99 0 0 7 0 0 0 7 0.1
Valid responses = 3829 34 7106 63 49 0 11,289 97.6
Invalid responses include no response or multiple responses.
Mean Median Std Dev Min Max
Male 17.99 15.00 16.15 0 100
Female 24.44 20.00 18.87 0 99
Overall 22.18 18.00 18.21 0 100
17B. Within the last 30 days, what percent of students at your school used alcohol? State your best estimate.
Male Female Unknown Total
Percent Freq. Pct. Freq. Pct. Freq. Pct. Freq. Pct.
0 84 2 88 1 1 2 178 1.6
1-10 141 4 151 2 1 2 303 2.7
11-20 131 3 131 2 1 2 268 2.4
21-30 194 5 232 3 2 4 441 3.9
31-40 259 7 277 4 3 6 551 4.9
41-50 423 11 670 9 2 4 1,130 10.0
51-60 416 11 669 9 7 14 1,123 10.0
61-70 521 14 1012 14 9 18 1,590 14.1
71-80 942 25 2055 29 13 27 3,092 27.4
81-90 563 15 1426 20 7 14 2,045 18.1
91-99 144 4 400 6 3 6 560 5.0
Valid responses = 3818 34 7111 63 49 0 11,281 97.6
Invalid responses include no response or multiple responses.
Mean Median Std Dev Min Max
Male 62.48 70.00 24.53 0 100
Female 68.88 75.00 21.56 0 100
Overall 66.61 75.00 22.86 0 100
17C. Within the last 30 days, what percent of students at your school used marijuana? State your best estimate.
Male Female Unknown Total
Percent Freq. Pct. Freq. Pct. Freq. Pct. Freq. Pct.
0 216 6 195 3 4 8 426 3.8
1-10 763 20 786 11 6 12 1,591 14.1
11-20 496 13 749 11 7 14 1,280 11.4
21-30 616 16 975 14 4 8 1,630 14.5
31-40 481 13 864 12 6 12 1,388 12.3
41-50 487 13 1239 17 9 18 1,793 15.9
51-60 235 6 689 10 4 8 951 8.4
61-70 196 5 582 8 3 6 805 7.1
71-80 209 6 680 10 4 8 925 8.2
81-90 77 2 280 4 2 4 372 3.3
91-99 36 1 71 1 0 0 112 1.0
Valid responses = 3812 34 7110 63 49 0 11,273 97.5
Invalid responses include no response or multiple responses.
Mean Median Std Dev Min Max
Male 33.48 30.00 24.63 0 100
Female 43.08 40.00 24.70 0 100
Overall 39.82 40.00 25.12 0 100
Page 23 of 60
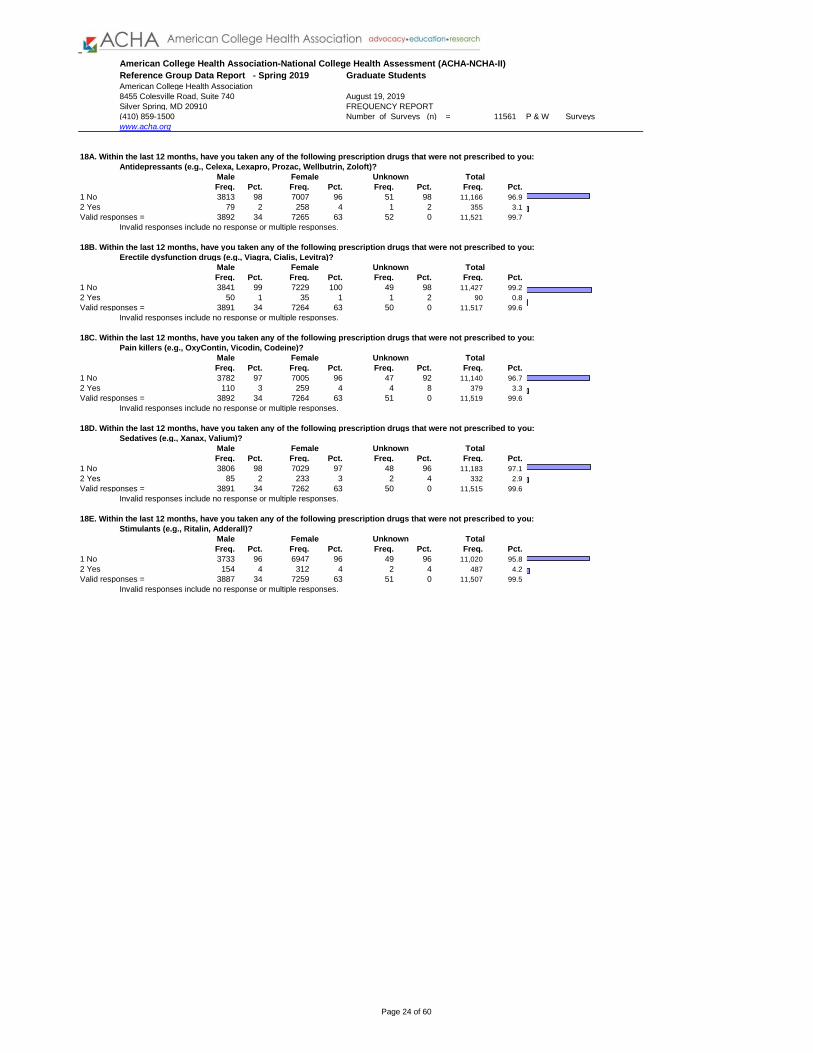
Reference Group Data Report - Spring 2019
American College Health Association
8455 Colesville Road, Suite 740
Silver Spring, MD 20910 FREQUENCY REPORT
(410) 859-1500 Number of Surveys (n) = 11561 P & W Surveys
www.acha.org
American College Health Association-National College Health Assessment (ACHA-NCHA-II)
Graduate Students
August 19, 2019
18A. Within the last 12 months, have you taken any of the following prescription drugs that were not prescribed to you:
Antidepressants (e.g., Celexa, Lexapro, Prozac, Wellbutrin, Zoloft)?
Male Female Unknown Total
Freq. Pct. Freq. Pct. Freq. Pct. Freq. Pct.
1 No 3813 98 7007 96 51 98 11,166 96.9
2 Yes 79 2 258 4 1 2 355 3.1
Valid responses = 3892 34 7265 63 52 0 11,521 99.7
Invalid responses include no response or multiple responses.
18B. Within the last 12 months, have you taken any of the following prescription drugs that were not prescribed to you:
Erectile dysfunction drugs (e.g., Viagra, Cialis, Levitra)?
Male Female Unknown Total
Freq. Pct. Freq. Pct. Freq. Pct. Freq. Pct.
1 No 3841 99 7229 100 49 98 11,427 99.2
2 Yes 50 1 35 1 1 2 90 0.8
Valid responses = 3891 34 7264 63 50 0 11,517 99.6
Invalid responses include no response or multiple responses.
18C. Within the last 12 months, have you taken any of the following prescription drugs that were not prescribed to you:
Pain killers (e.g., OxyContin, Vicodin, Codeine)?
Male Female Unknown Total
Freq. Pct. Freq. Pct. Freq. Pct. Freq. Pct.
1 No 3782 97 7005 96 47 92 11,140 96.7
2 Yes 110 3 259 4 4 8 379 3.3
Valid responses = 3892 34 7264 63 51 0 11,519 99.6
Invalid responses include no response or multiple responses.
18D. Within the last 12 months, have you taken any of the following prescription drugs that were not prescribed to you:
Sedatives (e.g., Xanax, Valium)?
Male Female Unknown Total
Freq. Pct. Freq. Pct. Freq. Pct. Freq. Pct.
1 No 3806 98 7029 97 48 96 11,183 97.1
2 Yes 85 2 233 3 2 4 332 2.9
Valid responses = 3891 34 7262 63 50 0 11,515 99.6
Invalid responses include no response or multiple responses.
18E. Within the last 12 months, have you taken any of the following prescription drugs that were not prescribed to you:
Stimulants (e.g., Ritalin, Adderall)?
Male Female Unknown Total
Freq. Pct. Freq. Pct. Freq. Pct. Freq. Pct.
1 No 3733 96 6947 96 49 96 11,020 95.8
2 Yes 154 4 312 4 2 4 487 4.2
Valid responses = 3887 34 7259 63 51 0 11,507 99.5
Invalid responses include no response or multiple responses.
Page 24 of 60

Reference Group Data Report - Spring 2019
American College Health Association
8455 Colesville Road, Suite 740
Silver Spring, MD 20910 FREQUENCY REPORT
(410) 859-1500 Number of Surveys (n) = 11561 P & W Surveys
www.acha.org
American College Health Association-National College Health Assessment (ACHA-NCHA-II)
Graduate Students
August 19, 2019
19. Within the last 12 months, with how many partners have you had oral sex, vaginal intercourse or anal intercourse?
Male Female Unknown Total
Partners Freq. Pct. Freq. Pct. Freq. Pct. Freq. Pct.
0 987 26 1516 21 10 20 2,584 22.8
1 2110 55 4474 63 30 61 6,755 59.6
2 246 6 526 7 2 4 809 7.1
3 123 3 266 4 2 4 410 3.6
4 84 2 144 2 2 4 237 2.1
5 71 2 95 1 1 2 176 1.6
6 46 1 50 1 1 2 100 0.9
7 15 0 27 0 0 0 43 0.4
8 27 1 18 0 0 0 46 0.4
GE 9 120 3 47 1 1 2 183 1.6
Valid responses = 3829 34 7163 63 49 0 11,343 98.1
Invalid responses include no response or multiple responses.
Mean Median Std Dev Min Max
Male 1.73 1.00 4.48 0 90
Female 1.22 1.00 1.87 0 69
Overall 1.43 1.00 3.23 0 90
20A. Within the last 12 months, did you have sexual partner(s) who were: Women?
Male Female Unknown Total
Freq. Pct. Freq. Pct. Freq. Pct. Freq. Pct.
1 No 1276 33 6673 94 31 69 8,177 72.5
2 Yes 2568 67 411 6 14 31 3,100 27.5
Valid responses = 3844 34 7084 63 45 0 11,277 97.5
Invalid responses include no response or multiple responses.
20B. Within the last 12 months, did you have sexual partner(s) who were: Men?
Male Female Unknown Total
Freq. Pct. Freq. Pct. Freq. Pct. Freq. Pct.
1 No 3403 90 1692 24 25 52 5,282 46.7
2 Yes 369 10 5499 77 23 48 6,032 53.3
Valid responses = 3772 33 7191 64 48 0 11,314 97.9
Invalid responses include no response or multiple responses.
20C. Within the last 12 months, did you have sexual partner(s) who were: Trans women?
Male Female Unknown Total
Freq. Pct. Freq. Pct. Freq. Pct. Freq. Pct.
1 No 3734 100 7016 100 45 100 11,072 99.6
2 Yes 16 0 18 0 0 0 49 0.4
Valid responses = 3750 34 7034 63 45 0 11,121 96.2
Invalid responses include no response or multiple responses.
20D. Within the last 12 months, did you have sexual partner(s) who were: Trans men?
Male Female Unknown Total
Freq. Pct. Freq. Pct. Freq. Pct. Freq. Pct.
1 No 3738 100 7015 100 44 100 11,077 99.6
2 Yes 12 0 17 0 0 0 42 0.4
Valid responses = 3750 34 7032 63 44 0 11,119 96.2
Invalid responses include no response or multiple responses.
20E. Within the last 12 months, did you have sexual partner(s) who were: Genderqueer?
Male Female Unknown Total
Freq. Pct. Freq. Pct. Freq. Pct. Freq. Pct.
1 No 3705 99 6986 99 44 96 10,978 98.5
2 Yes 51 1 59 1 2 4 170 1.5
Valid responses = 3756 34 7045 63 46 0 11,148 96.4
Invalid responses include no response or multiple responses.
Page 25 of 60
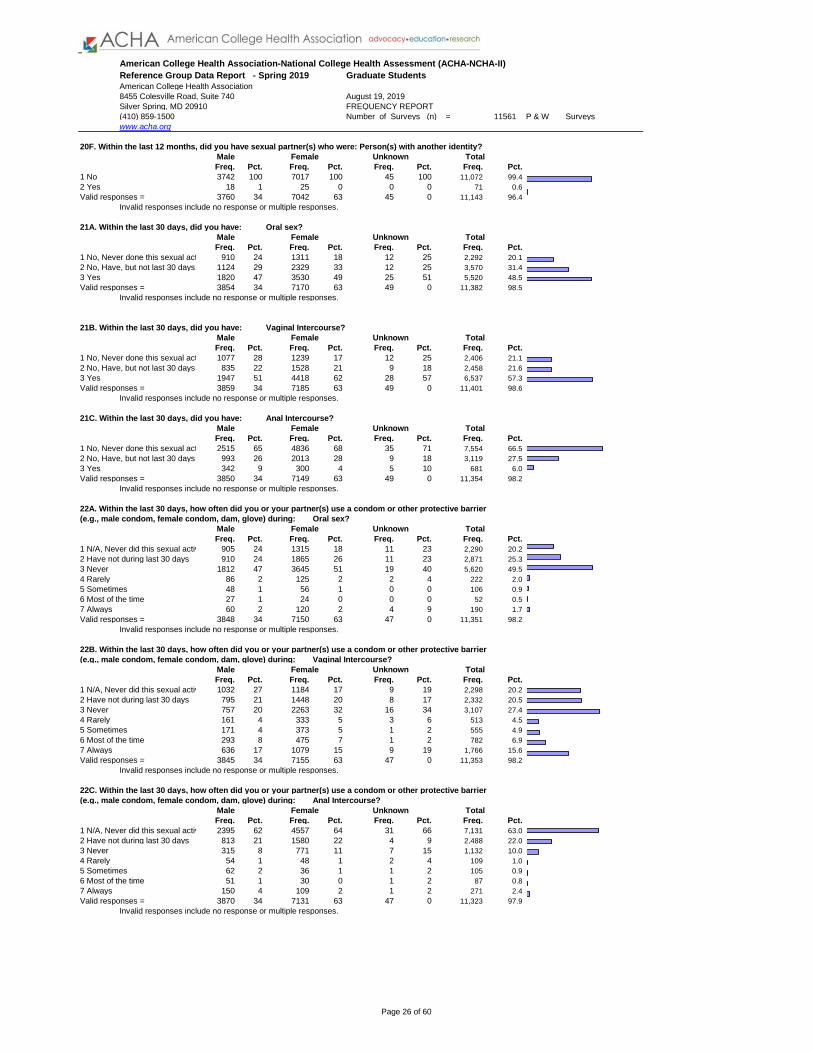
Reference Group Data Report - Spring 2019
American College Health Association
8455 Colesville Road, Suite 740
Silver Spring, MD 20910 FREQUENCY REPORT
(410) 859-1500 Number of Surveys (n) = 11561 P & W Surveys
www.acha.org
American College Health Association-National College Health Assessment (ACHA-NCHA-II)
Graduate Students
August 19, 2019
20F. Within the last 12 months, did you have sexual partner(s) who were: Person(s) with another identity?
Male Female Unknown Total
Freq. Pct. Freq. Pct. Freq. Pct. Freq. Pct.
1 No 3742 100 7017 100 45 100 11,072 99.4
2 Yes 18 1 25 0 0 0 71 0.6
Valid responses = 3760 34 7042 63 45 0 11,143 96.4
Invalid responses include no response or multiple responses.
21A. Within the last 30 days, did you have: Oral sex?
Male Female Unknown Total
Freq. Pct. Freq. Pct. Freq. Pct. Freq. Pct.
1 No, Never done this sexual activity 910 24 1311 18 12 25 2,292 20.1
2 No, Have, but not last 30 days 1124 29 2329 33 12 25 3,570 31.4
3 Yes 1820 47 3530 49 25 51 5,520 48.5
Valid responses = 3854 34 7170 63 49 0 11,382 98.5
Invalid responses include no response or multiple responses.
21B. Within the last 30 days, did you have: Vaginal Intercourse?
Male Female Unknown Total
Freq. Pct. Freq. Pct. Freq. Pct. Freq. Pct.
1 No, Never done this sexual activity 1077 28 1239 17 12 25 2,406 21.1
2 No, Have, but not last 30 days 835 22 1528 21 9 18 2,458 21.6
3 Yes 1947 51 4418 62 28 57 6,537 57.3
Valid responses = 3859 34 7185 63 49 0 11,401 98.6
Invalid responses include no response or multiple responses.
21C. Within the last 30 days, did you have: Anal Intercourse?
Male Female Unknown Total
Freq. Pct. Freq. Pct. Freq. Pct. Freq. Pct.
1 No, Never done this sexual activity 2515 65 4836 68 35 71 7,554 66.5
2 No, Have, but not last 30 days 993 26 2013 28 9 18 3,119 27.5
3 Yes 342 9 300 4 5 10 681 6.0
Valid responses = 3850 34 7149 63 49 0 11,354 98.2
Invalid responses include no response or multiple responses.
22A. Within the last 30 days, how often did you or your partner(s) use a condom or other protective barrier
(e.g., male condom, female condom, dam, glove) during: Oral sex?
Male Female Unknown Total
Freq. Pct. Freq. Pct. Freq. Pct. Freq. Pct.
1 N/A, Never did this sexual activity 905 24 1315 18 11 23 2,290 20.2
2 Have not during last 30 days 910 24 1865 26 11 23 2,871 25.3
3 Never 1812 47 3645 51 19 40 5,620 49.5
4 Rarely 86 2 125 2 2 4 222 2.0
5 Sometimes 48 1 56 1 0 0 106 0.9
6 Most of the time 27 1 24 0 0 0 52 0.5
7 Always 60 2 120 2 4 9 190 1.7
Valid responses = 3848 34 7150 63 47 0 11,351 98.2
Invalid responses include no response or multiple responses.
22B. Within the last 30 days, how often did you or your partner(s) use a condom or other protective barrier
(e.g., male condom, female condom, dam, glove) during: Vaginal Intercourse?
Male Female Unknown Total
Freq. Pct. Freq. Pct. Freq. Pct. Freq. Pct.
1 N/A, Never did this sexual activity 1032 27 1184 17 9 19 2,298 20.2
2 Have not during last 30 days 795 21 1448 20 8 17 2,332 20.5
3 Never 757 20 2263 32 16 34 3,107 27.4
4 Rarely 161 4 333 5 3 6 513 4.5
5 Sometimes 171 4 373 5 1 2 555 4.9
6 Most of the time 293 8 475 7 1 2 782 6.9
7 Always 636 17 1079 15 9 19 1,766 15.6
Valid responses = 3845 34 7155 63 47 0 11,353 98.2
Invalid responses include no response or multiple responses.
22C. Within the last 30 days, how often did you or your partner(s) use a condom or other protective barrier
(e.g., male condom, female condom, dam, glove) during: Anal Intercourse?
Male Female Unknown Total
Freq. Pct. Freq. Pct. Freq. Pct. Freq. Pct.
1 N/A, Never did this sexual activity 2395 62 4557 64 31 66 7,131 63.0
2 Have not during last 30 days 813 21 1580 22 4 9 2,488 22.0
3 Never 315 8 771 11 7 15 1,132 10.0
4 Rarely 54 1 48 1 2 4 109 1.0
5 Sometimes 62 2 36 1 1 2 105 0.9
6 Most of the time 51 1 30 0 1 2 87 0.8
7 Always 150 4 109 2 1 2 271 2.4
Valid responses = 3870 34 7131 63 47 0 11,323 97.9
Invalid responses include no response or multiple responses.
Page 26 of 60
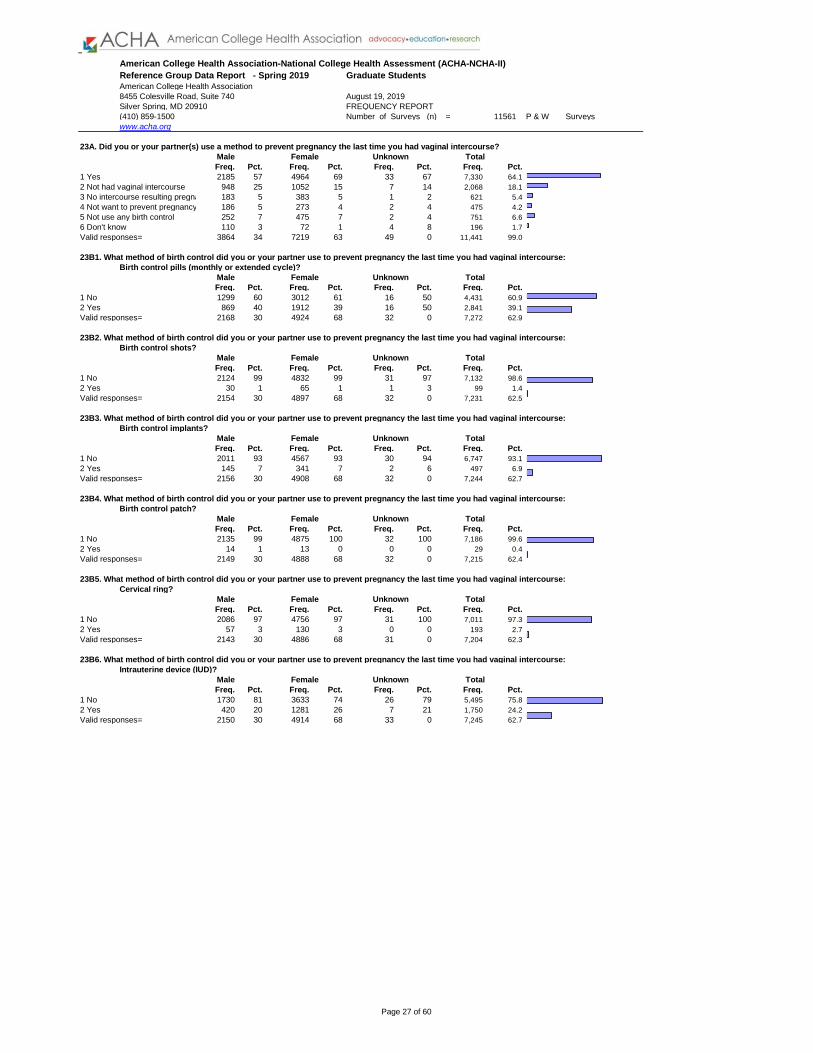
Reference Group Data Report - Spring 2019
American College Health Association
8455 Colesville Road, Suite 740
Silver Spring, MD 20910 FREQUENCY REPORT
(410) 859-1500 Number of Surveys (n) = 11561 P & W Surveys
www.acha.org
American College Health Association-National College Health Assessment (ACHA-NCHA-II)
Graduate Students
August 19, 2019
23A. Did you or your partner(s) use a method to prevent pregnancy the last time you had vaginal intercourse?
Male Female Unknown Total
Freq. Pct. Freq. Pct. Freq. Pct. Freq. Pct.
1 Yes 2185 57 4964 69 33 67 7,330 64.1
2 Not had vaginal intercourse 948 25 1052 15 7 14 2,068 18.1
3 No intercourse resulting pregnancy 183 5 383 5 1 2 621 5.4
4 Not want to prevent pregnancy 186 5 273 4 2 4 475 4.2
5 Not use any birth control 252 7 475 7 2 4 751 6.6
6 Don't know 110 3 72 1 4 8 196 1.7
Valid responses= 3864 34 7219 63 49 0 11,441 99.0
23B1. What method of birth control did you or your partner use to prevent pregnancy the last time you had vaginal intercourse:
Birth control pills (monthly or extended cycle)?
Male Female Unknown Total
Freq. Pct. Freq. Pct. Freq. Pct. Freq. Pct.
1 No 1299 60 3012 61 16 50 4,431 60.9
2 Yes 869 40 1912 39 16 50 2,841 39.1
Valid responses= 2168 30 4924 68 32 0 7,272 62.9
23B2. What method of birth control did you or your partner use to prevent pregnancy the last time you had vaginal intercourse:
Birth control shots?
Male Female Unknown Total
Freq. Pct. Freq. Pct. Freq. Pct. Freq. Pct.
1 No 2124 99 4832 99 31 97 7,132 98.6
2 Yes 30 1 65 1 1 3 99 1.4
Valid responses= 2154 30 4897 68 32 0 7,231 62.5
23B3. What method of birth control did you or your partner use to prevent pregnancy the last time you had vaginal intercourse:
Birth control implants?
Male Female Unknown Total
Freq. Pct. Freq. Pct. Freq. Pct. Freq. Pct.
1 No 2011 93 4567 93 30 94 6,747 93.1
2 Yes 145 7 341 7 2 6 497 6.9
Valid responses= 2156 30 4908 68 32 0 7,244 62.7
23B4. What method of birth control did you or your partner use to prevent pregnancy the last time you had vaginal intercourse:
Birth control patch?
Male Female Unknown Total
Freq. Pct. Freq. Pct. Freq. Pct. Freq. Pct.
1 No 2135 99 4875 100 32 100 7,186 99.6
2 Yes 14 1 13 0 0 0 29 0.4
Valid responses= 2149 30 4888 68 32 0 7,215 62.4
23B5. What method of birth control did you or your partner use to prevent pregnancy the last time you had vaginal intercourse:
Cervical ring?
Male Female Unknown Total
Freq. Pct. Freq. Pct. Freq. Pct. Freq. Pct.
1 No 2086 97 4756 97 31 100 7,011 97.3
2 Yes 57 3 130 3 0 0 193 2.7
Valid responses= 2143 30 4886 68 31 0 7,204 62.3
23B6. What method of birth control did you or your partner use to prevent pregnancy the last time you had vaginal intercourse:
Intrauterine device (IUD)?
Male Female Unknown Total
Freq. Pct. Freq. Pct. Freq. Pct. Freq. Pct.
1 No 1730 81 3633 74 26 79 5,495 75.8
2 Yes 420 20 1281 26 7 21 1,750 24.2
Valid responses= 2150 30 4914 68 33 0 7,245 62.7
Page 27 of 60
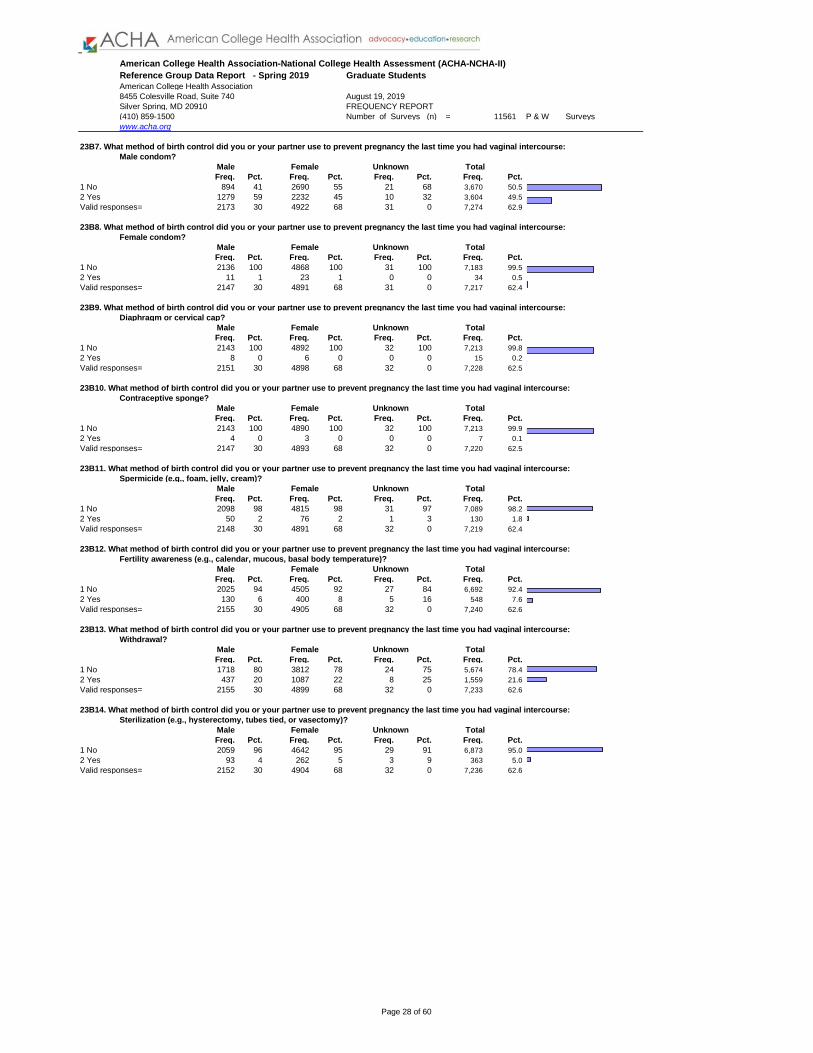
Reference Group Data Report - Spring 2019
American College Health Association
8455 Colesville Road, Suite 740
Silver Spring, MD 20910 FREQUENCY REPORT
(410) 859-1500 Number of Surveys (n) = 11561 P & W Surveys
www.acha.org
American College Health Association-National College Health Assessment (ACHA-NCHA-II)
Graduate Students
August 19, 2019
23B7. What method of birth control did you or your partner use to prevent pregnancy the last time you had vaginal intercourse:
Male condom?
Male Female Unknown Total
Freq. Pct. Freq. Pct. Freq. Pct. Freq. Pct.
1 No 894 41 2690 55 21 68 3,670 50.5
2 Yes 1279 59 2232 45 10 32 3,604 49.5
Valid responses= 2173 30 4922 68 31 0 7,274 62.9
23B8. What method of birth control did you or your partner use to prevent pregnancy the last time you had vaginal intercourse:
Female condom?
Male Female Unknown Total
Freq. Pct. Freq. Pct. Freq. Pct. Freq. Pct.
1 No 2136 100 4868 100 31 100 7,183 99.5
2 Yes 11 1 23 1 0 0 34 0.5
Valid responses= 2147 30 4891 68 31 0 7,217 62.4
23B9. What method of birth control did you or your partner use to prevent pregnancy the last time you had vaginal intercourse:
Diaphragm or cervical cap?
Male Female Unknown Total
Freq. Pct. Freq. Pct. Freq. Pct. Freq. Pct.
1 No 2143 100 4892 100 32 100 7,213 99.8
2 Yes 8 0 6 0 0 0 15 0.2
Valid responses= 2151 30 4898 68 32 0 7,228 62.5
23B10. What method of birth control did you or your partner use to prevent pregnancy the last time you had vaginal intercourse:
Contraceptive sponge?
Male Female Unknown Total
Freq. Pct. Freq. Pct. Freq. Pct. Freq. Pct.
1 No 2143 100 4890 100 32 100 7,213 99.9
2 Yes 4 0 3 0 0 0 7 0.1
Valid responses= 2147 30 4893 68 32 0 7,220 62.5
23B11. What method of birth control did you or your partner use to prevent pregnancy the last time you had vaginal intercourse:
Spermicide (e.g., foam, jelly, cream)?
Male Female Unknown Total
Freq. Pct. Freq. Pct. Freq. Pct. Freq. Pct.
1 No 2098 98 4815 98 31 97 7,089 98.2
2 Yes 50 2 76 2 1 3 130 1.8
Valid responses= 2148 30 4891 68 32 0 7,219 62.4
23B12. What method of birth control did you or your partner use to prevent pregnancy the last time you had vaginal intercourse:
Fertility awareness (e.g., calendar, mucous, basal body temperature)?
Male Female Unknown Total
Freq. Pct. Freq. Pct. Freq. Pct. Freq. Pct.
1 No 2025 94 4505 92 27 84 6,692 92.4
2 Yes 130 6 400 8 5 16 548 7.6
Valid responses= 2155 30 4905 68 32 0 7,240 62.6
23B13. What method of birth control did you or your partner use to prevent pregnancy the last time you had vaginal intercourse:
Withdrawal?
Male Female Unknown Total
Freq. Pct. Freq. Pct. Freq. Pct. Freq. Pct.
1 No 1718 80 3812 78 24 75 5,674 78.4
2 Yes 437 20 1087 22 8 25 1,559 21.6
Valid responses= 2155 30 4899 68 32 0 7,233 62.6
23B14. What method of birth control did you or your partner use to prevent pregnancy the last time you had vaginal intercourse:
Sterilization (e.g., hysterectomy, tubes tied, or vasectomy)?
Male Female Unknown Total
Freq. Pct. Freq. Pct. Freq. Pct. Freq. Pct.
1 No 2059 96 4642 95 29 91 6,873 95.0
2 Yes 93 4 262 5 3 9 363 5.0
Valid responses= 2152 30 4904 68 32 0 7,236 62.6
Page 28 of 60
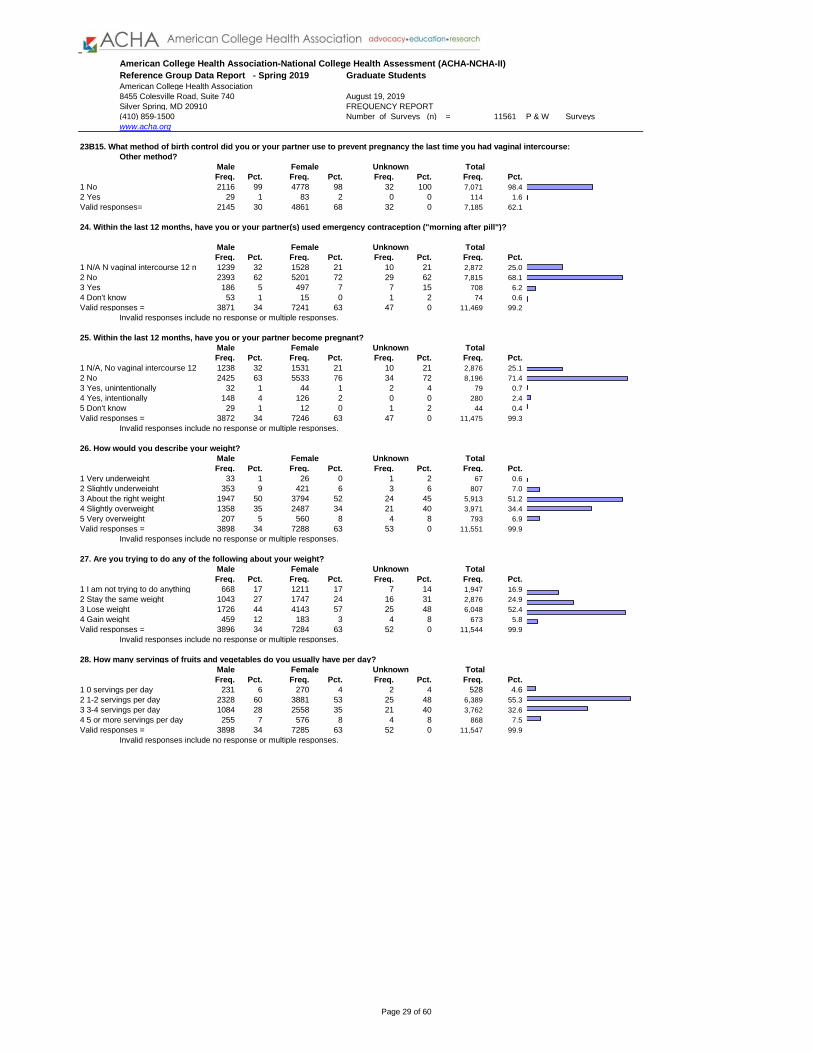
Reference Group Data Report - Spring 2019
American College Health Association
8455 Colesville Road, Suite 740
Silver Spring, MD 20910 FREQUENCY REPORT
(410) 859-1500 Number of Surveys (n) = 11561 P & W Surveys
www.acha.org
American College Health Association-National College Health Assessment (ACHA-NCHA-II)
Graduate Students
August 19, 2019
23B15. What method of birth control did you or your partner use to prevent pregnancy the last time you had vaginal intercourse:
Other method?
Male Female Unknown Total
Freq. Pct. Freq. Pct. Freq. Pct. Freq. Pct.
1 No 2116 99 4778 98 32 100 7,071 98.4
2 Yes 29 1 83 2 0 0 114 1.6
Valid responses= 2145 30 4861 68 32 0 7,185 62.1
24. Within the last 12 months, have you or your partner(s) used emergency contraception ("morning after pill")?
Male Female Unknown Total
Freq. Pct. Freq. Pct. Freq. Pct. Freq. Pct.
1 N/A N vaginal intercourse 12 mo. 1239 32 1528 21 10 21 2,872 25.0
2 No 2393 62 5201 72 29 62 7,815 68.1
3 Yes 186 5 497 7 7 15 708 6.2
4 Don't know 53 1 15 0 1 2 74 0.6
Valid responses = 3871 34 7241 63 47 0 11,469 99.2
Invalid responses include no response or multiple responses.
25. Within the last 12 months, have you or your partner become pregnant?
Male Female Unknown Total
Freq. Pct. Freq. Pct. Freq. Pct. Freq. Pct.
1 N/A, No vaginal intercourse 12 mo. 1238 32 1531 21 10 21 2,876 25.1
2 No 2425 63 5533 76 34 72 8,196 71.4
3 Yes, unintentionally 32 1 44 1 2 4 79 0.7
4 Yes, intentionally 148 4 126 2 0 0 280 2.4
5 Don't know 29 1 12 0 1 2 44 0.4
Valid responses = 3872 34 7246 63 47 0 11,475 99.3
Invalid responses include no response or multiple responses.
26. How would you describe your weight?
Male Female Unknown Total
Freq. Pct. Freq. Pct. Freq. Pct. Freq. Pct.
1 Very underweight 33 1 26 0 1 2 67 0.6
2 Slightly underweight 353 9 421 6 3 6 807 7.0
3 About the right weight 1947 50 3794 52 24 45 5,913 51.2
4 Slightly overweight 1358 35 2487 34 21 40 3,971 34.4
5 Very overweight 207 5 560 8 4 8 793 6.9
Valid responses = 3898 34 7288 63 53 0 11,551 99.9
Invalid responses include no response or multiple responses.
27. Are you trying to do any of the following about your weight?
Male Female Unknown Total
Freq. Pct. Freq. Pct. Freq. Pct. Freq. Pct.
1 I am not trying to do anything 668 17 1211 17 7 14 1,947 16.9
2 Stay the same weight 1043 27 1747 24 16 31 2,876 24.9
3 Lose weight 1726 44 4143 57 25 48 6,048 52.4
4 Gain weight 459 12 183 3 4 8 673 5.8
Valid responses = 3896 34 7284 63 52 0 11,544 99.9
Invalid responses include no response or multiple responses.
28. How many servings of fruits and vegetables do you usually have per day?
Male Female Unknown Total
Freq. Pct. Freq. Pct. Freq. Pct. Freq. Pct.
1 0 servings per day 231 6 270 4 2 4 528 4.6
2 1-2 servings per day 2328 60 3881 53 25 48 6,389 55.3
3 3-4 servings per day 1084 28 2558 35 21 40 3,762 32.6
4 5 or more servings per day 255 7 576 8 4 8 868 7.5
Valid responses = 3898 34 7285 63 52 0 11,547 99.9
Invalid responses include no response or multiple responses.
Page 29 of 60

Reference Group Data Report - Spring 2019
American College Health Association
8455 Colesville Road, Suite 740
Silver Spring, MD 20910 FREQUENCY REPORT
(410) 859-1500 Number of Surveys (n) = 11561 P & W Surveys
www.acha.org
American College Health Association-National College Health Assessment (ACHA-NCHA-II)
Graduate Students
August 19, 2019
29A. On how many of the past 7 days did you:
Do moderate intensity cardio or aerobic exercise for at least 30 minutes?
Male Female Unknown Total
Freq. Pct. Freq. Pct. Freq. Pct. Freq. Pct.
1 0 days 870 22 1546 21 10 20 2,498 21.8
2 1 day 584 15 1097 15 9 18 1,730 15.1
3 2 days 677 18 1379 19 9 18 2,132 18.6
4 3 days 590 15 1253 17 10 20 1,901 16.6
5 4 days 357 9 724 10 2 4 1,113 9.7
6 5 days 421 11 632 9 5 10 1,083 9.4
7 6 days 150 4 287 4 2 4 450 3.9
8 7 days 230 6 319 4 2 4 569 5.0
Valid responses = 3879 34 7237 63 49 0 11,476 99.3
Invalid responses include no response or multiple responses.
29B. On how many of the past 7 days did you:
Do vigorous intensity cardio or aerobic exercise for at least 20 minutes?
Male Female Unknown Total
Freq. Pct. Freq. Pct. Freq. Pct. Freq. Pct.
1 0 days 1578 41 3293 46 19 39 5,035 44.0
2 1 day 755 20 1242 17 8 16 2,055 18.0
3 2 days 528 14 1034 14 9 18 1,618 14.1
4 3 days 440 11 762 11 8 16 1,240 10.8
5 4 days 226 6 384 5 2 4 626 5.5
6 5 days 203 5 306 4 2 4 526 4.6
7 6 days 83 2 128 2 0 0 214 1.9
8 7 days 55 1 69 1 1 2 132 1.2
Valid responses = 3868 34 7218 63 49 0 11,446 99.0
Invalid responses include no response or multiple responses.
29C. On how many of the past 7 days did you:
Do 8-10 strength training exercises for 8-12 repetitions each?
Male Female Unknown Total
Freq. Pct. Freq. Pct. Freq. Pct. Freq. Pct.
1 0 days 1852 48 3864 54 28 56 5,911 51.6
2 1 day 484 13 988 14 5 10 1,513 13.2
3 2 days 421 11 899 12 5 10 1,359 11.9
4 3 days 489 13 675 9 6 12 1,201 10.5
5 4 days 263 7 369 5 5 10 655 5.7
6 5 days 237 6 245 3 0 0 494 4.3
7 6 days 84 2 126 2 0 0 213 1.9
8 7 days 45 1 57 1 1 2 112 1.0
Valid responses = 3875 34 7223 63 50 0 11,458 99.1
Invalid responses include no response or multiple responses.
30A. Have you ever felt things were hopeless?
Male Female Unknown Total
Freq. Pct. Freq. Pct. Freq. Pct. Freq. Pct.
1 Never 1343 35 1853 26 19 38 3,266 28.4
2 Not in last 12 months 835 22 1743 24 14 28 2,649 23.0
3 In the last 2 weeks 612 16 1218 17 10 20 1,929 16.8
4 In the last 30 days 324 8 777 11 0 0 1,135 9.9
5 In the last 12 months 774 20 1670 23 7 14 2,532 22.0
Valid responses = 3888 34 7261 63 50 0 11,511 99.6
Invalid responses include no response or multiple responses.
Page 30 of 60

Reference Group Data Report - Spring 2019
American College Health Association
8455 Colesville Road, Suite 740
Silver Spring, MD 20910 FREQUENCY REPORT
(410) 859-1500 Number of Surveys (n) = 11561 P & W Surveys
www.acha.org
American College Health Association-National College Health Assessment (ACHA-NCHA-II)
Graduate Students
August 19, 2019
30B. Have you ever felt overwhelmed by all you had to do?
Male Female Unknown Total
Freq. Pct. Freq. Pct. Freq. Pct. Freq. Pct.
1 Never 558 14 359 5 8 16 945 8.2
2 Not in last 12 months 339 9 310 4 6 12 664 5.8
3 In the last 2 weeks 1516 39 3954 55 22 45 5,682 49.4
4 In the last 30 days 600 15 1178 16 5 10 1,826 15.9
5 In the last 12 months 876 23 1459 20 8 16 2,392 20.8
Valid responses = 3889 34 7260 63 49 0 11,509 99.6
Invalid responses include no response or multiple responses.
30C. Have you ever felt exhausted (not from physical activity)?
Male Female Unknown Total
Freq. Pct. Freq. Pct. Freq. Pct. Freq. Pct.
1 Never 573 15 437 6 10 20 1,040 9.0
2 Not in last 12 months 316 8 361 5 5 10 691 6.0
3 In the last 2 weeks 1590 41 3941 54 19 38 5,740 49.8
4 In the last 30 days 615 16 1213 17 7 14 1,884 16.4
5 In the last 12 months 795 20 1312 18 9 18 2,160 18.8
Valid responses = 3889 34 7264 63 50 0 11,515 99.6
Invalid responses include no response or multiple responses.
30D. Have you ever felt very lonely?
Male Female Unknown Total
Freq. Pct. Freq. Pct. Freq. Pct. Freq. Pct.
1 Never 915 24 1138 16 17 35 2,110 18.4
2 Not in last 12 months 899 23 1730 24 13 27 2,684 23.3
3 In the last 2 weeks 769 20 1627 22 10 20 2,512 21.8
4 In the last 30 days 402 10 950 13 3 6 1,402 12.2
5 In the last 12 months 899 23 1808 25 6 12 2,789 24.3
Valid responses = 3884 34 7253 63 49 0 11,497 99.4
Invalid responses include no response or multiple responses.
30E. Have you ever felt very sad?
Male Female Unknown Total
Freq. Pct. Freq. Pct. Freq. Pct. Freq. Pct.
1 Never 812 21 868 12 14 29 1,727 15.0
2 Not in last 12 months 812 21 1269 18 14 29 2,131 18.5
3 In the last 2 weeks 787 20 2009 28 13 27 2,934 25.5
4 In the last 30 days 465 12 1095 15 2 4 1,605 14.0
5 In the last 12 months 1007 26 2011 28 6 12 3,097 26.9
Valid responses = 3883 34 7252 63 49 0 11,494 99.4
Invalid responses include no response or multiple responses.
30F. Have you ever felt so depressed that it was difficult to function?
Male Female Unknown Total
Freq. Pct. Freq. Pct. Freq. Pct. Freq. Pct.
1 Never 1577 41 2323 32 22 45 3,979 34.6
2 Not in last 12 months 916 24 1874 26 12 25 2,872 25.0
3 In the last 2 weeks 452 12 959 13 6 12 1,500 13.0
4 In the last 30 days 252 7 640 9 4 8 935 8.1
5 In the last 12 months 690 18 1463 20 5 10 2,221 19.3
Valid responses = 3887 34 7259 63 49 0 11,507 99.5
Invalid responses include no response or multiple responses.
Page 31 of 60
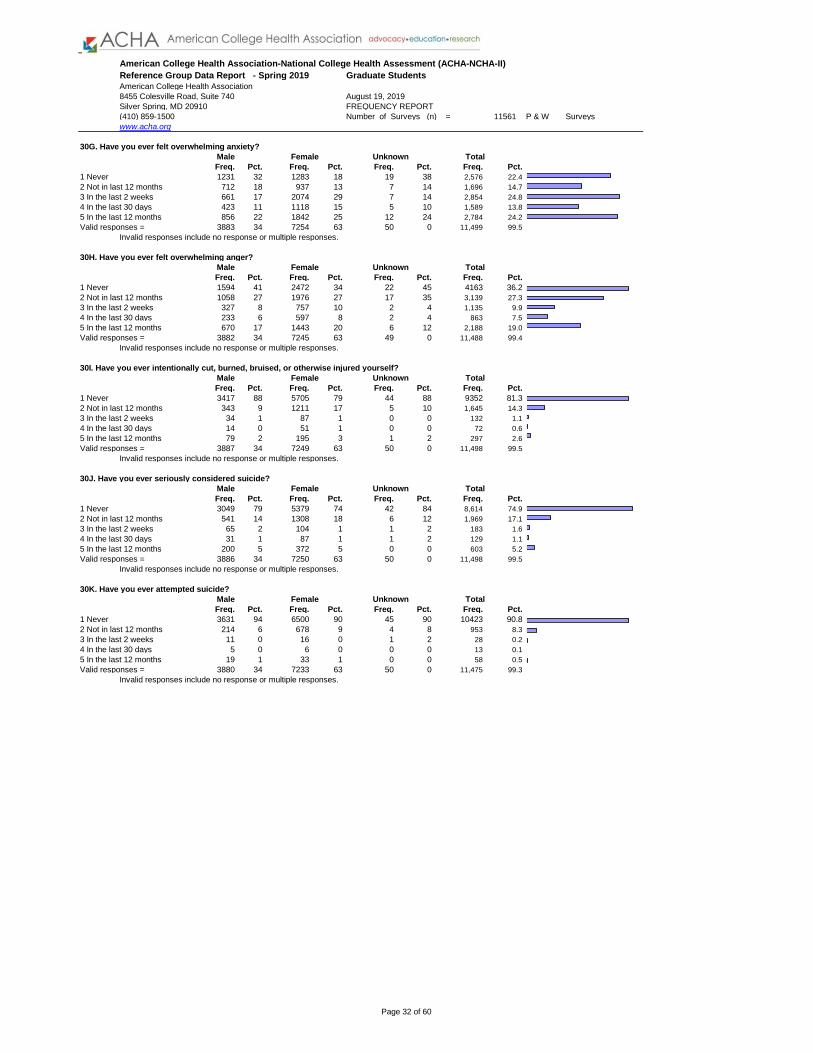
Reference Group Data Report - Spring 2019
American College Health Association
8455 Colesville Road, Suite 740
Silver Spring, MD 20910 FREQUENCY REPORT
(410) 859-1500 Number of Surveys (n) = 11561 P & W Surveys
www.acha.org
American College Health Association-National College Health Assessment (ACHA-NCHA-II)
Graduate Students
August 19, 2019
30G. Have you ever felt overwhelming anxiety?
Male Female Unknown Total
Freq. Pct. Freq. Pct. Freq. Pct. Freq. Pct.
1 Never 1231 32 1283 18 19 38 2,576 22.4
2 Not in last 12 months 712 18 937 13 7 14 1,696 14.7
3 In the last 2 weeks 661 17 2074 29 7 14 2,854 24.8
4 In the last 30 days 423 11 1118 15 5 10 1,589 13.8
5 In the last 12 months 856 22 1842 25 12 24 2,784 24.2
Valid responses = 3883 34 7254 63 50 0 11,499 99.5
Invalid responses include no response or multiple responses.
30H. Have you ever felt overwhelming anger?
Male Female Unknown Total
Freq. Pct. Freq. Pct. Freq. Pct. Freq. Pct.
1 Never 1594 41 2472 34 22 45 4163 36.2
2 Not in last 12 months 1058 27 1976 27 17 35 3,139 27.3
3 In the last 2 weeks 327 8 757 10 2 4 1,135 9.9
4 In the last 30 days 233 6 597 8 2 4 863 7.5
5 In the last 12 months 670 17 1443 20 6 12 2,188 19.0
Valid responses = 3882 34 7245 63 49 0 11,488 99.4
Invalid responses include no response or multiple responses.
30I. Have you ever intentionally cut, burned, bruised, or otherwise injured yourself?
Male Female Unknown Total
Freq. Pct. Freq. Pct. Freq. Pct. Freq. Pct.
1 Never 3417 88 5705 79 44 88 9352 81.3
2 Not in last 12 months 343 9 1211 17 5 10 1,645 14.3
3 In the last 2 weeks 34 1 87 1 0 0 132 1.1
4 In the last 30 days 14 0 51 1 0 0 72 0.6
5 In the last 12 months 79 2 195 3 1 2 297 2.6
Valid responses = 3887 34 7249 63 50 0 11,498 99.5
Invalid responses include no response or multiple responses.
30J. Have you ever seriously considered suicide?
Male Female Unknown Total
Freq. Pct. Freq. Pct. Freq. Pct. Freq. Pct.
1 Never 3049 79 5379 74 42 84 8,614 74.9
2 Not in last 12 months 541 14 1308 18 6 12 1,969 17.1
3 In the last 2 weeks 65 2 104 1 1 2 183 1.6
4 In the last 30 days 31 1 87 1 1 2 129 1.1
5 In the last 12 months 200 5 372 5 0 0 603 5.2
Valid responses = 3886 34 7250 63 50 0 11,498 99.5
Invalid responses include no response or multiple responses.
30K. Have you ever attempted suicide?
Male Female Unknown Total
Freq. Pct. Freq. Pct. Freq. Pct. Freq. Pct.
1 Never 3631 94 6500 90 45 90 10423 90.8
2 Not in last 12 months 214 6 678 9 4 8 953 8.3
3 In the last 2 weeks 11 0 16 0 1 2 28 0.2
4 In the last 30 days 5 0 6 0 0 0 13 0.1
5 In the last 12 months 19 1 33 1 0 0 58 0.5
Valid responses = 3880 34 7233 63 50 0 11,475 99.3
Invalid responses include no response or multiple responses.
Page 32 of 60

Reference Group Data Report - Spring 2019
American College Health Association
8455 Colesville Road, Suite 740
Silver Spring, MD 20910 FREQUENCY REPORT
(410) 859-1500 Number of Surveys (n) = 11561 P & W Surveys
www.acha.org
American College Health Association-National College Health Assessment (ACHA-NCHA-II)
Graduate Students
August 19, 2019
31A1. Within the last 12 months, have you been diagnosed or treated by a professional for any of the following:
Anorexia?
Male Female Unknown Total
Freq. Pct. Freq. Pct. Freq. Pct. Freq. Pct.
1 No 3859 100 7135 99 48 98 11341 98.8
2 Yes, diagnosed not treated 7 0 29 0 0 0 38 0.3
3 Yes, treated with medication 2 0 11 0 0 0 13 0.1
4 Yes, treated with psychotherapy 7 0 38 1 1 2 53 0.5
5 Yes, treated meds + psychotherapy 1 0 16 0 0 0 19 0.2
6 Yes, other treatment 0 0 13 0 0 0 13 0.1
Valid responses = 3876 34 7242 63 49 0 11,477 99.3
Invalid responses include no response or multiple responses.
31A2. Within the last 12 months, have you been diagnosed or treated by a professional for any of the following:
Anxiety?
Male Female Unknown Total
Freq. Pct. Freq. Pct. Freq. Pct. Freq. Pct.
1 No 3320 86 5021 69 40 80 8,559 74.5
2 Yes, diagnosed not treated 78 2 298 4 1 2 392 3.4
3 Yes, treated with medication 151 4 612 9 3 6 783 6.8
4 Yes, treated with psychotherapy 156 4 629 9 4 8 835 7.3
5 Yes, treated meds + psychotherapy 167 4 620 9 2 4 838 7.3
6 Yes, other treatment 10 0 60 1 0 0 74 0.6
Valid responses = 3882 34 7240 63 50 0 11,481 99.3
Invalid responses include no response or multiple responses.
31A3. Within the last 12 months, have you been diagnosed or treated by a professional for any of the following:
Attention Deficit and Hyperactivity Disorder (ADHD)?
Male Female Unknown Total
Freq. Pct. Freq. Pct. Freq. Pct. Freq. Pct.
1 No 3663 94 6814 94 47 96 10,794 93.9
2 Yes, diagnosed not treated 52 1 100 1 0 0 160 1.4
3 Yes, treated with medication 106 3 239 3 0 0 360 3.1
4 Yes, treated with psychotherapy 17 0 10 0 0 0 31 0.3
5 Yes, treated meds + psychotherapy 40 1 87 1 2 4 143 1.2
6 Yes, other treatment 2 0 3 0 0 0 6 0.1
Valid responses = 3880 34 7253 63 49 0 11,494 99.4
Invalid responses include no response or multiple responses.
31A4. Within the last 12 months, have you been diagnosed or treated by a professional for any of the following:
Bipolar Disorder?
Male Female Unknown Total
Freq. Pct. Freq. Pct. Freq. Pct. Freq. Pct.
1 No 3829 99 7124 98 49 100 11,295 98.3
2 Yes, diagnosed not treated 11 0 20 0 0 0 32 0.3
3 Yes, treated with medication 14 0 45 1 0 0 62 0.5
4 Yes, treated with psychotherapy 8 0 11 0 0 0 24 0.2
5 Yes, treated meds + psychotherapy 18 1 46 1 0 0 73 0.6
6 Yes, other treatment 0 0 0 0 0 0 0 0.0
Valid responses = 3880 34 7246 63 49 0 11,486 99.4
Invalid responses include no response or multiple responses.
Page 33 of 60
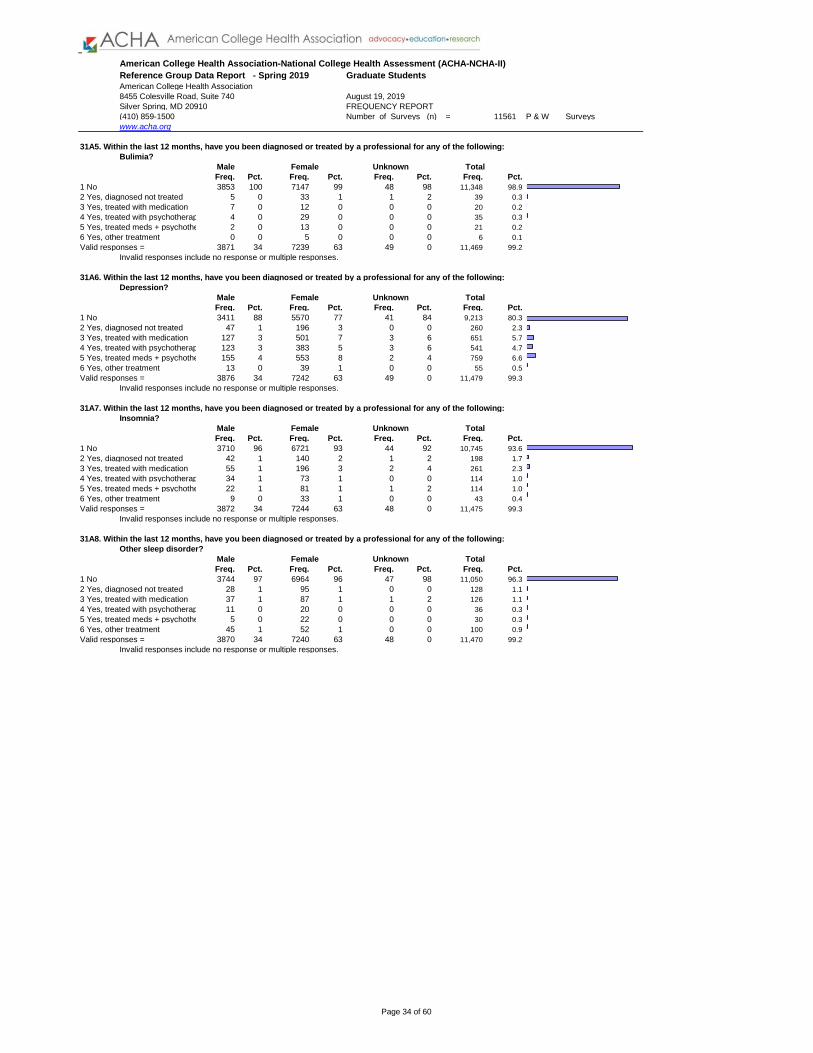
Reference Group Data Report - Spring 2019
American College Health Association
8455 Colesville Road, Suite 740
Silver Spring, MD 20910 FREQUENCY REPORT
(410) 859-1500 Number of Surveys (n) = 11561 P & W Surveys
www.acha.org
American College Health Association-National College Health Assessment (ACHA-NCHA-II)
Graduate Students
August 19, 2019
31A5. Within the last 12 months, have you been diagnosed or treated by a professional for any of the following:
Bulimia?
Male Female Unknown Total
Freq. Pct. Freq. Pct. Freq. Pct. Freq. Pct.
1 No 3853 100 7147 99 48 98 11,348 98.9
2 Yes, diagnosed not treated 5 0 33 1 1 2 39 0.3
3 Yes, treated with medication 7 0 12 0 0 0 20 0.2
4 Yes, treated with psychotherapy 4 0 29 0 0 0 35 0.3
5 Yes, treated meds + psychotherapy 2 0 13 0 0 0 21 0.2
6 Yes, other treatment 0 0 5 0 0 0 6 0.1
Valid responses = 3871 34 7239 63 49 0 11,469 99.2
Invalid responses include no response or multiple responses.
31A6. Within the last 12 months, have you been diagnosed or treated by a professional for any of the following:
Depression?
Male Female Unknown Total
Freq. Pct. Freq. Pct. Freq. Pct. Freq. Pct.
1 No 3411 88 5570 77 41 84 9,213 80.3
2 Yes, diagnosed not treated 47 1 196 3 0 0 260 2.3
3 Yes, treated with medication 127 3 501 7 3 6 651 5.7
4 Yes, treated with psychotherapy 123 3 383 5 3 6 541 4.7
5 Yes, treated meds + psychotherapy 155 4 553 8 2 4 759 6.6
6 Yes, other treatment 13 0 39 1 0 0 55 0.5
Valid responses = 3876 34 7242 63 49 0 11,479 99.3
Invalid responses include no response or multiple responses.
31A7. Within the last 12 months, have you been diagnosed or treated by a professional for any of the following:
Insomnia?
Male Female Unknown Total
Freq. Pct. Freq. Pct. Freq. Pct. Freq. Pct.
1 No 3710 96 6721 93 44 92 10,745 93.6
2 Yes, diagnosed not treated 42 1 140 2 1 2 198 1.7
3 Yes, treated with medication 55 1 196 3 2 4 261 2.3
4 Yes, treated with psychotherapy 34 1 73 1 0 0 114 1.0
5 Yes, treated meds + psychotherapy 22 1 81 1 1 2 114 1.0
6 Yes, other treatment 9 0 33 1 0 0 43 0.4
Valid responses = 3872 34 7244 63 48 0 11,475 99.3
Invalid responses include no response or multiple responses.
31A8. Within the last 12 months, have you been diagnosed or treated by a professional for any of the following:
Other sleep disorder?
Male Female Unknown Total
Freq. Pct. Freq. Pct. Freq. Pct. Freq. Pct.
1 No 3744 97 6964 96 47 98 11,050 96.3
2 Yes, diagnosed not treated 28 1 95 1 0 0 128 1.1
3 Yes, treated with medication 37 1 87 1 1 2 126 1.1
4 Yes, treated with psychotherapy 11 0 20 0 0 0 36 0.3
5 Yes, treated meds + psychotherapy 5 0 22 0 0 0 30 0.3
6 Yes, other treatment 45 1 52 1 0 0 100 0.9
Valid responses = 3870 34 7240 63 48 0 11,470 99.2
Invalid responses include no response or multiple responses.
Page 34 of 60

Reference Group Data Report - Spring 2019
American College Health Association
8455 Colesville Road, Suite 740
Silver Spring, MD 20910 FREQUENCY REPORT
(410) 859-1500 Number of Surveys (n) = 11561 P & W Surveys
www.acha.org
American College Health Association-National College Health Assessment (ACHA-NCHA-II)
Graduate Students
August 19, 2019
31B1. Within the last 12 months, have you been diagnosed or treated by a professional for any of the following:
Obsessive Compulsive Disorder (OCD)?
Male Female Unknown Total
Freq. Pct. Freq. Pct. Freq. Pct. Freq. Pct.
1 No 3809 98 7027 97 50 100 11,185 97.2
2 Yes, diagnosed not treated 26 1 60 1 0 0 91 0.8
3 Yes, treated with medication 13 0 65 1 0 0 80 0.7
4 Yes, treated with psychotherapy 19 1 55 1 0 0 75 0.7
5 Yes, treated meds + psychotherapy 17 0 55 1 0 0 77 0.7
6 Yes, other treatment 2 0 2 0 0 0 4 0.0
Valid responses = 3886 34 7264 63 50 0 11,512 99.6
Invalid responses include no response or multiple responses.
31B2. Within the last 12 months, have you been diagnosed or treated by a professional for any of the following:
Panic Attacks?
Male Female Unknown Total
Freq. Pct. Freq. Pct. Freq. Pct. Freq. Pct.
1 No 3716 96 6356 88 46 92 10,368 90.2
2 Yes, diagnosed not treated 35 1 185 3 2 4 231 2.0
3 Yes, treated with medication 49 1 254 4 2 4 320 2.8
4 Yes, treated with psychotherapy 29 1 214 3 0 0 258 2.2
5 Yes, treated meds + psychotherapy 53 1 215 3 0 0 288 2.5
6 Yes, other treatment 3 0 29 0 0 0 34 0.3
Valid responses = 3885 34 7253 63 50 0 11,499 99.5
Invalid responses include no response or multiple responses.
31B3. Within the last 12 months, have you been diagnosed or treated by a professional for any of the following:
Phobia?
Male Female Unknown Total
Freq. Pct. Freq. Pct. Freq. Pct. Freq. Pct.
1 No 3829 99 7115 99 47 96 11,291 98.7
2 Yes, diagnosed not treated 12 0 31 0 0 0 47 0.4
3 Yes, treated with medication 6 0 16 0 1 2 24 0.2
4 Yes, treated with psychotherapy 7 0 39 1 1 2 48 0.4
5 Yes, treated meds + psychotherapy 4 0 17 0 0 0 24 0.2
6 Yes, other treatment 0 0 3 0 0 0 3 0.0
Valid responses = 3858 34 7221 63 49 0 11,437 98.9
Invalid responses include no response or multiple responses.
31B4. Within the last 12 months, have you been diagnosed or treated by a professional for any of the following:
Schizophrenia?
Male Female Unknown Total
Freq. Pct. Freq. Pct. Freq. Pct. Freq. Pct.
1 No 3850 100 7187 100 50 100 11,390 99.7
2 Yes, diagnosed not treated 5 0 10 0 0 0 17 0.1
3 Yes, treated with medication 4 0 9 0 0 0 13 0.1
4 Yes, treated with psychotherapy 2 0 1 0 0 0 5 0.0
5 Yes, treated meds + psychotherapy 1 0 0 0 0 0 2 0.0
6 Yes, other treatment 0 0 0 0 0 0 0 0.0
Valid responses = 3862 34 7207 63 50 0 11,427 98.8
Invalid responses include no response or multiple responses.
Page 35 of 60
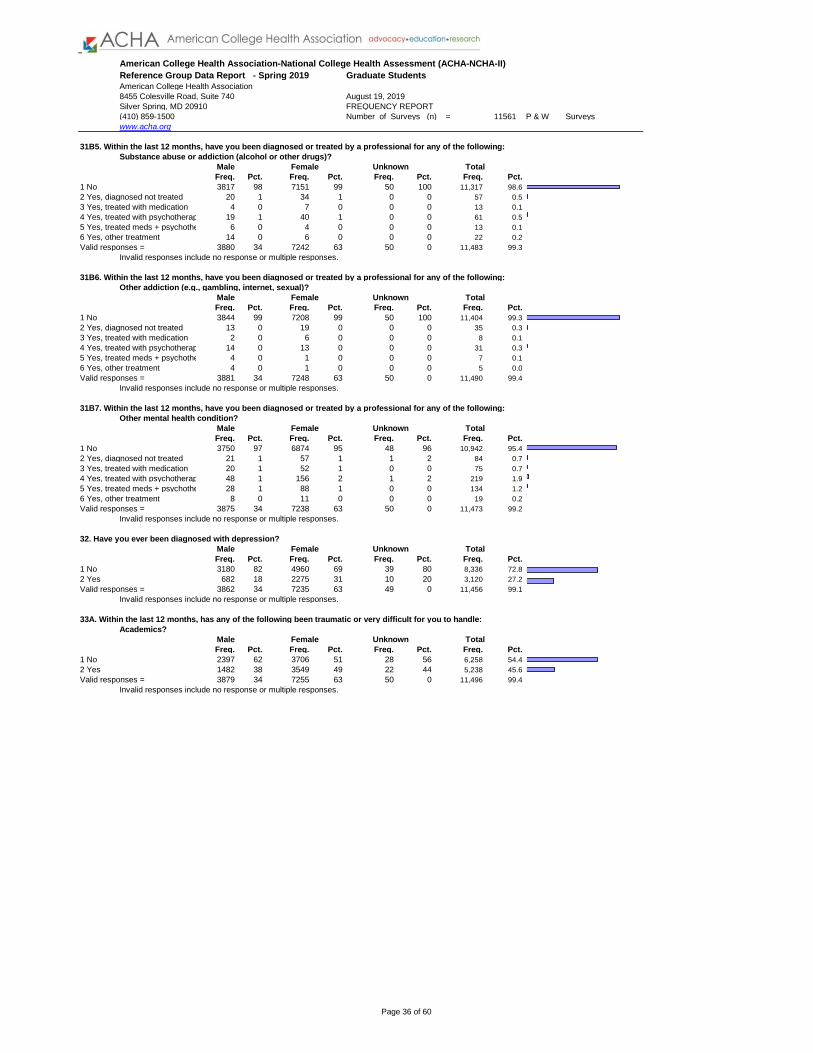
Reference Group Data Report - Spring 2019
American College Health Association
8455 Colesville Road, Suite 740
Silver Spring, MD 20910 FREQUENCY REPORT
(410) 859-1500 Number of Surveys (n) = 11561 P & W Surveys
www.acha.org
American College Health Association-National College Health Assessment (ACHA-NCHA-II)
Graduate Students
August 19, 2019
31B5. Within the last 12 months, have you been diagnosed or treated by a professional for any of the following:
Substance abuse or addiction (alcohol or other drugs)?
Male Female Unknown Total
Freq. Pct. Freq. Pct. Freq. Pct. Freq. Pct.
1 No 3817 98 7151 99 50 100 11,317 98.6
2 Yes, diagnosed not treated 20 1 34 1 0 0 57 0.5
3 Yes, treated with medication 4 0 7 0 0 0 13 0.1
4 Yes, treated with psychotherapy 19 1 40 1 0 0 61 0.5
5 Yes, treated meds + psychotherapy 6 0 4 0 0 0 13 0.1
6 Yes, other treatment 14 0 6 0 0 0 22 0.2
Valid responses = 3880 34 7242 63 50 0 11,483 99.3
Invalid responses include no response or multiple responses.
31B6. Within the last 12 months, have you been diagnosed or treated by a professional for any of the following:
Other addiction (e.g., gambling, internet, sexual)?
Male Female Unknown Total
Freq. Pct. Freq. Pct. Freq. Pct. Freq. Pct.
1 No 3844 99 7208 99 50 100 11,404 99.3
2 Yes, diagnosed not treated 13 0 19 0 0 0 35 0.3
3 Yes, treated with medication 2 0 6 0 0 0 8 0.1
4 Yes, treated with psychotherapy 14 0 13 0 0 0 31 0.3
5 Yes, treated meds + psychotherapy 4 0 1 0 0 0 7 0.1
6 Yes, other treatment 4 0 1 0 0 0 5 0.0
Valid responses = 3881 34 7248 63 50 0 11,490 99.4
Invalid responses include no response or multiple responses.
31B7. Within the last 12 months, have you been diagnosed or treated by a professional for any of the following:
Other mental health condition?
Male Female Unknown Total
Freq. Pct. Freq. Pct. Freq. Pct. Freq. Pct.
1 No 3750 97 6874 95 48 96 10,942 95.4
2 Yes, diagnosed not treated 21 1 57 1 1 2 84 0.7
3 Yes, treated with medication 20 1 52 1 0 0 75 0.7
4 Yes, treated with psychotherapy 48 1 156 2 1 2 219 1.9
5 Yes, treated meds + psychotherapy 28 1 88 1 0 0 134 1.2
6 Yes, other treatment 8 0 11 0 0 0 19 0.2
Valid responses = 3875 34 7238 63 50 0 11,473 99.2
Invalid responses include no response or multiple responses.
32. Have you ever been diagnosed with depression?
Male Female Unknown Total
Freq. Pct. Freq. Pct. Freq. Pct. Freq. Pct.
1 No 3180 82 4960 69 39 80 8,336 72.8
2 Yes 682 18 2275 31 10 20 3,120 27.2
Valid responses = 3862 34 7235 63 49 0 11,456 99.1
Invalid responses include no response or multiple responses.
33A. Within the last 12 months, has any of the following been traumatic or very difficult for you to handle:
Academics?
Male Female Unknown Total
Freq. Pct. Freq. Pct. Freq. Pct. Freq. Pct.
1 No 2397 62 3706 51 28 56 6,258 54.4
2 Yes 1482 38 3549 49 22 44 5,238 45.6
Valid responses = 3879 34 7255 63 50 0 11,496 99.4
Invalid responses include no response or multiple responses.
Page 36 of 60

Reference Group Data Report - Spring 2019
American College Health Association
8455 Colesville Road, Suite 740
Silver Spring, MD 20910 FREQUENCY REPORT
(410) 859-1500 Number of Surveys (n) = 11561 P & W Surveys
www.acha.org
American College Health Association-National College Health Assessment (ACHA-NCHA-II)
Graduate Students
August 19, 2019
33B. Within the last 12 months, has any of the following been traumatic or very difficult for you to handle:
Career related issue?
Male Female Unknown Total
Freq. Pct. Freq. Pct. Freq. Pct. Freq. Pct.
1 No 2547 66 4413 61 31 63 7,166 62.3
2 Yes 1330 34 2845 39 18 37 4,329 37.7
Valid responses = 3877 34 7258 63 49 0 11,495 99.4
Invalid responses include no response or multiple responses.
33C. Within the last 12 months, has any of the following been traumatic or very difficult for you to handle:
Death of a family member or friend?
Male Female Unknown Total
Freq. Pct. Freq. Pct. Freq. Pct. Freq. Pct.
1 No 3469 90 6125 85 41 84 9,896 86.1
2 Yes 406 11 1127 16 8 16 1,591 13.9
Valid responses = 3875 34 7252 63 49 0 11,487 99.4
Invalid responses include no response or multiple responses.
33D. Within the last 12 months, has any of the following been traumatic or very difficult for you to handle:
Family problems?
Male Female Unknown Total
Freq. Pct. Freq. Pct. Freq. Pct. Freq. Pct.
1 No 3162 82 5135 71 40 82 8,522 74.2
2 Yes 707 18 2114 29 9 18 2,957 25.8
Valid responses = 3869 34 7249 63 49 0 11,479 99.3
Invalid responses include no response or multiple responses.
33E. Within the last 12 months, has any of the following been traumatic or very difficult for you to handle:
Intimate relationships?
Male Female Unknown Total
Freq. Pct. Freq. Pct. Freq. Pct. Freq. Pct.
1 No 2878 74 5123 71 38 78 8,218 71.5
2 Yes 1003 26 2133 29 11 22 3,279 28.5
Valid responses = 3881 34 7256 63 49 0 11,497 99.4
Invalid responses include no response or multiple responses.
33F. Within the last 12 months, has any of the following been traumatic or very difficult for you to handle:
Other relationships?
Male Female Unknown Total
Freq. Pct. Freq. Pct. Freq. Pct. Freq. Pct.
1 No 3197 82 5603 77 39 78 9,030 78.5
2 Yes 681 18 1656 23 11 22 2,467 21.5
Valid responses = 3878 34 7259 63 50 0 11,497 99.4
Invalid responses include no response or multiple responses.
33G. Within the last 12 months, has any of the following been traumatic or very difficult for you to handle:
Finances?
Male Female Unknown Total
Freq. Pct. Freq. Pct. Freq. Pct. Freq. Pct.
1 No 2882 74 4707 65 34 68 7,793 67.9
2 Yes 994 26 2541 35 16 32 3,692 32.1
Valid responses = 3876 34 7248 63 50 0 11,485 99.3
Invalid responses include no response or multiple responses.
33H. Within the last 12 months, has any of the following been traumatic or very difficult for you to handle:
Health problem of a family member or partner?
Male Female Unknown Total
Freq. Pct. Freq. Pct. Freq. Pct. Freq. Pct.
1 No 3342 86 5659 78 42 86 9,261 80.7
2 Yes 531 14 1587 22 7 14 2,218 19.3
Valid responses = 3873 34 7246 63 49 0 11,479 99.3
Invalid responses include no response or multiple responses.
Page 37 of 60
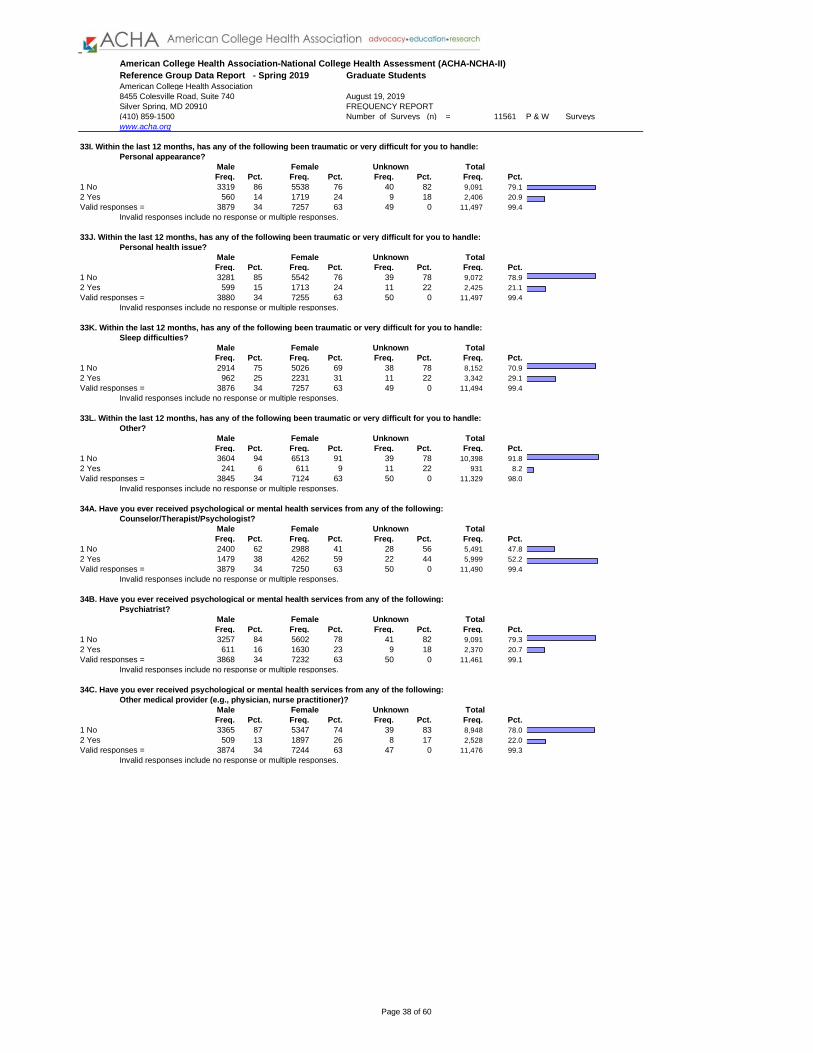
Reference Group Data Report - Spring 2019
American College Health Association
8455 Colesville Road, Suite 740
Silver Spring, MD 20910 FREQUENCY REPORT
(410) 859-1500 Number of Surveys (n) = 11561 P & W Surveys
www.acha.org
American College Health Association-National College Health Assessment (ACHA-NCHA-II)
Graduate Students
August 19, 2019
33I. Within the last 12 months, has any of the following been traumatic or very difficult for you to handle:
Personal appearance?
Male Female Unknown Total
Freq. Pct. Freq. Pct. Freq. Pct. Freq. Pct.
1 No 3319 86 5538 76 40 82 9,091 79.1
2 Yes 560 14 1719 24 9 18 2,406 20.9
Valid responses = 3879 34 7257 63 49 0 11,497 99.4
Invalid responses include no response or multiple responses.
33J. Within the last 12 months, has any of the following been traumatic or very difficult for you to handle:
Personal health issue?
Male Female Unknown Total
Freq. Pct. Freq. Pct. Freq. Pct. Freq. Pct.
1 No 3281 85 5542 76 39 78 9,072 78.9
2 Yes 599 15 1713 24 11 22 2,425 21.1
Valid responses = 3880 34 7255 63 50 0 11,497 99.4
Invalid responses include no response or multiple responses.
33K. Within the last 12 months, has any of the following been traumatic or very difficult for you to handle:
Sleep difficulties?
Male Female Unknown Total
Freq. Pct. Freq. Pct. Freq. Pct. Freq. Pct.
1 No 2914 75 5026 69 38 78 8,152 70.9
2 Yes 962 25 2231 31 11 22 3,342 29.1
Valid responses = 3876 34 7257 63 49 0 11,494 99.4
Invalid responses include no response or multiple responses.
33L. Within the last 12 months, has any of the following been traumatic or very difficult for you to handle:
Other?
Male Female Unknown Total
Freq. Pct. Freq. Pct. Freq. Pct. Freq. Pct.
1 No 3604 94 6513 91 39 78 10,398 91.8
2 Yes 241 6 611 9 11 22 931 8.2
Valid responses = 3845 34 7124 63 50 0 11,329 98.0
Invalid responses include no response or multiple responses.
34A. Have you ever received psychological or mental health services from any of the following:
Counselor/Therapist/Psychologist?
Male Female Unknown Total
Freq. Pct. Freq. Pct. Freq. Pct. Freq. Pct.
1 No 2400 62 2988 41 28 56 5,491 47.8
2 Yes 1479 38 4262 59 22 44 5,999 52.2
Valid responses = 3879 34 7250 63 50 0 11,490 99.4
Invalid responses include no response or multiple responses.
34B. Have you ever received psychological or mental health services from any of the following:
Psychiatrist?
Male Female Unknown Total
Freq. Pct. Freq. Pct. Freq. Pct. Freq. Pct.
1 No 3257 84 5602 78 41 82 9,091 79.3
2 Yes 611 16 1630 23 9 18 2,370 20.7
Valid responses = 3868 34 7232 63 50 0 11,461 99.1
Invalid responses include no response or multiple responses.
34C. Have you ever received psychological or mental health services from any of the following:
Other medical provider (e.g., physician, nurse practitioner)?
Male Female Unknown Total
Freq. Pct. Freq. Pct. Freq. Pct. Freq. Pct.
1 No 3365 87 5347 74 39 83 8,948 78.0
2 Yes 509 13 1897 26 8 17 2,528 22.0
Valid responses = 3874 34 7244 63 47 0 11,476 99.3
Invalid responses include no response or multiple responses.
Page 38 of 60

Reference Group Data Report - Spring 2019
American College Health Association
8455 Colesville Road, Suite 740
Silver Spring, MD 20910 FREQUENCY REPORT
(410) 859-1500 Number of Surveys (n) = 11561 P & W Surveys
www.acha.org
American College Health Association-National College Health Assessment (ACHA-NCHA-II)
Graduate Students
August 19, 2019
34D. Have you ever received psychological or mental health services from any of the following:
Minister/Priest/Rabbi/Other clergy?
Male Female Unknown Total
Freq. Pct. Freq. Pct. Freq. Pct. Freq. Pct.
1 No 3588 93 6707 93 45 94 10,615 92.6
2 Yes 278 7 529 7 3 6 844 7.4
Valid responses = 3866 34 7236 63 48 0 11,459 99.1
Invalid responses include no response or multiple responses.
35. Have you ever received psychological or mental health services from your current college/university's
Counseling or Health Service?
Male Female Unknown Total
Freq. Pct. Freq. Pct. Freq. Pct. Freq. Pct.
1 No 3084 79 5221 72 39 77 8,523 74.0
2 Yes 799 21 2057 28 12 24 3,000 26.0
Valid responses = 3883 34 7278 63 51 0 11,523 99.7
Invalid responses include no response or multiple responses.
36. If in the future you were having a personal problem that was really bothering you, would you consider seeking
help from a mental health professional?
Male Female Unknown Total
Freq. Pct. Freq. Pct. Freq. Pct. Freq. Pct.
1 No 643 17 657 9 11 21 1,348 11.7
2 Yes 3241 83 6618 91 41 79 10,174 88.3
Valid responses = 3884 34 7275 63 52 0 11,522 99.7
Invalid responses include no response or multiple responses.
37. Within the last 12 months, how would you rate the overall level of stress you have experienced?
Male Female Unknown Total
Freq. Pct. Freq. Pct. Freq. Pct. Freq. Pct.
1 No stress 95 2 52 1 2 4 157 1.4
2 Less than average stress 444 11 261 4 5 10 718 6.2
3 Average stress 1245 32 1909 26 14 27 3,225 28.0
4 More than average stress 1649 42 3801 52 25 48 5,637 48.9
5 Tremendous stress 458 12 1258 17 6 12 1,798 15.6
Valid responses = 3891 34 7281 63 52 0 11,535 99.8
Invalid responses include no response or multiple responses.
38A. Within the last 30 days, did you do any of the following:
Exercise to lose weight?
Male Female Unknown Total
Freq. Pct. Freq. Pct. Freq. Pct. Freq. Pct.
1 No 2021 52 3116 43 21 43 5,326 46.3
2 Yes 1861 48 4147 57 28 57 6,180 53.7
Valid responses = 3882 34 7263 63 49 0 11,506 99.5
Invalid responses include no response or multiple responses.
38B. Within the last 30 days, did you do any of the following:
Diet to lose weight?
Male Female Unknown Total
Freq. Pct. Freq. Pct. Freq. Pct. Freq. Pct.
1 No 2430 63 4019 56 26 53 6,670 58.1
2 Yes 1452 37 3226 45 23 47 4,818 41.9
Valid responses = 3882 34 7245 63 49 0 11,488 99.4
Invalid responses include no response or multiple responses.
Page 39 of 60
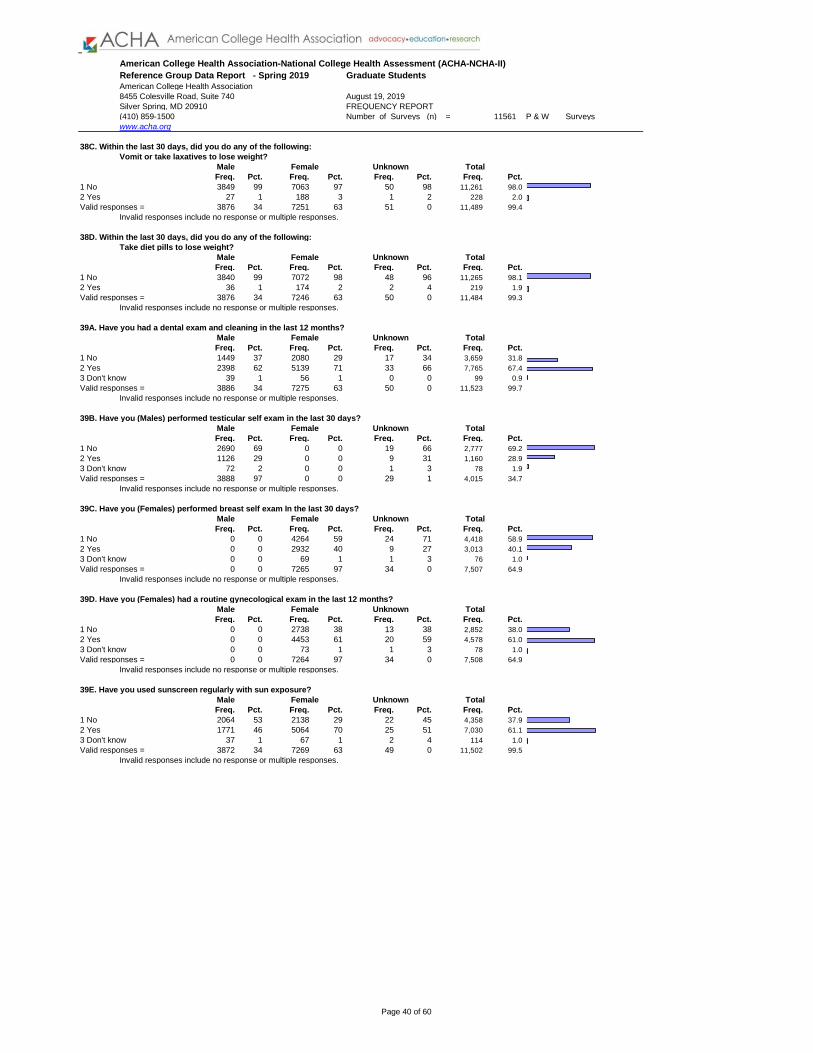
Reference Group Data Report - Spring 2019
American College Health Association
8455 Colesville Road, Suite 740
Silver Spring, MD 20910 FREQUENCY REPORT
(410) 859-1500 Number of Surveys (n) = 11561 P & W Surveys
www.acha.org
American College Health Association-National College Health Assessment (ACHA-NCHA-II)
Graduate Students
August 19, 2019
38C. Within the last 30 days, did you do any of the following:
Vomit or take laxatives to lose weight?
Male Female Unknown Total
Freq. Pct. Freq. Pct. Freq. Pct. Freq. Pct.
1 No 3849 99 7063 97 50 98 11,261 98.0
2 Yes 27 1 188 3 1 2 228 2.0
Valid responses = 3876 34 7251 63 51 0 11,489 99.4
Invalid responses include no response or multiple responses.
38D. Within the last 30 days, did you do any of the following:
Take diet pills to lose weight?
Male Female Unknown Total
Freq. Pct. Freq. Pct. Freq. Pct. Freq. Pct.
1 No 3840 99 7072 98 48 96 11,265 98.1
2 Yes 36 1 174 2 2 4 219 1.9
Valid responses = 3876 34 7246 63 50 0 11,484 99.3
Invalid responses include no response or multiple responses.
39A. Have you had a dental exam and cleaning in the last 12 months?
Male Female Unknown Total
Freq. Pct. Freq. Pct. Freq. Pct. Freq. Pct.
1 No 1449 37 2080 29 17 34 3,659 31.8
2 Yes 2398 62 5139 71 33 66 7,765 67.4
3 Don't know 39 1 56 1 0 0 99 0.9
Valid responses = 3886 34 7275 63 50 0 11,523 99.7
Invalid responses include no response or multiple responses.
39B. Have you (Males) performed testicular self exam in the last 30 days?
Male Female Unknown Total
Freq. Pct. Freq. Pct. Freq. Pct. Freq. Pct.
1 No 2690 69 0 0 19 66 2,777 69.2
2 Yes 1126 29 0 0 9 31 1,160 28.9
3 Don't know 72 2 0 0 1 3 78 1.9
Valid responses = 3888 97 0 0 29 1 4,015 34.7
Invalid responses include no response or multiple responses.
39C. Have you (Females) performed breast self exam In the last 30 days?
Male Female Unknown Total
Freq. Pct. Freq. Pct. Freq. Pct. Freq. Pct.
1 No 0 0 4264 59 24 71 4,418 58.9
2 Yes 0 0 2932 40 9 27 3,013 40.1
3 Don't know 0 0 69 1 1 3 76 1.0
Valid responses = 0 0 7265 97 34 0 7,507 64.9
Invalid responses include no response or multiple responses.
39D. Have you (Females) had a routine gynecological exam in the last 12 months?
Male Female Unknown Total
Freq. Pct. Freq. Pct. Freq. Pct. Freq. Pct.
1 No 0 0 2738 38 13 38 2,852 38.0
2 Yes 0 0 4453 61 20 59 4,578 61.0
3 Don't know 0 0 73 1 1 3 78 1.0
Valid responses = 0 0 7264 97 34 0 7,508 64.9
Invalid responses include no response or multiple responses.
39E. Have you used sunscreen regularly with sun exposure?
Male Female Unknown Total
Freq. Pct. Freq. Pct. Freq. Pct. Freq. Pct.
1 No 2064 53 2138 29 22 45 4,358 37.9
2 Yes 1771 46 5064 70 25 51 7,030 61.1
3 Don't know 37 1 67 1 2 4 114 1.0
Valid responses = 3872 34 7269 63 49 0 11,502 99.5
Invalid responses include no response or multiple responses.
Page 40 of 60

Reference Group Data Report - Spring 2019
American College Health Association
8455 Colesville Road, Suite 740
Silver Spring, MD 20910 FREQUENCY REPORT
(410) 859-1500 Number of Surveys (n) = 11561 P & W Surveys
www.acha.org
American College Health Association-National College Health Assessment (ACHA-NCHA-II)
Graduate Students
August 19, 2019
39F. Have you ever been tested for Human Immunodeficiency Virus (HIV) infection?
Male Female Unknown Total
Freq. Pct. Freq. Pct. Freq. Pct. Freq. Pct.
1 No 2393 62 3493 48 23 48 6,043 52.5
2 Yes 1378 36 3410 47 21 44 4,976 43.3
3 Don't know 106 3 362 5 4 8 483 4.2
Valid responses = 3877 34 7265 63 48 0 11,502 99.5
Invalid responses include no response or multiple responses.
40A. Have you received the following vaccinations (shots or series of shots):
Hepatitis B?
Male Female Unknown Total
Freq. Pct. Freq. Pct. Freq. Pct. Freq. Pct.
1 No 421 11 607 8 4 9 1,064 9.3
2 Yes 2914 76 5668 79 35 75 8,838 77.4
3 Don't know 522 14 936 13 8 17 1,523 13.3
Valid responses = 3857 34 7211 63 47 0 11,425 98.8
Invalid responses include no response or multiple responses.
40B. Have you received the following vaccinations (shots series of shots)):
Human Papillomavirus/HPV (cervical cancer vaccine)?
Male Female Unknown Total
Freq. Pct. Freq. Pct. Freq. Pct. Freq. Pct.
1 No 1654 43 2239 31 19 39 4,018 35.2
2 Yes 1462 38 4554 63 23 47 6,207 54.3
3 Don't know 708 19 449 6 7 14 1,201 10.5
Valid responses = 3824 33 7242 63 49 0 11,426 98.8
Invalid responses include no response or multiple responses.
40C. Have you received the following vaccinations (shots series of shots)):
Influenza (the flu) in the last 12 months (shot or nasal mist)?
Male Female Unknown Total
Freq. Pct. Freq. Pct. Freq. Pct. Freq. Pct.
1 No 1514 39 2673 37 14 29 4,328 37.7
2 Yes 2199 57 4440 61 32 65 6,848 59.6
3 Don't know 157 4 138 2 3 6 305 2.7
Valid responses = 3870 34 7251 63 49 0 11,481 99.3
Invalid responses include no response or multiple responses.
40D. Have you received the following vaccinations (shots series of shots)):
Measles, Mumps, Rubella?
Male Female Unknown Total
Freq. Pct. Freq. Pct. Freq. Pct. Freq. Pct.
1 No 309 8 327 5 2 4 657 5.7
2 Yes 3357 87 6661 92 44 90 10,341 90.1
3 Don't know 206 5 261 4 3 6 482 4.2
Valid responses = 3872 34 7249 63 49 0 11,480 99.3
Invalid responses include no response or multiple responses.
40E. Have you received the following vaccinations (shots):
Meningococcal disease (meningococcal meningitis)?
Male Female Unknown Total
Freq. Pct. Freq. Pct. Freq. Pct. Freq. Pct.
1 No 510 13 755 10 6 13 1,301 11.3
2 Yes 2738 71 5538 76 36 75 8,547 74.5
3 Don't know 624 16 953 13 6 13 1,629 14.2
Valid responses = 3872 34 7246 63 48 0 11,477 99.3
Invalid responses include no response or multiple responses.
Page 41 of 60

Reference Group Data Report - Spring 2019
American College Health Association
8455 Colesville Road, Suite 740
Silver Spring, MD 20910 FREQUENCY REPORT
(410) 859-1500 Number of Surveys (n) = 11561 P & W Surveys
www.acha.org
American College Health Association-National College Health Assessment (ACHA-NCHA-II)
Graduate Students
August 19, 2019
40F. Have you received the following vaccinations (shots):
Varicella (chicken pox)?
Male Female Unknown Total
Freq. Pct. Freq. Pct. Freq. Pct. Freq. Pct.
1 No 1061 27 1908 26 11 24 3,060 26.7
2 Yes 2390 62 4811 67 30 67 7,432 64.8
3 Don't know 415 11 521 7 4 9 970 8.5
Valid responses = 3866 34 7240 63 45 0 11,462 99.1
Invalid responses include no response or multiple responses.
41A1. Within the last 12 months, have you been diagnosed or treated by a professional for the following:
Allergies?
Male Female Unknown Total
Freq. Pct. Freq. Pct. Freq. Pct. Freq. Pct.
1 No 3396 88 5832 81 41 85 9,517 82.9
2 Yes 484 13 1417 20 7 15 1,970 17.1
Valid responses = 3880 34 7249 63 48 0 11,487 99.4
Invalid responses include no response or multiple responses.
41A2. Within the last 12 months, have you been diagnosed or treated by a professional for the following:
Asthma?
Male Female Unknown Total
Freq. Pct. Freq. Pct. Freq. Pct. Freq. Pct.
1 No 3698 95 6591 91 43 90 10,611 92.5
2 Yes 179 5 649 9 5 10 865 7.5
Valid responses = 3877 34 7240 63 48 0 11,476 99.3
Invalid responses include no response or multiple responses.
41A3. Within the last 12 months, have you been diagnosed or treated by a professional for the following:
Back pain?
Male Female Unknown Total
Freq. Pct. Freq. Pct. Freq. Pct. Freq. Pct.
1 No 3431 89 6098 84 47 98 9,832 85.8
2 Yes 442 11 1134 16 1 2 1,630 14.2
Valid responses = 3873 34 7232 63 48 0 11,462 99.1
Invalid responses include no response or multiple responses.
41A4. Within the last 12 months, have you been diagnosed or treated by a professional for the following:
Broken bone/Fracture/Sprain?
Male Female Unknown Total
Freq. Pct. Freq. Pct. Freq. Pct. Freq. Pct.
1 No 3678 95 6915 96 47 98 10,939 95.4
2 Yes 192 5 325 5 1 2 530 4.6
Valid responses = 3870 34 7240 63 48 0 11,469 99.2
Invalid responses include no response or multiple responses.
41A5. Within the last 12 months, have you been diagnosed or treated by a professional for the following:
Bronchitis?
Male Female Unknown Total
Freq. Pct. Freq. Pct. Freq. Pct. Freq. Pct.
1 No 3772 98 6855 95 47 98 10,968 95.8
2 Yes 90 2 372 5 1 2 480 4.2
Valid responses = 3862 34 7227 63 48 0 11,448 99.0
Invalid responses include no response or multiple responses.
41A6. Within the last 12 months, have you been diagnosed or treated by a professional for the following:
Chlamydia?
Male Female Unknown Total
Freq. Pct. Freq. Pct. Freq. Pct. Freq. Pct.
1 No 3831 99 7187 99 47 98 11,371 99.0
2 Yes 46 1 64 1 1 2 114 1.0
Valid responses = 3877 34 7251 63 48 0 11,485 99.3
Invalid responses include no response or multiple responses.
Page 42 of 60
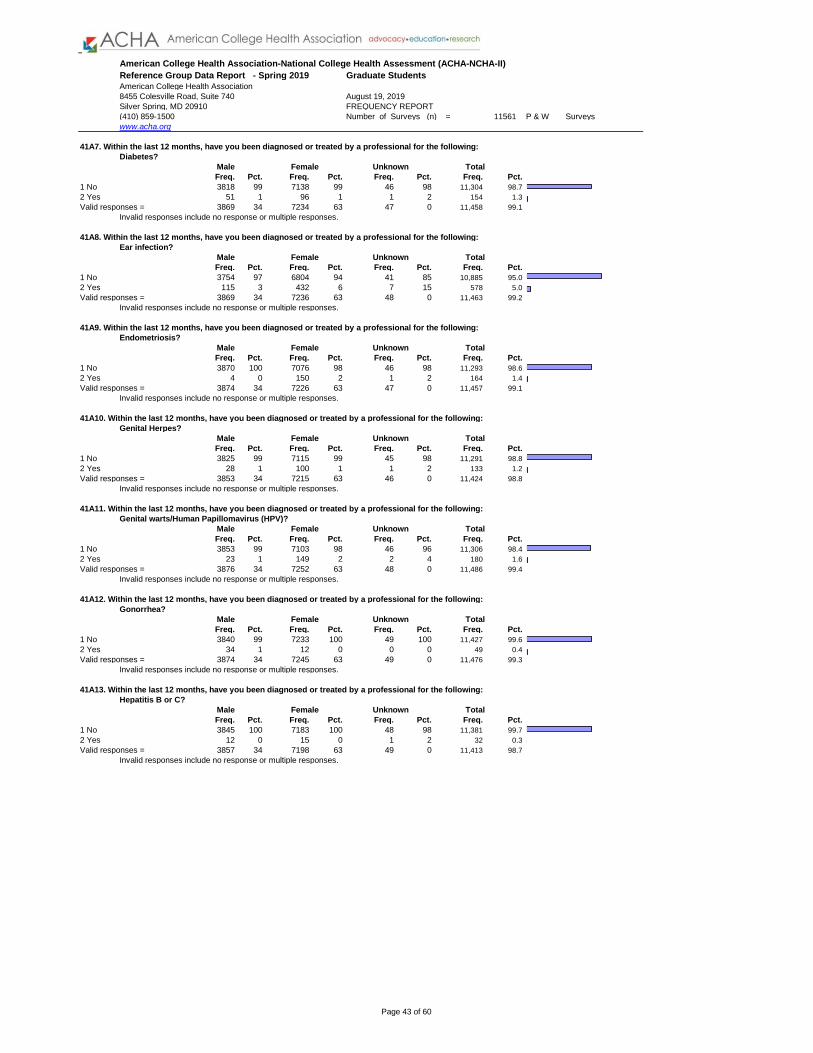
Reference Group Data Report - Spring 2019
American College Health Association
8455 Colesville Road, Suite 740
Silver Spring, MD 20910 FREQUENCY REPORT
(410) 859-1500 Number of Surveys (n) = 11561 P & W Surveys
www.acha.org
American College Health Association-National College Health Assessment (ACHA-NCHA-II)
Graduate Students
August 19, 2019
41A7. Within the last 12 months, have you been diagnosed or treated by a professional for the following:
Diabetes?
Male Female Unknown Total
Freq. Pct. Freq. Pct. Freq. Pct. Freq. Pct.
1 No 3818 99 7138 99 46 98 11,304 98.7
2 Yes 51 1 96 1 1 2 154 1.3
Valid responses = 3869 34 7234 63 47 0 11,458 99.1
Invalid responses include no response or multiple responses.
41A8. Within the last 12 months, have you been diagnosed or treated by a professional for the following:
Ear infection?
Male Female Unknown Total
Freq. Pct. Freq. Pct. Freq. Pct. Freq. Pct.
1 No 3754 97 6804 94 41 85 10,885 95.0
2 Yes 115 3 432 6 7 15 578 5.0
Valid responses = 3869 34 7236 63 48 0 11,463 99.2
Invalid responses include no response or multiple responses.
41A9. Within the last 12 months, have you been diagnosed or treated by a professional for the following:
Endometriosis?
Male Female Unknown Total
Freq. Pct. Freq. Pct. Freq. Pct. Freq. Pct.
1 No 3870 100 7076 98 46 98 11,293 98.6
2 Yes 4 0 150 2 1 2 164 1.4
Valid responses = 3874 34 7226 63 47 0 11,457 99.1
Invalid responses include no response or multiple responses.
41A10. Within the last 12 months, have you been diagnosed or treated by a professional for the following:
Genital Herpes?
Male Female Unknown Total
Freq. Pct. Freq. Pct. Freq. Pct. Freq. Pct.
1 No 3825 99 7115 99 45 98 11,291 98.8
2 Yes 28 1 100 1 1 2 133 1.2
Valid responses = 3853 34 7215 63 46 0 11,424 98.8
Invalid responses include no response or multiple responses.
41A11. Within the last 12 months, have you been diagnosed or treated by a professional for the following:
Genital warts/Human Papillomavirus (HPV)?
Male Female Unknown Total
Freq. Pct. Freq. Pct. Freq. Pct. Freq. Pct.
1 No 3853 99 7103 98 46 96 11,306 98.4
2 Yes 23 1 149 2 2 4 180 1.6
Valid responses = 3876 34 7252 63 48 0 11,486 99.4
Invalid responses include no response or multiple responses.
41A12. Within the last 12 months, have you been diagnosed or treated by a professional for the following:
Gonorrhea?
Male Female Unknown Total
Freq. Pct. Freq. Pct. Freq. Pct. Freq. Pct.
1 No 3840 99 7233 100 49 100 11,427 99.6
2 Yes 34 1 12 0 0 0 49 0.4
Valid responses = 3874 34 7245 63 49 0 11,476 99.3
Invalid responses include no response or multiple responses.
41A13. Within the last 12 months, have you been diagnosed or treated by a professional for the following:
Hepatitis B or C?
Male Female Unknown Total
Freq. Pct. Freq. Pct. Freq. Pct. Freq. Pct.
1 No 3845 100 7183 100 48 98 11,381 99.7
2 Yes 12 0 15 0 1 2 32 0.3
Valid responses = 3857 34 7198 63 49 0 11,413 98.7
Invalid responses include no response or multiple responses.
Page 43 of 60
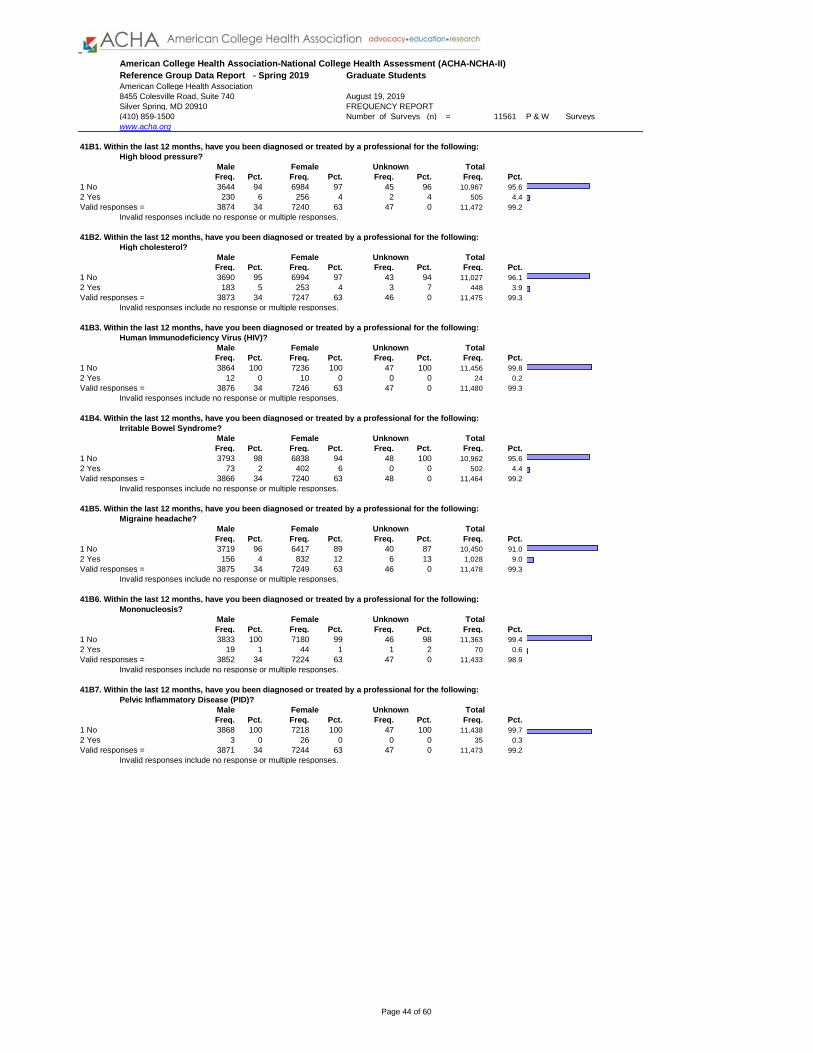
Reference Group Data Report - Spring 2019
American College Health Association
8455 Colesville Road, Suite 740
Silver Spring, MD 20910 FREQUENCY REPORT
(410) 859-1500 Number of Surveys (n) = 11561 P & W Surveys
www.acha.org
American College Health Association-National College Health Assessment (ACHA-NCHA-II)
Graduate Students
August 19, 2019
41B1. Within the last 12 months, have you been diagnosed or treated by a professional for the following:
High blood pressure?
Male Female Unknown Total
Freq. Pct. Freq. Pct. Freq. Pct. Freq. Pct.
1 No 3644 94 6984 97 45 96 10,967 95.6
2 Yes 230 6 256 4 2 4 505 4.4
Valid responses = 3874 34 7240 63 47 0 11,472 99.2
Invalid responses include no response or multiple responses.
41B2. Within the last 12 months, have you been diagnosed or treated by a professional for the following:
High cholesterol?
Male Female Unknown Total
Freq. Pct. Freq. Pct. Freq. Pct. Freq. Pct.
1 No 3690 95 6994 97 43 94 11,027 96.1
2 Yes 183 5 253 4 3 7 448 3.9
Valid responses = 3873 34 7247 63 46 0 11,475 99.3
Invalid responses include no response or multiple responses.
41B3. Within the last 12 months, have you been diagnosed or treated by a professional for the following:
Human Immunodeficiency Virus (HIV)?
Male Female Unknown Total
Freq. Pct. Freq. Pct. Freq. Pct. Freq. Pct.
1 No 3864 100 7236 100 47 100 11,456 99.8
2 Yes 12 0 10 0 0 0 24 0.2
Valid responses = 3876 34 7246 63 47 0 11,480 99.3
Invalid responses include no response or multiple responses.
41B4. Within the last 12 months, have you been diagnosed or treated by a professional for the following:
Irritable Bowel Syndrome?
Male Female Unknown Total
Freq. Pct. Freq. Pct. Freq. Pct. Freq. Pct.
1 No 3793 98 6838 94 48 100 10,962 95.6
2 Yes 73 2 402 6 0 0 502 4.4
Valid responses = 3866 34 7240 63 48 0 11,464 99.2
Invalid responses include no response or multiple responses.
41B5. Within the last 12 months, have you been diagnosed or treated by a professional for the following:
Migraine headache?
Male Female Unknown Total
Freq. Pct. Freq. Pct. Freq. Pct. Freq. Pct.
1 No 3719 96 6417 89 40 87 10,450 91.0
2 Yes 156 4 832 12 6 13 1,028 9.0
Valid responses = 3875 34 7249 63 46 0 11,478 99.3
Invalid responses include no response or multiple responses.
41B6. Within the last 12 months, have you been diagnosed or treated by a professional for the following:
Mononucleosis?
Male Female Unknown Total
Freq. Pct. Freq. Pct. Freq. Pct. Freq. Pct.
1 No 3833 100 7180 99 46 98 11,363 99.4
2 Yes 19 1 44 1 1 2 70 0.6
Valid responses = 3852 34 7224 63 47 0 11,433 98.9
Invalid responses include no response or multiple responses.
41B7. Within the last 12 months, have you been diagnosed or treated by a professional for the following:
Pelvic Inflammatory Disease (PID)?
Male Female Unknown Total
Freq. Pct. Freq. Pct. Freq. Pct. Freq. Pct.
1 No 3868 100 7218 100 47 100 11,438 99.7
2 Yes 3 0 26 0 0 0 35 0.3
Valid responses = 3871 34 7244 63 47 0 11,473 99.2
Invalid responses include no response or multiple responses.
Page 44 of 60
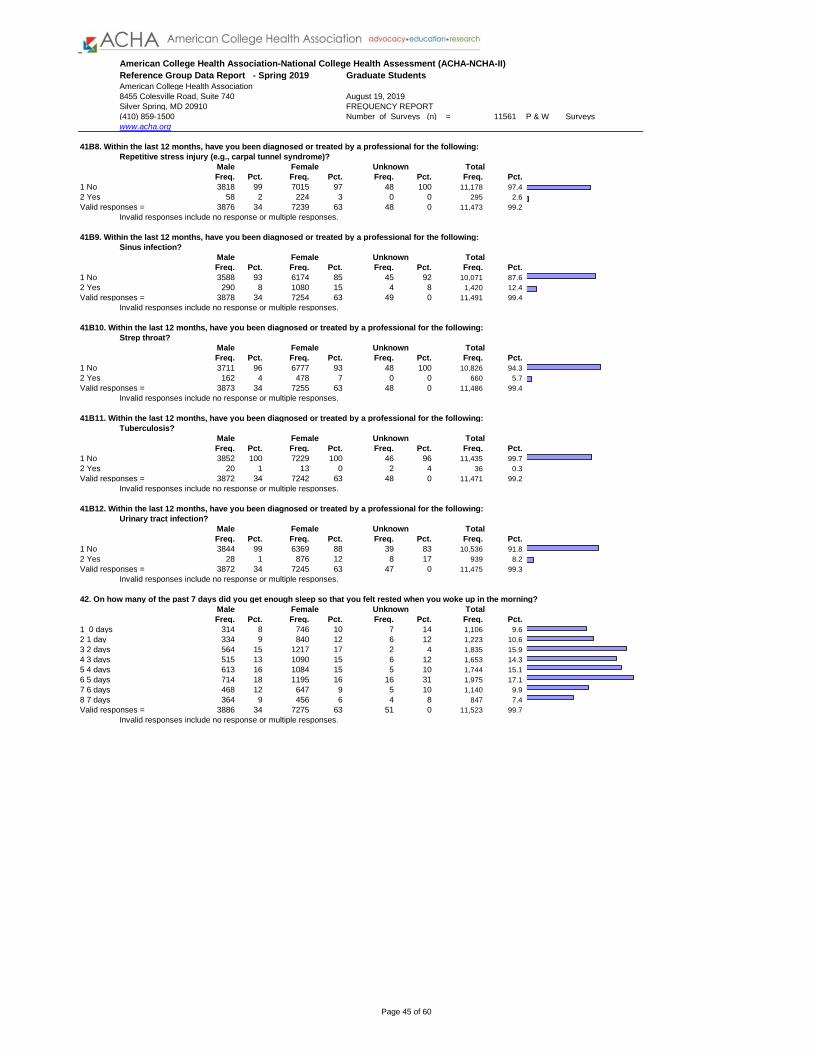
Reference Group Data Report - Spring 2019
American College Health Association
8455 Colesville Road, Suite 740
Silver Spring, MD 20910 FREQUENCY REPORT
(410) 859-1500 Number of Surveys (n) = 11561 P & W Surveys
www.acha.org
American College Health Association-National College Health Assessment (ACHA-NCHA-II)
Graduate Students
August 19, 2019
41B8. Within the last 12 months, have you been diagnosed or treated by a professional for the following:
Repetitive stress injury (e.g., carpal tunnel syndrome)?
Male Female Unknown Total
Freq. Pct. Freq. Pct. Freq. Pct. Freq. Pct.
1 No 3818 99 7015 97 48 100 11,178 97.4
2 Yes 58 2 224 3 0 0 295 2.6
Valid responses = 3876 34 7239 63 48 0 11,473 99.2
Invalid responses include no response or multiple responses.
41B9. Within the last 12 months, have you been diagnosed or treated by a professional for the following:
Sinus infection?
Male Female Unknown Total
Freq. Pct. Freq. Pct. Freq. Pct. Freq. Pct.
1 No 3588 93 6174 85 45 92 10,071 87.6
2 Yes 290 8 1080 15 4 8 1,420 12.4
Valid responses = 3878 34 7254 63 49 0 11,491 99.4
Invalid responses include no response or multiple responses.
41B10. Within the last 12 months, have you been diagnosed or treated by a professional for the following:
Strep throat?
Male Female Unknown Total
Freq. Pct. Freq. Pct. Freq. Pct. Freq. Pct.
1 No 3711 96 6777 93 48 100 10,826 94.3
2 Yes 162 4 478 7 0 0 660 5.7
Valid responses = 3873 34 7255 63 48 0 11,486 99.4
Invalid responses include no response or multiple responses.
41B11. Within the last 12 months, have you been diagnosed or treated by a professional for the following:
Tuberculosis?
Male Female Unknown Total
Freq. Pct. Freq. Pct. Freq. Pct. Freq. Pct.
1 No 3852 100 7229 100 46 96 11,435 99.7
2 Yes 20 1 13 0 2 4 36 0.3
Valid responses = 3872 34 7242 63 48 0 11,471 99.2
Invalid responses include no response or multiple responses.
41B12. Within the last 12 months, have you been diagnosed or treated by a professional for the following:
Urinary tract infection?
Male Female Unknown Total
Freq. Pct. Freq. Pct. Freq. Pct. Freq. Pct.
1 No 3844 99 6369 88 39 83 10,536 91.8
2 Yes 28 1 876 12 8 17 939 8.2
Valid responses = 3872 34 7245 63 47 0 11,475 99.3
Invalid responses include no response or multiple responses.
42. On how many of the past 7 days did you get enough sleep so that you felt rested when you woke up in the morning?
Male Female Unknown Total
Freq. Pct. Freq. Pct. Freq. Pct. Freq. Pct.
1 0 days 314 8 746 10 7 14 1,106 9.6
2 1 day 334 9 840 12 6 12 1,223 10.6
3 2 days 564 15 1217 17 2 4 1,835 15.9
4 3 days 515 13 1090 15 6 12 1,653 14.3
5 4 days 613 16 1084 15 5 10 1,744 15.1
6 5 days 714 18 1195 16 16 31 1,975 17.1
7 6 days 468 12 647 9 5 10 1,140 9.9
8 7 days 364 9 456 6 4 8 847 7.4
Valid responses = 3886 34 7275 63 51 0 11,523 99.7
Invalid responses include no response or multiple responses.
Page 45 of 60
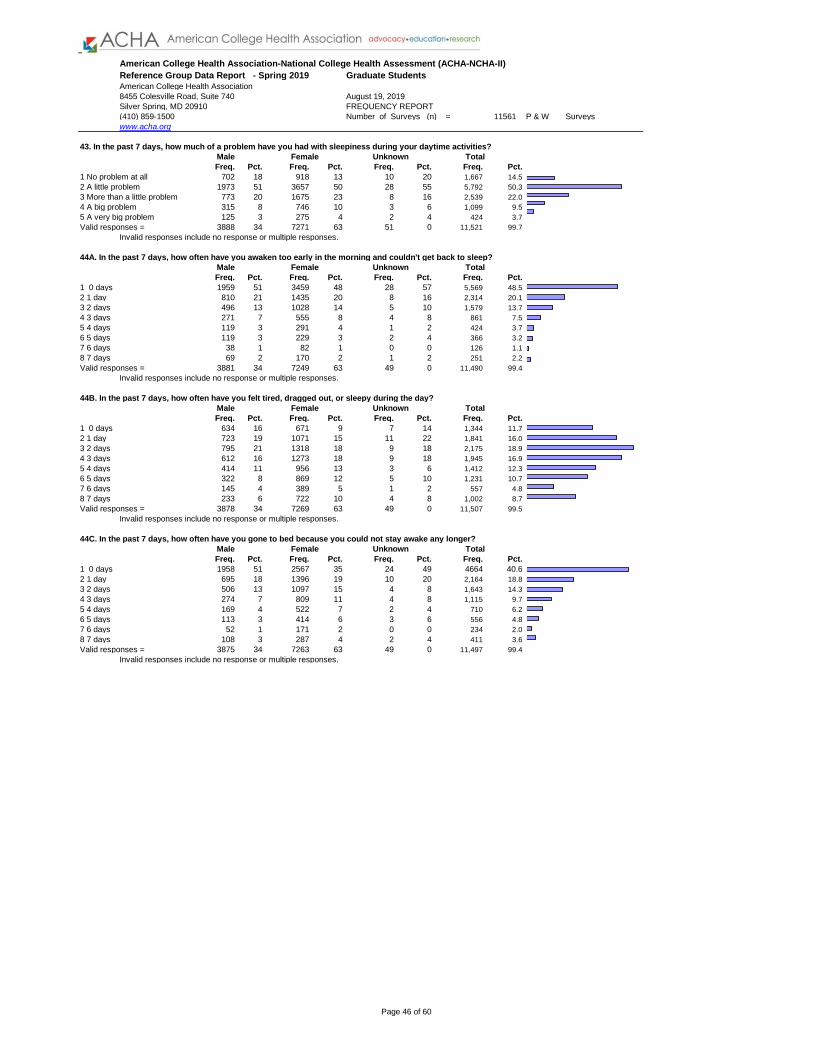
Reference Group Data Report - Spring 2019
American College Health Association
8455 Colesville Road, Suite 740
Silver Spring, MD 20910 FREQUENCY REPORT
(410) 859-1500 Number of Surveys (n) = 11561 P & W Surveys
www.acha.org
American College Health Association-National College Health Assessment (ACHA-NCHA-II)
Graduate Students
August 19, 2019
43. In the past 7 days, how much of a problem have you had with sleepiness during your daytime activities?
Male Female Unknown Total
Freq. Pct. Freq. Pct. Freq. Pct. Freq. Pct.
1 No problem at all 702 18 918 13 10 20 1,667 14.5
2 A little problem 1973 51 3657 50 28 55 5,792 50.3
3 More than a little problem 773 20 1675 23 8 16 2,539 22.0
4 A big problem 315 8 746 10 3 6 1,099 9.5
5 A very big problem 125 3 275 4 2 4 424 3.7
Valid responses = 3888 34 7271 63 51 0 11,521 99.7
Invalid responses include no response or multiple responses.
44A. In the past 7 days, how often have you awaken too early in the morning and couldn't get back to sleep?
Male Female Unknown Total
Freq. Pct. Freq. Pct. Freq. Pct. Freq. Pct.
1 0 days 1959 51 3459 48 28 57 5,569 48.5
2 1 day 810 21 1435 20 8 16 2,314 20.1
3 2 days 496 13 1028 14 5 10 1,579 13.7
4 3 days 271 7 555 8 4 8 861 7.5
5 4 days 119 3 291 4 1 2 424 3.7
6 5 days 119 3 229 3 2 4 366 3.2
7 6 days 38 1 82 1 0 0 126 1.1
8 7 days 69 2 170 2 1 2 251 2.2
Valid responses = 3881 34 7249 63 49 0 11,490 99.4
Invalid responses include no response or multiple responses.
44B. In the past 7 days, how often have you felt tired, dragged out, or sleepy during the day?
Male Female Unknown Total
Freq. Pct. Freq. Pct. Freq. Pct. Freq. Pct.
1 0 days 634 16 671 9 7 14 1,344 11.7
2 1 day 723 19 1071 15 11 22 1,841 16.0
3 2 days 795 21 1318 18 9 18 2,175 18.9
4 3 days 612 16 1273 18 9 18 1,945 16.9
5 4 days 414 11 956 13 3 6 1,412 12.3
6 5 days 322 8 869 12 5 10 1,231 10.7
7 6 days 145 4 389 5 1 2 557 4.8
8 7 days 233 6 722 10 4 8 1,002 8.7
Valid responses = 3878 34 7269 63 49 0 11,507 99.5
Invalid responses include no response or multiple responses.
44C. In the past 7 days, how often have you gone to bed because you could not stay awake any longer?
Male Female Unknown Total
Freq. Pct. Freq. Pct. Freq. Pct. Freq. Pct.
1 0 days 1958 51 2567 35 24 49 4664 40.6
2 1 day 695 18 1396 19 10 20 2,164 18.8
3 2 days 506 13 1097 15 4 8 1,643 14.3
4 3 days 274 7 809 11 4 8 1,115 9.7
5 4 days 169 4 522 7 2 4 710 6.2
6 5 days 113 3 414 6 3 6 556 4.8
7 6 days 52 1 171 2 0 0 234 2.0
8 7 days 108 3 287 4 2 4 411 3.6
Valid responses = 3875 34 7263 63 49 0 11,497 99.4
Invalid responses include no response or multiple responses.
Page 46 of 60

Reference Group Data Report - Spring 2019
American College Health Association
8455 Colesville Road, Suite 740
Silver Spring, MD 20910 FREQUENCY REPORT
(410) 859-1500 Number of Surveys (n) = 11561 P & W Surveys
www.acha.org
American College Health Association-National College Health Assessment (ACHA-NCHA-II)
Graduate Students
August 19, 2019
44D. In the past 7 days, how often have you had an extremely hard time falling asleep?
Male Female Unknown Total
Freq. Pct. Freq. Pct. Freq. Pct. Freq. Pct.
1 0 days 1986 51 3275 45 23 46 5,396 46.9
2 1 day 737 19 1399 19 13 26 2,206 19.2
3 2 days 439 11 918 13 4 8 1,405 12.2
4 3 days 254 7 524 7 3 6 800 7.0
5 4 days 134 4 357 5 2 4 513 4.5
6 5 days 125 3 310 4 3 6 464 4.0
7 6 days 70 2 155 2 0 0 235 2.0
8 7 days 132 3 328 5 2 4 485 4.2
Valid responses = 3877 34 7266 63 50 0 11,504 99.5
Invalid responses include no response or multiple responses.
45A1. Within the last 12 months, have any of the following affected your academic performance:
Alcohol use?
Male Female Unknown Total
Freq. Pct. Freq. Pct. Freq. Pct. Freq. Pct.
1 This did not happen to me, N/A 2813 73 5689 79 31 65 8,761 76.3
2 Exprd, academics not affected 1005 26 1469 20 16 33 2,565 22.3
3 Received lower grade exam 32 1 57 1 0 0 95 0.8
4 Received lower grade course 14 0 13 0 1 2 28 0.2
5 Received incomplete/dropped 1 0 5 0 0 0 6 0.1
6 Significant disruption thesis 13 0 17 0 0 0 33 0.3
Valid responses = 3878 34 7250 63 48 0 11,488 99.4
Invalid responses include no response or multiple responses.
45A2. Within the last 12 months, have any of the following affected your academic performance:
Allergies?
Male Female Unknown Total
Freq. Pct. Freq. Pct. Freq. Pct. Freq. Pct.
1 This did not happen to me, N/A 3189 82 5610 78 37 80 9,072 79.1
2 Exprd, academics not affected 618 16 1522 21 8 17 2,214 19.3
3 Received lower grade exam 30 1 55 1 1 2 92 0.8
4 Received lower grade course 9 0 10 0 0 0 21 0.2
5 Received incomplete/dropped 0 0 1 0 0 0 1 0.0
6 Significant disruption thesis 22 1 42 1 0 0 65 0.6
Valid responses = 3868 34 7240 63 46 0 11,465 99.2
Invalid responses include no response or multiple responses.
45A3. Within the last 12 months, have any of the following affected your academic performance:
Anxiety?
Male Female Unknown Total
Freq. Pct. Freq. Pct. Freq. Pct. Freq. Pct.
1 This did not happen to me, N/A 2286 59 2863 40 21 46 5,257 45.9
2 Exprd, academics not affected 958 25 2786 39 17 37 3,875 33.8
3 Received lower grade exam 252 7 783 11 4 9 1,079 9.4
4 Received lower grade course 124 3 219 3 1 2 359 3.1
5 Received incomplete/dropped 37 1 91 1 0 0 139 1.2
6 Significant disruption thesis 207 5 497 7 3 7 749 6.5
Valid responses = 3864 34 7239 63 46 0 11,458 99.1
Invalid responses include no response or multiple responses.
Page 47 of 60
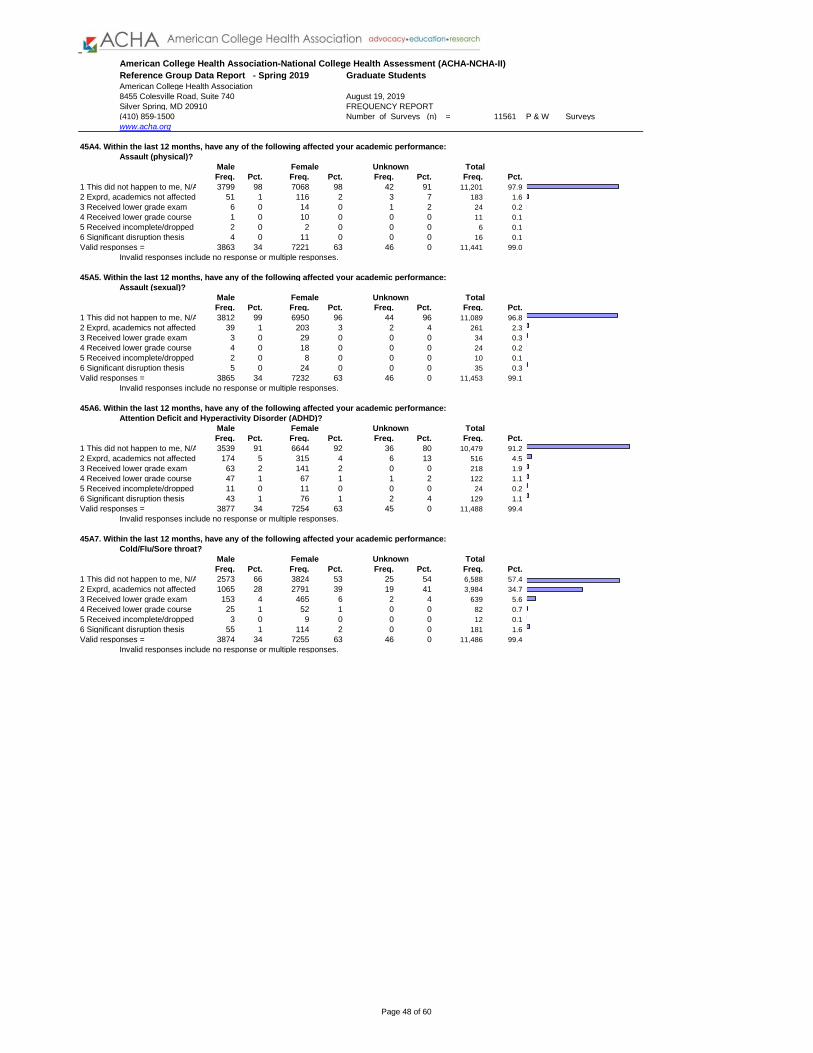
Reference Group Data Report - Spring 2019
American College Health Association
8455 Colesville Road, Suite 740
Silver Spring, MD 20910 FREQUENCY REPORT
(410) 859-1500 Number of Surveys (n) = 11561 P & W Surveys
www.acha.org
American College Health Association-National College Health Assessment (ACHA-NCHA-II)
Graduate Students
August 19, 2019
45A4. Within the last 12 months, have any of the following affected your academic performance:
Assault (physical)?
Male Female Unknown Total
Freq. Pct. Freq. Pct. Freq. Pct. Freq. Pct.
1 This did not happen to me, N/A 3799 98 7068 98 42 91 11,201 97.9
2 Exprd, academics not affected 51 1 116 2 3 7 183 1.6
3 Received lower grade exam 6 0 14 0 1 2 24 0.2
4 Received lower grade course 1 0 10 0 0 0 11 0.1
5 Received incomplete/dropped 2 0 2 0 0 0 6 0.1
6 Significant disruption thesis 4 0 11 0 0 0 16 0.1
Valid responses = 3863 34 7221 63 46 0 11,441 99.0
Invalid responses include no response or multiple responses.
45A5. Within the last 12 months, have any of the following affected your academic performance:
Assault (sexual)?
Male Female Unknown Total
Freq. Pct. Freq. Pct. Freq. Pct. Freq. Pct.
1 This did not happen to me, N/A 3812 99 6950 96 44 96 11,089 96.8
2 Exprd, academics not affected 39 1 203 3 2 4 261 2.3
3 Received lower grade exam 3 0 29 0 0 0 34 0.3
4 Received lower grade course 4 0 18 0 0 0 24 0.2
5 Received incomplete/dropped 2 0 8 0 0 0 10 0.1
6 Significant disruption thesis 5 0 24 0 0 0 35 0.3
Valid responses = 3865 34 7232 63 46 0 11,453 99.1
Invalid responses include no response or multiple responses.
45A6. Within the last 12 months, have any of the following affected your academic performance:
Attention Deficit and Hyperactivity Disorder (ADHD)?
Male Female Unknown Total
Freq. Pct. Freq. Pct. Freq. Pct. Freq. Pct.
1 This did not happen to me, N/A 3539 91 6644 92 36 80 10,479 91.2
2 Exprd, academics not affected 174 5 315 4 6 13 516 4.5
3 Received lower grade exam 63 2 141 2 0 0 218 1.9
4 Received lower grade course 47 1 67 1 1 2 122 1.1
5 Received incomplete/dropped 11 0 11 0 0 0 24 0.2
6 Significant disruption thesis 43 1 76 1 2 4 129 1.1
Valid responses = 3877 34 7254 63 45 0 11,488 99.4
Invalid responses include no response or multiple responses.
45A7. Within the last 12 months, have any of the following affected your academic performance:
Cold/Flu/Sore throat?
Male Female Unknown Total
Freq. Pct. Freq. Pct. Freq. Pct. Freq. Pct.
1 This did not happen to me, N/A 2573 66 3824 53 25 54 6,588 57.4
2 Exprd, academics not affected 1065 28 2791 39 19 41 3,984 34.7
3 Received lower grade exam 153 4 465 6 2 4 639 5.6
4 Received lower grade course 25 1 52 1 0 0 82 0.7
5 Received incomplete/dropped 3 0 9 0 0 0 12 0.1
6 Significant disruption thesis 55 1 114 2 0 0 181 1.6
Valid responses = 3874 34 7255 63 46 0 11,486 99.4
Invalid responses include no response or multiple responses.
Page 48 of 60

Reference Group Data Report - Spring 2019
American College Health Association
8455 Colesville Road, Suite 740
Silver Spring, MD 20910 FREQUENCY REPORT
(410) 859-1500 Number of Surveys (n) = 11561 P & W Surveys
www.acha.org
American College Health Association-National College Health Assessment (ACHA-NCHA-II)
Graduate Students
August 19, 2019
45A8. Within the last 12 months, have any of the following affected your academic performance:
Concern for a troubled friend or family member?
Male Female Unknown Total
Freq. Pct. Freq. Pct. Freq. Pct. Freq. Pct.
1 This did not happen to me, N/A 2931 76 4519 62 28 61 7,655 66.7
2 Exprd, academics not affected 711 18 2038 28 13 28 2,851 24.8
3 Received lower grade exam 118 3 360 5 1 2 497 4.3
4 Received lower grade course 38 1 112 2 2 4 159 1.4
5 Received incomplete/dropped 7 0 29 0 0 0 38 0.3
6 Significant disruption thesis 65 2 190 3 2 4 275 2.4
Valid responses = 3870 34 7248 63 46 0 11,475 99.3
Invalid responses include no response or multiple responses.
45B1. Within the last 12 months, have any of the following affected your academic performance:
Chronic health problem or serious illness (e.g. diabetes, asthma, cancer)?
Male Female Unknown Total
Freq. Pct. Freq. Pct. Freq. Pct. Freq. Pct.
1 This did not happen to me, N/A 3535 91 6135 85 44 94 9,954 86.6
2 Exprd, academics not affected 227 6 729 10 2 4 994 8.7
3 Received lower grade exam 37 1 134 2 0 0 179 1.6
4 Received lower grade course 23 1 62 1 1 2 93 0.8
5 Received incomplete/dropped 4 0 37 1 0 0 46 0.4
6 Significant disruption thesis 51 1 158 2 0 0 225 2.0
Valid responses = 3877 34 7255 63 47 0 11,491 99.4
Invalid responses include no response or multiple responses.
45B2. Within the last 12 months, have any of the following affected your academic performance:
Chronic pain?
Male Female Unknown Total
Freq. Pct. Freq. Pct. Freq. Pct. Freq. Pct.
1 This did not happen to me, N/A 3514 91 6191 86 38 83 9,983 87.1
2 Exprd, academics not affected 271 7 752 10 7 15 1,079 9.4
3 Received lower grade exam 28 1 115 2 0 0 150 1.3
4 Received lower grade course 17 0 43 1 1 2 66 0.6
5 Received incomplete/dropped 6 0 18 0 0 0 25 0.2
6 Significant disruption thesis 35 1 111 2 0 0 156 1.4
Valid responses = 3871 34 7230 63 46 0 11,459 99.1
Invalid responses include no response or multiple responses.
45B3. Within the last 12 months, have any of the following affected your academic performance:
Death of a friend or family member?
Male Female Unknown Total
Freq. Pct. Freq. Pct. Freq. Pct. Freq. Pct.
1 This did not happen to me, N/A 3378 87 5976 83 36 77 9,643 84.1
2 Exprd, academics not affected 381 10 903 13 6 13 1,325 11.6
3 Received lower grade exam 50 1 155 2 1 2 212 1.8
4 Received lower grade course 16 0 66 1 2 4 90 0.8
5 Received incomplete/dropped 6 0 28 0 0 0 36 0.3
6 Significant disruption thesis 40 1 107 2 2 4 158 1.4
Valid responses = 3871 34 7235 63 47 0 11,464 99.2
Invalid responses include no response or multiple responses.
Page 49 of 60
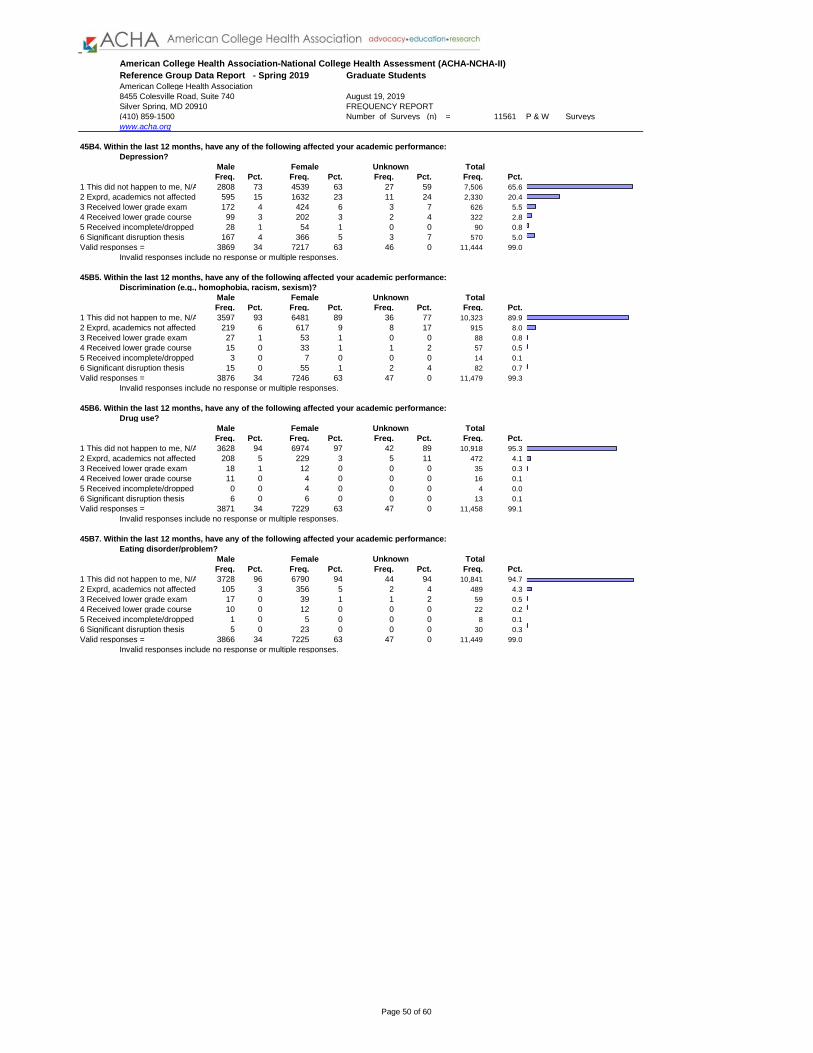
Reference Group Data Report - Spring 2019
American College Health Association
8455 Colesville Road, Suite 740
Silver Spring, MD 20910 FREQUENCY REPORT
(410) 859-1500 Number of Surveys (n) = 11561 P & W Surveys
www.acha.org
American College Health Association-National College Health Assessment (ACHA-NCHA-II)
Graduate Students
August 19, 2019
45B4. Within the last 12 months, have any of the following affected your academic performance:
Depression?
Male Female Unknown Total
Freq. Pct. Freq. Pct. Freq. Pct. Freq. Pct.
1 This did not happen to me, N/A 2808 73 4539 63 27 59 7,506 65.6
2 Exprd, academics not affected 595 15 1632 23 11 24 2,330 20.4
3 Received lower grade exam 172 4 424 6 3 7 626 5.5
4 Received lower grade course 99 3 202 3 2 4 322 2.8
5 Received incomplete/dropped 28 1 54 1 0 0 90 0.8
6 Significant disruption thesis 167 4 366 5 3 7 570 5.0
Valid responses = 3869 34 7217 63 46 0 11,444 99.0
Invalid responses include no response or multiple responses.
45B5. Within the last 12 months, have any of the following affected your academic performance:
Discrimination (e.g., homophobia, racism, sexism)?
Male Female Unknown Total
Freq. Pct. Freq. Pct. Freq. Pct. Freq. Pct.
1 This did not happen to me, N/A 3597 93 6481 89 36 77 10,323 89.9
2 Exprd, academics not affected 219 6 617 9 8 17 915 8.0
3 Received lower grade exam 27 1 53 1 0 0 88 0.8
4 Received lower grade course 15 0 33 1 1 2 57 0.5
5 Received incomplete/dropped 3 0 7 0 0 0 14 0.1
6 Significant disruption thesis 15 0 55 1 2 4 82 0.7
Valid responses = 3876 34 7246 63 47 0 11,479 99.3
Invalid responses include no response or multiple responses.
45B6. Within the last 12 months, have any of the following affected your academic performance:
Drug use?
Male Female Unknown Total
Freq. Pct. Freq. Pct. Freq. Pct. Freq. Pct.
1 This did not happen to me, N/A 3628 94 6974 97 42 89 10,918 95.3
2 Exprd, academics not affected 208 5 229 3 5 11 472 4.1
3 Received lower grade exam 18 1 12 0 0 0 35 0.3
4 Received lower grade course 11 0 4 0 0 0 16 0.1
5 Received incomplete/dropped 0 0 4 0 0 0 4 0.0
6 Significant disruption thesis 6 0 6 0 0 0 13 0.1
Valid responses = 3871 34 7229 63 47 0 11,458 99.1
Invalid responses include no response or multiple responses.
45B7. Within the last 12 months, have any of the following affected your academic performance:
Eating disorder/problem?
Male Female Unknown Total
Freq. Pct. Freq. Pct. Freq. Pct. Freq. Pct.
1 This did not happen to me, N/A 3728 96 6790 94 44 94 10,841 94.7
2 Exprd, academics not affected 105 3 356 5 2 4 489 4.3
3 Received lower grade exam 17 0 39 1 1 2 59 0.5
4 Received lower grade course 10 0 12 0 0 0 22 0.2
5 Received incomplete/dropped 1 0 5 0 0 0 8 0.1
6 Significant disruption thesis 5 0 23 0 0 0 30 0.3
Valid responses = 3866 34 7225 63 47 0 11,449 99.0
Invalid responses include no response or multiple responses.
Page 50 of 60

Reference Group Data Report - Spring 2019
American College Health Association
8455 Colesville Road, Suite 740
Silver Spring, MD 20910 FREQUENCY REPORT
(410) 859-1500 Number of Surveys (n) = 11561 P & W Surveys
www.acha.org
American College Health Association-National College Health Assessment (ACHA-NCHA-II)
Graduate Students
August 19, 2019
45B8. Within the last 12 months, have any of the following affected your academic performance:
Finances?
Male Female Unknown Total
Freq. Pct. Freq. Pct. Freq. Pct. Freq. Pct.
1 This did not happen to me, N/A 2873 74 4764 66 24 52 7,836 68.4
2 Exprd, academics not affected 786 20 2071 29 20 44 2,965 25.9
3 Received lower grade exam 82 2 162 2 0 0 260 2.3
4 Received lower grade course 40 1 71 1 1 2 121 1.1
5 Received incomplete/dropped 11 0 14 0 0 0 28 0.2
6 Significant disruption thesis 74 2 149 2 1 2 245 2.1
Valid responses = 3866 34 7231 63 46 0 11,455 99.1
Invalid responses include no response or multiple responses.
45C1. Within the last 12 months, have any of the following affected your academic performance:
Gambling?
Male Female Unknown Total
Freq. Pct. Freq. Pct. Freq. Pct. Freq. Pct.
1 This did not happen to me, N/A 3765 97 7167 99 47 100 11,284 98.6
2 Exprd, academics not affected 95 3 43 1 0 0 139 1.2
3 Received lower grade exam 3 0 4 0 0 0 7 0.1
4 Received lower grade course 4 0 3 0 0 0 7 0.1
5 Received incomplete/dropped 1 0 0 0 0 0 2 0.0
6 Significant disruption thesis 2 0 1 0 0 0 5 0.0
Valid responses = 3870 34 7218 63 47 0 11,444 99.0
Invalid responses include no response or multiple responses.
45C2. Within the last 12 months, have any of the following affected your academic performance:
Homesickness?
Male Female Unknown Total
Freq. Pct. Freq. Pct. Freq. Pct. Freq. Pct.
1 This did not happen to me, N/A 3230 84 5596 78 37 80 9,098 79.5
2 Exprd, academics not affected 555 14 1391 19 6 13 2,015 17.6
3 Received lower grade exam 49 1 118 2 2 4 176 1.5
4 Received lower grade course 9 0 34 1 1 2 48 0.4
5 Received incomplete/dropped 4 0 10 0 0 0 15 0.1
6 Significant disruption thesis 20 1 72 1 0 0 94 0.8
Valid responses = 3867 34 7221 63 46 0 11,446 99.0
Invalid responses include no response or multiple responses.
45C3. Within the last 12 months, have any of the following affected your academic performance:
Injury (e.g., fracture, sprain, strain, cut)?
Male Female Unknown Total
Freq. Pct. Freq. Pct. Freq. Pct. Freq. Pct.
1 This did not happen to me, N/A 3486 90 6560 91 43 94 10,356 90.3
2 Exprd, academics not affected 322 8 563 8 3 7 923 8.0
3 Received lower grade exam 23 1 44 1 0 0 69 0.6
4 Received lower grade course 13 0 16 0 0 0 30 0.3
5 Received incomplete/dropped 7 0 10 0 0 0 18 0.2
6 Significant disruption thesis 26 1 44 1 0 0 76 0.7
Valid responses = 3877 34 7237 63 46 0 11,472 99.2
Invalid responses include no response or multiple responses.
Page 51 of 60
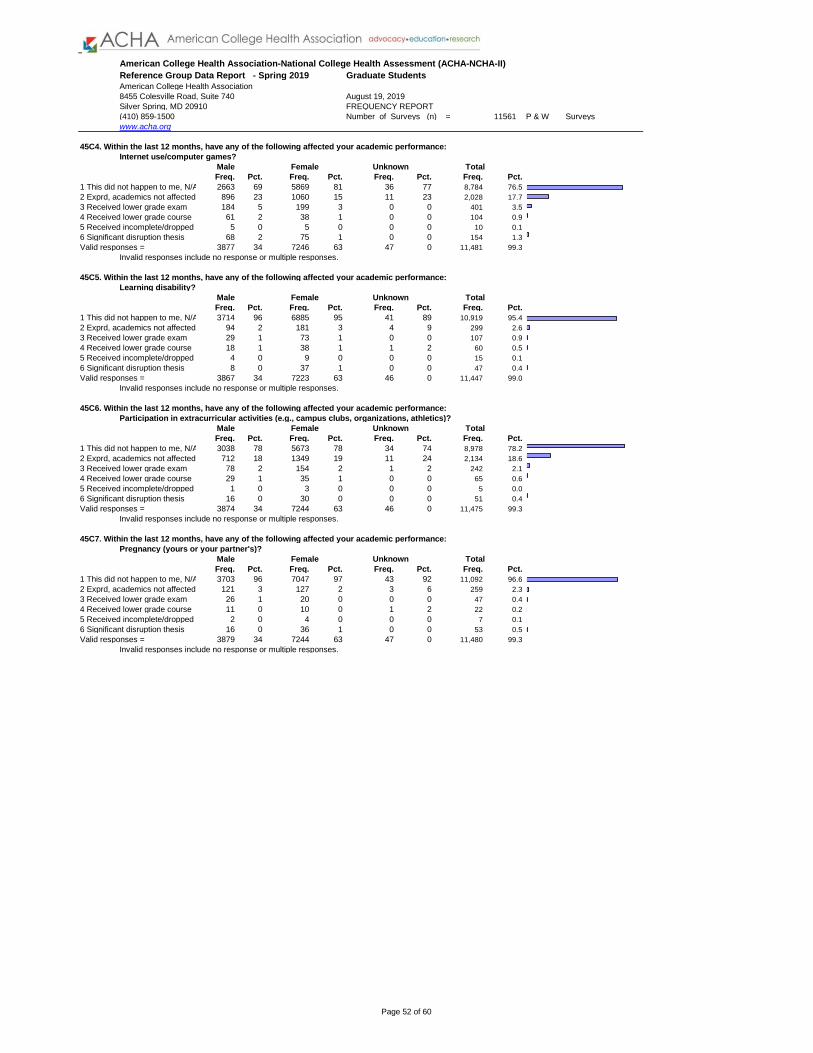
Reference Group Data Report - Spring 2019
American College Health Association
8455 Colesville Road, Suite 740
Silver Spring, MD 20910 FREQUENCY REPORT
(410) 859-1500 Number of Surveys (n) = 11561 P & W Surveys
www.acha.org
American College Health Association-National College Health Assessment (ACHA-NCHA-II)
Graduate Students
August 19, 2019
45C4. Within the last 12 months, have any of the following affected your academic performance:
Internet use/computer games?
Male Female Unknown Total
Freq. Pct. Freq. Pct. Freq. Pct. Freq. Pct.
1 This did not happen to me, N/A 2663 69 5869 81 36 77 8,784 76.5
2 Exprd, academics not affected 896 23 1060 15 11 23 2,028 17.7
3 Received lower grade exam 184 5 199 3 0 0 401 3.5
4 Received lower grade course 61 2 38 1 0 0 104 0.9
5 Received incomplete/dropped 5 0 5 0 0 0 10 0.1
6 Significant disruption thesis 68 2 75 1 0 0 154 1.3
Valid responses = 3877 34 7246 63 47 0 11,481 99.3
Invalid responses include no response or multiple responses.
45C5. Within the last 12 months, have any of the following affected your academic performance:
Learning disability?
Male Female Unknown Total
Freq. Pct. Freq. Pct. Freq. Pct. Freq. Pct.
1 This did not happen to me, N/A 3714 96 6885 95 41 89 10,919 95.4
2 Exprd, academics not affected 94 2 181 3 4 9 299 2.6
3 Received lower grade exam 29 1 73 1 0 0 107 0.9
4 Received lower grade course 18 1 38 1 1 2 60 0.5
5 Received incomplete/dropped 4 0 9 0 0 0 15 0.1
6 Significant disruption thesis 8 0 37 1 0 0 47 0.4
Valid responses = 3867 34 7223 63 46 0 11,447 99.0
Invalid responses include no response or multiple responses.
45C6. Within the last 12 months, have any of the following affected your academic performance:
Participation in extracurricular activities (e.g., campus clubs, organizations, athletics)?
Male Female Unknown Total
Freq. Pct. Freq. Pct. Freq. Pct. Freq. Pct.
1 This did not happen to me, N/A 3038 78 5673 78 34 74 8,978 78.2
2 Exprd, academics not affected 712 18 1349 19 11 24 2,134 18.6
3 Received lower grade exam 78 2 154 2 1 2 242 2.1
4 Received lower grade course 29 1 35 1 0 0 65 0.6
5 Received incomplete/dropped 1 0 3 0 0 0 5 0.0
6 Significant disruption thesis 16 0 30 0 0 0 51 0.4
Valid responses = 3874 34 7244 63 46 0 11,475 99.3
Invalid responses include no response or multiple responses.
45C7. Within the last 12 months, have any of the following affected your academic performance:
Pregnancy (yours or your partner's)?
Male Female Unknown Total
Freq. Pct. Freq. Pct. Freq. Pct. Freq. Pct.
1 This did not happen to me, N/A 3703 96 7047 97 43 92 11,092 96.6
2 Exprd, academics not affected 121 3 127 2 3 6 259 2.3
3 Received lower grade exam 26 1 20 0 0 0 47 0.4
4 Received lower grade course 11 0 10 0 1 2 22 0.2
5 Received incomplete/dropped 2 0 4 0 0 0 7 0.1
6 Significant disruption thesis 16 0 36 1 0 0 53 0.5
Valid responses = 3879 34 7244 63 47 0 11,480 99.3
Invalid responses include no response or multiple responses.
Page 52 of 60
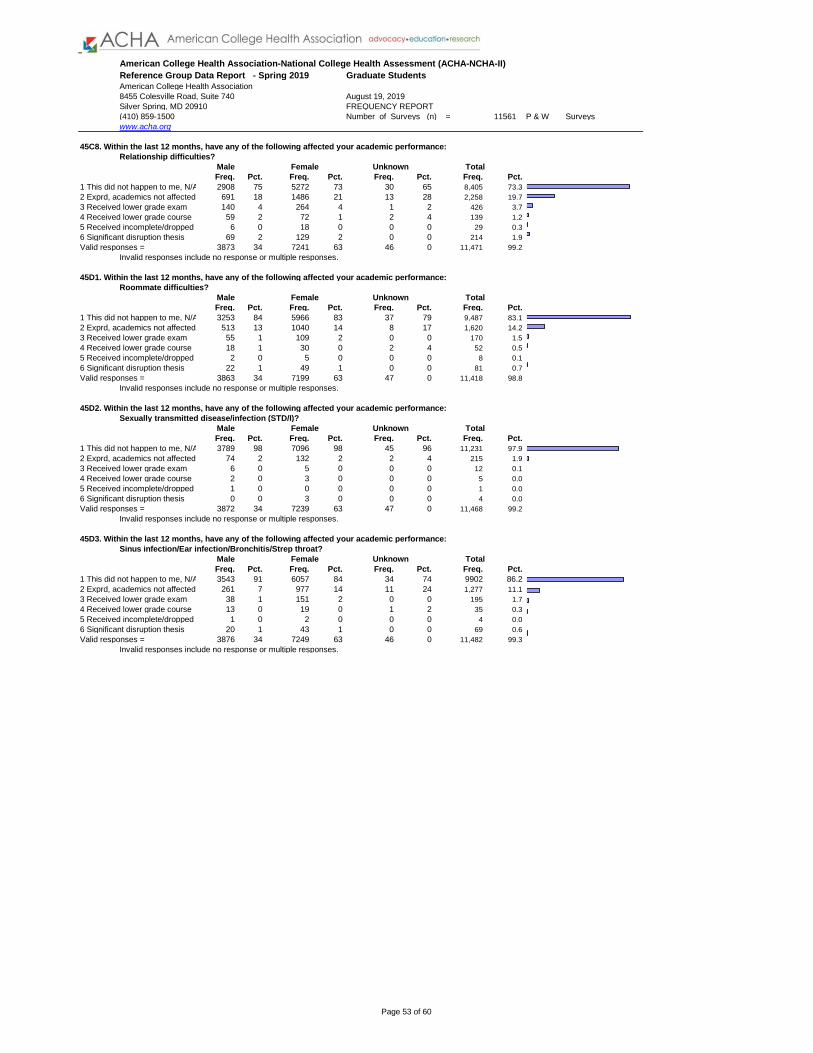
Reference Group Data Report - Spring 2019
American College Health Association
8455 Colesville Road, Suite 740
Silver Spring, MD 20910 FREQUENCY REPORT
(410) 859-1500 Number of Surveys (n) = 11561 P & W Surveys
www.acha.org
American College Health Association-National College Health Assessment (ACHA-NCHA-II)
Graduate Students
August 19, 2019
45C8. Within the last 12 months, have any of the following affected your academic performance:
Relationship difficulties?
Male Female Unknown Total
Freq. Pct. Freq. Pct. Freq. Pct. Freq. Pct.
1 This did not happen to me, N/A 2908 75 5272 73 30 65 8,405 73.3
2 Exprd, academics not affected 691 18 1486 21 13 28 2,258 19.7
3 Received lower grade exam 140 4 264 4 1 2 426 3.7
4 Received lower grade course 59 2 72 1 2 4 139 1.2
5 Received incomplete/dropped 6 0 18 0 0 0 29 0.3
6 Significant disruption thesis 69 2 129 2 0 0 214 1.9
Valid responses = 3873 34 7241 63 46 0 11,471 99.2
Invalid responses include no response or multiple responses.
45D1. Within the last 12 months, have any of the following affected your academic performance:
Roommate difficulties?
Male Female Unknown Total
Freq. Pct. Freq. Pct. Freq. Pct. Freq. Pct.
1 This did not happen to me, N/A 3253 84 5966 83 37 79 9,487 83.1
2 Exprd, academics not affected 513 13 1040 14 8 17 1,620 14.2
3 Received lower grade exam 55 1 109 2 0 0 170 1.5
4 Received lower grade course 18 1 30 0 2 4 52 0.5
5 Received incomplete/dropped 2 0 5 0 0 0 8 0.1
6 Significant disruption thesis 22 1 49 1 0 0 81 0.7
Valid responses = 3863 34 7199 63 47 0 11,418 98.8
Invalid responses include no response or multiple responses.
45D2. Within the last 12 months, have any of the following affected your academic performance:
Sexually transmitted disease/infection (STD/I)?
Male Female Unknown Total
Freq. Pct. Freq. Pct. Freq. Pct. Freq. Pct.
1 This did not happen to me, N/A 3789 98 7096 98 45 96 11,231 97.9
2 Exprd, academics not affected 74 2 132 2 2 4 215 1.9
3 Received lower grade exam 6 0 5 0 0 0 12 0.1
4 Received lower grade course 2 0 3 0 0 0 5 0.0
5 Received incomplete/dropped 1 0 0 0 0 0 1 0.0
6 Significant disruption thesis 0 0 3 0 0 0 4 0.0
Valid responses = 3872 34 7239 63 47 0 11,468 99.2
Invalid responses include no response or multiple responses.
45D3. Within the last 12 months, have any of the following affected your academic performance:
Sinus infection/Ear infection/Bronchitis/Strep throat?
Male Female Unknown Total
Freq. Pct. Freq. Pct. Freq. Pct. Freq. Pct.
1 This did not happen to me, N/A 3543 91 6057 84 34 74 9902 86.2
2 Exprd, academics not affected 261 7 977 14 11 24 1,277 11.1
3 Received lower grade exam 38 1 151 2 0 0 195 1.7
4 Received lower grade course 13 0 19 0 1 2 35 0.3
5 Received incomplete/dropped 1 0 2 0 0 0 4 0.0
6 Significant disruption thesis 20 1 43 1 0 0 69 0.6
Valid responses = 3876 34 7249 63 46 0 11,482 99.3
Invalid responses include no response or multiple responses.
Page 53 of 60

Reference Group Data Report - Spring 2019
American College Health Association
8455 Colesville Road, Suite 740
Silver Spring, MD 20910 FREQUENCY REPORT
(410) 859-1500 Number of Surveys (n) = 11561 P & W Surveys
www.acha.org
American College Health Association-National College Health Assessment (ACHA-NCHA-II)
Graduate Students
August 19, 2019
45D4. Within the last 12 months, have any of the following affected your academic performance:
Sleep difficulties?
Male Female Unknown Total
Freq. Pct. Freq. Pct. Freq. Pct. Freq. Pct.
1 This did not happen to me, N/A 2200 57 3531 49 19 40 5,867 51.2
2 Exprd, academics not affected 1177 30 2697 37 18 38 4,017 35.0
3 Received lower grade exam 267 7 593 8 8 17 900 7.9
4 Received lower grade course 97 3 129 2 1 2 242 2.1
5 Received incomplete/dropped 12 0 23 0 0 0 35 0.3
6 Significant disruption thesis 119 3 261 4 1 2 403 3.5
Valid responses = 3872 34 7234 63 47 0 11,464 99.2
Invalid responses include no response or multiple responses.
45D5. Within the last 12 months, have any of the following affected your academic performance:
Stress?
Male Female Unknown Total
Freq. Pct. Freq. Pct. Freq. Pct. Freq. Pct.
1 This did not happen to me, N/A 1522 39 1585 22 13 28 3,182 27.7
2 Exprd, academics not affected 1573 41 3814 53 22 48 5,541 48.3
3 Received lower grade exam 383 10 1001 14 5 11 1,434 12.5
4 Received lower grade course 136 4 255 4 3 7 415 3.6
5 Received incomplete/dropped 34 1 67 1 0 0 112 1.0
6 Significant disruption thesis 226 6 515 7 3 7 783 6.8
Valid responses = 3874 34 7237 63 46 0 11,467 99.2
Invalid responses include no response or multiple responses.
45D6. Within the last 12 months, have any of the following affected your academic performance:
Work?
Male Female Unknown Total
Freq. Pct. Freq. Pct. Freq. Pct. Freq. Pct.
1 This did not happen to me, N/A 2357 61 3603 50 24 52 6,122 53.4
2 Exprd, academics not affected 1098 28 2690 37 15 33 3,908 34.1
3 Received lower grade exam 220 6 554 8 5 11 813 7.1
4 Received lower grade course 79 2 138 2 1 2 229 2.0
5 Received incomplete/dropped 23 1 28 0 0 0 54 0.5
6 Significant disruption thesis 94 2 220 3 1 2 334 2.9
Valid responses = 3871 34 7233 63 46 0 11,460 99.1
Invalid responses include no response or multiple responses.
45D7. Within the last 12 months, have any of the following affected your academic performance:
Other?
Male Female Unknown Total
Freq. Pct. Freq. Pct. Freq. Pct. Freq. Pct.
1 This did not happen to me, N/A 2000 96 3784 96 26 100 5,964 95.5
2 Exprd, academics not affected 38 2 67 2 0 0 112 1.8
3 Received lower grade exam 9 0 37 1 0 0 49 0.8
4 Received lower grade course 14 1 20 1 0 0 40 0.6
5 Received incomplete/dropped 5 0 8 0 0 0 14 0.2
6 Significant disruption thesis 21 1 40 1 0 0 68 1.1
Valid responses = 2087 33 3956 63 26 0 6,247 54.0
Invalid responses include no response or multiple responses.
Page 54 of 60
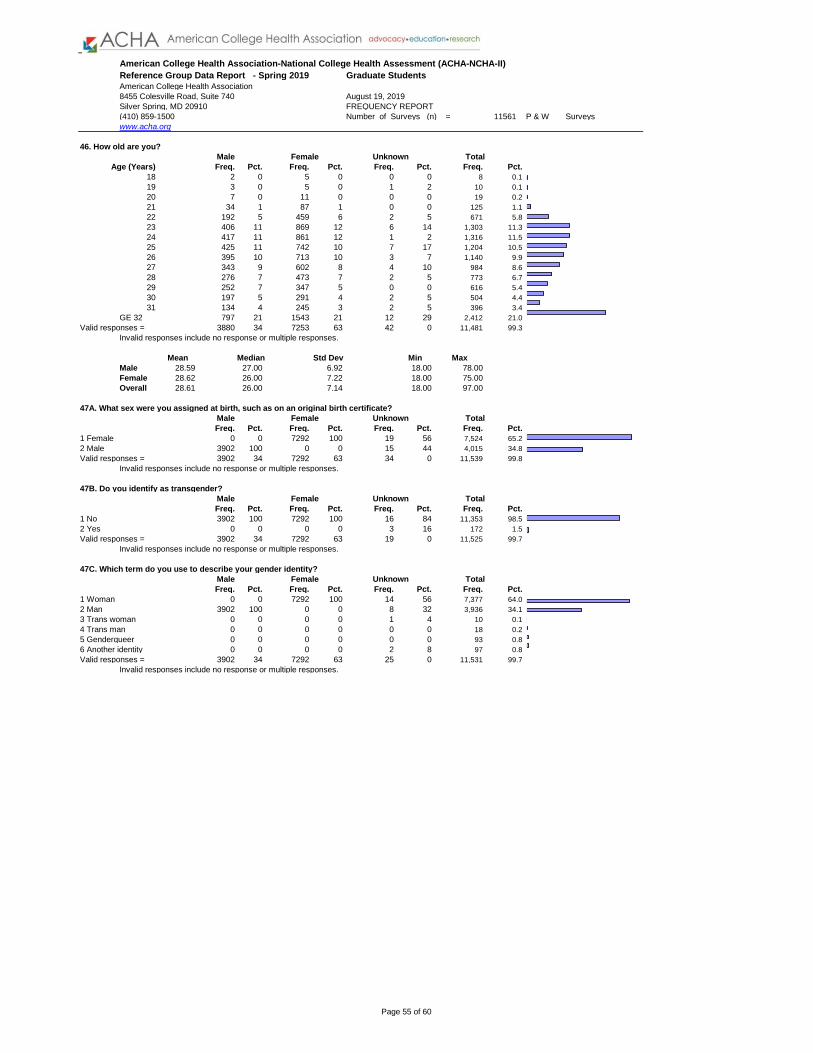
Reference Group Data Report - Spring 2019
American College Health Association
8455 Colesville Road, Suite 740
Silver Spring, MD 20910 FREQUENCY REPORT
(410) 859-1500 Number of Surveys (n) = 11561 P & W Surveys
www.acha.org
American College Health Association-National College Health Assessment (ACHA-NCHA-II)
Graduate Students
August 19, 2019
46. How old are you?
Male Female Unknown Total
Age (Years) Freq. Pct. Freq. Pct. Freq. Pct. Freq. Pct.
18 2 0 5 0 0 0 8 0.1
19 3 0 5 0 1 2 10 0.1
20 7 0 11 0 0 0 19 0.2
21 34 1 87 1 0 0 125 1.1
22 192 5 459 6 2 5 671 5.8
23 406 11 869 12 6 14 1,303 11.3
24 417 11 861 12 1 2 1,316 11.5
25 425 11 742 10 7 17 1,204 10.5
26 395 10 713 10 3 7 1,140 9.9
27 343 9 602 8 4 10 984 8.6
28 276 7 473 7 2 5 773 6.7
29 252 7 347 5 0 0 616 5.4
30 197 5 291 4 2 5 504 4.4
31 134 4 245 3 2 5 396 3.4
GE 32 797 21 1543 21 12 29 2,412 21.0
Valid responses = 3880 34 7253 63 42 0 11,481 99.3
Invalid responses include no response or multiple responses.
Mean Median Std Dev Min Max
Male 28.59 27.00 6.92 18.00 78.00
Female 28.62 26.00 7.22 18.00 75.00
Overall 28.61 26.00 7.14 18.00 97.00
47A. What sex were you assigned at birth, such as on an original birth certificate?
Male Female Unknown Total
Freq. Pct. Freq. Pct. Freq. Pct. Freq. Pct.
1 Female 0 0 7292 100 19 56 7,524 65.2
2 Male 3902 100 0 0 15 44 4,015 34.8
Valid responses = 3902 34 7292 63 34 0 11,539 99.8
Invalid responses include no response or multiple responses.
47B. Do you identify as transgender?
Male Female Unknown Total
Freq. Pct. Freq. Pct. Freq. Pct. Freq. Pct.
1 No 3902 100 7292 100 16 84 11,353 98.5
2 Yes 0 0 0 0 3 16 172 1.5
Valid responses = 3902 34 7292 63 19 0 11,525 99.7
Invalid responses include no response or multiple responses.
47C. Which term do you use to describe your gender identity?
Male Female Unknown Total
Freq. Pct. Freq. Pct. Freq. Pct. Freq. Pct.
1 Woman 0 0 7292 100 14 56 7,377 64.0
2 Man 3902 100 0 0 8 32 3,936 34.1
3 Trans woman 0 0 0 0 1 4 10 0.1
4 Trans man 0 0 0 0 0 0 18 0.2
5 Genderqueer 0 0 0 0 0 0 93 0.8
6 Another identity 0 0 0 0 2 8 97 0.8
Valid responses = 3902 34 7292 63 25 0 11,531 99.7
Invalid responses include no response or multiple responses.
Page 55 of 60

Reference Group Data Report - Spring 2019
American College Health Association
8455 Colesville Road, Suite 740
Silver Spring, MD 20910 FREQUENCY REPORT
(410) 859-1500 Number of Surveys (n) = 11561 P & W Surveys
www.acha.org
American College Health Association-National College Health Assessment (ACHA-NCHA-II)
Graduate Students
August 19, 2019
48. Which term best describes your sexual orientation?
Male Female Unknown Total
Freq. Pct. Freq. Pct. Freq. Pct. Freq. Pct.
1 Asexual 10 0 65 1 0 0 90 0.8
2 Bisexual 115 3 633 9 6 17 787 6.8
3 Gay 325 8 12 0 2 6 352 3.1
4 Lesbian 0 0 149 2 1 3 163 1.4
5 Pansexual 20 1 133 2 0 0 191 1.7
6 Queer 30 1 122 2 0 0 240 2.1
7 Questioning 27 1 106 2 0 0 144 1.3
9 Straight/Heterosexual 3360 86 6015 83 27 75 9,488 82.4
10 Another identity 8 0 38 1 0 0 60 0.5
Valid responses = 3895 34 7273 63 36 0 11,515 99.6
Invalid responses include no response or multiple responses.
49. Height in inches?
Male Female Unknown Total
Inches Freq. Pct. Freq. Pct. Freq. Pct. Freq. Pct.
low-36 0 0 0 0 0 0 0 0
37-48 2 0 17 0 0 0 22 0.2
49-60 16 0 334 5 2 4 359 3.1
61-72 3054 79 6833 94 45 92 10,199 88.9
73-84 799 21 57 1 2 4 885 7.7
GE 85 2 0 0 0 0 0 4 0.0
Valid responses = 3873 34 7241 63 49 0 11,469 99.2
Invalid responses include no response or multiple responses.
Mean Median Std Dev Min Max
Male 70.18 70.00 3.18 44.00 85.00
Female 64.88 65.00 3.06 41.00 82.00
Overall 66.72 66.00 4.04 41.00 85.00
50. What is your weight in pounds?
Male Female Unknown Total
Pounds Freq. Pct. Freq. Pct. Freq. Pct. Freq. Pct.
0-50 0 0 0 0 0 0 0 0.0
51-100 21 1 180 3 0 0 207 1.8
101-150 918 24 4424 62 21 45 5,513 48.4
151-200 2166 56 1960 27 20 43 4,251 37.3
201-250 604 16 448 6 5 11 1,088 9.6
251-300 114 3 145 2 1 2 263 2.3
301-350 26 1 17 0 0 0 45 0.4
351-400 8 0 8 0 0 0 18 0.2
401-450 1 0 3 0 0 0 5 0.0
GE 451 0 0 1 0 0 0 1 0.0
Valid responses = 3858 34 7186 63 47 0 11,391 98.5
Invalid responses include no response or multiple responses.
Mean Median Std Dev Min Max
Male 177.00 170.0 37.52 54.00 425.00
Female 149.81 140.0 38.38 55.00 455.00
Overall 159.35 150.0 40.36 54.00 455.00
51. What is your year in school?
Male Female Unknown Total
Freq. Pct. Freq. Pct. Freq. Pct. Freq. Pct.
1 1st year undergraduate 0 0 0 0 0 0 0 0.0
2 2nd year undergraduate 0 0 0 0 0 0 0 0.0
3 3rd year undergraduate 0 0 0 0 0 0 0 0.0
4 4th year undergraduate 0 0 0 0 0 0 0 0.0
5 5th year or more undergraduate 0 0 0 0 0 0 0 0.0
6 Graduate or professional 3902 100 7292 100 55 100 11,561 100.0
7 Not seeking a degree 0 0 0 0 0 0 0 0.0
8 Other 0 0 0 0 0 0 0 0.0
Valid responses = 3902 34 7292 63 55 0 11,561 100.0
Invalid responses include no response or multiple responses.
52. What is your enrollment status?
Male Female Unknown Total
Freq. Pct. Freq. Pct. Freq. Pct. Freq. Pct.
1 Full-time 3473 89 6215 85 45 87 10,017 86.7
2 Part-time 398 10 1026 14 7 14 1,458 12.6
3 Other 29 1 49 1 0 0 79 0.7
Valid responses = 3900 34 7290 63 52 0 11,554 99.9
Invalid responses include no response or multiple responses.
Page 56 of 60

Reference Group Data Report - Spring 2019
American College Health Association
8455 Colesville Road, Suite 740
Silver Spring, MD 20910 FREQUENCY REPORT
(410) 859-1500 Number of Surveys (n) = 11561 P & W Surveys
www.acha.org
American College Health Association-National College Health Assessment (ACHA-NCHA-II)
Graduate Students
August 19, 2019
53. Have you transferred to this college or university within the last 12 months?
Male Female Unknown Total
Freq. Pct. Freq. Pct. Freq. Pct. Freq. Pct.
1 No 3222 83 6203 85 44 82 9,731 84.4
2 Yes 672 17 1072 15 10 19 1,803 15.6
Valid responses = 3894 34 7275 63 54 0 11,534 99.8
Invalid responses include no response or multiple responses.
54. How do you usually describe yourself?
Male Female Unknown Total
Freq. Pct. Freq. Pct. Freq. Pct. Freq. Pct.
White 2334 60 4840 66 28 51 7,409 64.1
Black or African American 107 3 355 5 2 4 481 4.2
Hispanic or Latino/a 338 9 689 9 3 6 1,061 9.2
Asian or Pacific Islander 1073 28 1300 18 13 24 2,443 21.1
American Indian or Alaskan 43 1 105 1 2 4 160 1.4
Biracial or Multi racial 110 3 341 5 2 4 480 4.2
Other 154 4 189 3 5 9 365 3.2
Valid responses = all responses and blanks: since multiple responses were possible, more than 100% may be included.
55. Are you an international student?
Male Female Unknown Total
Freq. Pct. Freq. Pct. Freq. Pct. Freq. Pct.
1 No 2695 69 6053 83 38 76 9,049 78.5
2 Yes 1201 31 1221 17 12 24 2,481 21.5
Valid responses = 3896 34 7274 63 50 0 11,530 99.7
Invalid responses include no response or multiple responses.
56. What is your relationship status?
Male Female Unknown Total
Freq. Pct. Freq. Pct. Freq. Pct. Freq. Pct.
1 Not in a relationship 1468 38 2342 32 16 33 3,949 34.2
2 In relationship not living together 982 25 2023 28 10 20 3,098 26.9
3 In relationship living together 1445 37 2910 40 23 47 4,483 38.9
Valid responses = 3895 34 7275 63 49 0 11,530 99.7
Invalid responses include no response or multiple responses.
57. What is you marital status?
Male Female Unknown Total
Freq. Pct. Freq. Pct. Freq. Pct. Freq. Pct.
1 Single 2684 69 4964 68 32 63 7,903 68.5
2 Married/Partnered 1126 29 2020 28 19 37 3,228 28.0
3 Separated 8 0 32 0 0 0 45 0.4
4 Divorced 49 1 178 2 0 0 241 2.1
5 Other 32 1 89 1 0 0 128 1.1
Valid responses = 3899 34 7283 63 51 0 11,545 99.9
Invalid responses include no response or multiple responses.
58. Where do you currently live?
Male Female Unknown Total
Freq. Pct. Freq. Pct. Freq. Pct. Freq. Pct.
1 Campus residence hall 186 5 188 3 3 6 395 3.4
2 Fraternity or sorority house 4 0 9 0 0 0 14 0.1
3 Other college/university housing 396 10 490 7 4 8 915 7.9
4 Parent/guardian's house 151 4 469 6 3 6 639 5.5
5 Other off-campus housing 2865 74 5316 73 33 64 8,440 73.1
6 Other 295 8 808 11 9 17 1,138 9.9
Valid responses = 3897 34 7280 63 52 0 11,541 99.8
Invalid responses include no response or multiple responses.
59. Are you a member of a social fraternity or sorority?
Male Female Unknown Total
Freq. Pct. Freq. Pct. Freq. Pct. Freq. Pct.
1 No 3751 96 6963 96 44 86 11,059 95.8
2 Yes 147 4 319 4 7 14 484 4.2
Valid responses = 3898 34 7282 63 51 0 11,543 99.8
Invalid responses include no response or multiple responses.
Page 57 of 60
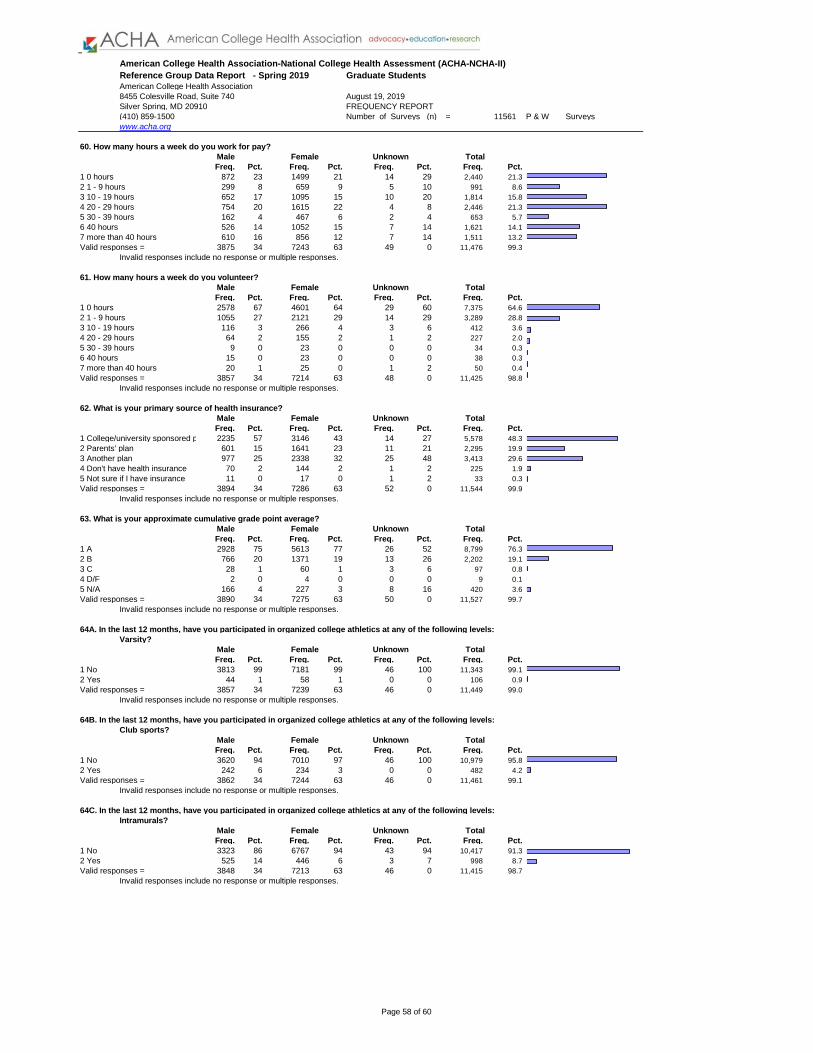
Reference Group Data Report - Spring 2019
American College Health Association
8455 Colesville Road, Suite 740
Silver Spring, MD 20910 FREQUENCY REPORT
(410) 859-1500 Number of Surveys (n) = 11561 P & W Surveys
www.acha.org
American College Health Association-National College Health Assessment (ACHA-NCHA-II)
Graduate Students
August 19, 2019
60. How many hours a week do you work for pay?
Male Female Unknown Total
Freq. Pct. Freq. Pct. Freq. Pct. Freq. Pct.
1 0 hours 872 23 1499 21 14 29 2,440 21.3
2 1 - 9 hours 299 8 659 9 5 10 991 8.6
3 10 - 19 hours 652 17 1095 15 10 20 1,814 15.8
4 20 - 29 hours 754 20 1615 22 4 8 2,446 21.3
5 30 - 39 hours 162 4 467 6 2 4 653 5.7
6 40 hours 526 14 1052 15 7 14 1,621 14.1
7 more than 40 hours 610 16 856 12 7 14 1,511 13.2
Valid responses = 3875 34 7243 63 49 0 11,476 99.3
Invalid responses include no response or multiple responses.
61. How many hours a week do you volunteer?
Male Female Unknown Total
Freq. Pct. Freq. Pct. Freq. Pct. Freq. Pct.
1 0 hours 2578 67 4601 64 29 60 7,375 64.6
2 1 - 9 hours 1055 27 2121 29 14 29 3,289 28.8
3 10 - 19 hours 116 3 266 4 3 6 412 3.6
4 20 - 29 hours 64 2 155 2 1 2 227 2.0
5 30 - 39 hours 9 0 23 0 0 0 34 0.3
6 40 hours 15 0 23 0 0 0 38 0.3
7 more than 40 hours 20 1 25 0 1 2 50 0.4
Valid responses = 3857 34 7214 63 48 0 11,425 98.8
Invalid responses include no response or multiple responses.
62. What is your primary source of health insurance?
Male Female Unknown Total
Freq. Pct. Freq. Pct. Freq. Pct. Freq. Pct.
1 College/university sponsored plan. 2235 57 3146 43 14 27 5,578 48.3
2 Parents' plan 601 15 1641 23 11 21 2,295 19.9
3 Another plan 977 25 2338 32 25 48 3,413 29.6
4 Don't have health insurance 70 2 144 2 1 2 225 1.9
5 Not sure if I have insurance 11 0 17 0 1 2 33 0.3
Valid responses = 3894 34 7286 63 52 0 11,544 99.9
Invalid responses include no response or multiple responses.
63. What is your approximate cumulative grade point average?
Male Female Unknown Total
Freq. Pct. Freq. Pct. Freq. Pct. Freq. Pct.
1 A 2928 75 5613 77 26 52 8,799 76.3
2 B 766 20 1371 19 13 26 2,202 19.1
3 C 28 1 60 1 3 6 97 0.8
4 D/F 2 0 4 0 0 0 9 0.1
5 N/A 166 4 227 3 8 16 420 3.6
Valid responses = 3890 34 7275 63 50 0 11,527 99.7
Invalid responses include no response or multiple responses.
64A. In the last 12 months, have you participated in organized college athletics at any of the following levels:
Varsity?
Male Female Unknown Total
Freq. Pct. Freq. Pct. Freq. Pct. Freq. Pct.
1 No 3813 99 7181 99 46 100 11,343 99.1
2 Yes 44 1 58 1 0 0 106 0.9
Valid responses = 3857 34 7239 63 46 0 11,449 99.0
Invalid responses include no response or multiple responses.
64B. In the last 12 months, have you participated in organized college athletics at any of the following levels:
Club sports?
Male Female Unknown Total
Freq. Pct. Freq. Pct. Freq. Pct. Freq. Pct.
1 No 3620 94 7010 97 46 100 10,979 95.8
2 Yes 242 6 234 3 0 0 482 4.2
Valid responses = 3862 34 7244 63 46 0 11,461 99.1
Invalid responses include no response or multiple responses.
64C. In the last 12 months, have you participated in organized college athletics at any of the following levels:
Intramurals?
Male Female Unknown Total
Freq. Pct. Freq. Pct. Freq. Pct. Freq. Pct.
1 No 3323 86 6767 94 43 94 10,417 91.3
2 Yes 525 14 446 6 3 7 998 8.7
Valid responses = 3848 34 7213 63 46 0 11,415 98.7
Invalid responses include no response or multiple responses.
Page 58 of 60
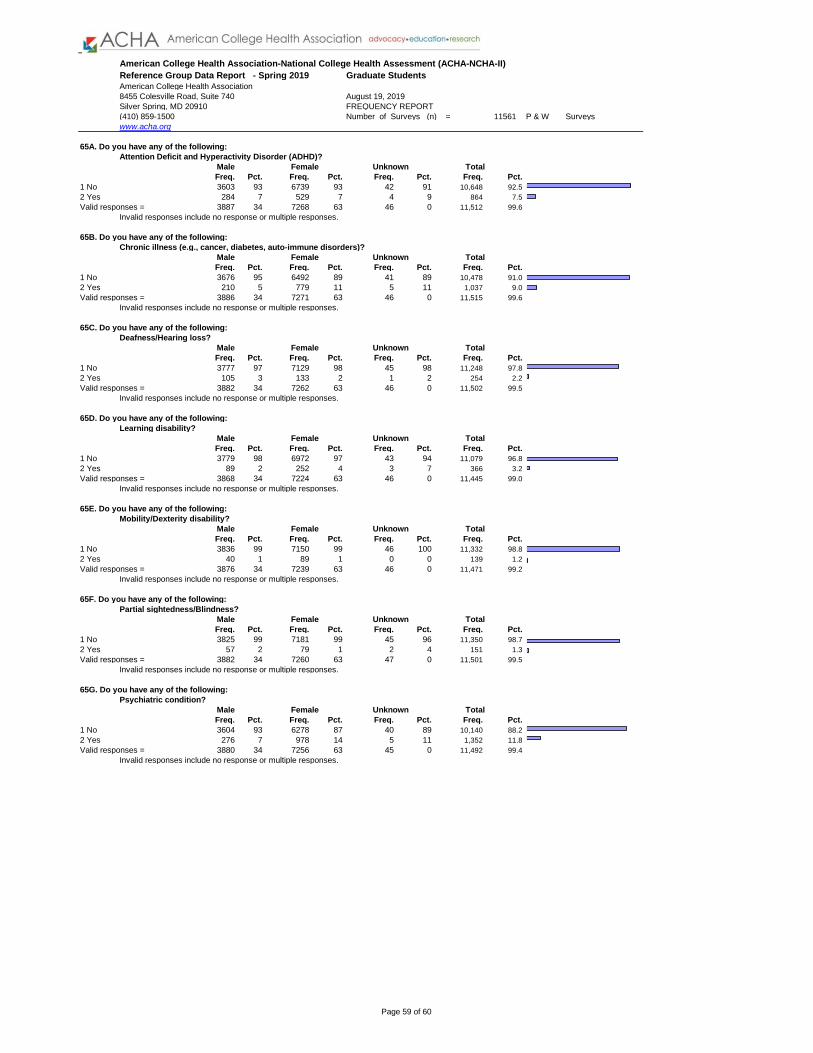
Reference Group Data Report - Spring 2019
American College Health Association
8455 Colesville Road, Suite 740
Silver Spring, MD 20910 FREQUENCY REPORT
(410) 859-1500 Number of Surveys (n) = 11561 P & W Surveys
www.acha.org
American College Health Association-National College Health Assessment (ACHA-NCHA-II)
Graduate Students
August 19, 2019
65A. Do you have any of the following:
Attention Deficit and Hyperactivity Disorder (ADHD)?
Male Female Unknown Total
Freq. Pct. Freq. Pct. Freq. Pct. Freq. Pct.
1 No 3603 93 6739 93 42 91 10,648 92.5
2 Yes 284 7 529 7 4 9 864 7.5
Valid responses = 3887 34 7268 63 46 0 11,512 99.6
Invalid responses include no response or multiple responses.
65B. Do you have any of the following:
Chronic illness (e.g., cancer, diabetes, auto-immune disorders)?
Male Female Unknown Total
Freq. Pct. Freq. Pct. Freq. Pct. Freq. Pct.
1 No 3676 95 6492 89 41 89 10,478 91.0
2 Yes 210 5 779 11 5 11 1,037 9.0
Valid responses = 3886 34 7271 63 46 0 11,515 99.6
Invalid responses include no response or multiple responses.
65C. Do you have any of the following:
Deafness/Hearing loss?
Male Female Unknown Total
Freq. Pct. Freq. Pct. Freq. Pct. Freq. Pct.
1 No 3777 97 7129 98 45 98 11,248 97.8
2 Yes 105 3 133 2 1 2 254 2.2
Valid responses = 3882 34 7262 63 46 0 11,502 99.5
Invalid responses include no response or multiple responses.
65D. Do you have any of the following:
Learning disability?
Male Female Unknown Total
Freq. Pct. Freq. Pct. Freq. Pct. Freq. Pct.
1 No 3779 98 6972 97 43 94 11,079 96.8
2 Yes 89 2 252 4 3 7 366 3.2
Valid responses = 3868 34 7224 63 46 0 11,445 99.0
Invalid responses include no response or multiple responses.
65E. Do you have any of the following:
Mobility/Dexterity disability?
Male Female Unknown Total
Freq. Pct. Freq. Pct. Freq. Pct. Freq. Pct.
1 No 3836 99 7150 99 46 100 11,332 98.8
2 Yes 40 1 89 1 0 0 139 1.2
Valid responses = 3876 34 7239 63 46 0 11,471 99.2
Invalid responses include no response or multiple responses.
65F. Do you have any of the following:
Partial sightedness/Blindness?
Male Female Unknown Total
Freq. Pct. Freq. Pct. Freq. Pct. Freq. Pct.
1 No 3825 99 7181 99 45 96 11,350 98.7
2 Yes 57 2 79 1 2 4 151 1.3
Valid responses = 3882 34 7260 63 47 0 11,501 99.5
Invalid responses include no response or multiple responses.
65G. Do you have any of the following:
Psychiatric condition?
Male Female Unknown Total
Freq. Pct. Freq. Pct. Freq. Pct. Freq. Pct.
1 No 3604 93 6278 87 40 89 10,140 88.2
2 Yes 276 7 978 14 5 11 1,352 11.8
Valid responses = 3880 34 7256 63 45 0 11,492 99.4
Invalid responses include no response or multiple responses.
Page 59 of 60

Reference Group Data Report - Spring 2019
American College Health Association
8455 Colesville Road, Suite 740
Silver Spring, MD 20910 FREQUENCY REPORT
(410) 859-1500 Number of Surveys (n) = 11561 P & W Surveys
www.acha.org
American College Health Association-National College Health Assessment (ACHA-NCHA-II)
Graduate Students
August 19, 2019
65H. Do you have any of the following:
Speech or language disorder?
Male Female Unknown Total
Freq. Pct. Freq. Pct. Freq. Pct. Freq. Pct.
1 No 3847 99 7220 100 46 100 11,420 99.3
2 Yes 36 1 37 1 0 0 78 0.7
Valid responses = 3883 34 7257 63 46 0 11,498 99.5
Invalid responses include no response or multiple responses.
65I. Do you have any of the following:
Other disability?
Male Female Unknown Total
Freq. Pct. Freq. Pct. Freq. Pct. Freq. Pct.
1 No 3779 98 7032 98 44 100 11,138 97.7
2 Yes 73 2 160 2 0 0 259 2.3
Valid responses = 3852 34 7192 63 44 0 11,397 98.6
Invalid responses include no response or multiple responses.
66. Are you currently or have you been a member of the United States Armed Services (Active Duty, Reserve, or National Guard)?
Male Female Unknown Total
Freq. Pct. Freq. Pct. Freq. Pct. Freq. Pct.
1 No 3726 96 7178 99 50 98 11,254 97.6
2 Yes deployed hazardous duty 95 2 46 1 1 2 148 1.3
3 Yes not deployed hazardous duty 70 2 54 1 0 0 129 1.1
Valid responses = 3891 34 7278 63 51 0 11,531 99.7
Invalid responses include no response or multiple responses.
Page 60 of 60
Related Documents