GRADUATE EMPLOYMENT & WAGE RESULTS 2009-2012 Office of Institutional Research Data Source: Department of Labor (Employment & Wage Data Release) Note: Employment data is NON-SPECIFIC and MAY NOT reflect employment in a field related to the student’s college major/field of study.

Welcome message from author
This document is posted to help you gain knowledge. Please leave a comment to let me know what you think about it! Share it to your friends and learn new things together.
Transcript
GRADUATE EMPLOYMENT
& WAGE RESULTS 2009-2012
Office of Institutional Research
Data Source: Department of Labor (Employment & Wage Data Release) Note: Employment data is NON-SPECIFIC and MAY NOT reflect employment
in a field related to the student’s college major/field of study.
Graduate Employment & Wage Results
Page 1 January 2015
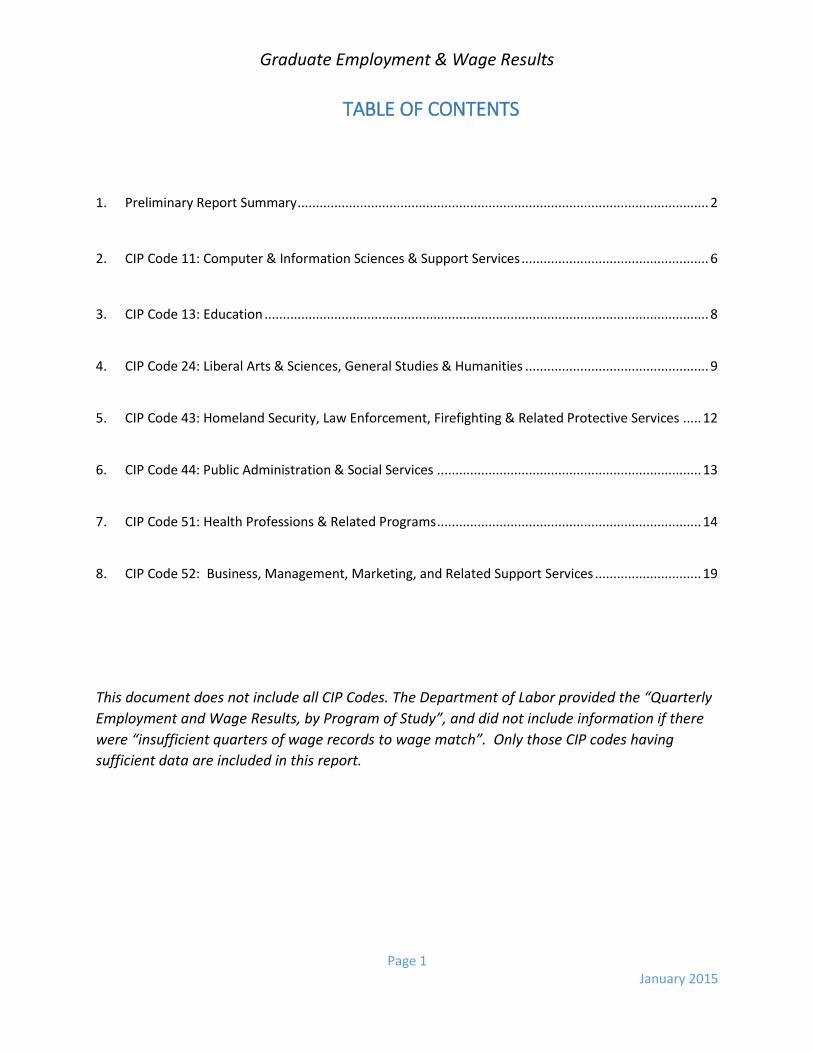
TABLE OF CONTENTS
1. Preliminary Report Summary ................................................................................................................ 2
2. CIP Code 11: Computer & Information Sciences & Support Services ................................................... 6
3. CIP Code 13: Education ......................................................................................................................... 8
4. CIP Code 24: Liberal Arts & Sciences, General Studies & Humanities .................................................. 9
5. CIP Code 43: Homeland Security, Law Enforcement, Firefighting & Related Protective Services ..... 12
6. CIP Code 44: Public Administration & Social Services ........................................................................ 13
7. CIP Code 51: Health Professions & Related Programs ........................................................................ 14
8. CIP Code 52: Business, Management, Marketing, and Related Support Services ............................. 19
This document does not include all CIP Codes. The Department of Labor provided the “Quarterly
Employment and Wage Results, by Program of Study”, and did not include information if there
were “insufficient quarters of wage records to wage match”. Only those CIP codes having
sufficient data are included in this report.
Graduate Employment & Wage Results
Page 2 January 2015
1. Preliminary Report Summary
The Department of Labor has provided employment and wage outcomes for the graduates in four
academic years (2009-2012). The Employment and Wage Data Release presents statistical
information gathered at four points in time: 1st quarter prior to graduation – 1st quarter after
graduation, 3rd quarter after graduation, and 8th quarter after graduation.
This report is based exclusively on the statistics provided by the Connecticut Department of
Labor. These statistics do not include employment and wage earnings for graduates who are
employed outside the state of Connecticut, self-employed, or currently serving in the military.
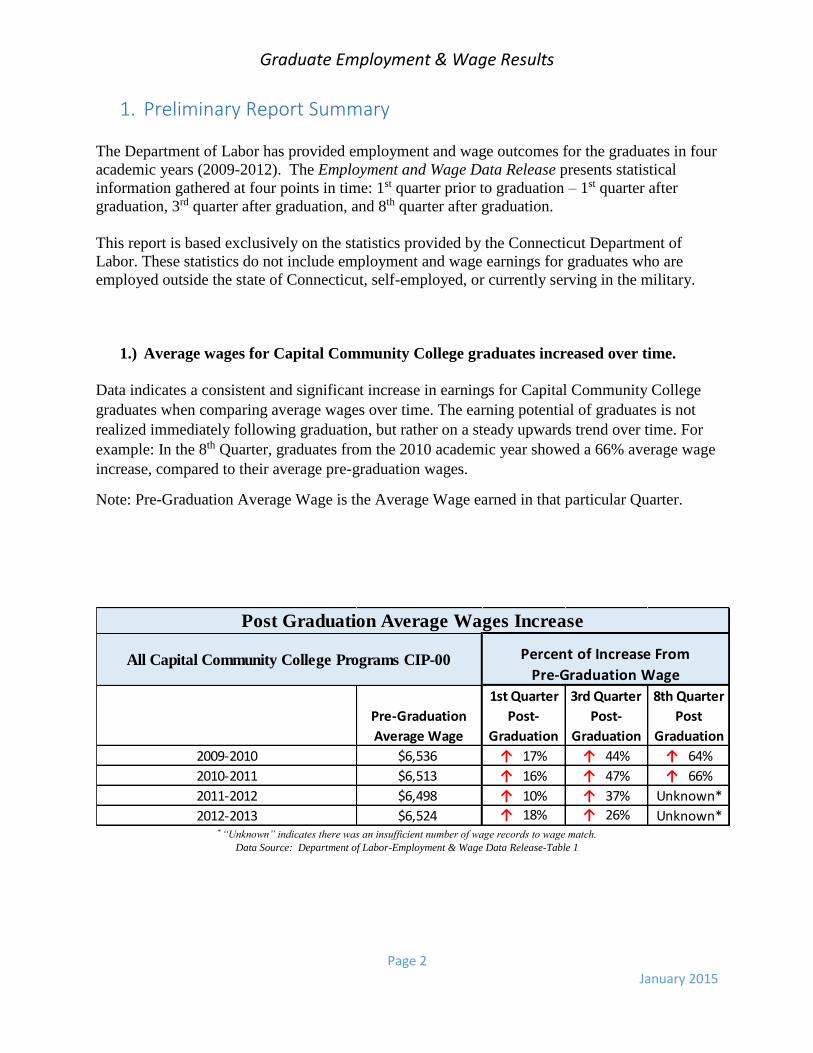
1.) Average wages for Capital Community College graduates increased over time.
Data indicates a consistent and significant increase in earnings for Capital Community College
graduates when comparing average wages over time. The earning potential of graduates is not
realized immediately following graduation, but rather on a steady upwards trend over time. For
example: In the 8th Quarter, graduates from the 2010 academic year showed a 66% average wage
increase, compared to their average pre-graduation wages.
Note: Pre-Graduation Average Wage is the Average Wage earned in that particular Quarter.
* “Unknown” indicates there was an insufficient number of wage records to wage match.
Data Source: Department of Labor-Employment & Wage Data Release-Table 1
Pre-Graduation
Average Wage
1st Quarter
Post-
Graduation
3rd Quarter
Post-
Graduation
8th Quarter
Post
Graduation
2009-2010 $6,536 ↑ 17% ↑ 44% ↑ 64%
2010-2011 $6,513 ↑ 16% ↑ 47% ↑ 66%
2011-2012 $6,498 ↑ 10% ↑ 37% Unknown*
2012-2013 $6,524 ↑ 18% ↑ 26% Unknown*
All Capital Community College Programs CIP-00
Post Graduation Average Wages Increase
Percent of Increase From
Pre-Graduation Wage
Graduate Employment & Wage Results
Page 3 January 2015
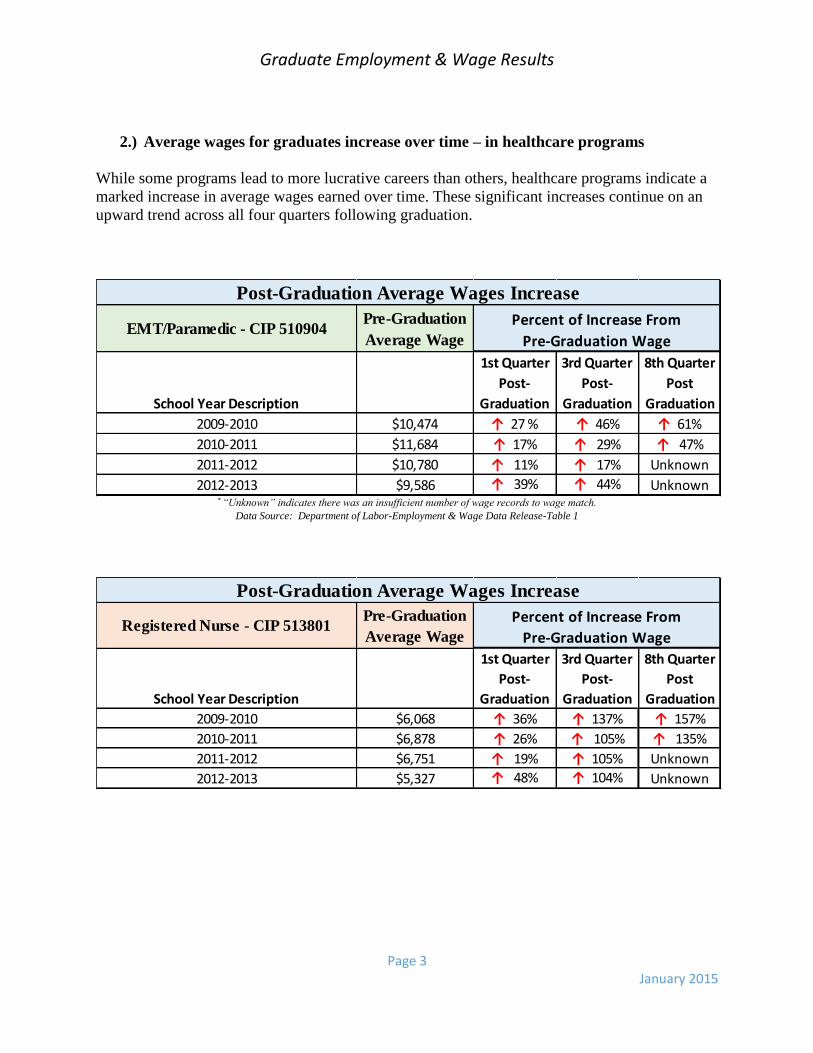
2.) Average wages for graduates increase over time – in healthcare programs
While some programs lead to more lucrative careers than others, healthcare programs indicate a
marked increase in average wages earned over time. These significant increases continue on an
upward trend across all four quarters following graduation.
* “Unknown” indicates there was an insufficient number of wage records to wage match.
Data Source: Department of Labor-Employment & Wage Data Release-Table 1
EMT/Paramedic - CIP 510904Pre-Graduation
Average Wage
School Year Description
1st Quarter
Post-
Graduation
3rd Quarter
Post-
Graduation
8th Quarter
Post
Graduation
2009-2010 $10,474 ↑ 27 % ↑ 46% ↑ 61%
2010-2011 $11,684 ↑ 17% ↑ 29% ↑ 47%
2011-2012 $10,780 ↑ 11% ↑ 17% Unknown
2012-2013 $9,586 ↑ 39% ↑ 44% Unknown
Post-Graduation Average Wages Increase
Percent of Increase From
Pre-Graduation Wage
Registered Nurse - CIP 513801Pre-Graduation
Average Wage
School Year Description
1st Quarter
Post-
Graduation
3rd Quarter
Post-
Graduation
8th Quarter
Post
Graduation
2009-2010 $6,068 ↑ 36% ↑ 137% ↑ 157%
2010-2011 $6,878 ↑ 26% ↑ 105% ↑ 135%
2011-2012 $6,751 ↑ 19% ↑ 105% Unknown
2012-2013 $5,327 ↑ 48% ↑ 104% Unknown
Post-Graduation Average Wages Increase
Percent of Increase From
Pre-Graduation Wage
Graduate Employment & Wage Results
Page 4 January 2015
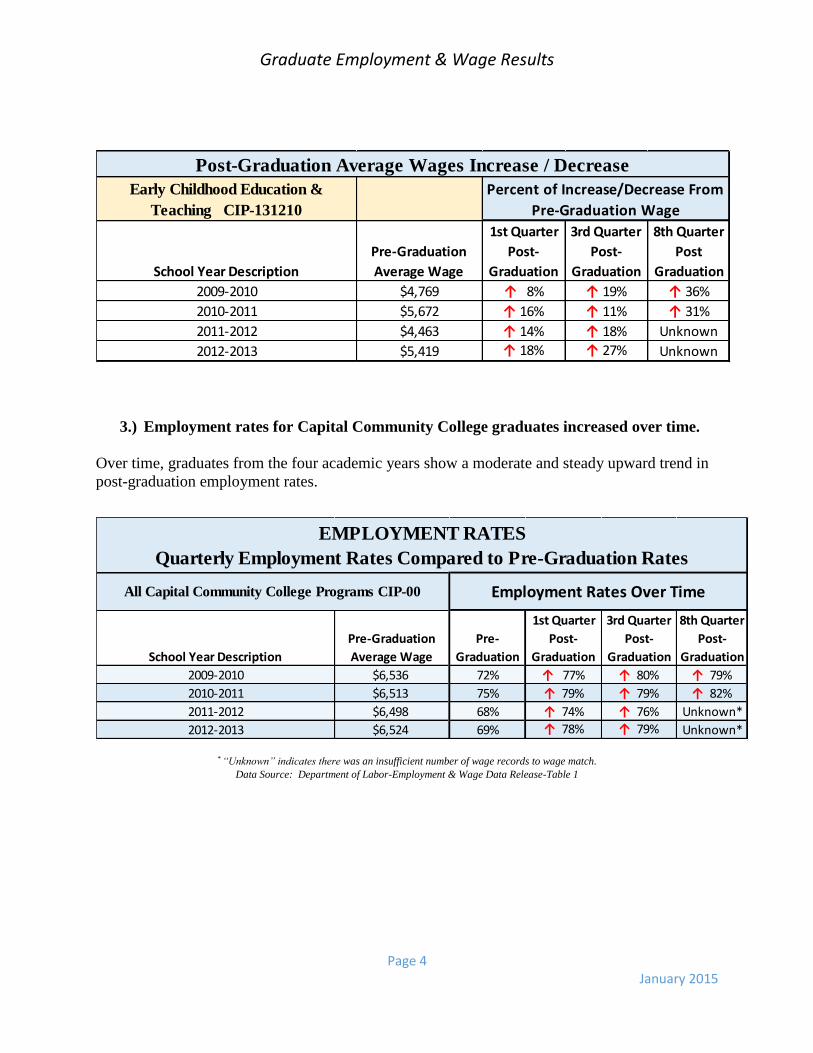
3.) Employment rates for Capital Community College graduates increased over time.
Over time, graduates from the four academic years show a moderate and steady upward trend in
post-graduation employment rates.
* “Unknown” indicates there was an insufficient number of wage records to wage match.
Data Source: Department of Labor-Employment & Wage Data Release-Table 1
Early Childhood Education &
Teaching CIP-131210
School Year Description
Pre-Graduation
Average Wage
1st Quarter
Post-
Graduation
3rd Quarter
Post-
Graduation
8th Quarter
Post
Graduation
2009-2010 $4,769 ↑ 8% ↑ 19% ↑ 36%
2010-2011 $5,672 ↑ 16% ↑ 11% ↑ 31%
2011-2012 $4,463 ↑ 14% ↑ 18% Unknown
2012-2013 $5,419 ↑ 18% ↑ 27% Unknown
Post-Graduation Average Wages Increase / Decrease
Percent of Increase/Decrease From
Pre-Graduation Wage
School Year Description
Pre-Graduation
Average Wage
Pre-
Graduation
1st Quarter
Post-
Graduation
3rd Quarter
Post-
Graduation
8th Quarter
Post-
Graduation
2009-2010 $6,536 72% ↑ 77% ↑ 80% ↑ 79%
2010-2011 $6,513 75% ↑ 79% ↑ 79% ↑ 82%
2011-2012 $6,498 68% ↑ 74% ↑ 76% Unknown*
2012-2013 $6,524 69% ↑ 78% ↑ 79% Unknown*
All Capital Community College Programs CIP-00
EMPLOYMENT RATES
Quarterly Employment Rates Compared to Pre-Graduation Rates
Employment Rates Over Time
Graduate Employment & Wage Results
Page 5 January 2015
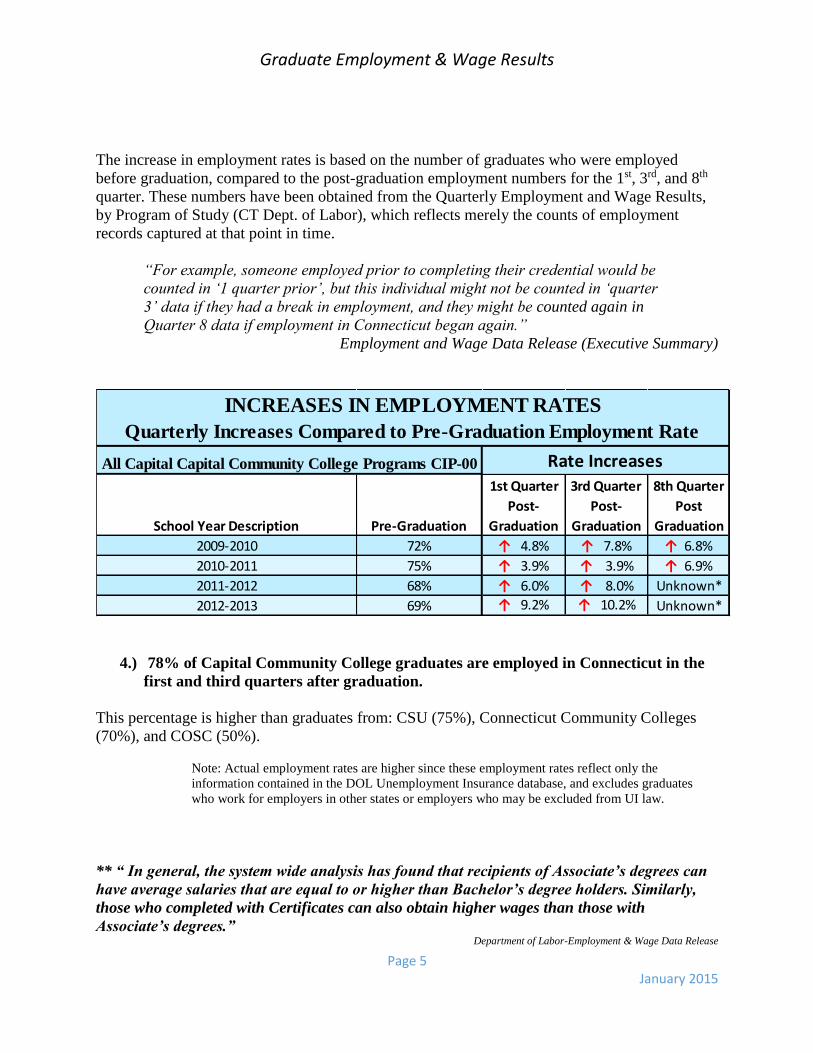
The increase in employment rates is based on the number of graduates who were employed
before graduation, compared to the post-graduation employment numbers for the 1st, 3rd, and 8th
quarter. These numbers have been obtained from the Quarterly Employment and Wage Results,
by Program of Study (CT Dept. of Labor), which reflects merely the counts of employment
records captured at that point in time.
“For example, someone employed prior to completing their credential would be
counted in ‘1 quarter prior’, but this individual might not be counted in ‘quarter
3’ data if they had a break in employment, and they might be counted again in
Quarter 8 data if employment in Connecticut began again.”
Employment and Wage Data Release (Executive Summary)
4.) 78% of Capital Community College graduates are employed in Connecticut in the
first and third quarters after graduation.
This percentage is higher than graduates from: CSU (75%), Connecticut Community Colleges
(70%), and COSC (50%).
Note: Actual employment rates are higher since these employment rates reflect only the
information contained in the DOL Unemployment Insurance database, and excludes graduates
who work for employers in other states or employers who may be excluded from UI law.
** “ In general, the system wide analysis has found that recipients of Associate’s degrees can
have average salaries that are equal to or higher than Bachelor’s degree holders. Similarly,
those who completed with Certificates can also obtain higher wages than those with
Associate’s degrees.” Department of Labor-Employment & Wage Data Release
School Year Description Pre-Graduation
1st Quarter
Post-
Graduation
3rd Quarter
Post-
Graduation
8th Quarter
Post
Graduation
2009-2010 72% ↑ 4.8% ↑ 7.8% ↑ 6.8%
2010-2011 75% ↑ 3.9% ↑ 3.9% ↑ 6.9%
2011-2012 68% ↑ 6.0% ↑ 8.0% Unknown*
2012-2013 69% ↑ 9.2% ↑ 10.2% Unknown*
INCREASES IN EMPLOYMENT RATES
Quarterly Increases Compared to Pre-Graduation Employment Rate
All Capital Capital Community College Programs CIP-00 Rate Increases
Graduate Employment & Wage Results
Page 6 January 2015
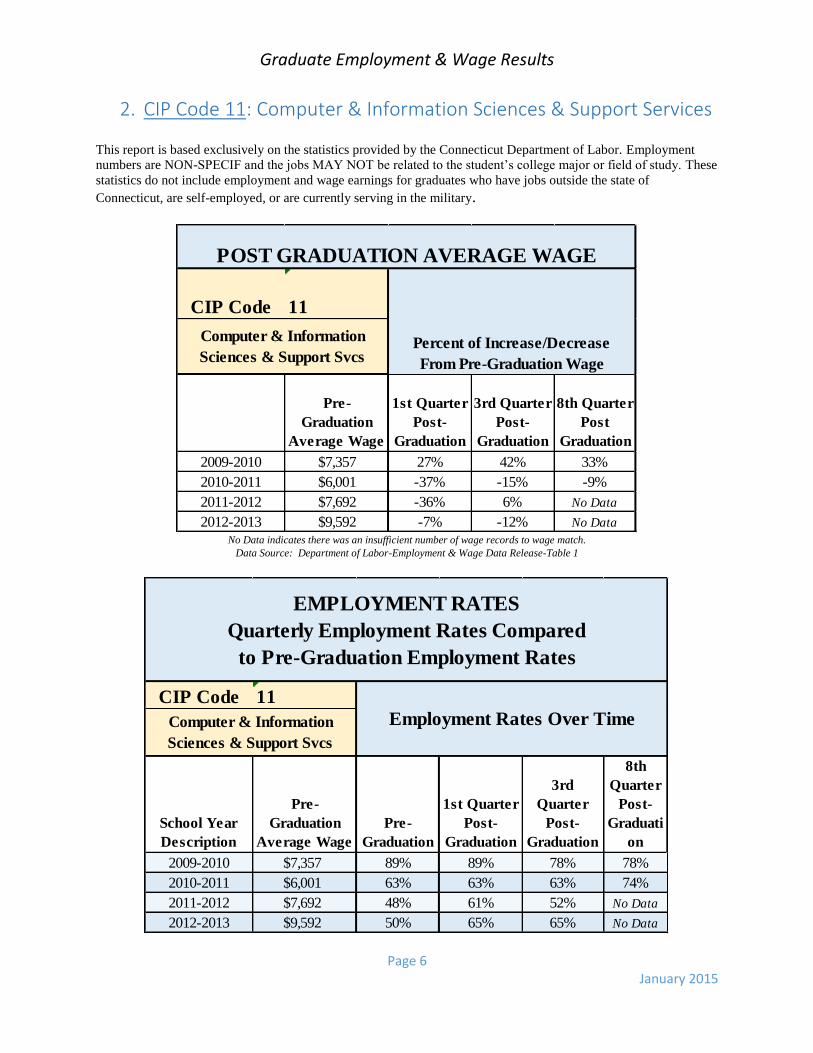
2. CIP Code 11: Computer & Information Sciences & Support Services This report is based exclusively on the statistics provided by the Connecticut Department of Labor. Employment
numbers are NON-SPECIF and the jobs MAY NOT be related to the student’s college major or field of study. These
statistics do not include employment and wage earnings for graduates who have jobs outside the state of
Connecticut, are self-employed, or are currently serving in the military.
No Data indicates there was an insufficient number of wage records to wage match.
Data Source: Department of Labor-Employment & Wage Data Release-Table 1
CIP Code 11
Pre-
Graduation
Average Wage
1st Quarter
Post-
Graduation
3rd Quarter
Post-
Graduation
8th Quarter
Post
Graduation
2009-2010 $7,357 27% 42% 33%
2010-2011 $6,001 -37% -15% -9%
2011-2012 $7,692 -36% 6% No Data
2012-2013 $9,592 -7% -12% No Data
POST GRADUATION AVERAGE WAGE
Percent of Increase/Decrease
From Pre-Graduation Wage
Computer & Information
Sciences & Support Svcs
CIP Code 11
School Year
Description
Pre-
Graduation
Average Wage
Pre-
Graduation
1st Quarter
Post-
Graduation
3rd
Quarter
Post-
Graduation
8th
Quarter
Post-
Graduati
on
2009-2010 $7,357 89% 89% 78% 78%
2010-2011 $6,001 63% 63% 63% 74%
2011-2012 $7,692 48% 61% 52% No Data
2012-2013 $9,592 50% 65% 65% No Data
EMPLOYMENT RATES
Quarterly Employment Rates Compared
to Pre-Graduation Employment Rates
Employment Rates Over TimeComputer & Information
Sciences & Support Svcs
Graduate Employment & Wage Results
Page 7 January 2015
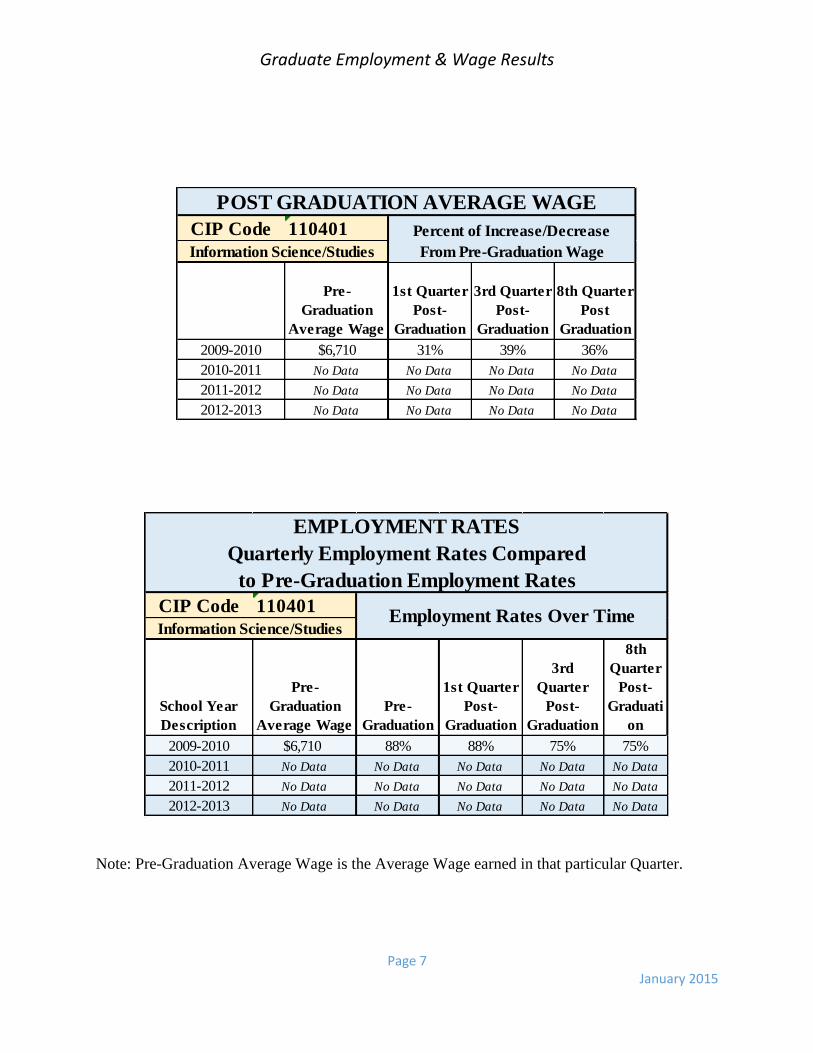
Note: Pre-Graduation Average Wage is the Average Wage earned in that particular Quarter.
CIP Code 110401
Pre-
Graduation
Average Wage
1st Quarter
Post-
Graduation
3rd Quarter
Post-
Graduation
8th Quarter
Post
Graduation
2009-2010 $6,710 31% 39% 36%
2010-2011 No Data No Data No Data No Data
2011-2012 No Data No Data No Data No Data
2012-2013 No Data No Data No Data No Data
Percent of Increase/Decrease
From Pre-Graduation WageInformation Science/Studies
POST GRADUATION AVERAGE WAGE
CIP Code 110401
School Year
Description
Pre-
Graduation
Average Wage
Pre-
Graduation
1st Quarter
Post-
Graduation
3rd
Quarter
Post-
Graduation
8th
Quarter
Post-
Graduati
on
2009-2010 $6,710 88% 88% 75% 75%
2010-2011 No Data No Data No Data No Data No Data
2011-2012 No Data No Data No Data No Data No Data
2012-2013 No Data No Data No Data No Data No Data
EMPLOYMENT RATES
Quarterly Employment Rates Compared
to Pre-Graduation Employment Rates
Employment Rates Over TimeInformation Science/Studies
Graduate Employment & Wage Results
Page 8 January 2015
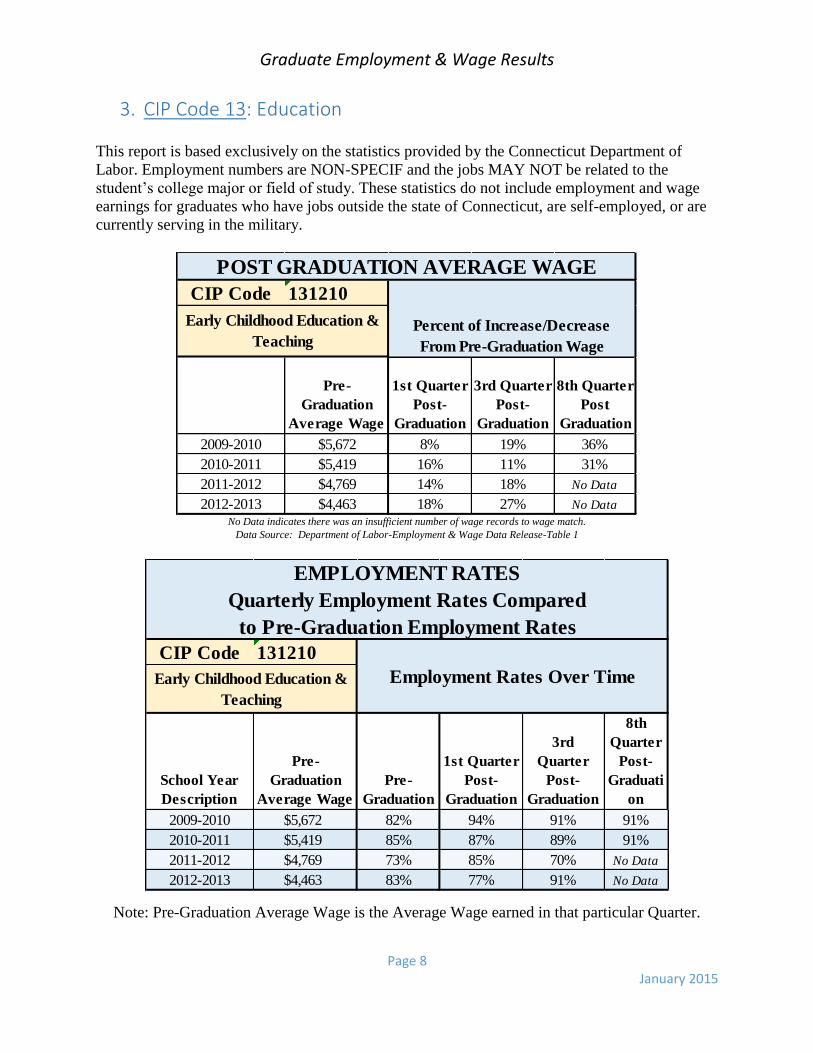
3. CIP Code 13: Education
This report is based exclusively on the statistics provided by the Connecticut Department of
Labor. Employment numbers are NON-SPECIF and the jobs MAY NOT be related to the
student’s college major or field of study. These statistics do not include employment and wage
earnings for graduates who have jobs outside the state of Connecticut, are self-employed, or are
currently serving in the military.
No Data indicates there was an insufficient number of wage records to wage match.
Data Source: Department of Labor-Employment & Wage Data Release-Table 1
Note: Pre-Graduation Average Wage is the Average Wage earned in that particular Quarter.
CIP Code 131210
Pre-
Graduation
Average Wage
1st Quarter
Post-
Graduation
3rd Quarter
Post-
Graduation
8th Quarter
Post
Graduation
2009-2010 $5,672 8% 19% 36%
2010-2011 $5,419 16% 11% 31%
2011-2012 $4,769 14% 18% No Data
2012-2013 $4,463 18% 27% No Data
POST GRADUATION AVERAGE WAGE
Percent of Increase/Decrease
From Pre-Graduation Wage
Early Childhood Education &
Teaching
CIP Code 131210
School Year
Description
Pre-
Graduation
Average Wage
Pre-
Graduation
1st Quarter
Post-
Graduation
3rd
Quarter
Post-
Graduation
8th
Quarter
Post-
Graduati
on
2009-2010 $5,672 82% 94% 91% 91%
2010-2011 $5,419 85% 87% 89% 91%
2011-2012 $4,769 73% 85% 70% No Data
2012-2013 $4,463 83% 77% 91% No Data
EMPLOYMENT RATES
Quarterly Employment Rates Compared
to Pre-Graduation Employment Rates
Employment Rates Over TimeEarly Childhood Education &
Teaching
Graduate Employment & Wage Results
Page 9 January 2015
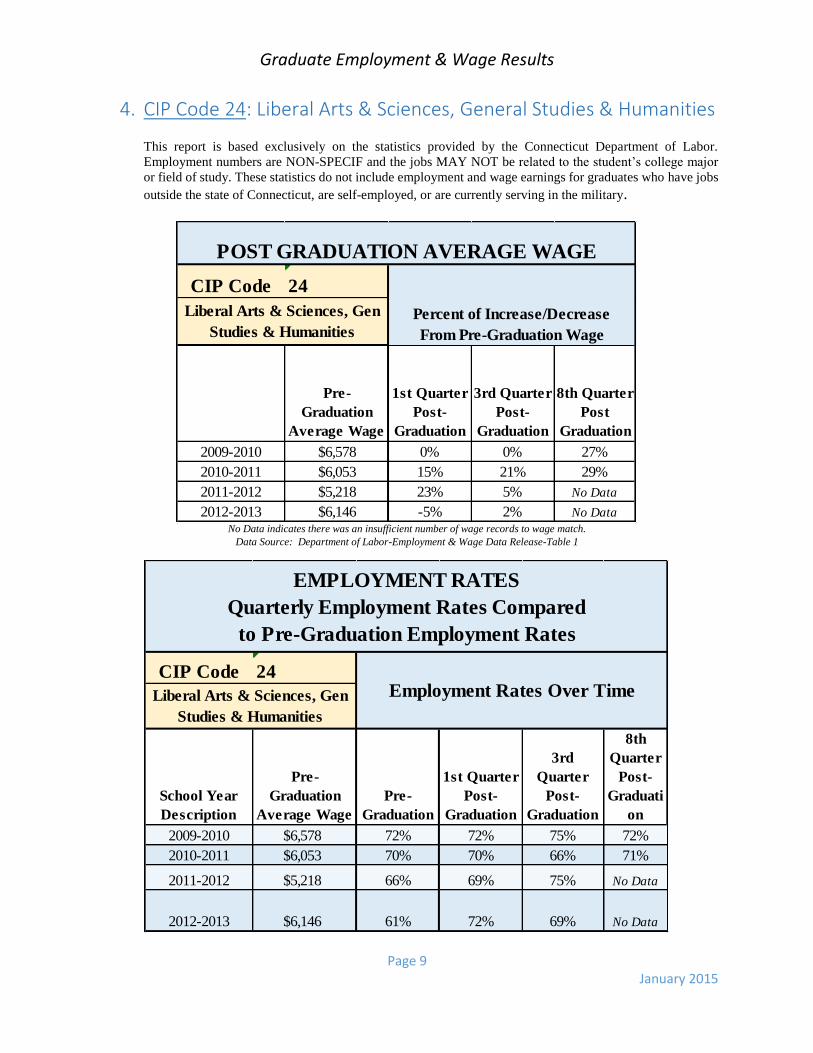
4. CIP Code 24: Liberal Arts & Sciences, General Studies & Humanities
This report is based exclusively on the statistics provided by the Connecticut Department of Labor.
Employment numbers are NON-SPECIF and the jobs MAY NOT be related to the student’s college major
or field of study. These statistics do not include employment and wage earnings for graduates who have jobs
outside the state of Connecticut, are self-employed, or are currently serving in the military.
No Data indicates there was an insufficient number of wage records to wage match.
Data Source: Department of Labor-Employment & Wage Data Release-Table 1
CIP Code 24
Pre-
Graduation
Average Wage
1st Quarter
Post-
Graduation
3rd Quarter
Post-
Graduation
8th Quarter
Post
Graduation
2009-2010 $6,578 0% 0% 27%
2010-2011 $6,053 15% 21% 29%
2011-2012 $5,218 23% 5% No Data
2012-2013 $6,146 -5% 2% No Data
POST GRADUATION AVERAGE WAGE
Percent of Increase/Decrease
From Pre-Graduation Wage
Liberal Arts & Sciences, Gen
Studies & Humanities
CIP Code 24
School Year
Description
Pre-
Graduation
Average Wage
Pre-
Graduation
1st Quarter
Post-
Graduation
3rd
Quarter
Post-
Graduation
8th
Quarter
Post-
Graduati
on
2009-2010 $6,578 72% 72% 75% 72%
2010-2011 $6,053 70% 70% 66% 71%
2011-2012 $5,218 66% 69% 75% No Data
2012-2013 $6,146 61% 72% 69% No Data
EMPLOYMENT RATES
Quarterly Employment Rates Compared
to Pre-Graduation Employment Rates
Employment Rates Over TimeLiberal Arts & Sciences, Gen
Studies & Humanities
Graduate Employment & Wage Results
Page 10 January 2015
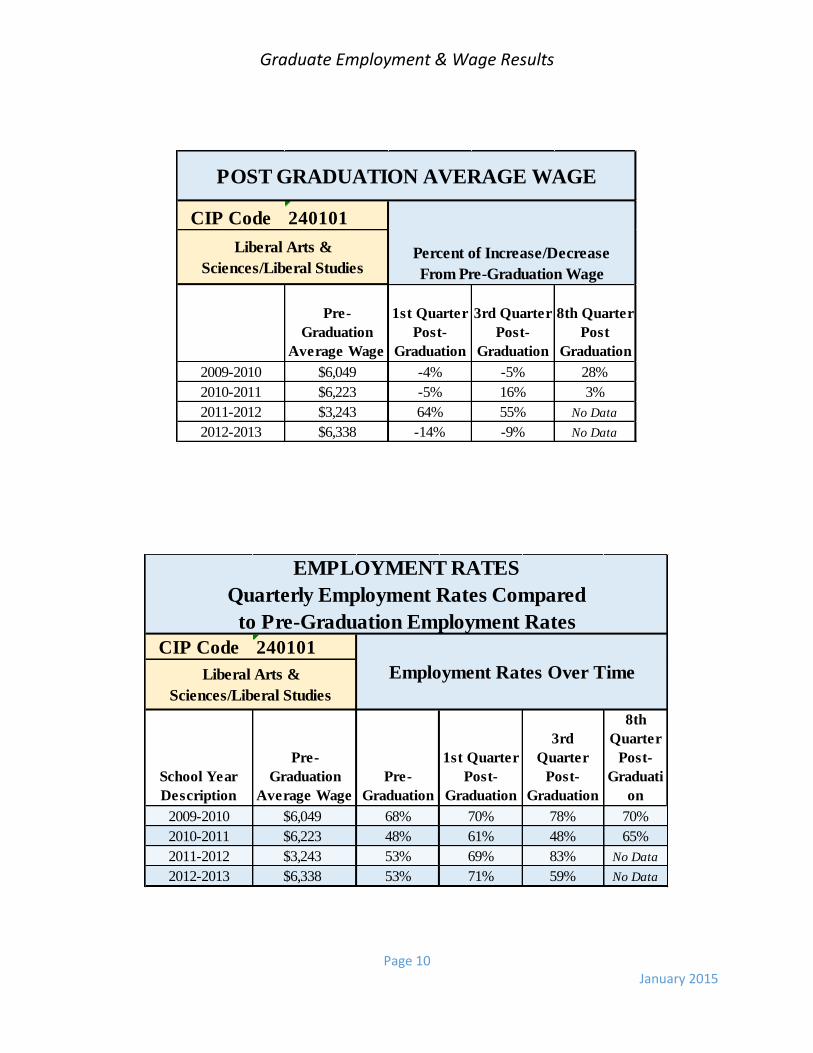
CIP Code 240101
Pre-
Graduation
Average Wage
1st Quarter
Post-
Graduation
3rd Quarter
Post-
Graduation
8th Quarter
Post
Graduation
2009-2010 $6,049 -4% -5% 28%
2010-2011 $6,223 -5% 16% 3%
2011-2012 $3,243 64% 55% No Data
2012-2013 $6,338 -14% -9% No Data
POST GRADUATION AVERAGE WAGE
Percent of Increase/Decrease
From Pre-Graduation Wage
Liberal Arts &
Sciences/Liberal Studies
CIP Code 240101
School Year
Description
Pre-
Graduation
Average Wage
Pre-
Graduation
1st Quarter
Post-
Graduation
3rd
Quarter
Post-
Graduation
8th
Quarter
Post-
Graduati
on
2009-2010 $6,049 68% 70% 78% 70%
2010-2011 $6,223 48% 61% 48% 65%
2011-2012 $3,243 53% 69% 83% No Data
2012-2013 $6,338 53% 71% 59% No Data
EMPLOYMENT RATES
Quarterly Employment Rates Compared
to Pre-Graduation Employment Rates
Employment Rates Over TimeLiberal Arts &
Sciences/Liberal Studies
Graduate Employment & Wage Results
Page 11 January 2015
Note: Pre-Graduation Average Wage is the Average Wage earned in that particular Quarter.
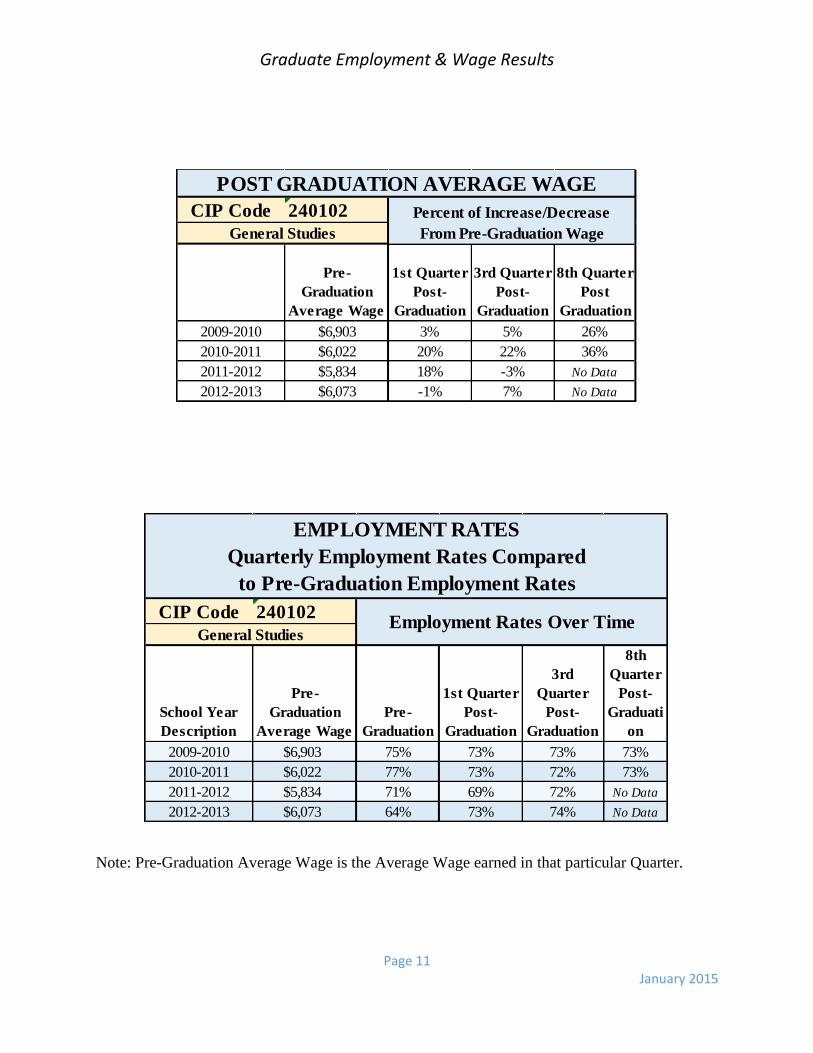
CIP Code 240102
Pre-
Graduation
Average Wage
1st Quarter
Post-
Graduation
3rd Quarter
Post-
Graduation
8th Quarter
Post
Graduation
2009-2010 $6,903 3% 5% 26%
2010-2011 $6,022 20% 22% 36%
2011-2012 $5,834 18% -3% No Data
2012-2013 $6,073 -1% 7% No Data
POST GRADUATION AVERAGE WAGE
Percent of Increase/Decrease
From Pre-Graduation WageGeneral Studies
CIP Code 240102
School Year
Description
Pre-
Graduation
Average Wage
Pre-
Graduation
1st Quarter
Post-
Graduation
3rd
Quarter
Post-
Graduation
8th
Quarter
Post-
Graduati
on
2009-2010 $6,903 75% 73% 73% 73%
2010-2011 $6,022 77% 73% 72% 73%
2011-2012 $5,834 71% 69% 72% No Data
2012-2013 $6,073 64% 73% 74% No Data
EMPLOYMENT RATES
Quarterly Employment Rates Compared
to Pre-Graduation Employment Rates
Employment Rates Over TimeGeneral Studies
Graduate Employment & Wage Results
Page 12 January 2015
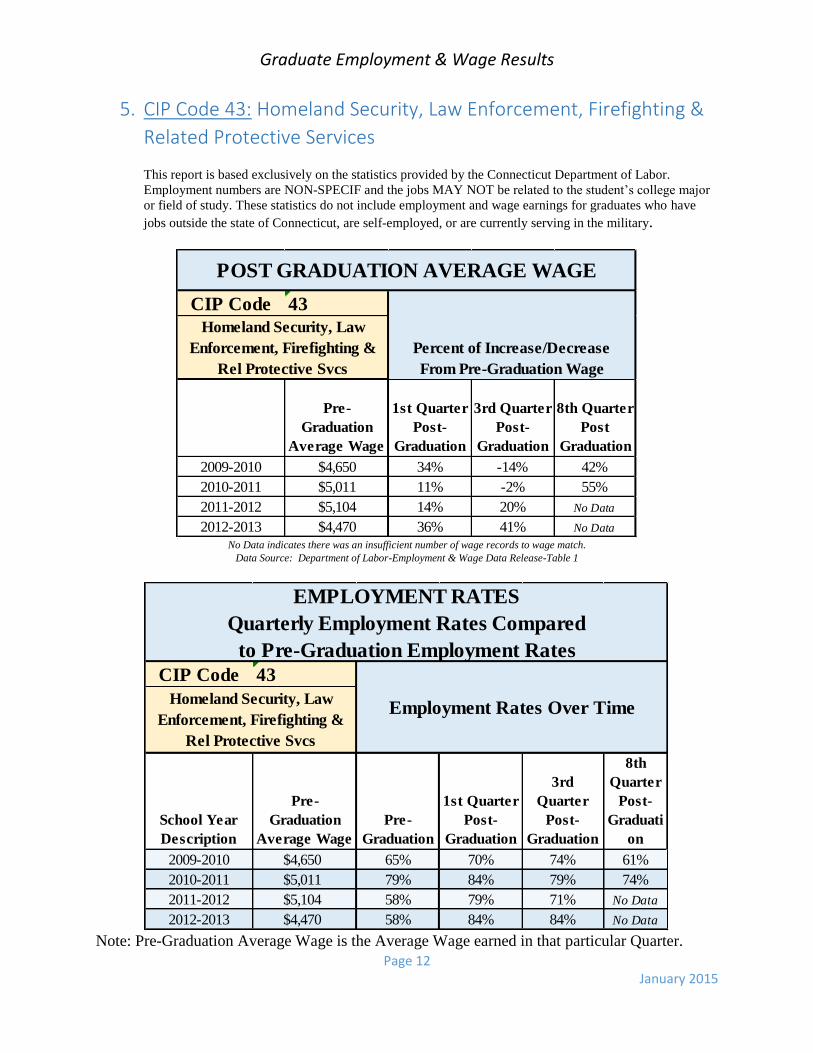
5. CIP Code 43: Homeland Security, Law Enforcement, Firefighting &
Related Protective Services
This report is based exclusively on the statistics provided by the Connecticut Department of Labor.
Employment numbers are NON-SPECIF and the jobs MAY NOT be related to the student’s college major
or field of study. These statistics do not include employment and wage earnings for graduates who have
jobs outside the state of Connecticut, are self-employed, or are currently serving in the military.
No Data indicates there was an insufficient number of wage records to wage match.
Data Source: Department of Labor-Employment & Wage Data Release-Table 1
Note: Pre-Graduation Average Wage is the Average Wage earned in that particular Quarter.
CIP Code 43
Pre-
Graduation
Average Wage
1st Quarter
Post-
Graduation
3rd Quarter
Post-
Graduation
8th Quarter
Post
Graduation
2009-2010 $4,650 34% -14% 42%
2010-2011 $5,011 11% -2% 55%
2011-2012 $5,104 14% 20% No Data
2012-2013 $4,470 36% 41% No Data
POST GRADUATION AVERAGE WAGE
Percent of Increase/Decrease
From Pre-Graduation Wage
Homeland Security, Law
Enforcement, Firefighting &
Rel Protective Svcs
CIP Code 43
School Year
Description
Pre-
Graduation
Average Wage
Pre-
Graduation
1st Quarter
Post-
Graduation
3rd
Quarter
Post-
Graduation
8th
Quarter
Post-
Graduati
on
2009-2010 $4,650 65% 70% 74% 61%
2010-2011 $5,011 79% 84% 79% 74%
2011-2012 $5,104 58% 79% 71% No Data
2012-2013 $4,470 58% 84% 84% No Data
EMPLOYMENT RATES
Quarterly Employment Rates Compared
to Pre-Graduation Employment Rates
Employment Rates Over TimeHomeland Security, Law
Enforcement, Firefighting &
Rel Protective Svcs
Graduate Employment & Wage Results
Page 13 January 2015
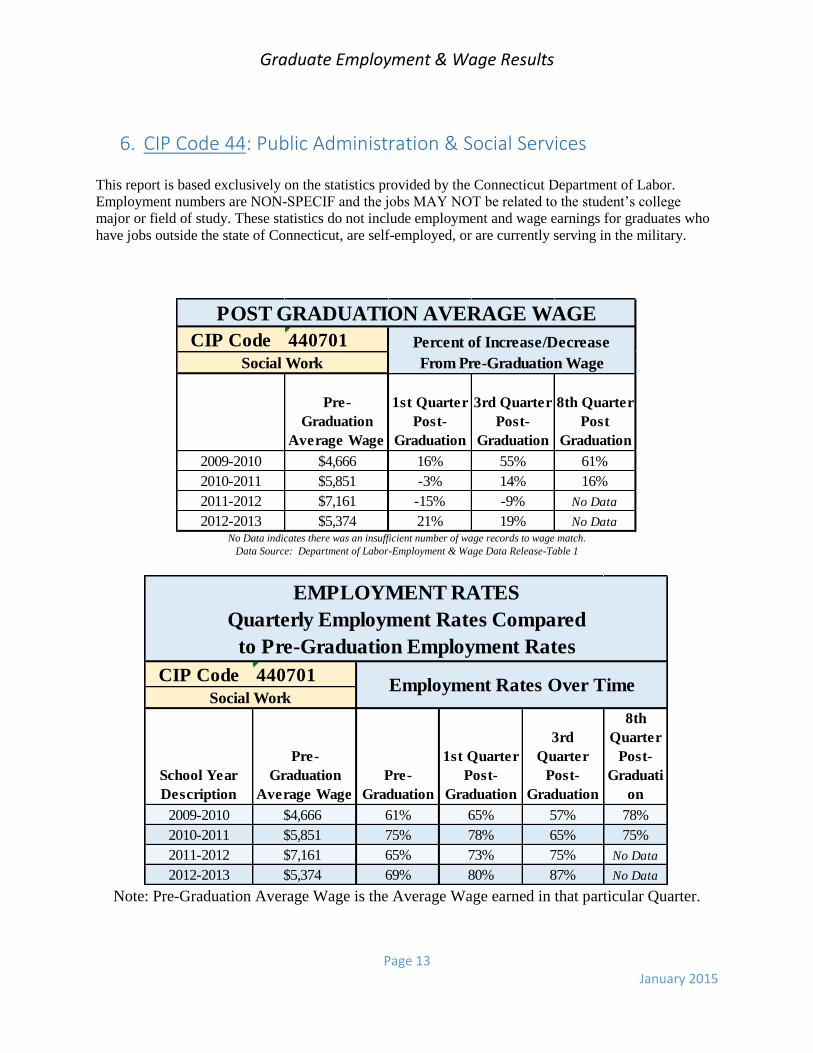
6. CIP Code 44: Public Administration & Social Services This report is based exclusively on the statistics provided by the Connecticut Department of Labor.
Employment numbers are NON-SPECIF and the jobs MAY NOT be related to the student’s college
major or field of study. These statistics do not include employment and wage earnings for graduates who
have jobs outside the state of Connecticut, are self-employed, or are currently serving in the military.
No Data indicates there was an insufficient number of wage records to wage match.
Data Source: Department of Labor-Employment & Wage Data Release-Table 1
Note: Pre-Graduation Average Wage is the Average Wage earned in that particular Quarter.
CIP Code 440701
Pre-
Graduation
Average Wage
1st Quarter
Post-
Graduation
3rd Quarter
Post-
Graduation
8th Quarter
Post
Graduation
2009-2010 $4,666 16% 55% 61%
2010-2011 $5,851 -3% 14% 16%
2011-2012 $7,161 -15% -9% No Data
2012-2013 $5,374 21% 19% No Data
POST GRADUATION AVERAGE WAGE
Percent of Increase/Decrease
From Pre-Graduation WageSocial Work
CIP Code 440701
School Year
Description
Pre-
Graduation
Average Wage
Pre-
Graduation
1st Quarter
Post-
Graduation
3rd
Quarter
Post-
Graduation
8th
Quarter
Post-
Graduati
on
2009-2010 $4,666 61% 65% 57% 78%
2010-2011 $5,851 75% 78% 65% 75%
2011-2012 $7,161 65% 73% 75% No Data
2012-2013 $5,374 69% 80% 87% No Data
Employment Rates Over TimeSocial Work
EMPLOYMENT RATES
Quarterly Employment Rates Compared
to Pre-Graduation Employment Rates
Graduate Employment & Wage Results
Page 14 January 2015
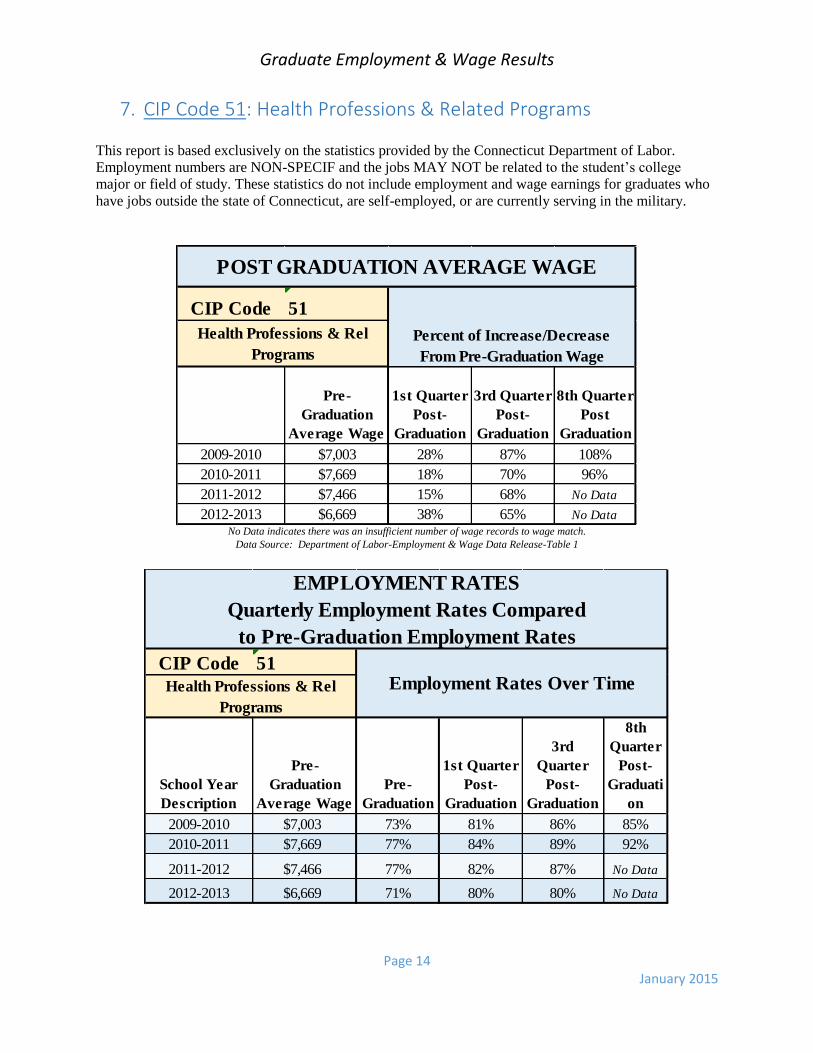
7. CIP Code 51: Health Professions & Related Programs This report is based exclusively on the statistics provided by the Connecticut Department of Labor.
Employment numbers are NON-SPECIF and the jobs MAY NOT be related to the student’s college
major or field of study. These statistics do not include employment and wage earnings for graduates who
have jobs outside the state of Connecticut, are self-employed, or are currently serving in the military.
No Data indicates there was an insufficient number of wage records to wage match.
Data Source: Department of Labor-Employment & Wage Data Release-Table 1
CIP Code 51
Pre-
Graduation
Average Wage
1st Quarter
Post-
Graduation
3rd Quarter
Post-
Graduation
8th Quarter
Post
Graduation
2009-2010 $7,003 28% 87% 108%
2010-2011 $7,669 18% 70% 96%
2011-2012 $7,466 15% 68% No Data
2012-2013 $6,669 38% 65% No Data
POST GRADUATION AVERAGE WAGE
Percent of Increase/Decrease
From Pre-Graduation Wage
Health Professions & Rel
Programs
CIP Code 51
School Year
Description
Pre-
Graduation
Average Wage
Pre-
Graduation
1st Quarter
Post-
Graduation
3rd
Quarter
Post-
Graduation
8th
Quarter
Post-
Graduati
on
2009-2010 $7,003 73% 81% 86% 85%
2010-2011 $7,669 77% 84% 89% 92%
2011-2012 $7,466 77% 82% 87% No Data
2012-2013 $6,669 71% 80% 80% No Data
Employment Rates Over TimeHealth Professions & Rel
Programs
EMPLOYMENT RATES
Quarterly Employment Rates Compared
to Pre-Graduation Employment Rates

Graduate Employment & Wage Results
Page 15 January 2015
CIP Code 510801
Pre-
Graduation
Average Wage
1st Quarter
Post-
Graduation
3rd Quarter
Post-
Graduation
8th Quarter
Post
Graduation
2009-2010 $3,105 58% 87% 100%
2010-2011 $5,133 2% 43% 40%
2011-2012 $5,022 37% 32% No Data
2012-2013 No Data No Data No Data No Data
POST GRADUATION AVERAGE WAGE
Percent of Increase/Decrease
From Pre-Graduation WageMedical/Clinical Assistant
CIP Code 510801
School Year
Description
Pre-
Graduation
Average Wage
Pre-
Graduation
1st Quarter
Post-
Graduation
3rd
Quarter
Post-
8th
Quarter
Post-
2009-2010 $3,105 59% 65% 65% 65%
2010-2011 $5,133 74% 96% 87% 83%
2011-2012 $5,022 71% 71% 65% No Data
2012-2013 No Data No Data No Data No Data No Data
EMPLOYMENT RATES
Quarterly Employment Rates Compared
to Pre-Graduation Employment Rates
Employment Rates Over TimeMedical/Clinical Assistant
Graduate Employment & Wage Results
Page 16 January 2015
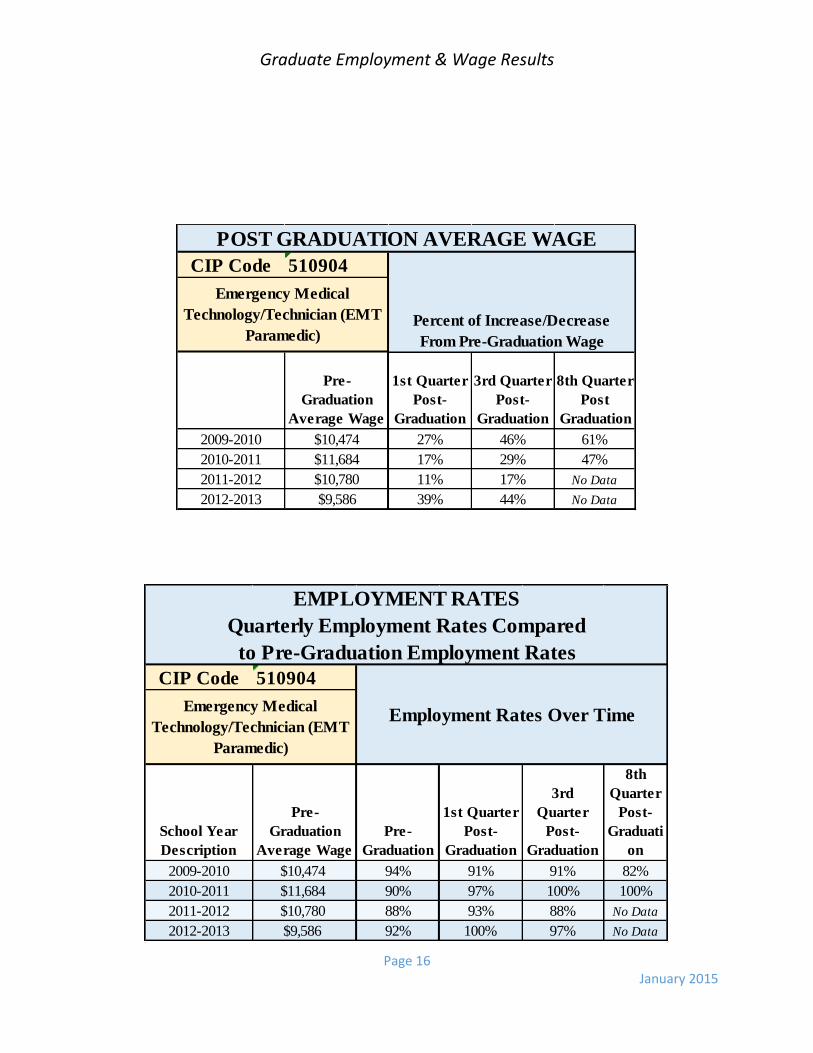
CIP Code 510904
Pre-
Graduation
Average Wage
1st Quarter
Post-
Graduation
3rd Quarter
Post-
Graduation
8th Quarter
Post
Graduation
2009-2010 $10,474 27% 46% 61%
2010-2011 $11,684 17% 29% 47%
2011-2012 $10,780 11% 17% No Data
2012-2013 $9,586 39% 44% No Data
POST GRADUATION AVERAGE WAGE
Percent of Increase/Decrease
From Pre-Graduation Wage
Emergency Medical
Technology/Technician (EMT
Paramedic)
CIP Code 510904
School Year
Description
Pre-
Graduation
Average Wage
Pre-
Graduation
1st Quarter
Post-
Graduation
3rd
Quarter
Post-
Graduation
8th
Quarter
Post-
Graduati
on
2009-2010 $10,474 94% 91% 91% 82%
2010-2011 $11,684 90% 97% 100% 100%
2011-2012 $10,780 88% 93% 88% No Data
2012-2013 $9,586 92% 100% 97% No Data
EMPLOYMENT RATES
Quarterly Employment Rates Compared
to Pre-Graduation Employment Rates
Employment Rates Over TimeEmergency Medical
Technology/Technician (EMT
Paramedic)
Graduate Employment & Wage Results
Page 17 January 2015
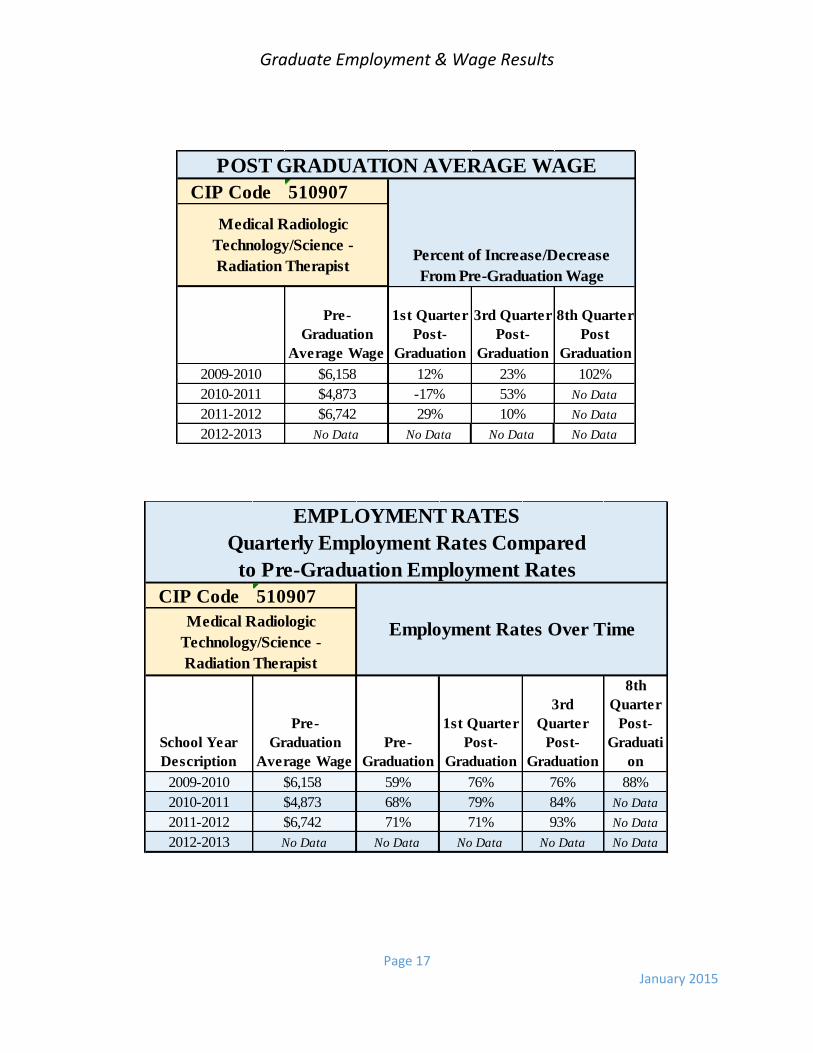
CIP Code 510907
Pre-
Graduation
Average Wage
1st Quarter
Post-
Graduation
3rd Quarter
Post-
Graduation
8th Quarter
Post
Graduation
2009-2010 $6,158 12% 23% 102%
2010-2011 $4,873 -17% 53% No Data
2011-2012 $6,742 29% 10% No Data
2012-2013 No Data No Data No Data No Data
POST GRADUATION AVERAGE WAGE
Percent of Increase/Decrease
From Pre-Graduation Wage
Medical Radiologic
Technology/Science -
Radiation Therapist
CIP Code 510907
School Year
Description
Pre-
Graduation
Average Wage
Pre-
Graduation
1st Quarter
Post-
Graduation
3rd
Quarter
Post-
Graduation
8th
Quarter
Post-
Graduati
on
2009-2010 $6,158 59% 76% 76% 88%
2010-2011 $4,873 68% 79% 84% No Data
2011-2012 $6,742 71% 71% 93% No Data
2012-2013 No Data No Data No Data No Data No Data
EMPLOYMENT RATES
Quarterly Employment Rates Compared
to Pre-Graduation Employment Rates
Employment Rates Over TimeMedical Radiologic
Technology/Science -
Radiation Therapist
Graduate Employment & Wage Results
Page 18 January 2015
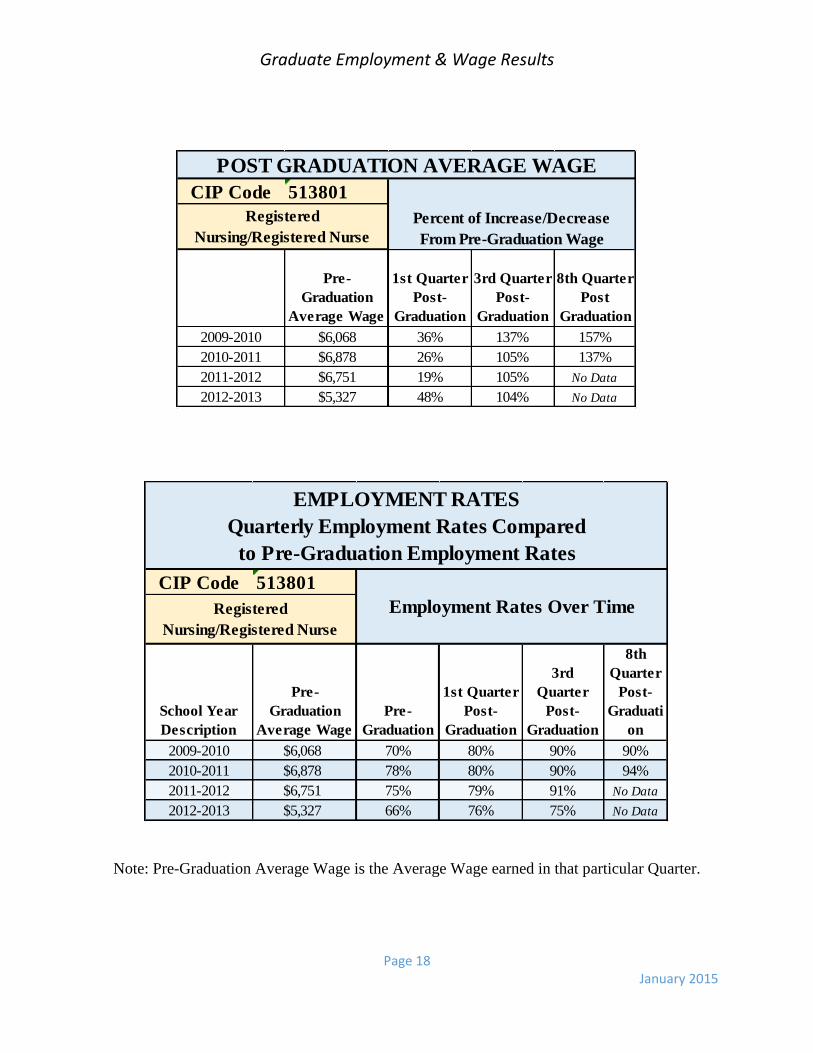
Note: Pre-Graduation Average Wage is the Average Wage earned in that particular Quarter.
CIP Code 513801
Pre-
Graduation
Average Wage
1st Quarter
Post-
Graduation
3rd Quarter
Post-
Graduation
8th Quarter
Post
Graduation
2009-2010 $6,068 36% 137% 157%
2010-2011 $6,878 26% 105% 137%
2011-2012 $6,751 19% 105% No Data
2012-2013 $5,327 48% 104% No Data
POST GRADUATION AVERAGE WAGE
Percent of Increase/Decrease
From Pre-Graduation Wage
Registered
Nursing/Registered Nurse
CIP Code 513801
School Year
Description
Pre-
Graduation
Average Wage
Pre-
Graduation
1st Quarter
Post-
Graduation
3rd
Quarter
Post-
Graduation
8th
Quarter
Post-
Graduati
on
2009-2010 $6,068 70% 80% 90% 90%
2010-2011 $6,878 78% 80% 90% 94%
2011-2012 $6,751 75% 79% 91% No Data
2012-2013 $5,327 66% 76% 75% No Data
Employment Rates Over TimeRegistered
Nursing/Registered Nurse
EMPLOYMENT RATES
Quarterly Employment Rates Compared
to Pre-Graduation Employment Rates
Graduate Employment & Wage Results
Page 19 January 2015
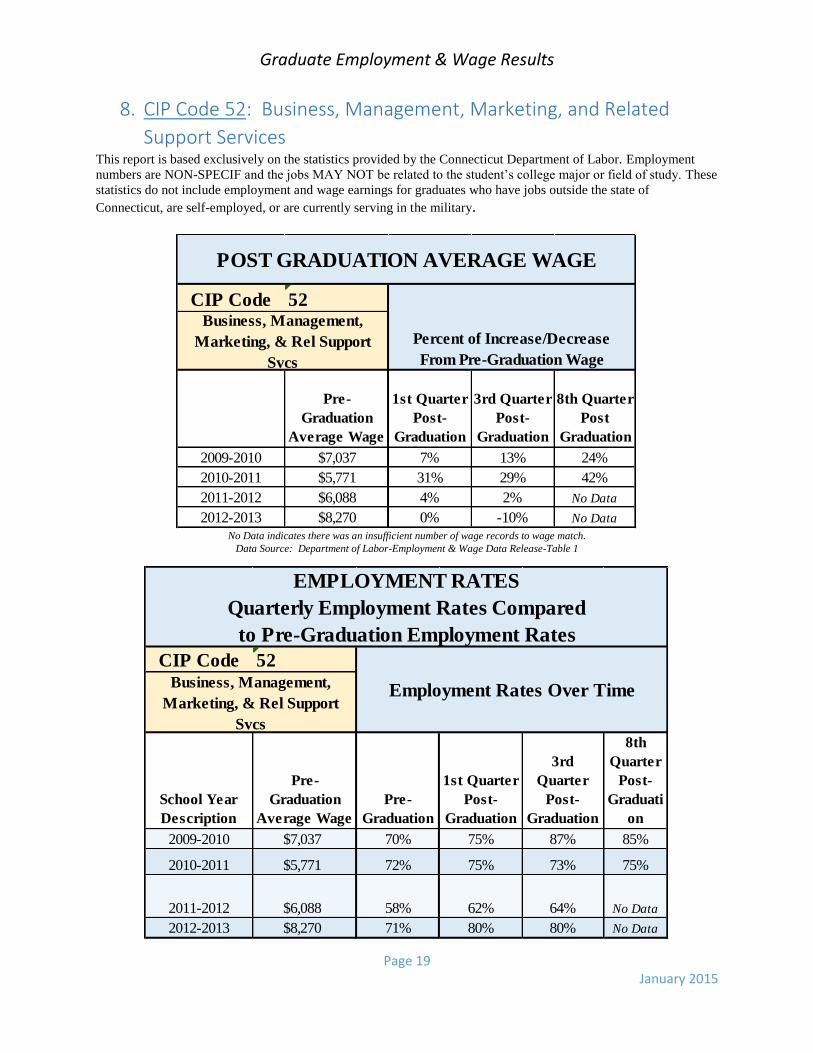
8. CIP Code 52: Business, Management, Marketing, and Related
Support Services This report is based exclusively on the statistics provided by the Connecticut Department of Labor. Employment
numbers are NON-SPECIF and the jobs MAY NOT be related to the student’s college major or field of study. These
statistics do not include employment and wage earnings for graduates who have jobs outside the state of
Connecticut, are self-employed, or are currently serving in the military.
No Data indicates there was an insufficient number of wage records to wage match.
Data Source: Department of Labor-Employment & Wage Data Release-Table 1
CIP Code 52
Pre-
Graduation
Average Wage
1st Quarter
Post-
Graduation
3rd Quarter
Post-
Graduation
8th Quarter
Post
Graduation
2009-2010 $7,037 7% 13% 24%
2010-2011 $5,771 31% 29% 42%
2011-2012 $6,088 4% 2% No Data
2012-2013 $8,270 0% -10% No Data
POST GRADUATION AVERAGE WAGE
Percent of Increase/Decrease
From Pre-Graduation Wage
Business, Management,
Marketing, & Rel Support
Svcs
CIP Code 52
School Year
Description
Pre-
Graduation
Average Wage
Pre-
Graduation
1st Quarter
Post-
Graduation
3rd
Quarter
Post-
Graduation
8th
Quarter
Post-
Graduati
on
2009-2010 $7,037 70% 75% 87% 85%
2010-2011 $5,771 72% 75% 73% 75%
2011-2012 $6,088 58% 62% 64% No Data
2012-2013 $8,270 71% 80% 80% No Data
EMPLOYMENT RATES
Quarterly Employment Rates Compared
to Pre-Graduation Employment Rates
Employment Rates Over TimeBusiness, Management,
Marketing, & Rel Support
Svcs
Graduate Employment & Wage Results
Page 20 January 2015
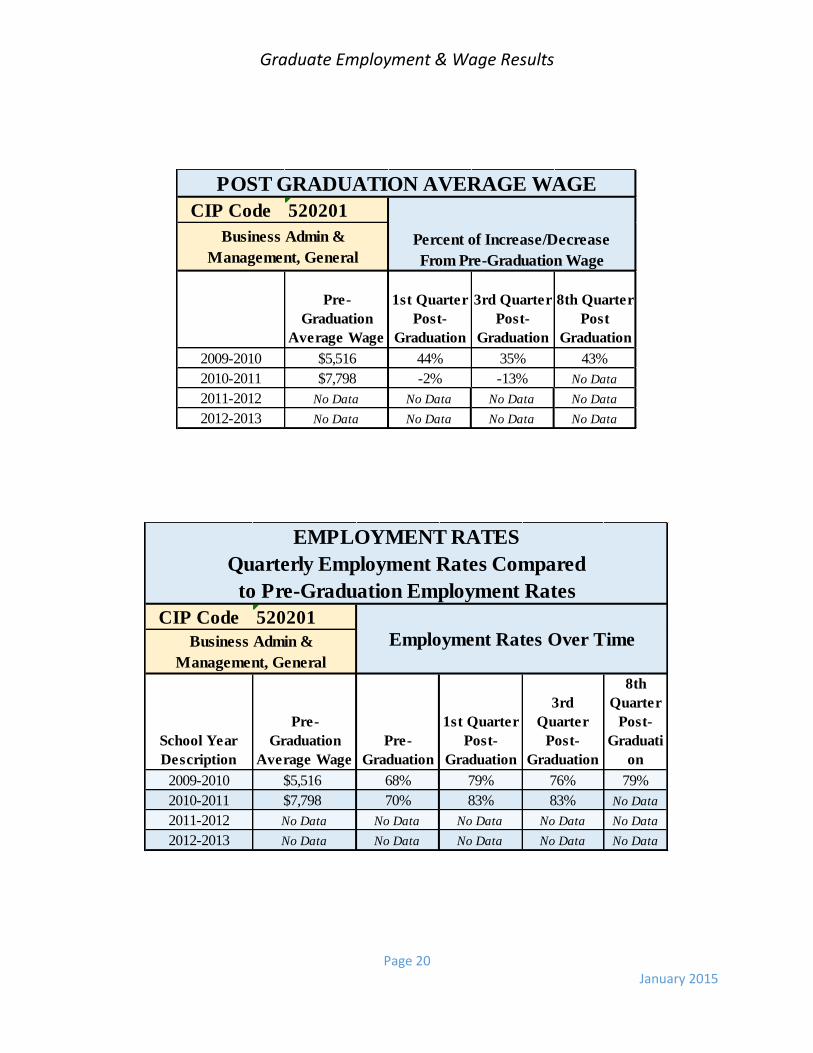
CIP Code 520201
Pre-
Graduation
Average Wage
1st Quarter
Post-
Graduation
3rd Quarter
Post-
Graduation
8th Quarter
Post
Graduation
2009-2010 $5,516 44% 35% 43%
2010-2011 $7,798 -2% -13% No Data
2011-2012 No Data No Data No Data No Data
2012-2013 No Data No Data No Data No Data
POST GRADUATION AVERAGE WAGE
Percent of Increase/Decrease
From Pre-Graduation Wage
Business Admin &
Management, General
CIP Code 520201
School Year
Description
Pre-
Graduation
Average Wage
Pre-
Graduation
1st Quarter
Post-
Graduation
3rd
Quarter
Post-
Graduation
8th
Quarter
Post-
Graduati
on
2009-2010 $5,516 68% 79% 76% 79%
2010-2011 $7,798 70% 83% 83% No Data
2011-2012 No Data No Data No Data No Data No Data
2012-2013 No Data No Data No Data No Data No Data
EMPLOYMENT RATES
Quarterly Employment Rates Compared
to Pre-Graduation Employment Rates
Employment Rates Over TimeBusiness Admin &
Management, General
Graduate Employment & Wage Results
Page 21 January 2015
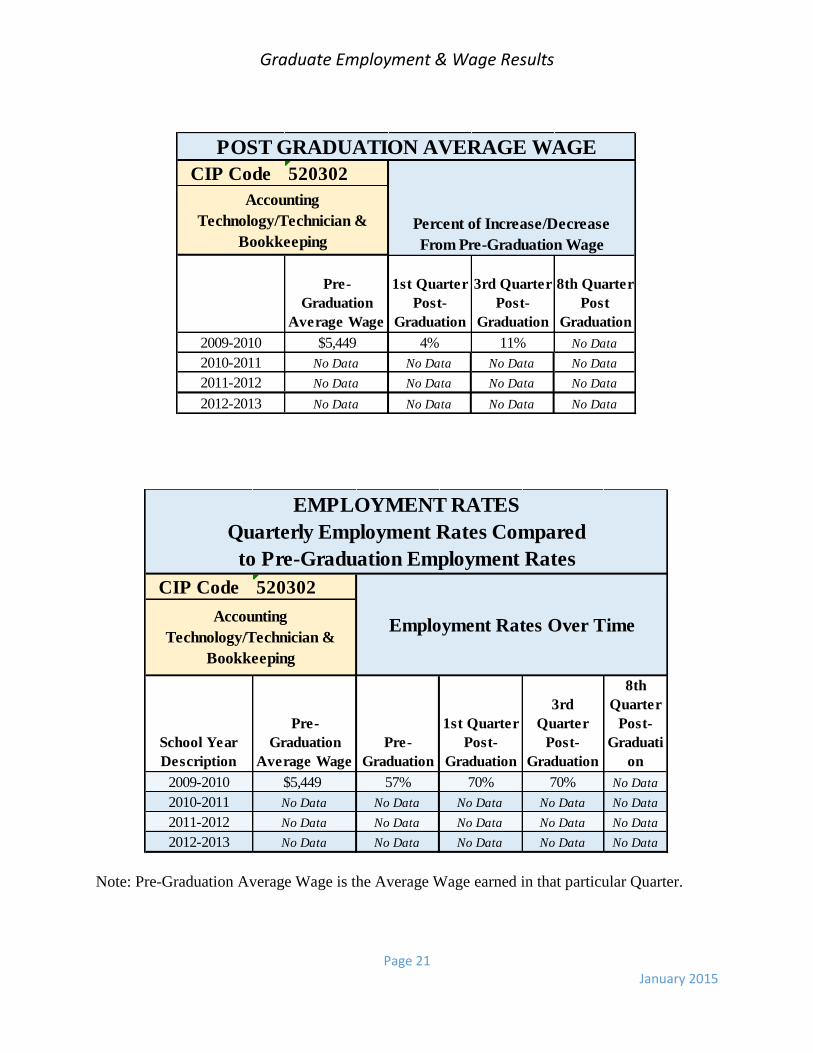
Note: Pre-Graduation Average Wage is the Average Wage earned in that particular Quarter.
CIP Code 520302
Pre-
Graduation
Average Wage
1st Quarter
Post-
Graduation
3rd Quarter
Post-
Graduation
8th Quarter
Post
Graduation
2009-2010 $5,449 4% 11% No Data
2010-2011 No Data No Data No Data No Data
2011-2012 No Data No Data No Data No Data
2012-2013 No Data No Data No Data No Data
POST GRADUATION AVERAGE WAGE
Percent of Increase/Decrease
From Pre-Graduation Wage
Accounting
Technology/Technician &
Bookkeeping
CIP Code 520302
School Year
Description
Pre-
Graduation
Average Wage
Pre-
Graduation
1st Quarter
Post-
Graduation
3rd
Quarter
Post-
Graduation
8th
Quarter
Post-
Graduati
on
2009-2010 $5,449 57% 70% 70% No Data
2010-2011 No Data No Data No Data No Data No Data
2011-2012 No Data No Data No Data No Data No Data
2012-2013 No Data No Data No Data No Data No Data
EMPLOYMENT RATES
Quarterly Employment Rates Compared
to Pre-Graduation Employment Rates
Employment Rates Over TimeAccounting
Technology/Technician &
Bookkeeping
Related Documents