In this issue: Focusing on Guidelines for Laboratory Medicine and Biomarkers Grading evidence for laboratory test studies beyond diagnosc accuracy: applicaon to prognosc tesng Andrew C. Don-Wauchope, Pasqualina L. Santaguida Grading evidence for laboratory test studies beyond diagnosc accuracy: applicaon to prognosc tesng Andrew C. Don-Wauchope, Pasqualina L. Santaguida Grading evidence for laboratory test studies beyond diagnostic accuracy: application to prognostic testing Andrew C. Don-Wauchope 1,2 , Pasqualina L. Santaguida 3 1 Department of Pathology and Molecular Medicine, McMaster University, Hamilton, Ontario, Canada 2 Hamilton Regional Laboratory Medicine Program, Hamilton, Ontario, Canada 3 Department of Clinical Epidemiology and Biostascs, McMaster University, Hamilton, Ontario, Canada ARTICLE INFO ABSTRACT Background: Evidence-based guideline development requires transparent methodology for gathering, syn- thesizing and grading the quality and strength of evi- dence behind recommendaons. The Grading of Rec- ommendaons Assessment, Development and Evalu- aon (GRADE) project has addressed diagnosc test use in many of their publicaons. Most of the work has been directed at diagnosc tests and no consen- sus has been reached for prognosc biomarkers. Aim of this paper: The GRADE system for rang the quality of evidence and the strength of a recom- mendaon is described. The applicaon of GRADE to diagnosc tesng is discussed and a descripon of applicaon to prognosc tesng is detailed. Some strengths and limitaons of the GRADE process in relaon to clinical laboratory tesng are presented. Conclusions: The GRADE system is applicable to clini- cal laboratory tesng and if correctly applied should improve the reporng of recommendaons for clini- cal laboratory tests by standardising the style of rec- ommendaon and by encouraging transparent re- porng of the actual guideline process. Corresponding author: Andrew C. Don-Wauchope Core Laboratory Juravinski Hospital and Cancer Centre 711 Concession Street Hamilton, L8V 1C3 Ontario, Canada Phone: +1 905 521 2100 x76306 Fax: +1 905 381 7066 E-mail: [email protected] Andrew C. Don-Wauchope, Pasqualina L. Santaguida Page 168 eJIFCC2015Vol26No3pp168-182

Welcome message from author
This document is posted to help you gain knowledge. Please leave a comment to let me know what you think about it! Share it to your friends and learn new things together.
Transcript

In this issue: Focusing on Guidelines for Laboratory Medicine and Biomarkers
Grading evidence for laboratory test studies beyond diagnostic accuracy: application to prognostic testingAndrew C. Don-Wauchope, Pasqualina L. Santaguida
Grading evidence for laboratory test studies beyond diagnostic accuracy: application to prognostic testingAndrew C. Don-Wauchope, Pasqualina L. Santaguida
Grading evidence for laboratory test studies beyond diagnostic accuracy: application to prognostic testingAndrew C. Don-Wauchope1,2, Pasqualina L. Santaguida3
1 Department of Pathology and Molecular Medicine, McMaster University, Hamilton, Ontario, Canada 2 Hamilton Regional Laboratory Medicine Program, Hamilton, Ontario, Canada 3 Department of Clinical Epidemiology and Biostatistics, McMaster University, Hamilton, Ontario, Canada
A R T I C L E I N F O A B S T R A C T
Background: Evidence-based guideline development requires transparent methodology for gathering, syn-thesizing and grading the quality and strength of evi-dence behind recommendations. The Grading of Rec-ommendations Assessment, Development and Evalu-ation (GRADE) project has addressed diagnostic test use in many of their publications. Most of the work has been directed at diagnostic tests and no consen-sus has been reached for prognostic biomarkers.
Aim of this paper: The GRADE system for rating the quality of evidence and the strength of a recom-mendation is described. The application of GRADE to diagnostic testing is discussed and a description of application to prognostic testing is detailed. Some strengths and limitations of the GRADE process in relation to clinical laboratory testing are presented.
Conclusions: The GRADE system is applicable to clini-cal laboratory testing and if correctly applied should improve the reporting of recommendations for clini-cal laboratory tests by standardising the style of rec-ommendation and by encouraging transparent re-porting of the actual guideline process.
Corresponding author:Andrew C. Don-Wauchope Core Laboratory Juravinski Hospital and Cancer Centre 711 Concession StreetHamilton, L8V 1C3Ontario, Canada Phone: +1 905 521 2100 x76306 Fax: +1 905 381 7066 E-mail: [email protected]
Andrew C. Don-Wauchope, Pasqualina L. Santaguida
Page 168eJIFCC2015Vol26No3pp168-182

Andrew C. Don-Wauchope, Pasqualina L. SantaguidaGrading evidence for laboratory test studies beyond diagnostic accuracy: application to prognostic testing
INTRODUCTION
The Grading of Recommendations Assessment, Development and Evaluation (GRADE) proj-ect was initiated to standardise the grading of guideline recommendations (1). The GRADE system addresses both the quality of evidence as well as the level of recommendation (2). Numerous systems exist for grading the evi-dence and recommendations, generated by a range of organisations representing profes-sional societies and national/provincial/inter-national bodies amongst others (3). The GRADE
project has published two sets of papers with the most recent series still appearing in the literature (4). These provide a combination of general guidance and examples of specific ap-plication to a range of areas in medicine. This article will briefly describe the GRADE approach to evaluating the quality of evidence for diag-nostic testing with a focus on laboratory tests. Figure 1 gives an overview of how this fits into the overall GRADE process that includes a number of other factors in the formation of a recommendation classified as strong or weak. Subsequently, we will describe how this can be
Figure 1 The GRADE domains – the basis for the evaluation of quality of evidence
This information is obtained as part of a systematic review that allows for full evaluation of the evidence for each individual paper and then a collation of this into an overall summary of the quality of evidence. The guideline developers then need to consider the quality of evidence in context of a number of other important factors to judge a final recommendation.
Page 169eJIFCC2015Vol26No3pp168-182

Andrew C. Don-Wauchope, Pasqualina L. SantaguidaGrading evidence for laboratory test studies beyond diagnostic accuracy: application to prognostic testing
applied to prognostic testing using our previ-ous work on natriuretic peptides as the exam-ple. Finally, the strengths and limitations of the GRADE approach will be considered in the con-text of laboratory medicine.
OVERVIEW OF THE GRADE SYSTEM OF RATING THE QUALITY OF THE EVIDENCE
The GRADE system uses four major domains to evaluate the quality of the evidence for a re-search question (Figure 1). Typically research questions would be expected to follow the Population-Intervention-Comparator-Outcome (PICO) format (5). There are four major do-mains and several minor domains that can be considered as modifiers of the final quality of evidence (6).
The first major domain investigates the risk of bias or limitations of primary papers that are considered for answering the specific PICO re-search question behind the guideline recom-mendations (7). This is based on evaluation of the study design (i.e. cohort or randomized tri-als), the application of the study design (identi-fication of any threats to internal validity), the reporting and analysis of the results and the conclusions presented. There are a range of validated tools available to assist researchers and guideline teams to evaluate the risk of bias in the primary papers. Systematic reviewers should include their GRADE assessment and the supporting data in the results of the systematic review.
The second major domain investigates the in-consistency of the evidence (8). This domain considers all the primary papers related to each outcome (defined in the PICO) and evaluates the direction of the effect for consistency. The presence of inconsistency in the direction or magnitude of the effect (i.e. specificity) would result in a downward grading of the evidence
for the outcome. It is evaluated by considering the range of point estimates, the confidence interval around each point estimate and the statistical testing for heterogeneity. When sev-eral outcomes are considered, inconsistency is evaluated separately for each outcome.
The third major domain investigates the indi-rectness of evidence in relation to outcomes (9). This domain considers the plausible or proved link between the factor (e.g. the diagnostic in-tervention) being considered and the outcome being evaluated. This requires consideration of the potential differences in population, type of intervention, outcome measures and the com-parisons made. The overall indirectness needs to be judged based on the PICO and if pres-ent would downgrade the quality of evidence. Similar to inconsistency, each outcome is evalu-ated for indirectness.
The fourth major domain is about the impreci-sion of the evidence (10). Ideally, this domain evaluates outcomes for which a summary pooled estimate is calculated in a meta-analysis to provide a measure of overall effect across dif-ferent studies. The width of the 95% CI in this context would give an estimate of the impreci-sion of the summarised data. If an intervention is being compared to a control then the 95% CI of the individual point estimates for each included study would be precise if there was no overlap, and imprecise if there was overlap. When the study effects cannot be meta-analyzed a num-ber of factors (such as sample size) are consid-ered across the literature being evaluated and graded for imprecision.
There are several minor domains that can also be considered when grading evidence and rec-ommendations. One minor domain is publica-tion bias (11). This domain is generally evalu-ated using statistical techniques to assess the probability of publication bias. There must be sufficient number of studies included so that
Page 170eJIFCC2015Vol26No3pp168-182

Andrew C. Don-Wauchope, Pasqualina L. SantaguidaGrading evidence for laboratory test studies beyond diagnostic accuracy: application to prognostic testing
the statistical test has validity. In the case where there are too few studies, one may likely assume that publication bias is likely present. Other as-pects to consider when assessing publication bias are small numbers of studies with small populations and predominate funding from in-dustry sponsors whose role within the study is not specified. Other minor domains include any evidence for dose response, the magnitude of the effect size and plausible residual confound-ing (12).
Using the GRADE approach, the quality of evidence is reported as one of 4 levels: High (++++); Moderate (+++o); Low (++oo); or Very Low (oooo) (13). The use of symbols to convey the strength of evidence is becoming more ap-parent in clinical practice guidelines and assists readers in quickly assessing the quality upon which the recommendations are based. The definitions of these categories have been well described for therapeutic interventions (13) and we have suggested some additional de-scriptions applicable to diagnostic accuracy and prognostic studies. Table 1 (on the next page) is an adaptation of the practical interpretation of the quality of the evidence when considering intervention (13), diagnostic accuracy (14), and prognostic studies (15).
GRADE FOR DIAGNOSTIC TESTING USING LABORATORY TESTS
Diagnostic testing was considered a separate category when the GRADE project published the first set of articles describing the process for evaluating quality of the evidence and recom-mendations (16). This was received with some scepticism from the laboratory community but has been successfully applied in some situations with a number of limitations. The challenge to diagnostic testing is often in the nature of the study design providing data to support the PICO question. The Oxford Centre for Evidence-Based
Medicine (CEBM) has articulated this well in their table for levels of evidence in diagnostic accuracy testing (17). Within this hierarchy, the highest order (i.e. most rigorous and valid) of study are cohort and case-control studies and thus quite different from therapeutic interven-tions where randomised controlled trials are considered the highest order of study design. This is noted in the GRADE description for diag-nostic test strategies, where exception is made for diagnostic accuracy studies that would in-clude cross-sectional or cohort designs as an acceptable study type with no downgrading based on for the domain of study limitations. However, the evidence is quickly down-ranked when considering the indirectness and impre-cision often associated with these study de-sign types. As more experience with the use of GRADE was gained, the approach to evaluating diagnostic accuracy studies was further devel-oped (18, 19).
The same general principles and categories ap-ply and it remains essential to set the question well with consideration of the PICO elements. There is some evidence to suggest that many clinical questions posed in diagnostic test stud-ies do not distinguish between the population being tested and the problem (disease) of inter-est (20).
The PICO format for interventions typically combines the problem with population while for diagnosis it may be important to separately define these two components. For diagnostic accuracy studies the outcomes are typically the classification of the results into the proportion of true positive, true negative, false positive and false negative (21). This assumes that the patient-relevant clinical outcome is the correct diagnosis, and this encourages focus on diag-nostic accuracy data. However, there is debate about what is considered the most appropriate clinical outcome of testing and that more em-phasis should be placed on the role of testing
Page 171eJIFCC2015Vol26No3pp168-182

Andrew C. Don-Wauchope, Pasqualina L. SantaguidaGrading evidence for laboratory test studies beyond diagnostic accuracy: application to prognostic testing
in clinical pathways, and that the purpose of the test (diagnosis, monitoring, screening, prognosis, risk stratification and guiding therapy) and the clinical effectiveness of testing should be consid-ered in the wider context of health care and the
role for diagnostic testing (22). If the clinically im-portant outcome includes appropriate manage-ment and improvement in patient health, then there is great difficulty in linking the diagnos-tic test to the health outcome directly and the
Table 1 Interpretation of the quality of evidence for GRADE
Quality Interventions (13)Diagnostic test for
diagnostic accuracy (14)Prognostic use of
diagnostic test (15)
High Quality
We are confident that the true effect lies close to the estimate of the effect
We are confident that the diagnostic accuracy estimates are accurate.
We are confident that the test makes an important contribution to the determination of outcome (predictive strength).
Moderate Quality
We are moderately confident in the effect estimate. The true effect is likely to be close to the estimate of the effect, but there is a possibility that it is substantially different.
We are moderately confident in the estimates of accuracy. The true accuracy estimate is likely to be close to the observed accuracy, but there is a possibility that it is substantially different.
We are moderately confident that the test makes an important contribution to the determination of the outcome. The estimate of the observed predictive strength is likely close to the true effect, but there is a possibility that it is substantially different.
Low Quality
Our confidence in the effect estimate is limited: the true effect may be substantially different from the estimate of the effect
Our confidence in the accuracy estimate is limited; the true accuracy may be substantially different from the accuracy observed.
Our confidence in the predictive strength is limited; the true predictive strength may be substantially different from the estimate of predictive strength observed.
Very Low Quality
We have very little confidence in the effect estimate: The true effect is likely to be substantially different from the estimate of effect.
We have very little confidence in the accuracy. The true accuracy is likely to be substantially different from the observed accuracy.
We have very little confidence in the predictive estimate of the test. The true predictive strength is likely to be substantially different from the estimate of predictive strength.
Page 172eJIFCC2015Vol26No3pp168-182

Andrew C. Don-Wauchope, Pasqualina L. SantaguidaGrading evidence for laboratory test studies beyond diagnostic accuracy: application to prognostic testing
assessment of imprecision requires that multi-ple other factors are considered (22, 23). There are a number of outcome options that could be considered for diagnostic testing and the most appropriate of these should be defined as part of the PICO (22, 24).
Thus far most of the published literature has focused on diagnostic accuracy studies. The STARD document has helped improve the re-porting of diagnostic accuracy studies (25). The comparator could be a “gold” standard test but this may not be available and other options are mentioned in the STARD document. This con-cept has been explored further by the Agency for Health Care Research and Quality (AHRQ) in their methods guide for medical test reviews (26). Other parts of the extended PICO question definition may include the timing and setting for the question (i.e. PICOTS) (27). Timing is one aspect that is often considered critical for diag-nostic testing as the time between the test being investigated and the comparator test is essen-tial. Timing plays an important role, particularly if the investigators are not blinded to the index and reference test results are not masked. It is also important if the two tests are carried out at different time points in the disease process. For index tests and reference tests, that require samples or procedures other than blood (for example tissue or diagnostic imaging), then the two tests must be conducted in a time frame in which change in the disease process would not impact the interpretation of the test result. For laboratory testing based on blood samples the ideal situation is collection of all samples at the same point in time. The setting often helps defines the population more clearly. When the prevalence of the diagnosis is changed because of the setting (e.g. primary care versus special-ist clinic), it becomes an important component as consideration of prevalence will impact the diagnostic accuracy data. This can be illustrat-ed by two of the questions asked in the AHRQ
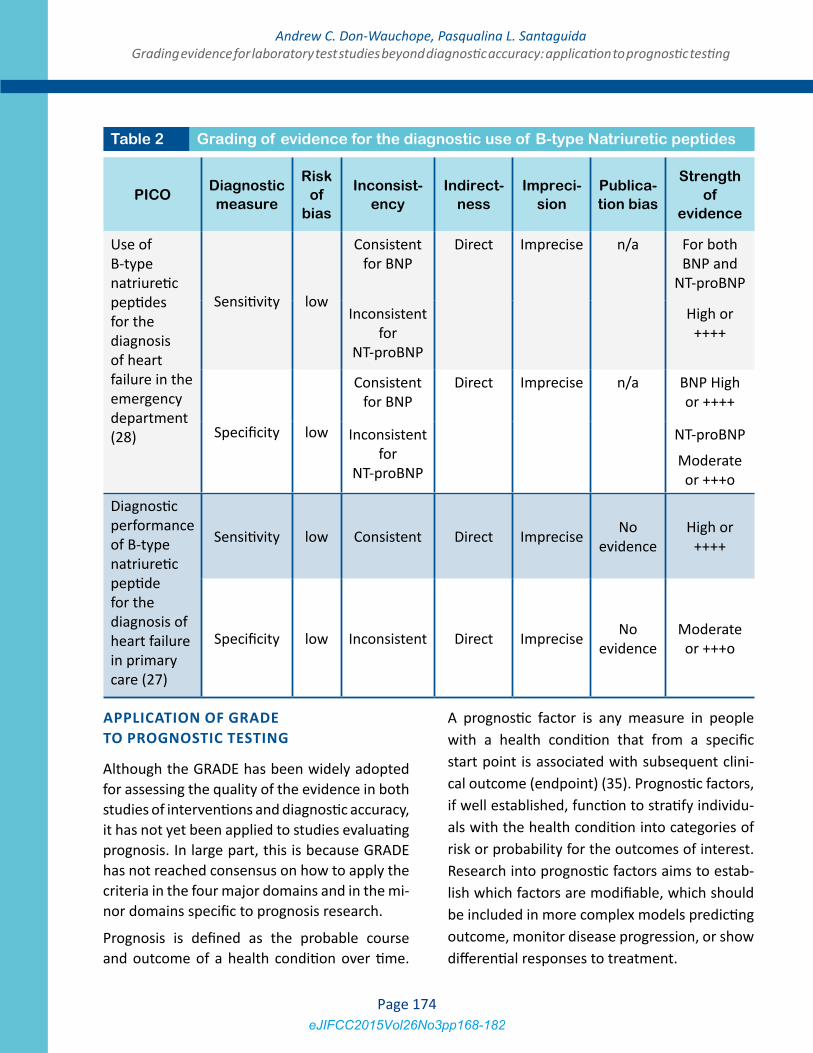
comparative effectiveness review on the use of Natriuretic peptides in Heart Failure (28, 29). Two diagnostic settings were considered and this allowed for the primary papers to be grouped correctly and evaluated in the appro-priate context (Table 2).
Assessing risk of bias for diagnostic accuracy studies is discussed extensively in the GRADE papers as this is seen as particularly challenging (18, 30). The AHRQ Methods Guide describes the challenges of assessing risk of bias in more detail (31). Validated tools such as the QUADAS II(32) tool or its predecessor the QUADAS(33) can be helpful to carefully consider a range of important factors that impact on the evalua-tion of risk of bias. For any new systematic re-views or clinical practice guidelines the use of QUADAS II would be recommended as it has im-proved from the earlier version. QUADAS II fo-cuses on 4 aspects of risk of bias (patient selec-tion, conduct or interpretation of the index test, conduct or interpretation of the reference test, flow and timing of the tests) and four aspects of applicability (whether the study is applicable to the population and settings of interest). In the AHRQ Methods Guide, the domain of indi-rectness, which is the link between diagnostic accuracy and clinical outcome, and the domain of imprecision were identified as challenging to assess (34).
This section provides an overview of the theo-retical framework to identify ways in which the domains of risk of bias/study limitations, incon-sistency, indirectness, imprecision and publica-tion bias can be considered for evaluating the evidence for diagnostic tests. This has been successfully applied to diagnostic applications of laboratory tests and Table 2 provides an ex-ample of how GRADE was applied in the recent AHRQ systematic review for Natriuretic pep-tides in the diagnosis of heart failure (28, 29).
Page 173eJIFCC2015Vol26No3pp168-182
Andrew C. Don-Wauchope, Pasqualina L. SantaguidaGrading evidence for laboratory test studies beyond diagnostic accuracy: application to prognostic testing
APPLICATION OF GRADE TO PROGNOSTIC TESTING
Although the GRADE has been widely adopted for assessing the quality of the evidence in both studies of interventions and diagnostic accuracy, it has not yet been applied to studies evaluating prognosis. In large part, this is because GRADE has not reached consensus on how to apply the criteria in the four major domains and in the mi-nor domains specific to prognosis research.
Prognosis is defined as the probable course and outcome of a health condition over time.
A prognostic factor is any measure in people with a health condition that from a specific start point is associated with subsequent clini-cal outcome (endpoint) (35). Prognostic factors, if well established, function to stratify individu-als with the health condition into categories of risk or probability for the outcomes of interest. Research into prognostic factors aims to estab-lish which factors are modifiable, which should be included in more complex models predicting outcome, monitor disease progression, or show differential responses to treatment.
PICODiagnostic measure
Risk of
bias
Inconsist-ency
Indirect-ness
Impreci-sion
Publica-tion bias
Strength of
evidence
Use of B-type natriuretic peptides for the diagnosis of heart failure in the emergency department (28)
Sensitivity low
Consistent for BNP
Direct Imprecise n/a For both BNP and
NT-proBNP
Inconsistent for
NT-proBNP
High or ++++
Specificity low
Consistent for BNP
Direct Imprecise n/a BNP High or ++++
Inconsistent for
NT-proBNP
NT-proBNP
Moderate or +++o
Diagnostic performance of B-type natriuretic peptide for the diagnosis of heart failure in primary care (27)
Sensitivity low Consistent Direct Imprecise No evidence
High or ++++
Specificity low Inconsistent Direct Imprecise No evidence
Moderate or +++o
Table 2 Grading of evidence for the diagnostic use of B-type Natriuretic peptides
Page 174eJIFCC2015Vol26No3pp168-182

Andrew C. Don-Wauchope, Pasqualina L. SantaguidaGrading evidence for laboratory test studies beyond diagnostic accuracy: application to prognostic testing
We had the opportunity to explore the applica-tion of the GRADE approach in a systematic re-view in which 3 prognostic questions were ad-dressed (36). In the diagnostic examples (Table 2), we considered the use of natriuretic peptides with respect to diagnosing heart failure. In ad-dition, our systematic review considered natri-uretic peptides as potential markers predicting mortality and morbidity in both acutely ill and chronic heart failure patients(37-40). as well as in the general population (41). Our review showed that both BNP and NT-proBNP gener-ally functioned as an independent predictor of subsequent mortality and morbidity at different time frames.
Huguet et al.(2013) have recently proposed some guidance for adapting GRADE for prog-nostic studies based on their work in identifying factors associated with chronic pain (15). The main differences from GRADE applied to inter-vention studies, occur with respect to study lim-itations and to factors that may increase overall quality. With regards to study limitations, there is consideration of the phases of prognostic re-search. This differs from evaluating evidence from intervention and diagnostic accuracy stud-ies, where the type of specific design (e.g. RCT or cohort study) is given specific weighting. In the context of prognostic studies, there is no consensus on the taxonomy for phases of prog-nosis research (Table 3). The simplest approach considers three phases of prognostic research. At the lowest level of prediction (PHASE 1), prognosis studies are designed to identify po-tential associations of the factors of interest and are termed “exploration” (42) or ”predic-tor finding”(43) or “developmental studies” (44) PHASE 2 explanatory studies typically es-tablish or confirm independent association be-tween prognostic factors and outcomes, and are also labelled as “validation” studies (44). The highest level of evidence is from PHASE 3 studies where the prognosis study attempts to
evaluate the underlying processes that link the prognostic factor with the outcome. High qual-ity evidence is likely found in PHASE 3 studies (15); conversely, moderate to very low quality evidence is based on PHASE 1 and 2 studies.
In prognostic research, setting the clinical ques-tion is still the most important aspect as patient important outcomes need to be addressed in the appropriate context. Using the PICOTS format is central to this process to adequately define the population, the intervention, the timing and the setting. The comparator and the outcome are also critical but often challenging to define. The comparator test could be a wide range of items when it comes to delineating probable course and outcome. In our examples we included a full range of reported comparators in the form of any type of diagnosis of heart failure.
This could prove to be challenging if one form of confirmation is clearly better than another or if the different confirmatory tests include different sub-populations. For the heart failure populations we did not attempt to divide these out, apart from the division between acute de-compensated and chronic stable heart failure. However, we could have tried to use different diagnostic criteria such as echocardiography findings to delineate severity and diastolic from systolic dysfunction.
As discussed in the diagnostic accuracy section the range of clinically relevant outcomes can be quite diverse. For prognostic outcomes the use of clinical pathways and clinically effectiveness should be considered in additional to the more traditional mortality and morbidity outcomes. The length of time from the test to the evalua-tion of the outcome status may be an important consideration as this may change with differing lengths of time. Bearing all these concepts in mind is important when defining the outcome as the applicability of the findings will be de-pendent on patient important outcomes.
Page 175eJIFCC2015Vol26No3pp168-182

Andrew C. Don-Wauchope, Pasqualina L. SantaguidaGrading evidence for laboratory test studies beyond diagnostic accuracy: application to prognostic testing
Risk of bias for the prognostic studies in the na-triuretic peptide systematic review was evalu-ated using the underlying principles of the Quality in Prognosis Studies (QUIPS) tool (45). The elements of the QUIPS tool had been pre-viously published and we adapted these very slightly for the prognostic questions in our study (46). This considers 6 domains that may impact bias of a prognostic study: participation; attrition; prognostic factor measurement; con-founding measurement and control; outcome measurement; and analysis and reporting (45). The type of study design for prognostic evalua-tion is largely cohort studies and these are pri-marily prospective in nature. However, in many reports the original study was a prospective or randomised controlled trial and the analysis
of the prognostic factor was done as an after-thought and hence the study design should be classified as retrospective cohort. There are randomised controlled trials that could be con-sidered as true evaluations of prognostic testing but these are rare.
One additional advantage of using the QUIPS is that there is a thorough assessment of the po-tential for confounding bias. When applying the GRADE to intervention studies, where the pres-ence of plausible confounding in cohort studies can be expected to reduce the effect size ob-served, the study limitations can be upgraded. However, this assumption may not be applicable to prognostic studies which are predominately observational in design; residual confounding can effect predictions in either direction (over or
Framework of an explanatory approach to studying
prognosis (42)
Consecutive phases of multivariable prognostic
research (44)
Types of multivariable prediction research (43)
PHASE 1: Identifying associations
Predictor Finding Studies
PHASE 2: Testing independent associations
Developmental Studies (new prognostic model is designed)
Model Development studies without external validation
PHASE 3: Understanding Prognostic Pathways
Validation Studies (External replication of the model)
Model Development studies with external validation
External validation with or without model updating
Impact Studies
(prognostic models are technologies which require ssessment of their impact on health outcomes)
Model Impact Studies
Table 3 Frameworks for sequential development of prediction models that assess the contribution of potential prognostic factors
Page 176eJIFCC2015Vol26No3pp168-182

Andrew C. Don-Wauchope, Pasqualina L. SantaguidaGrading evidence for laboratory test studies beyond diagnostic accuracy: application to prognostic testing
under estimation of the predictive strength) or have no effect at all (15). Our systematic review for natriuretic peptides and heart failure showed that most studies had many plausible confound-ers (biases) that were not accounted for in the adjusted analysis (i.e. residual confounders) (38, 40). The methods used in our comparative effec-tiveness review attempted to establish a mini-mum of three critical confounders; age, renal function, BMI (or other measure of height and weight) considered in the study design or in the analysis. As an example to evaluate confound-ing from renal function we considered mul-tiple terms to identify the tests and conditions (Table 4). Our findings showed consistent prob-lems with studies measuring these three plau-sible confounders, not considering several other
potential confounders. However, it was not clear which if any of these affected our estimates of prediction or the direction of impact. The do-main of confounder measurement and control is essential in prognostic studies because the link between the prognostic test and the out-come is most often not direct and thus consid-eration of all other known factors that influence the outcome need to be taken into account. This evaluation of primary papers allowed us to judge the overall bias for the papers included for each sub-question that we addressed as well as obtain some insight into the other relevant do-mains of GRADE. Huguet et al (2013) have also made use of the QUIPS tool in their experience with chronic pain systematic reviews (15).
Terms used for renal function Test used for renal function
renal failure urea or BUNacute renal failure blood (serum or plasma) creatinine
ARF creatinine clearanceprimary acute renal failure urine creatinine
chronic renal failureCRF
acute interstitial nephritisacute tubular necrosis
azotemiadialysis
glomerulonephritishemodialysis
obstructive renal failurerenal insufficiency
kidneysacute kidney failure
diabetes
Table 4 Example of the range of terms used to identify renal dysfunction in the prognostic evaluation of natriuretic peptides
Page 177eJIFCC2015Vol26No3pp168-182

Andrew C. Don-Wauchope, Pasqualina L. SantaguidaGrading evidence for laboratory test studies beyond diagnostic accuracy: application to prognostic testing
Inconsistency can be estimated from the sum-mary tables with the point estimates and 95% CI from odds ratio (OR), hazards ratio (HR) and relative risk (RR). This follows the description from the GRADE group and application of this category does not differ from tests of interven-tion or diagnostic tests (8).
The proposed adaptation of the GRADE to prognostic studies for indirectness asks rat-ers to consider this domain in the context of the population, the prognostic factor, and the outcome. The less generalizable the results for each of these contexts, the higher the likeli-hood of down-rating this category increases. Indirectness is typically present when one con-siders prognostic use of a test as there is very seldom a direct link between the test and the outcome of interest. There are typically numer-ous steps in the process and many of these are completely independent of the test being eval-uated. If the factors described by the GRADE group (population; intervention, outcome and comparator) are well described in the PICOTS then it may be possible to find a group of pri-mary studies that match all factors in the same way. If such a group of studies could be found then indirectness may not be present. In the natriuretic peptide systematic review primary studies differed in outcome and comparators that clearly made the evidence-to-outcomes link indirect (38, 40).
Imprecision has some interesting difference be-tween application in guidelines and systematic reviews (10). For systematic reviews the goal is estimating the effect size while for guidelines the goal is to support a recommendation. Thus in a systematic review the precision will be in-terpreted on the width of the 95% CI while in guidelines it would be interpreted on the ability to separate from the comparator. When pos-sible the pooled effect size and confidence limit would be the ideal tool to evaluate impreci-sion. Consideration should also be given to the
sample size of studies (10). However meta-anal-ysis is not always available as the appropriate application of meta-analysis requires that the studies being included match the PICOTS close-ly. When meta-analysis is not possible the range of effect size and the spread of 95% CI need to be considered.
Publication bias will follow the same principles described in the GRADE papers (11). Although the issue has been noted in recent literature, in the context of prognostic studies (47), there is currently no registry of studies, or studies re-lated to laboratory testing. Thus it is difficult to make informed judgements about the likeli-hood of publication bias.
Careful consideration and description of all the GRADE domains need to be made by the guide-line developers or systematic reviewers. This should be documented and written up as an ap-pendix to allow users of the guideline to con-sider the details used by the guideline writers and to allow methodologists the opportunity to further develop the concepts around evaluation of diagnostic tests.
STRENGTHS AND LIMITATIONS OF GRADE FOR LABORATORY TESTS
The major strengths when using the GRADE approach for the evaluation of the strength of evidence and recommendations is the explicit-ness and reproducibility of the process (48). An advantage is the requirement to define a useful and appropriate clinical question that includes the necessary components of PICOTS. The GRADE system takes into account key domains to assess quality and strength of evidence. The process of GRADE allows for transparency when users of the guideline review the evidence be-hind the recommendations (49).
Limitations can be grouped in a number of ar-eas. Firstly guideline writers often do not fully understand the GRADE system. Methodological
Page 178eJIFCC2015Vol26No3pp168-182
Andrew C. Don-Wauchope, Pasqualina L. SantaguidaGrading evidence for laboratory test studies beyond diagnostic accuracy: application to prognostic testing
experts are most often aware of the system but many of them invited to participate in the guideline team will not have had sufficient ex-posure to GRADE or training to incorporate the GRADE assessment of the strength of evidence strength or to the process for making recom-mendations. The GRADE system has been avail-able for a number of years but as it continues to develop it can be difficult for non-methodol-ogists to keep pace with the changes. The ap-plication of GRADE requires judgment of the evidence in the domains as well as judgement of the factors that help form the recommenda-tion. This judgment is often construed as ex-pert opinion and this has formed the core of clinical practice guidelines in many instances. The GRADE process is designed to move away from expert opinion alone to one that includes an evidence-formed judgement. If the team is well versed in the GRADE literature and suit-ably trained then the judgement aspect will be a strength; however, it could be a limitation if the team is not able to sufficiently consider the evidence and be unduly influenced by their own expert opinion.
The second group of limitations relates to the challenges guideline teams face in meet-ing the explicit criteria required for develop-ing structured clinical questions and for the evaluation of the evidence as described in the GRADE process. Although the domains of GRADE and how to apply these are well de-fined, the heterogeneity of evidence presents practical challenges to guideline development teams. For example, defining the appropriate type of study design for the highest rank of evidence can be challenging. As noted pre-viously, the designs that are considered to have greater rigour (i.e. higher form of evi-dence) will depend on the actual purpose of the study. For diagnostic testing and prognos-tic testing these will be different and these nuances require careful reflection from the
guideline developers. Initially the researchers may consider using the currently published models (for example CEBM tables and Table 3) and use these if seen as appropriate (17, 42-44). If an alternative system is used it should be justified in the method description. The as-pects of PICOTS require careful consideration to make the question applicable to the target audience. This is reasonably straightforward for diagnostic testing (19). but definitions may be more challenging in prognostic questions as the distinction between population and disease become even more important. Often more than a single outcome should be consid-ered in order to capture the complexity of the contribution of diagnostic testing in relation to patient important outcomes. There are practi-cal challenges when judgements are based on patient-relevant versus a test accuracy per-spective (19). Similarly, there are some chal-lenges to adequately judge imprecision as sta-tistical approaches are somewhat limited for assessing heterogeneity in diagnostic tests. The complexity and diversity of clinical care pathways may complicate the assessment of indirectness. Here the factors that may im-pact the clinical care pathway need to be ac-counted for when the directness or indirect-ness of the evidence is rated. The choice of outcome measures will further influence the considered judgement process of the GRADE approach.
CONCLUSIONS
The GRADE system can be used to rate the evi-dence for diagnostic and prognostic use of lab-oratory testing. There are numerous challeng-es and the results may not always be seen as consistent between different guideline groups. However, the GRADE evidence rating system allows users of the guideline to compare and contrast guidelines covering the same or similar content. The transparency of the approach also
Page 179eJIFCC2015Vol26No3pp168-182

Andrew C. Don-Wauchope, Pasqualina L. SantaguidaGrading evidence for laboratory test studies beyond diagnostic accuracy: application to prognostic testing
allows better-informed adaptation and imple-mentation of guideline recommendations to lo-cal practice.
REFERENCES
1. Guyatt GH, Oxman AD, Vist GE, Kunz R, Falck-Ytter Y, Alonso-Coello P, et al. Grade: An emerging consensus on rating quality of evidence and strength of recommenda-tions. BMJ. 2008;336:924-6.
2. Andrews J, Guyatt G, Oxman AD, Alderson P, Dahm P, Falck-Ytter Y, et al. Grade guidelines: 14. Going from evi-dence to recommendations: The significance and presen-tation of recommendations. Journal of clinical epidemiol-ogy. 2013;66:719-25.
3. Atkins D, Eccles M, Flottorp S, Guyatt GH, Henry D, Hill S, et al. Systems for grading the quality of evidence and the strength of recommendations i: Critical appraisal of existing approaches the grade working group. BMC health services research. 2004;4:38.
4. List of grade working group publications and grants. GRADE Working Group. http://www.gradeworkinggroup.org/publications/index.htm (accessed 20 February 2015)
5. Guyatt GH, Oxman AD, Kunz R, Atkins D, Brozek J, Vist G, et al. Grade guidelines: 2. Framing the question and deciding on important outcomes. Journal of clinical epi-demiology. 2011;64:395-400.
6. Guyatt G, Oxman AD, Akl EA, Kunz R, Vist G, Brozek J, et al. Grade guidelines: 1. Introduction-grade evidence pro-files and summary of findings tables. Journal of clinical epidemiology. 2011;64:383-94.
7. Guyatt GH, Oxman AD, Vist G, Kunz R, Brozek J, Alonso-Coello P, et al. Grade guidelines: 4. Rating the quality of evidence--study limitations (risk of bias). Journal of clini-cal epidemiology. 2011;64:407-15.
8. Guyatt GH, Oxman AD, Kunz R, Woodcock J, Brozek J, Helfand M, et al. Grade guidelines: 7. Rating the quality of evidence--inconsistency. Journal of clinical epidemiology. 2011;64:1294-302.
9. Guyatt GH, Oxman AD, Kunz R, Woodcock J, Brozek J, Helfand M, et al. Grade guidelines: 8. Rating the quality of evidence--indirectness. Journal of clinical epidemiology. 2011;64:1303-10.
10. Guyatt GH, Oxman AD, Kunz R, Brozek J, Alonso-Coel-lo P, Rind D, et al. Grade guidelines 6. Rating the quality of evidence-imprecision. Journal of clinical epidemiology. 2011;64:1283-93.
11. Guyatt GH, Oxman AD, Montori V, Vist G, Kunz R, Brozek J, et al. Grade guidelines: 5. Rating the quality of ev-
idence-publication bias. Journal of clinical epidemiology. 2011;64:1277-82.
12. Guyatt GH, Oxman AD, Sultan S, Glasziou P, Akl EA, Alonso-Coello P, et al. Grade guidelines: 9. Rating up the quality of evidence. Journal of clinical epidemiology. 2011;64:1311-6.
13. Balshem H, Helfand M, Schünemann HJ, Oxman AD, Kunz R, Brozek J, et al. Grade guidelines: 3. Rating the quality of evidence. Journal of clinical epidemiology. 2011;64:401-6.
14. Brozek JL, Akl EA, Alonso-Coello P, Lang D, Jaeschke R, Williams JW, et al. Grading quality of evidence and strength of recommendations in clinical practice guide-lines. Part 1 of 3. An overview of the grade approach and grading quality of evidence about interventions. Allergy. 2009;64:669-77.
15. Huguet A, Hayden JA, Stinson J, McGrath PJ, Cham-bers CT, Tougas ME, et al. Judging the quality of evidence in reviews of prognostic factor research: Adapting the grade framework. Systematic Reviews. 2013;2:1-.
16. Schünemann HJ, Schünemann AHJ, Oxman AD, Brozek J, Glasziou P, Jaeschke R, et al. Grading quality of evidence and strength of recommendations for diagnostic tests and strategies. BMJ. 2008;336:1106-10.
17. Howick J, Chalmers I, Glasziou P, Greenhalgh T, Heneghan C, Liberati A, et al. The oxford levels of evi-dence 2. Oxford Centre for Evidence-Based Medicine. http://www.cebm.net/index.aspx?o=5653 (accessed 20 February 2015
18. Brozek JL, Akl EA, Compalati E, Kreis J, Terracciano L, Fiocchi A, et al. Grading quality of evidence and strength of recommendations in clinical practice guidelines part 3 of 3. The grade approach to developing recommenda-tions. Allergy. 2011;66:588-95.
19. Gopalakrishna G, Mustafa RA, Davenport C, Scholten RJPM, Hyde C, Brozek J, et al. Applying grading of recom-mendations assessment, development and evaluation (grade) to diagnostic tests was challenging but doable. Journal of clinical epidemiology. 2014;67:760-8.
20. Huang X, Lin J, Demner-Fushman D. Evaluation of pico as a knowledge representation for clinical questions. AMIA Annual Symposium proceedings / AMIA Sympo-sium AMIA Symposium. 2006:359-63.
21. Tatsioni A, Zarin DA, Aronson N, Samson DJ, Flamm CR, Schmid C, et al. Challenges in systematic reviews of diagnostic technologies. Annals of internal medicine. 2005;142:1048-55.
22. Horvath AR, Lord SJ, Stjohn A, Sandberg S, Cobbaert CM, Lorenz S, et al. From biomarkers to medical tests: The changing landscape of test evaluation. Clinica chi-
Page 180eJIFCC2015Vol26No3pp168-182

Andrew C. Don-Wauchope, Pasqualina L. SantaguidaGrading evidence for laboratory test studies beyond diagnostic accuracy: application to prognostic testing
mica acta; international journal of clinical chemistry. 2014;427:49-57.
23. Siebert U. When should decision-analytic modeling be used in the economic evaluation of health care? The European Journal of Health Economics. 2003;4:143-50.
24. Matchar DB. Chapter 1: Introduction to the methods guide for medical test reviews. Journal of General Inter-nal Medicine. 2012;27:4-10.
25. Bossuyt PM, Reitsma JB, Bruns DE, Gatsonis CA, Glasziou PP, Irwig LM, et al. The stard statement for re-porting studies of diagnostic accuracy: Explanation and elaboration. Clinical Chemistry. 2003;49:7-18.
26. Trikalinos TA and Balion CM. Chapter 9: Options for summarizing medical test performance in the absence of a “gold standard”. Journal of General Internal Medicine. 2012;27:S67-75.
27. Samson D, Schoelles KM. Chapter 2: Medical tests guidance (2) developing the topic and structuring sys-tematic reviews of medical tests: Utility of picots, analytic frameworks, decision trees, and other frameworks. Jour-nal of General Internal Medicine. 2012;27 Suppl 1:S11-9.
28. Booth RA, Hill SA, Don-Wauchope A, Santaguida PL, Oremus M, McKelvie R, et al. Performance of bnp and nt-probnp for diagnosis of heart failure in primary care patients: A systematic review. Heart failure reviews. 2014;19:439-51.
29. Hill SA, Booth RA, Santaguida PL, Don-Wauchope A, Brown JA, Oremus M, et al. Use of bnp and nt-probnp for the diagnosis of heart failure in the emergency depart-ment: A systematic review of the evidence. Heart failure reviews. 2014;19:421-38.
30. Schünemann HJ, Oxman AD, Brozek J, Glasziou P, Bossuyt P, Chang S, et al. Grade: Assessing the quality of evidence for diagnostic recommendations. Evidence-based medicine. 2008;13:162-3.
31. Santaguida PL, Riley CM, Matchar DB. Chapter 5: As-sessing risk of bias as a domain of quality in medical test studies. Journal of General Internal Medicine. 2012;27 Suppl 1:S33-8.
32. Whiting PF, Rutjes AWS, Westwood ME, Mallett S, Deeks JJ, Reitsma JB, et al. Quadas-2: A revised tool for the quality assessment of diagnostic accuracy studies. Annals of internal medicine. 2011;155:529-36.
33. Whiting P, Rutjes AWS, Reitsma JB, Bossuyt PMM, Klei-jnen J. The development of quadas: A tool for the quality assessment of studies of diagnostic accuracy included in systematic reviews. BMC medical research methodology. 2003;3:25.
34. Singh S, Chang SM, Matchar DB, Bass EB. Chapter 7: Grading a body of evidence on diagnostic tests. Journal of General Internal Medicine. 2012;27 Suppl 1:S47-55.
35. Riley RD, Hayden JA, Steyerberg EW, Moons KGM, Abrams K, Kyzas PA, et al. Prognosis research strategy (progress) 2: Prognostic factor research. PLoS medicine. 2013;10:e1001380.
36. Oremus M, McKelvie R, Don-Wauchope A, Santaguida PL, Ali U, Balion C, et al. A systematic review of bnp and nt-probnp in the management of heart failure: Overview and methods. Heart failure reviews. 2014;19:413-9.
37. Don-Wauchope AC, Santaguida PL, Oremus M, McKel-vie R, Ali U, Brown JA, et al. Incremental predictive value of natriuretic peptides for prognosis in the chronic stable heart failure population: A systematic review. Heart fail-ure reviews. 2014;19:521-40.
38. Oremus M, Don-Wauchope A, McKelvie R, Santaguida PL, Hill S, Balion C, et al. Bnp and nt-probnp as prognos-tic markers in persons with chronic stable heart failure. Heart failure reviews. 2014;19:471-505.
39. Santaguida PL, Don-Wauchope AC, Ali U, Oremus M, Brown JA, Bustamam A, et al. Incremental value of na-triuretic peptide measurement in acute decompensated heart failure: A systematic review. Heart failure reviews. 2014;19:507-19.
40. Santaguida PL, Don-Wauchope AC, Oremus M, McK-elvie R, Ali U, Hill SA, et al. Bnp and nt-probnp as prog-nostic markers in persons with acute decompensated heart failure: A systematic review. Heart failure reviews. 2014;19:453-70.
41. Don-Wauchope AC, Santaguida PL, McKelvie R, Brown JA, Oremus M, Ali U, et al. Prediction of clinical outcomes using b-type natriuretic peptides in the general population: A systematic review. Heart failure reviews. 2014;19:541-51.
42. Hayden JA, Côté P, Steenstra IA, Bombardier C, et al. Identifying phases of investigation helps planning, ap-praising, and applying the results of explanatory prognosis studies. Journal of clinical epidemiology. 2008;61:552-60.
43. Bouwmeester W, Zuithoff NPA, Mallett S, Geerlings MI, Vergouwe Y, Steyerberg EW, et al. Reporting and methods in clinical prediction research: A systematic re-view. PLoS medicine. 2012;9:e1001221.
44. Moons KGM, Royston P, Vergouwe Y, Grobbee DE, Alt-man DG. Prognosis and prognostic research: What, why, and how? BMJ (Clinical research ed). 2009;338:b375-b.
45. Hayden JA, van der Windt DA, Cartwright JL, Côté P, Bombardier C. Assessing bias in studies of prognostic fac-tors. Annals of internal medicine. 2013;158:280-6.
Page 181eJIFCC2015Vol26No3pp168-182

Andrew C. Don-Wauchope, Pasqualina L. SantaguidaGrading evidence for laboratory test studies beyond diagnostic accuracy: application to prognostic testing
46. Hayden JA, Côté P, Bombardier C. Evaluation of the quality of prognosis studies in systematic reviews. Annals of internal medicine. 2006;144:427-37.
47. Peat G, Riley RD, Croft P, Morley KI, Kyzas PA, Moons KGM, et al. Improving the transparency of prognosis re-search: The role of reporting, data sharing, registration, and protocols. PLoS medicine. 2014;11:e1001671.
48. Mustafa RA, Santesso N, Brozek J, Akl EA, Walter SD, Norman G, et al. The grade approach is reproducible
in assessing the quality of evidence of quantitative evidence syntheses. Journal of clinical epidemiology. 2013;66:736-42.
49. Hsu J, Brożek JL, Terracciano L, Kreis J, Compalati E, Stein AT, et al. Application of grade: Making evidence-based recommendations about diagnostic tests in clinical practice guidelines. Implementation science. 2011;6:62.
Page 182eJIFCC2015Vol26No3pp168-182
Related Documents