Grade 6 Math SOL Expanded Test Blueprint Summary Table Blue Hyperlinks link to Understanding the Standards and Essential Knowledge, Skills, and Processes Reporting Category Grade 6 Standards of Learning Number of Items Number and Number Sense 6.1 The student will describe and compare data, using ratios, and will use appropriate notations, such as a b , a to b, and a:b. 6.2 The student will a) investigate and describe fractions, decimals, and percents as ratios; b) identify a given fraction, decimal, or percent from a representation; c) demonstrate equivalent relationships among fractions, decimals, and percents; and d) compare and order fractions, decimals, and percents. 6.3 The student will a) identify and represent integers; b) order and compare integers; and c) identify and describe absolute value of integers. 6.4 The student will demonstrate multiple representations of multiplication and division of fractions. 6.5 The student will investigate and describe concepts of positive exponents and perfect squares. 9 Computation and Estimation 6.6 The student will a) multiply and divide fractions and mixed numbers; and b) estimate solutions and then solve single-step and multistep practical problems involving addition, subtraction, multiplication, and division of fractions. 6.7 The student will solve single-step and multistep practical problems involving addition, subtraction, multiplication, and division of decimals. 6.8 The student will evaluate whole number numerical expressions, using the order of operations. 8 Measurement and Geometry 6.9 The student will make ballpark comparisons between measurements in the U.S. Customary System of measurement and measurements in the metric 11

Welcome message from author
This document is posted to help you gain knowledge. Please leave a comment to let me know what you think about it! Share it to your friends and learn new things together.
Transcript

Grade 6 Math SOL Expanded Test Blueprint Summary Table
Blue Hyperlinks link to Understanding the Standards and Essential Knowledge, Skills, and Processes
Reporting Category Grade 6 Standards of Learning Number of Items
Number and Number Sense 6.1 The student will describe and compare data, using ratios, and will use
appropriate notations, such as a
b , a to b, and a:b.
6.2 The student will
a) investigate and describe fractions, decimals, and percents as ratios;
b) identify a given fraction, decimal, or percent from a representation;
c) demonstrate equivalent relationships among fractions, decimals, and
percents; and
d) compare and order fractions, decimals, and percents.
6.3 The student will
a) identify and represent integers;
b) order and compare integers; and
c) identify and describe absolute value of integers.
6.4 The student will demonstrate multiple representations of multiplication and
division of fractions.
6.5 The student will investigate and describe concepts of positive exponents and
perfect squares.
9
Computation and Estimation
6.6 The student will
a) multiply and divide fractions and mixed numbers; and
b) estimate solutions and then solve single-step and multistep practical
problems involving addition, subtraction, multiplication, and division of
fractions.
6.7 The student will solve single-step and multistep practical problems involving
addition, subtraction, multiplication, and division of decimals.
6.8 The student will evaluate whole number numerical expressions, using the
order of operations.
8
Measurement and Geometry
6.9 The student will make ballpark comparisons between measurements in the
U.S. Customary System of measurement and measurements in the metric
11

system.
6.10 The student will
a) define π (pi) as the ratio of the circumference of a circle to its diameter;
b) solve practical problems involving circumference and area of a circle,
given the diameter or radius;
c) solve practical problems involving area and perimeter; and
d) describe and determine the volume and surface area of a rectangular prism.
6.11 The student will
a) identify the coordinates of a point in a coordinate plane; and
b) graph ordered pairs in a coordinate plane.
6.12 The student will determine congruence of segments, angles, and polygons.
6.13 The student will describe and identify properties of quadrilaterals.
Probability, Statistics, Patterns, Functions, and Algebra
6.14 The student, given a problem situation, will
a) construct circle graphs;
b) draw conclusions and make predictions, using circle graphs; and
c) compare and contrast graphs that present information from the same data
set.
6.15 The student will
a) describe mean as balance point; and
b) decide which measure of center is appropriate for a given purpose.
6.16 The student will
a) compare and contrast dependent and independent events; and
b) determine probabilities for dependent and independent events.
6.17 The student will identify and extend geometric and arithmetic sequences.
6.18 The student will solve one-step linear equations in one variable involving
whole number coefficients and positive rational solutions.
6.19 The student will investigate and recognize
a) the identity properties for addition and multiplication;
b) the multiplicative property of zero; and
c) the inverse property for multiplication.
6.20 The student will graph inequalities on a number line.
17
Excluded from Test None
Number of Operational 45
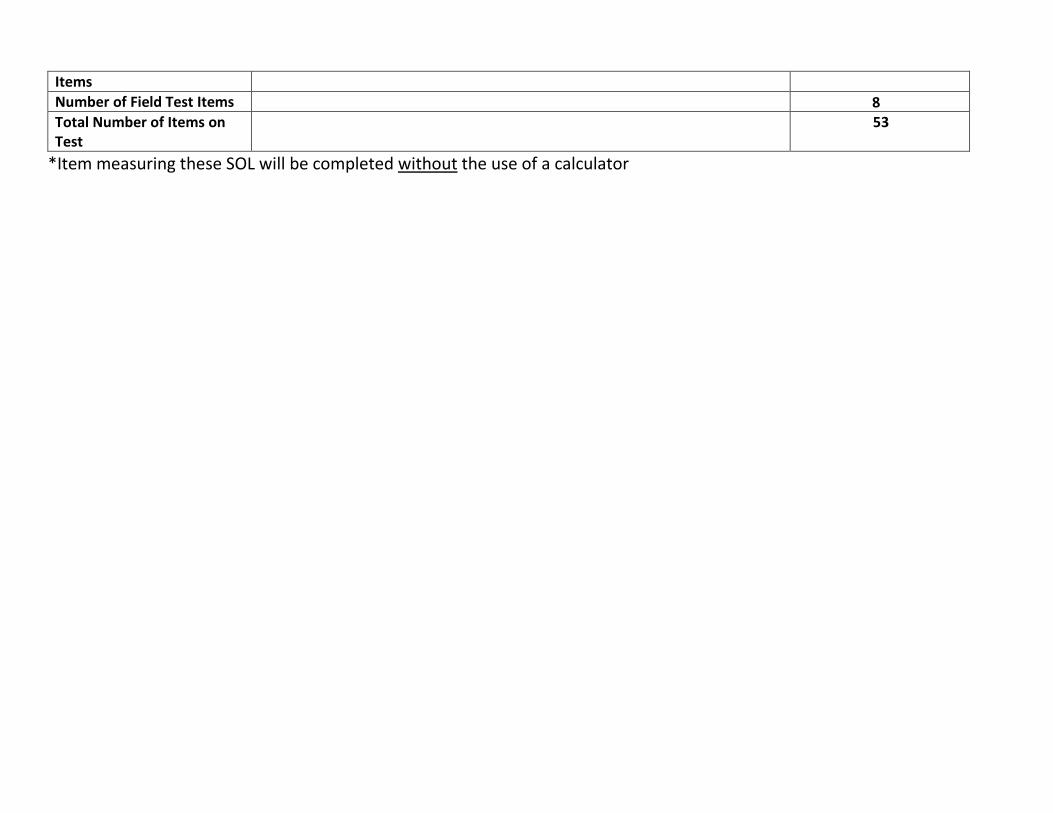
Items
Number of Field Test Items 8 Total Number of Items on Test
53
*Item measuring these SOL will be completed without the use of a calculator

STANDARD 6.1 STRAND: NUMBER AND NUMBER SENSE GRADE LEVEL 6
6.1 The student will describe and compare data, using ratios, and will use appropriate notations, such as a
b , a to b, and a:b.
UNDERSTANDING THE STANDARD (Background Information for Instructor Use Only) ESSENTIAL UNDERSTANDINGS ESSENTIAL KNOWLEDGE AND SKILLS
A ratio is a comparison of any two quantities. A
ratio is used to represent relationships within and
between sets.
A ratio can compare part of a set to the entire set
(part-whole comparison).
A ratio can compare part of a set to another part
of the same set (part-part comparison).
A ratio can compare part of a set to a
corresponding part of another set (part-part
comparison).
A ratio can compare all of a set to all of another
set (whole-whole comparison).
The order of the quantities in a ratio is directly
related to the order of the quantities expressed in
the relationship. For example, if asked for the
ratio of the number of cats to dogs in a park, the
ratio must be expressed as the number of cats to
the number of dogs, in that order.
A ratio is a multiplicative comparison of two
numbers, measures, or quantities.
All fractions are ratios and vice versa.
Ratios may or may not be written in simplest
form.
Ratios can compare two parts of a whole.
Rates can be expressed as ratios.
What is a ratio?A ratio is a comparison of any two quantities. A ratio is
used to represent relationships within a set and
between two sets. A ratio can be written using
fraction form
( 23 ), a colon (2:3), or the word to (2 to 3).
The student will use problem solving, mathematical
communication, mathematical reasoning, connections,
and representations to
Describe a relationship within a set by comparing
part of the set to the entire set.
Describe a relationship between two sets by
comparing part of one set to a corresponding part of
the other set.
Describe a relationship between two sets by
comparing all of one set to all of the other set.
Describe a relationship within a set by comparing
one part of the set to another part of the same set.
Represent a relationship in words that makes a
comparison by using the notations a
b, a:b, and a
to b.
Create a relationship in words for a given ratio
expressed symbolically.

STANDARD 6.1 STRAND: NUMBER AND NUMBER SENSE GRADE LEVEL 6
6.1 The student will describe and compare data, using ratios, and will use appropriate notations, such as a
b , a to b, and a:b.
UNDERSTANDING THE STANDARD (Background Information for Instructor Use Only) ESSENTIAL UNDERSTANDINGS ESSENTIAL KNOWLEDGE AND SKILLS
STANDARD 6.2 STRAND: NUMBER AND NUMBER SENSE GRADE LEVEL 6
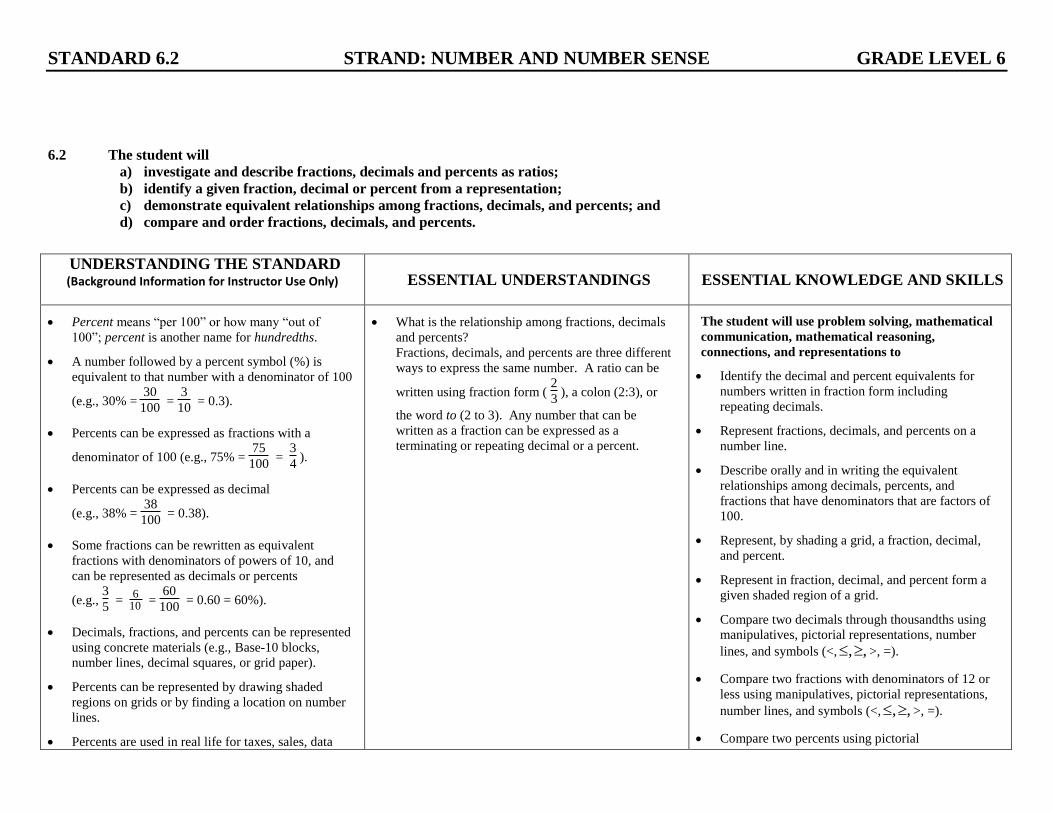
6.2 The student will
a) investigate and describe fractions, decimals and percents as ratios;
b) identify a given fraction, decimal or percent from a representation;
c) demonstrate equivalent relationships among fractions, decimals, and percents; and
d) compare and order fractions, decimals, and percents.
UNDERSTANDING THE STANDARD (Background Information for Instructor Use Only) ESSENTIAL UNDERSTANDINGS ESSENTIAL KNOWLEDGE AND SKILLS
Percent means “per 100” or how many “out of
100”; percent is another name for hundredths.
A number followed by a percent symbol (%) is
equivalent to that number with a denominator of 100
(e.g., 30% = 30
100 =
3
10 = 0.3).
Percents can be expressed as fractions with a
denominator of 100 (e.g., 75% = 75
100 =
3
4 ).
Percents can be expressed as decimal
(e.g., 38% = 38
100 = 0.38).
Some fractions can be rewritten as equivalent
fractions with denominators of powers of 10, and
can be represented as decimals or percents
(e.g., 3
5 =
610
= 60
100 = 0.60 = 60%).
Decimals, fractions, and percents can be represented
using concrete materials (e.g., Base-10 blocks,
number lines, decimal squares, or grid paper).
Percents can be represented by drawing shaded
regions on grids or by finding a location on number
lines.
Percents are used in real life for taxes, sales, data
What is the relationship among fractions, decimals
and percents?
Fractions, decimals, and percents are three different
ways to express the same number. A ratio can be
written using fraction form ( 2
3 ), a colon (2:3), or
the word to (2 to 3). Any number that can be
written as a fraction can be expressed as a
terminating or repeating decimal or a percent.
The student will use problem solving, mathematical
communication, mathematical reasoning,
connections, and representations to
Identify the decimal and percent equivalents for
numbers written in fraction form including
repeating decimals.
Represent fractions, decimals, and percents on a
number line.
Describe orally and in writing the equivalent
relationships among decimals, percents, and
fractions that have denominators that are factors of
100.
Represent, by shading a grid, a fraction, decimal,
and percent.
Represent in fraction, decimal, and percent form a
given shaded region of a grid.
Compare two decimals through thousandths using
manipulatives, pictorial representations, number
lines, and symbols (<, ,, >, =).
Compare two fractions with denominators of 12 or
less using manipulatives, pictorial representations,
number lines, and symbols (<, ,, >, =).
Compare two percents using pictorial

STANDARD 6.2 STRAND: NUMBER AND NUMBER SENSE GRADE LEVEL 6
6.2 The student will
a) investigate and describe fractions, decimals and percents as ratios;
b) identify a given fraction, decimal or percent from a representation;
c) demonstrate equivalent relationships among fractions, decimals, and percents; and
d) compare and order fractions, decimals, and percents.
UNDERSTANDING THE STANDARD (Background Information for Instructor Use Only) ESSENTIAL UNDERSTANDINGS ESSENTIAL KNOWLEDGE AND SKILLS
description, and data comparison.
Fractions, decimals and percents are equivalent
forms representing a given number.
The decimal point is a symbol that separates the
whole number part from the fractional part of a
number.
The decimal point separates the whole number
amount from the part of a number that is less than
one.
The symbol can be used in Grade 6 in place of
“x” to indicate multiplication.
Strategies using 0, 1
2 and 1 as benchmarks can be
used to compare fractions.
When comparing two fractions, use 1
2 as a
benchmark. Example: Which is greater, 4
7 or
3
9?
4
7 is greater than
1
2 because 4, the numerator,
represents more than half of 7, the denominator.
The denominator tells the number of parts that
make the whole. 3
9 is less than
1
2 because 3, the
representations and symbols (<, ,, >, =).
Order no more than 3 fractions, decimals, and
percents (decimals through thousandths, fractions
with denominators of 12 or less), in ascending or
descending order.
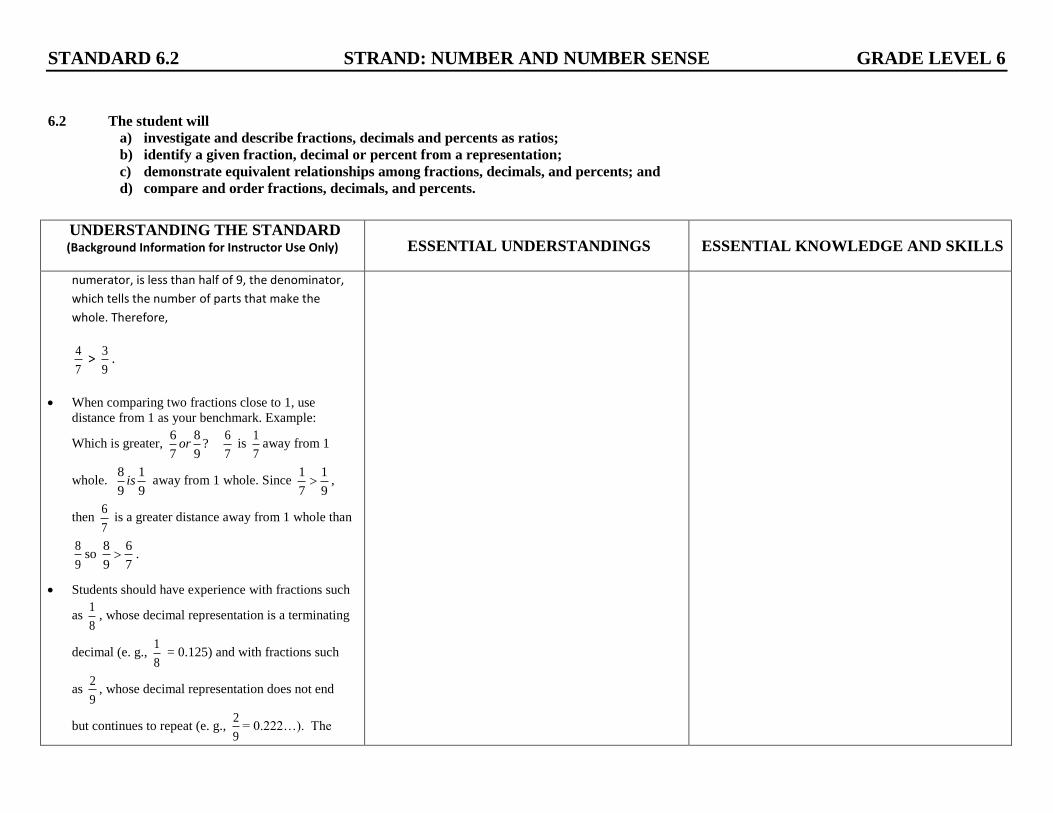
STANDARD 6.2 STRAND: NUMBER AND NUMBER SENSE GRADE LEVEL 6
6.2 The student will
a) investigate and describe fractions, decimals and percents as ratios;
b) identify a given fraction, decimal or percent from a representation;
c) demonstrate equivalent relationships among fractions, decimals, and percents; and
d) compare and order fractions, decimals, and percents.
UNDERSTANDING THE STANDARD (Background Information for Instructor Use Only) ESSENTIAL UNDERSTANDINGS ESSENTIAL KNOWLEDGE AND SKILLS
numerator, is less than half of 9, the denominator,
which tells the number of parts that make the
whole. Therefore,
4
7 >
3
9.
When comparing two fractions close to 1, use
distance from 1 as your benchmark. Example:
Which is greater, 6 8
?7 9
or 6
7 is
1
7away from 1
whole. 8 1
9 9is away from 1 whole. Since
1 1
7 9 ,
then 6
7 is a greater distance away from 1 whole than
8
9so
8 6
9 7 .
Students should have experience with fractions such
as 1
8, whose decimal representation is a terminating
decimal (e. g., 1
8 = 0.125) and with fractions such
as 2
9, whose decimal representation does not end
but continues to repeat (e. g., 2
9= 0.222…). The

STANDARD 6.2 STRAND: NUMBER AND NUMBER SENSE GRADE LEVEL 6
6.2 The student will
a) investigate and describe fractions, decimals and percents as ratios;
b) identify a given fraction, decimal or percent from a representation;
c) demonstrate equivalent relationships among fractions, decimals, and percents; and
d) compare and order fractions, decimals, and percents.
UNDERSTANDING THE STANDARD (Background Information for Instructor Use Only) ESSENTIAL UNDERSTANDINGS ESSENTIAL KNOWLEDGE AND SKILLS
repeating decimal can be written with ellipses (three
dots) as in 0.222… or denoted with a bar above the
digits that repeat as in 0.2 .

STANDARD 6.3 STRAND: NUMBER AND NUMBER SENSE GRADE LEVEL 6
6.3 The student will
a) identify and represent integers;
b) order and compare integers; and
c) identify and describe absolute value of integers.
UNDERSTANDING THE STANDARD (Background Information for Instructor Use Only) ESSENTIAL UNDERSTANDINGS ESSENTIAL KNOWLEDGE AND SKILLS
Integers are the set of whole numbers, their
opposites, and zero.
Positive integers are greater than zero.
Negative integers are less than zero.
Zero is an integer that is neither positive nor
negative.
A negative integer is always less than a positive
integer.
When comparing two negative integers, the negative
integer that is closer to zero is greater.
An integer and its opposite are the same distance
from zero on a number line. For example, the
opposite of 3 is -3.
The absolute value of a number is the distance of a
number from zero on the number line regardless of
direction. Absolute value is represented as 6 = 6.
On a conventional number line, a smaller number is
always located to the left of a larger number (e.g.,
–7 lies to the left of –3, thus –7 < –3; 5 lies to the
left of 8 thus 5 is less than 8).
What role do negative integers play in practical situations? Some examples of the use of negative integers are
found in temperature (below 0), finance (owing
money), below sea level. There are many other
examples.
How does the absolute value of an integer compare
to the absolute value of its opposite?
They are the same because an integer and its
opposite are the same distance from zero on a
number line.
The student will use problem solving, mathematical
communication, mathematical reasoning,
connections, and representations to
Identify an integer represented by a point on a
number line.
Represent integers on a number line.
Order and compare integers using a number line.
Compare integers, using mathematical symbols
(<, >, =).
Identify and describe the absolute value of an
integer.

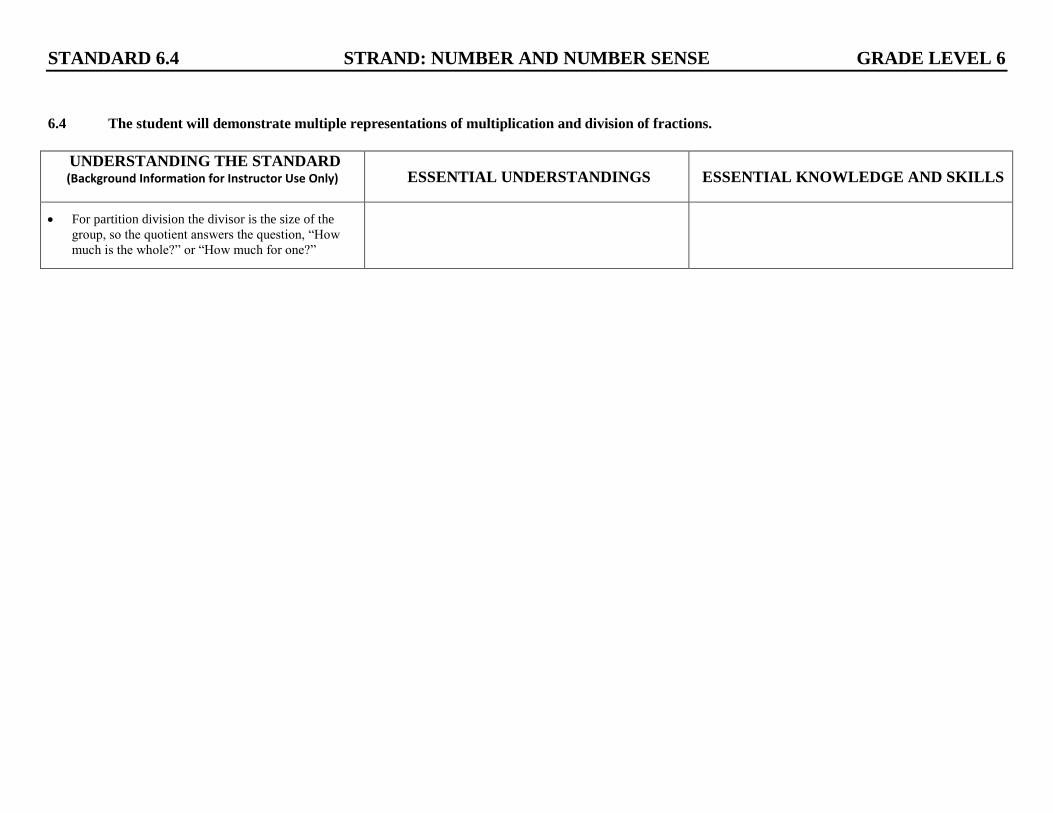
STANDARD 6.4 STRAND: NUMBER AND NUMBER SENSE GRADE LEVEL 6
6.4 The student will demonstrate multiple representations of multiplication and division of fractions.
UNDERSTANDING THE STANDARD (Background Information for Instructor Use Only) ESSENTIAL UNDERSTANDINGS ESSENTIAL KNOWLEDGE AND SKILLS
Using manipulatives to build conceptual
understanding and using pictures and sketches to
link concrete examples to the symbolic enhance
students’ understanding of operations with fractions
and help students connect the meaning of whole
number computation to fraction computation.
Multiplication and division of fractions can be
represented with arrays, paper folding, repeated
addition, repeated subtraction, fraction strips,
pattern blocks and area models.
When multiplying a whole by a fraction such as
3 x 1
2 , the meaning is the same as with
multiplication of whole numbers: 3 groups the size
of 1
2 of the whole.
When multiplying a fraction by a fraction such as
2 3
3 4 , we are asking for part of a part.
When multiplying a fraction by a whole number
such as 1
2 x 6, we are trying to find a part of the
whole.
For measurement division, the divisor is the number
of groups. You want to know how many are in each
of those groups. Division of fractions can be
explained as how many of a given divisor are
needed to equal the given dividend. In other words,
for 1 2
4 3 , the question is, “How many
2
3 make
1
4?”
When multiplying fractions, what is the meaning of
the operation?
When multiplying a whole by a fraction such as 3 x
1
2 , the meaning is the same as with multiplication
of whole numbers: 3 groups the size of 1
2 of the
whole.
When multiplying a fraction by a fraction such as
2 3
3 4 , we are asking for part of a part.
When multiplying a fraction by a whole number
such as 1
2 x 6, we are trying to find a part of the
whole.
What does it mean to divide with fractions?
For measurement division, the divisor is the number
of groups and the quotient will be the number of
groups in the dividend. Division of fractions can be
explained as how many of a given divisor are
needed to equal the given dividend. In other words,
for 1 2
4 3 the question is, “How many
2
3 make
1
4
?”
For partition division the divisor is the size of the
group, so the quotient answers the question, “How
much is the whole?” or “How much for one?”
The student will use problem solving, mathematical
communication, mathematical reasoning,
connections, and representations to
Demonstrate multiplication and division of fractions
using multiple representations.
Model algorithms for multiplying and dividing with
fractions using appropriate representations.
STANDARD 6.4 STRAND: NUMBER AND NUMBER SENSE GRADE LEVEL 6
6.4 The student will demonstrate multiple representations of multiplication and division of fractions.
UNDERSTANDING THE STANDARD (Background Information for Instructor Use Only) ESSENTIAL UNDERSTANDINGS ESSENTIAL KNOWLEDGE AND SKILLS
For partition division the divisor is the size of the
group, so the quotient answers the question, “How
much is the whole?” or “How much for one?”

STANDARD 6.5 STRAND: NUMBER AND NUMBER SENSE GRADE LEVEL 6
6.5 The student will investigate and describe concepts of positive exponents and perfect squares.
UNDERSTANDING THE STANDARD (Background Information for Instructor Use Only) ESSENTIAL UNDERSTANDINGS ESSENTIAL KNOWLEDGE AND SKILLS
In exponential notation, the base is the number that
is multiplied, and the exponent represents the
number of times the base is used as a factor. In 83, 8
is the base and 3 is the exponent.
A power of a number represents repeated
multiplication of the number by itself
(e.g., 83 = 8 8 8 and is read “8 to the third
power”).
Any real number other than zero raised to the zero
power is 1. Zero to the zero power (0) is undefined.
Perfect squares are the numbers that result from
multiplying any whole number by itself
(e.g., 36 = 6 6 = 62
).
Perfect squares can be represented geometrically as
the areas of squares the length of whose sides are
whole numbers (e.g., 1 1, 2 2, or 3 3). This
can be modeled with grid paper, tiles, geoboards and
virtual manipulatives.
What does exponential form represent?
Exponential form is a short way to write repeated
multiplication of a common factor such as
5 x 5 x 5 x 5 = 54
.
What is the relationship between perfect squares and
a geometric square?
A perfect square is the area of a geometric square
whose side length is a whole number.
The student will use problem solving, mathematical
communication, mathematical reasoning,
connections, and representations to
Recognize and describe patterns with exponents that
are natural numbers, by using a calculator.
Recognize and describe patterns of perfect squares
not to exceed 202
, by using grid paper, square tiles,
tables, and calculators.
Recognize powers of ten by examining patterns in a
place value chart: 104 = 10,000, 10
3 = 1000, 10
2 =
100, 101 = 10, 10
0=1.

FOCUS 6–8 STRAND: COMPUTATION AND ESTIMATION GRADE LEVEL 6
In the middle grades, the focus of mathematics learning is to
build on students’ concrete reasoning experiences developed in the elementary grades; construct a more advanced understanding of mathematics through active learning experiences; develop deep mathematical understandings required for success in abstract learning experiences; and apply mathematics as a tool in solving practical problems.
Students in the middle grades use problem solving, mathematical communication, mathematical reasoning, connections, and representations to integrate
understanding within this strand and across all the strands.
Students develop conceptual and algorithmic understanding of operations with integers and rational numbers through concrete activities and
discussions that bring meaning to why procedures work and make sense.
Students develop and refine estimation strategies and develop an understanding of when to use algorithms and when to use calculators. Students
learn when exact answers are appropriate and when, as in many life experiences, estimates are equally appropriate.
Students learn to make sense of the mathematical tools they use by making valid judgments of the reasonableness of answers.
Students reinforce skills with operations with whole numbers, fractions, and decimals through problem solving and application activities.
STANDARD 6.6 STRAND: COMPUTATION AND ESTIMATION GRADE LEVEL 6
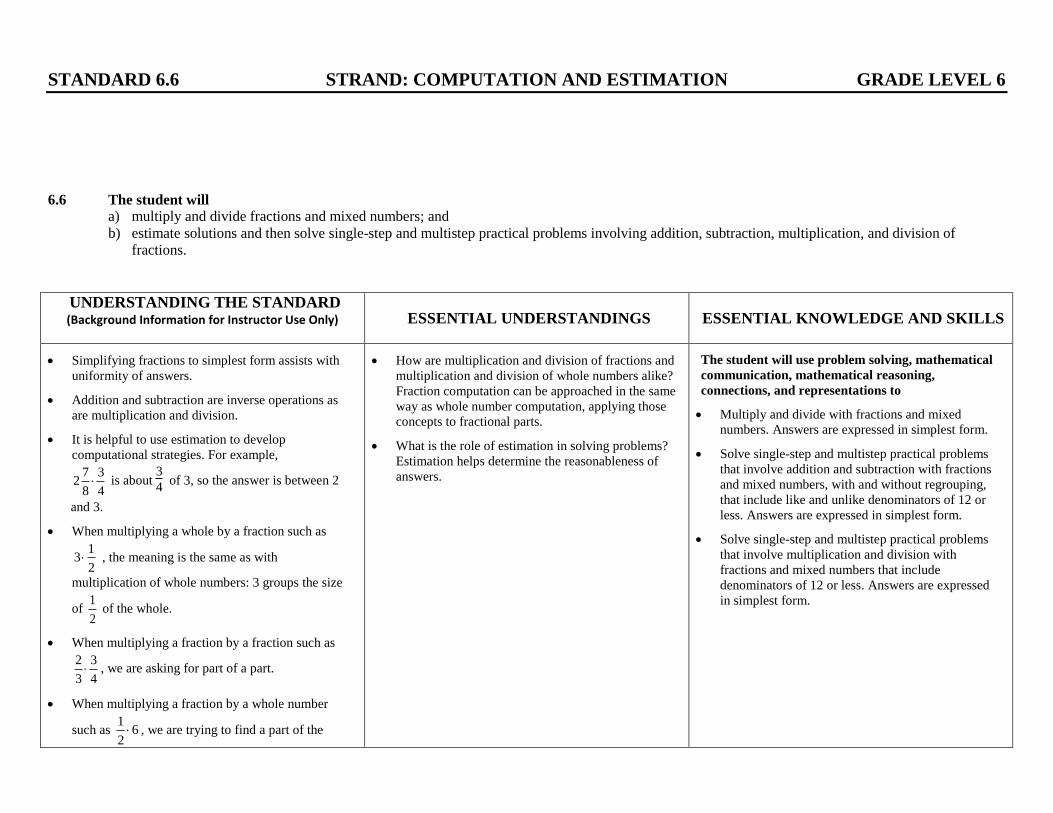
6.6 The student will
a) multiply and divide fractions and mixed numbers; and
b) estimate solutions and then solve single-step and multistep practical problems involving addition, subtraction, multiplication, and division of
fractions.
UNDERSTANDING THE STANDARD (Background Information for Instructor Use Only) ESSENTIAL UNDERSTANDINGS ESSENTIAL KNOWLEDGE AND SKILLS
Simplifying fractions to simplest form assists with
uniformity of answers.
Addition and subtraction are inverse operations as
are multiplication and division.
It is helpful to use estimation to develop
computational strategies. For example,
7 32
8 4 is about
3
4 of 3, so the answer is between 2
and 3.
When multiplying a whole by a fraction such as
13
2 , the meaning is the same as with
multiplication of whole numbers: 3 groups the size
of 1
2 of the whole.
When multiplying a fraction by a fraction such as
2 3
3 4 , we are asking for part of a part.
When multiplying a fraction by a whole number
such as 1
62 , we are trying to find a part of the
How are multiplication and division of fractions and
multiplication and division of whole numbers alike?
Fraction computation can be approached in the same
way as whole number computation, applying those
concepts to fractional parts.
What is the role of estimation in solving problems?
Estimation helps determine the reasonableness of
answers.
The student will use problem solving, mathematical
communication, mathematical reasoning,
connections, and representations to
Multiply and divide with fractions and mixed
numbers. Answers are expressed in simplest form.
Solve single-step and multistep practical problems
that involve addition and subtraction with fractions
and mixed numbers, with and without regrouping,
that include like and unlike denominators of 12 or
less. Answers are expressed in simplest form.
Solve single-step and multistep practical problems
that involve multiplication and division with
fractions and mixed numbers that include
denominators of 12 or less. Answers are expressed
in simplest form.
STANDARD 6.6 STRAND: COMPUTATION AND ESTIMATION GRADE LEVEL 6
6.6 The student will
a) multiply and divide fractions and mixed numbers; and
b) estimate solutions and then solve single-step and multistep practical problems involving addition, subtraction, multiplication, and division of
fractions.
UNDERSTANDING THE STANDARD (Background Information for Instructor Use Only) ESSENTIAL UNDERSTANDINGS ESSENTIAL KNOWLEDGE AND SKILLS
whole.

STANDARD 6.7 STRAND: COMPUTATION AND ESTIMATION GRADE LEVEL 6
6.7 The student will solve single-step and multistep practical problems involving addition, subtraction, multiplication, and division of decimals.
UNDERSTANDING THE STANDARD (Background Information for Instructor Use Only) ESSENTIAL UNDERSTANDINGS ESSENTIAL KNOWLEDGE AND SKILLS
Different strategies can be used to estimate the
result of computations and judge the reasonableness
of the result. For example: What is an approximate
answer for 2.19 0.8? The answer is around 2
because 2 1 = 2.
Understanding the placement of the decimal point is
very important when finding quotients of decimals.
Examining patterns with successive decimals
provides meaning, such as dividing the dividend by
6, by 0.6, by 0.06, and by 0.006.
Solving multistep problems in the context of real-
life situations enhances interconnectedness and
proficiency with estimation strategies.
Examples of practical situations solved by using
estimation strategies include shopping for groceries,
buying school supplies, budgeting an allowance,
deciding what time to leave for school or the
movies, and sharing a pizza or the prize money from
a contest.
What is the role of estimation in solving problems?
Estimation gives a reasonable solution to a problem
when an exact answer is not required. If an exact
answer is required, estimation allows you to know if
the calculated answer is reasonable.
The student will use problem solving, mathematical
communication, mathematical reasoning,
connections, and representations to
Solve single-step and multistep practical problems
involving addition, subtraction, multiplication and
division with decimals expressed to thousandths
with no more than two operations.

STANDARD 6.8 STRAND: COMPUTATION AND ESTIMATION GRADE LEVEL 6
6.8 The student will evaluate whole number numerical expressions, using the order of operations.
UNDERSTANDING THE STANDARD (Background Information for Instructor Use Only) ESSENTIAL UNDERSTANDINGS ESSENTIAL KNOWLEDGE AND SKILLS
The order of operations is a convention that defines
the computation order to follow in simplifying an
expression.
The order of operations is as follows:
– First, complete all operations within grouping
symbols*. If there are grouping symbols
within other grouping symbols, do the
innermost operation first.
– Second, evaluate all exponential expressions.
– Third, multiply and/or divide in order from left
to right.
– Fourth, add and/or subtract in order from left to
right.
* Parentheses ( ), brackets [ ], braces {}, and the division
bar – as in 3 4
5 6
should be treated as grouping symbols.
The power of a number represents repeated
multiplication of the number (e.g., 83 = 8 · 8 · 8).
The base is the number that is multiplied, and the
exponent represents the number of times the base is
used as a factor. In the example, 8 is the base, and 3
is the exponent.
Any number, except 0, raised to the zero power is 1.
Zero to the zero power is undefined.
What is the significance of the order of operations?
The order of operations prescribes the order to use
to simplify expressions containing more than one
operation. It ensures that there is only one correct
answer.
The student will use problem solving, mathematical
communication, mathematical reasoning,
connections, and representations to
Simplify expressions by using the order of
operations in a demonstrated step-by-step approach.
The expressions should be limited to positive values
and not include braces { } or absolute value | |.
Find the value of numerical expressions, using order
of operations, mental mathematics, and appropriate
tools. Exponents are limited to positive values.

STANDARD 6.8 STRAND: COMPUTATION AND ESTIMATION GRADE LEVEL 6

FOCUS 6–8 STRAND: MEASUREMENT GRADE LEVEL 6
In the middle grades, the focus of mathematics learning is to
build on students’ concrete reasoning experiences developed in the elementary grades; construct a more advanced understanding of mathematics through active learning experiences; develop deep mathematical understandings required for success in abstract learning experiences; and apply mathematics as a tool in solving practical problems.
Students in the middle grades use problem solving, mathematical communication, mathematical reasoning, connections, and representations to integrate
understanding within this strand and across all the strands.
Students develop the measurement skills that provide a natural context and connection among many mathematics concepts. Estimation skills are
developed in determining length, weight/mass, liquid volume/capacity, and angle measure. Measurement is an essential part of mathematical
explorations throughout the school year.
Students continue to focus on experiences in which they measure objects physically and develop a deep understanding of the concepts and
processes of measurement. Physical experiences in measuring various objects and quantities promote the long-term retention and understanding
of measurement. Actual measurement activities are used to determine length, weight/mass, and liquid volume/capacity.
Students examine perimeter, area, and volume, using concrete materials and practical situations. Students focus their study of surface area and
volume on rectangular prisms, cylinders, pyramids, and cones.

STANDARD 6.9 STRAND: MEASUREMENT GRADE LEVEL 6
6.9 The student will make ballpark comparisons between measurements in the U.S. Customary System of measurement and measurements in the metric
system.
UNDERSTANDING THE STANDARD (Background Information for Instructor Use Only) ESSENTIAL UNDERSTANDINGS ESSENTIAL KNOWLEDGE AND SKILLS
Making sense of various units of measure is an
essential life skill, requiring reasonable estimates of
what measurements mean, particularly in relation to
other units of measure.
– 1 inch is about 2.5 centimeters.
– 1 foot is about 30 centimeters.
– 1 meter is a little longer than a yard, or about 40
inches.
– 1 mile is slightly farther than 1.5 kilometers.
– 1 kilometer is slightly farther than half a mile.
– 1 ounce is about 28 grams.
– 1 nickel has the mass of about 5 grams.
– 1 kilogram is a little more than 2 pounds.
– 1 quart is a little less than 1 liter.
– 1 liter is a little more than 1 quart.
– Water freezes at 0°C and 32°F.
– Water boils at 100°C and 212°F.
– Normal body temperature is about 37°C and
98°F.
– Room temperature is about 20°C and 70°F.
Mass is the amount of matter in an object. Weight is
the pull of gravity on the mass of an object. The
mass of an object remains the same regardless of its
location. The weight of an object changes dependent
on the gravitational pull at its location. In everyday
life, most people are actually interested in
determining an object’s mass, although they use the
term weight, as shown by the questions: “How much
does it weigh?” versus “What is its mass?”
What is the difference between weight and mass?
Weight and mass are different. Mass is the amount
of matter in an object. Weight is the pull of gravity
on the mass of an object. The mass of an object
remains the same regardless of its location. The
weight of an object changes dependent on the
gravitational pull at its location.
How do you determine which units to use at
different times?
Units of measure are determined by the attributes of
the object being measured. Measures of length are
expressed in linear units, measures of area are
expressed in square units, and measures of volume
are expressed in cubic units.
Why are there two different measurement systems?
Measurement systems are conventions invented by
different cultures to meet their needs. The U.S.
Customary System is the preferred method in the
United States. The metric system is the preferred
system worldwide.
The student will use problem solving, mathematical
communication, mathematical reasoning,
connections, and representations to
Estimate the conversion of units of length,
weight/mass, volume, and temperature between the
U.S. Customary system and the metric system by
using ballpark comparisons.
Ex: 1 L 1qt. Ex: 4L 4 qts.
Estimate measurements by comparing the object to
be measured against a benchmark.

STANDARD 6.9 STRAND: MEASUREMENT GRADE LEVEL 6
6.9 The student will make ballpark comparisons between measurements in the U.S. Customary System of measurement and measurements in the metric
system.
UNDERSTANDING THE STANDARD (Background Information for Instructor Use Only) ESSENTIAL UNDERSTANDINGS ESSENTIAL KNOWLEDGE AND SKILLS
The degree of accuracy of measurement required is
determined by the situation.
Whether to use an underestimate or an overestimate
is determined by the situation.
Physically measuring objects along with using
visual and symbolic representations improves
student understanding of both the concepts and
processes of measurement.
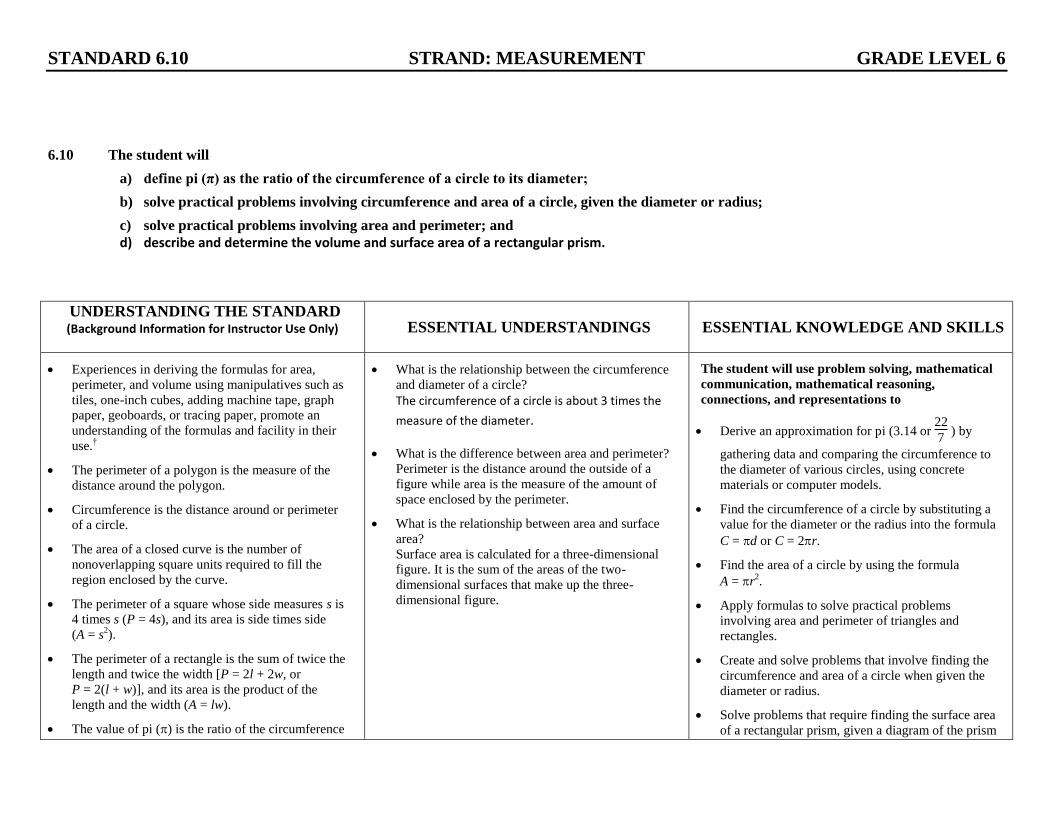
STANDARD 6.10 STRAND: MEASUREMENT GRADE LEVEL 6
6.10 The student will
a) define pi (π) as the ratio of the circumference of a circle to its diameter;
b) solve practical problems involving circumference and area of a circle, given the diameter or radius;
c) solve practical problems involving area and perimeter; and
d) describe and determine the volume and surface area of a rectangular prism.
UNDERSTANDING THE STANDARD (Background Information for Instructor Use Only) ESSENTIAL UNDERSTANDINGS ESSENTIAL KNOWLEDGE AND SKILLS
Experiences in deriving the formulas for area,
perimeter, and volume using manipulatives such as
tiles, one-inch cubes, adding machine tape, graph
paper, geoboards, or tracing paper, promote an
understanding of the formulas and facility in their
use.†
The perimeter of a polygon is the measure of the
distance around the polygon.
Circumference is the distance around or perimeter
of a circle.
The area of a closed curve is the number of
nonoverlapping square units required to fill the
region enclosed by the curve.
The perimeter of a square whose side measures s is
4 times s (P = 4s), and its area is side times side
(A = s2).
The perimeter of a rectangle is the sum of twice the
length and twice the width [P = 2l + 2w, or
P = 2(l + w)], and its area is the product of the
length and the width (A = lw).
The value of pi () is the ratio of the circumference
What is the relationship between the circumference
and diameter of a circle?
The circumference of a circle is about 3 times the
measure of the diameter.
What is the difference between area and perimeter?
Perimeter is the distance around the outside of a
figure while area is the measure of the amount of
space enclosed by the perimeter.
What is the relationship between area and surface
area?
Surface area is calculated for a three-dimensional
figure. It is the sum of the areas of the two-
dimensional surfaces that make up the three-
dimensional figure.
The student will use problem solving, mathematical
communication, mathematical reasoning,
connections, and representations to
Derive an approximation for pi (3.14 or 22
7 ) by
gathering data and comparing the circumference to
the diameter of various circles, using concrete
materials or computer models.
Find the circumference of a circle by substituting a
value for the diameter or the radius into the formula
C = d or C = 2r.
Find the area of a circle by using the formula
A = r2.
Apply formulas to solve practical problems
involving area and perimeter of triangles and
rectangles.
Create and solve problems that involve finding the
circumference and area of a circle when given the
diameter or radius.
Solve problems that require finding the surface area
of a rectangular prism, given a diagram of the prism

STANDARD 6.10 STRAND: MEASUREMENT GRADE LEVEL 6
6.10 The student will
a) define pi (π) as the ratio of the circumference of a circle to its diameter;
b) solve practical problems involving circumference and area of a circle, given the diameter or radius;
c) solve practical problems involving area and perimeter; and
d) describe and determine the volume and surface area of a rectangular prism.
UNDERSTANDING THE STANDARD (Background Information for Instructor Use Only) ESSENTIAL UNDERSTANDINGS ESSENTIAL KNOWLEDGE AND SKILLS
of a circle to its diameter.
The ratio of the circumference to the diameter of a
circle is a constant value, pi (), which can be
approximated by measuring various sizes of circles.
The fractional approximation of pi generally used is 22
7 .
The decimal approximation of pi generally used is
3.14.
The circumference of a circle is computed using
C d or 2C r , where d is the diameter and r
is the radius of the circle.
The area of a circle is computed using the formula 2A r , where r is the radius of the circle.
The surface area of a rectangular prism is the sum of
the areas of all six faces ( 2 2 2SA lw lh wh ).
The volume of a rectangular prism is computed by
multiplying the area of the base, B, (length x width)
by the height of the prism (V lwh Bh ).
with the necessary dimensions labeled.
Solve problems that require finding the volume of a
rectangular prism given a diagram of the prism with
the necessary dimensions labeled.

STANDARD 6.10 STRAND: MEASUREMENT GRADE LEVEL 6
6.10 The student will
a) define pi (π) as the ratio of the circumference of a circle to its diameter;
b) solve practical problems involving circumference and area of a circle, given the diameter or radius;
c) solve practical problems involving area and perimeter; and
d) describe and determine the volume and surface area of a rectangular prism.
UNDERSTANDING THE STANDARD (Background Information for Instructor Use Only) ESSENTIAL UNDERSTANDINGS ESSENTIAL KNOWLEDGE AND SKILLS
†Revised March 2011
FOCUS 6–8 STRAND: GEOMETRY GRADE LEVEL 6
In the middle grades, the focus of mathematics learning is to
build on students’ concrete reasoning experiences developed in the elementary grades; construct a more advanced understanding of mathematics through active learning experiences; develop deep mathematical understandings required for success in abstract learning experiences; and apply mathematics as a tool in solving practical problems.
Students in the middle grades use problem solving, mathematical communication, mathematical reasoning, connections, and representations to integrate
understanding within this strand and across all the strands.
Students expand the informal experiences they have had with geometry in the elementary grades and develop a solid foundation for the
exploration of geometry in high school. Spatial reasoning skills are essential to the formal inductive and deductive reasoning skills required in
subsequent mathematics learning.
Students learn geometric relationships by visualizing, comparing, constructing, sketching, measuring, transforming, and classifying geometric
figures. A variety of tools such as geoboards, pattern blocks, dot paper, patty paper, miras, and geometry software provides experiences that help
students discover geometric concepts. Students describe, classify, and compare plane and solid figures according to their attributes. They develop
and extend understanding of geometric transformations in the coordinate plane.
Students apply their understanding of perimeter and area from the elementary grades in order to build conceptual understanding of the surface
area and volume of prisms, cylinders, pyramids, and cones. They use visualization, measurement, and proportional reasoning skills to develop an
understanding of the effect of scale change on distance, area, and volume. They develop and reinforce proportional reasoning skills through the
study of similar figures.
Students explore and develop an understanding of the Pythagorean Theorem. Mastery of the use of the Pythagorean Theorem has far-reaching
impact on subsequent mathematics learning and life experiences.
The van Hiele theory of geometric understanding describes how students learn geometry and provides a framework for structuring student experiences that
should lead to conceptual growth and understanding.
Level 0: Pre-recognition. Geometric figures are not recognized. For example, students cannot differentiate between three-sided and four-sided
polygons.

FOCUS 6–8 STRAND: GEOMETRY GRADE LEVEL 6
Level 1: Visualization. Geometric figures are recognized as entities, without any awareness of parts of figures or relationships between
components of a figure. Students should recognize and name figures and distinguish a given figure from others that look somewhat the same.
(This is the expected level of student performance during grades K and 1.)
Level 2: Analysis. Properties are perceived but are isolated and unrelated. Students should recognize and name properties of geometric figures.
(Students are expected to transition to this level during grades 2 and 3.)
Level 3: Abstraction. Definitions are meaningful, with relationships being perceived between properties and between figures. Logical
implications and class inclusions are understood, but the role and significance of deduction is not understood. (Students should transition to this
level during grades 5 and 6 and fully attain it before taking algebra.)
Level 4: Deduction. Students can construct proofs, understand the role of axioms and definitions, and know the meaning of necessary and
sufficient conditions. Students should be able to supply reasons for steps in a proof. (Students should transition to this level before taking
geometry.)
STANDARD 6.11 STRAND: GEOMETRY GRADE LEVEL 6
6.11 The student will
a) identify the coordinates of a point in a coordinate plane; and
b) graph ordered pairs in a coordinate plane.
UNDERSTANDING THE STANDARD (Background Information for Instructor Use Only) ESSENTIAL UNDERSTANDINGS ESSENTIAL KNOWLEDGE AND SKILLS
In a coordinate plane, the coordinates of a point are
typically represented by the ordered pair (x, y),
where x is the first coordinate and y is the second
coordinate. However, any letters may be used to
label the axes and the corresponding ordered pairs.
The quadrants of a coordinate plane are the four
regions created by the two intersecting
perpendicular number lines. Quadrants are named in
counterclockwise order. The signs on the ordered
pairs for quadrant I are (+,+); for quadrant II, (–,+);
for quadrant III, (–, –); and for quadrant IV, (+,–).
In a coordinate plane, the origin is the point at the
intersection of the x-axis and y-axis; the coordinates
of this point are (0,0).
For all points on the x-axis, the y-coordinate is 0.
For all points on the y-axis, the x-coordinate is 0.
The coordinates may be used to name the point. (e.g., the point (2,7)). It is not necessary to say “the point whose coordinates are (2,7)”.
Can any given point be represented by more than
one ordered pair?
The coordinates of a point define its unique location
in a coordinate plane. Any given point is defined by
only one ordered pair.
In naming a point in the plane, does the order of the
two coordinates matter?
Yes. The first coordinate tells the location of the
point to the left or right of the y-axis and the second
point tells the location of the point above or below
the x-axis. Point (0, 0) is at the origin.
The student will use problem solving, mathematical
communication, mathematical reasoning,
connections, and representations to
Identify and label the axes of a coordinate plane.
Identify and label the quadrants of a coordinate
plane.
Identify the quadrant or the axis on which a point is
positioned by examining the coordinates (ordered
pair) of the point.
Graph ordered pairs in the four quadrants and on the
axes of a coordinate plane.
Identify ordered pairs represented by points in the
four quadrants and on the axes of the coordinate
plane.
Relate the coordinate of a point to the distance from
each axis and relate the coordinates of a single point
to another point on the same horizontal or vertical
line.†

STANDARD 6.11 STRAND: GEOMETRY GRADE LEVEL 6
6.11 The student will
a) identify the coordinates of a point in a coordinate plane; and
b) graph ordered pairs in a coordinate plane.
UNDERSTANDING THE STANDARD (Background Information for Instructor Use Only) ESSENTIAL UNDERSTANDINGS ESSENTIAL KNOWLEDGE AND SKILLS
†Revised March 2011

STANDARD 6.12 STRAND: GEOMETRY GRADE LEVEL 6
6.12 The student will determine congruence of segments, angles, and polygons.
UNDERSTANDING THE STANDARD (Background Information for Instructor Use Only) ESSENTIAL UNDERSTANDINGS ESSENTIAL KNOWLEDGE AND SKILLS
Congruent figures have exactly the same size and
the same shape.
Noncongruent figures may have the same shape but
not the same size.
The symbol for congruency is .
The corresponding angles of congruent polygons
have the same measure, and the corresponding sides
of congruent polygons have the same measure.
The determination of the congruence or
noncongruence of two figures can be accomplished
by placing one figure on top of the other or by
comparing the measurements of all sides and angles.
Construction of congruent line segments, angles,
and polygons helps students understand congruency.
Given two congruent figures, what inferences can be
drawn about how the figures are related?
The congruent figures will have exactly the same
size and shape.
Given two congruent polygons, what inferences can be drawn about how the polygons are related?
Corresponding angles of congruent polygons
will have the same measure. Corresponding sides
of congruent polygons will have the same measure.
The student will use problem solving, mathematical
communication, mathematical reasoning,
connections, and representations to
Characterize polygons as congruent and
noncongruent according to the measures of their
sides and angles.
Determine the congruence of segments, angles, and
polygons given their attributes.
Draw polygons in the coordinate plane given
coordinates for the vertices; use coordinates to find
the length of a side joining points with the same first
coordinate or the same second coordinate. Apply
these techniques in the context of solving practical
and mathematical problems.†
†Revised March 2011
STANDARD 6.13 STRAND: GEOMETRY GRADE LEVEL 6
6.13 The student will describe and identify properties of quadrilaterals.
UNDERSTANDING THE STANDARD (Background Information for Instructor Use Only) ESSENTIAL UNDERSTANDINGS ESSENTIAL KNOWLEDGE AND SKILLS
A quadrilateral is a closed planar (two-dimensional)
figure with four sides that are line segments.
A parallelogram is a quadrilateral whose opposite
sides are parallel and opposite angles are congruent.
A rectangle is a parallelogram with four right
angles.
Rectangles have special characteristics (such as
diagonals are bisectors) that are true for any
rectangle.
To bisect means to divide into two equal parts.
A square is a rectangle with four congruent sides or
a rhombus with four right angles.
A rhombus is a parallelogram with four congruent
sides.
A trapezoid is a quadrilateral with exactly one pair
of parallel sides. The parallel sides are called bases,
and the nonparallel sides are called legs. If the legs
have the same length, then the trapezoid is an
isosceles trapezoid.
A kite is a quadrilateral with two pairs of adjacent
congruent sides. One pair of opposite angles is
congruent.
Quadrilaterals can be sorted according to common
attributes, using a variety of materials.
Quadrilaterals can be classified by the number of
Can a figure belong to more than one subset of
quadrilaterals?
Any figure that has the attributes of more than one
subset of quadrilaterals can belong to more than
one subset. For example, rectangles have opposite
sides of equal length. Squares have all 4 sides of
equal length thereby meeting the attributes of both
subsets.
The student will use problem solving, mathematical
communication, mathematical reasoning,
connections, and representations to
Sort and classify polygons as quadrilaterals,
parallelograms, rectangles, trapezoids, kites,
rhombi, and squares based on their properties.
Properties include number of parallel sides, angle
measures and number of congruent sides.
Identify the sum of the measures of the angles of a
quadrilateral as 360°.

STANDARD 6.13 STRAND: GEOMETRY GRADE LEVEL 6
6.13 The student will describe and identify properties of quadrilaterals.
UNDERSTANDING THE STANDARD (Background Information for Instructor Use Only) ESSENTIAL UNDERSTANDINGS ESSENTIAL KNOWLEDGE AND SKILLS
parallel sides: a parallelogram, rectangle, rhombus,
and square each have two pairs of parallel sides; a
trapezoid has only one pair of parallel sides; other
quadrilaterals have no parallel sides.
Quadrilaterals can be classified by the measures of
their angles: a rectangle has four 90° angles; a
trapezoid may have zero or two 90° angles.
Quadrilaterals can be classified by the number of
congruent sides: a rhombus has four congruent
sides; a square, which is a rhombus with four right
angles, also has four congruent sides; a
parallelogram and a rectangle each have two pairs of
congruent sides.
A square is a special type of both a rectangle and a
rhombus, which are special types of parallelograms,
which are special types of quadrilaterals.
The sum of the measures of the angles of a
quadrilateral is 360°.
A chart, graphic organizer, or Venn Diagram can be
made to organize quadrilaterals according to
attributes such as sides and/or angles.

FOCUS 6–8 STRAND: PROBABILITY AND STATISTICS GRADE LEVEL 6
In the middle grades, the focus of mathematics learning is to
build on students’ concrete reasoning experiences developed in the elementary grades; construct a more advanced understanding of mathematics through active learning experiences; develop deep mathematical understandings required for success in abstract learning experiences; and apply mathematics as a tool in solving practical problems.
Students in the middle grades use problem solving, mathematical communication, mathematical reasoning, connections, and representations to integrate
understanding within this strand and across all the strands.
Students develop an awareness of the power of data analysis and probability by building on their natural curiosity about data and making
predictions.
Students explore methods of data collection and use technology to represent data with various types of graphs. They learn that different types of
graphs represent different types of data effectively. They use measures of center and dispersion to analyze and interpret data.
Students integrate their understanding of rational numbers and proportional reasoning into the study of statistics and probability.
Students explore experimental and theoretical probability through experiments and simulations by using concrete, active learning activities.
STANDARD 6.14 STRAND: PROBABILITY AND STATISTICS GRADE LEVEL 6
6.14 The student, given a problem situation, will
a) construct circle graphs;
b) draw conclusions and make predictions, using circle graphs; and
c) compare and contrast graphs that present information from the same data set.
UNDERSTANDING THE STANDARD (Background Information for Instructor Use Only) ESSENTIAL UNDERSTANDINGS ESSENTIAL KNOWLEDGE AND SKILLS
To collect data for any problem situation, an
experiment can be designed, a survey can be
conducted, or other data-gathering strategies can be
used. The data can be organized, displayed, analyzed,
and interpreted to answer the problem.
Different types of graphs are used to display different
types of data.
– Bar graphs use categorical (discrete) data (e.g.,
months or eye color).
– Line graphs use continuous data (e.g.,
temperature and time).
– Circle graphs show a relationship of the parts to a
whole.
All graphs include a title, and data categories should
have labels.
A scale should be chosen that is appropriate for the
data.
A key is essential to explain how to read the graph.
A title is essential to explain what the graph
represents.
Data are analyzed by describing the various features
and elements of a graph.
What types of data are best presented in a circle
graph?
Circle graphs are best used for data showing a
relationship of the parts to the whole.
The student will use problem solving, mathematical
communication, mathematical reasoning,
connections, and representations to
Collect, organize and display data in circle graphs
by depicting information as fractional.
Draw conclusions and make predictions about data
presented in a circle graph.
Compare and contrast data presented in a circle
graph with the same data represented in other
graphical forms.

STANDARD 6.15 STRAND: PROBABILITY AND STATISTICS GRADE LEVEL 6
6.15 The student will
a) describe mean as balance point; and
b) decide which measure of center is appropriate for a given purpose.
UNDERSTANDING THE STANDARD (Background Information for Instructor Use Only) ESSENTIAL UNDERSTANDINGS ESSENTIAL KNOWLEDGE AND SKILLS
Measures of center are types of averages for a data
set. They represent numbers that describe a data set.
Mean, median, and mode are measures of center that
are useful for describing the average for different
situations.
– Mean works well for sets of data with no very
high or low numbers.
– Median is a good choice when data sets have a
couple of values much higher or lower than
most of the others.
– Mode is a good descriptor to use when the set of
data has some identical values or when data
are not conducive to computation of other
measures of central tendency, as when
working with data in a yes or no survey.
The mean is the numerical average of the data set
and is found by adding the numbers in the data set
together and dividing the sum by the number of data
pieces in the set.
In grade 5 mathematics, mean is defined as fair-
share.
Mean can be defined as the point on a number line
where the data distribution is balanced. This means
that the sum of the distances from the mean of all
the points above the mean is equal to the sum of the
distances of all the data points below the mean. This
is the concept of mean as the balance point.
What does the phrase “measure of center” mean?
This is a collective term for the 3 types of averages
for a set of data – mean, median, and mode.
What is meant by mean as balance point?
Mean can be defined as the point on a number line
where the data distribution is balanced. This means
that the sum of the distances from the mean of all
the points above the mean is equal to the sum of the
distances of all the data points below the mean. This
is the concept of mean as the balance point.
The student will use problem solving, mathematical
communication, mathematical reasoning,
connections, and representations to
Find the mean for a set of data.
Describe the three measures of center and a situation
in which each would best represent a set of data.
Identify and draw a number line that demonstrates
the concept of mean as balance point for a set of
data.

STANDARD 6.15 STRAND: PROBABILITY AND STATISTICS GRADE LEVEL 6
6.15 The student will
a) describe mean as balance point; and
b) decide which measure of center is appropriate for a given purpose.
UNDERSTANDING THE STANDARD (Background Information for Instructor Use Only) ESSENTIAL UNDERSTANDINGS ESSENTIAL KNOWLEDGE AND SKILLS
Defining mean as balance point is a prerequisite for
understanding standard deviation.
The median is the middle value of a data set in
ranked order. If there are an odd number of pieces
of data, the median is the middle value in ranked
order. If there is an even number of pieces of data,
the median is the numerical average of the two
middle values.
The mode is the piece of data that occurs most
frequently. If no value occurs more often than any
other, there is no mode. If there is more than one
value that occurs most often, all these most-
frequently-occurring values are modes. When there
are exactly two modes, the data set is bimodal.

STANDARD 6.16 STRAND: PROBABILITY AND STATISTICS GRADE LEVEL 6
6.16 The student will
a) compare and contrast dependent and independent events; and
b) determine probabilities for dependent and independent events.
UNDERSTANDING THE STANDARD (Background Information for Instructor Use Only) ESSENTIAL UNDERSTANDINGS ESSENTIAL KNOWLEDGE AND SKILLS
The probability of an event occurring is equal to the
ratio of desired outcomes to the total number of
possible outcomes (sample space).
The probability of an event occurring can be
represented as a ratio or the equivalent fraction,
decimal, or percent.
The probability of an event occurring is a ratio
between 0 and 1.
– A probability of 0 means the event will never
occur.
– A probability of 1 means the event will always
occur.
A simple event is one event (e.g., pulling one sock
out of a drawer and examining the probability of
getting one color).
Events are independent when the outcome of one
has no effect on the outcome of the other. For
example, rolling a number cube and flipping a coin
are independent events.
The probability of two independent events is found
by using the following formula:
( ) ( ) ( )P Aand B P A P B
Ex: When rolling two number cubes simultaneously,
what is the probability of rolling a 3 on one cube and
How can you determine if a situation involves
dependent or independent events?
Events are independent when the outcome of one
has no effect on the outcome of the other. Events are
dependent when the outcome of one event is
influenced by the outcome of the other.
The student will use problem solving, mathematical
communication, mathematical reasoning,
connections, and representations to
Determine whether two events are dependent or
independent.
Compare and contrast dependent and independent
events.
Determine the probability of two dependent events.
Determine the probability of two independent
events.

STANDARD 6.16 STRAND: PROBABILITY AND STATISTICS GRADE LEVEL 6
6.16 The student will
a) compare and contrast dependent and independent events; and
b) determine probabilities for dependent and independent events.
UNDERSTANDING THE STANDARD (Background Information for Instructor Use Only) ESSENTIAL UNDERSTANDINGS ESSENTIAL KNOWLEDGE AND SKILLS
a 4 on the other?
1 1 1
(3 4) (3) (4)6 6 36
P and P P
Events are dependent when the outcome of one
event is influenced by the outcome of the other. For
example, when drawing two marbles from a bag, not
replacing the first after it is drawn affects the
outcome of the second draw.
The probability of two dependent events is found by
using the following formula:
( ) ( ) ( )P Aand B P A P Bafter A
Ex: You have a bag holding a blue ball, a red ball,
and a yellow ball. What is the probability of picking
a blue ball out of the bag on the first pick and then
without replacing the blue ball in the bag, picking a
red ball on the second pick?
1 1 1
(blue red) (blue) (red blue)3 2 6
P and P P after

STANDARD 6.16 STRAND: PROBABILITY AND STATISTICS GRADE LEVEL 6
6.16 The student will
a) compare and contrast dependent and independent events; and
b) determine probabilities for dependent and independent events.
UNDERSTANDING THE STANDARD (Background Information for Instructor Use Only) ESSENTIAL UNDERSTANDINGS ESSENTIAL KNOWLEDGE AND SKILLS
FOCUS 6–8 STRAND: PATTERNS, FUNCTIONS, AND ALGEBRA GRADE LEVEL 6
In the middle grades, the focus of mathematics learning is to
build on students’ concrete reasoning experiences developed in the elementary grades; construct a more advanced understanding of mathematics through active learning experiences; develop deep mathematical understandings required for success in abstract learning experiences; and apply mathematics as a tool in solving practical problems.
Students in the middle grades use problem solving, mathematical communication, mathematical reasoning, connections, and representations to integrate
understanding within this strand and across all the strands.
Students extend their knowledge of patterns developed in the elementary grades and through life experiences by investigating and describing
functional relationships.
Students learn to use algebraic concepts and terms appropriately. These concepts and terms include variable, term, coefficient, exponent,
expression, equation, inequality, domain, and range. Developing a beginning knowledge of algebra is a major focus of mathematics learning in
the middle grades.
Students learn to solve equations by using concrete materials. They expand their skills from one-step to two-step equations and inequalities.
Students learn to represent relations by using ordered pairs, tables, rules, and graphs. Graphing in the coordinate plane linear equations in two
variables is a focus of the study of functions.

STANDARD 6.17 STRAND: PATTERNS, FUNCTIONS, AND ALGEBRA GRADE LEVEL 6
6.17 The student will identify and extend geometric and arithmetic sequences.
UNDERSTANDING THE STANDARD (Background Information for Instructor Use Only) ESSENTIAL UNDERSTANDINGS ESSENTIAL KNOWLEDGE AND SKILLS
Numerical patterns may include linear and
exponential growth, perfect squares, triangular and
other polygonal numbers, or Fibonacci numbers.
Arithmetic and geometric sequences are types of
numerical patterns.
In the numerical pattern of an arithmetic sequence,
students must determine the difference, called the
common difference, between each succeeding
number in order to determine what is added to each
previous number to obtain the next number. Sample
numerical patterns are 6, 9, 12, 15, 18, ; and 5, 7,
9, 11, 13, .
In geometric number patterns, students must
determine what each number is multiplied by to
obtain the next number in the geometric sequence.
This multiplier is called the common ratio. Sample
geometric number patterns include 2, 4, 8, 16, 32,
…; 1, 5, 25, 125, 625, …; and 80, 20, 5, 1.25, …
Strategies to recognize and describe the differences
between terms in numerical patterns include, but are
not limited to, examining the change between
consecutive terms, and finding common factors. An
example is the pattern 1, 2, 4, 7, 11, 16,
What is the difference between an arithmetic and a
geometric sequence?
While both are numerical patterns, arithmetic
sequences are additive and geometric sequences
are multiplicative.
The student will use problem solving, mathematical
communication, mathematical reasoning,
connections, and representations to
Investigate and apply strategies to recognize and
describe the change between terms in arithmetic
patterns.
Investigate and apply strategies to recognize and
describe geometric patterns.
Describe verbally and in writing the relationships
between consecutive terms in an arithmetic or
geometric sequence.
Extend and apply arithmetic and geometric
sequences to similar situations.
Extend arithmetic and geometric sequences in a
table by using a given rule or mathematical
relationship.
Compare and contrast arithmetic and geometric
sequences.
Identify the common difference for a given
arithmetic sequence.
Identify the common ratio for a given geometric
sequence.
STANDARD 6.18 STRAND: PATTERNS, FUNCTIONS, AND ALGEBRA GRADE LEVEL 6
6.18 The student will solve one-step linear equations in one variable involving whole number coefficients and positive rational solutions.
UNDERSTANDING THE STANDARD (Background Information for Instructor Use Only) ESSENTIAL UNDERSTANDINGS ESSENTIAL KNOWLEDGE AND SKILLS
A one-step linear equation is an equation that
requires one operation to solve.
A mathematical expression contains a variable or a
combination of variables, numbers, and/or operation
symbols and represents a mathematical relationship.
An expression cannot be solved.
A term is a number, variable, product, or quotient in
an expression of sums and/or differences. In 7x2 +
5x – 3, there are three terms, 7x2, 5x, and 3.
A coefficient is the numerical factor in a term. For
example, in the term 3xy2, 3 is the coefficient; in the
term z, 1 is the coefficient.
Positive rational solutions are limited to whole
numbers and positive fractions and decimals.
An equation is a mathematical sentence stating that
two expressions are equal.
A variable is a symbol (placeholder) used to
represent an unspecified member of a set.
When solving an equation, why is it necessary to
perform the same operation on both sides of an
equal sign?
To maintain equality, an operation performed on one
side of an equation must be performed on the other
side.
The student will use problem solving, mathematical
communication, mathematical reasoning, connections
and representation to
Represent and solve a one-step equation, using a
variety of concrete materials such as colored chips,
algebra tiles, or weights on a balance scale.
Solve a one-step equation by demonstrating the
steps algebraically.
Identify and use the following algebraic terms
appropriately: equation, variable, expression, term,
and coefficient.

STANDARD 6.19 STRAND: PATTERNS, FUNCTIONS, AND ALGEBRA GRADE LEVEL 6
6.19 The student will investigate and recognize
a) the identity properties for addition and multiplication;
b) the multiplicative property of zero; and
c) the inverse property for multiplication.
UNDERSTANDING THE STANDARD (Background Information for Instructor Use Only) ESSENTIAL UNDERSTANDINGS ESSENTIAL KNOWLEDGE AND SKILLS
Identity elements are numbers that combine with
other numbers without changing the other numbers.
The additive identity is zero (0). The multiplicative
identity is one (1). There are no identity elements
for subtraction and division.
The additive identity property states that the sum of
any real number and zero is equal to the given real
number (e.g., 5 + 0 = 5).
The multiplicative identity property states that the
product of any real number and one is equal to the
given real number (e.g., 8 · 1 = 8).
Inverses are numbers that combine with other
numbers and result in identity elements.
The multiplicative inverse property states that the
product of a number and its multiplicative inverse
(or reciprocal) always equals one (e.g., 4 · 1
4 = 1).
Zero has no multiplicative inverse.
The multiplicative property of zero states that the
product of any real number and zero is zero.
Division by zero is not a possible arithmetic
operation. Division by zero is undefined.
How are the identity properties for multiplication
and addition the same? Different?
For each operation the identity elements are
numbers that combine with other numbers without
changing the value of the other numbers. The
additive identity is zero (0). The multiplicative
identity is one (1).
What is the result of multiplying any real number by
zero?
The product is always zero.
Do all real numbers have a multiplicative inverse? No. Zero has no multiplicative inverse because there is no real number that can be multiplied by zero resulting in a product of one.
The student will use problem solving, mathematical
communication, mathematical reasoning,
connections, and representations to
Identify a real number equation that represents each
property of operations with real numbers, when
given several real number equations.
Test the validity of properties by using examples of
the properties of operations on real numbers.
Identify the property of operations with real
numbers that is illustrated by a real number
equation.
NOTE: The commutative, associative and distributive
properties are taught in previous grades.

STANDARD 6.19 STRAND: PATTERNS, FUNCTIONS, AND ALGEBRA GRADE LEVEL 6
6.20 The student will graph inequalities on a number line.
UNDERSTANDING THE STANDARD (Background Information for Instructor Use Only) ESSENTIAL UNDERSTANDINGS
ESSENTIAL KNOWLEDGE AND
SKILLS
Inequalities using the < or > symbols are
represented on a number line with an open
circle on the number and a shaded line over the
solution set.
Ex: x < 4
When graphing x 4 fill in the circle above the
4 to indicate that the 4 is included.
Inequalities using the or symbols are
represented on a number line with a closed
circle on the number and shaded line in the
direction of the solution set.
The solution set to an inequality is the set of all
numbers that make the inequality true.
It is important for students to see inequalities
written with the variable before the inequality
symbol and after. For example x > -6 and 7 > y.
In an inequality, does the order of the
elements matter?
Yes, the order does matter. For example, x > 5
is not the same relationship as 5 > x.
However, x > 5 is the same relationship as 5 <
x.
The student will use problem solving,
mathematical communication, mathematical
reasoning, connections and representation to
Given a simple inequality with integers,
graph the relationship on a number line.
Given the graph of a simple inequality with
integers, represent the inequality two
different ways using symbols (<, >, <, >).

STANDARD 6.19 STRAND: PATTERNS, FUNCTIONS, AND ALGEBRA GRADE LEVEL 6
Related Documents