Grade 1 Data Analysis: Additional Sample 1 How Did You Come to School Today? Context The students had previous experience with tallying, graphing, and orally explaining what they leaned from their graphs. Mathematical Concepts • collect information in a variety of ways to answer a given question or solve a problem • represent the data collected on a concrete object graph and a pictograph, using one-to-one correspondence • interpret data using appropriate language Process Students surveyed classmates on how they came to school and tallied their results on a template provided by the teacher. The teacher then asked students to repeat the survey for another class, and tally those results. Students constructed separate bar graphs for each class on a template provided by the teacher, then used their graphs to compare the two classes, telling how they were the same or different.

Welcome message from author
This document is posted to help you gain knowledge. Please leave a comment to let me know what you think about it! Share it to your friends and learn new things together.
Transcript

Grade 1 Data Analysis: Additional Sample 1
How Did You Come to School Today?
Context
The students had previous experience with tallying, graphing, and orally explaining what they leaned from their graphs.
Mathematical Concepts
• collect information in a variety of ways to answer a given question or solve a problem
• represent the data collected on a concrete object graph and a pictograph, using one-to-one correspondence
• interpret data using appropriate language
Process
Students surveyed classmates on how they came to school and tallied their results on a template provided by the teacher. The teacher then asked students to repeat the survey for another class, and tally those results.
Students constructed separate bar graphs for each class on a template provided by the teacher, then used their graphs to compare the two classes, telling how they were the same or different.
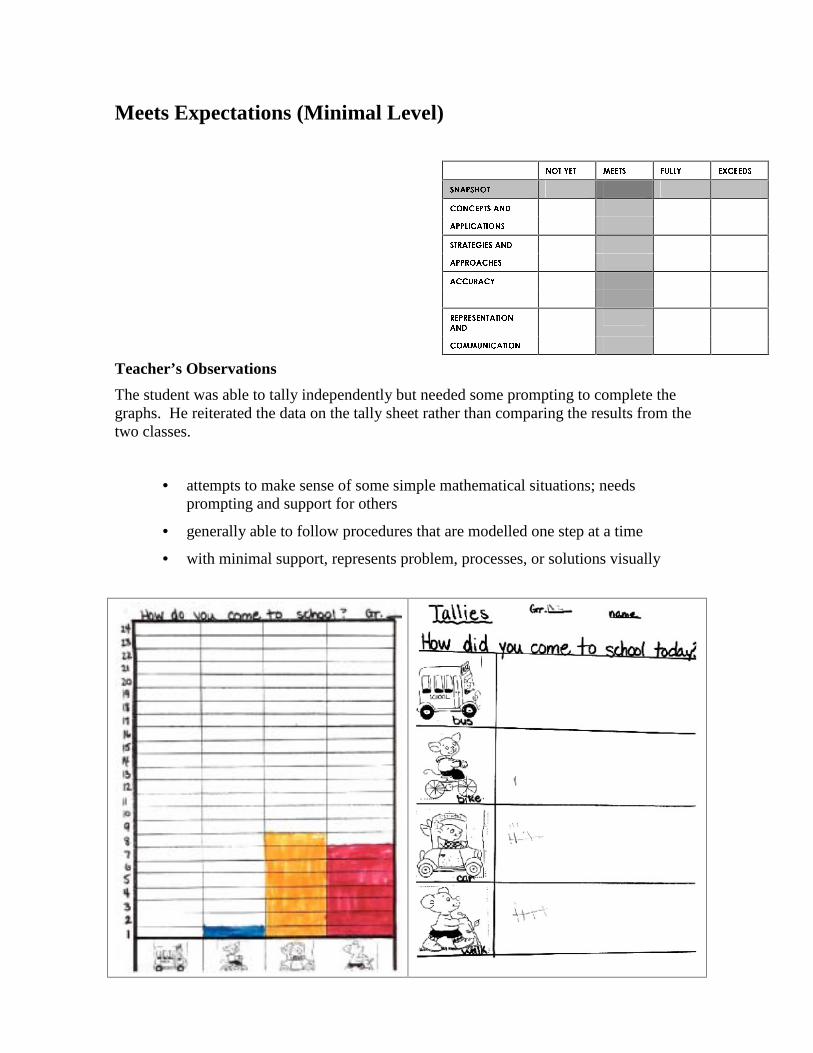
Meets Expectations (Minimal Level)
� �������� ������ ���� �� �����
��������� � � � �
�� ���������� � � � �
����� ������� � � � �
��������������� � � � �
������ ���� � � � �
� �� �� � � � �
�
���������������
�����
����� ������
Teacher’s Observations
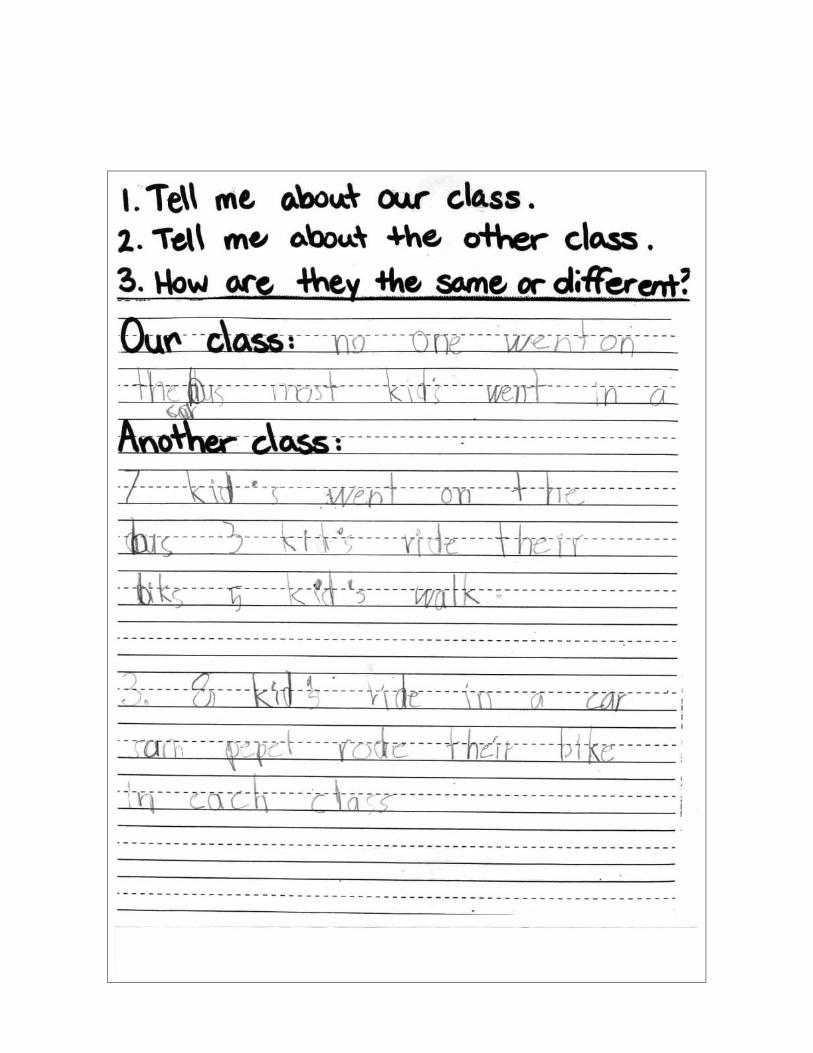
The student was able to tally independently but needed some prompting to complete the graphs. He reiterated the data on the tally sheet rather than comparing the results from the two classes.
• attempts to make sense of some simple mathematical situations; needs prompting and support for others
• generally able to follow procedures that are modelled one step at a time
• with minimal support, represents problem, processes, or solutions visually

Fully Meets Expectations
� �������� ������ ���� �� �����
��������� � � � �
�� ���������� � � � �
����� ������� � � � �
��������������� � � � �
������ ���� � � � �
� �� �� � � � �
�
���������������
�����
����� ������
Teacher’s Observations
The student was able to tally and graph data independently. She identified both what was the same and what was different between the two classes.
• tries to make sense of simple mathematical situations
• follows modelled procedures when asked
• represents problems, processes, and/or solutions visually
• correctly uses simple comparing terms


Grade 1 Data Analysis Additional Sample 2
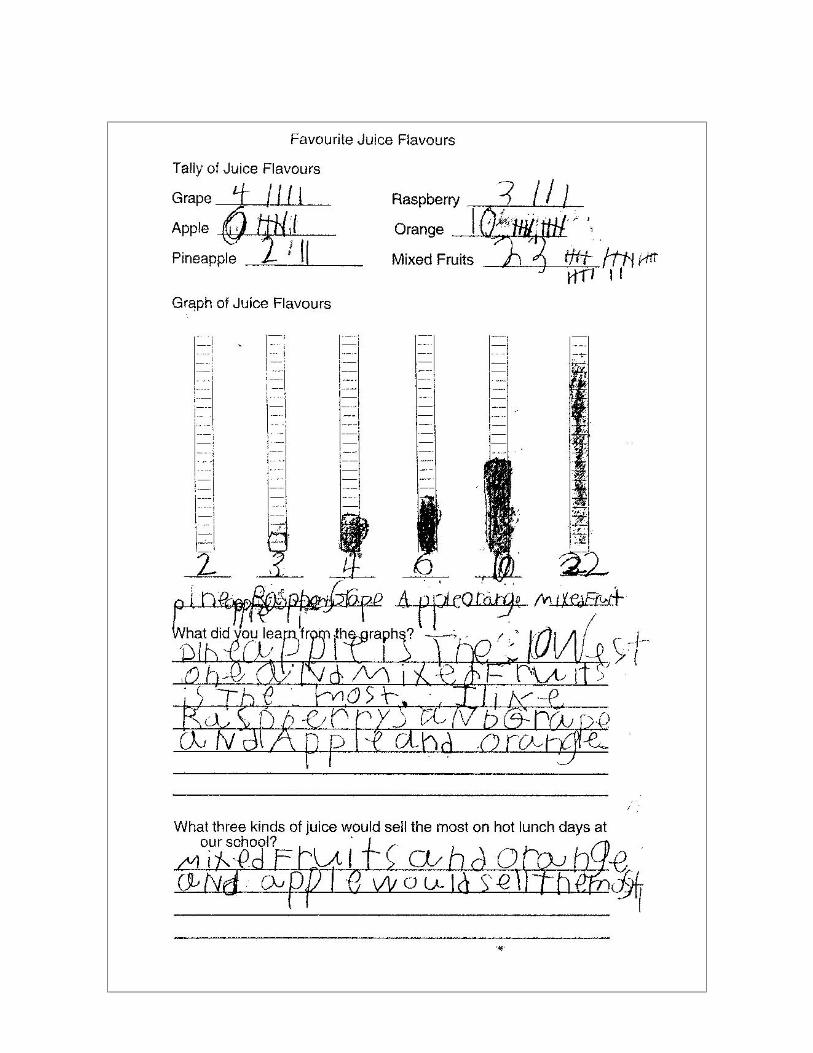
Favourite Juice Flavours
Context
The students had done several simple surveys before, and were familiar with tallying and graphing.
Mathematical Concepts
• collect information in a variety of ways to answer a given question or solve a problem
• represent the data collected on a concrete object graph and a pictograph, using one-to-one correspondence
• interpret data using appropriate language
Process
The students were asked to survey their classmates about their favourite flavours of juice, and tally and graph the results using the templates provided by the teacher. Students were then asked what they could learn from their graphs.
In order to provide a practical application for their work, the teacher asked the students to decide what three kinds of juice would sell the most on hot lunch days at their school.

Meets Expectations (Minimal Level)
� �������� ������ ���� �� �����
��������� � � � �
�� ���������� � � � �
����� ������� � � � �
��������������� � � � �
������ ���� � � � �
� �� �� � � � �
�
���������������
�����
����� ������
Teacher’s Observations
The student needed prompting to transfer the totals from her tally to the bar graph. She was able to communicate her conclusions using some simple comparing terms.
• attempts to make sense of some simple mathematical situations; needs prompting and support for others
• generally able to follow procedures that are modelled one step at a time
• with minimal support, represents problem, processes, or solutions visually
• with minimal prompting, uses most simple comparing terms correctly

Fully Meets Expectations
� �������� ������ ���� �� �����
��������� � � � �
�� ���������� � � � �
����� ������� � � � �
��������������� � � � �
������ ���� � � � �
� �� �� � � � �
�
���������������
�����
����� ������
Teacher’s Observations
The student was able to follow all the modelled procedures for tallying and constructing the graph. She correctly identified which three kinds of juice would sell the most, and distinguished between the favourite flavours identified by the data and her personal favourite flavours.
• tries to make sense of simple mathematical situations
• follows modelled procedures when asked
• represents problems, processes, and/or solutions visually
• correctly uses simple comparing terms


Grade 1 Data Analysis Additional Sample 3
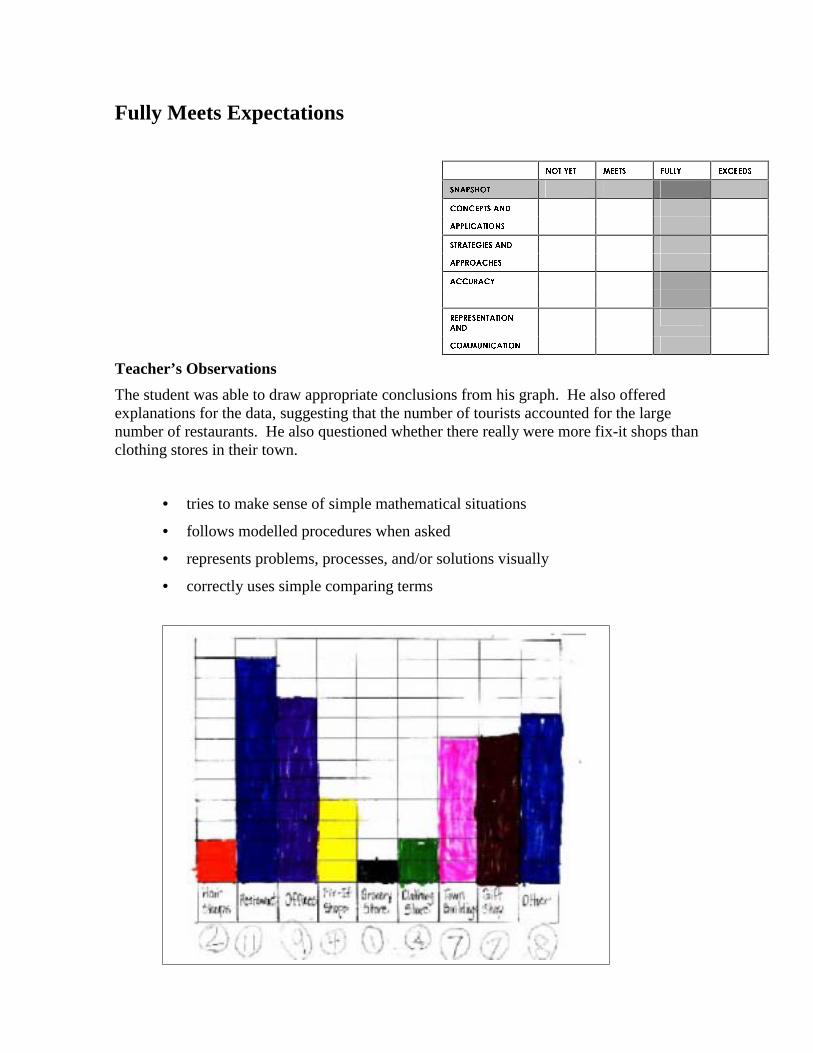
Our Neighbourhood
Context
This was an integrated Social Studies and Mathematics activity. The students were already familiar with what a community needs – food, shelter, safety, jobs, and entertainment. They were also familiar with tally sheets from chance and probability tasks.
Mathematical Concepts
• collect information in a variety of ways to answer a given question or solve a problem
• represent the data collected on a concrete object graph and a pictograph, using one-to-one correspondence
• interpret data using appropriate language
Process
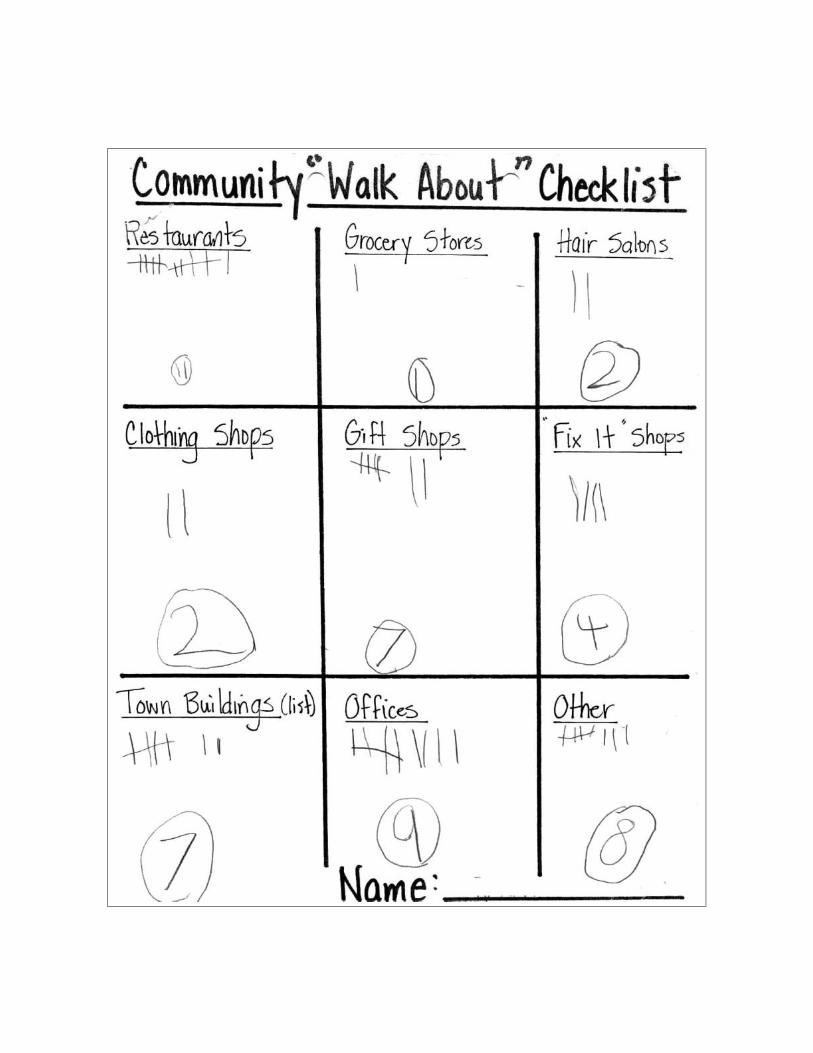
The teacher explained to the students that they would be taking a “walk-about” through their community to look for different types of building representing the basic needs of a community. Each student was given a clipboard with a “walk-about checklist” developed by the teacher. The class sang “Walk Around the Block” before leaving the school.
During their walk through the community, the class stopped at each building and discussed as a group what the building was, and where it fit in the tally grid sheet.
Upon return, the students added up their tally sheets. The teacher asked questions such as:
• What does our data tell us?
• Why are there more of some types of buildings than others?
• What limits our findings? (They did not walk around the whole town.)
Students wrote about the walk and their data in response journals.
The next day, students used their data to construct bar graphs on a template provided by the teacher. They formed small groups to discuss what they could tell from their graphs, and whether tally sheets or bar graphs are easier to read. Student then worked independently to write what they learned from their graphs.

Meets Expectations (Minimal Level)
� �������� ������ ���� �� �����
��������� � � � �
�� ���������� � � � �
����� ������� � � � �
��������������� � � � �
������ ���� � � � �
� �� �� � � � �
�
���������������
�����
����� ������
Teacher’s Observations
The student had difficulty constructing the bar graph, so the teacher suggested that her write the numbers in the squares as he counted them. He was able to draw several conclusions from the graph, all using “more and less” terms.
• attempts to make sense of some simple mathematical situations; needs prompting and support for others
• generally able to follow procedures that are modelled one step at a time
• with minimal support, represents problem, processes, or solutions visually
• with minimal prompting, uses most simple comparing terms correctly


Fully Meets Expectations
� �������� ������ ���� �� �����
��������� � � � �
�� ���������� � � � �
����� ������� � � � �
��������������� � � � �
������ ���� � � � �
� �� �� � � � �
�
���������������
�����
����� ������
Teacher’s Observations
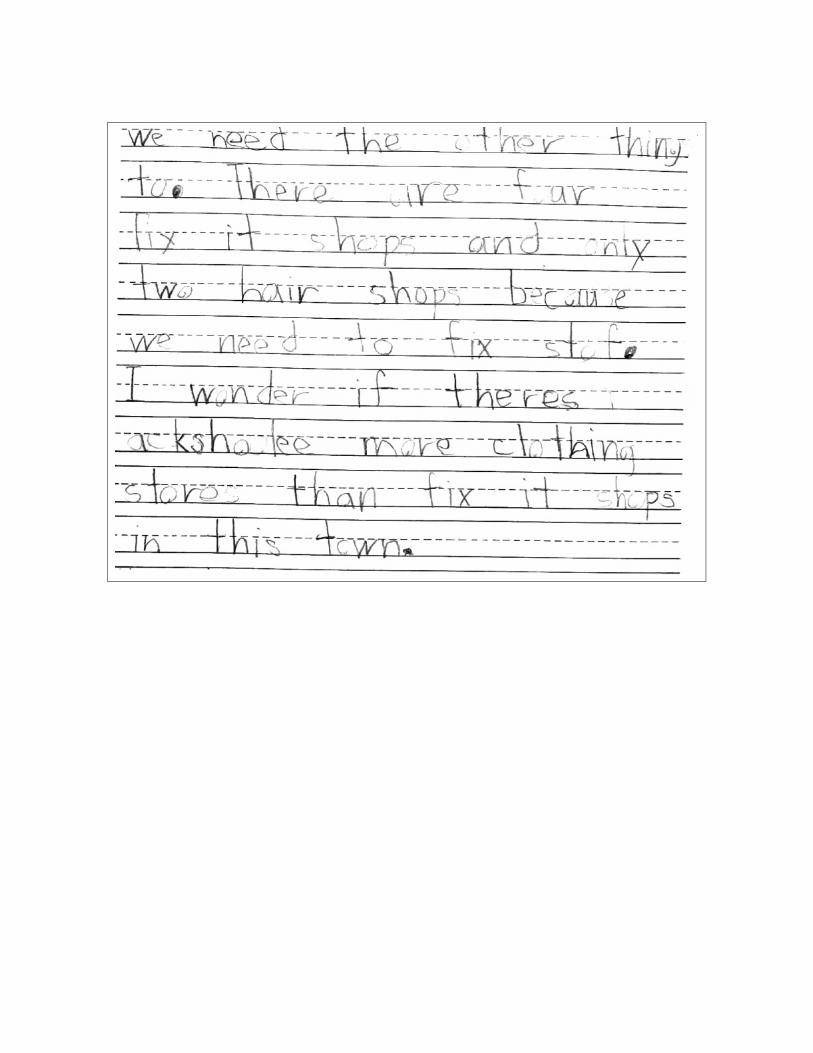
The student was able to draw appropriate conclusions from his graph. He also offered explanations for the data, suggesting that the number of tourists accounted for the large number of restaurants. He also questioned whether there really were more fix-it shops than clothing stores in their town.
• tries to make sense of simple mathematical situations
• follows modelled procedures when asked
• represents problems, processes, and/or solutions visually
• correctly uses simple comparing terms


Grade 1 Measurement: Additional Sample 1
Sharing Granola
Context
In previous classes the students had measured volume using a variety of non-standard measures.
Mathematical Concepts
• estimate, measure, record, and compare the volume/capacity of containers, using non-standard units
• solve problems that involve one or more content areas
• analyze problems to develop a plan (e.g., identify key words, relevant information)
• develop specific skills in selecting and using an appropriate problem-solving strategy or combination of strategies from, but not restricted to: guess and check; identify patterns; use a list, chart, or table; make and use a picture or diagram; role play; model using objects; work backward; simplify the original problem
• verify that solutions to problems are correct and reasonable
• communicate an understanding of a problem, the process used to solve it, and the justification of the solution
• solve problems individually and cooperatively
Process
The students were asked to bring a container, any size, to school. The next day the class made granola under the direction of the teacher. When it was time to divide it up and eat it, the class gathered in a circle with their containers. The teacher started filling the containers, and ran out of granola after the seventh container.
When the class erupted with complaints, the teacher asked them how they would divide the granola fairly. Each student was given a sheet of paper and asked to explain their plan. They later shared their thinking orally within small groups.

Meets Expectations (Minimal Level)
� �������� ������ ���� �� �����
��������� � � � �
�� ���������� � � � �
����� ������� � � � �
��������������� � � � �
������ ���� � � � �
� �� �� � � � �
�
���������������
�����
����� ������
Teacher’s Observations
The student found this problem overwhelming at first, and needed some prompting from the teacher to get started. He decided to give each student one scoop of granola, and if there was some left over, to give everyone another scoop. He drew this procedure on his paper. When he realized he would run out of granola on the second round, he gave up.
• with support, identifies ways to apply mathematical skills such as counting and comparing to everyday problems that are similar to those previously experienced
• often needs prompting to draw on what they know in order to figure out what they don’t know; may be reluctant to create own procedures
• with minimal support, represents problems, processes, and/or solutions visually

Fully Meets Expectations
� �������� ������ ���� �� �����
��������� � � � �
�� ���������� � � � �
����� ������� � � � �
��������������� � � � �
������ ���� � � � �
� �� �� � � � �
�
���������������
�����
����� ������
Teacher’s Observations
This student approached the problem confidently. He decided to count the pieces of granola and then divide by the number of students in the class. He even asked the teacher if she had a calculator, saying he would need to do division. He soon realized that counting each piece of granola would take too much time. He then chose a spoon as a measure and estimated that each student would get two spoonfuls of granola.
• tries to make sense of simple mathematical situations
• in familiar situations, makes predictions and evaluates the reasonableness of an answer or result (estimate) with minimal support, using number and spatial sense
• tries, with some confidence , to draw on what they know in order to figure out what they don’t know; often able to create own procedures
• analyzes simple problem to develop a plan
• selects and uses appropriate problem-solving strategies
• with some prompting, demonstrates and orally describes processes and results that they have experienced

Grade 1 Problem-Solving: Additional Sample 1
Planning a Mothers’ Day Tea
Context
Each year the class hosts a Mothers’ Day Tea. The teacher usually tries to pose problems for the students related to planning the tea. The type of problem varies depending on the mathematics concepts the students are working on at the time.
Mathematical Concepts
• use a referent to estimate the number of objects in a set (to 50), then count the objects and compare the number with their estimate
• represent numbers concretely, pictorially, and symbolically
• solve problems that involve one or more content areas
• analyze problems to develop a plan (e.g., identify key words, relevant information
• develop specific skills in selecting and using an appropriate problem-solving strategy or combination of strategies from, but not restricted to: guess and check; identify patterns; use a list, chart, or table; make and use a picture or diagram; role play; model using objects; work backward; simplify the original problem
• verify that solutions to problems are correct and reasonable
• communicate an understanding of a problem, the process used to solve it, and the justification of the solution
• solve problems individually and cooperatively
Process
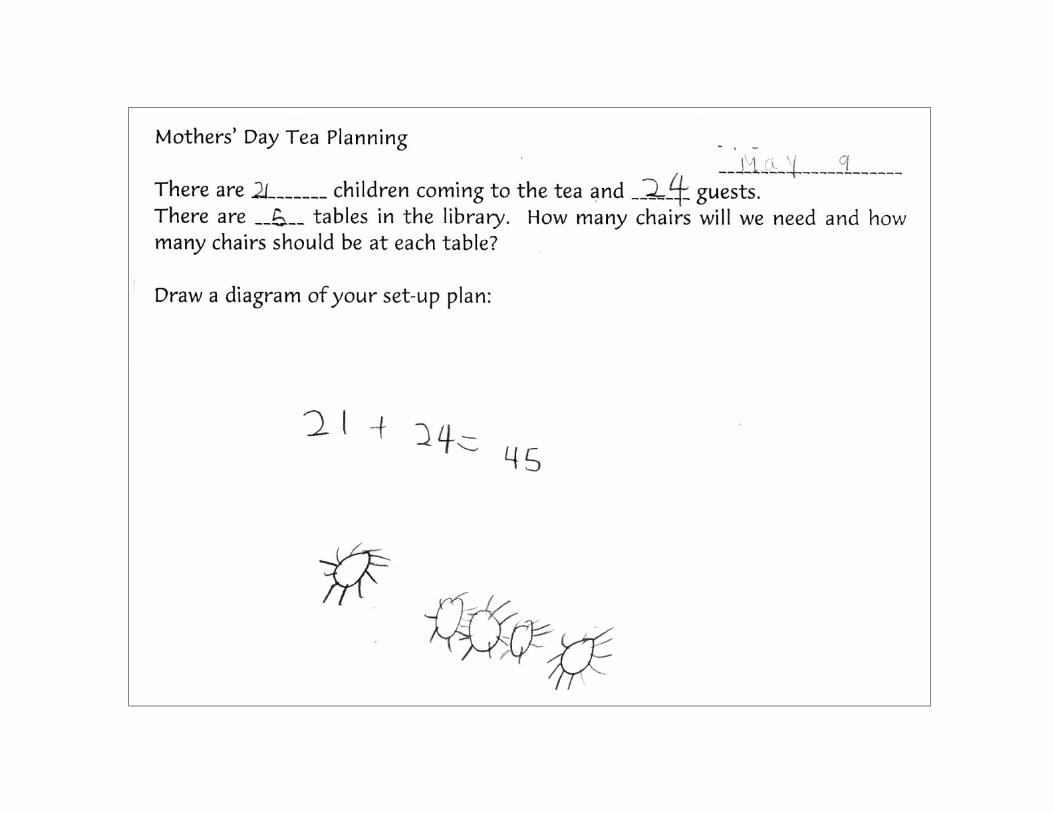
The students were asked to find out how many guests would be attending the tea, and how many tables were available to them in the library. The students were then asked to create a seating plan, and to figure out how many chairs would be needed for students and guests.

Not Yet Within Expectations
� �������� ������ ���� �� �����
��������� � � � �
�� ���������� � � � �
����� ������� � � � �
��������������� � � � �
������ ���� � � � �
� �� �� � � � �
�
���������������
�����
����� ������
Teacher’s Observations
This student did not know where to start, and relied on the teacher and other students for procedures. He heard someone say the number of guests was 45, and he copied the algorithm from another student. The teacher prompted him to draw the tables. He then randomly put chairs at tables counting by 1’s to 45.
• often does not attempt to make sense of simple mathematical situations
• shows little confidence in own knowledge and skill; may be unable to connect what he or she knows to a particular task
• requires one-to-one support to complete all parts of the task
• uses one-to-one correspondence
• counts by 1s to 100; may work slowly and need direct support with larger numbers
• unable to explain or demonstrate how to complete most or all parts of the task

Meets Expectations (Minimal Level)
� �������� ������ ���� �� �����
��������� � � � �
�� ���������� � � � �
����� ������� � � � �
��������������� � � � �
������ ���� � � � �
� �� �� � � � �
�
���������������
�����
����� ������
Teacher’s Observations
This student used her felts as manipulatives to add 21 plus 24, counting on from 21. However, she ran into difficult as she got to larger numbers, and another student told her the answer was 45. She started with lots of chairs around each table, then started to erase some as she realized she had too many. She tried to count the chairs she had left but again had difficult when she got to larger numbers, and said; “This is too hard.”
• attempts to make sense of some simple mathematical situations; needs prompting and support for others
• often needs prompting to draw on what they know in order to figure out what they don’t know; may be reluctant to create own procedures
• shows limited flexibility and perseverance; often needs support to continue with a challenging task
• counts by 1s to 100; may work slowly and need direct support with larger numbers
• writes numerals up to 50

Fully Meets Expectations
� �������� ������ ���� �� �����
��������� � � � �
�� ���������� � � � �
����� ������� � � � �
��������������� � � � �
������ ���� � � � �
� �� �� � � � �
�
���������������
�����
����� ������
Teacher’s Observations
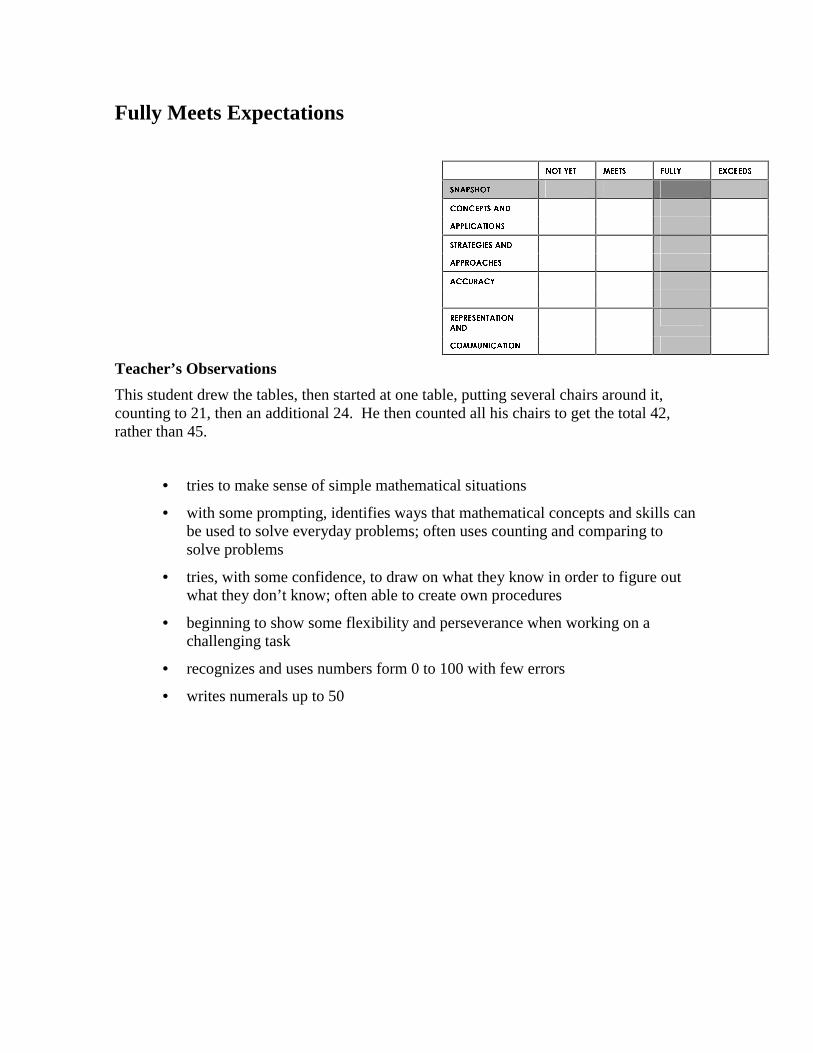
This student drew the tables, then started at one table, putting several chairs around it, counting to 21, then an additional 24. He then counted all his chairs to get the total 42, rather than 45.
• tries to make sense of simple mathematical situations
• with some prompting, identifies ways that mathematical concepts and skills can be used to solve everyday problems; often uses counting and comparing to solve problems
• tries, with some confidence, to draw on what they know in order to figure out what they don’t know; often able to create own procedures
• beginning to show some flexibility and perseverance when working on a challenging task
• recognizes and uses numbers form 0 to 100 with few errors
• writes numerals up to 50


Exceeds Expectations
� �������� ������ ���� �� �����
��������� � � � �
�� ���������� � � � �
����� ������� � � � �
��������������� � � � �
������ ���� � � � �
� �� �� � � � �
�
���������������
�����
����� ������
Teacher’s Observations
The student immediately wrote the number sentence 21+24, and did the calculation independently. He worked out that there should be 9 chairs at each table by trying to put an even number at each table, and then erasing when he had too many at a table. He was able to write an explanation of his procedure in his own words.
• independently applies mathematical concepts to everyday problems; readily uses counting and comparing to solve problems
• confidently uses what they know in an attempt to figure out what they don’t know and create own procedures
• shows increasing flexibility and perseverance in a range of challenging situations
• counts by 1s with ease
• adds and subtracts to 18 with ease (may use mental math to arrive at a correct answer quickly); beginning to add and subtract with two digits
• writes numerals to 50
• demonstrates and orally describes processes that have been modelled and practiced; often uses own words

Related Documents