//2006 Annual Report / / / / / / / / / / / / / / / /

Welcome message from author
This document is posted to help you gain knowledge. Please leave a comment to let me know what you think about it! Share it to your friends and learn new things together.
Transcript
//2006 Annual Report////////// //////////CORPORATE HEADQUARTERS//
GROUP 1 AUTOMOTIVE, INC. 950 ECHO LANE, SUITE 100 // HOUSTON, TEXAS 77024
713.647.5700
WWW.GROUP1AUTO.COM
////////
www.Group1Auto.com
CONTENTSFINANCIAL HIGHLIGHTS //01// LETTER TO STOCKHOLDERS //02–03// ACQUISITIONS //04–05// OPERATIONS //06–011//
BOARD OF DIRECTORS/MANAGEMENT TEAM //012–013// REGIONAL VICE PRESIDENTS //014–015// CORPORATE INFORMATION //016//
//NYSE: GPI
, a Fortune 500 automotive retailer,
is a leading operator in the $1 trillion automotive retailing industry. Since its
initial public offering in October 1997, Group 1 has grown to become one
of the top five dealership groups in the United States. The company has
achieved this success through a strategy that leverages management
experience and emphasizes geographic and brand diversity, interrelated
revenue streams, operational efficiencies and the prudent deployment
of capital.
Group 1 owns 104 dealerships comprised of 143 franchises, 33 brands and
28 collision service centers in Alabama, California, Florida, Georgia, Kansas,
Louisiana, Massachusetts, Mississippi, New Hampshire, New Jersey, New
Mexico, New York, Oklahoma and Texas. Through its dealerships, the
company sells new and used cars and light trucks; arranges related
financing, vehicle service and insurance contracts; provides maintenance
and repair services; and sells replacement parts. In 2006, the company
sold more than 197,000 retail new and used vehicles.
www.Group1Auto.com
de
sig
ned
by
curr
an &
co
nno
rs, i
nc. /
ww
w.c
urra
n-c
onn
ors
.co
m
//2006 AR
(Dollars and shares in thousands, except per share amounts)
//2006
//2005
//2004
//2003
//2002
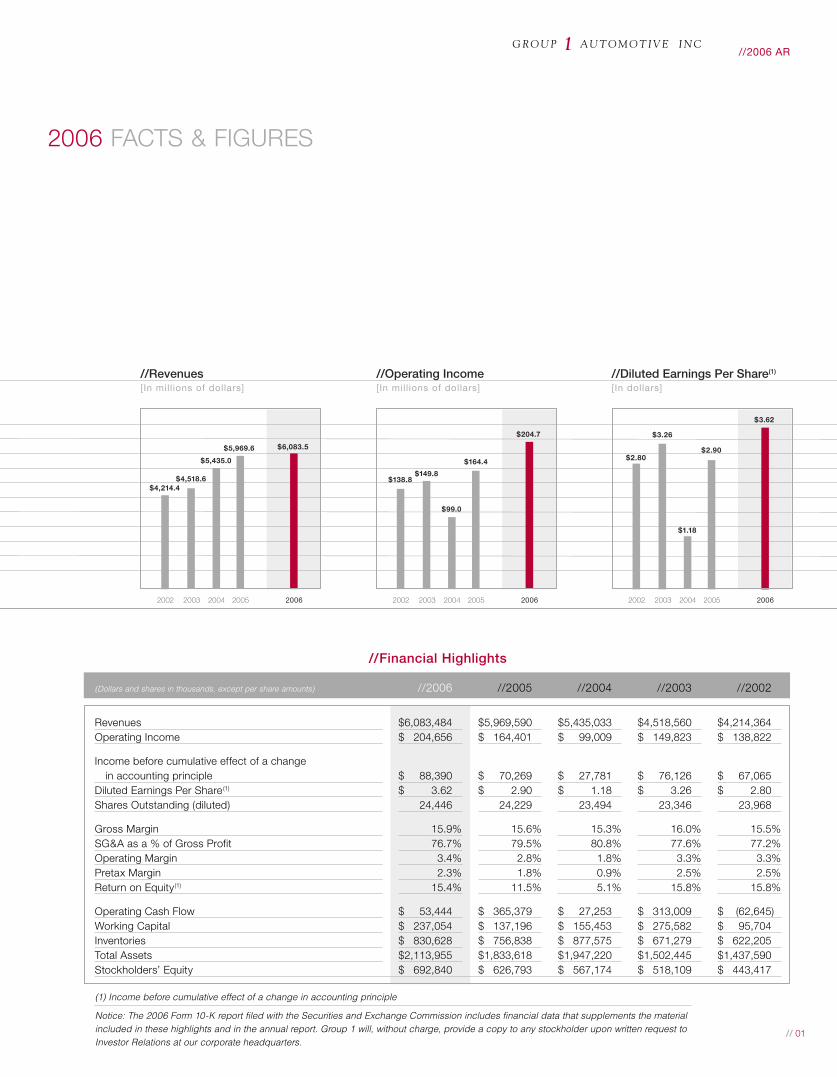
Revenues $ 6,083,484 $ 5,969,590 $ 5,435,033 $ 4,518,560 $ 4,214,364 Operating Income $ 204,656 $ 164,401 $ 99,009 $ 149,823 $ 138,822
Income before cumulative effect of a change in accounting principle $ 88,390 $ 70,269 $ 27,781 $ 76,126 $ 67,065 Diluted Earnings Per Share(1) $ 3.62 $ 2.90 $ 1.18 $ 3.26 $ 2.80 Shares Outstanding (diluted) 24,446 24,229 23,494 23,346 23,968
Gross Margin 15.9% 15.6% 15.3% 16.0% 15.5%SG&A as a % of Gross Profit 76.7% 79.5% 80.8% 77.6% 77.2%Operating Margin 3.4% 2.8% 1.8% 3.3% 3.3%Pretax Margin 2.3% 1.8% 0.9% 2.5% 2.5%Return on Equity(1) 15.4% 11.5% 5.1% 15.8% 15.8%
Operating Cash Flow $ 53,444 $ 365,379 $ 27,253 $ 313,009 $ (62,645)Working Capital $ 237,054 $ 137,196 $ 155,453 $ 275,582 $ 95,704 Inventories $ 830,628 $ 756,838 $ 877,575 $ 671,279 $ 622,205 Total Assets $ 2,113,955 $ 1,833,618 $ 1,947,220 $ 1,502,445 $ 1,437,590 Stockholders’ Equity $ 692,840 $ 626,793 $ 567,174 $ 518,109 $ 443,417
20062005200420032002
$3.62
$2.90
$1.18
$3.26
$2.80
//Diluted Earnings Per Share(1)
[In dollars]
20062005200420032002
$6,083.5$5,969.6
$5,435.0
$4,518.6$4,214.4
//Revenues[In mill ions of dollars]
20062005200420032002
$204.7
$164.4
$99.0
$149.8$138.8
//Operating Income[In mill ions of dollars]
0.0
0.5
1.0
1.5
2.0
2.5
3.0
3.5
4.0
0
50
100
150
200
250
0
1000
2000
3000
4000
5000
6000
7000
8000
//Financial Highlights
2006 FACTS & FIGURES
(1) Income before cumulative effect of a change in accounting principle
Notice: The 2006 Form 10-K report filed with the Securities and Exchange Commission includes financial data that supplements the material included in these highlights and in the annual report. Group 1 will, without charge, provide a copy to any stockholder upon written request to Investor Relations at our corporate headquarters.
// 01
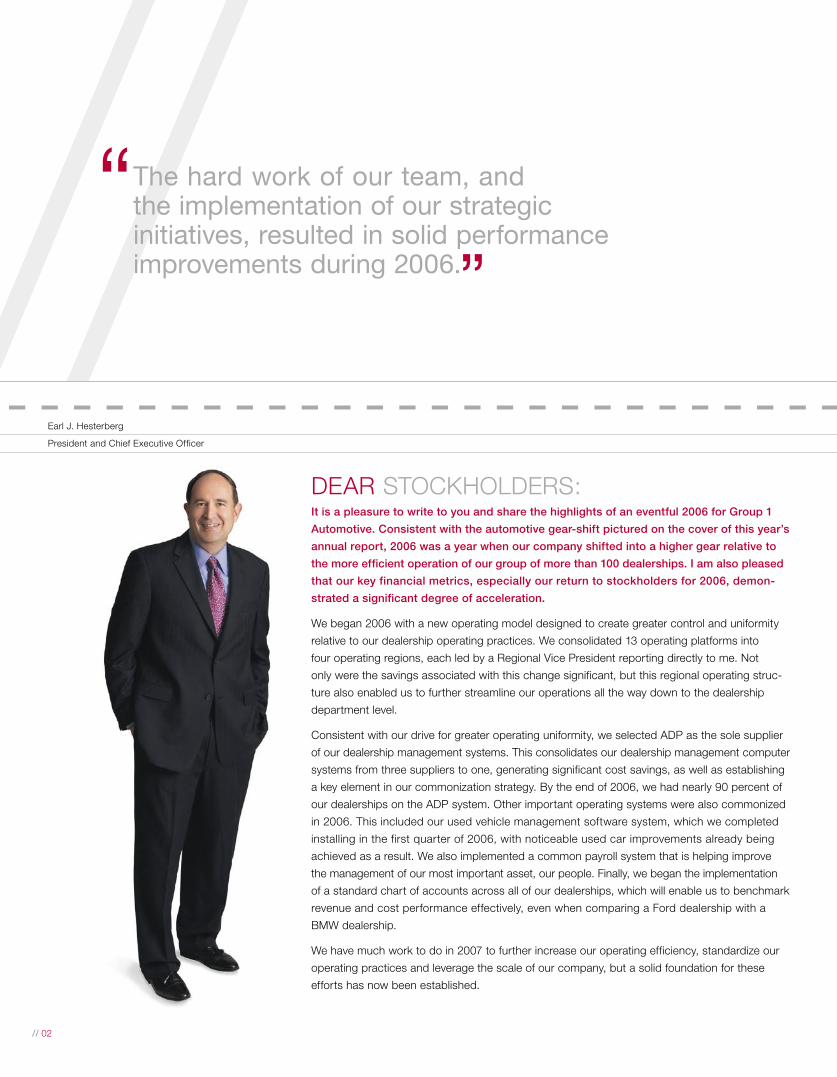
//Earl J. Hesterberg
President and Chief Executive Officer
DEAR STOCKHOLDERS:It is a pleasure to write to you and share the highlights of an eventful 2006 for Group 1
Automotive. Consistent with the automotive gear-shift pictured on the cover of this year’s
annual report, 2006 was a year when our company shifted into a higher gear relative to
the more efficient operation of our group of more than 100 dealerships. I am also pleased
that our key financial metrics, especially our return to stockholders for 2006, demon-
strated a significant degree of acceleration.
We began 2006 with a new operating model designed to create greater control and uniformity
relative to our dealership operating practices. We consolidated 13 operating platforms into
four operating regions, each led by a Regional Vice President reporting directly to me. Not
only were the savings associated with this change significant, but this regional operating struc-
ture also enabled us to further streamline our operations all the way down to the dealership
department level.
Consistent with our drive for greater operating uniformity, we selected ADP as the sole supplier
of our dealership management systems. This consolidates our dealership management computer
systems from three suppliers to one, generating significant cost savings, as well as establishing
a key element in our commonization strategy. By the end of 2006, we had nearly 90 percent of
our dealerships on the ADP system. Other important operating systems were also commonized
in 2006. This included our used vehicle management software system, which we completed
installing in the first quarter of 2006, with noticeable used car improvements already being
achieved as a result. We also implemented a common payroll system that is helping improve
the management of our most important asset, our people. Finally, we began the implementation
of a standard chart of accounts across all of our dealerships, which will enable us to benchmark
revenue and cost performance effectively, even when comparing a Ford dealership with a
BMW dealership.
We have much work to do in 2007 to further increase our operating efficiency, standardize our
operating practices and leverage the scale of our company, but a solid foundation for these
efforts has now been established.
// 02
“ The hard work of our team, and the implementation of our strategic initiatives, resulted in solid performance improvements during 2006.”
Although it is critical to standardize many of our operating practices
and increase our operating efficiency, we continue to place a high
degree of emphasis on the quality of our people. Entrepreneurial spirit
and local market knowledge are critical to success in automotive
retailing. One of the key personnel development practices we imple-
mented in 2006 was a focus on “promoting from within” at our Market
Director and dealership General Manager levels. This strategy provides
our top performers with greater career opportunities within the com-
pany, and our standardization of key operating practices enables this
by allowing us to more effectively move people within the Group 1
organization.
Continuing with the theme of the importance of people, we were also
able to dramatically strengthen our corporate headquarters team
during 2006. We promoted one of Group 1’s original team members,
Randy Callison, to Senior Vice President of Operations and Corporate
Development. This integrates our dealership acquisition and disposal
function with the organization responsible for operating our dealer-
ships under someone with the detailed knowledge of our company,
as well as the general automotive market in the United States. Our
other Senior Vice President, John Rickel, served his first full year as
Chief Financial Officer of Group 1 after a successful 21-year career
with Ford Motor Company. John came to Group 1 with experience
in automotive retailing and a broad background in corporate finance,
which enabled him to provide an immediate, significant impact on
our company.
We also added very experienced personnel as our General Counsel,
Vice President of Fixed Operations and Vice President of Purchasing,
which better prepares us to manage our fast-growing business.
On the subject of fast growing, we significantly increased the pace
of acquisitions in 2006. This, following a year of integrating and
improving our existing operations. In 2006, we acquired approxi-
mately $732 million in annualized revenues primarily in the area of
import and luxury brands.
On the disposition front, we disposed of dealerships with $198 million
of annualized revenues in 2006. These were dealerships that were not
generating adequate returns and were primarily domestic brand stores.
During 2006, as a result of the dealerships we acquired and disposed
of, our brand mix shifted to approximately 70 percent import and lux-
ury and 30 percent domestic from approximately 38 percent domes-
tic at the end of 2005. We have targeted to further increase this mix
to be at least 75 percent import/luxury by the end of 2007. This shift
should impact Group 1’s same-store new vehicle sales growth, which
has been relatively flat due to the declining performance of the key
domestic automotive brands in recent years and, in conjunction with
our continuing focus on used vehicles and parts and service, should
support better overall same-store results in the future.
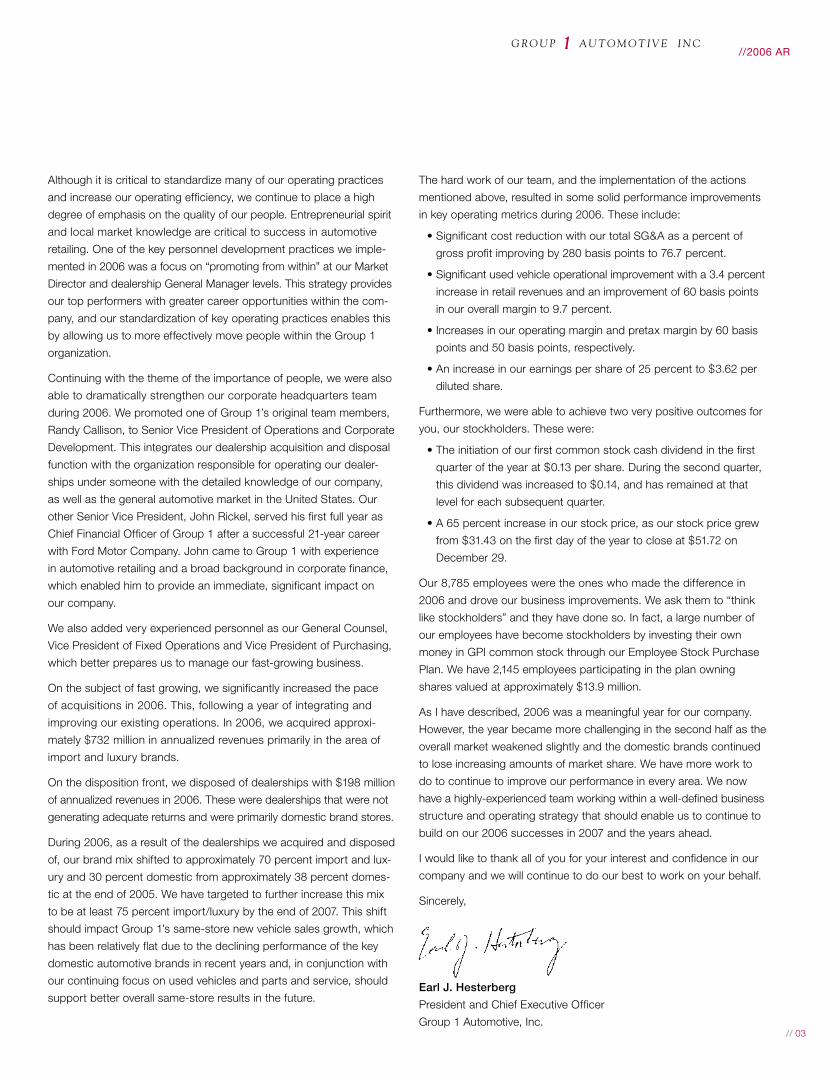
The hard work of our team, and the implementation of the actions
mentioned above, resulted in some solid performance improvements
in key operating metrics during 2006. These include:
• Significant cost reduction with our total SG&A as a percent of
gross profit improving by 280 basis points to 76.7 percent.
• Significant used vehicle operational improvement with a 3.4 percent
increase in retail revenues and an improvement of 60 basis points
in our overall margin to 9.7 percent.
• Increases in our operating margin and pretax margin by 60 basis
points and 50 basis points, respectively.
• An increase in our earnings per share of 25 percent to $3.62 per
diluted share.
Furthermore, we were able to achieve two very positive outcomes for
you, our stockholders. These were:
• The initiation of our first common stock cash dividend in the first
quarter of the year at $0.13 per share. During the second quarter,
this dividend was increased to $0.14, and has remained at that
level for each subsequent quarter.
• A 65 percent increase in our stock price, as our stock price grew
from $31.43 on the first day of the year to close at $51.72 on
December 29.
Our 8,785 employees were the ones who made the difference in
2006 and drove our business improvements. We ask them to “think
like stockholders” and they have done so. In fact, a large number of
our employees have become stockholders by investing their own
money in GPI common stock through our Employee Stock Purchase
Plan. We have 2,145 employees participating in the plan owning
shares valued at approximately $13.9 million.
As I have described, 2006 was a meaningful year for our company.
However, the year became more challenging in the second half as the
overall market weakened slightly and the domestic brands continued
to lose increasing amounts of market share. We have more work to
do to continue to improve our performance in every area. We now
have a highly-experienced team working within a well-defined business
structure and operating strategy that should enable us to continue to
build on our 2006 successes in 2007 and the years ahead.
I would like to thank all of you for your interest and confidence in our
company and we will continue to do our best to work on your behalf.
Sincerely,
Earl J. Hesterberg
President and Chief Executive Officer
Group 1 Automotive, Inc.// 03
//2006 AR
// 04
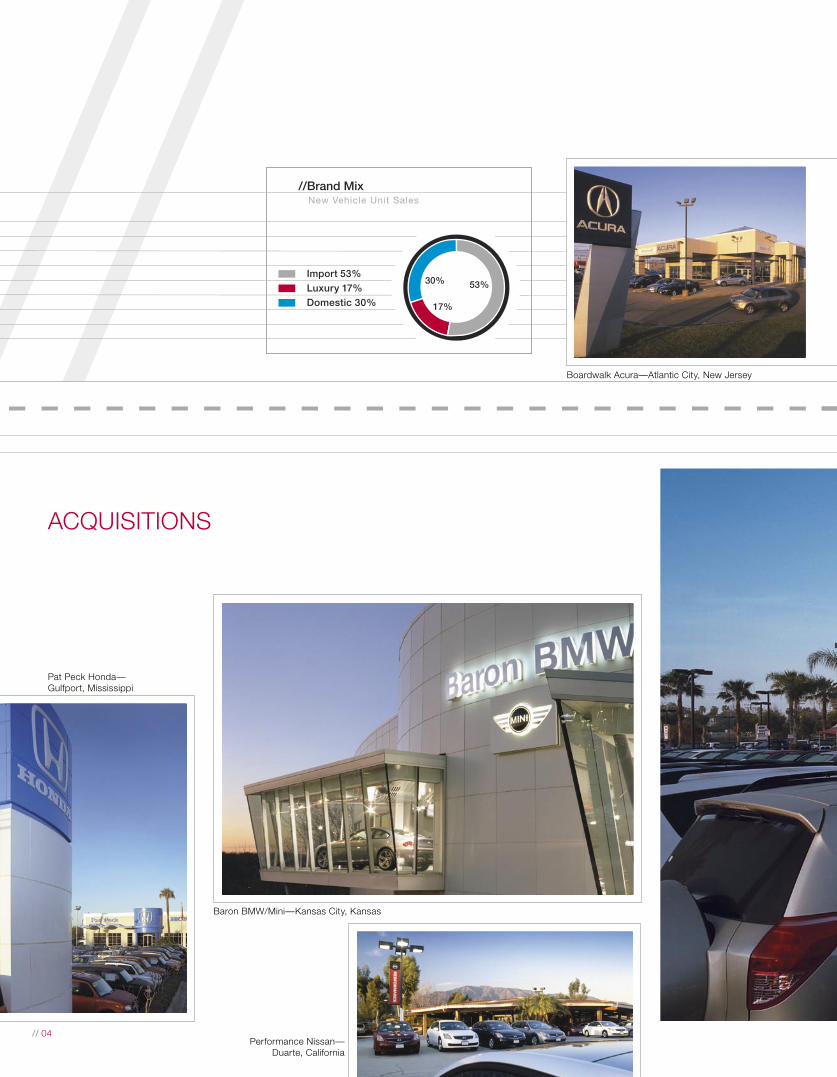
//ACQUISITIONS
Domestic 30%Luxury 17%Import 53%
//Brand Mix New Vehicle Unit Sales
53%
17%
30%
Baron BMW/Mini—Kansas City, Kansas
Pat Peck Honda— Gulfport, Mississippi
Boardwalk Acura—Atlantic City, New Jersey
Performance Nissan— Duarte, California
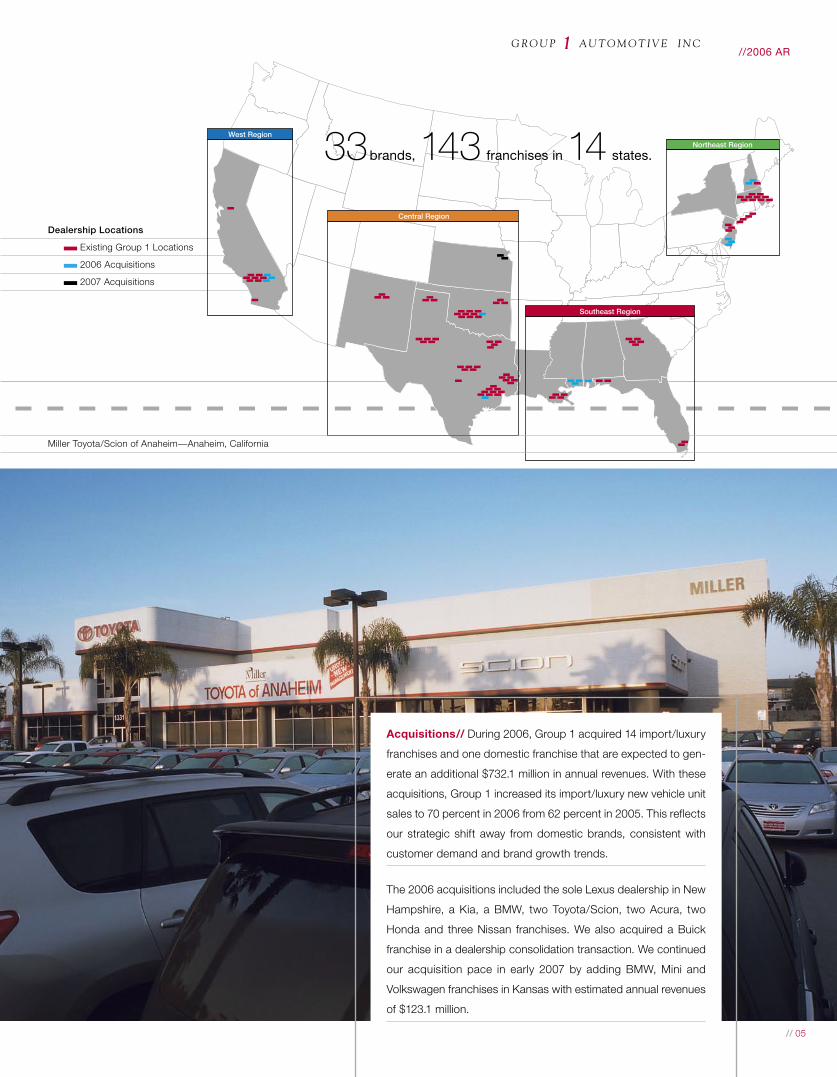
Dealership Locations
Existing Group 1 Locations
2006 Acquisitions
2007 Acquisitions
// 05
Northeast Region
Southeast Region
Central Region
West Region
Acquisitions// During 2006, Group 1 acquired 14 import/luxury
franchises and one domestic franchise that are expected to gen-
erate an additional $732.1 million in annual revenues. With these
acquisitions, Group 1 increased its import/luxury new vehicle unit
sales to 70 percent in 2006 from 62 percent in 2005. This reflects
our strategic shift away from domestic brands, consistent with
customer demand and brand growth trends.
The 2006 acquisitions included the sole Lexus dealership in New
Hampshire, a Kia, a BMW, two Toyota/Scion, two Acura, two
Honda and three Nissan franchises. We also acquired a Buick
franchise in a dealership consolidation transaction. We continued
our acquisition pace in early 2007 by adding BMW, Mini and
Volkswagen franchises in Kansas with estimated annual revenues
of $123.1 million.
33 brands, 143 franchises in 14 states.
Miller Toyota/Scion of Anaheim—Anaheim, California
//2006 AR
// 06
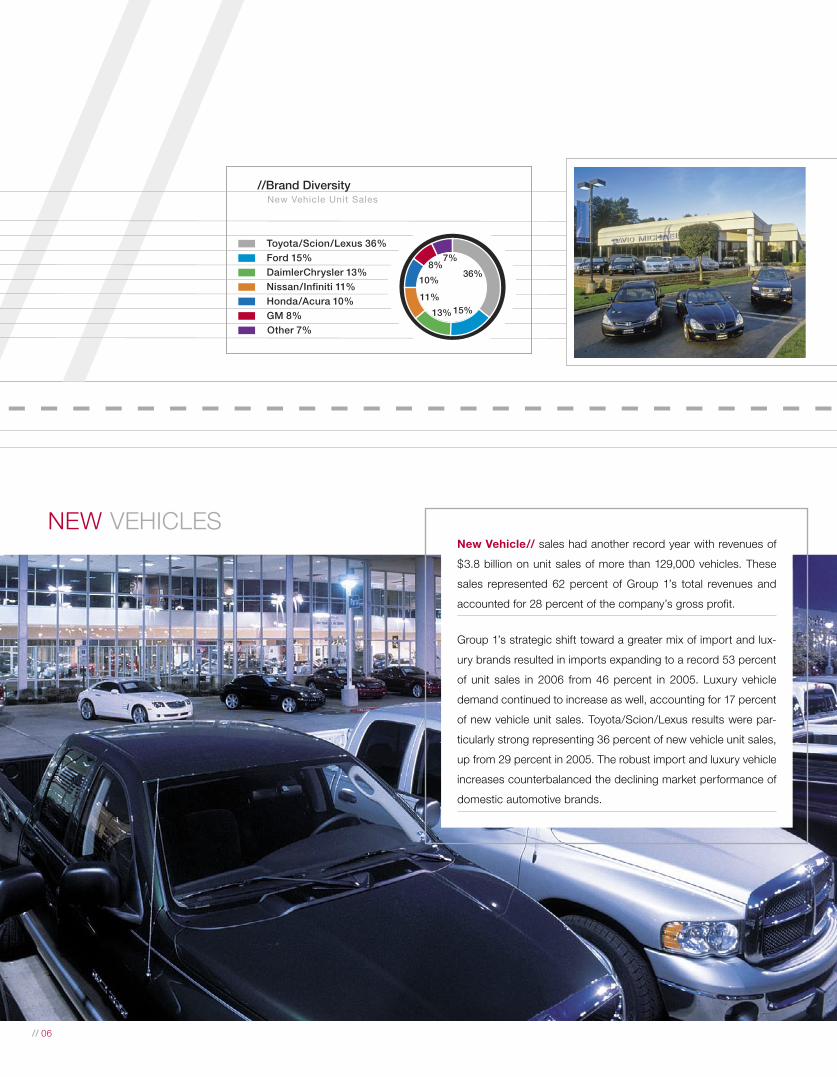
//NEW VEHICLES
New Vehicle// sales had another record year with revenues of
$3.8 billion on unit sales of more than 129,000 vehicles. These
sales represented 62 percent of Group 1’s total revenues and
accounted for 28 percent of the company’s gross profit.
Group 1’s strategic shift toward a greater mix of import and lux-
ury brands resulted in imports expanding to a record 53 percent
of unit sales in 2006 from 46 percent in 2005. Luxury vehicle
demand continued to increase as well, accounting for 17 percent
of new vehicle unit sales. Toyota/Scion/Lexus results were par-
ticularly strong representing 36 percent of new vehicle unit sales,
up from 29 percent in 2005. The robust import and luxury vehicle
increases counterbalanced the declining market performance of
domestic automotive brands.
//Brand Diversity New Vehicle Unit Sales
10%36%
7%8%
15%13%
11%Nissan/Infiniti 11%DaimlerChrysler 13%Ford 15%Toyota/Scion/Lexus 36%
Honda/Acura 10%GM 8%Other 7%
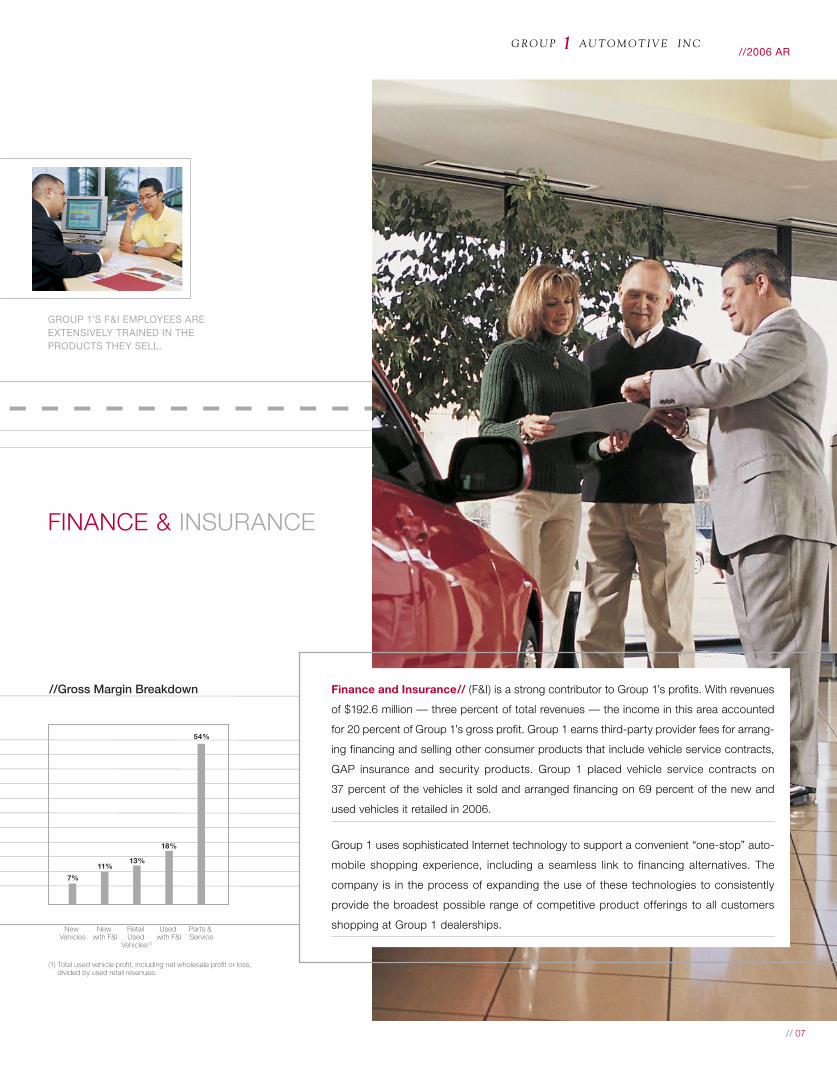
54%
18%
13%11%
7%
//Gross Margin Breakdown
New Vehicles
(1) Total used vehicle profit, including net wholesale profit or loss, divided by used retail revenues.
New with F&I
Used with F&I
Parts & Service
Retail Used
Vehicles(1)
0
10
20
30
40
50
60
// 07
FINANCE & INSURANCE
Finance and Insurance// (F&I) is a strong contributor to Group 1’s profits. With revenues
of $192.6 million — three percent of total revenues — the income in this area accounted
for 20 percent of Group 1’s gross profit. Group 1 earns third-party provider fees for arrang-
ing financing and selling other consumer products that include vehicle service contracts,
GAP insurance and security products. Group 1 placed vehicle service contracts on
37 percent of the vehicles it sold and arranged financing on 69 percent of the new and
used vehicles it retailed in 2006.
Group 1 uses sophisticated Internet technology to support a convenient “one-stop” auto-
mobile shopping experience, including a seamless link to financing alternatives. The
company is in the process of expanding the use of these technologies to consistently
provide the broadest possible range of competitive product offerings to all customers
shopping at Group 1 dealerships.
GROUP 1’S F&I EMPLOYEES ARE EXTENSIVELY TRAINED IN THE PRODUCTS THEY SELL.
//2006 AR
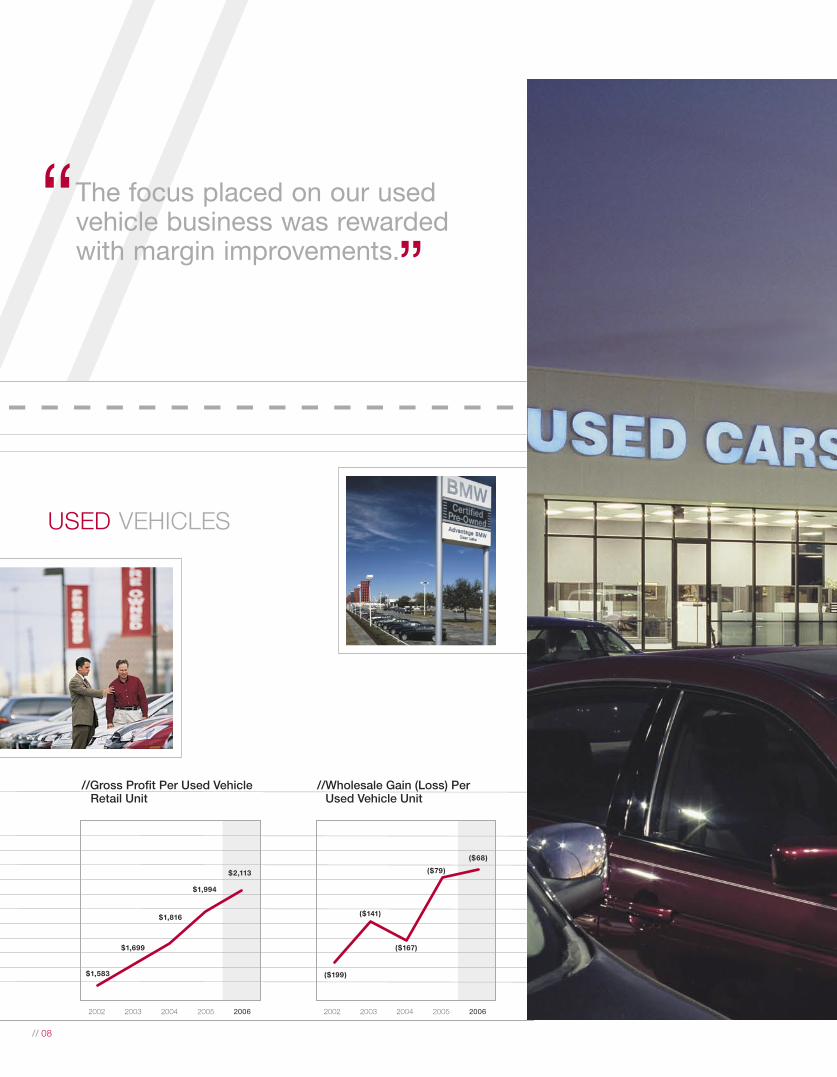
20062005200420032002
$2,113
20062005200420032002
//Gross Profit Per Used Vehicle Retail Unit
($68)
//Wholesale Gain (Loss) Per Used Vehicle Unit
20062005200420032002
$2,113$1,994
$1,816
$1,699$1,583
//Used Vehicle Gross Profit Per Retail Unit
20062005200420032002
($68)($79)
($167)
($141)
($199)
//Used Vehicle Wholesale Gain (Loss) Per Unit
1500
1625
1750
1875
2000
2125
2250
2375
2500
0
500
1000
1500
2000
2500
0
50
100
150
200
250
-250
-200
-150
-100
-50
0
$1,994
$1,816
$1,699
$1,583
($79)
($167)
($141)
($199)
//“ The focus placed on our used vehicle business was rewarded with margin improvements.”
USED VEHICLES
// 08
// 09
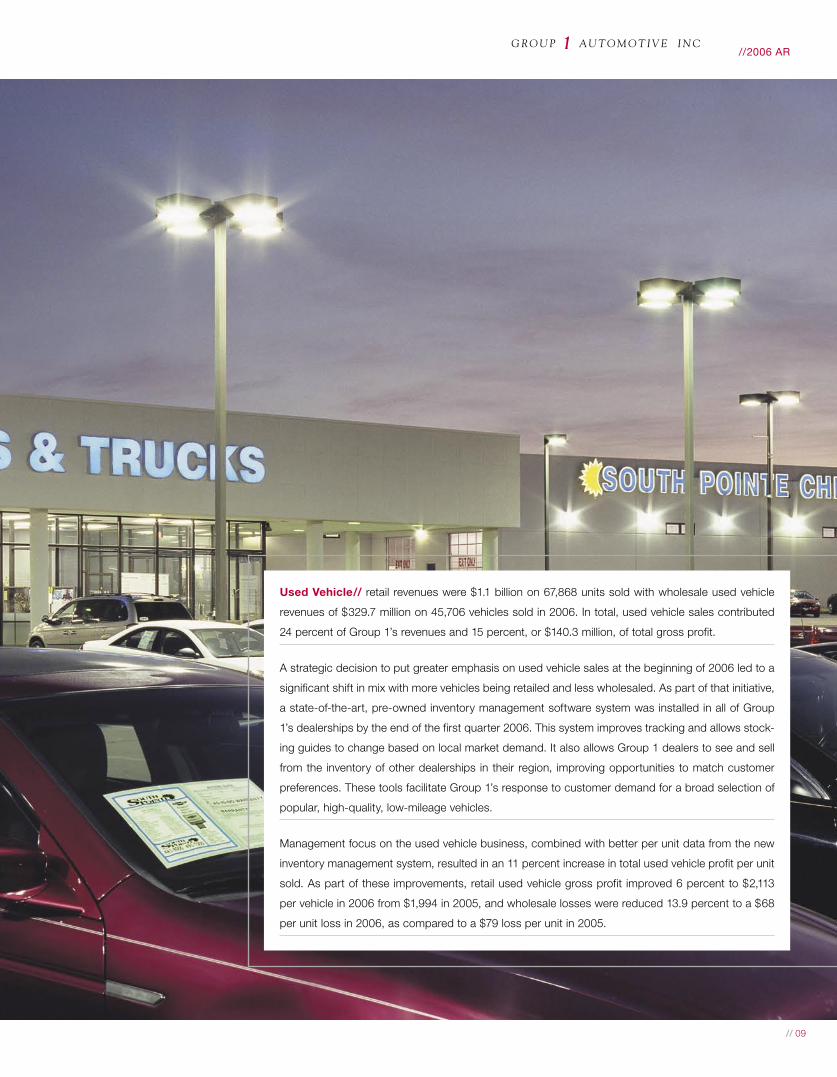
Used Vehicle// retail revenues were $1.1 billion on 67,868 units sold with wholesale used vehicle
revenues of $329.7 million on 45,706 vehicles sold in 2006. In total, used vehicle sales contributed
24 percent of Group 1’s revenues and 15 percent, or $140.3 million, of total gross profit.
A strategic decision to put greater emphasis on used vehicle sales at the beginning of 2006 led to a
significant shift in mix with more vehicles being retailed and less wholesaled. As part of that initiative,
a state-of-the-art, pre-owned inventory management software system was installed in all of Group
1’s dealerships by the end of the first quarter 2006. This system improves tracking and allows stock-
ing guides to change based on local market demand. It also allows Group 1 dealers to see and sell
from the inventory of other dealerships in their region, improving opportunities to match customer
preferences. These tools facilitate Group 1’s response to customer demand for a broad selection of
popular, high-quality, low-mileage vehicles.
Management focus on the used vehicle business, combined with better per unit data from the new
inventory management system, resulted in an 11 percent increase in total used vehicle profit per unit
sold. As part of these improvements, retail used vehicle gross profit improved 6 percent to $2,113
per vehicle in 2006 from $1,994 in 2005, and wholesale losses were reduced 13.9 percent to a $68
per unit loss in 2006, as compared to a $79 loss per unit in 2005.
//2006 AR
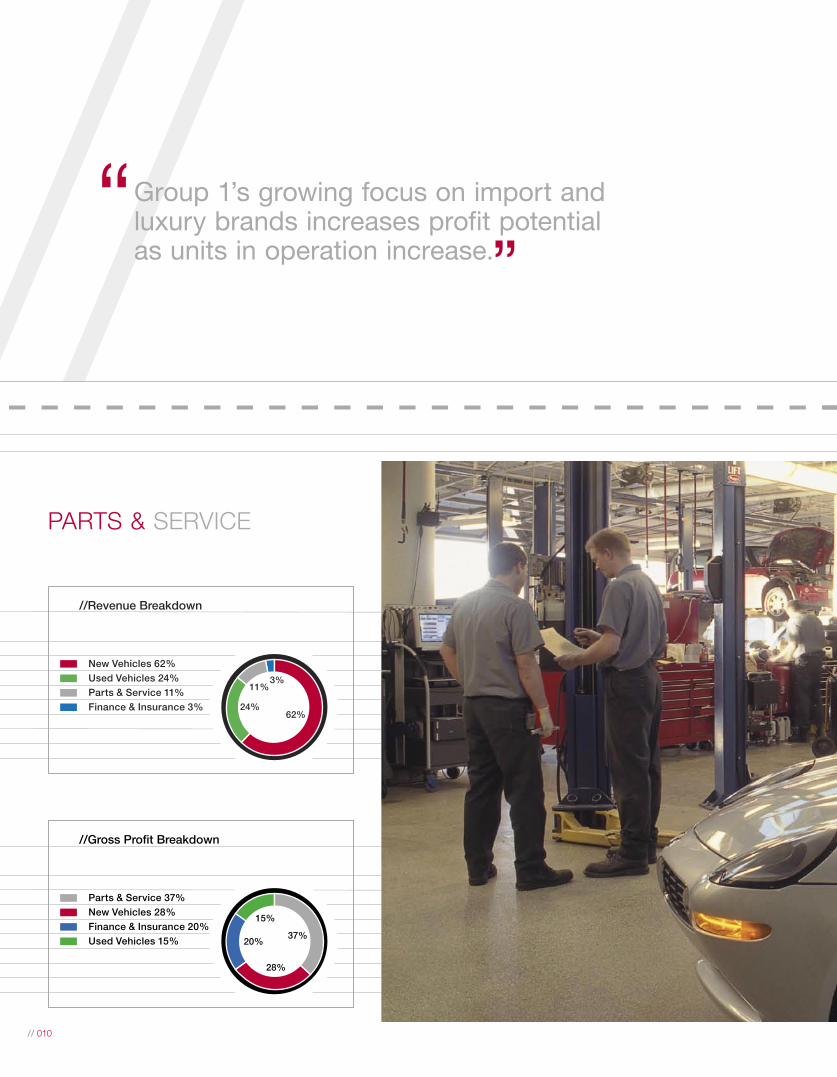
//Revenue Breakdown
Finance & Insurance 3%Parts & Service 11%Used Vehicles 24%New Vehicles 62%
62%
3%11%
24%
//Gross Profit Breakdown
Used Vehicles 15%Finance & Insurance 20%New Vehicles 28%Parts & Service 37%
37%
15%
20%
28%
// 010
//“ Group 1’s growing focus on import and luxury brands increases profit potential as units in operation increase.”
PARTS & SERVICE
// 011
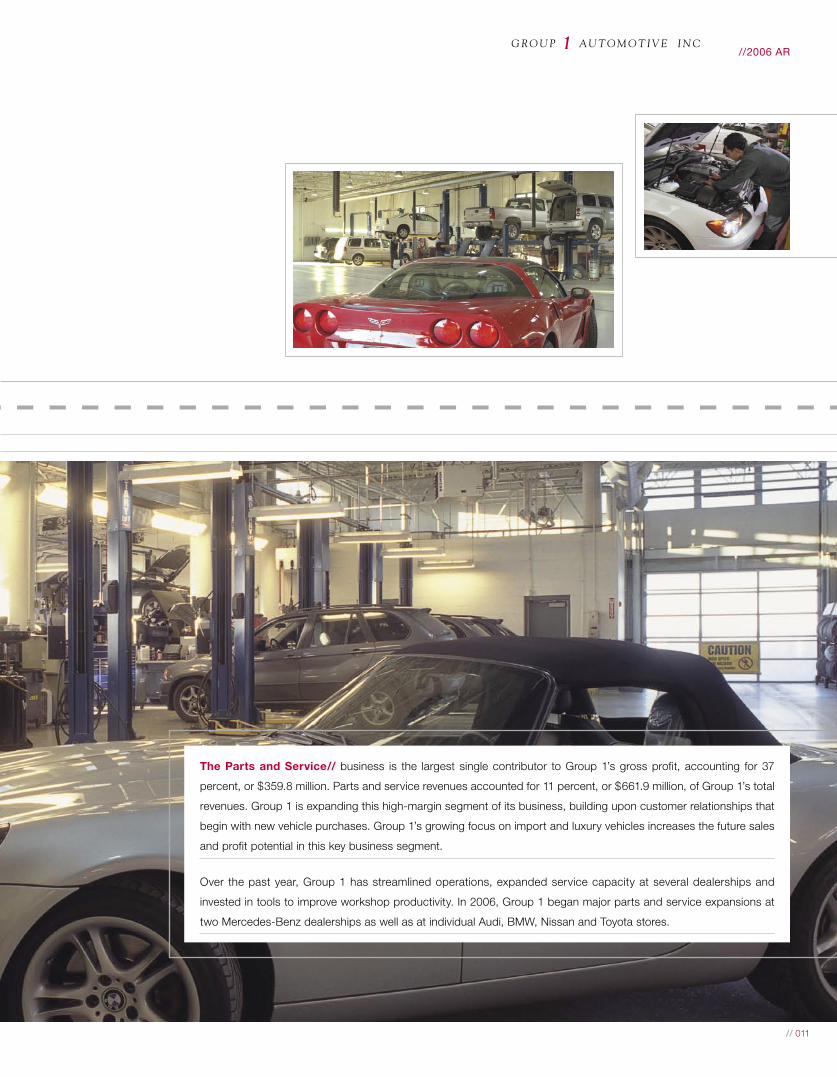
The Parts and Service// business is the largest single contributor to Group 1’s gross profit, accounting for 37
percent, or $359.8 million. Parts and service revenues accounted for 11 percent, or $661.9 million, of Group 1’s total
revenues. Group 1 is expanding this high-margin segment of its business, building upon customer relationships that
begin with new vehicle purchases. Group 1’s growing focus on import and luxury vehicles increases the future sales
and profit potential in this key business segment.
Over the past year, Group 1 has streamlined operations, expanded service capacity at several dealerships and
invested in tools to improve workshop productivity. In 2006, Group 1 began major parts and service expansions at
two Mercedes-Benz dealerships as well as at individual Audi, BMW, Nissan and Toyota stores.
//2006 AR
//// 012
www.Group1Auto.com
LEADERSHIP IN MANAGEMENT
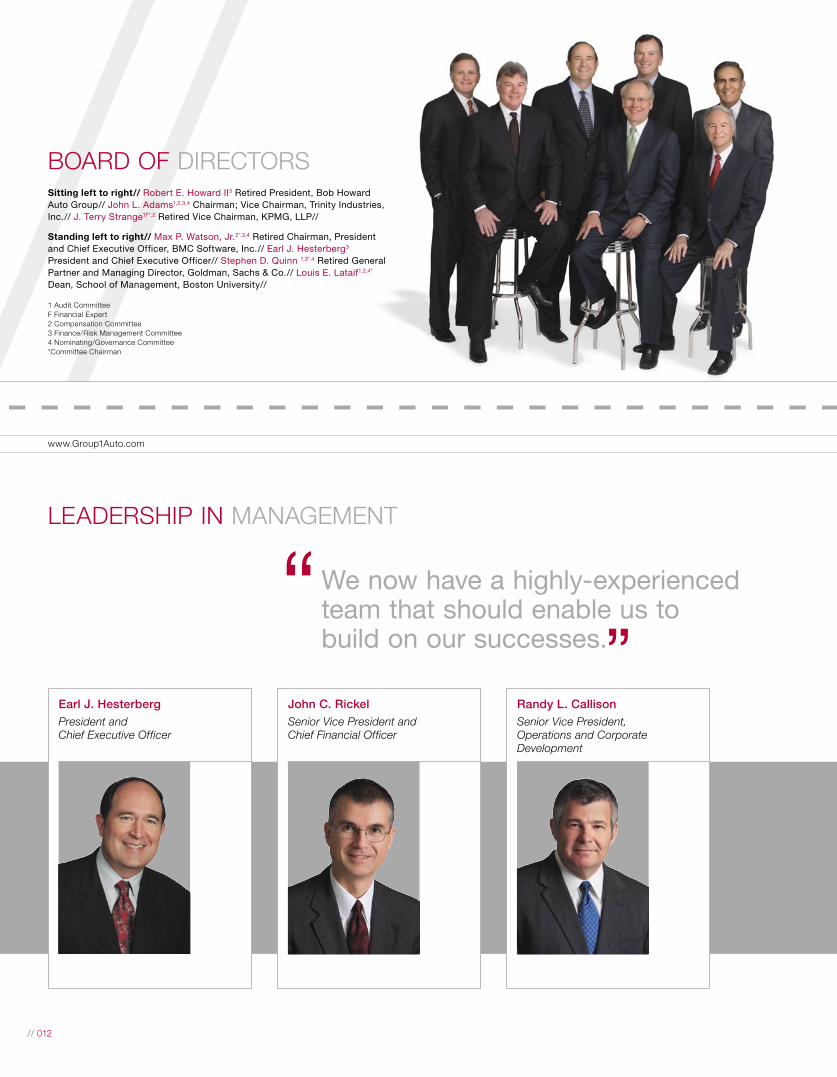
BOARD OF DIRECTORS
“ We now have a highly-experienced team that should enable us to build on our successes.”
Earl J. HesterbergPresident and Chief Executive Officer
John C. RickelSenior Vice President and Chief Financial Officer
Randy L. CallisonSenior Vice President, Operations and Corporate Development
Sitting left to right// Robert E. Howard II3 Retired President, Bob Howard Auto Group// John L. Adams1,2,3,4 Chairman; Vice Chairman, Trinity Industries, Inc.// J. Terry Strange1F*,2 Retired Vice Chairman, KPMG, LLP//
Standing left to right// Max P. Watson, Jr.2*,3,4 Retired Chairman, President and Chief Executive Officer, BMC Software, Inc.// Earl J. Hesterberg3 President and Chief Executive Officer// Stephen D. Quinn 1,3*,4 Retired General Partner and Managing Director, Goldman, Sachs & Co.// Louis E. Lataif1,2,4* Dean, School of Management, Boston University//
1 Audit CommitteeF Financial Expert2 Compensation Committee3 Finance/Risk Management Committee4 Nominating/Governance Committee *Committee Chairman
// 013
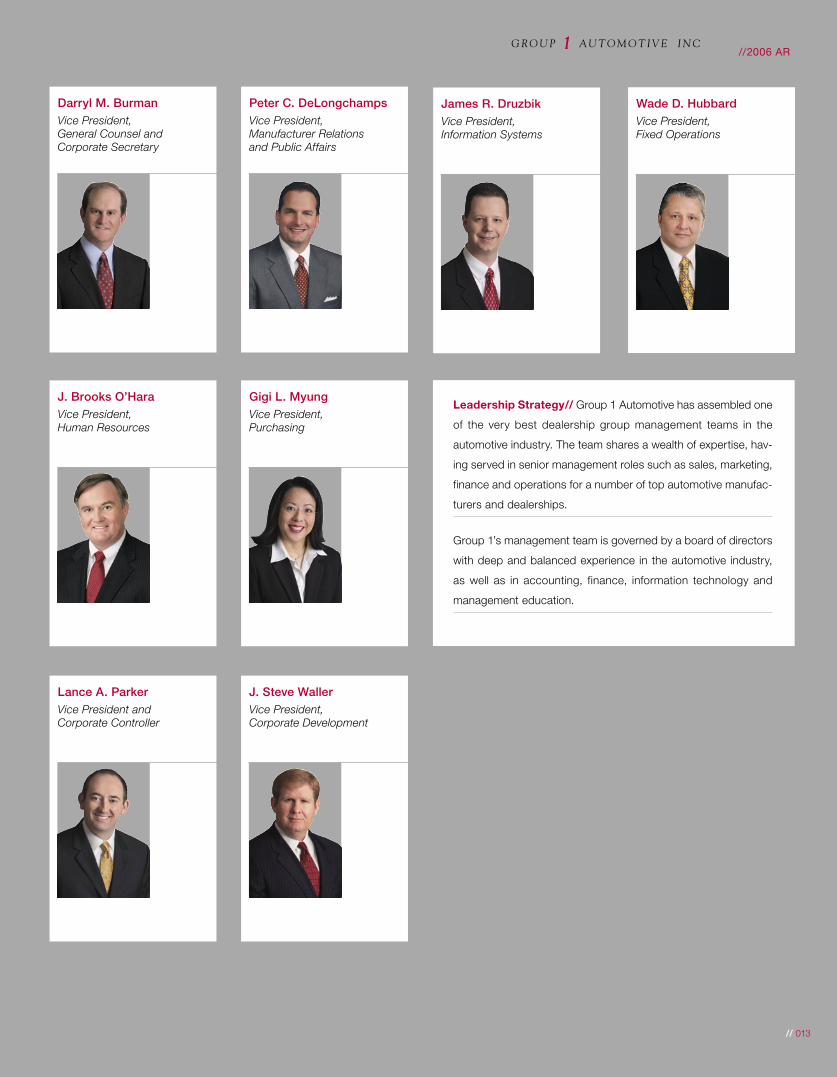
Darryl M. BurmanVice President, General Counsel and Corporate Secretary
Peter C. DeLongchampsVice President, Manufacturer Relations and Public Affairs
J. Brooks O’HaraVice President, Human Resources
Gigi L. MyungVice President, Purchasing
James R. DruzbikVice President, Information Systems
Lance A. ParkerVice President and Corporate Controller
J. Steve WallerVice President, Corporate Development
Leadership Strategy// Group 1 Automotive has assembled one
of the very best dealership group management teams in the
automotive industry. The team shares a wealth of expertise, hav-
ing served in senior management roles such as sales, marketing,
finance and operations for a number of top automotive manufac-
turers and dealerships.
Group 1’s management team is governed by a board of directors
with deep and balanced experience in the automotive industry,
as well as in accounting, finance, information technology and
management education.
Wade D. HubbardVice President, Fixed Operations
//2006 AR
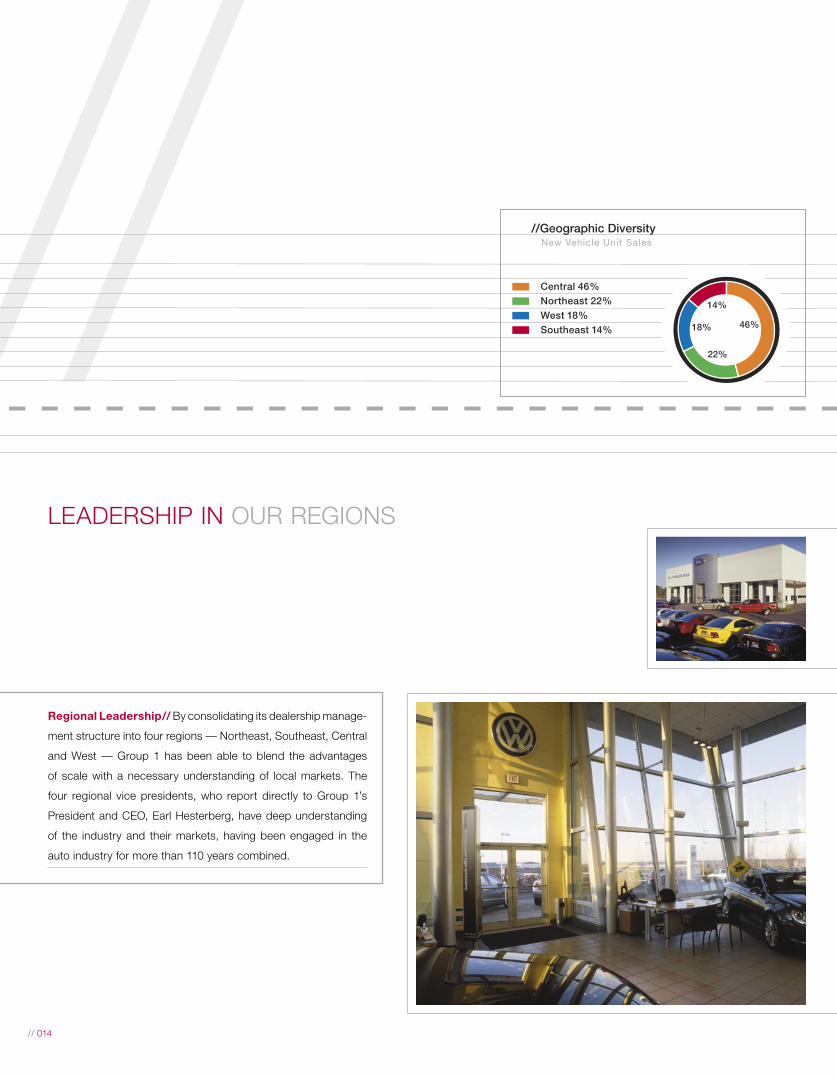
// //Geographic Diversity New Vehicle Unit Sales
Southeast 14%West 18%Northeast 22%Central 46%
46%
14%
18%
22%
// 014
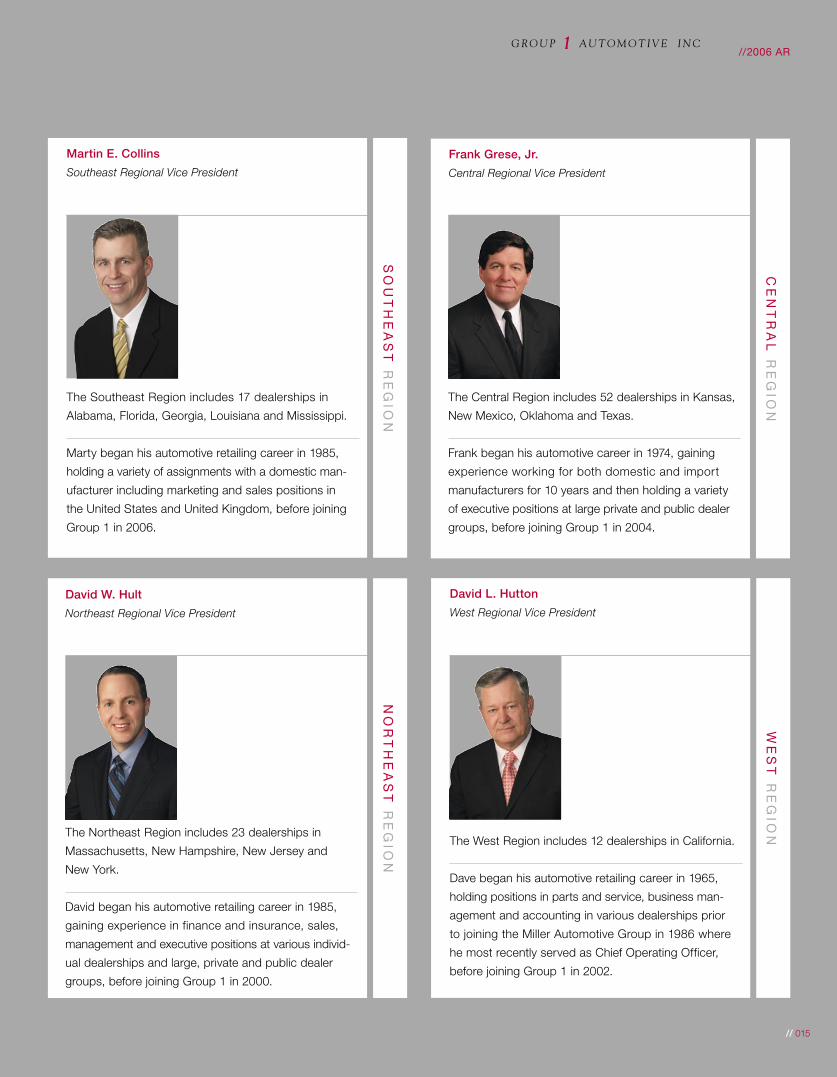
Regional Leadership// By consolidating its dealership manage-
ment structure into four regions — Northeast, Southeast, Central
and West — Group 1 has been able to blend the advantages
of scale with a necessary understanding of local markets. The
four regional vice presidents, who report directly to Group 1’s
President and CEO, Earl Hesterberg, have deep understanding
of the industry and their markets, having been engaged in the
auto industry for more than 110 years combined.
LEADERSHIP IN OUR REGIONS
//Geographic Diversity New Vehicle Unit Sales
Southeast 14%West 18%Northeast 22%Central 46%
46%
14%
18%
22%
// 015
SO
UT
HE
AS
T R
EG
ION
Martin E. Collins
Southeast Regional Vice President
The Central Region includes 52 dealerships in Kansas,
New Mexico, Oklahoma and Texas.
Frank began his automotive career in 1974, gaining
experience working for both domestic and import
manufacturers for 10 years and then holding a variety
of executive positions at large private and public dealer
groups, before joining Group 1 in 2004.
CE
NT
RA
L R
EG
ION
Frank Grese, Jr.
Central Regional Vice President
The West Region includes 12 dealerships in California.
Dave began his automotive retailing career in 1965,
holding positions in parts and service, business man-
agement and accounting in various dealerships prior
to joining the Miller Automotive Group in 1986 where
he most recently served as Chief Operating Officer,
before joining Group 1 in 2002.
WE
ST
RE
GIO
N
David L. Hutton
West Regional Vice President
The Southeast Region includes 17 dealerships in
Alabama, Florida, Georgia, Louisiana and Mississippi.
Marty began his automotive retailing career in 1985,
holding a variety of assignments with a domestic man-
ufacturer including marketing and sales positions in
the United States and United Kingdom, before joining
Group 1 in 2006.
The Northeast Region includes 23 dealerships in
Massachusetts, New Hampshire, New Jersey and
New York.
David began his automotive retailing career in 1985,
gaining experience in finance and insurance, sales,
management and executive positions at various individ-
ual dealerships and large, private and public dealer
groups, before joining Group 1 in 2000.
NO
RT
HE
AS
T R
EG
ION
David W. Hult
Northeast Regional Vice President
//2006 AR
020406080
100120140160180200
0
20
40
60
80
100
120
140
160
180
$200
2001 2002 2003 2004 2005 2006
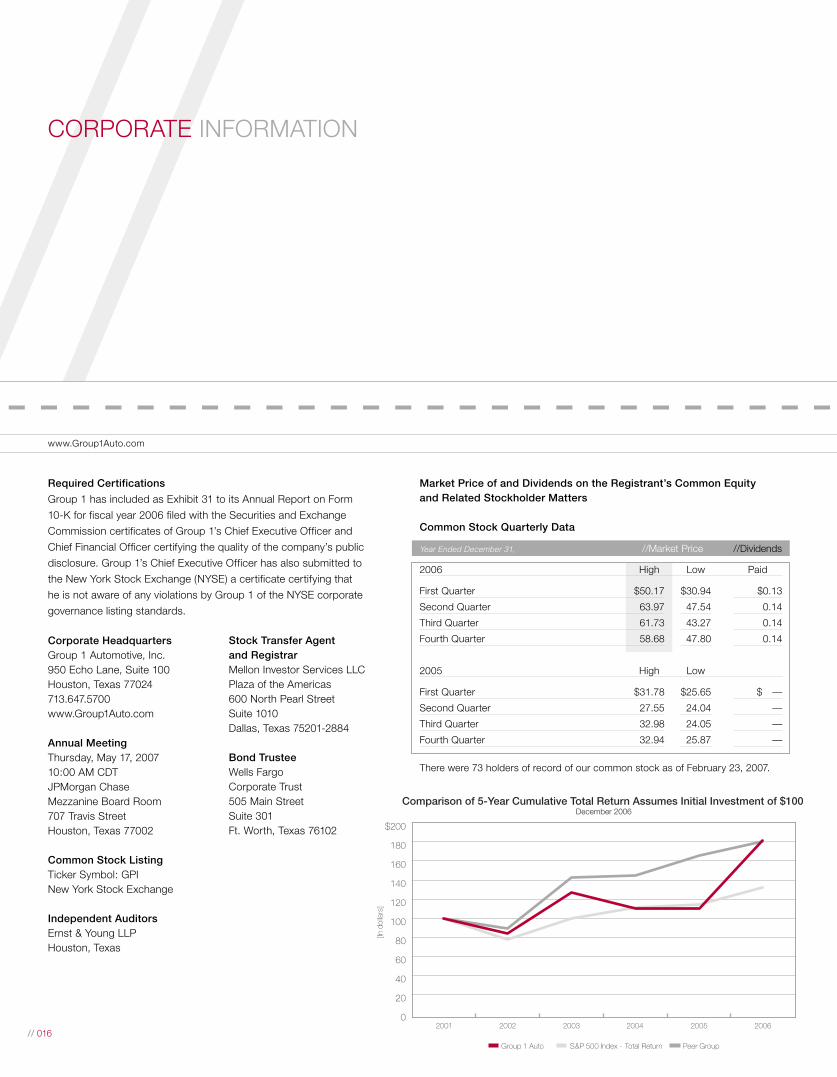
Comparison of 5-Year Cumulative Total Return Assumes Initial Investment of $100December 2006
Peer GroupS&P 500 Index - Total ReturnGroup 1 Auto
[In d
olla
rs]
//www.Group1Auto.com
// 016
CORPORATE INFORMATION
Market Price of and Dividends on the Registrant’s Common Equity and Related Stockholder Matters
Common Stock Quarterly Data
Year Ended December 31, //Market Price //Dividends
2006 High Low Paid
First Quarter $50.17 $30.94 $0.13
Second Quarter 63.97 47.54 0.14
Third Quarter 61.73 43.27 0.14
Fourth Quarter 58.68 47.80 0.14
2005 High Low
First Quarter $31.78 $25.65 $ —
Second Quarter 27.55 24.04 —
Third Quarter 32.98 24.05 —
Fourth Quarter 32.94 25.87 —
There were 73 holders of record of our common stock as of February 23, 2007.
Corporate Headquarters Group 1 Automotive, Inc. 950 Echo Lane, Suite 100 Houston, Texas 77024 713.647.5700 www.Group1Auto.com
Annual Meeting Thursday, May 17, 2007 10:00 AM CDT JPMorgan Chase Mezzanine Board Room 707 Travis Street Houston, Texas 77002
Common Stock Listing Ticker Symbol: GPI New York Stock Exchange
Independent Auditors Ernst & Young LLP Houston, Texas
Stock Transfer Agent and Registrar Mellon Investor Services LLC Plaza of the Americas 600 North Pearl Street Suite 1010 Dallas, Texas 75201-2884
Bond Trustee Wells Fargo Corporate Trust 505 Main Street Suite 301 Ft. Worth, Texas 76102
Required Certifications
Group 1 has included as Exhibit 31 to its Annual Report on Form
10-K for fiscal year 2006 filed with the Securities and Exchange
Commission certificates of Group 1’s Chief Executive Officer and
Chief Financial Officer certifying the quality of the company’s public
disclosure. Group 1’s Chief Executive Officer has also submitted to
the New York Stock Exchange (NYSE) a certificate certifying that
he is not aware of any violations by Group 1 of the NYSE corporate
governance listing standards.

www.Group1Auto.com
de
sig
ned
by
curr
an &
co
nno
rs, i
nc. /
ww
w.c
urra
n-c
onn
ors
.co
m

//2006 Annual Report////////// //////////CORPORATE HEADQUARTERS//
GROUP 1 AUTOMOTIVE, INC. 950 ECHO LANE, SUITE 100 // HOUSTON, TEXAS 77024
713.647.5700
WWW.GROUP1AUTO.COM
////////
www.Group1Auto.com