Government of Kenya THE 2021 LONG RAINS SEASON ASSESSMENT REPORT Kenya Food Security Steering Group (KFSSG) Collaborative report of the Kenya Food Security Steering Group (KFSSG): Ministries of Devolution and ASALs; Agriculture, Livestock and Fisheries; Water and Irrigation; Health; and Education, Science and Technology; the National Drought Management Authority (NDMA), WFP, FEWS NET, UNICEF, FAO, World Vision, ACF, and Arid and Semi-Arid Lands (ASAL) County Steering Groups (CSGs): with financial support from the Government of Kenya (NDMA), WFP, UNICEF and partners. August 2021

Welcome message from author
This document is posted to help you gain knowledge. Please leave a comment to let me know what you think about it! Share it to your friends and learn new things together.
Transcript

Government of Kenya
THE 2021 LONG RAINS SEASON ASSESSMENT REPORT
Kenya Food Security Steering Group (KFSSG)
Collaborative report of the Kenya Food Security Steering Group (KFSSG): Ministries of Devolution and ASALs; Agriculture, Livestock and Fisheries; Water and Irrigation; Health; and Education, Science and
Technology; the National Drought Management Authority (NDMA), WFP, FEWS NET, UNICEF, FAO, World
Vision, ACF, and Arid and Semi-Arid Lands (ASAL) County Steering Groups (CSGs): with financial support from the Government of Kenya (NDMA), WFP, UNICEF and partners.
August 2021

2
Contents
Acronyms ................................................................................................................................... 3
EXECUTIVE SUMMARY ....................................................................................................... 4
1.0 Introduction ........................................................................................................................ 17
1.1 Assessment Coverage and Objectives ....................................................................... 17
1.2 Methodological Approach ......................................................................................... 17
2.0 Food and Nutrition Security Analysis by Livelihood Cluster ........................................... 18
2.1 The Pastoral North-West Livelihood Cluster ............................................................ 18
2.3 The Agro Pastoral Livelihood Cluster ...................................................................... 42
2.4 The South Eastern Marginal Agricultural Livelihood Cluster .................................. 55
2.5 The Coastal Marginal Agricultural Livelihood Cluster ............................................ 66
3.0 Food Security Prognosis .................................................................................................... 81
3.1 Assumptions ................................................................................................................... 81
3.2 Food security Prognosis (August 2021 – January 2022)................................................ 82
4.0 Proposed Sectoral Interventions ........................................................................................ 84
4.1 Agriculture Sector: Priority Interventions (August 2021 – Feb 2022)........................... 84
4.2 Livestock Sector: Priority Interventions (August 2021 – Feb 2022) ............................. 84
4.3 Water Sector: Priority Interventions (August 2021 – Feb 2022) ................................... 84
4.4 Health and Nutrition Sector: Priority Interventions (August 2021 – Feb 2022) ............ 85
4.5 Education Sector: Priority Interventions (August 2021 – Feb 2022) ............................. 85
4.6 Food Assistance Sector: Priority Interventions (August 2021 – Feb 2022) ................... 85
4.7 Peace and Security Sector: Priority Interventions (August 2021 – Feb 2022)............... 85

3
Acronyms
CBPP Contagious Bovine Pleuro-pneumonia
CCPP Contagious Caprine Pleuro-pneumonia
CSG County Steering Group
CSI Coping Strategy Index
CSMP Community School Meals Programme
ECD Early Childhood Development
ESMP Expanded School Meals Programme
FEWSNET Famine Early Warning System Network
FMD Foot and Mouth Disease
FNSA Food and Nutrition Security Assessment
GAM Global Acute Malnutrition
HGSMP Home Grown School Meals Programme
IPC Integrated Phase Classification
KFSSG Kenya Food Security Steering Group
KNBS Kenya National Bureau of Statistics
LSD Lumpy Skin Disease
LTA Long-Term Average
MAM Moderate Acute Malnutrition
MUAC Mid-Upper Arm Circumference
NDMA National Drought Management Authority
PPR Peste des Petits Ruminants
RSMP Regular School Meals Programme
SAM Severe Acute Malnutrition
SDA State Department of Agriculture
TLU Tropical Livestock Unit
ToT Terms of Trade
URTI Upper Respiratory Tract Infection
WFP World Food Programme
WHZ Weight for Height Z-score

4
EXECUTIVE SUMMARY
I. Introduction
The Kenya Food and Nutrition Security Assessment (FNSA) is a multi-agency, multi-sectoral
exercise led by the government of Kenya, and is conducted in 23 arid and semi-arid (ASAL)
counties. The assessment is carried out by the Kenya Food Security Steering Group (KFSSG) in collaboration with the respective County Steering Groups (CSGs). The KFSSG is a multi-
agency body comprised of government departments, United Nation (UN) agencies and Non-Governmental Organizations (NGO) concerned with food and nutrition security and is chaired
by the National Drought Management Authority (NDMA) and co-chaired by the World Food
Programme (UN WFP). Food security/insecurity in the country is highly dependent of rainfall. Given that the rainfall is bimodal in the ASAL counties, the assessments are conducted bi-
annually, after the short rains of October to December and the long rains of March to May. The 2021 Long Rains Assessment was conducted between 6th July and 12th August 2021.
II. Objective
The main objective of the assessment was to determine the impacts of the 2021 long rains on
food and nutrition security in 23 ASAL counties. The assessment also considered the
cumulative effects of previous seasons and impacts of other shocks and hazards including
COVID-19 pandemic on food security.
III. Methodology
The food security/insecurity analysis focused on acute food insecurity, but also considered
other chronic issues that had direct impacts on food security. The assessment was centered on
the four pillars of food security: food availability, food access, utilization and stability. The contributing factors and outcomes and their effects on the key sectors of agriculture, livestock,
water, health and nutrition, education, peace and security, and markets and trade were also considered. The assessment also identified interventions to address the issues arising in each
sector.
The assessment covered the 23 counties that comprise the ASAL region of Kenya, and whose population is generally the most food insecure given their high levels poverty, high
vulnerability to shock and hazards, and the of aridity and rainfall variability of the areas. The area covers approximately 88 percent of Kenya’s landmass, and for the purposes of the
assessment is classified into various livelihood zones grouped into five clusters; Pastoral North-
West, comprising Turkana, Samburu and Marsabit; Pastoral North-East, comprising Wajir, Garissa, Isiolo, Tana River and Mandera; South-East Marginal Agriculture, comprised of Kitui,
Makueni, Tharaka Nithi, Embu, and Meru; Coastal Marginal Agriculture, comprising Kilifi, Kwale, Taita Taveta and Lamu; and the Agro-pastoral cluster of Baringo, Narok, Kajiado, West
Pokot, Laikipia and the northern part of Nyeri county (Kieni sub-county). The main livelihood
activities in these clusters are Pastoralism, Agro-pastoralism, Mixed Farming, Marginal Mixed Farming and some Irrigated Cropping, and these form the unit of analysis.
The assessment involved the collection of both primary and secondary data. The principal sources were: (i) the NDMA’s drought early warning and monitoring system; (ii) data collected
from the relevant sectors at county and sub-county level; (iii) community interviews and market
interviews using focus group discussions and trader interviews; (iv) secondary data from nutrition surveys (SMART surveys); (v) field observations during transect drives; and (vi)
agro-climatic data from FEWS NET.

5
The Acute Integrated Food Security Phase Classification (IPC Version 3) was used for the analysis. The IPC is a standard global tool for classifying the severity of food insecurity and
ensures that best practice is being applied. IPC Acute Malnutrition analysis was also carried out to understand both the food and non-food causes of malnutrition.
IV. Drivers of Food and Nutrition Security
Rainfall Performance
Across the country, the 2021 March to May long rains were mixed across the country. In the
western, north-western, central, southwestern, parts of the southeast of the country and
Mandera county, the rains were mostly 91 – 110 percent of normal with western and parts of Mandera, Turkana, Kitui, Narok and West Pokot receiving amounts between 111 – 140 percent
of normal. Across the eastern and southern parts of the country the rains received were 51 – 75 percent of normal with some few areas receiving 76 -90 percent of normal however, Lamu and
parts of Turkana, Marsabit, Samburu, Isiolo, Wajir, Garissa, Tana River, Kilifi and Taita
Taveta counties received amounts that were 26 – 50 percent of normal rainfall. The rainfall onset was timely in the western parts of the country however in the eastern parts of the country,
the rainfall onset varied from 1 – 2 dekads late was three to over four dekads late in parts of Marsabit, Samburu, Isiolo, Marakwet, Baringo, Laikipa, Isiolo, Garissa, Kitui, Machakos,
Makueni, Kajiado, Tana River, Kilifi, Lamu, Kwale and Taita Taveta. The rains were poorly
distributed in space and time particularly where below average rainfall was received significantly affecting cropping both livestock and crop production.
The COVID – 19 Pandemic
As of August 23, Kenya has registered 229, 628 confirmed cases, 213, 473 recoveries and 4,
528 fatalities. In the month of August, the positivity rate has remained between 10-15 percent. Nairobi, Kiambu and Nakuru counties continue to record a high number of infections. As a
result of the consistently high number of confirmed cases, the President issued a number of
directives which were; Extension of the 10pm to 4am curfew for a further 60 days, Extension on the ban on political rallies, meetings and gatherings for 60 days, Announcement of protocols
for under which funerals, social gatherings, religious worship services, bars and restaurants are
Figure 1.1: March to May long rains as a percent of normal Figure 1.2. Rainfall onset anomaly

6
to operate/be carried out under and a directive requiring all civil servants to be vaccinated against COVID-19 by August 23.
In the ASALs, the COVID-19 pandemic related restrictions continue to disrupt markets in the county therefore adversely impacting food security. In Mandera and Marsabit, to control cross
border spread of the disease, cross-border movement of goods and people with Somalia and
Ethiopia was restricted which has constrained volumes of commodities and resulted in higher prices. The enforcement of social distancing measures has restricted the communal
performance of agricultural activities and availability of casual labor opportunities reducing the amount of land cultivated and projected crop production. Disrupted market functioning
affected the supply of agricultural inputs constraining production activities while the disruption
of supply of staple food commodities and livestock has led to increased volatility of prices impacting household food access and income. The pandemic has also affected the school
calendar and relevant school feeding programmes, impacted the health sector leading to a reduction in health-seeking, under-utilization of static health facilities, reduced health services
like outreaches due to re-allocation of resources towards efforts to curb the virus. In the urban
areas, poor households especially those in the informal settlements, continue to face constrained food and income at household level due to a prolonged period of constrained
economic activities due to the pandemic and its related restrictions. The nationwide vaccination drive continues and statistics show that the percentage of vaccinated people in Nairobi County
stood at 10 percent compared to 2% of the rest of the country. However, the vaccination drive
continues to get boosted by the arrival of vaccines from various sources.
V. Other shocks and hazards
Conflict and Insecurity
Across the pastoral and marginal areas, there have been recurrent resource-based conflicts over forage and water resources. In Marsabit, conflict was reported in Saku, North Horr and Moyale
sub-counties where in Saku sub-county clashes resulted in the loss of at least 100 lives,
destruction of 73 homes and the displacement of 2,500 households displaced. Conflict in North Horr (Forolle, Dukana, Garwole, Balesaru, Idido and Bulluk) and Moyale (Elledimtu) sub-
counties hindered access to pasture and water while bandit attacks in northwestern parts of Laisamis sub-county affected flow of food commodities and livestock to the main markets
casing disruptions in supply. As a result of these conflicts, 36 schools (17 ECDE centres, 15 primary schools and four secondary schools) in parts of Saku, Moyale and North Horr sub
counties were temporary closed disrupting the learning and access to school meals for
approximately 6,417 students. Other cases of resource-based conflict were reported in Isiolo along the borders Garissa and with Wajir where seven people were killed, and several others
injured. In Tana River, Nyeri (Kieni) and Lamu counties influx of livestock into the farming zones from pastoral zones and other counties resulted in tension and conflict between farmers
and pastoralists. Threats from terrorism remained along the Kenya-Somalia border regions.
However inter-tribal conflicts were reported in Garissa (Lagdera) and in Mandera in Lafey and Mandera South sub-counties that resulted in six fatalities.
Cattle rustling was reported Isiolo (Ngaremara ward) resulting in the loss of several heads of livestock while in tension persisted in Samburu (Samburu North) along the border of Samburu
and Isiolo counties. In Turkana cattle rustling and banditry were reported across Turkana East
that resulted in displacement of about 3,500 households and the loss of 13,000 small stock and 250 camels with the road connecting Kapedo to Lokori and Lokori to Lokichar affecting
delivery of commodities along that belt.

7
Human wildlife conflict occurrences were also notable and and cropland was damaged by elephants in Nyeri (Kieni East) and particularly in Meru (Igembe North) where 10 Ha of banana
crops and 200 Ha of maize and sorghum were destroyed. In Kitui (Kitui South, Kitui East, Mwingi North and Mwingi Central) about 382 livestock were killed by wild animals. In
Makueni and Taita Taveta counties conflict was witnessed in the areas bordering Tsavo
National Park between domestic and wild animals over water resources where elephants destroyed cropland and water infrastructure.
Below average crop production
Due to below average March to May long rains that were characterized by combination of late
onsets, dry spells, poor spatial and temporal distribution and an early cessation resulted in
below average crop production. In the southeast marginal agricultural cluster maize, green grams and cowpea production was 42, 61 and 58 percent below average respectively and as a
result, household stocks are 34 - 66 percent below average for all crops. In the coastal marginal agricultural cluster production was relatively worse than in the southeast cluster driven by poor
rainfall performance and limited access to farm inputs, Fall armyworm (FAW)invasions and
reduced area planted. Maize, green grams and cowpea production was 70, 89 and 86 percent below the long-term averages indicating widespread crop failure. In Kilifi, total crop
production was below 10 percent of the LTA. Across the cluster, household food stocks were 39 - 48 percent below the LTA for the crops.
VI. Summary of Key Findings
The deterioration in food security situation has resulted in an estimated 2.1 million people facing acute food insecurity and in urgent need of humanitarian assistance in the next six
months and are IPC Phase 3 and above. Compared to the short rains’ assessment, this is an increase from 1.4 million found to be acutely food insecure. The deterioration is attributed to
dismal performance of the March – May Long rains season compounded by effects of Covid
19 and poor performance of the previous short rains season. It is projected that the situation will worsen further and affect 2.4 million people during the October – December Short rains
season forecasted to be below normal.
Figure 1.3: Trends of food insecure populations
0
500,000
1,000,000
1,500,000
2,000,000
2,500,000
3,000,000
3,500,000
4,000,000
Sep
04 -
Feb
05
Mar
05
- A
ug…
Sep
05 -
Feb
06
Mar
06
- A
ug…
Sep
06 -
Feb
07
Mar
07
- S
ep 0
7
Oct
07
- Feb
08
Mar
08
- S
ep 0
8
Oct
08
- Mar
09
Mar
09
- A
ug…
Sep
09 -
Feb
10
Mar
10
- A
ug…
Sep
10 -
Feb
11
Mar
11
- A
ug…
Sep
11 -
Feb
12
Mar
12
- A
ug…
Sep
12 -
Feb
13
Mar
13
- A
ug…
Sep
13 -
Feb
14
Mar
14
- A
ug…
Sep
14 -
Feb
15
Mar
15
- A
ug…
Sep
15 -
Feb
16
Mar
16
- A
ug…
Sep
16 -
Feb
17
Ma
r 1
7 -
Ju
l 1
7
Au
g 1
7 -
Fe
b 1
8
Mar
18
- A
ug…
Au
g 1
8 -
Fe
b 1
9
Mar
19
- M
ay…
Jun
19 -
Aug
19
Au
g 1
9 -
Fe
b 2
0
Mar
20
- A
ug…
Au
g 2
0 -
Fe
b 2
1
Mar
21
- A
ug…
Au
g 2
1 -
Fe
b 2
2

8
The pastoral counties are now experiencing the second consecutive failed season with Isiolo,
Marsabit, Wajir, Garissa and Tana River the worst hit. Pasture and browse regeneration was
insufficient and their condition ranges from fair to poor and is expected to last for 1 – 2 months
from August. Return trekking distances between grazing areas and water sources have
increased by 60 – 90 percent and is 8km compared to normal of 3 – 5km in Turkana and Tana
river, 15 – 20km compared to normal of 5 – 10 in Wajir and Isiolo while the highest was
reported in Marsabit of 25 – 30km with some areas recording up to 40km compared to normal
of 15 – 20km. Most of the surface water sources have dried up and pasture is being depleted
rapidly and likely to last for less than 2 months up to September. Consequently, watering
frequency for cattle and shoats currently stand at 1 – 3 days every week compared to daily with
camels being watered after 7 – 10 days compared to 3 – 5 days normally.
Livestock body condition is below average with grazers being fair to poor and expected to
deteriorate rapidly as distances to water and pasture increase. Milk production has declined by
up to 90 percent and currently households produce 0.5 - 1 litre compared to normal of 2-3 litres
with the worst hit being Isiolo and Marsabit. Calving, kidding and lambing are below average
as forage regeneration was inadequate. Moreover, milk prices have increased to Ksh 80 – 120
from normal of Ksh 40 – 70.
High staple food prices coupled with declining livestock prices have impacted negatively on
households purchasing power with current terms of trade of 10 – 30 percent below the five-
year average in Marsabit, Wajir, Isiolo and Tana river. Earlier than normal outmigration of
about 40 – 60 percent of livestock have been witnessed mainly in search of pasture and water
and has intensified insecurity and conflict as well as high risk of livestock diseases.
In the marginal agricultural areas, poor performance of the long rains coupled with effects of
Covid 19 impacted negatively on household food security and considering this being second
successive failed season. Maize production reduced by 70 percent and households have limited
stocks of 60 percent with the rest relying on market purchases. Similarly, South eastern
marginal cluster experienced below average rainfall thus cutting maize production by more
Figure 1.4: Comparative terms of trade in pastoral and agro pastoral counties ̀
0
20
40
60
80
100
120
Kilo
gram
s o
f mai
ze p
urc
has
ed
fro
m s
ale
of
a go
at
July, 2021 July Average (2016-2020)

9
than 40 percent. High food prices are expected to continue until the end of the year further
impacting on household food security.
VII. Categories of Food Insecure Populations
As extremes of weather continue to be the main contributing factor to food insecurity, the
overall food security situation continued to deteriorate after the long rains season, which
performed below average and this being the second consecutive season whose performance
was poor. Consequently the trend of food insecure population increased across all the
livelihood zones in the country. Turkana, Marsabit, Wajir, Isiolo, Mandera, Garissa Tana river
and parts of Kitui were classified to be in IPC phase three crisis. However, there was an increase
in the population of people in need of humanitarian assistance across all the counties including
those that were classified in IPC phase 2 (Stressed). Overall, the numbers increased by about
50 percent, with Turkana and Isiolo counties recording the largest increase by about 40 percent
of the population.
The worsening of the situation that is attributed to the Poor performance of the season was also
aggravated by impacts of COVID-19 that saw a number of households income reduce to
various containment measures like night curfew and reduced remittances from the family
networks.
The previously reported cases of desert locusts and fall army worms that had previously
threatened food security in most parts of the country had significantly reduced with no extreme
case reported across the livelihood zones
Figure 1.5: Current and projected national food security phase classification

10
VIII. Population in Crisis (IPC Phase3)1
The number of people in need of urgent humanitarian assistance was 2.1 million an increase
from 1.4 million during the short-rains assessment conducted in February 2021. These were
the populations classified to be in IPC phase 3 meaning they are in immediate need of
humanitarian assistance. Turkana County had the highest number of these population around
370,800 followed by Wajir which had about 198,000. Others that had over 100,000 were
Mandera, Garissa, Marsabit, Isiolo, Baringo, Kitui and Kilifi.
During the February short rains assessment, counties that had not recorded any populations
under IPC phase three or worse had new populations under this category in July. This overall
worsening of the population in need was as a result of the failure of rain season which resulted
to undesirable food security outcomes across many livelihood zones.
The forecast for the 2021 short rains season indicates a likelihood of a below average
performance characterized by drier than normal and warmer than usual conditions across most
parts of the country. There is also a likelihood of a delayed start of season especially in the
western part of the country, a situation that would likely affect some of the counties in food
security crisis. As a result, following the current trend of the performance of the previous
seasons and the indicated forecast, the food security situation is likely to worsen with more
households requiring humanitarian assistance. The nutrition situation is also likely to worsen
with increase of caseloads for malnourished individuals.
Table 1: Food Insecure Populations by County, July 2021 County
population
(KNBS 2019
Census)
Population in
need of
assistance
after the 2019
SRA
Population in
need of
assistance
after the 2020
LRA
Population in
need of
assistance
after the 2020
SRA
Population in
need of
assistance
after the 2021
LRA
Turkana 926,976 139,000 93,000 185,000 370,800
Wajir 781,263 111,000 117,000 117,000 195,300
Mandera 867,457 130,000 130,000 173,000 173,500
Garissa 841,353 84,000 84,000 126,000 168,300
Marsabit 459,785 69,000 69,000 92,000 160,900
Samburu 310,327 47,000 31,000 47,000 46,500
Laikipia 268,262 26,000 0 26,000 25,900
West Pokot 621,241 51,000 0 62,000 31,100
Tana River 315,943 47,000 32,000 47,000 63,200
Isiolo 268,002 40,000 27,000 54,000 107,200
Kajiado 1,117,840 56,000 0 6,000 55,900
Baringo 666,763 33,000 33,000 67,000 133,400
Narok 1,157,873 0 0 0 57,900
Sub-total,
Pastoral
7,551,115 833,000 616,000 1,002,000 1,589,900
Makueni 987,653 73,000 0 50,000 98,800
Kwale 866,820 78,000 43,000 87,000 86,700
Kilifi 1,453,787 80,000 73,000 145,000 145,400
Kitui 1,136,187 87,000 0 57,000 113,600
Taita Taveta 340,671 17,000 0 17,000 17,000
Embu (Mbeere) 272,357 27,000 0 0 27,200
1 IPC Phase 3 (Crisis), Households either Have food consumption gaps that are reflected by high or above-usual acute malnutrition or Are marginally able to meet minimum food needs but only by depleting essential livelihood assets or through crisis

11
County
population
(KNBS 2019
Census)
Population in
need of
assistance
after the 2019
SRA
Population in
need of
assistance
after the 2020
LRA
Population in
need of
assistance
after the 2020
SRA
Population in
need of
assistance
after the 2021
LRA
Tharaka-Nithi
(Tharaka)
133,595 40,000 0 7,000 6,700
Meru (North) 764,885 69,000 0 38,000 38,200
Nyeri (Kieni) 198,901 0 0 0 9,900
Lamu 143,920 14,000 7,000 22,000 14,400
Sub-total,
Marginal
Agricultural
6,075,275 485,000 123,000 423,000 557,900
Total 13,626,390 1,318,000 739,000 1,425,000 2,147,800
IX. National Nutrition Situation Summary
According to integrated phase classification for acute malnutrition (IPC-AMN) conducted in
July-August 2021, the nutrition situation has remained within the same phase across the
counties compared to the February 2021 analysis. Nutrition situation was critical (IPC AMN
Phase 4) in Garissa, Wajir, Mandera, Samburu, Turkana, North Horr & Laisamis sub-counties
in Marsabit County and Tiaty in Baringo County. Tana River and West Pokot Counties were
classified in serious phase (IPC AMN Phase 3) while Saku and Moyale sub-counties in
Marsabit County were in alert phase (IPC AMN Phase 2). Several areas could not be classified
due to insufficient evidence and require investment in data by county governments.
Nutrition situation is projected to worsen in Turkana, Samburu, Mandera, Garissa, Wajir, Isiolo
and North Horr and Laisamis given the projected worsening food security situation and will
further worsen across counties if the 2021 short rains perform poorly. The malnutrition levels
though within the same phase are still unacceptably high mainly attributed to poor child feeding
Figure 1.6: Current and projected acute malnutrition phase classification

12
practices and reduced milk availability for children’s diet. Other contributing factors include
stock-out of essential supplies for management of acute malnutrition, sub-optimal coverage of
health and nutrition programs and high morbidities. Multiple and recurrent shocks coupled with
pre-existing factors such as poverty and limited livelihood sources aggravate the problem.
Overall, an estimated 652,960 children 6-59 months and 96,480 Pregnant and lactating women
require treatment of acute malnutrition (Table 1). Due to the COVID-19 pandemic that is
affecting all counties in the country, caseload for children 6 to 59 months requiring treatment
were calculated for all counties in the country to inform planning in the context of the
pandemic.
Table 2: Number of Children 6 to 59 months and Pregnant and Lactating Women
(PLW) Requiring Treatment of Acute Malnutrition
Global Acute
malnutrition
Children 6 to 59
Months
Severe Acute
Malnutrition
Children 6 to 59
Months
Moderate Acute
Malnutrition
Children 6 to 59
Months
Pregnant
and
Lactating
Women
(PLW) Area Total
Caseloads
Target Total
Caseloads
Target Total
Caseloads
Target
Arid and
Semi-Arid
Areas (ASAL)
465,226 256,674 96,242 72,181 368,985 184,492 93,348
Urban 58,138 32,794 14,899 11,174 43,238 21,619 3,132
Non-ASAL 129,596 72,714 31,668 23,750 97,928 48,962
Grand Total 652,960 362,182 142,809 107,105 510,151 255,073 96,480
Recommendations
• Continue to advocate for national and county government budgetary allocation to procure
commodities for management of acute malnutrition
• Advocate for national and county government investment on evidence generation and
nutrition surveillance activities to allow for comprehensive nutrition situation analysis
• Closely monitor health and nutrition situation in the face of rising Covid-19 cases to inform
system capacity adjustment and expansion for sustained service delivery
• Continue to strengthen multi-sectoral linkages and coordination at the National and county
level to address the underlying and basic causes of the persistently high levels of acute
malnutrition
• Update contingency and response plans
Factors to monitor
• Effects of COVID-19 on continuity of essential services and livelihoods as cases continue
to rise and mitigate its effect on food and nutrition situation
• Nutrition situation across the country given the high levels of malnutrition across the
counties and worsening projection

13
X. Crop Production Prospects
The 2021 long rains production estimates for maize from medium and high rainfall areas of
Western and Rift Valley is projected to decline by 8 percent below the long term average due
to the late onset of rain and dry spells during the critical stages of growth which has resulted in
reduced production per unit area in most counties. The rains received were also not adequate
coupled with poor distribution in both space and time. Maize production for the 2021 long rains
in the country is projected to be approximately 32 million (90 kg Bags) which is approximately
5 – 10 percent below the five-year average for the same period.
The production of maize in the marginal agricultural clusters is projected to be 4 million 90 kg
bags against a normal of 7-8 million bags. This represents a decline of 50 percent which is
attributed to low acreage and depressed rains that resulted in wilting of most crops. Some
counties in the ASALs have total crop failure and in some areas farmers did not even plant
and where planted the crop dried below knee high. Resumption of some rains made some
famers to replant but the prospects of the crop growing to maturity are minimal. The
leguminous crops such as, beans, green grams and cow peas declined by 60-90 percent
compared to the long term average (LTA).
XI. Food and Livestock Price Trends
Staple food prices were mixed across the country and maize prices were generally below average in the urban reference markets and in the marginal agricultural areas due to cross-
border imports and available long rains harvests. In the pastoral areas however, staple food
prices were mostly above average as there was a high demand for maize as both human and livestock food due to the intensifying drought. Livestock prices were also mixed due to limited
supply brought about by the ongoing migration and the deterioration in body condition.
In the month of July across the major urban reference markets of Nairobi, Mombasa, Kisumu
and Eldoret, wholesale maize prices were within the five-year averages in Kisumu and 7-16 below average across rest of the markets driven by available local stocks and cross-border
regional imports. Retail maize prices in the marginal agricultural areas ranged between 7-17 percent below the five-year average driven by available long rains harvest despite being below
average in quantity. In the pastoral markets maize prices ranged between 6-32 percent above
Figure 1.7: Wholesale maize prices in urban reference markets
0500
10001500200025003000350040004500500055006000
Jan
Feb
Mar
Apr
May Jun
Jul
Aug Se
pO
ctN
ov
Dec Jan
Feb
Mar
Apr
May Jun
Jul
Aug Se
pO
ctN
ov
Dec Jan
Feb
Mar
Apr
May Jun
Jul
Aug Se
pO
ctN
ov
Dec Jan
Feb
Mar
Apr
May Jun
Jul
Aug Se
pO
ctN
ov
Dec
Nairobi Eldoret Kisumu Mombasa
Pri
ce (K
sh/9
0 K
g b
ag)
LTA 2016-2020 2020 2021

14
average due to constrained supply because of restriction of cross-border trade especially in the northeast, below average production in local source markets and increased demand as both
human and livestock food to stem forage scarcity in drought-stricken areas. However, in Turkana, prices were 14 percent below the five-year average due to sufficient supplies from
Trans Nzoia County and Uganda.
Dry bean prices across the urban reference markets range from 17 – 41 percent above average due to consecutive below average production seasons both locally and regionally however, in
Eldoret the prices are within average due to relatively better local harvests and cross border imports from Uganda. In the marginal agricultural areas prices are within average in Kitui and
Taita Taveta receiving supplies from Tanzania but are 8-18 percent above average across the
rest of the marginal areas due high demand following below average production and low household stocks.
In the pastoral areas, goat prices were 7-11 percent below average in Wajir and Turkana due to below average body conditions and oversupply to the market respectively while they were
average in Marsabit following a deterioration in livestock body conditions. However, in Isiolo and Garissa the prices were 9-13 percent above average due to favorable body conditions. Goat
prices are expected to drop as livestock body conditions deteriorate reducing household income and food access in the coming months.
XII. Food Security Prognosis (August 2021 – January 2022)
Pastoral Areas
Rapid deterioration of the rangeland resources is expected to start off an early lean season
driving further livestock migration to atypical routes including neighboring counties and
countries driving resource-based conflicts. Increased return trekking distances are expected to drive a further deterioration in livestock body conditions and productivity reducing milk
production and sale value. Resource-based conflicts and livestock disease outbreaks are expected to increase where the herders congregate and may result in significant livestock deaths
0
500
1000
1500
2000
2500
3000
3500
4000
4500
5000
5500
Jan
Feb
Mar
Ap
rM
ay Jun
Jul
Au
gSe
pO
ctN
ov
Dec Jan
Feb
Mar
Ap
rM
ay Jun
Jul
Au
gSe
pO
ctN
ov
Dec Jan
Feb
Mar
Ap
rM
ay Jun
Jul
Au
gSe
pO
ctN
ov
Dec Jan
Feb
Mar
Ap
rM
ay Jun
Jul
Au
gSe
pO
ctN
ov
Dec
Turkana Garissa Marsabit Mandera
Go
at
pri
ce
s
(2016 - 2020) 5-Year Average 2020 2021
Figure 1.8: Goat prices across selected pastoral markets

15
and constrained livelihood activities that will further reduce household food and income sources. Households will attempt to intensify non-livestock income sources such as casual
labor, charcoal and firewood sales, and petty trade which will likely be limited due to high competition and effects of COVID - 19. To bridge food and income gaps, households will
employ consumption-based and livelihood-based strategies with more households moving into
Crisis (IPC Phase 3) by late October. In late October the forecasted below average short rains are expected to begin late and only partially recharge forage and water resources. Livestock
will likely recover slightly and not be able to achieve complete recovery keeping sale values and milk production low. Livestock will likely remain in the dry season grazing areas keeping
household milk access low and will be followed by the remaining herds from late December.
Low milk consumption at household level will increase malnutrition levels for children under five years of age which will be ‘Alert’ (GAM MUAC 5-9.9 percent) in Saku and Moyale sub-
counties of Marsabit County, Serious’ (GAM MUAC 10 – 14.9 percent) in West Pokot and Tana River and ‘Critical’ (GAM MUAC 15 – 29.9 percent) across the rest of the areas. Low
income and high staple food prices will result in in income and food gaps at household level
intensifying food insecurity. Stressed (IPC Phase 2) area-level outcomes are expected in parts of West Pokot, Samburu, Tana River and Baringo while Crisis (IPC Phase 3) area-level
outcomes will likely be observed in Turkana, Marsabit, Isiolo, Wajir, Mandera and Garissa counties and parts of Baringo, Samburu, Laikipia and Tana River. In these counties, there will
be a small population of most-affected households that will be in Emergency (Phase 4) but will
be insufficient to map at area level.
Marginal Areas
Household food availability is set to decrease through September as household food stocks
diminish signaling a return to market dependence for households. The below average October
to December short rains season will reduce cropping activities and associated income from
casual labor from September onwards and from crop sales from December onwards. The below
average harvests are expected to reduce household food availability. The effect of the short
rains are expected to improve forage and water availability for a short-lived period improving
livestock productivity however, milk production and consumption at household level is
expected to remain below average driving increasing malnutrition for children under five years
of age. Despite low income, households will get some relief from projected below average
staple food prices due to carryover stocks, cross-border imports and as harvests from the high
and medium rainfall areas become available from September which will keep food relatively
accessible by households. To obtain income, households will intensify use of consumption
coping strategies and livelihood coping strategies. At least one in five households in will be
able to afford their minimum food needs but be unable to afford non-food needs in and be in
Stressed (IPC Phase 2) in Kitui, Lamu and parts of Nyeri (Kieni), Meru (Meru North), Embu
(Mbeere), Tharaka Nithi (Tharaka), Makueni, Taita Taveta, Kwale and Kilifi counties.
XIII. Options for response
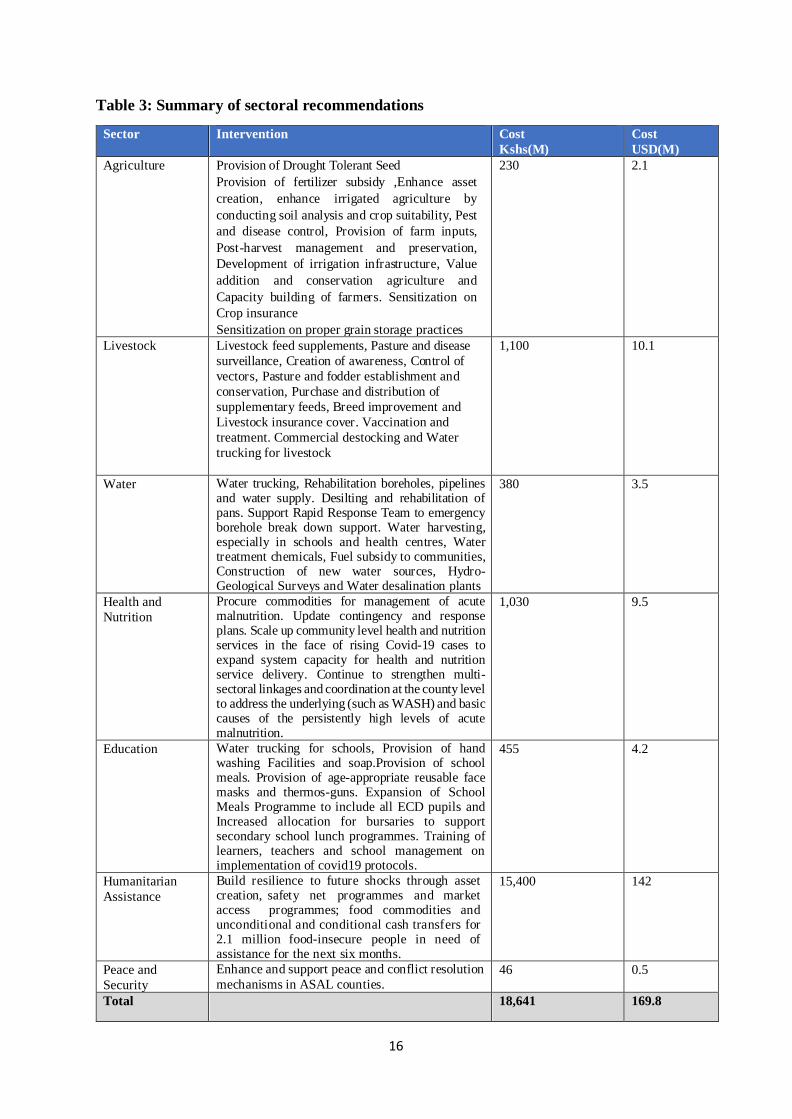
The table 3 below sets out the options for response by sector. All immediate, medium and
long-term interventions should be anchored in the Ending Drought Emergencies Common
Programme Framework.
16
Table 3: Summary of sectoral recommendations
Sector Intervention Cost
Kshs(M)
Cost
USD(M)
Agriculture Provision of Drought Tolerant Seed
Provision of fertilizer subsidy ,Enhance asset
creation, enhance irrigated agriculture by
conducting soil analysis and crop suitability, Pest
and disease control, Provision of farm inputs,
Post-harvest management and preservation,
Development of irrigation infrastructure, Value
addition and conservation agriculture and
Capacity building of farmers. Sensitization on
Crop insurance
Sensitization on proper grain storage practices
230 2.1
Livestock Livestock feed supplements, Pasture and disease
surveillance, Creation of awareness, Control of
vectors, Pasture and fodder establishment and
conservation, Purchase and distribution of
supplementary feeds, Breed improvement and
Livestock insurance cover. Vaccination and
treatment. Commercial destocking and Water
trucking for livestock
1,100 10.1
Water Water trucking, Rehabilitation boreholes, pipelines and water supply. Desilting and rehabilitation of pans. Support Rapid Response Team to emergency borehole break down support. Water harvesting, especially in schools and health centres, Water treatment chemicals, Fuel subsidy to communities, Construction of new water sources, Hydro-Geological Surveys and Water desalination plants
380 3.5
Health and
Nutrition
Procure commodities for management of acute malnutrition. Update contingency and response plans. Scale up community level health and nutrition services in the face of rising Covid-19 cases to expand system capacity for health and nutrition service delivery. Continue to strengthen multi-sectoral linkages and coordination at the county level to address the underlying (such as WASH) and basic causes of the persistently high levels of acute malnutrition.
1,030 9.5
Education Water trucking for schools, Provision of hand washing Facilities and soap.Provision of school meals. Provision of age-appropriate reusable face masks and thermos-guns. Expansion of School Meals Programme to include all ECD pupils and Increased allocation for bursaries to support secondary school lunch programmes. Training of learners, teachers and school management on implementation of covid19 protocols.
455 4.2
Humanitarian
Assistance
Build resilience to future shocks through asset creation, safety net programmes and market access programmes; food commodities and unconditional and conditional cash transfers for 2.1 million food-insecure people in need of assistance for the next six months.
15,400 142
Peace and
Security
Enhance and support peace and conflict resolution
mechanisms in ASAL counties. 46 0.5
Total 18,641 169.8

17
1.0 Introduction
1.1 Assessment Coverage and Objectives
The 2021 long rains assessment was undertaken between 6th July and 12th August 2021 in the
23 ASAL counties by the government of Kenya through the Kenya Food Security Steering
Group (KFSSG), in collaboration with the 23 county governments through their respective
County Steering Groups (CSGs). The KFSSG is a multi-agency body comprising of key
government departments, UN agencies and non-Governmental organizations, all with a stake
in food and nutrition security in the country. The KFSSG is chaired by the National Drought
Management Authority (NDMA) and co-chaired by the World Food Programme while the
CSGs are county level multi-sectoral and multi-agency group that coordinates food security
related activities.
Objectives
The overall objective of the assessment was to determine the impacts of the 2021 long rains on
food and nutrition security in 23 ASAL counties considering the cumulative effects of previous
seasons and impacts of other shocks and hazards on food security. At the same time, the assessment also considered the impacts of COVID-19 on food security. The assessment also
set out to determine the impact of the season on food availability, access, utilization and their stability by evaluating the contributing factors and outcomes, and their impacts on agriculture,
livestock, water, health and nutrition, education, peace and security, and markets and trade sectors. The results of the assessment and recommended interventions are presented in this
report.
1.2 Methodological Approach
The seasonal assessments cover the arid and semi-arid region of the country comprising of 23
counties, which are generally the most food insecure and exhibit high levels of vulnerability and covers approximately 80 percent of Kenya’s landmass. The area covered by these counties
is further classified into generalized livelihood zones which comprise of; Pastoral North West Livelihood cluster (Turkana, Samburu and Marsabit counties), Pastoral North East (Wajir,
Garissa, Isiolo, Tana River and Mandera Counties), South East Marginal Agriculture Cluster
(Kitui, Makueni, lower parts of Tharaka Nithi, and Embu counties and the Northern parts of Meru County). Other clusters include Coastal Marginal Agriculture (Kilifi, Kwale, Taita
Taveta and Lamu counties) and Agro Pastoral cluster (Baringo, Narok, Kajiado, West Pokot, Laikipia and northern part of Nyeri county- Kieni). The main livelihood activities across these
include Pastoralism, Agro-pastoralism, Mixed Farming, Marginal Mixed Farming and some
Irrigated Cropping, which formed the unit of analysis for this assessment.
This assessment included collection of secondary and primary data with varied data sources
including data from NDMA sentinel sites, which is collected monthly using questionnaires, Data from the various government sectors (livestock, water, agriculture, education, health and
nutrition) at the county and sub counties using checklists. Also included was data collected
through community interviews and market interviews through focus group discussions and interviewing of traders respectively, drought early warning bulletins among others and field
observations through transect drives. During the analysis, Acute Integrated Food Security Phase Classification (IPC Version 3) protocols were used. The IPC is a standard global tool for
classifying the severity of food insecurity, was used to analyze the severity, causes as well as
reach a technical consensus on the food security situation.

18
2.0 Food and Nutrition Security Analysis by Livelihood Cluster
2.1 The Pastoral North-West Livelihood Cluster
2.1.1 Cluster Background Information
The cluster comprises of Turkana, Samburu
and Marsabit Counties and covers an approximate area of 173,815.1 square
kilometers with an estimated population of
1.69 million persons (KNBS Census 2019). The cluster has three main livelihood zones
namely: Pastoral livelihood zone, accounting for 69 percent of the population,
Agro Pastoral 24 percent and
Fisheries/Formal employment at seven percent.
2.1.2 Current Drivers of Food Insecurity
Rainfall performance
The onset of long rains was late by 3 to 4 dekads across the cluster. Most parts of Cluster
received average rains which were 51-90 percent of normal. The northern parts of the Turkana County including Turkana north, Loima and parts of Turkana central sub-counties, the eastern
parts of Moyale Sub County (Township, Heillu Manyatta, Obbu and Golbo) and northern parts
of Illeret received between 91-110 percent of normal rains whereas depressed rainfall of 25-50 percent of normal was received in some pockets of Turkana East Sub- County, Laisamis, Saku
and parts of North Horr sub counties and Waso and Nyiro wards bordering Isiolo and Marsabit counties. The spatial and temporal distribution of rains was poor and uneven across the cluster.
The cessation was normal in Samburu County in the third dekad of May while late cessation
was recorded in Turkana and Marsabit counties in the second dekad of May as opposed to the third dekad normally.
Resource Based Conflict/Insecurity
Incidences of conflicts between communities was reported in the period under review in the
entire cluster as occasioned by competition for pasture and water, cattle rustling and revenge
retaliatory attacks which have resulted to loss lives and livelihoods. In Turkana County, displacement of households in Turkana East Sub-county which affected an estimated 3,500
households and resulted in the loss of approximately 13,000 sheep and goats; and 250 camels was reported. In Marsabit County conflicts between two warring communities was reported in
Saku, North Horr and Moyale. In Saku Sub County conflicts between communities resulted in
the loss of lives and livelihoods. At least 100 lives were lost, 73 homes destroyed and over 2,500 households displaced. Several schools were affected by conflicts resulting in temporary
closure of 36 schools. In Samburu County Several incidences of stock theft and retaliatory attacks were reported in pockets of Samburu North Sub County
COVID-19 Pandemic
In Turkana the caseload in the County as at 22nd July, 2021 was 1,557 out of 13,810 cumulative tests conducted with a positivity rate of 8.2 percent. The restriction of communal approach to
agricultural activities was reflected in the reduction of land put under cultivation. Low livestock prices at the market were recorded owing to the minimal participation of external traders whose
Figure 2.1: Pastoral Northwest cluster livelihood zones

19
activities were affected negatively by the COVID-19 restrictions. In the County of Samburu cumulative positive cases so far stands at 239. Total deaths related to COVID – 19
complications were four. County cumulative COVID-19 vaccination uptake as at 28th July 2021 is 3,737 for first dose and 2040 for the second dose amounting to 1.4 percent of population
fully vaccinated (County Public Health Office). Face masking, 10 pm to 4 am curfew and social
distancing still in force to mitigate further spread of the disease.
Other Shock and Hazards
The other hazards contributing to food insecurity in the Turkana include tree Locust Invasion: Floods, Invasive Plant Species. The negative impacts of the Tree Locusts were evident across
most sites in Turkana South, East, North and West Sub-counties. The Tree Locusts continued
decimating large tracks of browse estimated at 7,000 hectares. Losses of livestock and crops due to flash floods were reported. Invasive Plant Species such as Prosopis juliflora have
invaded Turkana County resulting in loss of grazing biomass.
2.1.3 Current Food Security Situation
Marsabit and Turkana Counties are classified as crisis phase; Integrated Food Security
Classification (IPC Phase 3) while Samburu County is in the stressed phase (IPC phase 2). Maize stocks held at household level for Samburu, Turkana and Marsabit counties were 40, 19,
and 46 percent respectively below the long-term average. Pasture and browse condition were fair to poor in the cluster. Livestock body condition ranged between good to fair for Marsabit
and Tukana Counties while fair to poor in Samburu County. Market price for maize in Samburu
and Turkana Counties reported 13 percent below long-term average while maize prices in Marsabit County were eight percent above LTA. Goat prices were above long-term average by
eight and one percent for Samburu and Marsabit respectively while 12 percent below long average for Turkana. Terms of trade were above LTA in Turkana and Samburu which recorded
five and 21 respectively while Marsabit County reported eight percent below the long-term
average. Water consumption ranged between 10-15 litres per person per day for Marsabit and Turkana counties; whereas in Samburu, 4-12 litres per person per day was reported compared
with the WHO sphere standards 15 litres per person per day across the cluster.
2.1.4 Food Security Trends Pastoral North West Food security trends
Indicator Short rains assessment, Feb
2021
Long rains assessment, July 2021
Percent of maize stocks held by
households
44 percent below LTA 35 percent below LTA
Livestock body condition (Cattle) Good to Fair Fair to Poor
Water consumption (litres/ person/
day)
11-15 7- 14
Price of maize (per kg) 60 54
Distance to grazing in km 8-20 8-14
Terms of trade (pastoral zone) 67 59
Coping strategy index 12 17
Food consumption score Acceptable-62
Borderline-26
Poor-12
Acceptable-53
Borderline-34
Poor-13

20
2.1.5 Impacts of Drivers on Food and Nutrition Security
2.1.5.1 Crop Production
Rain-fed crop production
The cluster mainly depends on long rains for crop production, which contributes 80, 60 and 40 percent of total annual food production in Samburu, Turkana and Marsabit counties
respectively. Crop production contributes 30 to 40 percent of the cash incomes in the three counties. The major crops grown under rain fed agriculture are maize, beans and sorghum.
Other minor crops are cowpeas and green grams. The area planted under maize increased by
54 percent above the LTA whereas the area under beans and sorghum declined by 45 percent of the LTA. The decline in area under beans and sorghum was attributed to seed inadequacy,
hesitation by some farmers to plant due to late onset of rainfall. The production of beans and sorghum was estimated at nine percent of the LTA while that of maize was estimated at three
percent. The near total failure in the production was due to poor rainfall performance
particularly delayed onset and poor spatial and temporal distribution which resulted in wilting of most crops.
Rain-fed crop production Crop Area planted during
2021 long rains
season (Ha)
Long term average
area planted during
the long rains season
(Ha)
2021 Long rains
season
production
Long term average
production during
the long rains season
Maize 6,705 4,360 2,626 86,952
Beans 3,620 6,487 6,324 68,948
Sorghum 3,400 6,237 6,036 67,796
Irrigated Agriculture
The main crops grown under irrigation are sorghum, maize and kales. Other minor crops under
irrigation include cowpeas, tomatoes, cabbages and spinach. The area under kales, sorghum and maize production was 142, 103 and 65 percent of the LTA. The increase in area planted is
attributed to enhanced campaigns and provision of vegetable seeds to groups within water
sources. The production of kales and sorghum is estimated at 24 and three percent respectively above the LTA while that of maize is estimated at 56 percent of the LTA. The increased yield
of kales and sorghum is attributed to increased acreage and increased recharge of the water sources. The projected maize yield from the irrigation scheme is expected to be lower than the
long-term average due to low water levels in the irrigation schemes and prevalence of Fall
Army Worm and Stalk borers. Irrigation is mainly done in irrigation schemes along river Turkwel and Kerio in Turkana County while in Marsabit and Samburu it is done through on-
farm water harvesting structures.
Irrigated crop production Crop Area planted
during 2021
Long rains
season (Ha)
Long Term Average
(3 yr) area planted
during the long rains
season (Ha)
2021 long rains
season
production (90 kg
bags) Projected
Long Term
Average (3 yr)
production during
the short rains
season (90 kg
bags)
Sorghum 4,289 4,148 44,433 42,973

21
Maize 1,894 2,879 32,198 56,949
Kales 54 38 222 179
Cereal Stocks
The main cereal stocks available in the cluster were maize, rice and sorghum. The cereal stocks
held by various actors across the County were generally below LTA except for rice. The maize stocks held by farmers, traders, millers and NCPB in the cluster were 41, 89, 59 and 5 percent
respectively of the LTA. The low cereal stocks held by the farmers, traders and millers was attributed to the poor performance of the rainfall that resulted in reduced harvest. The stocks
for sorghum are expected to increase once the farmers start harvesting. The rice stocks held by
NCPB were 175 percent above the LTA while the rice stocks held by traders and farmers were five and 33 percent below the LTA. The increased rice stocks at the NCPB were attributed to
the government relief supplies to cushion the population against hunger.
Cereal stocks in the cluster Actor Maize Rice Sorghum
Current LTA Current LTA Current LTA
Farmers 9,670 23,517 400 600 2,313 2,960
Traders 28,856 32,223 5540 5830 930 11,560
Millers 4,500 7,658 0 0 0 1,100
NCPB 741 15,000 6,875 2,500 0 0
Total 43,767 78,398 12,815 8,930 3,243 15,620
2.1.5.2 Livestock Production
Livestock production contributes about 82- 85 and 45 -60 and 18 percent to cash income in the
Pastoral, Agro pastoral and Fishing livelihood zones respectively. The pasture condition was fair to poor in the Pastoral and good to fair in the Agro Pastoral and the Fishing livelihood
zones compared to good to fair normally. The browse condition was fair to poor across the cluster compared with good to fair normally. The decline in forage situation was due to uneven
distribution of the long rains and has been accelerated by adverse effects of climate change
coupled with Desert Locust infestation. In Turkana County, Tree Locusts continued decimating large tracks of browse estimated at 7,000 hectares. The available pasture is projected to last for
one month in the Pastoral and Fishing livelihood zones and 2 months in the Agro Pastoral livelihood zone when compared to 3-4 months normally while browse is projected to last for
2-3 months compared with 3 – 5 months normally. The main limiting factors to forage access
were: the emergence of non-palatable vegetation species especially Calotropis Procera in Marsabit, cissus rotundifolia (Raraiti) and Acacia reficiens, ipomoea species and Prosopis
juliflora in parts of Samburu. Access to available forage was also limited by insecurity/ resource based conflicts across the cluster. The COVID-19 containment measures especially
control on movement also posed challenge to forage access. The deteriorating forage situation
in the cluster is likely to trigger intensified abnormal migration of livestock through to the beginning of November 2021.

22
Pasture and Browse Situation Livelihood
zone
Pasture condition Browse condition
Current Normally Projected Duration
to last (Months)
Current Normally Projected Duration
to last (Months)
Current Normally Current Normally
Pastoral Fair to
poor
Good-
Fair
<1 3-4 Fair to
Poor
Good -
Fair
2 3
Agro
pastoral
Good to
fair
Good-
Fair
1-2 3-4 Good -
Fair
Good -
Fair
2 3-5
Fishing Fair to
poor
Good-
Fair
1-2 4 Fair to
Poor
Good -
Fair
2 3
During the season under review, the cluster registered 22 hay storage facilities with a storage
capacity of 341,700 bales, currently holding 75,000 bales. The weight per bales ranged between
10 – 20 kilograms and was sold at Kshs. 200 – 500. In Marsabit County, pasture conservation was undertaken in support of the local community which constructed hay storage facilities in
Moyale and Laisamis Sub Counties. In Samburu County, pasture development and conservation was promoted in the highlands of Samburu Central Sub County with Loosuk ward
producing hay in large quantities. The NDMA, World Vision, Drought Resilience Livelihood
Support Project (DRLSP), the Regional Pastoral Livelihood Resilience Project (RPLRP) and Samburu County government were the main institutions supporting pasture conservation.
Production of hay was mostly done on pilot plots to analyze its adaptability to climatic change before commercial production can commence in Turkana County.
Hay Conservation in the Cluster Sub
County
No. of
Hay
Stores
Storage
Capacity
(Total
number of
bales)
No. of
Bales
currently
being
held
Average
Weight
per bale
(in Kg)
Average
price
per bale
(Ksh.)
Comments–e.g. percentage
held by farmers and other
Institutions
Marsabit 7 61,700 29,000 10-12 300-500 70% by the farmer and 30% by
the ATC
Samburu 11 200,000 40,000 13 250 20% Farmers
80% institutions
Turkana 4 80,000 6,000 20 200 -300 <5% by farmers
95% by institutions
Total 22 341,700 75,000 10-20 200-500
The livestock body condition for cattle, sheep, goats and camels was good to fair in the Pastoral and Agro Pastoral livelihood zones which was within the normal seasonal ranges but fair to
poor (for cattle, sheep and goats) and good for camels in the Fishing livelihood zone cluster compared with good to fair normally. The fair to poor livestock body condition in the Fishing
livelihood zone was attributed to rapid depletion of forage due below normal 2021 long rains
which resulted in poor regeneration of forage, long return trekking distance in search of water and forage and invasion of desert locusts to pasture/browse. With deterioration of forages
resources and increased distances from grazing to water sources, the body condition of livestock is projected to deteriorate in all livelihood zones in the next 3 months.
Livestock Body Condition Livelihood
zone
Cattle Sheep Goat Camel
Current Normal Current Normal Current Normal Current Normal
Pastoral Good to
Fair
Good to
Fair
Good to
Fair
Good to
Fair
Good to
Fair
Good to
Fair
Good to
Fair
Good

23
Livelihood
zone
Cattle Sheep Goat Camel
Current Normal Current Normal Current Normal Current Normal
Agro
pastoral
Good to
Fair
Good to
Fair
Good to
Fair
Good to
Fair
Good to
Fair
Good to
Fair
Good to
Fair
Good
Fishing Fair to
poor
Good to
Fair
Fair to
poor
Good to
Fair
Fair to
poor
Good to
Fair
Good Good
Livestock birth rates were below normal especially in the Pastoral livelihood zone due to poor performance of two consecutive rainy seasons leading to prolonged breeding period. More
kidding/lambing are expected within the next three months however with the progression of the dry spell currently being experienced, livestock birth rates are expected to decline
especially in the Pastoral livelihood zone. The average TLUs holding declined by 50, 30 and
25 percent among the poor households and by 40, 14 and 12.5 percent among medium households in Pastoral, Agro Pastoral and Fishing Livelihood Zone respectively. The current
trend of decline in TLUs can also be associated to the effects of climate change, land degradation and cattle rustling.
Tropical Livestock Units (TLU) by Livelihood Zones
Milk production in the cluster decreased by 37 to 50 percent compared with LTA. Consumption
of milk per household per day decreased by over 75 percent across all livelihood zones compared with LTA. The decline in milk consumption was attributed to limited milk
availability at the household level. Milk price increased by 50 percent of LTA in all livelihood
zones across the cluster.
Milk Production, Consumption and Prices Livelihood zone
Milk Production (Litres)
/Household
Milk consumption
(Litres)/Household
Prices (Ksh)/Litres
Current LTA Current LTA Current LTA
Pastoral 0.25 – 2 2-5 0.25-1 1-3 60-120 40-90
Agro pastoral 1-3 2-5 0.5-1 1-5 60-90 40-90
Fishing 0.25 2 0.25 1 60 40
In Pastoral livelihood zone, the return trekking distance from grazing areas to water points increased from 4-25 km to 8-30 km; whereas in the Agro Pastoral Livelihood zone the trekking
distances increased from 1-10 kilometers to 3-15 kilometers. Areas experiencing long trekking
distances include North Horr and Maikona Wards and Laisamis Sub-county of Marsabit County. The main factors attributed to increased trekking distances were low recharge levels,
drying up of open water sources and depletion of pastures. Intense livestock migration and high livestock concentration was observed at major boreholes. The available water was expected to
last for 1-3 months compared with 3-4 months normally. With the progression of the long dry
spell and insecurity incidences, livestock trekking distances from grazing areas to water points are likely to increase further.
Livelihood zone Poor income households Medium income households
Current Normal Current Normal
Pastoral 2-8 4-10 6-15 10-20
Agro Pastoral 2-4 3-8 6-8 7-10
Fishing 3 4 6 8

24
Water for Livestock Livelihood zone Return trekking distances (Km) Expected duration to last (Months)
Current Normal Current Normal
Pastoral 8-30 4-25 <1 – 3 3-4
Agro pastoral 3-15 1-10 1-2 3-5
Fishing 1 1 Lake – Through out Lake- Through out
In Pastoral livelihood zone, watering intervals for cattle, sheep and goats was after every two
days compared with the normal watering interval of either daily or 4 days in a week, while
camels were watered once a week or after two weeks compared to the normal of twice a week or after 3-10 days. In the Agro Pastoral livelihood zone cattle, sheep and goats watering
frequency was daily or 5 days in a week against the normal of daily or after every 2-3 days with camels being watered after every 5-7 days or in other instances after two weeks when
compared to after every 2 – 6 days normally. Livestock migration has intensified across the
cluster. In Marsabit County, livestock were moving to the dry grazing areas in North Horr Sub-County and parts of Laisamis sub-county. In Samburu County, mass out-migration was
witnessed in Samburu Central and East sub counties to Arabal and Ngelecha in Baringo County. Majority of livestock from Samburu North are currently grazing within the dry season
grazing fields in Samburu West. The major livestock migrations currently witnessed in Turkana
County are those of kraals (a group of households) moving towards the international borders of Uganda, South Sudan and Ethiopia. The migration of livestock is expected to intensify in
the coming months due to limited access to forage and water resources and recurrent conflicts hence the possibility of increased resource-based conflicts.
The cluster did not experience cases of livestock disease outbreaks. The endemic livestock
diseases reported across the cluster were Foot and Mouth Diseases (FMD), Rabies, Peste des Petits Ruminants (PPR), Contagious Caprine Pleuropneumonia (CCPP), Anaplasmosis, heart
water, Sheep and Goat pox, Haemorrhagic Septicemia (HS), ORF, Trypanosomiasis, helminthes, Mange and Enterotoxaemia. Marsabit County reported high livestock mortalities
in sheep and goats of about 10 percent due to PPR, CCPP and abortion while livestock mortality
rates of approximately 3.3 percent were recorded in Turkana due to Haemorrhagic Septicemia (HS) and PPR. However, no abnormal occurrence of livestock mortalities across the livelihood
zones was reported. The Veterinary Services and other partners continued to support disease surveillance, vaccination and treatment of livestock.
2.1.5.3 Market Performance
Typical market operations were witnessed across most of the main markets with majority being
well positioned with essential food commodities and livestock products. However, disruptions were reported in the commodity markets of Dukana and Forolle; and livestock markets in
Jirime in Marsabit and Kakuma livestock market in Turkana that remained opened despite
conflicts in management. The livestock traded volumes continued to decline across the cluster. Migration is expected to further impact negatively the traded volumes of livestock in the next
3 months. Most food items traded such as cereals and pulses were sourced externally from Trans Nzoia, West Pokot, Uganda, Meru, Nanyuki, Nyahururu, Ethiopia, Isiolo, Nakuru,
Laikipia, Meru and Nyandarua while livestock was sourced locally. An increase in food prices
was reported in Layeni, Komote, El Boru Magadho and Rage due to increased distances to markets as a result of Layeni and Komote being completely cut-off by the surging waters of
Lake Turkana. Insecurity and COVID-19 restrictions negatively affected commodity market operations, traded volumes of foodstuffs, livestock marketing and pastoralist mobility.

25
Market prices and terms of trade
The average maize price in the
cluster ranged from the low of Ksh. 46 per kilogram in
Samburu County being 13.2
percent below the long term average price of Ksh. 53.
Turkana County reported the highest prices at Ksh. 66 per
kilogram compared with the
long term average of Ksh. 77. The prices fell below the long
term average in Turkana and Samburu counties whereas
Marsabit County recorded above
long term average price of Ksh. 49 per kilogram an average price
of Ksh. 45. The price of a medium sized-goat in the month of July was Ksh. 2,855 in Turkana, Ksh. 2,940 in Samburu
and Ksh. 3,495 in Marsabit. The prices were below the long term averages for Turkana and
Marsabit counties due to availability of cereals in the markets driven by local harvests from the 2020 long rains harvest coupled with imports by traders from Trans Nzoia and Uganda,
Laikipia, Nyandrua Meru, and Nakuru counties. Samburu count recorded above long term average price due to poor local harvests and depletion of household stocks. Terms of trade were
favourable across the cluster with exception of Marsabit County. Households were thus able to
buy more kilograms of maize from the sale of a medium-sized goat compared to long term averages. In Marsabit county households would purchase 73 kilograms of maize from the
proceeds of a goat sold compared with the long term average of 78 kilograms while in Samburu and Turkana counties the sale of a goat purchased 64 and 43 kilograms respectively which was
more than the long term averages.
2.1.5.4 Water Access and Availability
The main sources of domestic water are boreholes, shallow wells, pans and dams, Lake Turkana, River Turkwel, Kerio and Ewaso Nyiro. Other sources are rock catchment and
underground tanks in Marsabit. Lake Turkana is also a water source but the communities’
access water through hand dug wells near the lake. The recharge of surface water sources was between 45-80 percent in the cluster. Water pans in the cluster are expected to last for 1-2
months except in Turkana where boreholes can last throughout the year due to high recharge during the long rains. The shallow wells in Turkana are estimated to last for six months. The
ground water sources are projected to dwindle as both humans and livestock converge at
ground sources for water demand in areas in Samburu. Majority of surface water sources in Samburu and Marsabit have dried up in pastoral zone. Water pans in pastoral areas of Marsabit
(Laisamis and North Horr) and Samburu were dry. Some water pans in parts of Forolle and Selegabaro in North Horr of Marsabit were inaccessible due to insecurities and conflicts.
Distances to water sources increased across the cluster with the pastoral areas of Turkana and Marsabit recording 10 kilometres compared with the normal 3-6 kilometres while in the
pastoral zone of Samburu recorded 10-15 kilometres compared with the normal 5–10
kilometres. The average return trekking distance in Samburu was eight kilometres in pastoral households. In agropastoral livelihood zones of Marsabit recorded the highest return distances
of 5-10 kilometres. Increased distances were mainly due to drying up of water sources and high
0.0
10.0
20.0
30.0
40.0
50.0
60.0
70.0
80.0
90.0
Marsabit Samburu Turkana
Kilo
gram
s o
f mai
ze p
urc
has
ed
fro
m s
ale
of
a go
at
July, 2021 July Average (2016-2020)
Figure 2.2: Comparative Terms of Trade in the Cluster

26
concentration in boreholes due to prolonged pumping hours and over abstraction in Marsabit. Non-operational boreholes were due to faulty spares parts or vandalism by community
members in Samburu. The distances in Marsabit are expected to increase due to high concentration of human and livestock occasioned by drying up and low yield of boreholes as
well as insecurity along the Kenya-Ethiopia border.
Waiting time at water sources in all the livelihoods across the cluster was 30 to 60 minutes. Exceptional areas included Turkana West which reported a higher proportion of households
waiting for water for more than one hour. Highest waiting time was recorded in pastoral areas of North Horr Sub-County including El Boru Magadho, Gas and Qorqa Gudha) of Marsabit
where households waited for 4–6 hours due to high concentration of human and livestock,
breakdown of boreholes and low yielding boreholes. The cost of water remained normal at Kshs 5 to 10 across all livelihood zones; except in the pastoral areas of Laisamis and Korr in
Marsabit where the price was Ksh.30 per 20 litres jerrycan. High prices by vendors were reported in Longech in Turkana Central at Ksh. 80 per 20 litre jerrycan. In urban centres of
Maralal, Wamba, Kisima and Archerspost in Samburu, vendors supplied water at a cost of Ksh
20–30 per 20 litres jerrycan inclusive of vendor’s transportation cost while in Baragoi, a 20 litre jerrycan was sold Ksh 40. Water consumption per person per day reduced compared to
normal in Turkana with the average water consumption per person per day across the pastoral, agro-pastoral and fisheries livelihood zones being 10-15 litres, 25-30 litres and 15-20 litres
respectively. In North Horr Sub-County Marsabit, households consumed less than 10 litres per
person per day.
2.1.5.5 Food Consumption The proportion of households with poor food consumption score was estimated at 30.9, 6.8 and
2.8 percent in Turkana, Samburu and Marsabit Counties respectively; implying consumption
of a starch and vegetable mostly and occasional (less than 3 days in a week) consumption of other high nutrient food groups. The deteriorating food consumption in Turkana County is as
a result of unfavorable Terms of Trade, reduced milk production and consumption and below average livestock prices. Milk consumption was below normal across the cluster and is
attributed to weakening livestock body condition and migration.
2.1.5.6 Coping Strategies
During the month of July, 2021 the cluster reported relative stability in households coping strategies (rCSI). Marsabit, Turkana and Samburu counties registered rCSI score of 17.4, 16.6
and 11.1 respectively. Reduced portion size and reliance on less preferred food/less expensive
food were the predominant consumption-based coping strategies employed by households. The observed stability is attributed to favorable weather conditions driven by some off-season rains
received that resulted in improved food availability in parts of the cluster. The proportion of households employing crisis coping strategies was at 31.6, 17 and 44.5 percent in Turkana,
Samburu and Marsabit counties respectively. Turkana County further registered the highest
number of households with stressed coping strategies at 68 percent.

27
2.1.5.7 Health and Nutrition
The According to IPC AMN
classification, the situation has remained largely the same compared
with the same period last year. Samburu,
Turkana and Marsabit (Laisamis and North Horr) were in critical phase (IPC
AMN Phase 4) while Moyale and Saku were classified in alert phase (IPC AMN
phase 2). The situation is expected to
worsen across the cluster during the projection period except for Saku and
Moyale where the situation will remain similar. The main drivers of acute
malnutrition in the cluster include high
disease burden, food insecurity and poor child care practices. Across the cluster, an increase on IMAM admissions was observed for
both SAM and MAM compared to 2020. This could be attributed to a gradual resumption of services compared to 2020 when a scale down of service delivery was experienced due to Covid
19 restrictions.
Morbidity and Mortality
Trends of Acute Respiratory Tract Infection (URTIs), malaria and diarrhoea remained within
the seasonal morbidity trends. The URTIs cases were highest across the cluster compared to other conditions in both 2020 and 2021. The URTI and Malaria showed an increasing trend in
Turkana and Samburu. Conversely, malaria and diarrhea showed a decreasing trend in Marsabit
2020.
Health and Nutrition Sector in COVID -19 Contexts
A total of 2,108 cases and 30 deaths have been reported across the cluster. Health and nutrition services are ongoing with the observance of preventive measures. The counties have safely
resumed household surveys and data collection procedures.
1COVID-19 Situation in the Cluster County Number of
cumulative cases
Number
of deaths
Number of vaccine doses
administered
Comments
First dose Second dose
Marsabit 282 55 health workers under
quarantine and treatment
Turkana 1,587 26 4,707 1,000
Samburu 239 4 3,737 2,040
Immunization and Micronutrients Supplementation
Generally, there was observed decrease in all the antigens and Vitamin A supplementation. Fully Immunized child (FIC) decreased across the cluster between 2020 and 2021 except in
Marsabit County. Notably, in Samburu, OPV 3 coverage increased from 78.9 percent in 2020
to 83.6 percent in 2021 while in Marsabit and Turkana the coverage remained the same. Vitamin A coverage across the cluster was below the national target of 80%. Provision of these
services was affected due to closure of integrated outreaches either due to lack of funding. This has resulted in significant drop of immunization and VAS coverage.
Figure 2.3: Malnutrition trends in the cluster

28
Child Feeding and Child Care Practices
Across the cluster, initiation to breastfeeding was high above 80 percent implying that mothers
had knowledge on the benefits of breastfeeding. Exclusive breastfeeding across the cluster remained high above 75 percent with Samburu recording the highest at 77.6 percent . Most
mothers continued breastfeeding up to one year and beyond. Complementary feeding indicators
are still poor across the cluster. On introduction of complementary feeds, Samburu recorded the highest at 47.9 percent while Turkana was lowest (36 percent This could attributed to food
insecurity with reduced milk production and consumption reported across the cluster coupled with inadequate knowledge among care givers on complementary feeding practices. In
addition, historical data indicates poor child caring practices across the cluster that contributes
to acute malnutrition. This includes children’s minimum dietary diversity, meal frequency and minimum acceptable diets which have been found to have a direct link to poor nutrition
outcomes.
Water, Sanitation and Hygiene
Hand washing practices at the 4 critical times was less than 30% across the cluster. However,
this is an improvement compared with previous years as attributable to increased awareness on COVID 19 control measures. The proportion of households treating water is still low across
the cluster at less than 25%. In Turkana, water treatment practices dropped from 18.4 percent in 2019 to 9.7 percent in 2021. According to SMART survey 2019, the proportion of
households treating water in Marsabit and Samburu was 22.1 and 2.6 percent respectively.
North Horr and Laisamis recorded 24.6 and 17.5 percent of households treating water respectively. Majority of the households’ reported consuming <15 litres of water per
person/day in Samburu and Turkana which is below the WHO recommended SPHERE standards by 20.3 and 27.4 percent respectively. Latrine coverage in Turkana and Samburu
counties was below 50 percent whereas Marsabit County reported latrine coverage at 54.8
percent; suggesting that open defecation is still predominant across the cluster
2.1.5.8 Education
Access: Enrolment
Enrollment at ECDE level had a significant increase in Marsabit (14%) and Turkana (23%). The increase was attributable to adoption of MOH COVID 19 containment measures, thereby
reducing fear among parents, learners and teachers, absence of scheduled traditional ceremonies, availability of ISMP, timely disbursement of Free Primary Education (FPE), Free
Day Secondary Education (FDSE) and bursary/scholarship programs that ensured prompt
payment of school fees. However, there was a negligible decline in enrollment at Primary and Secondary levels in Turkana and Samburu. Cases of dropouts were minimal across the three
counties in the cluster. Albeit a few cases being reported in Turkana where migration in search of pasture and water due to nomadism; transfers outside the County; the fear associated with
the COVID-19 pandemic which scared away parents from taking their children to school.
Further, Boda Boda business attracted some of the learners who opted to drop out of schools. Teenage pregnancies, truancy, marriages and culture also contributed to the drop out cases
amongst the learners.
Change in Enrolment
Level County Change in Enrollment
Boys Girls Overall
ECDE
Turkana 23% 22% 23%
Marsabit 14% 15% 14%
Samburu 0% 0% 0%

29
Level County Change in Enrollment
Boys Girls Overall
Primary
Turkana -0.07% -0.09% 0.08%
Marsabit 0.90% 0.90% -0.20%
Samburu -10.10% -9.70% -9.7%
Secondary
Turkana -0.20% 0.20% -0.20%
Marsabit 0.04% 0.07% 0.05%
Samburu -19.50% -12.10% -16.3%
Effects of 2021 Long Rains on Schools
The below average amount of rainfall experienced across the cluster had no significant impact
on school infrastructure. Nevertheless, an isolated case of damage to school facilities was reported in Turkana and Marsabit where school roofs and walls were destroyed. The shortage
of rain in the previous two seasons has brought about serious water shortages in Schools in
Marsabit County.
School Feeding Programme
In Samburu County, all the 184 schools and 183 Primary Schools benefited from the In-kind School Meals Programme (ISMP) whereby ministry of education (MOE) purchases food and
distributes to schools. The challenges experienced in provision of school meals included long
procurement process or delay in delivery of food commodities, limited access to water for cooking, lack of cooking fuel and staff (cooks). There was no cash transfer for school meals to
schools, in kind, community and expanded school meals programme. However, there were
reported cases of inadequate food storage facilities in schools in Marsabit County.
Inter-Sector Links
There was no significant effect of COVID 19 on enrolment in school in both Marsabit and Samburu. However, in Turkana County some learners failed to attend school due to parents’
fear for their children contracting covid-19 virus at school. In addition, migration in search of
pasture in some places in Turkana East, North sub counties affected school attendance.
All schools adhered to MoH COVID-19 containment measures such as wearing facemasks,
hand washing, physical distancing and awareness creation of the pandemic. No school has been closed down due to covid-19 across the cluster. Nevertheless, inadequate classrooms in
Samburu and shortage of water were cited across the cluster as a challenge to hand washing.
The three counties reported inadequate sanitation facilities with Marsabit County citing the
highest need. Provision of sanitary packs to girls by the
government and other stakeholders was reported across the cluster. There were no cases of child abuse especially on
labour, physical violence, pregnancy or Sexual and Gender-
Based Violence (SGBV) among boys and girls.
2.2 The Pastoral North-East Livelihood Cluster
2.2.1 Cluster Background
The cluster covers five Counties that include; Isiolo, Garissa,
Mandera, Tana River and Wajir with an area of 193,245 square kilometres and a population of 3,074,018 persons (KNBS 2019
Census). The major livelihoods in the cluster include Pastoral
all species livelihood zone accounting for 51.8 percent of the population, Agro pastoral 19.2 percent, Marginal mixed
farming 7.6 percent, Irrigated 6.4 percent and Informal/Formal Figure 2.4: Pastoral Northeast cluster livelihood zones

30
employment/Business/Petty Trade 5.4 percent. The major sources of cash income in the cluster are; livestock production contributing 60 percent and crop production 30 percent for the
households (Figure 2.4)
2.2.2 Current Drivers of Food Insecurity
Rainfall Performance
The overall performance of long rains of March, April, and May 2021 was below normal across the cluster with exception of Mandera County which had normal rain. The onset of the season
delayed across the Counties. The onset was four dekad late as witnessed in Isiolo and major parts of Tana River County. The amount of rainfall received in Isiolo North, Lagdera, Dadaab,
Garissa Township, Ijara, Galole sub counties and parts of Garsen was 26 to 50 percent of
normal rainfall. Wajir County, Fafi and Balambala sub counties of Garissa County, parts of Isiolo south sub county and Kutulo sub county of Mandera received 51 to 75 percent of normal
rainfall. Most parts of Mandera County received 90-110 percent of normal rainfall. Distribution was poor and uneven in time and space across the cluster. The cessation of the long rains was
early in the second dekad of May in Isiolo and Tana River Counties compared to third dekad
of same month normally. Garissa County cessation was first dekad of May compared to second dekad of May while Mandera and Wajir cessation normal.
Conflict/Insecurity
Resource based conflicts was reported across the cluster resulting to loss of lives and livelihoods. The conflicts derailed livelihood activities such as forage and water resources
search and livestock marketing subsequently leading to a significant shrinking of markets access and prices offered at the remaining operational markets. The areas with conflicts
included in Isiolo County are Garbatulla, Sericho and Korbesa in Garbatulla sub-county,
Alango, Yamicha in Merti and Kom in Charri ward. Other areas with significant conflicts were fanned by cattle rustling in Ngaremara ward in Isiolo. In Wajir County, the areas affected were
Gesdor, Baragothey, Lolakuta North, Onasalat and Gubutonle in Hadado Sub-County and Nurgose and Wellgaras in Wajir West. Additionally, loss of lives, displacement of people,
closure of schools and health facilities and general disruption of livelihoods was reported. In
Mandera County, inter clan conflicts led to loss of lives in Lafey and Mandera South sub counties resulting to over six deaths. In Tana River, influx of livestock in mixed faming
livelihood zones of Kilelengwani, Kipini, Chara, Maziwa and Ozi from other regions resulted in high tension between the farmers and pastoralists. Inter clan conflicts were also reported in
Benane ward in Lagdera Sub County, Garissa County. However, insecurity remain a major
threat along the Kenya-Somalia borders areas of Mandera to Garissa Counties. However, several measures were put in place to address the conflict included sensitization and community
peace dialogues.
COVID-19 Pandemic
A total of 259 confirmed positive cases were recorded in Mandera County resulting to 44 deaths
and 213 recoveries. The pandemic has resulted to restrictions that disrupted markets thereby
adversely impacting food security. The cross border trade with Somalia and Ethiopia was restricted to control cross border spread of the disease. Due to these restrictions, volumes traded
had plummeted in the county’s major markets leading to increased demands and hence higher prices of commodities. Market supplies and volumes continuously dwindled while prices
increased due to high market demands when compared to the previous 2020 long-rains season.
In the event that these restrictions remained in place in the next six months, the markets will continue to experience disruptions. In Wajir County, 103 positive cases with six confirmed

31
fatalities. However, market disruptions due to the pandemic containment measures resulted in income deficits and reduced purchasing power, especially among the urban poor households.
However, the COVID 19 pandemic and its resultant prevention measures had no major impact on food security in the county. In Isiolo County, COVID 19 control measures resulted to loss
of jobs and livelihoods especially among the urban households. In the pastoral livelihood zone,
farmers were offered significantly lower prices for their livestock compared to the pre COVID 19 period. However, this among other factors led to lower purchasing power of a large
proportion of the county population that relied on sale of livestock to access food commodities. In Tana River County, the pandemic restrictions impacted negatively on the livelihood sources
including farm operations and agriculture advisory services. The supply of agricultural inputs
such as pesticides and seeds to the agrovets from Mombasa, Nairobi and other counties was disrupted due to movement restrictions as a result of imposed curfews and lockdowns. Food
commodities supplies such as maize and beans sources from other regions was constrained leading to increased prices. Reduced casual labour was experienced in the irrigation schemes
due to the fear of corona virus infection.
Other shocks and hazards
High food prices, livestock diseases outbreaks (LSD, FMD, CCPP), crop failure in Isiolo and
Tana River Counties, outbreak of Kala-Azar (Visceral Leishmaniasis) in Wajir County with
274 cases and two reported deaths are other hazards contributed to food insecurity in the cluster. The outbreak of Kala-Azar (Visceral Leishmaniasis) was reported in all the sub-counties with
Eldas and Wajir West reporting 108 and 126 confirmed cases respectively.
2.2.3 Current Food Security Situation
The phase classification for counties within the cluster was stressed (IPC Phase 2) except Isiolo
and Garissa counties which are categorized as crisis (IPC Phase 3). The maize stocks held by farmers, traders, millers and NCPB were 34, 88, 80 and 44 percent respectively due to below
normal rainfall over the last two consecutive rain seasons. Pasture and browse condition are
currently fair to poor across the cluster. Livestock body condition for cattle in Tana River, Garissa, Isiolo and Wajir Counties was fair to poor while it was fair In Mandera. High food
commodity prices were noted in the cluster especially cereal prices as all counties reported above long term average prices. Goat prices also varied across the cluster and ranged from Ksh.
3,194 in Isiolo County to Ksh. 4,169 in Mandera County. The prices were above the long term average in Mandera, Garissa and Isiolo counties whereas Wajir and Tana River counties the
prices fell below the long term averages. The Terms of trade were unfavorable across the cluster
with only Garissa reporting above long term average terms of trade where households were able to purchase 45 kilograms of maize compared to 44 kilograms. Consumption of water
within the cluster households averaged between 15-20 litres per person per day except in Garissa County where consumption was less than 10 litres per person per day compared to 15-
20 per person per day. The proportion of households with poor food consumption scores was
highest in Garissa and Tana River ranging between 19.8 and 15.6 percent respectively. However, those with acceptable scores were highest in Mandera and Isiolo at 73.8 and 71.7
percent respectively. The proportion of households employing livelihood coping strategies across the cluster varied however, in Garissa County, households did not employing any coping
mechanisms while 24.3 percent of the households in Isiolo engaged into emergency livelihood
coping strategies. The nutrition situation according to Integrated Phase Classification (IPC) for Acute Malnutrition was Critical (IPC AMN Phase 4) in Garissa, Mandera and Wajir while
Tana River was Serious (IPC AMN Phase 3). Isiolo was not classified due to insufficient evidence. The GAM by WHZ prevalence based on SMART surveys for 2021 were captured

32
for Mandera (20.1%), Wajir (17.9%) and Garissa (17%). While Tana River with no SMART survey used NDMA sentinel data (1.5%).
2.2.4 Food Security Trends
Indicator Short Rain Assessment, February
2021 (Previous Season)
Long Rain Assessment, August
2021 (Current Season)
% of maize stocks held by
households
44% 34%
Livestock body condition
(Cattle)
Good to Fair Fair -Poor
Water consumption (litres per
person per day
11-15 10-15
Price of maize (per kg) 60 68
Distance to grazing in km 8-20 12-15
Terms of trade (pastoral zone) 67 53
Coping strategy index 12 12
Food consumption score Acceptable-62
Borderline-26
Poor-12
Acceptable-58
Borderline-30
Poor-18
2.2.5 Impact of Drivers on Food and Nutrition Security
2.2.5.1 Crop Production
Rain fed crop production
The cluster experiences a bimodal rainfall with the short rains being more reliable for the crop production compared with the long rains. The three major crops grown under rain fed are
maize, sorghum and green grams. Other minor but equally important crops to food security in
the cluster counties are cowpeas and beans. The area planted under maize, sorghum and green grams was 101, 101 and 89 percent of LTA respectively. The increase in area under maize and
sorghum was attributed to provision of assorted seeds, fertilizer and subsidized tractor services by some development partners under the livelihoods recovery programme from the negative
impact of desert locust infestation which was being supported by the Food and Agriculture Organization (FAO) of the United Nations and World Vision in collaboration with the national
and county governments. The area under green grams declined due to delayed onset of the long
rains that caused some degree of uncertainty about performance of the cropping season. The production of sorghum was 24 percent above the LTA due to increase in the area planted and
provision of quality seeds and fertilizers during the cropping season. However, the production of maize and green grams was 86 and 96 percent below the LTA attributed to below average
rainfall performance that resulted to crop wilting due to poor moisture leading to a near total
crop failure.
Rain fed crop production in the cluster Crop Area planted
during 2021
long rains
season (Ha)
Long term average (5
year) area planted
during the short rains
season (Ha)
2021 long rains
season production
(90 kg bags)
Projected
Long term average (5
year) production
during the short
rains season (90 kg
bags)
Maize 4,795 4,755 9,555 66,383
Sorghum 1,523 1,504 6,997 5,654
Green
Grams
1,019 1,141 590 14,234

33
Irrigated Crops
The three major crops grown under irrigation are maize, cowpeas and bananas. Other crops
grown under irrigation included mangoes, watermelon, green grams, kales and tomatoes. Irrigation was mainly practiced along river Tana in Garissa and Tana River Counties while in
Wajir it was done by use of shallow wells/water pans and Mandera relied on seasonal River
Daua. The area planted under cowpeas and bananas increased by 12 and 10 percent respectively attributed to provision of assorted seeds, fertilizers and subsidized land preparation services by
some development partners in collaboration with the national and county governments under the desert locust livelihoods recovery programme. However, area under maize reduced by nine
percent compared to the LTA due to crop rotation and market intelligence on the price
speculation at the markets. The production of bananas, cowpeas and maize was 117, 93 and 48 percent of the LTA. Production of bananas increased by 17 percent above the LTA as a result
of provision of improved varieties and increased acreage. Maize production declined by 52 percent due to high infestation of the Fall Armyworm which has a high preference for maize
compared to other food crops and especially at a time when other vegetation cover had been
reduced by the below average long rains performance. Production of cowpeas declined by seven percent below the LTA due to shortage of labour as a result of COVID 19 containment
measures that advised people to remain at homes in order to minimize the disease transmission.
Irrigated cropping in the cluster Crop Area
planted
during 2021
Long rains
season (Ha)
Long Term Average
area planted during the
Long rains season (Ha)
2021 Long rains
season production
(90 kg bags)
Projected
Long Term Average
production during the
Long rains season (90
kg bags)
Maize 2,493 2,731 18,520 38,736
Cowpeas 928 830 3,501 3,761
Bananas 878 795 13,340 11,440
Cereal Stocks
The main cereal stocks available in the cluster were maize, rice, sorghum and green grams. The maize stocks held by farmers, traders, millers and NCPB were 34, 88, 80 and 44 percent
respectively. Reduced stocks held by farmers was attributed to the poor harvest which was caused by below normal rainfall over the last two consecutive rain seasons. Rice stocks held
by farmers, traders and millers were six, four and 22 percent above the LTA due to imports
from other areas as a strategy to bridge the food deficits caused by the below average rainfall performance. The sorghum stocks were projected to increase once the farmers started
harvesting of the crop. The stocks held at the NCPB was attributed to the national government interventions to mitigate food shortage as a result of the projected below average yields caused
by below normal rainfall performance.
Cereal stocks in the cluster
Agencies Maize Rice Sorghum Green grams
Current LTA Current LTA Current LTA Current LTA
Farmers 8,114 23,859 955 905 3,072 4,595 1,886 6,349
Traders 33,013 37,376 92,823 89,427 9,575 16,368 3,295 4,491
Millers 1,900 2,363 0 0 0 20 0 0
NCPB 3,855 8,740 36,700 30,040 1,220 12,015 705 1,225
Food AID 0 7,700 0 13,000 12 21,500 0 1,900
Total 46,882 80,038 130,478 133,372 13,879 54,498 5,886 13,965

34
2.2.5.2 Livestock Production
Livestock production contributed 45 and 85 percent of cash income in the agropastoral and
pastoral livelihood zones respectively. The main livestock types reared are camels, cattle, sheep, goats and donkeys.
Pasture and browse conditions
Pasture and browse condition was fair to poor across all the livelihood zones in the cluster compared with fair for pasture and good to fair for browse at a similar period of the year. In
Wajir, Isiolo, Tana River and Garissa, pasture was poor especially in pastoral areas. In the pastoral and agropastoral livelihood zones, pasture is projected to last for 1-2 months compared
with 2-3 months normally. Browse in the pastoral and agro pastoral livelihood zones is
projected to last 1-2 months compared to normal of 2-4 months. However, in pastoral areas in Tana River and Wajir, pasture is projected to last less than one month due to poor regeneration
as a result of below average long rains performance. Several factors in the cluster limited access to pastures included resource based conflicts in parts of Mandera and insecurity in parts of
Garissa and Isiolo. The invasion by Prosopis juriflora (Mathenge) in parts of Tana River,
Wajir, Isiolo and Garissa affected establishment of pasture in the grazing areas. In Isiolo County, invasive plant species Acacia reficience invaded Oldonyiro ward. However, tsetse fly
and tick infestation were reported in Kinna ward of Isiolo County around the border of Bisan Adhi and Meru National park limiting the access to pasture and browse. In Isiolo County, also
inadequate water in dry grazing areas in Yamicha and Alango coupled with bush fires in Cherab
and Sericho limited forage access.
Pasture and browse condition Livelihood
zone
Pasture condition Browse condition
Current Normally Projected
Duration to
last
(Months)
Current Normally Projected
Duration to last
(Months)
Pastoral all
species
Fair to
poor
Fair 1-2 Fair to poor Good to
fair
2-3
Agro
pastoral
Fair to poor Fair 1-2 Fair to poor Good to
fair
2-3
Pasture conservation status
Pasture across the cluster was mainly conserved as baled hay and/or loosely tied hay bundles.
In Tana River County, pasture conservation was supported by Regional Pastoral Livelihood
Resilience Project (RPLRP) and Pastoralist Girl Initiative (PGI) while National Irrigation Authority (NIA) Hola scheme, was involved in pasture conservation. In Tana River and Isiolo
counties, pasture conservation was majorly undertaken by farmer’s groups. However, the conserved hay was mainly utilized by individual pastoralists who buy in small quantities to
feed their milking herd. The utilization of hay was limited due to perceived high price,
insufficient storage facilities near the farms, beliefs among the pastoralists that pasture was a free input in livestock production system, lack of technical skills in pasture conservation and
lack of incentives in pasture conservation. There was minimal use of crop residues as livestock feed especially in the agropastoral zones in the cluster. The cluster had 27 hay stores with a
capacity of 328,000 bales but it hold 62,750 bales during the period under review. The average weight per bale was 12–18 kilograms marketed at Ksh. 300–500 per bale.

35
Hay Conservation Status County No. of
Hay
Stores
Storage
Capacity
(bales)
No. of Bales
currently
being held
Average
Weight per
bale (in
Kgs)
Average
price per
bale (Kshs.)
Comments – E.g.
percentage held
by farmers and
other Institutions
Garissa 0 0 0 0 0 -
Tana
River
3 10,000 200 12 300
100% held by
farmers
Wajir 19 218,000 61,650 18 500 100% Farmers and
100% Livestock
Training Institute
Mandera 0 0 0 0 0 -
Isiolo 5 (Only 3
utilized)
100,000 900 0 300 3,500 bales of hay
currently being
held by farmers
and farmers
groups
Total 27 328,000 62,750 12-18 300-500
Livestock body condition
In all the livelihood zones, the livestock body condition for cattle was generally fair to poor compared to good to fair normally. Sheep had a generally fair body condition compared good
body condition in all the livelihood zones except in some pastoral areas of Wajir and Isiolo
Counties where body condition was poor. Camel body condition was fair to good compared to good normally across all the livelihood zones. Deteriorating trend in body condition across the
livelihood zones was due to the depletion of both forage and water resources resulting to long return trekking distance to watering sources and decreased watering frequencies. The fair to
poor body condition has negatively affected livestock prices and milk availability and
consumption at household level across the livelihood zones. However, with the faster rate of depletion of the available forage and water, livestock body condition is likely to decline further
which will contribute negatively to food security situation at household as a result of reduced milk production and decline livestock prices.
Livestock body condition Livelihood
zone
Cattle Sheep Goat Camel
Current Normally Current Normally Current Normally Current Normally
Pastoral
all species
Fair to
Poor
Fair Fair Good Good to
Fair
Good Good to
fair
Good
Agro
pastoral
Fair Good Fair Good Good to
Fair
Good Good to
fair
Good
Tropical Livestock Units (TLU)
The TLUs were generally below average for both poor and middle income groups across all
the livelihood zones. TLUs declined by 35 percent for poor income households in the pastoral compared to normal. The TLUs for medium income households in pastoral and agropastoral
livelihood zones decreased by 25 and 19 percent respectively across the cluster compared with
normal. Declined TLUs were reported in Garissa, Isiolo and Tana River Counties. However, in Mandera, average TLUs per household for both poor and middle-income households
increased by one due to maturing of calves and favorable weather conditions. The decline in TLUs was attributed to previous droughts which resulted to livestock deaths, high incidences
of livestock diseases outbreaks and cattle rustling.

36
Tropical Livestock Unit (TLUs) by Household Income Groups Livelihood zone Poor income households Medium income households
Current Normal Current Normal
Pastoral 2-7 4-10 5-16 8-20
Agro-pastoral 2-8 3-7 5-16 10-16
Milk production, consumption and prices
Household milk production in both the agropastoral and pastoral livelihood zones was below than the long-term average due to the deteriorating livestock body condition and migrations of
livestock in search of pastures. Milk production in the pastoral and agropastoral livelihood
zones, declined by 25 and 43 percent respectively compared to LTA due to fair to poor forage resources (Table 9). Declined milk production was highest in Isiolo County due to dry milking
herds except for camels. Milk prices increased by 38 and 31 percent in pastoral and agropastoral livelihood zones respectively compared to the LTA. In all the livelihood zones, milk
consumption reduced due to reduced production, increased cost of milk and reduced purchasing
power among most households.
Milk production, consumption and prices Livelihood zone
Milk Production
(Litres)/Household
Milk consumption (Litres)
per Household
Prices Ksh per/Litre
Current LTA Current LTA Current LTA
Pastoral 0-3 2-6 0-1.6 1-4 60-120 50-80
Agro pastoral 1-3 2 -5 0-2 1-2.4 50-120 50-80
Water for livestock
The return trekking distances from grazing area to watering points increased by 133 and 29
percent in the pastoral and agropastoral livelihood zones respectively compared with normal.
Increased trekking distances was attributed to low recharge of open water sources and subsequent drying up of the most water pans due to below average long rains. Watering
frequencies in cattle was between 1-3 days per week across the livelihood zones compared to normal of 3-7 days per week. Sheep and goat were watered after every 2-4 days compared to
3-7 days per week normally across the livelihood zones. Camels were watered after once per
week compared to 2-5 days normally across the cluster. However, water sources in the cluster are expected to last between 1-2 months compared to 3-4 normally. Mandera County was worst
hit as most of open water sources may not last for more than a month. Trekking distances and watering frequency are likely to reduce further owing to projected decrease in available open
water sources until next season.
Water for Livestock in the Cluster Livelih
ood
zone
Return
distance-
KM
Expected
duration to
last
(Months)
Watering frequency (Days per week)
Cattle Camels Goats Sheep
curr
ent
nor
mal
Curr
ent
nor
mal
Curr
ent
Nor
mal
Curr
ent
Nor
mal
Curr
ent
Nor
mal
Curr
ent
Nor
mal
Pastora
l
8-20 2-10 <1-2 1-3 1-2 3-7 <1-1 2-5 2-3 3-7 2-3 3-7
Agro-
pastoral
4-14 4-10 <1 1-3 1-3 3-7 <1-1 2-5 2-4 3-7 2-4 3-7

37
Migration, livestock diseases and mortalities
Internal migrations of livestock from wet grazing areas to dry grazing areas were reported
across the cluster. Over 60 percent of all livestock types migrated across the cluster. However, cross county migration was reported in Isiolo where livestock from Oldonyiro ward moved to
Laikipia West Sub-County and Samburu County. In Wajir and Garissa counties, livestock
moved to Isiolo County in search of forage and water resources. Livestock also migrated from Lagdera Sub-County in Garissa County to Wajir County. Livestock migration will likely
increase towards September with continued diminishing forage and water resources.
Several livestock diseases were reported across the cluster. Trypanosomiasis was reported in
parts of Garissa and Contagious Bovine Caprine Pleuropneumonia (CBPP) in Tana River and
parts of Mandera resulting in cattle deaths in Mandera. Contagious Caprine Pleuropneumonia (CCPP) was reported in Mandera, Tana River and parts of Garissa. Cases of Peste des petit
ruminants (PPR) in shoats were reported in Garissa (Garissa Township) and Mandera County. Flu and Hemorrhagic Septicemia in camels was reported in parts of Garissa and Wajir.
However, Foot and Mouth Disease (FMD) was reported in Wajir and Tana River due to in-
migrations of livestock towards Tana Delta sub-county. Other endemic livestock diseases in the cluster include; CCPP, PPR, Sheep and Goat Pox (SGP) and CBPP. Trypanosomiasis was
prevalent in Tana River, Wajir and Garissa while tick paralysis was present in Wajir. The Veterinary Services in the cluster continued to support disease surveillance, vaccination,
treatment and pest control. Mortality rates in livestock types across the cluster was normal and
mostly attributed to natural causes.
2.2.5.3 Market Performance
There were no major market disruptions reported except for Belgesh, Duse and Escot in Isiolo and Madogo in Tana River all due to insecurity. Available food commodities within the
markets during the season included maize, sugar, rice, beans, posho, bananas, tomatoes, meat,
milk and wheat flour. Markets in Tana River were well provisioned unlike those in other counties within the cluster. Supply sources for food commodities in the markets included
Nairobi, Thika, Meru, Nanyuki, Somalia, Ethiopia, Samburu and Marsabit.
Market prices
Remarkably high food commodity prices were noted in the cluster especially cereal prices as
all counties reported above long term average prices. The lowest maize price per kilogram was
recorded in Isiolo county at Ksh. 56 and highest in Mandera County at Ksh. 83. Goat prices
also varied across the cluster and ranged from Ksh. 3,194 in Isiolo County to Ksh. 4,169 in
Mandera County. The prices were above the long term average in Mandera, Garissa and Isiolo
counties whereas Wajir and Tana
River counties the prices fell below
the long term averages.
Terms of trade
The Terms of trade were
unfavorable across the cluster with only Garissa reporting near average
terms of trade where households
were able to purchase 45 kilograms of maize compared to 44 kilograms
normally. In Tana River County, households were able to buy 58 Figure 2.5: Comparative terms of trade

38
kilograms of maize from the sale of a medium sized goat compared to the long term average of 68 kilograms. Isiolo, Wajir and Mandera counties reported terms of trade at 57, 50 and 50
respectively compared to the long term average of 58, 71 and 53 kilograms
2.2.5.4 Water Access and Availability
The main sources of water for domestic use are boreholes, pans/dams, shallow wells, Benane
springs in Garissa, and rivers such as Tana, River Dua, Isiolo, and Ewaso Nyiro, Bisan. Other sources include Berkads” (Underground Tanks) Infiltration Gallery Wells (IGWs) in Mandera
County. The long rains recharged water pans and dams by 10-30 percent in Wajir, Isiolo, Tana
River and pastoral areas of Garissa. However, open water sources in most parts of Mandera and southern parts of Garissa were fairly recharged by about 60 percent. Remaining water in
pans/dams in Mandera and southern parts of Garissa may last for about 2-3 months. About 70-90 percent of water pans in Isiolo, Wajir and pastoral areas of Garissa and Tana River were
dried up and water levels in shallow wells had significantly declined. River flows have reduced
in Isiolo mainly due to upstream over abstraction for irrigation with some rivers such as River Ewaso Nyiro and Rikiundu drying up.
Return distances to water sources are within the normal range of 5-10 kilometres in Mandera and Wajir. Return distances in the pastoral zones of Isiolo and Tana River increased from the
normal 1-3 kilometres to 2-5 kilometres. Return distances remained at five kilometres in the
agro-pastoral zone of Garissa but increased from the normal 5-10 kilometres to 10-15 kilometres in the pastoral zone. Highest return distances to domestic water sources of 15-18
kilometres was recorded in Modogashe ward and pastoral areas in Balambala sub-county. Waiting time was within the normal 5-20 minutes in Tana River, Isiolo and agro-pastoral
livelihood zone of Garissa. Households in the pastoral areas of Mandera and Garissa are waited
for 40-60 minutes to collect water. However, increased waiting time of 1-2 hours was recorded in Wajir and pastoral areas of Balambala, Fafi and Modogashe wards in Garissa from the
normal 30-60 minutes due to drying up of water pans and reduced yield of shallow wells.
Cost for a 20 litre jerrycan was normal at Ksh. 2-5 in Mandera, Isiolo, Wajir and mixed and
marginal mixed farming livelihood zones of Tana River County. Cost of water was average at
Ksh. 5-10 in Garissa and pastoral zones of Tana River compared to normal Ksh 3-5. Households with individual connection paid between Ksh. 200-300 shillings per month. Water
vendors in Modogashe in Isiolo are sold water at Ksh. 10 per 20 litre jerrycan. However, cost of water increased from the normal Ksh. 5 to Ksh. 20-30 per 20 litres jerrycan in Garissa
Township and isolated areas in Maalimin and Benane wards in Garissa. Highest cost was noted
in Modogashe town where vendors are selling between Ksh. 30-50 per 20 litres jerrycan. Water consumption was 15-20 litres per person per day in Mandera and pastoral zone of Wajir and
Tana River. Water consumption reduced from the normal 15-20 litres per person per day to 7-10 litres per person per day in the pastoral areas of Garissa and Isiolo. Water consumption was
within the normal range of 20-30 in the agro-pastoral/marginal mixed farming zones of Isiolo, Wajir and Garissa and mixed farming areas of Tana River. Exceptional cases were noted in
Modogashe and Sabina ward in Garissa where households are consuming an average of five
litres per person per day.
2.2.5.5 Food Consumption
Garissa County registered the highest proportion of households with poor food consumption at
19.8 percent compared to 6.1 percent in Wajir County. Mandera County had the highest number
of households with acceptable food consumption at 73.8 percent compared to Tana River
County at 37.4 percent. In Isiolo County, the proportion of households categorized as having

39
poor, borderline and acceptable food consumption was at 8.1 percent, 20.2 percent and 71.4
percent respectively. The was an improved dietary diversity due to the Eidhul-Adha festivities
where a lot of animals are slaughtered through the Qurbani programme and the meat distributed
among the poor households.
2.2.5.6 Coping Strategies
The proportion of households employing livelihood coping strategies across the cluster varied.
The highest proportion of households employing stressed coping mechanisms were in Isiolo
County (42.8 percent). In Isiolo, Mandera, Wajir and Tana River Counties, households
employing emergency livelihood coping strategies were 24.3, 15.7, 12.6 and 4.5 percent
respectively. Majority of the households who were employing crisis coping strategies were in
Tana River County (48 percent). In Mandera, Wajir and Isiolo Counties, households employing
crisis coping strategies were 25.7, 14 and 11.6 percent respectively. Tana River County
registered the highest number of households with stressed coping strategies at 85.5 percent.
Coping strategies commonly applied include relying on less preferred food, borrowing food,
reducing number of meals and reducing portion size and quantity for adults. The average
coping strategies across the cluster is stressed at 69.2 percent
2.2.5.7 Health and Nutrition
Nutrition situation according to
Integrated Phase Classification
(IPC) for Acute Malnutrition was
Critical (IPC AMN Phase 4) in
Garissa, Mandera and Wajir while
Tana River was Serious (IPC AMN
Phase 3). Isiolo was not classified
due to insufficient evidence. The
GAM by WHZ prevalence based on
SMART surveys for 2021 were
captured for Mandera (20.1%),
Wajir (17.9%) and Garissa (17%).
While Tana River with no SMART
survey used NDMA sentinel data (1.5%). The main drivers of acute malnutrition across the
cluster were food insecurity with reduced milk consumption, sub-optimal coverage of health
and nutrition programs, poor WASH and high morbidity.
Morbidity and mortality
Morbidity remains a key driver to malnutrition in cluster. The most prevalent diseases are upper
respiratory tract infections (URTI), malaria and diarrhoea for children under the age of five years across the cluster. The prevalence of URTI was highest Wajir, Mandera, Tana River,
Garissa and then Isiolo with highest peak in March 2021. Diarrhoea prevalence was high
Mandera, Wajir, Garissa and Tana River in that order, however, as May-June 2021, prevalence of diarrhea was high in Isiolo.
Effects of COVID 19 Pandemic on Essential Services
As of August 2nd 2,308 COVID-19 cases have been reported in the cluster. Health and nutrition
programs are ongoing with minimal interruption compared to the same period last year when
we had the outbreak. Interventions are currently being implemented in conformity with the
Figure 2.6: GAM Trends (2017 to 2021)

40
COVID-19 Infection Prevention and Control (IPC) measures. The demand for health services
improved and routine health activities resumed following heighted community mobilization
and messaging to create awareness and educate communities on COVID-19.
Immunization and Vitamin A Supplementation
Mandera, Tana River, Isiolo and Wajir counties recording lowest immunization coverage for measles, full immunization and OPV3 based on routine coverage data analysis, with all
counties routine data coverage at below 60 percent. Vitamin A supplementation coverage based on routine data indicates a very varied picture with Isiolo and Tana River have very good
coverage (96.2 and 81.4% respectively), while Garissa and Mandera had low coverage (50.4
and 23.7% respectively)
Child Care Practices and Dietary Intake
Child care practices for the 2021 LRA analysis reported practices based on historical data from MIYCN KAP surveys conducted in 2017 (outside the 3yr limit for contributing factors
evidence use). According to the survey results, exclusive breastfeeding practice was less than
the national target of 80 percent within the cluster. However, Mandera (68.3%), Wajir (69.9%), and Isiolo (74.1%) are better compared to Garissa (43.4%) and Tana River (49.6 %) Counties.
Continued breastfeeding up to one year was above 60 percent for all Counties, which is a good practice but it deteriorated towards two years and beyond except in Tana River. There is need
for more up to date MICYN KAP data for the cluster.
2.2.5.8 Education
Access: Enrolment rate
Enrolment in across ECDE, primary and secondary levels of education in Garissa County declined by 4.5, 3.5 and 2.5 percent respectively. However, in Mandera county the enrolment
declined marginally by 0.4 percent at secondary level. In contract to Garissa and Mandera; Isiolo, Tana River & Wajir counties reported increased enrollment at all levels of education.
The decline in enrollment for Garissa County at primary and secondary levels which was
attributed to the long break occasioned by COVID 19, early pregnancies, early marriages, nomadic way of life and children engaging in income generating activities such as BodaBoda
riding. On the other hand; the decline in enrollment at ECDE level for Garissa County was attributed to migration due to nomadic way of life. Despite the COVID 19 pandemic, increased
enrolment at the ECDE level was attributed to the provision of porridge by MOE and WFP in
Mandera and to enrollment drives and mobilization by local administration through the government’s 100 percent school transition programme in Wajir County. Transitions drives
also led to increased enrollment across the secondary level. While both Isiolo, Tana River and Wajir counties registered stable to increased enrollment at all levels; Wajir posted the highest
increase of 9 percent at ECD level, Tana River had the highest increase of 28.5 percent at the
primary level while Wajir had the highest increase of about 12 percent at the secondary level.
Enrolment in the Cluster Enrolment County Percent change Reasons For the change
ECD Garissa -4.5 Migration due to nomadic way of life
Mandera 8.4 Provision of feeding at school
Isiolo 4.5
Tana River 0.1
Wajir 9.0
Primary Garissa -3.5 Drop outs due to teenage pregnancies
Mandera -0.4 Slight decline

41
Enrolment County Percent change Reasons For the change
Isiolo 5.5
Tana River 28.5
Wajir 17.0 Enforcement of school attendance
Secondary Garissa -2.5
Mandera 5.0
Isiolo 2.0
Tana River 11.7
Wajir 6 Enforcement of school attendance
School Meals Programmes
The school feeding programmes across the counties in the cluster included the in-kind school meals program-ISMP in Isiolo, Mandera and Wajir; expanded school meals programme–
ESMP in Garissa and the regular school meals programme–RSMP in Garissa and Tana River
counties. All counties secondary school meals in the cluster were catered by payment of individual students. However, in some counties, secondary school learners could not afford to
pay for meals leading to declined retention in school. While school feeding programmes were in 182, 116, 295 and 178 centers in Garissa, Isiolo, Mandera, and Tana River counties
respectively; 9 new schools in Mandera did not have school feeding programs as they were not
registered in the previous year.
The school meals had a positive impact on access, participation and retention as it resulted in
improved performance, increased attendance across all levels, increased enrolment at ECD and lower primary school levels, reduced age of entry into schools and led to higher retention and
completion across all levels. School meals programs faced several challenges such as
inadequate food to cater for all learners especially for public ECDE centers and Day secondary schools; logistical challenges like delay in procurement especially for ECDE centers, storage
and distribution; lack of permanent and safe water sources in most of the schools that makes it difficult for the meals to be provided in a safe and hygienic environment and the lack of policy
to guide the meal programme in ECDE. In some counties food was available but not cooked
due to lack of water, especially for ECDEs, thereby making learners to depend on food from SMP from the primary sector. Additionally, kitchen gardens are rarely established to
supplement the school meals program due to inadequacy of water and water storage facilities.
Water, Sanitation and Hygiene
Water, sanitation and hygiene in all public schools in the cluster was below average as a result
of the below average performance of the long rains that led to limited access to clean drinking water. Water and sanitation situation was further impacted by most of the learning institutions
lack of permanent water sources and storage facilities. The cluster had inadequate sanitation facilities raging from hand washing facilities, latrines and drinking water points. Most schools
do not conduct hand washing practices due to inadequate supply of water even where the
facilities are available. In fact, 41 ECDE centres and 26 primary schools did not have hand washing facilities. However, all the secondary schools have installed hand washing facilities.
Water supplies in some schools remain a challenge that need to be addressed.

42
2.3 The Agro Pastoral Livelihood Cluster
2.3.1 Cluster Background Information
The cluster comprises of West Pokot, Baringo, Nyeri
(Kieni), Narok, Kajiado and Laikipia Counties and covers an area of 71,471.7 square kilometers. It has a
population of 4,281,198 persons (KNBS 2019 census) and six main livelihood zones. The zones include Mixed
Farming, Pastoral, Marginal Mixed Farming, Agro
Pastoral, Formal employment/Tourism/Business and Irrigated Crop livelihood zones with a population
proportion of 31, 27, 20, 11, 10.7 and 0.7 percent respectively. Livestock and cash crop production are
the leading sources of income accounting for 75 percent
and 55 percent the total household income in the cluster.
2.3.2 Current Drivers of Food Insecurity
Rainfall performance
The onset of long rains of March to May 2021 was late across the cluster. Most parts of Cluster received
average rains which constituted 91-110 percent of normal rains while the larger part of Kajiado South received 51-75 percent of normal. The southern parts of Kajiado Central and Kajiado
East, and the northern parts of Kajiado South, Laikipia West and Laikipia North, parts of
Mugunda and Gakawa of Nyeri, greater part of Pokot Central and a section of Pokot received 76-90 percent of normal, the temporal distribution was poor and spatial distribution was uneven
across the cluster. The cessation was early across the cluster
Conflicts/ Insecurity
Resource based conflict were reported in parts of Baringo county namely Kapedo East and
West sub-locations in Silale ward, Tiaty Sub-County, attracting a massive security operation in the areas to restore law and order. The conflict has led to food to market closure in the
affected areas while movement of goods and transport services have come to a halt. The conflict has resulted in disruption of livelihood activities and displacement of populations while
provision of health and education services has been affected as some schools have been shut down mainly in Silale ward. Insecurity associated with cattle rustling were also reported in Ol-
moran and Sipili Laikipia County. In Kajiado County, communities bordering game reserves
in Entonet/Lenkism, Olongulului and Matapato South Wards reported wildlife invasion into their lands mainly from wild beasts, elephants, giraffes, zebras and antelopes, hindering them
from accessing pasture and browse for their livestock. Destruction of crops by the wild animals was also reported in Kimana, Rombo and Kuku wards. Cases of human-wildlife conflict in
Nyeri County were also experienced in Riiru area of Mweiga ward. A herd of about 300 cattle
believed to originate from Laikipia County was spotted in Kieni East Sub County, Gakawa ward. Such movement are common in the region during dry spell and more of such in
migrations are expected as the dry spell progresses, which will lead to competition over dwindling resources and resource-based conflicts.
COVID-19 Pandemic
In Baringo COVID-19 restriction measures are still affecting market operations. The night
curfews are hampering movement of goods and services while uptake of health services is still
Figure 2.7: Agro pastoral cluster livelihood zones

43
low compared to the previous seasons due to fear of contracting the disease at the health
facility. In West Pokot, due to Covid 19 measures, market operations close relatively early thus
limiting hours of trade. Community members who travel from far-off to markets have been
sometimes discouraged to travel to markets as expected for fearing to be caught by curfew
hours outside their homes. The community has however tried to work within the curfew hours
to transact their businesses in the effort to cope with the challenge. Market volumes have
decreased due to restriction of movements to and from Uganda, which normally provides a
significant supply of most commodities. In Kajiado and Narok the impact of the COVID-19
pandemic is minimal, however, some sectors such as health whose indicators were affected in
the last year are yet to catch up.
Insecurity/Conflicts
There was insecurity in some parts of Baringo and West Pokot Counties arising from resource-
based conflicts in the area. In Baringo County, Insecurity is posing challenges in the Pastoral
areas of the county mostly in Tiaty and Baringo South sub counties whereby incidents of
banditry were reported. The most affected wards were Mukutani in Baringo South Sub County
and parts of Mochongoi ward. The insecurity affected market operations and movement of
goods and services was severely affected. Normalcy is slowly returning in the affected areas
with the government reopening livestock markets in July. In West Pokot County, there had
been tension at the border of West Pokot and Turkana Counties after over 300 heads of cattle
from Turkana County was stolen. The situation is currently calm as the security personnel were
immediately deployed in the area in an effort to recover the stolen stock. There is restricted
grazing at the hotspot currently.
Other Shocks and Hazards
Livestock diseases reported in the cluster include, contagious caprine pleuropneumonia
(CCPP) and Pests des Petits Ruminants (PPR), Lumpy Skin Disease (LSD) and Foot and Mouth Disease (FMD) in Baringo, West Pokot and Kajiado Counties. Crop diseases cited were Fall
Army Worm (FAW) in Baringo, Kajiado, Laikipia and West Pokot Counties and Frost bite and
Blight in potatoes and beans being a major threat in Nyeri County. Other Crop disease such as Maize Lethal Necrosis Disease (MLND) affected about 2-5 percent of maize in Narok West
resulting in reduced yields. Pests such at tuta absoluta that affected tomatoes leading to reduced production
2.3.3 Current Food Security Situation
The integrated food security phase classification for Agro pastoral cluster is IPC phase two except for West Pokot and Narok Counties which are in phase one. Households’ stocks within
Kajiado, Narok, Nyeri and Baringo counties are currently holding maize stocks above long-
term average while West Pokot and Laikipia Counties are holding maize stock which is below long-term average by 35 and 19 respectively. Pasture and browse conditions were good to fair
in Baringo, Kajiado and Narok counties while it is fair to poor in Nyeri, Laikipia and West Pokot counties. Pasture is expected to last 1-2 while browse is expected to last 2-3 months in
the cluster. Livestock body condition for all species ranged from good to fair in Baringo,
Kajiado and Narok while the other remaining counties the conditions was fair to poor. Maize market prices across the cluster by five to ten percent above the long-term average while the
Laikipia County reported 15 below average. Goat market prices in cluster were above average except for Nyeri County where the price was below average. Terms of trade recorded across
the cluster with a medium size goat was above the long-term average except for Nyeri County
where it below the long-term average. Water consumption ranged between 8 – 30 liters per

44
person per day across the cluster except for Narok and Nyeri counties which recorded high consumption of between 20-40 liters per person per day. A high proportion of households
within the cluster counties recorded acceptable food consumption score except for Narok County which recorded eight percent of household with poor food consumption score.
Households employed normal coping strategies ranging between 1.8 -8.3 except for Baringo
which recorded high coping of 12.7. Proportion of children under 5 years at risk of malnutrition based on Mid Upper Arm Circumference (MUAC) ranged between 1.2 and 10.4 percent except
for Nyeri where none of the children was found to be at risk
2.3.4 Food Security Trends
Indicator Short Rain Assessment,
February 2021 (Previous
Season)
Long Rain Assessment,
August 2021 (Current
Season)
% of maize stocks held by households 44% 54%
Livestock body condition (Cattle) Good to Fair Good
Water consumption (litres per person
per day
11-15 10- 20
Price of maize (per kg) 60 47
Distance to grazing in km 8-20 5-10
Terms of trade (pastoral zone) 67 74
Coping strategy index 12 9
Food consumption score Acceptable-62
Borderline-26
Poor-12
Acceptable-77
Borderline-22
Poor-1
2.3.5 Impact of Drivers on Food and Nutrition Security
2.3.5.1 Crop production
Rain fed crop production
The cluster is mainly dependent on the long rains season for crop production. Crop production
contributes 30 percent food and about 40 percent to cash income for households. The main crops grown in the cluster were maize, beans, Irish potatoes and sorghum. The area planted
under maize, beans and Irish potatoes was within the LTA at 95, 103 and 101 percent of LTA
respectively. The production of maize, beans and Irish potatoes was 72, 53 and 75 percent of the LTA respectively which was attributed to poor rainfall performance. Baringo county
experienced fall army worm infestation which affected about 21 percent of the area planted in Eldama Ravine, Baringo South and Baringo Central Sub Counties. Scarcity of certified Irish
potato seed impacted negatively on production in Kajiado County. On average approximately
10-75 percent crop failure was experienced across the cluster.
Rain fed crop production Crop Area planted during
2021 long rains
season (Ha)
Long term average
area planted during
the long rains season
(Ha)
2021 Long rains
season production
Long term average
production during
the long rains season
Maize 190,110 200,277 3,601,945 5,017,868
Beans 111,481 107,553 704,302 1,315,718
Irish Potato 15,615 15,433 937,490 1,241,204

45
Irrigated crop production
Irrigation is mainly done in irrigation schemes and along rivers. The main crops grown under
irrigation were maize, tomatoes and cabbage. Others were bulb onions, watermelon, seed maize and French beans. The area under maize and cabbages was 74 and 66 percent of the LTA
respectively while Tomatoes was slightly above the LTA (five percent). A significant reduction
in acreage for maize and beans was experienced in West Pokot County due to reduced low in rivers and inadequate water in dams and pans. Laikipia county experienced high cost of farm
inputs and cost of labour compared to the previous season. The projected production for maize and cabbage is 76 and 21 percent of the LTA respectively while tomatoes production was
within the LTA. Reduction production of maize and cabbages was attributed to reduced area
under the crops.
Irrigated crop production Crop Area planted
during 2021
Long rains
season (Ha)
Long Term Average
(3 yr.) area planted
during the long
rains season (Ha)
2021 long rains
season
production (90
kg bags)
Projected
Long Term
Average (3 yr.)
production
during the long
rains season (90
kg bags)
Maize 700 944 14,000 18,436
Tomato 2,409 2,279 67,644 69,862
Cabbages 792 1,198 22,468 103,147
Cereal Stocks
The main stocks in the cluster were maize sorghum and green grams. The total maize stock in the county was 11 percent above the LTAs, sorghum stock 79 percent of the LTA and green
grams was within the LTA. Most of the maize (44 percent) held by households in the cluster was in Narok and Kajiado and was mainly carry over stock from the previous season and
harvests from the long rain seasons. Laikipia, Nyeri and West Pokot had below average maize
stock. Maize stock with traders increased by 30 percent for speculative purpose in anticipation of shortage due to poor performance of the season. Maize stock in Baringo is expected to last
for 1-3 months compared to 3-5 months normally, one month in West Pokot compared to two months normally, three months in Laikipia compared to four months normally and 2-3 months
in Kajiado and Nyeri (Kieni) which is comparable to a normal season.
Cereal stocks
Maize
Sorghum
Green Grams
Current LTA Current LTA Current LTA
Farmers 676,680 627,478 280 1528 503 620
Traders 347,243 266,624 2038 1293 830 700
Millers 82,342 117,112 12 120 - -
NCPB 29,817 10,270 - - - -
Total 1,136,082 1,021,484 2,330 2,941 1,333 1,320
2.3.5.2 Livestock Production
Livestock production contributes 22–35 percent to cash income in Mixed Farming livelihood
zones, 40-60 percent in the Marginal Mixed Farming zone, 60-88 percent in the Pastoral and
48-66 percent in Agro Pastoral livelihood zones. The main livestock species kept in the cluster
are cattle, sheep, goats, camels and poultry. The pasture condition was good in Mixed Farming

46
and Irrigated Cropping livelihood zones, fair in the Pastoral and Agro pastoral Livelihood
zones and fair to poor in the Marginal Mixed Farming livelihood zone which is within normal
seasonal range. The browse condition was good across all livelihood zones. The pasture is
expected to last for 1-2 months in the Mixed Farming, Pastoral and Agro Pastoral livelihood
zones, 1 months in the Marginal Mixed Farming and 3 months in the Irrigated cropping
livelihood zones compared to the normal of 2-3 months while browse is expected to last 3
months which is normal. The underperformance of both the short rains and the long rains
seasons lead to slight decline in forage qualities and quantities. Access to pasture and browse
was unlimited to livestock during the reporting season apart from few cases of insecurity and
conflicts over grazing space in Baringo County in areas surrounding Saimo Soi, Kalabata,
Arabal and Kapedo. Factors affecting forage access were invasive weeds such as mathenge and
Ipomoea, Mexican poppy in parts of Kajiado south and competition with wildlife in parts of
Narok county.
Pasture and browse situation
Pasture conservation status There are initiatives of forage production and conservation as well as utilization of crop by-
products by individual farmers across the livelihood zones. The cluster counties had 3,164 hay
stores with a storage capacity of 3,334,500 bales but currently holding 1,342,000 bales. The average weight per bale of hay was 15 kilograms and were sold at average price of Kshs. 200
per bale. Individual farmers were holding between 75 to 95 percent of the stored hay while individual institutions and farmer’s groups stored 5-25 percent of the bales.
Hay Conservation status
County No. of Hay
Stores
Storage
Capacity(bales)
No. of
Bales
currently
being held
Average
Weight
per bale
(in Kgs)
Average
price per
bale
(Kshs.)
Comments – E.g. percentage
held by farmers and other
Institutions
Baringo 92 1,410,500 794,500 15 200 80% by farmers 20% by other
institutions
Kajiado 1,026 792,000 236,000 12-15 250 95% held by farmers
Laikipia 1,786 835,000 107,500 15 250 75% by individual farmers 25%
by producer groups
Narok 260 297,000 204,000 15 200 75% by farmers 25% by other
institutions
TOTAL 3,164 3,334,500 1,342,000 15 200
Livelihood zone Pasture Browse
Condition How long to last
(Months)
Condition How long to last
(Months)
Current Normal Current Normal Current Normal Current Normal
Mixed Farming Good Good 1-2 3 Good Good 3 3
Marginal Mixed
Farming
Fair to poor Fair to good 1 3 Good Good 3 3
Pastoral Fair Fair to good 1-2 2-3 Good Good 3 3
Agro Pastoral Fair Fair to good 1-2 2-3 Good-Fair Good 3 3
Irrigated cropping Good-Fair Good 3 3 Good Good 3 3

47
Livestock body condition
The body condition for goats and camels was good in all the livelihood zones while body
condition for cattle and sheep was fair in Pastoral, Agro Pastoral and Marginal Mixed Farming livelihood zones compared to the normally good condition during the same period. In Mixed
Farming and Irrigated Cropping the body condition of all livestock species was good which
was normal. The fair livestock body condition was due to the fair forage condition as a result of the below normal performance of both short and long rains. For Mixed Farming and Irrigated
Cropping livelihood zones the good livestock body condition for all classes of livestock can be attributed to the average availability of quality forage
Livestock body condition Livelihood zone Cattle Sheep Goat Camel
Current Normal Current Normal Current Normal Current Normal
Mixed farming Good Good Good Good Good Good Good Good
Marginal Mixed
Farming
Fair-
poor
Good Fair Good Fair Good Good Good
Pastoral Fair Fair to Good Fair Good Fair -
Good
Good Good Good
Agro Pastoral Fair Good fair Good Good Good Good Good
Irrigated
cropping
Good Good Good Good Good Good N/A N/A
The Tropical Livestock Units (TLUs)
The Tropical Livestock Units in majority of the livelihood zones were lower than normal for
both poor and middle-income households. The TLUs for poor income household declined
below normal to 2-4, 1, 4-7, 3-6, and 2-9 compared to normal of 1-6, 3, 5-10, 4-7 and 5 in the Mixed Farming, Marginal Mixed Farming, Pastoral, Agro Pastoral and Irrigated Cropping
livelihood zones respectively. The decline in TLUs was attributed to increased sale of livestock by poor income households over time to cater for increased cost of living especially purchase
of food commodities and other domestic needs. The TLUs in the medium income households
slightly declined below normal to 8-9, 5-16 and 4-6 compared to normal of 7-21, 6-21 and 3-10 in the Pastoral, Agro Pastoral and Mixed Farming livelihood zones respectively. The decline
in TLUs is as result of diversification from keeping large herds of indigenous breeds to fewer improved breeds and also an emerging tendency in Pastoral and Agro Pastoral livelihood zones
from keeping large herds of cattle to small stock (sheep and goats) probably because of their
tolerance to dry spells. The other factor that has led to decline in TLUs is unfavorable weather conditions overtime that has resulted to fair forage conditions in most of the livelihood zones
that has forced livestock keepers to reduce their stocks to manageable levels to avoid loses. The general birth rates slightly decreased across all livelihood zones. The birth rates slightly
declined, being attributed to below average pastures across all livelihood zones during the
conception and gestation periods.
Tropical livestock units Livelihood zone Poor income households Medium income households
Current Normal Current Normal
Mixed Farming zones 2-4 1-6 4-6 3-10
Marginal Mixed Farming 1 3 4 4
Pastoral 4-7 5-10 8-9 7-21
Agro Pastoral 3-6 4-7 5-16 6-21
Irrigated Cropping 3 5 6 7

48
Milk production, consumption and prices
Milk production per household per day decreased by 50 percent in Pastoral, Agro Pastoral
and Mixed Farming livelihood zones respectively while in the Marginal Mixed Farming and Irrigated Cropping livelihood zones milk production declined by 57 and 38 percent
respectively when compared to LTA. The downward trend in milk production can be
attributed to the fair condition of pasture and browse in all the livelihood zones. Consequently, milk consumption per household per day also decreased by 50 percent in Mixed Farming,
Pastoral and Irrigated Cropping livelihood zones respectively and by 33 and 75 percent Mixed Farming and Agro Pastoral livelihood zones respectively when compared to LTA. The
decline in milk consumption can be attributed to low milk production at household. The milk
prices were higher comparable to the LTA in all the livelihood zones which was occasioned by the low milk production levels due to fair pasture condition.
Milk production, consumption and prices
Water for livestock
The common water sources of water for livestock were rivers, streams, water pans, dams, wells
and springs. The current water situation is normal in most areas of all livelihood zones high
owing to recharge rate. The return trekking distances was 2-4 KM in the Mixed farming, irrigated cropping and Marginal Mixed Farming which is within normal. While in the Pastoral
and Agro pastoral was 4-6 KM which was below normal. The water sources are likely to last for 2- 4 months in all the livelihood zones which is normal for the season.
Return trekking distances and duration to last Livelihood zone Return trekking distances-km Expected duration to last
(Months)
Current Normal Current Normal
Mixed Farming zones 2-4 2 2-5 3-4
Marginal Mixed Farming 2-4 3 2-4 2
Pastoral 6 3 -8 2-4 2-3
Agro Pastoral 4-6 2-6 2-4 3-4
Irrigated Cropping 2 1-2 Throughout the
year. Due to
permanent
rivers ,
shallow wells
and springs.
Throughout the
year
Watering frequency was within normal for all categories of livestock which was daily for
cattle, sheep and goats while 1-2 times per week for camel in Pastoral and Agro pastoral livelihood zones. The availability of water from most sources and normal return trekking
distances was attributed to high watering frequencies.
Livelihood zone Milk Production
(Litres)/Household
Milk consumption
(Litres) per Household
Prices (Kshs)/Litre
Current LTA Current LTA Current LTA
Mixed Farming zones 3-10 6-20 1-2 2-5 35-60 30-60
Marginal Mixed Farming 3 7 1 3 32-41 30
Pastoral 1-3 2-10 0.5-1.5 2-4 34-90 40-60
Agro Pastoral 2-2.5 4-12 1-1.5 2-3 30-60 60-75
Irrigated Cropping 5 8 1 2 50 50

49
Watering frequency (days per week) Livelihood zone Cattle Camels Sheep Goats
Current Normal Current Normal Current Normal Current Normal
Mixed Farming 7 7 - - 7 7 7 7
Marginal Mixed
Farming
7 7 - - 7 7 7 7
Pastoral 7 7 1 1 7 7 7 7
Agro Pastoral 7 7 2 2 7 7 7 7
Irrigated
Cropping
7 7 - - 7 7 7 7
Livestock Migration
There were internal livestock movements within the counties in the cluster which was normal at this time of the year in which 10 percent of cattle had migrated from Pastoral to Agro Pastoral
and Mixed Farming livelihood zones where there was pasture. The movement of livestock was
occasioned by poor pasture in some parts of Pastoral livelihood zones. However, Laikipia county experienced out migration of livestock out of the county to neighboring counties of
Nyeri and Nyandarua counties and also internal migration to dry season grazing of Laikipia North especially towards Sosian and Segera wards. The county has also experienced an influx
of over 10,000 heads of cattle from Samburu and Isiolo counties into Pastoral livelihood zone
specifically towards Koija group ranch.
Livestock diseases
The endemic livestock diseases reported in across the cluster counties were Food and Mouth Disease (FMD), Contagious Caprine Pleural Pneumonia (CCPP), Brucellosis, Contagious
Bovine Pleural Pneumonia (CBPP) Anaplasmosis, Enterotoxaemia and Lumpy Skin Disease
(LSD). There was no disease outbreak which was reported in the counties. Most county governments have carried out vaccinations and control measures of treatment.
2.3.5.3 Market Performance
Market operations were largely normal across all the counties in the cluster except for minor
impacts from Covid-19 containment measures. Sub-optimal market operations were reported
in Nginyang market in the Pastoral livelihood zone of West Pokot’s Tiaty sub-county that was closed or most of the reporting period but has since resumed operations in July 2021. Essential
food stuffs traded during the long rains season were beans, millet, sorghum, sweet potatoes, Irish potatoes, vegetables, tomatoes, rice, sugar, maize flour and green grams. A significant
proportion of the population relied on the market across the cluster with almost total reliance
on the markets reported in West Pokot County.
Supplies and Traded Volumes
Supply sources for food commodities were from Kiambu, Makueni, Nakuru, Tanzania, Transmara West, Lolgorian, Kilgoris, Sogoo, Bomet, and Kericho while livestock traded were
sourced locally and from Tanzania for the case of Kajiado and Narok counties. Even though
the markets were well stocked with foodstuff, low traded volumes were reported for Tiaty Sub- County in Baringo. The supply of livestock was high in Narok County due to influx from
Tanzania. Also, six times above long term average maize stocks were held by traders in Nyeri County.
Market Prices and Terms of Trade
Maize price in the cluster was above average in Kajiado, Nyeri and Laikipia counties while
Baringo, West Pokot and Narok counties recorded below average prices. The average prices
ranged from a low of Kshs. 45 per kilogram of maize in West Pokot and Laikipia to a high of

50
Kshs. 54 in Kajiado. Goat prices were above the long-term average in Baringo, West Pokot, Kajiado and Narok counties in as a result of good body condition. However, in Laikipia and
Nyeri counties, the price of a medium-sized goat fell below the long term average.
Terms of Trade (TOT)
Terms of trade were favorable
compared to the long term averages in Kajiado, Narok,
West Pokot and Baringo counties implying that
households had higher
purchasing power. Within the cluster, Kajiado County
recorded the most favorable terms of trade where households
were able to buy 107 kilograms
of maize from the sale of a medium sized goat compared to
the long term average of 76 kilograms. Baringo on the other hand reported the least favorable terms of trade whereby only
58 kilograms of maize could be purchased with the proceeds from the sale of a medium sized
goat compared to the long term average of 53 kilograms. Laikipia and Nyeri counties reported unfavorable terms of trade at 73 and 63 kilograms compared to the long term averages of 85
and 97 kilograms respectively.
2.3.5.4 Water Access and Availability
The main sources of water for domestic use are pans/dams, rivers and streams, boreholes,
shallow wells and piped water system. Spring are also used as source of water especially in mixed farming livelihood zones. Most households in the cluster had access to pipe water
systems. Rivers in West Pokot and Narok had average flows, however in Baringo, Laikipia and
Kajiado the flow was below average. The recharge of open water sources ranged between 20-50 percent in Nyeri and Kajiado and 60-80 percent in Narok, Baringo and West Pokot.
However, in Laikipia recharge to open water sources ranged between 85-95 percent of their capacities. Water in pans and dam are expected to last 2-3 months in the cluster instead of 4-6
months. However, in pastoral areas in Laikipia (Mukogodo East and Mukogodo West wards),
earth dams and water pans dried up due to below average long rain performance. Over 60-70 percent of boreholes are operational across the cluster. However, non-operation of boreholes
was due to breakdown of gen-sets or electro-mechanical breakdowns, vandalism or theft of solar panels and high cost of purchasing spare parts for solar powered pumps as well as
mismanagement due to collapse of management committees. High fluoride and poor water quality affected several boreholes in Baringo. Non-operational water pans was due to poor
siltation and porous soils.
Return distances to water sources remained normal at less than a kilometer in mixed farming in West Pokot, Baringo and Kajiado. Return distances in pastoral areas Baringo and Laikipia
increased from 5-6 kilometers normally to 7-12 kilometers. However, the pastoral areas in West Pokot, Narok and Kajiado remained normal at 5-10 kilometers. Water consumption in pastoral
areas ranged between 5-15 litres per person per day compared to 15-20 litres per person per
day normally, except in Narok, consumption was 20 litres per person per day. In mixed farming, irrigated cropping and Agro Pastoral areas in Kajiado and Baringo, households
Figure 2.8: Comparative terms of trade

51
consumed 15-20 litres per person per day which was normal. However, consumption of water was highest in Narok and Nyeri at 30-50 litres per person per day.
Households waited to collect water within 5-10 minutes except in West Pokot and marginal mixed farming areas in Laikipia where households waited for 20-30 minutes. Waiting time
lowest in mixed farming and Agro Pastoral areas in Nyeri, Laikipia and Kajiado at less than
five minutes. Highest waiting time of 45-90 minutes was reported in pastoral areas in Laikipia compared to 15-30 minutes normally. Most household relied on open water source. However,
the cost of water was normal ranging between Ksh.2-5 per 20 litres jerrycan across the cluster except in pastoral and marginal mixed farming areas in Kajiado and Nyeri respectively where
the cost of 20 litre jerrycan was Ksh.5-10 normally. Highest cost of water was reported in West
Pokot at Kshs. 20-50 per 20 litres jerrycan. Households with their individual connections paid between Kshs. 200-300 per month. In Nyeri (Gikomo village in Mweiga, Endarasha town and
Kinyaiti dam site in Mwiyogo/Endarasha Ward and Lachuta in Gatarakwa Ward) and isolated areas in Baringo, Laikipia, West Pokot and Kajiado water vendors sold water at Ksh.10-20 per
20 litres jerrycan. Majority of the households used boiling in water treatment. Latrine coverage
in the cluster ranged 80-100 percent except in Baringo and Narok where the coverage ranged 40-60 percent.
2.3.5.5 Food consumption
As at July, 2021, majority of the households in the cluster were having acceptable food
consumption scores with the highest being in West Pokot County. Nyeri County (56.8 percent)
had the highest proportion of households with borderline food consumption score. Other
counties with a relatively high proportion of households with borderline food consumption
scores were Baringo, Kajiado and Laikipia Counties with 28.5, 21.6 and 20 percent
respectively. In Baringo, Narok and Laikipia Counties, 2.2, 3.5 and 1.3 percent of households
had poor food consumption scores respectively. Majority of households with acceptable food
consumption scores across the cluster were able to take diverse food groups where staples and
vegetables are consumed daily, frequently accompanied by oil and pulses and occasionally
meat, fish and dairy and thus are more likely to meet their nutrient adequacy.
2.3.5.6 Coping Strategies
The largest proportion of households not employing any livelihood change coping strategies
were in West Pokot (100 percent) and Narok county (94. 7 percent), followed by Nyeri and
Kajiado counties which had 74.8 and 71.6 percent of the households respectively. In Laikipia
County (62.7percent), the highest proportion were employing Stressed coping strategies. There
were no households employing Crisis livelihood coping strategies across the cluster except in
Baringo (11.5percent) and Narok (4.1 percent). The proportion of households employing Crisis
food related consumption strategies was less than four percent across the cluster except in
Baringo (33.3 percent). The highest proportion of households employing Stressed food related
coping strategies were in Nyeri (65.8 percent) and Kajiado (69.2 percent). Those not employing
any food related coping strategies were in West Pokot (87.5percent), Narok (64.7 percent) and
Laikipia (58.7 percent). In the rest of the cluster, less than 30 percent of the proportion were
not using coping mechanisms.

52
2.3.5.7 Health and Nutrition
Nutrition situation
West Pokot was classified at Phase 3 “Serious” while East Pokot (Tiaty East and Tiaty West
Sub-counties) in Baringo County was classified at IPC Acute Malnutrition (AMN) Phase 4 “Critical”. The situation in West Pokot is attributed to lack of nutrition commodities for
management of acute malnutrition and high disease incidence especially upper respiratory tract
infections and malaria, and likely poor infant and young child feeding practices. In East Pokot, the situation is attributed to low dietary intake due to limited access to food that as a result of
inaccessibility to markets and high food prices due to insecurity, and poor Water Sanitation and Hygiene (WASH) practices. The situation in the two areas is further compounded by
reduced milk availability and consumption. However, there was inadequate data to classify
Kajiado, Laikipia, Narok and Nyeri North (Kieni). East Pokot (Tiaty) is likely to deteriorate but remain in the current phase during the projection period with the onset of the lean season
compounded by the persistent shortage of commodities for management of moderate acute malnutrition. West Pokot is projected to remain stable in the current phase. Admission into the
Integrated Management of Acute Malnutrition Programme (IMAM) was significantly
impacted upon by stock-outs of commodities. The Integrated Management of Acute Malnutrition Programme does not exist in Nyeri North (Kieni).
Morbidity and Mortality Morbidity trends for Upper Respiratory Tract Infections (URTIs), malaria and diarrhea were
generally stable in the reporting season except malaria which showed an upward trend in West
Pokot and Baringo (Tiaty). Stable diarrhea trends could be linked to the heightened hand hygiene and hand sanitization as part of COVID 19 mitigation measures. The decrease in
reported morbidity across the cluster is also attributed to poor health seeking behavior due to fear of contracting COVID-19 by the community which led to decrease in the health facility
visits; use of face masks which decreased URTI cases while depressed rainfall performance
resulted to reduced breeding of mosquitoes. A SMART survey conducted in East Pokot (Tiaty) showed that 13% of children had suffered from an illness two weeks prior to the survey, with
the most common illness being acute respiratory infections (83.3%), followed by diarrhea (30.1%) and malaria (16.9%). These diseases have a significant impact on the nutrition status
of children. An active measles outbreak, which started in 2019, was reported in West Pokot.
Health and Nutrition Sector in the context of COVID -19
Since the first case of COVID-19 was reported in Kenya in March 2020, different counties
have been affected differently. As of 2nd August 2021, Kajiado had registered 4976 cases followed by Nyeri (2740), Laikipia (1777), Narok (756), Baringo (668) and West Pokot (300).
The pandemic has affected both routine health services in the health facilities and in the community. Outreaches were either halted or scaled down in the cluster while outpatient
attendance as result of fear of contracting the disease.
Immunization and Micronutrients Supplementation
Measles immunization coverage for children at 9 months across the cluster in the year 2021 is
above the national target of 80 percent except in West Pokot (70). The coverage is however generally lower than that reported in the year 2020 except in Kajiado and Narok. Coverage for
OPV 3 in the cluster was high except in Baringo and West Pokot that reported 75 and 75.4
percent respectively. Vitamin A supplementation for children aged 6-59 months is generally above 80 percent across the cluster. The coverage was highest in, Laikipia, Narok, West Pokot

53
and Nyeri at 87, 87, 84 and 80 percent. The lowest coverage was reported in Kajiado and Nyeri which reported at 45.1 and 73 percent respectively.
Dietary Intake and Childcare Practices
Meal consumption was within the normal range in all counties in the cluster except in Laikipia
and Kieni. Historical data from West Pokot County indicate a low Exclusive Breastfeeding
(EBF) rate at 39.9 percent below the national average of 61 percent. Continued breastfeeding to 2 years is equally poor at 52.8 percent. Sub optimal breastfeeding practices could be
attributed to pre-lacteal feeds (60%, Baringo County), socio-cultural practices and high maternal workload. Complementary feeding indicators were sub optimal with minimum
dietary diversity, minimum meal frequency and minimum acceptable diet being 36.9 percent,
58 percent and 25 percent respectively. A SMART survey carried out in Tiaty in June 2021 indicated that Minimum Dietary Diversity for Women (MMD-W) was 65.4 percent.
Water Sanitation and Hygiene
In West Pokot and Tiaty, hand washing at 4 critical times was at 7.5 and 5.8 percent
respectively, while in Kajiado it was at 14.6% percent. The coverage in West Pokot, Narok and
Kajiado Counties was at 48, 52.4, and 42 percent respectively. The lowest latrine coverage in the cluster was reported in Baringo at 8 percent. Open defecation in such areas is still done and
this contributes to the water contamination and subsequently, an increase in water related and waterborne diseases.
2.3.5.8 Education
Apart from Baringo and West Pokot (who registered -1.3 and -10.6 percent drop in enrolment), all other counties registered an increased enrollment at ECDE level with Narok posting the
highest percentage increase of 25.3 percent (Table 12). The increase was associated to having
feeding programme at ECDE centres, good physical facilities and employment of ECDE teachers by the County Government. West Pokot had a decrease of 10.6 percent. This marked
decrease was attributed to Lack of physical facilities and long distances to ECDE centres in west Pokot where some centres conduct their learning activities in churches and some under
trees. Four Counties (Baringo, Laikipia, Nyeri and West Pokot) registered a significant drop
at Primary and Secondary school levels attributed migration in Laikipia, Insecurity in Baringo, engagement of learners especially boys in casual labour. Teen Pregnancies and early marriages
among secondary school girls was cited as a cause for decreased enrollment in West Pokot County. FDSE and the 100 percent transition policy have assisted maintain high enrollment
rates in Kajiado and Narok counties. Day secondary schools in West Pokot attracted many
transfers from boarding schools due to low amounts of school fees charged.
Enrolment rate
Level County
Percentage
change in
enrolment
Reasons for change
ECDE
Baringo -1.3 Insecurity in pastoral areas, Lack of fees
Kajiado 2.2 Admission of out of school children, Employment of
new teachers
Laikipia 1.2 Sensitization of parents on importance of education
Narok 25.3 Provision of Facilities, Uji programme, Employment
of teachers by County Government.
Nyeri 1.3
West Pokot -10.6 Lack of facilities & long distance to ECDE centres

54
Level County
Percentage
change in
enrolment
Reasons for change
Primary
Baringo -1.4 Insecurity, Loss of livelihoods for parents due to
Covid
Kajiado 1
Laikipia -2.4 Initiation ceremonies and Moranism, Insecurity
(Cattle theft) Fear of covid-19
Narok 27.2 Enforcement of school attendance
Nyeri -24 Casual labour
West Pokot -9.6 Early Marriages
Secondary
Baringo -9.2 Early Marriages, teen pregnancies, Child labour in
Irrigated farms & Boda-boda business
Kajiado 3.2 FDSE and 100% transition policy
Laikipia -7.6 Teenage pregnancies, early marriages,
Narok 18.6 FDSE, 100% transition policy
Nyeri -15.6 Boys engage in Casual labour on farms
West Pokot -7.3 Teen pregnancies
Drop Out Cases
During the period under review, two counties in the cluster reported a total 172, 428 and 226 learners as having dropped out of school in ECDE, Primary and Secondary levels respectively.
Overall, female learners were more affected especially at secondary school level. The reasons for boys dropping out were child labour such as herding of cattle, weeding, harvesting and
others economic activities such as in the ‘Boda boda’ industry. The girl child on the other hand
drops out of school due to inhibitive cultural practices like child marriage. Laikipia County reported zero drop out cases.
Drop Out Cases
Level County DROP OUTS
Boys Girls Total
ECDE
Kajiado 39 41 80
Laikipia 0 0 0
Narok 40 52 92
Sub Total 79 93 172
PRIMARY
Kajiado 57 95 152
Laikipia 0 0 0
Narok 74 202 276
Sub Total 131 297 428
SECONDARY
Kajiado 46 66 112
Laikipia 0 0 0
Narok 43 71 114
Sub Total 89 137 226
GRAND TOTAL 299 527 826
Effects of 2021 Long rains on schools
The depressed rainfall experienced across the cluster, led to shortage of water in schools that mostly depend on roof catchment harvesting. This increased the cost of operation in the
institutions, and trekking distances to water points. There were no reports of damaged

55
infrastructure in five Counties. However, Narok had a total of 104 schools experience damage to infrastructure with flooded classrooms, destroyed roofs and sunken toilets being cited.
Nevertheless, there were no cases of internally displaced persons in the cluster reported.
All the six counties in the cluster had some form of School feeding. In-Kind School Meals
Programme (ISMP) and Community Supported School Meals Programme (CSSMP) were the
prevalent types of feeding programmes. A total of 409,634 learners in primary schools were reported to be benefiting from the school feeding initiatives. This represented only a small
percentage of the learners. In Narok more than 95 percent of learners were not under any school feeding programme while in Nyeri 54 percent of schools were not covered. The feeding had
positive impact on access and retention among learners in the cluster. The main challenges
cited to be affecting the school feeding programme were lack of sufficient funds to sustain the programme throughout and termination of the programme in some very needy schools without
notice in Kajiado County. Inadequate storage facilities, erratic distribution of food stuff for government supported feeding programmes were highlighted too.
Inter-sector links
Sanitation and Hygiene in schools
Following low amounts of rain received in most of the counties in this cluster, a total 1,664 institutions did not have access to safe drinking water. West Pokot and Narok reported the
highest numbers. A total of 1,044 institutions had inadequate functional latrines as reported.
ECDE centres and Primary schools were the most affected across the cluster. Most of the schools in the cluster are in adherence to MOH Covid-19 control measures of wearing face
masks, social distancing and hand washing following Ministry of Education guidelines on Combating Covid-19. Baringo, Narok and Laikipia reported adequate stocks of sanitary kits to
school girls supplied by both National and County Governments, Mpesa Foundation. Even
though there have been insecurity challenges in Baringo county, no schools have been used to host IDPs.
2.4 The South Eastern Marginal Agricultural
Livelihood Cluster
2.4.1 Cluster Background Information
The cluster comprises of five counties namely, Kitui,
Makueni, Meru (North), Embu (Mbeere) and
Tharaka-Nithi. It covers an area of 49,039.4 square kilometers and has an estimated population of
3,556,767 persons (KNBS 2019 census). The cluster has two major livelihood zones; Marginal Mixed
Farming livelihood zone representing 65 percent of
the population, and Mixed Farming livelihood zone representing 26 percent of the population. The main
sources of income for the cluster includes; Crop production which account for 40 percent of the total
household income, Livestock production at 35 percent
and Employment at 25 percent.
Figure 2.9: Southeastern marginal agricultural cluster livelihood zones

56
2.4.2 Current Drivers of Food Insecurity
Rainfall performance
The onset of the March – May long rains season was late across the cluster. Most parts of Kitui and Makueni Counties received rainfall amount of 51 – 90 percent of normal range whereas
Meru North, Tharaka Nithi, Embu (Mbeere), some parts of Kitui south, Kitui West, Mwingi
west, Kaiti, Kilome sub counties received near normal to above normal rainfall (91-125%). The southern parts of Kitui South received below normal rainfall of between 26 – 50 percent.
The rains were uneven in space and characterized by poor distribution in time across the cluster. The cessation was normal in the second dekad of May across all the cluster.
Conflicts/Insecurity
Human-wildlife conflict was reported in parts of Meru North (Kanjoo and Kinanduba in Igembe North) where herds of elephants destroyed crop lands leading to loss of 10 Ha of banana
crops and 200 Ha of maize and sorghum in Ndumuru, Mariara, Kinanduba and Murera areas. Other cases of human wildlife conflicts were reported in Kitui South, Kitui East, Mwingi North
and Mwingi Central sub counties with about 382 livestock killed by wild animals. The cases
are currently limiting movement of livestock in search of water and pasture leading to deterioration of livestock body condition, low livestock prices and unfavourable terms of trade.
In Makueni county, cases of human-wildlife conflict were on decline as a result of installation of an electric fence in Tsavo West wildlife corridor. However, conflict on water access remains.
COVID 19 Pandemic
The impact of covid 19 pandemic prevention measures has affected counties across the cluster. In Tharaka Nithi and Makueni, movement restriction and curfew disrupted market operations
leading to decline in livestock prices and an increase in food commodity prices through increased cost of production and transportation. In the irrigation schemes of Tharaka Nithi,
post-harvest losses of 400 metric tons of pawpaw were reported due to depressed prices and
limited market access. In Meru covid 19 restriction measures affected market operations leading to low volume of livestock traded. Miraa was also affected leading to reduced income
for miraa dependent households and loss of income for casual laborers due to reduced man hours.
Other shocks and hazards
Livestock diseases were endemic in the cluster and included, contagious caprine pleuropneumonia (CCPP) and Pests des Petits Ruminants (PPR), Lumpy Skin Disease (LSD)
and Foot and Mouth Disease (FMD). Other livestock diseases reported were; 2,043 confirmed cases and 24 deaths for trypanosomiasis in Kitui South sub county, 120 confirmed cases and
30 deaths for New Castle Disease (NCD) in Mwingi North sub county, Anthrax and rabies in
Meru north and Tharaka nithi Counties. Crop pests and diseases reported include; Fall Army Worm (FAW) and aphid infestation in Embu and Meru North. Tuta absoluta in tomatoes led
to crop losses in Meru North. In Tharaka Nithi, Quelea quelea bird infestation resulted in upto
15 percent loss of sorghum and millet during the season.
2.4.3 Current Food Security Situation
The cluster was classified as stressed (IPC Phase 2) of acute food insecurity, except Meru which was classified as None/Minimal (IPC Phase 1 phase). Food stocks held by households in the
cluster were below normal with 28, 38, 40, 64 percent of long term average for Tharaka Nithi, Kitui, Embu and Makueni Counties respectively. However, household stocks in Meru County
were 54 percent above the long-term average. Pasture condition was fair to poor across the cluster except for Meru and Makueni counties which recorded good to fair pasture condition.

57
Browse was fair to poor across the cluster except in Makueni county where the browse was good to fair. Livestock body condition was good to fair for all species across the Livelihood
zones within the cluster except in Makueni County where body condition for cattle was good for all species. Maize prices across the cluster were below long-term average by 8 – 16 percent.
Goat prices across the cluster were 8 – 33 percent above long-term average except for Makueni
County which reported two percent above average. Favourable terms of trade were recorded across the cluster of between 3 and 26 percent. Terms of Trade were highest in Kitui and
Tharaka-Nithi of 30 and 51 percent above long-term average respectively. Water consumption was 5 – 30 litres per person per day in Kitui, Makueni and Meru counties. In Tharaka and Embu
Counties water consumption was highest at 30 – 60 litres per person per day.
2.4.4 Food Security Trends Indicator Short Rain Assessment,
February 2021
(Previous Season)
Long Rain Assessment,
August 2021 (Current
Season)
Percent of maize stocks held by households 49% 45%
Livestock body condition (Cattle) Fair-Good Good
Water consumption (p/p/l/d) 19-30 15-30
Price of maize (per kg) 35 34
Distance to grazing in km 4-9 5-15
Terms of trade (pastoral zone) 124 123
Coping strategy index 5 6.6
Food consumption score Acceptable-71
Borderline-26
Poor-3
Acceptable-78
Borderline-20
Poor-2
2.4.5 Impacts of Drivers on Food and Nutrition Security
2.4.5.1 Crop Production
The Long rains season contribute to 40 percent of annual crop production with short rains
season accounting for 60 percent. The main rain fed crops grown were maize, cowpeas and green grams. Others crops on small scale were beans and millet.
Rain fed crop production
The area under maize and green grams was 86 percent of the LTA while that of cowpeas was
95 percent of LTA. In Tharaka Nithi, poor performance of maize has resulted in most farmers
opting for drought-tolerant crops such as sorghum and pigeon peas thus reducing the area under maize. Lucrative market for sorghum has been a motivational factor in increasing production.
The projected production for green grams, cowpeas and maize was 39, 42 and 58 percent of LTA respectively. In Embu, decrease in production was attributed to false onset of MAM
rainfall and early cessation in some area in the Marginal Mixed zone that caused wilting and
drying of crops before maturity. In addition, the farmers continue to expand the area under Muguka crop due to the financial benefits attached to it. In Meru, wildlife damage (Elephants
and Buffalos) was reported in Ndumuru, Mariara, Kinanduba and Murera areas where about 200ha of maize and sorghum were destroyed.

58
Rain fed crop production Crop Area planted
during 2021 Long
rains season
(Ha)
LTA area
planted during
the Long rains
season (Ha)
2021 Long rains
season production
(90 kg bags)
Projected/Actual
LTA production
during the Long
rains season
(90 kg bags)
Maize 127,685 147,812 516,073 890,650
Green gram 66,480 77,512 131,993 342,508
Cow peas 47,756 50,490 112,232 266,562
Irrigated Crop Production
The area under kales and tomatoes was 54 and 97 percent of the LTA while that of watermelon was 49 percent above the LTA attributed to decreased irrigation water from rivers. The
projected production for kales was within the LTA while that of tomatoes and watermelon was 22 and 31 percent above the LTA, In Makueni, productivity was maintained at various levels
due to use of certified inputs and adherence to good agricultural practices. High petrol prices
negatively impacted on irrigation farming leading to reduced hectarage and productivity especially on the micro- irrigation for horticultural crops grown using water pumped from the
sand and earth dams. Pest and disease especially tuta absoluta and Fall Army Worm (FAW) also discouraged many of the farmers, since they could not afford the agro-chemicals, which
negatively impacted on food security, while in Meru, there were challenges of poor rainfall
performance, livestock and wildlife invasion and pests and diseases. Banana cultivation has increased due to new irrigation schemes being open up such as Ruungu irrigation scheme where
new land has been opened up for banana production and also replacement of conventional crop with banana plantations.
Cereal Stocks
Maize stocks within the cluster was 66 percent of the LTA. Traders, millers and farmers held maize stocks at 53, 73 and 86 percent of LTA. The green gram and sorghum stocks held by
farmers was 34 and 60 percent of the LTA while sorghum and green gram stocks held by traders was 36 and 55 percent of the LTA. The stocks are likely to last for one month in the Marginal
Mixed Farming zone and up to three months in the Mixed farming and Rain-fed Farming zone
in Tharaka. Household stocks in marginal mixed farming zones of Meru are expected to last for one month as opposed to two months normally. In the Mixed farming and Rain fed zones,
the stocks are expected to last for one to two months. In Makueni, stocks will last between two to three months for cereals and pulses. In Embu, current stocks are expected to last for two to
four months in the mixed farming livelihood zone as compared to normal of four to six months
while stocks in the marginal mixed farming zone are expected to last one to three months as compared to normal of three to four months.
Cereal Stocks
Commodit
y
Maize Rice Sorghum Green gram
Current LTA Current LTA Current LTA Current LTA
Farmers 204,067 238,300 85 0 40,108 67,362 66,086 194,565
Traders 186,848 354,141 145,119 371,598 18,803 52,945 54,250 98,686
Millers 33,058 45,400 2,000 2,000 1,950 15,400 4,000 2,500
Total 423,973 637,841 147,204 373,598 60,861 135,707 124,336 295,751

59
2.4.5.2 Livestock Production
Livestock production contributes 40-70 percent to cash income in the marginal mixed farming
areas and 15-45 percent to cash income in mixed farming livelihood zones. It also contributes 15-40 percent to cash income in rain fed agriculture and agro pastoral livelihood zones. The
main livestock species in the cluster include cattle, sheep, goats, poultry, donkeys, bees in some
counties and both local and exotic cattle. Pasture and browse situation was good to fair across cluster which is slightly below normal at this time of the year. The fair condition was attributed
to below normal long rains which affected growth and regeneration of the forage. The available pasture is expected to last for between 1-3 months compared to 1.5-4 months normally. The
browse condition was Fair to Good across the Livelihood zones. Browse is expected to last for
between 1 to 3 months compared with normal of 2-4 months. There was no limiting factor for access to pasture and browse.
Pasture and browse situation Livelihood
zone
Pasture Condition How long to last
(Months)
Browse condition How long to last
(Months)
Current Normal Current Norma
l
Current Normal Current Normal
Mixed Farming Fair -
Poor
Good 1-3 3-4 Fair-
Good
Good 1.5-3 2-3
Marginal
Mixed Farming
Fair -
Poor
Good 0.5-2 1.5-3 Fair-Poor Good 1-2 2-4
Rain fed Good Good 2-3 3 Good-
Fair
Good 4-5 1
Agro-pastoral Fair -
Poor
Good 1-2 2 Fair- poor Good 2 1-2
Mixed
farming-
livestock and
food crop
Fair Good 2 3 Good Good 3 3
Mixed
farming-
coffee/dairy
Good Good 3 3 Good Good 3 3
Pasture conservation
There are about 200 hay stores in Kitui county with a holding capacity of 38,000 bales. During
the period under review, farmers and other institutions were holding 18,500 bales of hay and
much of it was held by Kitui ATC mainly sourced from outside the county. Low hay
conservation by farmers is attributed to depressed rains, lack of technical know-how and
unavailability of bailing machines and tools for bailing. In Makueni, farmers are holding 95
percent of 97,155 hay stores. However, a number still practice standing hay as a method of
fodder conservation.
Livestock Body Condition
The livestock body condition for all livestock species in the Marginal Mixed zone was good to
Fair in all livelihood zones which is normal at this particular time of the year (Table 6). The
good livestock body condition was attributed to good forage condition and availability of water.

60
Livestock body condition
Tropical Livestock Units (TLUs) and Birth Rates
The Tropical Livestock Units (TLUs) for poor households declined by 31.3, 37.5, 60 and 66.7
percent in Marginal Mixed Farming, Mixed Farming, Rain-fed and Agro-Pastoral livelihood
zones respectively but remained stable in the Mixed Farming (livestock/ food crop) and Mixed Farming (coffee /dairy) livelihood zone when compared to LTA. Among the middle-income
households, the number of TLUs decreased by 25, 20, 33 and 51 percent in the Marginal Mixed Farming, Mixed Farming, Rain Fed and mixed farming coffee/dairy livelihood zones
respectively but remained stable Agro-Pastoral and Mixed farming crop/livestock livelihood
zones when compared to LTA. The decline in TLUs was due to allocation of land to crop production that reduced the availability of pastures. The stability in TLUs was realized because
of the favorable weather that enabled the farmers to maintain the stocking rates as per land availability. The good forage situation prevailing from the effects of Long rains and near
average 2020 Short rains season meant low livestock off take by households while some
farmers bought young stock hence the increase in TLUs. Births were normal across all livestock types in the county but with a marginal increase in kidding and lambing for goats and sheep
due to favorable weather conditions.
Tropical Livestock units (TLUs) Livelihood zone
Poor income households Medium income households
Current Normal Current Normal
Mixed Farming 1-2 1-7 1->10 2-6
Marginal Mixed
Farming
<1-4 1-7 4-5 4-8
Mixed farming
coffee/dairy
1.1 1 2.4 7
Mixed farming
crop/livestock
2.1 2 5.1 5
Rain-fed 1-2 2-3 2-6 4-8
Agro-pastoral 3 4-5 >10 >10
Milk production, consumption and prices
Milk production at household level increased by 66, 16, 10, 50 and 50 percent, Marginal Mixed
Farming, Mixed Farming Coffee/Dairy, mixed farming livestock and food crop, Rain Fed Agriculture and Agro Pastoral livelihood zones respectively when compared to LTA. In the
Mixed farming livelihood zone, there was a decrease of 25 percent. The increase in milk was attributed to good Livestock body condition and fair to good pasture availability. Consequently,
milk consumption increased by 66, 40 and 50 percent in mixed farming coffee/dairy, mixed
farming crop/livestock and Rain-Fed Agriculture livelihood zones respectively when compared
Livelihood zone
Cattle Sheep Goat
Current Normally Current Normally Current Normally
Marginal Mixed zone Fair -Good Good-
Excellent
Fair-
Good
Good Good
-fair
Good-
Excellent
Mixed farming Good -Fair Good Good Good Good Good Mixed Farming (livestock/
food crop)
Good Good Good Good Good Good
Mixed Farming (coffee
/dairy)
Good Good Good Good Good Good
Rain-fed Good Good Good Good Good Good Agro-pastoral Good Good Good Good Good Good

61
to the LTA. However, milk consumption declined by 16 and 20 percent in Mixed Farming and Marginal Mixed Farming Livelihood zone respectively and remained stable in the Agro
Pastoral Livelihood zone when compared to normal. A decrease in milk production in the affected areas led to increased milk prices. Milk prices increased by 18 and 10 percent in Mixed
Farming and Mixed farming livestock and food crop livelihood zones respectively when
compared to the LTA. In Marginal Mixed Farming, Mixed Farming coffee/Dairy and Agro pastoral Livelihood zones prices remained stable. The increase in milk prices is attributed
increased demand for consumption at household.
Milk production, consumption and prices
Livelihood zone
Milk Production
(Litres)/Household
Milk consumption
(Litres) per Household Prices (Ksh)/Litre
Current LTA Current LTA Current LTA
Mixed Farming 2-3.5 1-5 0.5-2 1 – 2 50 - 80 50-60
Marginal Mixed Farming 2 - 3 1 -2 0.5 -1.2 1-3 40 -60 40 -60
Mixed Farming
Coffee/Dairy 1.6 1.2 0.8 0.75 50 50
Mixed farming livestock
and food crop 1.1 1 0.7 0.5 50 60
Rain Fed Agriculture 2-2.5 1 – 2 1 2 50 - 60 50
Agro pastoral 4 2 1 1 50 50
Water for Livestock The current main sources of water for livestock across livelihood zones were boreholes,
seasonal rivers, dams, shallow wells, water pans, earth dams and streams. The return trekking
distances in from grazing areas to water points increased in Mixed farming, Rain-Fed and Mixed farming coffee/dairy Livelihood zones in comparison with the LTA by 44,10 and 41
respectively. However, return trekking distances decreased by 38 percent to below LTA in the Marginal Mixed Farming and remained stable in the Agro Pastoral. The decline in return
trekking distances is attributed to recharge of water sources and improved pasture condition
around the water points while the observed increased of trekking distances in some of the Livelihood zones is due to poor performance of the rains. The water frequency for all livestock
species was daily in all livelihood zones.
Water for Livestock Livelihood zone Return trekking
distances (Km)
Expected duration
to last (Months)
Watering frequency
(days)
Current Normal Current Normal Current Normal
Mixed Farming 0.5-6 0.5 -4 1-3 2-3 Daily Daily Marginal Mixed Farming 2-6 3-10 2-2.5 1.5-3 Daily Daily
Mixed farming
coffee/dairy
0.5 -1.5 0.2 -1 3 2 Daily Daily
Mixed farming
crop/livestock
1.5-6 1 3 2 Daily Daily
Rain-fed 0.1-2.5 1-2 1-3 2 Daily Daily Agro-pastoral Zones 5-7 >7 2 1 Daily Daily
Livestock Migration, diseases and mortality rates
Currently, there is no observed or reported unusual incidences of livestock migration, diseases and mortalities which is a normal situation at this time of the year. However, the main endemic
disease in the sub-county is the Contagious Caprine Pleuropneumonia (CCPP), rabies, fowl

62
pox and New Castle Diseases (NCD) across all zones. there was reported cases of increased vector (ticks) early into the season which resulted to a few cases of East Coast Fever (ECF)
cases. There were in migration, inter Sub County Migration and Inter zonal migration within the period under review in Meru while the other areas in the region didn’t experience any
migration patterns.
2.4.5.3 Market Performance
Markets for food commodities and livestock were operating normally across the cluster and
were well provisioned with a range of food commodities and livestock species including goats, sheep, cattle, and poultry. However, Kitui County’s Kitui meat market was closed due to
increased cases of foot and mouth disease (FMD).
Supplies and Traded Volumes
Food commodities were sourced locally and from Trans-Nzoia, Busia, Kajiado, Nyahururu,
and Kinangop. Supply sources for livestock were external from Isiolo, Garissa, Tana River supplemented with inter-county trade. The markets were well provisioned and traded volumes
normal except for Embu and Meru. The closure of Kitui meat market is likely to reduce income
from sale of livestock and diminish household purchasing power. Tharaka Nithi reported increased livestock traded volumes in the markets.
Market Prices
Prices for maize were
stable across the cluster
and below the long-term average prices. In
Makueni prices remained relatively
stable retailing at Ksh.
35 per kilogram. The lowest average prices
were reported in Meru North and Kitui counties
at Ksh. 33 while Embu
and Makueni reported the highest price within
the cluster at Ksh. 35 per kilogram as shown in
Figure 2.10. Goat prices
remained above the long-term average
within the cluster except in Makueni county where the prices fell below the long-term averages. The highest price of a
medium sized goat was reported in Tharaka Nithi county at Ksh. 4,758 compared to the long
term average of Ksh. 3,582 while the least price was recorded in Makueni county at Ksh. 3,254 compared to the long term average of Ksh. 3,322.
2.4.5.4 Water Access and Availability
The major sources of water for domestic use in the cluster are boreholes, rivers, pans/dams,
rock catchment, shallow wells, springs and piped water systems. About 40-60 percent of boreholes were operational. However, non-operational boreholes were as a result of mechanical
faults or break downs. Non-operational open sources were mainly due to drying up of water
Figure 2.10: Comparative maize price trends across the cluster

63
pans and dams, breached embankment and eroded spillways. Recharge to surface water sources ranged between 20-60 percent in Kitui and Meru, 60-80 percent in Tharaka Nithi and Embu
while in Makueni, recharge was 85-90 percent. Water in pans and dam are expected to last 1-2 months in the cluster instead of four months except in Embu were water was expected to last
for 2-3 months compared to six months normally. High human concentration at isolated water
points in marginal mixed farming areas in Kitui, agropastoral in Meru North (Buluu and Mariara boreholes) and parts of Tharaka (Kamanyaki, Kirangare and some parts of
Chiakariga).
In Kitui, Makueni, Meru and marginal mixed faming livelihood zone in Embu, the current
distances to water sources ranged between 2-10 kilometres compared to two to six kilometres
normally. The distance to water sources was lowest in Tharaka Nithi at less than a kilometre compared to one to four kilometres normally. The waiting time at the source in Meru and Embu
was within the normal range at 5-10 minutes, except in marginal mixed farming livelihood zone and agropastoral areas in Embu and Meru respectively, where waiting time was 20-50
minutes. In Tharaka Nithi, waiting time was 10-20 minutes while in Makueni and Kitui it was
20-60 minutes. However, in marginal mixed farming areas in Kitui (Kitui East) households waited for up to three hours for water due to water rationing. Water consumption was 10-20
litres per person per day compared to the normal of 20-30 litres per person per day. In Tharaka Nithi and Embu, households consumed 20-50 litres per person per day which was normal. The
cost of water was within the normal ranges of Ksh.2-5 per 20 litre jerrycan except in marginal
mixed farming and agropastoral areas in Embu and Meru respectively, where the cost was Ksh.20-50 per 20 litre jerrycan compared to Ksh 5-10 normally. The cost of water from vendors
was normal retailing at Ksh. 10-30 shillings per 20 litres jerrycan in the cluster except in isolated areas in Meru (Igembe North) where vendors sold water at Ksh.30-50 per 20 litres
jerrycan. Water treatment across the cluster remains low with less than 50 percent of the
households treated their water. Latrine coverage in the cluster ranged 85-95 percent.
2.4.5.5 Food Consumption
Embu recorded the highest proportions of households with acceptable food consumption score at 100 percent, followed by Tharaka Nithi County at 96 percent. Kitui County had the highest
number of households with poor food consumption score at 26.2 percent. However, Meru had
the lowest number of households with acceptable food consumption at 55.1 percent. In Kitui County, the above average food consumption patterns were due to favorable terms of trade
which impacted positively on household access to diversified diet. The acceptable food consumption across the cluster is attributed to the improved dietary diversity and food
availability at the household level.
2.2.5.6 Coping Strategies
Tharaka Nithi had the highest number of households in acceptable at 93.5 percent while in
Kitui at was at 82.7 percent. Number of households currently employing stress coping strategies was at 30 and 21.5 percent in Embu and Meru counties. Meru had 22.9 percent,
while Makueni and Embu had18.3 percent of households are using crisis coping strategies.
This is attributed to the poor performance of the 2021 March-May rain season which significantly reduced households’ income as a result of reduced crop production and casual
labour opportunities.

64
2.4.5.7 Health and Nutrition
Nutrition situation
As per the IPC Acute Malnutrition classification, all the counties (Mbeere, Meru North,
Makueni, Kitui and Tharaka) could not be classified due to data limitation. Meru North and Makueni showed stable trends of admissions to the OTP program while Kitui reported a higher
trend. The admission trend in SFP program was stable and low compared to other years.
Integrated Management of Acute Malnutrition
There is an overall improvement in performance of Outpatient Therapeutic Program (OTP)
program in 2021 compared to 2020, the cure rate improved in Makueni and Kitui but declined in Meru North. Kitui County achieved the target as per sphere standards. There is decline in
death rate in Makueni and Meru North in 2021 compared to 2020 but an increase was observed
in Kitui. The defaulter rate increased in Meru North and a decrease was observed in Kitui County. In all the three counties there is a decline in patients who were non-cured.
Performance of IMAM program
Cured (%) Deaths (%) Defaulter (%) Non-cured)%
Area 2020 2021 2020 2021 2020 2021 2020 2021
Makueni 64.70% 69.8% 2.10% 0.0% 27.60% 28.6% 5.60% 1.6%
Kitui 70.30% 75.6% 1.90% 9.2% 25.00% 13.7% 2.80% 1.5%
Meru 58.00% 37.0% 2.50% 0.0% 31.00% 56.2% 8.40% 6.8%
Morbidity and Mortality
URTI and Diarrhea are the common morbidities among the under-fives in the cluster. DHIS
morbidity data as indicated in the graphs below shows higher URTI cases compared to the
same season in 2020, which are also on an increasing trend. Kitui recorded the highest numbers of URTI while Tharaka Nithi County recoded the least cases. The increasing trend of URTI is
attributed to the cold weather conditions experienced in the region. Diarrhea cases were slightly higher during the analysis period compared to the same season in 2020. Makueni County
recorded the highest cases while Tharaka Nithi County recorded the least cases.
Disease outbreak
A total of 17,661 people were confirmed positive for COVID-19 since the onset of pandemic
in the cluster. The County Covid-19 Response Teams are in place in every county. Sensitization on Covid-19 preventive measures is still ongoing at all levels. Vaccination against
Covid-19 was started nationally in March 2021 and is ongoing in the cluster and a large number
of healthcare workers among other cohorts have been vaccinated. A total of 43,473 people have been vaccinated within the cluster with Embu leading in proportion of population full
vaccinated at 2.9 percent and Makueni is the lowest at 0.8%, Meru, Kitui and Tharaka Nithi at 1.5 percent, 1.3 percent and 1.9percent respectively. Isolation centers are still in place and are
being utilized as needed.
Immunization and Micronutrients Supplementation
Immunization coverage improved across the cluster in 2021 compared to 2020. Analysis
indicates that for all the antigens Makueni surpassed 80 percent, whereas Meru North had a decrease in performance of BCG, OPV1, OPV3, measles and FIC in 2020 compared to 2021
and this can be attributed to industrial action by health workers that extended upto March 2021.
Measles coverage indicates the greatest improvement across the region except for Meru County. Improved immunization coverage is attributed to availability of antigens and

65
accelerated child health services across the cluster to boost immunity for under-fives. The vaccinations were carried out at health facilities observing COVID -19 protocols.
Vitamin A supplementation
There was significant improvement in Vitamin A Supplementation among children aged 6 to
59 months, in semester 1 2021 compared to the same time in 2020. The performance in all the
counties was above the national target of 80 percent. This could be attributed to Malezi bora initiative where supplementation was done through Early Childhood Development centres
(ECDS), Community Health Service Structures and by use of door-to-door strategy across the cluster. In addition, there has been no vitamin A stock out during the period under review.
Childcare practices
Exclusive breastfeeding was above 80 percent in all the counties/areas of analysis with Tharaka having the highest at 93.8 percent and Meru was lowest at 83.3 percent according to routine
data obtained in KHIS. Childcare practices is affected by factors such as time available for child care, availability of bore hole water in agro-pastoral zones of Meru North had decreased
distance to water points.
Water Sanitation and Hygiene
The main sources of water across the cluster was piped water, river/springs, boreholes,
pans/dams and springs and shallow wells. Water treatment remained low in most counties with Meru, Embu and Tharaka at 47 percent, 20-30 percent, and 40 percent respectively. Hand
washing practices during the four critical times was high in Kitui at 89 percengt whereas Meru
and Tharaka were at 68 percent and 77 percent respectively. Latrine coverage was high above 80 percent in all counties within the cluster.
2.4.5.8 Education
Enrolment
There was a general decrease in the enrolment of students across the counties. This was mainly
driven by the impacts of COVID-19, child labour, early pregnancies and early marriages. In Kitui, more girls than boys were enrolled at secondary school levels while more boys compared
to girls were enrolled at both ECD and primary levels. The main reasons behind an increase in enrolment was transfers from towns due to parents’ loss of livelihoods due to COVID-19 and
fear of COVID-19 attacks. In Embu, the decrease in enrolment of boys in primary and
secondary school was mainly through truancy, child labour in miraa business and lack of fees. For the girls pregnancies, early marriages and transfers impacted the enrolment. In Makueni,
secondary school learners decreased slightly, and the dropout cases were also minimal. As a result of transfers due to distance from home and school fees challenges. The few cases of
dropouts were attributed to lack of school fees especially at secondary level, engaging in boda
boda operation among school boys and cases of teenage pregnancies. In Tharaka Nithi, there was no significant change in enrolment during the period. In Meru, there was a significant
positive change in ECD while for primary and secondary level of education levels, there was a negative change as a result of COVID-19. Moreover, there was a high drop in enrolment for
boys largely contributed to by child labour in miraa farms and boda boda business done to
sustain household food requirement. The drop in enrolment for girls by was attributed to pregnancy cases. Other reasons for drop in enrolment included fear of covid-19, migration out
of the region and relocation or transfer to school out of the county.

66
School Meals Programme
In Kitui county, community supported school meals programme (CSSMP) whereby parents
take food items to school or pay cash to school for meals and in-kind school meals programme (ISMP) were the main school feeding programmes in the county targeting about 94,860
beneficiary students (47,425 boys and 47,435 girls). School Meals programme improved
pupils’ attendance, participation, retention and performance. However, majority of schools in the county had no school meal programmes leading to low enrollment, drop out, absenteeism
and poor performance in class. In Embu, non-disbursement of funds to the schools for the last three years has impacted negatively on participation in teaching and learning due to depressed
concentration span. Further, the County Government stopped supplying milk to the ECDE
pupils. In some schools, parents have been contributing foodstuffs to schools for preparation of lunch for their children. In Makueni, during the review period, only a few schools reported
having some form of feeding programmes in Mukaa Sub County. Most of learners carry food to school while others go back home at lunch time. The season was preceded by a period with
little food security challenges at household level and therefore the effects of absence of feeding
at school level may not have had any significant impact on retention. However, going forward there is a looming crisis if the current situation continues. In Tharaka Nithi, there was an
Expanded School Meals Programme (ESMP) in Tharaka South Sub–County by a non-state actor known as International Aid Services. There was no feeding programs in Tharaka North
Sub-County which was initially under the Home Grown School Meals Programme (HGSMP)
which was initially benefitting 102 schools, 22,208 pupils who are now travelling long distances going for lunch hence much time is wasted. All schools in Kathangachini, Kanjoro
and Maragwa are in dire need of feeding programme especially after crop failure in Tharaka Sub County. In Tharaka South Sub-County the types of feeding being implemented was
expanded school meals programme (ESMP) where only 37 schools out of 111 schools
benefited. The programme is being undertaken by an NGO called International AIDS Services. The number of pupils benefitting from SMP are 3587 boys and 3886 girls which amounts to
7,473. Additionally, some of the schools do not have adequate safe drinking water. There are 87 primary schools and 21 secondary schools without safe drinking water. There is no ongoing
feeding programme in the Meru County. The schools make their own arrangements for meals,
some of the children carry their food from home.
2.5 The Coastal Marginal Agricultural Livelihood Cluster
2.5.1 Cluster Background
The cluster is located in the south most tip of
Kenya. It covers an estimated area of about
45,172.7 square kilometers, with a population
of 2,805,201 persons, and consists of Lamu,
Kwale, Taita Taveta and Kilifi Counties.
Major livelihood zones in the cluster include;
Mixed Farming (60 percent of the
population), Trade/Business/Formal
employment/Casual labour that accounts for
21 percent, Marginal Mixed Farming (11
percent) and others make up for 8 percent of the population. Livestock production contributes
40 percent of the cash income while crop production and waged labour account for 30 percent
of the total household income.
Figure 2.11: Coast marginal agricultural cluster livelihood zones

67
2.5.2 Current Drivers of Food Insecurity
Rainfall Performance
The March to May 2020 long rains season onset was late by four dekads (40 days’ period)
except Taita Taveta County where the rainfall delayed by one dekads. Most parts of the cluster received 50-75 percent of the normal rainfall with exception of Lamu County, parts of Voi,
Magarini, Malindi and Kilifi North that received 26-50 percent of Normal. Area of Mpeketoni,
Bahari and Witu and few pockets in the Islands in Lamu County received between 6- 25 percent of the normal rainfall. The cluster had uneven spatial distribution and poor temporal
distribution. The cessation of rains was early across the cluster in the first and second dekad of May compared to normal third dekad of May.
Insecurity and conflict
The communities bordering Tsavo National Park were affected by human and wildlife conflict mainly in the Mixed Farming: Food Crop/ Livestock livelihood zone. Marauding elephants
damaged and destroy crops and water facilities in the newly established NDMA project in Kishushe (Kanyagha – Kijijini water pipeline project). Two plastic tanks each with capacity
of 10,000 litres that had been installed for storage purposes to alleviated water rationing were
damaged. During the field visit it was also reported that farmer elephants destroyed four acres under pigeon peas. Increased cases of human wildlife conflict is attributed to poor rainfall
performance as aforementioned in areas bordering Tsavo East National Park resulting to wildlife encroaching settlement areas in search of forage and water. Human wildlife conflicts
over crops destruction were also reported in Pangani, Lumshi, Didewaride and Mkunumbi
locations in Lamu County. Resource based conflict over rangelands due influx of livestock in areas of Pangani, Lumshi, Didewaride and Mkunumbi between crop farmers and livestock
herders were reported.
COVD-19 pandemic
The COVID-19 pandemic affected revenue collection in Taita Taveta and the recent
Government of Kenya tax increment to raise revenue resulted to increased prices of commodities. Crop failure in the rainfed lowlands during the season, aggravated by fuel
increase has increased cost of living and ultimately increased vulnerability in the community. Covid-19 pandemic continues to negatively impact off-farm income-earning opportunities like
non-farm casual labour, petty trade and remittances. Covid -19 pandemic outbreak in Kwale
county and restrictions in movement negatively affected the availability and access to farm inputs, labour and timeliness of farm operations. Partial shortage of farm inputs was
experienced with some suppliers closing down their businesses resulting in a spike in prices of farm inputs. Constrained availability of farm inputs was experience across Kwale county
therefore limiting acreage and crop production. Women and children are still the main
suppliers of labour as men search for casual jobs in urban centres. Movement restrictions in Kilifi County impacted negatively on the livelihood sources especially labour and business
such as eateries limiting household purchasing power. The supply of food commodities such as maize, beans which are sourced from other regions reduced leading to increase in prices.
Low demand for livestock products led to reduced destocking of livestock and overstretching
of the limited forage and water resources across the livelihood zones.
Other shocks and hazards
Other shocks and hazards include high food prices, endemic animal diseases, Fall Army Worm and Tuta absoluta infestation in Kwale County. There were outbreaks of Newcastle disease,
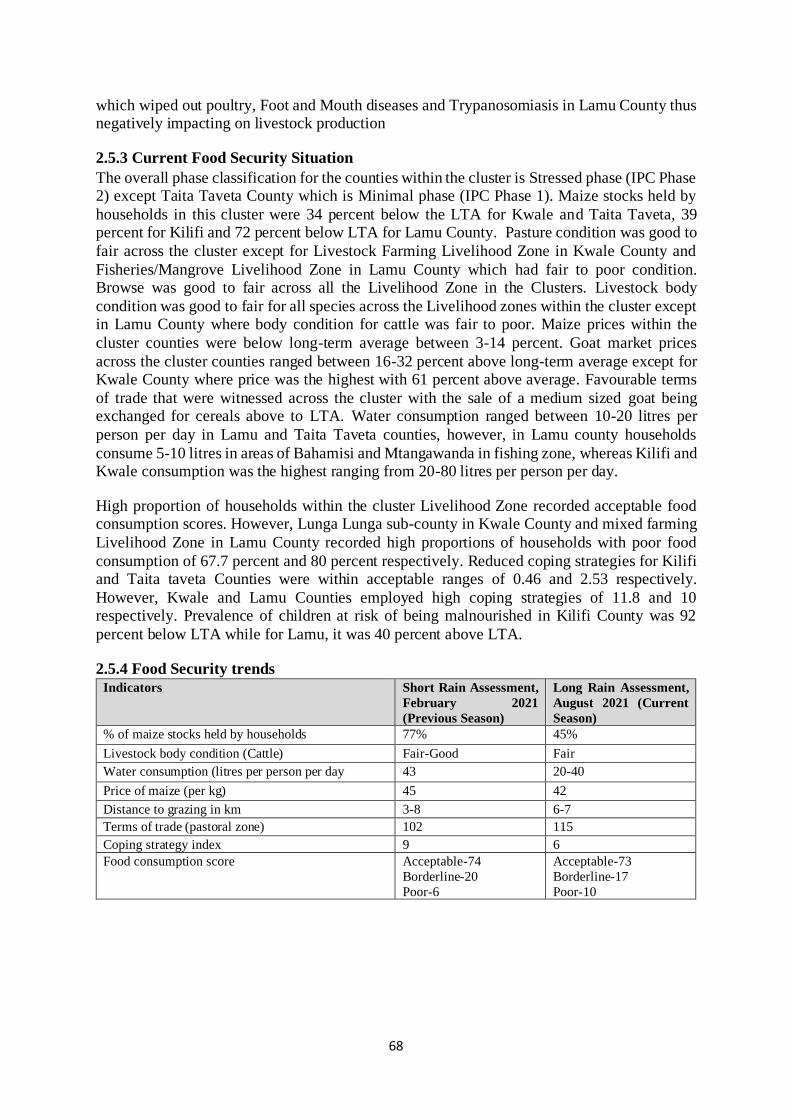
68
which wiped out poultry, Foot and Mouth diseases and Trypanosomiasis in Lamu County thus negatively impacting on livestock production
2.5.3 Current Food Security Situation
The overall phase classification for the counties within the cluster is Stressed phase (IPC Phase 2) except Taita Taveta County which is Minimal phase (IPC Phase 1). Maize stocks held by
households in this cluster were 34 percent below the LTA for Kwale and Taita Taveta, 39 percent for Kilifi and 72 percent below LTA for Lamu County. Pasture condition was good to
fair across the cluster except for Livestock Farming Livelihood Zone in Kwale County and
Fisheries/Mangrove Livelihood Zone in Lamu County which had fair to poor condition. Browse was good to fair across all the Livelihood Zone in the Clusters. Livestock body
condition was good to fair for all species across the Livelihood zones within the cluster except in Lamu County where body condition for cattle was fair to poor. Maize prices within the
cluster counties were below long-term average between 3-14 percent. Goat market prices
across the cluster counties ranged between 16-32 percent above long-term average except for Kwale County where price was the highest with 61 percent above average. Favourable terms
of trade that were witnessed across the cluster with the sale of a medium sized goat being exchanged for cereals above to LTA. Water consumption ranged between 10-20 litres per
person per day in Lamu and Taita Taveta counties, however, in Lamu county households
consume 5-10 litres in areas of Bahamisi and Mtangawanda in fishing zone, whereas Kilifi and Kwale consumption was the highest ranging from 20-80 litres per person per day.
High proportion of households within the cluster Livelihood Zone recorded acceptable food consumption scores. However, Lunga Lunga sub-county in Kwale County and mixed farming
Livelihood Zone in Lamu County recorded high proportions of households with poor food
consumption of 67.7 percent and 80 percent respectively. Reduced coping strategies for Kilifi and Taita taveta Counties were within acceptable ranges of 0.46 and 2.53 respectively.
However, Kwale and Lamu Counties employed high coping strategies of 11.8 and 10 respectively. Prevalence of children at risk of being malnourished in Kilifi County was 92
percent below LTA while for Lamu, it was 40 percent above LTA.
2.5.4 Food Security trends
Indicators Short Rain Assessment,
February 2021
(Previous Season)
Long Rain Assessment,
August 2021 (Current
Season)
% of maize stocks held by households 77% 45%
Livestock body condition (Cattle) Fair-Good Fair
Water consumption (litres per person per day 43 20-40
Price of maize (per kg) 45 42
Distance to grazing in km 3-8 6-7
Terms of trade (pastoral zone) 102 115
Coping strategy index 9 6
Food consumption score Acceptable-74
Borderline-20
Poor-6
Acceptable-73
Borderline-17
Poor-10

69
2.5.5 Impact of Drivers on Food and Nutrition Security
2.5.5.1 Crop production
Rain fed production
Lamu, Kwale and the coastal areas of Kilifi County rely on the long rains season for crop
production, while the hinterland of Kilifi County and Taita Taveta County depend on the short
rain season. The main crop grown in the cluster were maize, green grams and cowpeas. Other
crops were beans, sorghum and pearl millet. The area under cow peas, green grams and maize
was 47, 51 and 64 percent of the LTA. In Lamu, reduction in yields per unit area resulted from
the constrained ability of farmers to access farm inputs such as fertilizers and insecticides
required to control the Fall Army Worm and stock borers, due to limited incomes. The
production of green grams, cow peas and maize were 11, 14 and 30 percent of the LTA. The
late onset and early cessation of rains integrated with its poor distribution attributed to the
decline in area planted and hence decline in production in both cereals and pulses. A large
proportion of farmers in Taita Taveta did not plant due to late onset of the rains and the few
who planted, maize crop wilted at one-foot-high level.
Rain fed crop production
Crop Area planted
during 2021 Long
rains season
(Ha)
LTA area planted
during the Long
rains season (Ha)
2021 Long rains
season production
(90 kg bags)
Projected/Actual
LTA production
during the Long
rains season
(90 kg bags)
Maize 84,088 131,916 376,044 1,260,434
Green gram 13,701 27,053 14,336 132,830
Cow peas 9,776 20,950 14,959 105,418
Irrigated Crop Production
Irrigation in the cluster is mainly carried out in small irrigation schemes along the rivers. The
main crops grown under irrigation are tomatoes, banana and maize. Bananas is mainly grown
in Taita Taveta. Other crops include, papaya, and onions. The area planted under tomatoes was
59 percent of LTA while that of banana and maize was four and 66 percent above the LTA,
The production of tomatoes was 24 percent of the LTA while that of banana and maize was
eight and 75 percent above the LTA. The increase was attributed to farmers adopting good
agricultural practices and support by County Government in terms of well propagated high
quality varieties planting materials and enhanced extension services in Taita Taveta and
increased bucket irrigation to grow high value crops in non-irrigated areas in Kilifi. In Lamu,
there was a decline in irrigation production due to limited incomes to finance the operations
irrigation owing to effects of Covid 19 pandemic on household income sources. In Kwale,
tomato production attributed to National Agricultural and Rural Inclusive Project (NARIGP)
program supported farmers with farm inputs, however they encountered major challenges of
inadequate irrigation water in micro-irrigation sites that affected production. Increased cases
of emerging crop pests and diseases such as Fall Army worm and Tuta absoluta leading to
increased management costs.

70
Irrigated crop production
Crop Area planted
during 2021
Long rains
season (Ha)
Long Term Average
(3 year ) area planted
during the long rains
season (Ha)
2021 long rains
season production
(90 kg bags/tons)
Projected
Long Term Average (3
yr) production during
the short rains season (90
kg bags)
Maize 3,375 2,028 142,574 81,550
Banana 2,065 1,990 75,400 69,800
Tomato 111 187 2,017 8,376
Cereal Stocks The main cereal stocks in the cluster were maize, sorghum and green grams. Other cereals
stocked in small quantities were beans and millet. Sorghum, green grams and millet are mainly
for sale and only consumed to a small extent. Total maize stocks held within the cluster was 92 percent of the LTA. Millers and households maize stock was 49 and 61 percent of the LTA
while traders had 53 percent above the LTA. The sorghum and green grams with farmers was at 31 and 52 percent of the LTA. Traders in Taita Taveta, speculated that maize prices will
increase due to projected poor harvests and below normal harvests realized during short rain in
2020 and are therefore increasing their stock. The available maize stock at household level is projected to last for about 1-2 in Lamu and Kilifi and 1-3 months in Kwale.
Cereal Stocks
Commodity
Maize Rice Sorghum Green gram
Current LTA Current LTA Current LTA Current LTA
Households 100,127 162,867 1,207 3,406 1,100 3,510 5,199 9,908
Traders 155,335 101,644 35,401 29,128 1,501 1,323 18,025 10,292
Millers 12,250 25,038 0 0 0 0 0 1,000
Total 267,712 289,549 36,608 32,534 2,601 4,833 23,224 21,200
2.5.5.2 Livestock Production
Livestock production contributes 15-32, 33, 20-28, 60 and 15 percent to cash income in the Mixed Farming, Marginal Mixed Farming, Livestock farming, Agro-pastoral and Fisheries
Mangroves Livelihood Zones respectively. The main livestock species reared in the cluster are
cattle, sheep, goats, and poultry. The pasture and browse condition was fair to poor in Marginal Mixed Farming, Livestock farming, Agro Pastoral and Fisheries Mangroves Livelihood Zones
compared to good to fair normally. Pasture and browse condition in the Mixed Farming zone was good to fair compared to good normally. In Marginal Mixed Farming, Livestock Farming,
Agro Pastoral and Fisheries Mangroves livelihood zones pasture and browses is projected to
last for 1-2 months compared to 2-3 months normally whereas pasture and browse in Mixed Farming pasture while last for 1.5-3 months compared to 1-4 months normally. On average the
poor performance of both 2020 short rains and 2021 long rains in many parts of the cluster led to minimal regeneration of pasture and browse. Poor pasture condition was noted in some areas
of Taita Taveta County (Marginal Mixed Farming and Livestock Farming zone) and Lamu
County (Agro pastoral and Fisheries Mangroves),

71
Pasture and browse condition
Liveliho
od zone
Pasture Browse
Condition How long to last
(Months) Factors
Limitin
g access
Condition How long to last
(Months) Factors
Limitin
g access
Curre
nt
Norm
al
Curre
nt
Norm
al
Curre
nt
Norm
al
Curre
nt
Norm
al
Mixed
farming
Good-
fair
Good 1.5-3 1-3 Croppin
g, land
tenure,
diseases
Good-
fair
Good 2-3 3-4 Croppin
g, land
tenure
Marginal
Mixed
Farming
Fair-
Poor
Good 1-2 3 None Fair Good 2 3 None
Livestoc
k
farming
Fair-
Poor
Good 1-2 3 None Fair Good 2 3 None
Agro
pastoral
Fair –
poor
fair 1 2-3 fair Good 1-2 3-4
Fisheries
Mangrov
es
Fair-
poor
fair 1 1 3 Fair Good 1 2
Hay Conservation status
County pasture conservation in Kilifi is mainly undertaken by the large dairy farms like Kilifi
plantation, Sumra dairies, Mjanaheri, Makitosha, Kenya Agricultural and Livestock Research (KALRO) Mavuno dairy. A few small-scale farmers were making silage and NARIGP is
supporting dairy value chain actors to set up hay store for stocking. Utilization of conserved pasture in the cluster is between 80-100 percent. Inadequate knowledge and negative attitude
on hay making by most livestock keepers are the limiting factors on pasture conservation. The
cluster had 73 hay stores with a capacity to storing 81,450 bales but holding 31,425 bales during the period. The weight per bale was between 12-18 kilograms and were being sold between at
Kshs. 100-300 per bale. The summary of hay conservation status is highlighted in the table.
Hay Conservation status
County No. of Hay
Stores
Storage
Capacity(bales)
No. of Bales
currently
being held
Average
Weight
per bale
(in Kgs)
Average
price per
bale (Kshs.)
percentage held
by farmers and
other
Institutions
Kilifi 20 2450 625 15-54 100-250 100 percent
famers
Kwale 26 41,000 20,250 18 250 100 % by a
commercial
farmer
Lamu 2 3,500 300 12 200
Taita
Taveta
25 34,500 10,250 300
Total 73 81,450 31,425 12-18 100-300

72
Livestock body condition
Cattle and sheep body conditions were generally good to fair in Mixed Farming and Marginal
Mixed Farming zones, fair to poor in Livestock Farming and Agro-pastoral zones but poor body
condition in Fisheries Mangroves livelihood zone compared to good normally. Goat and camel body
condition were good to fair in all the livelihood zones compared to good normally. The fair to poor body condition for Cattle and sheep in the Livestock Farming, Agro-pastoral and Fisheries
Mangroves zones is due to low rainfall received in these zones which resulted to poor regeneration of forage. Cattle and sheep body conditions are projected to deteriorate further in
the next three months if the livelihoods zones will not receive substantial amount of rainfall
that allows regeneration of pasture and browse. However, for Taita Taveta in Mixed Farming zone where horticulture/ Dairy and Irrigation/ Livestock is practiced body condition for all
livestock species are expected to remain good condition for the next two to three months due to availability of forages and water at short distances
Livestock body condition Livelihood zone
Cattle Sheep Goat Camel
Current Normal Current Normal Current Normal Current Normal
Mixed farming Good-Fair Good Good Good Good Good Good Good
Marginal Mixed
Farming
Good to
Fair
Good Good Good Good Good
Livestock
farming
Fair -
Poor
Good Fair -
Poor
Good Good Good Fair -
Poor
Good
Agro-pastoral Fair-poor good fair good fair good
Fisheries
Mangroves
poor good poor good fair good
Tropical Livestock Units (TLUs)
The TLUs for poor income households remained stable in Mixed Farming, Marginal Mixed
Farming, Livestock Farming and Livelihood Zones except Agro Pastoral Livelihood and Fisheries Mangroves Zones where the number of TLUs were 33 percent below the LTA (Table
8). Similarly, TLUs for Medium income households remained stable in Mixed Farming,
Marginal Mixed Farming, Livestock Farming and Livelihood Zones except Agro Pastoral Livelihood and Fisheries Mangroves Zones where the number of TLUs were 63 and 50 percent
respectively below the LTA. There was no significant variation in the TLUs across Mixed Farming, Marginal Mixed Farming, Livestock Farming and Livelihood Zones as farmers
continued building their herds since the droughts of 2017 where most farmers lost their
livestock in large number. TLUs in the Livestock Farming especially in ranching areas and Mixed Farming zone have progressively increased from the 2019 to date. Low demand of
livestock in the market during the long rain season as also contributed to minimal destocking, However, in Kwale county poor income households in the livestock farming zone were hard
hit by the hard economic status occasioned by covid-19 forcing them to sell their livestock to
cater for their basic needs. In the Agro Pastoral livelihood zones livestock herd sizes have remained below average due to low conception and birth rates during the previous two
consecutive below average seasons while in the Fishing and Mangrove livelihood zone lower TLUs than normal was due to deaths as a result of drought and diseases.

73
Table: Tropical Livestock Units (TLUs) by Household Income
Milk production, consumption and prices
Milk production per household was below the LTA by 12.5, 41.7, 50 and 50 percent in Mixed
farming, Livestock farming, Agro Pastoral and Fisheries Mangroves Livelihood Zones
respectively and stable in Marginal Mixed Farming Livelihood Zone. Low milk production
than LTA in these livelihoods zones is due to poor livestock body condition as a result of poor
regeneration of pastures. Some households in parts of the Livestock Farming livelihood zone
in Kilifi county were not milking at all due to very low production which was attributed to poor
cattle body condition.
While Marginal Mixed Farming had a stable milk consumption, milk consumption per
household in Mixed farming, Livestock farming, Agro Pastoral and Fisheries Mangroves
Livelihood Zones were below the LTA by 50, 55.3, 43.3 and 75 percent respectively. Reduced
milk consumption across the livelihood zones was due to low milk availability resulting from
low milk production coupled with migration of cattle especially in Livestock Farming zone of
Kilifi County. The milk prices were normal in the Marginal Mixed Farming Livelihood Zones
during the period under review. Milk prices were above the LTA in the Mixed farming, Agro
Pastoral and Fisheries Mangroves Livelihood Zones by 17.7, 33.3 and 20 percent respectively
due to reduced production. Poor income households in Kwale county could not afford to buy
milk, which is likely to have a negative impact on the nutrition status of children below five
years in the Livestock Farming zone.
Milk production, consumption and prices Livelihood zone Milk Production
(Litres)/Household
Milk consumption
(Litres)per Household
Prices (Ksh)/Litre/
Current LTA Current LTA Current LTA
Mixed farming 1-6 2-6 <1-2 1-3 35-100 35-80 Marginal Mixed Farming 3 3 1 1 60 60 Livestock farming 0.5-3 2-4 <1-1 1-2 30-60 40-50
Agro Pastoral 1.5 3.0 1.7 3.0 80 60
Fisheries Mangroves 0.5 1-0 0.5 2.0 120 100
Water for livestock
The average return trekking return distances from grazing areas to main water sources were
below normal by 50, 86.7 and 110 percent in Mixed farming, Livestock farming and Agro Pastoral Livelihood Zones respectively. Water was diminishing in open water sources due to
poor performance of the long rains with recharging for water pans being less than 60 percent
across the livelihood zone in Kilifi County. Also, due to low rainfall some parts Livestock Farming zone in Kilifi County where ranching is practiced water pans did not recharge. The
available water was projected to last approximately less than one month to five months which is below the normal of two to 12 months. There was a significant reduction in watering
Livelihood zone
Low income households Middle income households
Current Normal Current Normal
Mixed farming 1-8 1-8 3-30 3-30
Marginal Mixed Farming 4 4 8 8
Livestock farming 2-6.5 3-6 8-10 8-9
Agro-pastoral 10 15 15 40
Fisheries Mangroves 1 3 2 4
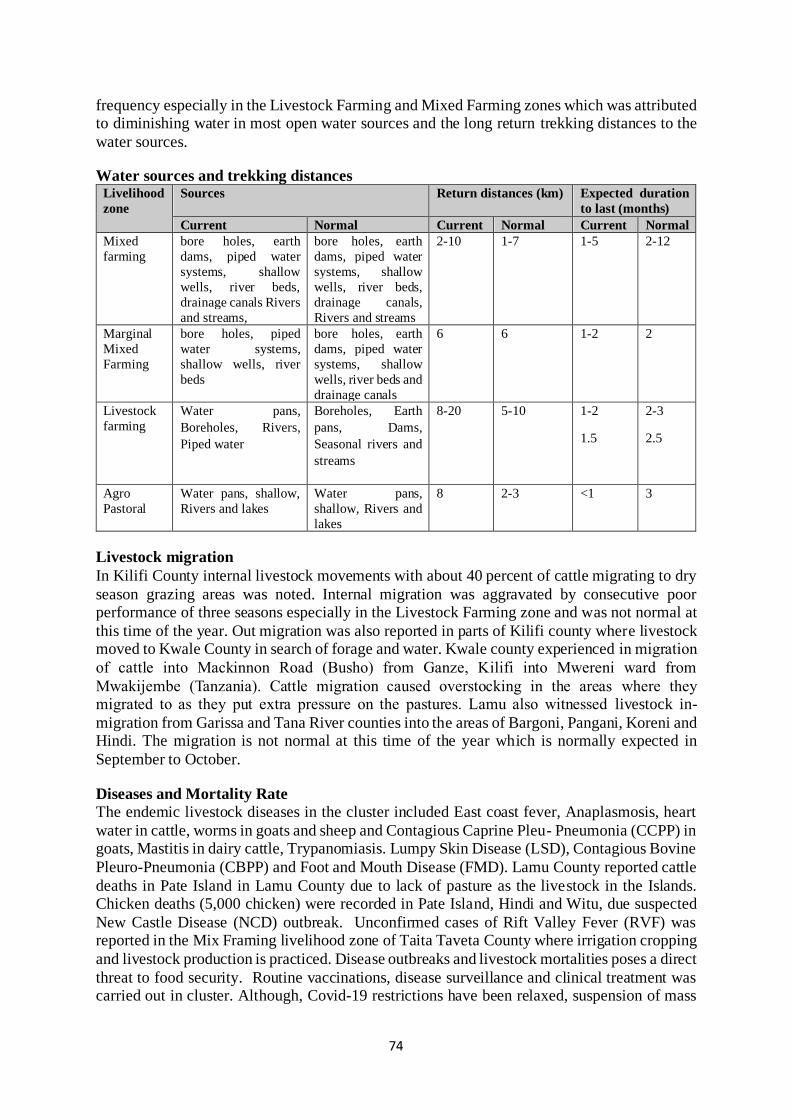
74
frequency especially in the Livestock Farming and Mixed Farming zones which was attributed to diminishing water in most open water sources and the long return trekking distances to the
water sources.
Water sources and trekking distances Livelihood
zone
Sources Return distances (km) Expected duration
to last (months)
Current Normal Current Normal Current Normal
Mixed
farming
bore holes, earth
dams, piped water
systems, shallow
wells, river beds,
drainage canals Rivers
and streams,
bore holes, earth
dams, piped water
systems, shallow
wells, river beds,
drainage canals,
Rivers and streams
2-10 1-7 1-5
2-12
Marginal
Mixed
Farming
bore holes, piped
water systems,
shallow wells, river
beds
bore holes, earth
dams, piped water
systems, shallow
wells, river beds and
drainage canals
6 6 1-2
2
Livestock
farming
Water pans,
Boreholes, Rivers,
Piped water
Boreholes, Earth
pans, Dams,
Seasonal rivers and
streams
8-20 5-10 1-2
1.5
2-3
2.5
Agro
Pastoral
Water pans, shallow,
Rivers and lakes
Water pans,
shallow, Rivers and
lakes
8 2-3 <1
3
Livestock migration
In Kilifi County internal livestock movements with about 40 percent of cattle migrating to dry
season grazing areas was noted. Internal migration was aggravated by consecutive poor performance of three seasons especially in the Livestock Farming zone and was not normal at
this time of the year. Out migration was also reported in parts of Kilifi county where livestock moved to Kwale County in search of forage and water. Kwale county experienced in migration
of cattle into Mackinnon Road (Busho) from Ganze, Kilifi into Mwereni ward from
Mwakijembe (Tanzania). Cattle migration caused overstocking in the areas where they migrated to as they put extra pressure on the pastures. Lamu also witnessed livestock in-
migration from Garissa and Tana River counties into the areas of Bargoni, Pangani, Koreni and Hindi. The migration is not normal at this time of the year which is normally expected in
September to October.
Diseases and Mortality Rate The endemic livestock diseases in the cluster included East coast fever, Anaplasmosis, heart
water in cattle, worms in goats and sheep and Contagious Caprine Pleu- Pneumonia (CCPP) in goats, Mastitis in dairy cattle, Trypanomiasis. Lumpy Skin Disease (LSD), Contagious Bovine
Pleuro-Pneumonia (CBPP) and Foot and Mouth Disease (FMD). Lamu County reported cattle
deaths in Pate Island in Lamu County due to lack of pasture as the livestock in the Islands. Chicken deaths (5,000 chicken) were recorded in Pate Island, Hindi and Witu, due suspected
New Castle Disease (NCD) outbreak. Unconfirmed cases of Rift Valley Fever (RVF) was reported in the Mix Framing livelihood zone of Taita Taveta County where irrigation cropping
and livestock production is practiced. Disease outbreaks and livestock mortalities poses a direct
threat to food security. Routine vaccinations, disease surveillance and clinical treatment was carried out in cluster. Although, Covid-19 restrictions have been relaxed, suspension of mass

75
vaccination activities to avoid aggregating the farmers in common sites used for vaccination is still in force limiting disease surveillance and control in the county.
2.5.5.3 Market Performance
All the markets were functioning normally and were well provisioned with essential food commodities. Kwale County had interruptions on supplies from Tanzania due to Covid-19
restrictions on movement. The most commonly food commodities traded included maize, beans, green grams, maize flour, sugar, cowpeas, rice and were readily available. Livestock
species in the market were cattle, sheep, goat and poultry. Most of the food commodities in the
markets were locally sourced through own production and also externally from across the Republic of Tanzania. Traded volumes increased in Taita Taveta, low for Kilifi but normal for
the other counties in the cluster.
Market Prices
Below average maize
prices were reported across the cluster with
Taita Taveta recording
the least prices at Ksh. 37 compared to the long
term average of Ksh. 40. On the other hand Lamu
county reported the
highest price of maize per kilogram at Ksh. 45
compared to the long term average of Ksh. 49
as shown in Figure 2.12.
The average price of a medium sized goat
retailed between Ksh. 4,000 in Kwale county
and Ksh. 5,400 in Lamu county against the
2.5.5.4 Water Access and Availability
The major sources of water for domestic use are water pans/dams, rivers, shallow wells,
traditional river wells, natural ponds, boreholes and piped water systems. Other sources included rock catchment and drainage canals especially in Taita Taveta. The open water
sources were recharged at 30-45 percent of their capacities across the cluster. Approximately
40-50 percent of the boreholes were operational. However, non-operational of boreholes was due to low yield, poor water quality, damaged or breakdown of boreholes, vandalized solar
power structures and low pressures along pipelines. Water rationing limited access to water in parts of livestock farming in Kilifi and mixed farming (food crops and livestock) areas in Taita
Taveta. Water is expected to last 1-3 months in Kilifi and Taita Taveta and 4-8 months in parts
of Kwale. While in Lamu, water is expected to last less than a month.
Return distances to domestic water
The return distances to domestic water ranged 1-2 kilometres in all livelihood zones in Lamu, mixed farming in Kwale and mixed farming (horticulture and dairy) in Taita Taveta which was
within the normal. However, in Kilifi, Kwale and mixed farming (food crops and livestock) in
Figure 2.12: Comparative maize price trends across the cluster

76
Taita Taveta, the distances ranged 3-6 kilometres compared to 2-5 kilometres normally. The waiting time at the source was 15-20 minutes in Kilifi compared to 5-10 minutes normally.
Lowest waiting time was reported in mixed farming in Kwale and mixed farming (irrigation and livestock) in Taita Taveta at 1-5 minutes which was normal. However, highest waiting
times at 30-60 minutes was reported in Lamu compared to 15-30 minutes normally.
Cost of Water
The cost of water was within normal range of Ksh.5-10 per 20 litres jerrycan which was normal
except in Taita Taveta where the cost was Ksh. 2-5 per 20 litres jerrycan. However, in fishing/mangrove livelihood zone in Lamu, the cost of 20 litres jerrycan was Ksh.10-50
compared to Ksh.10-15 normally. Water from vendors was Ksh.10-30 in Taita Taveta, Ksh.
40-50 in livestock farming/ranching zone in Kilifi (Bofu, Chamari and Ndatani) while in Lamu (Mtangawanda and Bahamisi), it was Ksh.50-100 per 20 litres jerrycan.
Water consumption
Water consumption ranged between 10-20 litres per person per day in Lamu and Taita Taveta
compared to normal of 20-25 litres per person per day. In Kwale and Kilifi, consumption of
water was highest 30-60 litres per person per day compared to normal of 60-80 litres per person per day. However, in Taita Taveta mixed farming (food crops and livestock) in Kasigau areas
and Kilifi (livestock farming areas in Ndigiria and Bofu), households consumed less than 10 litres per person per day. Latrine coverage in the cluster ranged 60-95 percent.
2.5.5.5 Food Consumption
As at July, 2021, majority of the households in the cluster were having acceptable food consumption scores with the highest being in Taita Taveta County. Lamu County had the
highest proportion of households with borderline food consumption score at 67.3 percent.
Other counties with a relatively high proportion of households with borderline food consumption scores were Kwale and Kilifi Counties with 16.6 and 11.8 percent respectively.
In Lamu and Kwale Counties, 28.7, and 10.5 percent of households had poor food consumption scores respectively. Majority of households with acceptable food consumption scores across
the cluster were able to take food from different food groups thus were likely to meet their
nutrient requirements for the day.
2.5.5.6 Coping Strategies
Households who were not employing any livelihood change coping strategies in the cluster were; -Taita Taveta (98.1 percent), Kilifi (86.7 percent), Lamu (74.7 percent) and the lowest
proportion is in Kwale (41.4 percent). The highest proportion employing Stressed coping
livelihood strategies were in Lamu County (25.3 percent) followed by Kwale county (19.9 percent). There were no households employing Crisis livelihood coping strategies across the
cluster except in Kwale and Kilifi counties where 29.3 percent and 10.9 percent of the households respectively were employing livelihood strategies. In Kwale County, 9.4 percent
of the households were employing emergency coping strategies. In this cluster, the highest
proportion of households not employing food related consumption strategies was in Taita Taveta County (98.6 percent. The highest proportion of households employing Stressed food
related coping strategies were in Lamu (64.7 percent), Kilifi (47.9 percent) and Kwale (34.3 percent). In Kwale County, 39.8 percent were employing crisis food related coping strategies

77
2.5.5.7 Health and Nutrition
Nutrition Situation
There was no adequate data for the IPC acute malnutrition classification in the four Counties in the cluster; no recent SMART or KABPs survey conducted in the last 2 years. The MUAC
data from the sentinel surveillance sites in the cluster did not meet threshold and therefore could
not be used for classification. However, the admission trends into the therapeutic programs showed a downward trend in outpatient therapeutic program and a fluctuating trend across the
cluster in supplementary feeding programmes from March, 2021 onwards except for Kilifi and Kwale clusters which had an upward trend in admissions into supplementary feeding program.
Across the cluster there was observed increase in admissions in the Month of March and April
2021 attributed to resumption of essential health services at the facility level following calling off of the nurse’s strike. High admissions were observed in Taita Taveta cluster in outpatient
therapeutic program during this period of analysis compared with the previous years. In the projected period the historical trends have always shown an increasing trend owing to
dwindling household food stocks which will adversely affect food security.
Morbidity and mortality
Across the cluster, acute respiratory tract infection (URTIs), malaria and diarrhea remained the
predominant causes of morbidity during the period under review. However, the cases remained within the seasonal morbidity trends. There were no disease outbreaks within the period of
analysis in the cluster. The cluster has a cumulative 5966 covid-19 cases since the first case
was reported in the country. The average case fatality rate is 1.68 percent with the highest CFR reported in Lamu at 2.4 percent pandemic in the cluster while the lowest CFR is in Taita Taveta
at 1.1 percent. In terms of the distribution of the cases 67.9 percent of the cases are in Kilifi county.
Immunization and Micronutrient Supplementation
The immunization coverage in 2021 across the cluster was above 80 percent for measles and Fully Immunized Child (FIC) with an exception of OPV3. Comparing the FIC to the same
period last year there is an improvement noted in Kwale, which is attributed to the earlier resumption of immunization through facility and outreach services after Health workers strike.
The Vitamin A Supplementation coverage across the cluster was able to surpass the national
target as compared to 2020 where none met covered the expected 80 percent. The increase is attributed to the Malezi Bora month through involvement of the CHEWs and CHVs
community’s house to house, ECDE centers and referrals by CHVs to the facilities were used for the campaign. There has not been any significant impact of Covid 19 to the immunization
and Vitamin A Supplementation in 2021 as the facilities are adhering to the Covid 19
regulations while offering these services.
Dietary intake
The food security situation in the Lamu, Kilifi, and Kwale were in stressed (IPC phase 2) while Taita Taveta was in minimal (IPC phase 1) with a stable trend. Majority of Households were
in acceptable food consumption score in Kilifi (86. 6 percent), Kwale (72.9 percent), Taita
(98.6 percent) with Lamu recording four percent of the households. Most households in the cluster consumed 2 to 3 meals per day consisting cereals, pulses oils and sugars. Above 45%
of households in Crisis and stressed phase in rCSI in Kilifi, Kwale and Lamu Counties. There was no reliable current data for caring practices across the cluster, however, historical data
indicates poor child caring practices that contribute to acute malnutrition. This includes giving Prelacteal feeding which is a challenge that requires immediate intervention. Poor children’s
minimum acceptable diets are also reported to be poor and this has a connection to poor
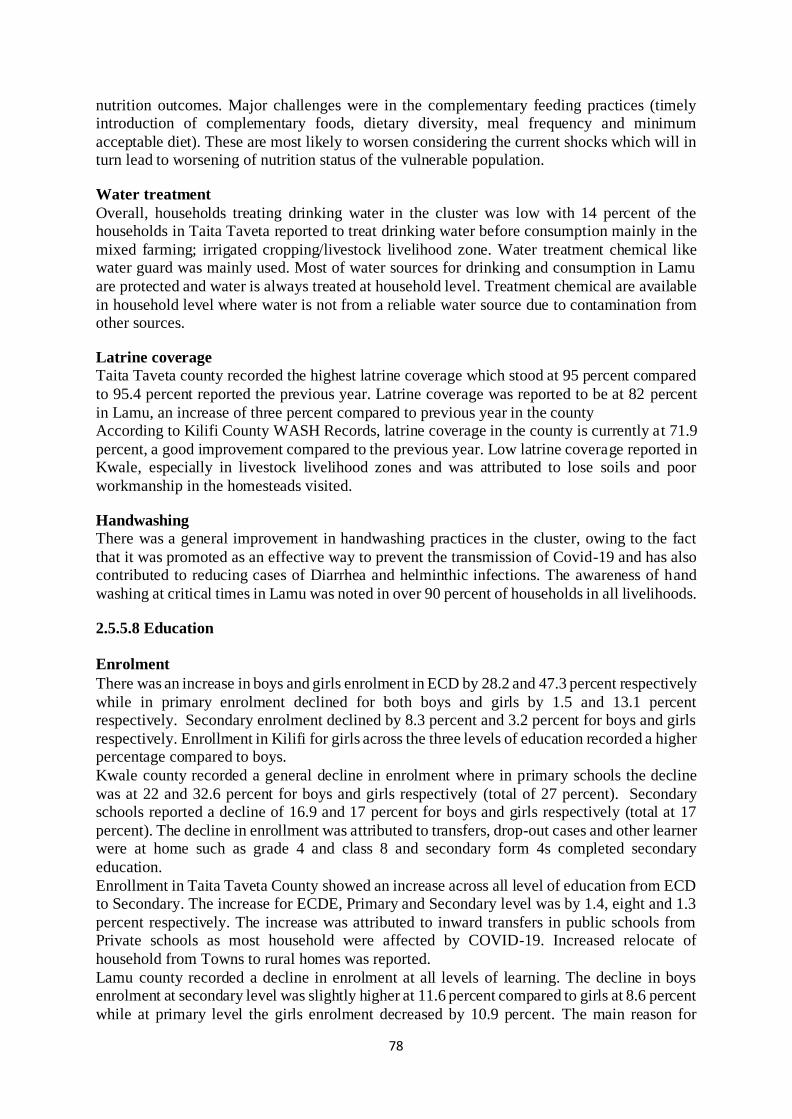
78
nutrition outcomes. Major challenges were in the complementary feeding practices (timely introduction of complementary foods, dietary diversity, meal frequency and minimum
acceptable diet). These are most likely to worsen considering the current shocks which will in turn lead to worsening of nutrition status of the vulnerable population.
Water treatment
Overall, households treating drinking water in the cluster was low with 14 percent of the households in Taita Taveta reported to treat drinking water before consumption mainly in the
mixed farming; irrigated cropping/livestock livelihood zone. Water treatment chemical like water guard was mainly used. Most of water sources for drinking and consumption in Lamu
are protected and water is always treated at household level. Treatment chemical are available
in household level where water is not from a reliable water source due to contamination from other sources.
Latrine coverage
Taita Taveta county recorded the highest latrine coverage which stood at 95 percent compared
to 95.4 percent reported the previous year. Latrine coverage was reported to be at 82 percent
in Lamu, an increase of three percent compared to previous year in the county According to Kilifi County WASH Records, latrine coverage in the county is currently at 71.9
percent, a good improvement compared to the previous year. Low latrine coverage reported in Kwale, especially in livestock livelihood zones and was attributed to lose soils and poor
workmanship in the homesteads visited.
Handwashing
There was a general improvement in handwashing practices in the cluster, owing to the fact
that it was promoted as an effective way to prevent the transmission of Covid-19 and has also contributed to reducing cases of Diarrhea and helminthic infections. The awareness of hand
washing at critical times in Lamu was noted in over 90 percent of households in all livelihoods.
2.5.5.8 Education
Enrolment
There was an increase in boys and girls enrolment in ECD by 28.2 and 47.3 percent respectively
while in primary enrolment declined for both boys and girls by 1.5 and 13.1 percent respectively. Secondary enrolment declined by 8.3 percent and 3.2 percent for boys and girls
respectively. Enrollment in Kilifi for girls across the three levels of education recorded a higher percentage compared to boys.
Kwale county recorded a general decline in enrolment where in primary schools the decline
was at 22 and 32.6 percent for boys and girls respectively (total of 27 percent). Secondary schools reported a decline of 16.9 and 17 percent for boys and girls respectively (total at 17
percent). The decline in enrollment was attributed to transfers, drop-out cases and other learner were at home such as grade 4 and class 8 and secondary form 4s completed secondary
education.
Enrollment in Taita Taveta County showed an increase across all level of education from ECD to Secondary. The increase for ECDE, Primary and Secondary level was by 1.4, eight and 1.3
percent respectively. The increase was attributed to inward transfers in public schools from Private schools as most household were affected by COVID-19. Increased relocate of
household from Towns to rural homes was reported.
Lamu county recorded a decline in enrolment at all levels of learning. The decline in boys enrolment at secondary level was slightly higher at 11.6 percent compared to girls at 8.6 percent
while at primary level the girls enrolment decreased by 10.9 percent. The main reason for

79
dropout for girls was attributed to pregnancies and household chores while for boys casual labor, bodaboda and businesses were the main factors. Transfers of learners to other regions
was attributed to loss of income sources due to COVID-19 and urban Rural migration. Most students also moved to different regions largely because their parents lost sources of income
and employment as a result of COVID 19 pandemic restrictions. Some students also transferred
to day school near their homes which are more affordable. The variation across the cluster in January to May 2021.
Enrollment: January to May 2021
Sub Counties
Percentage change in Enrollment. (January to May 2021)
ECD Primary Secondary
Boys Girls Boys Girls Boys Girls
Kilifi 12.0 20.1 22.2 22.0 19.1 20.9
Kwale 25.0 25.6 -22.0 -32.6 -16.9 -17.0
Taita Taveta 1.2 1.6 8.2 8.4 1.1 1.5
Lamu -10.0 .-9.5 -9.9 -10.9 -11.6 -8.6
Total 28.2 47.3 -1.5 -13.1 -8.3 -3.2
Effect of Long Rains
Poor crop productions in most areas in Kilifi county contributed to increased absenteeism in
school since some children joined their parents to generate income for food and movement with livestock in search of water and forage. Kwale reported minimal effect of long rains
compared to the previous year due to poor rainfall performance during the season.
School feeding programme
School meals were not provided in all public primary schools under Regular School Meals
Programme (RSMP) since late 2018. The school feeding programme when available was
reported to positively impact on retention of learners in schools. Only 3 primary schools in Kwale County had community supported school meals (CSSM) that included two low-cost
boarding institutions which caters for 419 boys and 433 girls and 98 percent of secondary schools have school feeding program funded fully by parents. In Taita Taveta county, 90
percent of pupils are under the parent or community school meals programs while 10 percent
are not in any school meals program. A total of 6,703 pupils in Lamu county who are beneficiaries of the feeding programme missed their meals due to lack of timely disbursement
of funds. 109 primary schools in Lamu county did not have any type of school feeding programme in the third term in May 2021 a total of 29,178 learners.
Inter-sector links
The COVID-19 pandemic has contributed to reduced ability of parents in paying school fees due to loss of income. Within Taita Taveta county, schools across the county have adequate
supply of water from source and only a few isolated households cannot access clean water especially in the livestock zones. There was notable improved hygiene in most schools with
the presence of functional latrines and access to hand washing facilities in most of the schools.
In Kwale county in terms of water and sanitation the following learning institution had no water supply: About 7.9, 35 and 17.3 percent of learners in ECDE, Primary and Secondary schools
respectively carry water from home to school. All the institutions had hand washing facilities; however, 49 percent did not provide soap.

80
On Child protection, Plan International has child protection packages and CBOs are carrying out sensitizing on child protection in schools and local community. Ministry of Education
(MOE) organized stakeholder fora to sensitize the community on child protection and strengthening Guidance and Counselling on behavioral change in schools. Provision of sanitary
towels to girls in the county was done by the county government and other donors including
Safaricom Foundation in primary schools, however there were no sanitary towels during school closure. Inadequate classrooms and sharing of desks most classrooms were overcrowded
especially on meeting COVID -19 Ministry of Health protocols was a challenge with some learners still sitting on the floor.

81
3.0 Food Security Prognosis
3.1 Assumptions
The following assumptions are expected to drive the most likely food security outcomes during the August 2021 – January 2022 period;
• According to a statement to the Ministry of Health, an expected 4.7 million doses of
different available vaccines are to be received in Kenya by mid-September. However,
this amounts to approximately ten percent of the total country’s population which remains a low vaccination rate. It is expected that some of the COVID-19 related
restrictions are expected to be lifted progressively as vaccination rates increase slightly
improving household income-earning opportunities and food security. However, most of the COVID-19 related restrictions are likely to remain in place through the scenario
period, significantly impacting household income and food access negatively.
• According to FEWS NET price projections, maize prices in Nairobi urban market, a
proxy for national prices are expected to remain 17-28 percent below average through January driven by above-average maize production in Uganda and near-average long
rains harvests from Kenya’s high and medium rainfall areas from October. Bean prices however are expected to remain 20-25 percent above the five-year average through the
scenario period driven by low carryover stocks and current below-average production.
• According to NMME ensemble climate models, there is likely to be a weak La Nina
effect and as a result there is a 40 – 60 percent probability that the 2021 October to
December short rains are expected to be below average in the eastern parts of the Country. However, the rains in western Kenya are forecasted to be normal. The
temperature is forecast to be average in western Kenya but in eastern Kenya there is a 40 – 60 percent probability that the temperatures will be above average from October
to December 2021.
• Atypical livestock migration is expected to intensify from September through October
and from December until the beginning of the 2022 March to May long rains. The
intensified migration is expected to increase incidences of resource-based conflicts that will disrupt market functions, schooling activities, access to health facilities and
services and disrupt livelihood activities.
• The forecasted below average October to December short rains are likely to drive below
average crop production activities in the cropping areas such as land preparation, planting and weeding which will reduce on-farm casual labor income earning
opportunities. Household income is likely to be below average forcing household to seek additional income from off-farm sources to bridge income gaps.
• Following the below average crop production from the 2021 long rains season, the
below average harvests in the marginal agricultural areas are expected to last 1 – 2
months to October across most areas. From October, most poor households are
expected to depend on markets as a source of food as their household food stocks get depleted.
• The forecast below-average October to December short rains are expected to result in
partial regeneration of forage and water resources while forecasted high temperatures
are expected to drive a rapid deterioration of these resources. This will result in low livestock conception and birth rates are expected from mid-November, driving below-
average household milk availability and related income throughout the scenario period.

82
3.2 Food security Prognosis (August 2021 – January 2022)
Most Likely Food Security Outcomes
Pastoral Areas
The deterioration of the already below average rangeland resources is expected to start off the
lean season early intensifying livestock migration even further to the dry-season grazing areas and expand their range further to atypical routes to neighboring counties and across the border
to neighboring countries driving resource-based conflicts between fellow herders and farmers. With the decline of rangeland resources return trekking distances are expected to increase
driving a deterioration in livestock body conditions and productivity reducing milk production
and sale value. Livestock herders are expected to congregate in the areas where the scarce rangeland resources are available which will likely result in resource-based and tribal conflicts
and livestock disease outbreaks that may result in significant livestock deaths due to the weakened body state of the livestock. Reduced assets because of the livestock deaths and
reduced sale value will reduce household income and households will attempt to intensify non-
livestock income sources such as casual labor, charcoal and firewood sales, and petty trade which will likely be limited due to high competition. To bridge food and income gaps,
households will employ consumption-based coping strategies such as skipping meals and eating less preferred foods and employ livelihood-based strategies like purchasing food on
credit and practice asset stripping with more households moving into Crisis (IPC Phase 3) by
late October. In late October the forecast below average short rains are expected to begin late and only partially recharge forage and water resources. Livestock will likely recover slightly
and not be able to achieve complete recovery keeping sale values and milk production low. The livestock that had previously migrated will likely remain in the dry season grazing areas
keeping milk access low at household level and the remaining livestock that had not migrated will begin migrating early from late December. Low milk consumption at household level will
increase malnutrition levels which will be ‘Alert’ (GAM MUAC 5-9.9 percent) in Saku and
Moyale sub-counties of Marsabit County, Serious’ (GAM MUAC 10 – 14.9 percent) in West Pokot and Tana River and ‘Critical’ (GAM MUAC 15 – 29.9 percent) across the rest of the
areas. Low income and high staple food prices will result in in income and food gaps at household level and more households will move into Crisis (IPC Phase 3) while Stressed (IPC
Phase 2) area-level outcomes will persist in parts of West Pokot, Samburu, Tana River and
Baringo while Crisis (IPC Phase 3) area-level outcomes will likely be observed in Turkana, Marsabit, Isiolo, Wajir, Mandera and Garissa counties and parts of Baringo, Samburu, Laikipia
and Tana River. In these counties, there will be a small population of most-affected households that will be in Emergency (Phase 4) but will not achieve the threshold of 20 percent for area-
level mapping.
Marginal Areas
Household food availability is set to decrease over the next two months as household food
stocks diminish and become depleted by the end of September signaling a return to market
dependence for households in these areas. The October to December short rains season is the
main production season in the marginal areas and the forecast below average short rains will
reduce cropping activities and associated income from casual labor from September onwards
and from crop sales from December onwards. Household food availability is expected to be
below average through the scenario period due to expected below average short cycle crop
harvests in December and the main harvest in February. The short rains are expected to improve
forage and water availability for a short-lived period improving livestock productivity
momentarily however, milk production and consumption at household level is expected to be

83
below average and will drive an increase in malnutrition for children under five years of age.
Despite low income, households will get relief from projected below average staple food prices
due to carryover stocks, cross-border imports and as harvests from the high and medium rainfall
areas become available from September which will keep food relatively accessible by
households. To obtain income, households will intensify use of consumption coping strategies
and livelihood coping strategies such as purchasing food on credit, selling of productive assets,
sending household members to eat elsewhere, spending savings and borrowing money. At least
one in five households in will be able to afford their minimum food needs but be unable to
afford non-food needs in Kitui, Lamu and parts of Nyeri (Kieni), Meru (Meru North), Embu
(Mbeere), Tharaka Nithi (Tharaka), Makueni, Taita Taveta, Kwale and Kilifi and be in Stressed
(IPC Phase 2).

84
4.0 Proposed Sectoral Interventions
Options for response
The tables below contain priority response options by sector. Immediate interventions to
mitigate food insecurity should be complemented by medium to long-term interventions that
build the resilience of vulnerable communities
4.1 Agriculture Sector: Priority Interventions (August 2021 – Feb 2022)
Interventions Counties Cost Kshs (Millions)
Provision of Drought Tolerant Seed
Provision of fertilizer subsidy ,Enhance asset
creation, enhance irrigated agriculture by
conducting soil analysis and crop suitability,
Pest and disease control, Provision of farm
inputs, Post-harvest management and
preservation,
Turkana, Samburu, West Pokot,
Narok, Nyeri, Baringo, Laikipia,
Meru North, Isiolo, Kitui,
Makueni, Narok, Meru, Embu,
Kitui, Lamu, Taita Taveta,
Kwale, Tharaka, Kajiado and
Tana river
90
Development of irrigation infrastructure, Value
addition and conservation agriculture and
Capacity building of farmers. Sensitization on
Crop insurance Sensitization on proper grain
storage practices
Baringo, West Pokot, Nyeri,
Isiolo, Turkana, Kilifi, Makueni,
Meru, Embu, Taita taveta, Nyeri
and Tharaka
140
Total 230
4.2 Livestock Sector: Priority Interventions (August 2021 – Feb 2022)
Interventions Counties Cost Kshs (Millions)
Livestock feed supplements, Pasture and disease
surveillance, Creation of awareness, Control of
vectors, Pasture and fodder establishment and
conservation, Purchase and distribution of
supplementary feeds, Breed improvement and
Livestock insurance cover. Vaccination and
treatment. Commercial destocking and Water
trucking for livestock
Kajiado, Isiolo, Mandera, Wajir,
Tana River, Garissa, Turkana,
Samburu, Marsabit, Taita
Taveta, Kilifi, Makueni, Kitui,
Meru, Baringo, West Pokot,
Laikipia, Kwale, Makueni,
Meru, Embu, Nyeri and Narok
1,100
Total 1,100
4.3 Water Sector: Priority Interventions (August 2021 – Feb 2022)
Interventions Counties Cost Kshs (Millions)
Water trucking, Rehabilitation boreholes,
pipelines and water supply. Desilting and
rehabilitation of pans. Support Rapid
Response Team to emergency borehole
break down support.
Isiolo, Mandera, Wajir, Tana River,
Garissa, Marsabit, Samburu, Turkana,
Kilifi, Kwale, Taita Taveta, Lamu,
Baringo, West Pokot, Tharaka Nithi,
Meru North, Kajiado, Kitui, Makueni,
Mbeere and Nyeri
220
Water harvesting, especially in schools and
health centres, Water treatment chemicals,
Fuel subsidy to communities, Construction
of new water sources, Hydro-Geological
Surveys and Water desalination plants
Isiolo, Mandera, Wajir, Tana River,
Garissa, Marsabit, Samburu, Turkana,
Kilifi, Kwale, Taita Taveta, Lamu,
Baringo, West Pokot, Tharaka Nithi,
Meru North, Kajiado, Kitui, Makueni,
Mbeere and Nyeri
160
Total 380

85
4.4 Health and Nutrition Sector: Priority Interventions (August 2021 – Feb 2022)
Interventions Counties Cost Kshs (Millions)
Implementation of high impact health
and nutrition
Interventions including IMAM,
Integrated health and nutrition
outreaches, Capacity strengthening,
Nutrition
Turkana, Samburu,Garissa, Wajir,
Mandera, Tana River, Isiolo, Kwale,
Lamu, Taita Taveta, Kilifi Embu,
Mbeere, Nyeri, Tharaka, Baringo, West
Pokot, Kajiado Narok, Makueni, kitui
and Meru
680
Surveillance and coordination. Provision
of vitamin A, Zinc and Iron Folate
Supplementation among Pregnant Women.
Capacitity and sensitization of health
workers on Covid-19
Isiolo, Garissa, Kilifi, Tana River,
Mandera, Wajir, Turkana, Samburu,
Marsabit, Kwale, Lamu, Taita Taveta,
Embu, Nyeri, Kitui, Tharaka, Baringo,
West Pokot, Kajiado and Narok
350
Total 1,030
4.5 Education Sector: Priority Interventions (August 2021 – Feb 2022)
Interventions Counties Cost Kshs (Millions)
Water trucking for schools, Provision of hand
washing Facilities and soap. Provision of school
meals. Provision of age-appropriate reusable
face masks and thermos-guns.
Expansion of School Meals Programme to
include all
Isiolo,Garissa, Kilifi, Tana
River, Mandera, Wajir, Turkana,
Samburu, Marsabit, Kwale, Lamu,
Taita Taveta, Embu, Nyeri, Kitui,
Tharaka, Baringo, West Pokot,
Kajiado and Narok
300
ECD pupils and Increased allocation for
bursaries to support secondary school lunch
programmes.Training of learners, teachers and
school management on implementation of
covid19 protocols
Taveta, Embu, Nyeri, Kitui,
Tharaka, Baringo, West Pokot,
Kajiado and Narok,
Isiolo,Garissa, Kilifi, Tana
River, Mandera, Wajir, Turkana,
Samburu
155
Total 455
4.6 Food Assistance Sector: Priority Interventions (August 2021 – Feb 2022)
Interventions Counties Cost Kshs (Millions)
In kind, cash transfer and safety
net programmes that are
nutrition sensitive including
asset creation activities to
strengthen food systems and
build resilience for
approximately 2.1 million food
insecure populations.
All ASAL counties except Narok, Embu
(Mbeere), Meru (North) and Nyeri (Kieni)
15,400
Total 15,400
4.7 Peace and Security Sector: Priority Interventions (August 2021 – Feb 2022) Interventions Counties Cost Kshs (Millions)
Peace building initiatives to
resolve conflict over resources
and monitoring of potential
conflict locations and support to
response
Marsabit, Samburu, Turkana, Mandera, Garissa,
Isiolo, Laikipia, West Pokot, Baringo and Meru
46
Total 46
Related Documents