GOVERNMENT OF GOA STATISTICAL HAND BOOK OF GOA 2016-17 Publication Division, Directorate of Planning, Statistics and Evaluation, Porvorim-Goa P R E F A C E The Statistical Hand Book of Goa is a regular publication of this Directorate of Planning, Statistics & Evaluation. The current issue is the 43 rd in the series for the year 2016-17. It is an important venture in dissemination of useful Socio-economic information about the State. Data have been provided district wise for North Goa and South Goa districts, wherever possible. It is hoped that this publication will serve as a useful and convenient reference, on the State’s socio-economic statistics, for the Government Departments, Educational Institutions, Research Scholars, Tourists, etc. It is my pleasure to extend my thanks to the various Departments/Agencies of our local Government/Government of India and other Organisations for their continued & generous co-operation in making available to us the requisite data incorporated in this publication. The hard work put in by staff of the publication Division of this Directorate in bringing out this Hand Book is also acknowledged. It has been our endeavour to consistently improve the quality of presentation of data in this publication. However, suggestions for improvement in contents & quality are most welcome. Porvorim, Goa. Dr. Y. Durga Prasad 2018. Director

Welcome message from author
This document is posted to help you gain knowledge. Please leave a comment to let me know what you think about it! Share it to your friends and learn new things together.
Transcript

GOVERNMENT OF GOA
STATISTICAL
HAND BOOK OF
GOA
2016-17
Publication Division, Directorate of Planning, Statistics and Evaluation,
Porvorim-Goa
P R E F A C E
The Statistical Hand Book of Goa is a regular publication of this Directorate of
Planning, Statistics & Evaluation. The current issue is the 43rd in the series for the
year 2016-17. It is an important venture in dissemination of useful Socio-economic
information about the State. Data have been provided district wise for North Goa
and South Goa districts, wherever possible.
It is hoped that this publication will serve as a useful and convenient reference, on
the State’s socio-economic statistics, for the Government Departments,
Educational Institutions, Research Scholars, Tourists, etc.
It is my pleasure to extend my thanks to the various Departments/Agencies of our
local Government/Government of India and other Organisations for their continued
& generous co-operation in making available to us the requisite data incorporated
in this publication.
The hard work put in by staff of the publication Division of this Directorate in
bringing out this Hand Book is also acknowledged.
It has been our endeavour to consistently improve the quality of presentation of
data in this publication. However, suggestions for improvement in contents &
quality are most welcome.
Porvorim, Goa. Dr. Y. Durga Prasad
2018. Director

CONTENTS
Page
I. CLIMATE
1. Rainfall at selected station of Goa state in year 2016.
2. Maximum and minimum temperatures for Panaji
and Mormugao towns, 2016. 2
II. AREA AND POPULATION
3. Important population characteristics, 2011 3
3A. Talukawise distribution of Geographical area, 2011 4
4. Talukawise distribution of population & density, 2011 5
5. Talukawise Number of towns & census villages, 2011 6
6. Decennial Growth of Population, Goa 7
7. Talukawise distribution of Population according to
Rural and Urban, 2011 8
8. Talukawise Population by Sex, 2011 9
9. Distribution of Population by Literacy in Rural and
Urban Areas, 2011 10
10A. Talukawise Literacy by sex, 2011 11
10B. Talukawise percentage of literacy by sex, 2011 12
11. Talukawise distribution of economically active Main
workers, Marginal workers and Non-workers, 2011 13
-a-
Page
12. Talukawise distribution of working population (Total
workers) by industrial category, 2011 14-15
13. Talukawise distribution of population of Scheduled
castes & Scheduled tribes, 2011 16
14. Distribution of population by major religious
Communities, 2011. 17
15. All India population by States / Union Territories. 2011 18-19
16. All India sexwise population by States /UnionTerritories. 2011 20-21
17. All India literacy by States/Union Territories, 2011 22-23
III. AGRICULTURE
18. Land utilization pattern, 2016-17 24
19. Estimates of total area under principal crops and
irrigated area, 2016-17. 25
20. Production Estimates of Paddy, Rice & Ragi Crops in
Kharif season, 2016-17. 26
21. Estimates of average yield of Paddy, Rice and Ragi Crops
in Kharif season, 2016-17. 27
22. Progress under soil conservation, 2016-17. 28
23. Number of agricultural implements & machinery
in Animal husbandry farms, 2016-17. 29
24. District wise number of operational holdings according
to size class as per Agricultural Census 2010-11. 30
25. District wise area of operational holdings according
to size class as per Agricultural Census 2010-11. 31
-b-

Page
IV ANIMAL HUSBANDRY
26. Districtwise number of livestock (Crossbred Cattle)
as per 19th Livestock Census 2012. 32
27. Districtwise number of livestock (Indigenous Cattle)
as per 19th Livestock Census 2012. 33
28. District wise number of livestock (Buffaloes)
as per 19th Livestock Census 2012. 34
29. District wise total number of livestock and poultry
as per 19th Livestock Census 2012 35
30. General information relating to Animal husbandry and
Veterinary services, 2016-17 36-37
-c-
Page
V. FISHERIES
31. Month wise Quantity & Value of fish catch- 2016. 38
32. Variety wise quantity & value of marine fish catch, 2016 39
33. Disposal of marine fish catch during 2016. 40
34. Quantity and value of frozen shrimps and other fish
exported from Goa, 2016 (Provisional) 41
35. Number of fishing Crafts registered during 2016. 42
36. Number of fishing Gears registered during 2016. 43
VI. FORESTS
37. Total area under forest & additional area brought under
forest plantation in 2016-17. 44
38. Quantity & value of forest produce during 2016-17. 45
VII. INDUSTRIES
39. General information on industries sector for the years,
2012-13 & 2013-14 46-47
40. Index of industrial production, 2013-14. 48-50
VIII. MINERALS
41. Quantity of mineral production, 2016-17 51
-d-

IX. ELECTRICITY Page
42. Energy purchased and sold, 2010-11 to 2016-17 52
43. Allocation of power from Central Sector Power
Generating Station 2015-16 53-54
44. Allocation of power from Central Sector Power
Generating Station 2016-17 55-56
45. Generation of Power within the State, 2015-16
and 2016-17 57
46. Electricity consumed during 2015-16 and 2016-17 58-59
X. WATER SUPPLY
47. Zone wise daily consumption of water, 2016-17. 60-61
XI. BANKING AND INSURANCE
48. Number of Banking Offices, 2009-10 to 2016-17. 62
49. Annual Growth Rate of Deposits and credit from March 2009
to March 2017 63
50. Loan sanctioned & disbursed by EDC since inception from
1975-76 to 2016-17. 64-65
51. Loan sanctioned and disbursed by NABARD during the year
2016-17 for investment credit (Refinance) 66
52A. Loan sanctioned & disbursed by NABARD during the year
2016-17 for Rural Infrastructure Development 67
52B. Other Assistance/Loan Sanctioned during the year 2016-17 68
53. Insurance Business, 2016-17 69
-e-
XII. CO-OPERATION Page
54. Number of Co-operative Societies, their membership
and financial position, 2016-17 (Provisional) 70
55. Functioning of consumer stores in North Goa, 2016-17. 71
56. Functioning of consumer stores in South Goa, 2016-17. 72
57. Functioning of consumer stores in Goa State, 2016-17. 73
58A. Type of co-operative Banks/Societies with membership,
share capital, deposits, loans and working capital,
North Goa, 2016-17. 74-78
58B. Type of cooperative Banks/Societies with membership,
share capital, deposits, loans and working capital,
South Goa, 2016-17. 79-83
59. Functioning of primary agricultural credit societies,
North Goa, 2016-17. 84-85
60. Functioning of primary agricultural credit societies,
South Goa , 2016-17. 86-87
XIII. PRICES
61. Consumer price index numbers for the middle class
non-manual employees in Goa, 2016. 88-89
62. Consumer price index numbers for industrial workers
(Labour class) in Goa, 2016. 90-91
63. Average retail prices of some important commodities
consumed by the middle class people in Goa, 2016 92-93
64. Average wholesale prices of some important commodities
in Panaji, Margao and Mapusa towns, 2016. 94
-f-

Page
XIV. TRANSPORT AND COMMUNICATION
65. Length of roads by type of surface, 2013-14 95
66. Talukawise length of roads under Village Panchayats
2013-14. 96-97
67. Number of motor vehicles registered during ,2016-17. 98
68. Number of motor vehicles on Live Register, 2016-17 99
69. Number of motor vehicles in operation, 2016-17. 100
70. Distance from Panaji town to other towns by road , 2016-17 101
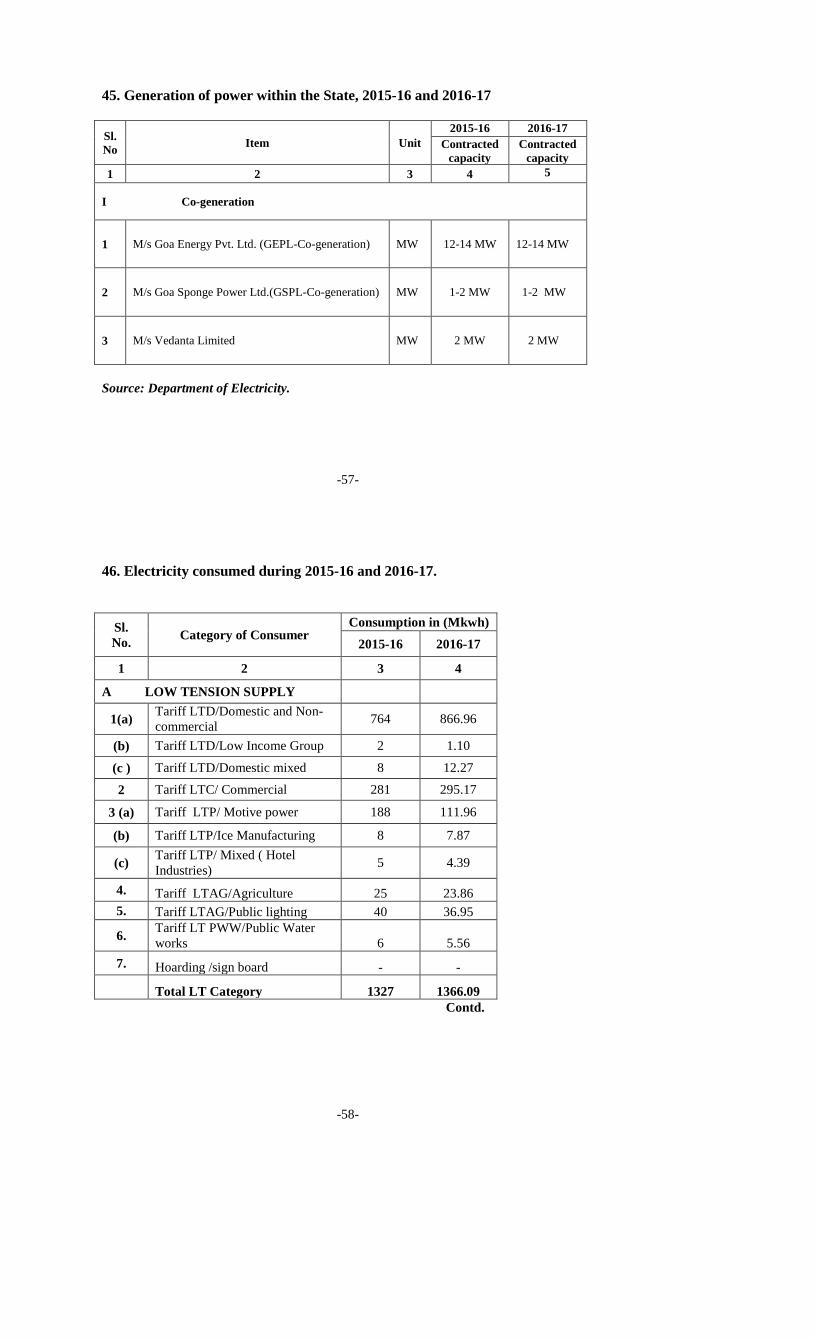
71. Details of Navigability of Inland waterways of Goa rivers
for the year 2016-17. 102-104
72 Table showing the number of ferry boats operating on
various routes of Goa, 2016-17 105-106
73. Road traffic accidents during the year, 2016-17. 107
74. Number of Post offices, Telephone exchanges, Telophone
Sets and Public call offices, for the year 2016-17. 108
XV. POLICE, CRIMES AND PRISONS
75. Number of police stations with staff strength,
and crimes reported during 2016-17. 109
76. Number of prisons and prisoners in jails, 2016-17. 110
-g-
XVI. TOURISM Page
77. Talukawise number of boarding and lodging houses
and total bed capacity, 2016-17. 111
78. Talukawise number of foreign & domestic tourists arrival
during 2016-17. 112
XVII. FOREIGN TRADE
79. Commodity -wise (G.R.T.) distribution of ships handled at
Mormugao Port, 2016-17 113
80A. Commodity wise foreign/coastal distribution of the
traffic handled by Indian & Foreign ships
at Mormugao Port (Exports), 2016-17. 114-115
80B. Commodity wise foreign/coastal distribution of the
traffic handled by Indian & Foreign ships
at Mormugao Port (Imports) , 2016-17. 116-119
81 Commodity -wise quantity exported/imported through
Mormugao port , 2016-17 120
82A. Trade (Imports) through Mormugao Port by principal
countries, 2016-17 121-122
82B. Trade (Exports) through Mormugao Port by principal
countries , 2016-17 123
83A. Commodity -wise & month -wise export trade through
Mormugao Port, 2016-17. 124-126
83B. Commodity wise & month wise import trade through
Mormugao Port, 2016-17. 127-129
-h-

XVIII. PUBLIC FINANCE Page
84. Budget at a glance, 2016-17. 130-131
85. Details of receipts under revenue account,
2016-17. 132-135
86. Details of expenditure under revenue account,
2016-17. 136-141
87. Details of receipts under capital account, 2016-17 142
88. Details of expenditure under capital account, 2016-17 143-146
XIX. FIVE YEAR PLANS
89A. Expenditure by Major Heads of development during
the Annual Plan, 2016-17. 147
89B. Expenditure by Major Heads /Sub-Heads of development
during the Annual Plan, 2016-17. 148-156
XX. STATE INCOME
90A. Net State Domestic Product (NSDP) at market price by
Industry of origin at current prices for the base year 2011-12. 157-158
90B. Net State Domestic Product (NSDP) at market price by
Industry of origin at constant prices for the base year 2011-12 159-160
-i-
XXI. LOCAL BODIES Page
91. Income and expenditure of the village Panchayats,
2016-17. 161
91A. Talukawise Income and expenditure of the village
Panchayats, 2016-17. 162-164
91B. Important Achievements of the Village Panchayats,
2016-17 165
91C. Talukawise Important Achievements of the Village
Panchayats, 2016-17. 166-168
92. Receipts and Expenditure of Municipal
Corporation/Councils, 2016-17 169
93. Distribution of income of Municipal Corporation/
Councils, 2016-17. 170-174
93 (A). Distribution of expenditure of Municipal Corporation /
Councils, 2016-17. 175-179
-j-

XXII. TAXES Page
94. Customs revenue collected, for the years 2014-15, 2015-16
& 2016-17 (Updated & Revised Figures) 180-181
95. Commodity wise central excise revenue collected, 2014-15
to 2016-17 182
96. Talukawise number of registered VAT/Central sales tax dealers at
the end of the year 2016-17. 183
97A. Talukawise VAT/Sales tax collected, 2016-17. 184
97B. Talukawise Entertainment tax, Luxury tax and Entry tax
collected, 2016-17. 185
98. Income tax, Corporate tax and other taxes
collected, 2016-17. 186
XXIII. EXCISE
99A. Talukawise number of shops licensed to sell liquor,
2016-17 (Retail). 187
99B. Talukawise number of shops licensed to sell liquor,
2016-17 (Wholesale). 188
100. Talukawise number of licenses issued for stills, 2016-17,
(Manufacture of liquor) 189
101. Production, import and export of liquor, 2016-17. 190
102. Excise revenue receipts collected, 2016-17. 191
XXIV LABOUR AND EMPLOYMENT
103. Working of Employment Exchanges, 2016-17. 192
104. Number of applicants (matriculates & above) registered
on the live register of the employment exchange by
level of education during 2016. 193-194
105. Number of applicants (matriculates & above) who got
placement from the live register of the employment
exchange by level of education during 2016. 195-196
-k-
Page
106. Number of job seekers (matriculates & above) on the
live register of the employment exchange as on Dec.
2016 by level of education. 197
107. Loss of mandays due to strikes and lockouts, 2006 to 2016 198
108. Trade unions, 2012 to 2016 199
109. General information pertaining to the employees of the
State Government Departments, Grants-in-Aid Institutions
and State Public Sector Undertakings in Goa as on
1st Jan, 2015. 200-201
XXV. EDUCATION
110. Number of schools, colleges and enrollment during
the academic year 2016-17. 202-203
111. Sexwise out- turn of matriculates, 2006-07 to 2016-17. 204
112. Out -turn of graduates and post-graduates during the year,
2016-17. 205
112 (A). Number of students graduated in Professional courses
in the year 2017 206
113. Number of sports coaching camps organized and
Participants attended, 2016-17. 207-208
114. Pre-National, Summer & Diet Coaching camps organized
for Boys & Girls for the year 2016-17 209-210
115. Month wise birth registered for the year 2016. 211
116. Talukawise birth registered for the year 2016. 212
-l-
XXVI. PUBLIC HEALTH & VITAL STATISTICS Page
117. Number of medical institutions & their activities,
2016-17. 213-220
118. Month-wise progress of Family Welfare Programme,.
2016-17. 221
119. Talukawise need and achievements under Family
Welfare Programme, 2016-17. 222-223
120. Progress of revised National Tuberculosis Control
Programme 2016-17. 224
121. Month-wise B.C.G. Vaccinations during 2016-17. 225
122. General information about the Institute of Psychiatry
and Human Behaviour, 2016-17. 226
123. Sex-wise number of drug addicts treated in the
Institute of Psychiatry & Human Behaviour,
2005-06 to 2016-17. 227
124. Number of Births, Deaths, & Marriages registered,
2013 to 2016. 228
XXVII. GENERAL ELECTIONS
125. Result of last Elections held in Goa for State Legislative
Asssembly on 04/02/2017. 229-238
125 (A). District-wise Results declared on 11/03/2017 of the winning
candidates for the General Assembly Elections held on
04/02/2017 (North Goa) 239-240
126. Results of Bye- Elections for the State Legislative Assemblies
for Panaji and Valpoi Constituencies held on 23/08/2017 241
127. Result of last Elections held in Goa for Lok Sabha
on 16/04/2014. 242
-m-
XXVIII. JOINT STOCK COMPANIES
128. Number of Joint Stock Companies (Limited by
shares) at work, 2006-07 to 2016-17. 243
129. Joint Stock Companies (limited by shares)
registered during, 2016-17. 244-245
XXIX. MISCELLANEOUS
130. Progress of Small Savings collection, 2016-17. 246
131. Quantity of food grains and sugar received
from the Government of India (Central Stock)
distributed under TPDS for the year 2016-17. 247
132. Achievements under various women & child
development programmes 2016-17. 248
133. Achievements under various social welfare
Programmes 2016-17. 249-251
134. Achievements under various tribal welfare
Programmes 2016-17 252
135. Targets & Achievements under the Twenty Point
programme (TPP)-2006 during 2016-17. 253-254
136. Activities of the Office of the Controller of
Legal Metrology for the year 2016-17. 255
137. Number of passports issued, 2006-2007 to 2016-17. 256
138. General information of Kadamba Transport
Corporation Ltd., 2016-17. 257-258
139. Taluka wise Distribution of Rural Enterprises &
No. of Persons employed as per Economic Census 2012 259-260
140. Taluka wise Distribution of Urban Enterprises &
No. of Persons employed as per Economic Census 2012 261-262
-n-

I. CLIMATE
1. Rainfall at selected station of Goa state in year 2016.
Sl.
No
Centre
Total
rainfall
during
the
year
(in mm)
No. of
rainy
days
(2.5 mm
or more
in a day)
Heaviest rainfall in a day
and the date
Rainfall in
(mm) Date
1 2 3 4 5 6
2016
1. Panaji 2990.4 96 155.8 22.06.2016
2. Mapusa 2941.4 109 137.0 29.06.2016
3. Pernem 3554.8 113 140.4 29.06.2016
4. Valpoi 3086.3 113 156.4 29.06.2016
5. Ponda 2832.5 103 136.8 29.06.2016
6. Sanguem 3085.6 105 179.6 29.06.2016
7. Canacona 2827.6 100 135.8 29.06.2016
8. Quepem 2746.9 98 155.0 14.06.2016
9. Margao 3029.6 92 140.6 18.07.2016
10. Mormugao 3319.6 98 145.8 22.06.2016
11. Ela (Old Goa) 2828.9 101 185.0 22.06.2016
12. Sankhali 3525.3 105 160.0 16.06.2016
13. Dabolim 3014.4 94 137.8 29.06.2016
Source : Meteorological Centre, Altinho, Panaji.
-1-
2. Maximum and minimum temperatures for
Panaji and Mormugao towns, 2016.
(Temperature in Deg. Centigrade)
Sl.
No
Year
Mean
Highest
Lowest
Maxi-
mum Mini-
mum
Tem-
perat-
ure
Date
Tem-
pera-
ture
Date
1. Panaji
1. 2016 32.1 24.3 36.5 02.01.2016 18.5 21.01.2016
05.02.2016
2. Mormugao
2. 2016 31.9 24.3 36.4 02.06.2016 20.0 10.11.2016
Source : Meteorological Centre, Altinho, Panaji.
-2-

II AREA AND POPULATION.
3. Important population characteristics, 2011
Sl.No
Particulars
District
Goa State North
Goa
South
Goa
1. Decadal Growth Rate of Population % +7.84 +8.73 +8.23
2. Sex-Ratio
963 986 973
3. Population Density per sq. km.
466 329 394
4. Population (Males)
416677 322463 739140
5. Population (Females)
401331 318074 719405
6. Total Population
818008 640537 1458545
7. 0-6 Population (Males)
40081 34379 74460
8. 0-6 Population (Females)
37624 32527 70151
9. 0-6 Total Population
77705 66906 144611
10. Literate Population (Males)
351738 264085 615823
11. Literate Population (Females)
311322 238342 549664
12. Total Literate Population
663060 502427 1165487
Source: Directorate of Census Operations, Goa
-3-
3A. Talukawise distribution of Geographical area, 2011.
Sl.
No.
India / State/
District/
Taluka
Area in
sq. Km.
Percentage to
total Geographical
area
1 2 3 4
1. India 3287469 100.00
2. Goa 3,702.00 100.00
(i)
North – Goa 1755.91 47.43
Tiswadi 213.55 5.77
Bardez 263.98 7.13
Pernem 251.68 6.80
Bicholim 238.79 6.45
Sattari 495.13 13.37
Ponda 292.78 7.91
(ii)
South – Goa 1946.09 52.57
Sanguem 873.75 23.60
Dharbandora
Canacona 352.04 9.50
Quepem 318.24 8.60
Salcete 292.94 7.91
Mormugao 109.12 2.96
Source: Directorate of Census Operations, Goa
-4-

4. Talukawise distribution of population & density, 2011
Sl.
No.
India / State/
District/
Taluka
Population
Percentage
to total
Population
Density
per Sq. Km.
1 2 3 4 5
1.
India
1,21,05,69,573 100.00 382*
2. Goa 14,58,545 100.00 394
(i).
North – Goa 8,18,008 56.08 466
Tiswadi 1,77,219 12.15 830
Bardez 2,37,440 16.28 899
Pernem 75,747 5.19 301
Bicholim 97,955 6.72 410
Sattari 63,817 4.37 129
Ponda 1,65,830 11.37 566
(ii)
South – Goa 6,40,537 43.92 329
Sanguem 65,147 4.46 75
Canacona 45,172 3.10 128
Quepem 81,193 5.57 255
Salcete 2,94,464 20.19 1005
Mormugao 1,54,561 10.60 1406
*Pakistan occupied Kashmir and area occupied by china is not considered
while calculating the Population density of India.
Source: Directorate of Census Operations, Goa
-5-
5. Talukawise Number of towns and census villages, 2011.
Sl.
No
State/District
/Taluka
Number of Towns Number of Villages
Municipal
Census
towns
Inhabi-
ted
Uninh-
abited
Sub-
merged
1 2 3 4 5 6 7
1. Goa 14 56 320 9 5
(i) North – Goa 7 40 188 2 4
Tiswadi 1* 9 22 - -
Bardez 1 15 28 - -
Pernem 1 4 23 - -
Bicholim 2 2 22 - -
Sattari 1 1 71 2 4
Ponda 1 9 22 - -
(ii) South – Goa 7 16 132 7 1
Sanguem 1 1 45 5 1
Canacona 1 -- 7 1 -
Quepem 2 1 35 - -
Salcete 2 11 35 - -
Mormugao 1 3 10 1 -
*Corporation of city of Panaji,
Source: Directorate of Census Operations, Goa
-6-

6. Decennial Growth of population, Goa.
Sl.
No Year Males Females Persons
Decennial
growth
(%)
1 2 3 4 5 6
1. 1900 2,27,393 2,48,120 4,75,513 -
2. 1910 2,30,923 2,55,829 4,86,752 +2.36
3. 1921 2,21,429 2,48,065 4,69,494 -3.55
4. 1931 2,41,936 2,63,345 5,05,281 +7.62
5. 1940 2,59,591 2,81,334 5,40,925 +7.05
6. 1950 2,57,267 2,90,181 5,47,448 +1.21
7. 1960 2,85,625 3,04,372 5,89,997 +7.77
8. 1971 4,01,362 3,93,758 7,95,120 +34.77
9. 1981 5,10,152 4,97,597 10,07,749 +26.74
10. 1991 5,94,790 5,75,003 11,69,793 +16.08
11. 2001 6,87,248 6,60,420 13,47,668 +15.21
12. 2011 7,39,140 7,19,405 14,58,545 +8.23
Source: Directorate of Census Operations, Goa.
-7-
7. Talukawise distribution of population according to Rural and
Urban, 2011.
Sl.
No
India / State/
District/
Taluka
Rural
Population
Urban
Population
% of
Rural
population
to total
population
% of
Urban
population
to total
population
1 2 3 4 5 6
1. India 83,34,63,448 37,71,06,125 68.85 31.15
2. Goa 5,51,731 9,06,814 37.83 62.17
(i)
North Goa 3,24,927 4,93,081 39.72 60.28
Tiswadi 37,549 1,39,670 21.19 78.81
Bardez 74,321 1,63,119 31.30 68.70
Pernem 45,681 30,066 60.31 39.69
Bicholim 55,775 42,180 56.94 43.06
Sattari 49,422 14,395 77.44 22.56
Ponda 62,179 1,03,651 37.50 62.50
(ii)
South Goa 2,26,804 4,13,733 35.41 64.59
Sanguem 53,600 11,547 82.28 17.72
Canacona 32,738 12,434 72.47 27.53
Quepem 36,234 44,959 44.63 55.37
Salcete 82,000 2,12,464 27.85 72.15
Mormugao 22,232 1,32,329 14.38 85.62
Source: Directorate of Census Operations, Goa
-8-

8. Talukawise population by sex, 2011.
Sl
No
India /
State/
District/
Taluka
Persons Males Females
Sex
ratio
(females
per ‘000
males)
Child
Sex
ratio
1 2 3 4 5 6 7
1. India 1,21,05,69,573 62,31,21,843 58,74,47,730 943 919
2. Goa 14,58,545 7,39,140 7,19,405 973 942
(i)
North Goa 8,18,008 4,16,677 4,01,331 963 939
Tiswadi 1,77,219 90,136 87,083 966 947
Bardez 2,37,440 1,19,892 1,17,548 980 940
Pernem 75,747 38,652 37,095 960 911
Bicholim 97,955 49,931 48,024 962 953
Sattari 63,817 32,574 31,243 959 901
Ponda 1,65,830 85,492 80,338 940 948
(ii)
South Goa 6,40,537 3,22,463 3,18,074 986 946
Sanguem 65,147 32,623 32,524 997 985
Canacona 45,172 22,532 22,640 1005 943
Quepem 81,193 40,722 40,471 994 964
Salcete 2,94,464 1,45,448 1,49,016 1025 950
Mormugao 1,54,561 81,138 73,423 905 915
Source: Directorate of Census Operations, Goa
-9-
9. Distribution of population by literacy in Rural and
Urban Areas, 2011.
Sl.
No.
Classifi-
cation Total Rural Urban
1 2 3 4 5
1.
Total Population
Persons 14,58,545 5,51,731 9,06,814
Males 7,39,140 2,75,436 4,63,704
Females 7,19,405 2,76,295 4,43,110
2.
Population ( age group 7 years and above)
Persons 13,13,934 4,97,717 8,16,217
Males 6,64,680 2,47,664 4,17,016
Females 6,49,254 2,50,053 3,99,201
3.
Literates
Persons 11,65,487 4,31,271 7,34,216
Males 6,15,823 2,27,143 3,88,680
Females 5,49,664 2,04,128 3,45,536
4.
Percentage Literacy
Persons 88.70 86.65 89.95
Males 92.65 91.71 93.21
Females 84.66 81.63 86.56
Source: Directorate of Census Operations, Goa.
-10-

10 A. Talukawise literacy by sex, 2011.
Sl.
No.
India / State/
District/Taluka
Literate Population
Persons Males Females
1 2 3 4 5
1. India 76,34,98,517 43,46,83,779 32,88,14,738
2. Goa 11,65,487 6,15,823 5,49,664
(i)
North Goa 6,63,060 3,51,738 3,11,322
Tiswadi 1,45,014 76,157 68,857
Bardez 1,96,015 1,01,804 94,211
Pernem 60,615 32,552 28,063
Bicholim 78,628 42,056 36,572
Sattari 48,929 26,763 22,166
Ponda 1,33,859 72,406 61,453
(ii)
South Goa 5,02,427 2,64,085 2,38,342
Sanguem 48,468 26,048 22,420
Canacona 34,325 18,137 16,188
Quepem 60,364 31,888 28,476
Salcete 2,36,082 1,20,381 1,15,701
Mormugao 1,23,188 67,631 55,557
.
Source: Directorate of Census Operations, Goa
-11-
10B. Talukawise percentage of literacy by sex, 2011
Sl.
No.
India / State/
District/Taluka
Percentage of Literacy (7 years and above)
Persons Males Females
1 2 3 4 5
1. India 72.98 80.88 64.63
2. Goa 88.70 92.65 84.66
(i)
North Goa 89.57 93.40 85.60
Tiswadi 90.37 93.41 87.24
Bardez 90.98 93.78 88.14
Pernem 88.05 92.90 83.02
Bicholim 89.24 93.69 84.62
Sattari 85.24 91.65 78.59
Ponda 89.21 93.56 84.58
(ii)
South Goa 87.59 91.67 83.47
Sanguem 83.43 89.60 77.24
Canacona 84.68 90.02 79.39
Quepem 82.93 87.50 78.35
Salcete 89.34 92.63 86.15
Mormugao 89.30 93.33 84.84
Source: Directorate of Census Operations, Goa
-12-

11. Talukawise distribution of economically active Main
workers, Marginal workers and Non-workers, 2011.
Sl.
No
India / State/
District/
Taluka
Main
Workers
Marginal
Workers Non Workers
1 2 3 4 5
1. India 36,24,46,420 11,92,96,891 72,88,26,262
2. Goa 4,76,053 1,01,195 8,81,297
(i)
North – Goa 2,69,437 58,221 4,90,350
Tiswadi 65,660 7,826 1,03,733
Bardez 80,338 14,324 1,42,778
Pernem 19,251 9,187 47,309
Bicholim 29,766 7,837 60,352
Sattari 16,498 7,854 39,465
Ponda 57,924 11,193 96,713
(ii)
South – Goa 2,06,616 42,974 3,90,947
Sanguem 20,335 6,946 37,866
Canacona 13,613 5,435 26,124
Quepem 24,821 8,069 48,303
Salcete 93,887 14,322 1,86,255
Mormugao 53,960 8,202 92,399
Source: Directorate of Census Operations, Goa
-13-
12. Talukawise distribution of Working population
(Total Workers) by Industrial category, 2011.
Sl.
No
India / State/
Distt/Taluka
Total
Workers
Industrial Category
Cultivators Agri . Labourers
1 2 3 4 5
1. India 48,17,43,311 11,86,92,640 14,43,29,833
2. Goa 5,77,248 31,354 26,760
(i)
North Goa 3,27,658 15,402 14,120
Tiswadi 73,486 2,091 1,072
Bardez 94,662 3,054 1,821
Pernem 28,438 2,655 1,876
Bicholim 37,603 2,272 1,864
Sattari 24,352 2,564 4,654
Ponda 69,117 2,766 2,833
(ii)
South Goa 2,49,590 15,952 12,640
Sanguem 27,281 2,658 3,530
Canacona 19,048 5,009 1,920
Quepem 32,890 3,684 4,289
Salcete 1,08,209 3,269 2,169
Mormugao 62,162 1,332 732
Contd.
Source: Directorate of Census Operations, Goa
-14-

12. Talukawise Distribution of Working population
(Total Workers) by Industrial category, 2011 (Concld.)
Sl.
No
India / State/
District/Taluka
Total
Workers
Industrial Category
Household
Industry Other Workers
1 2 3 6 7
1. India 48,17,43,311 1,83,36,307 20,03,84,531
2. Goa 5,77,248 14,708 5,04,426
(i) North Goa 3,27,658 8,862 2,89,274
Tiswadi 73,486 1,680 68,643
Bardez 94,662 3,199 86,588
Pernem 28,438 918 22,989
Bicholim 37,603 993 32,474
Sattari 24,352 529 16,605
Ponda 69,117 1,543 61,975
(ii)
South Goa 2,49,590 5,846 2,15,152
Sanguem 27,281 568 20,525
Canacona 19,048 767 11,352
Quepem 32,890 708 24,209
Salcete 1,08,209 2,926 99,845
Mormugao 62,162 877 59,221
Source: Directorate of Census Operations, Goa.
-15-
13. Talukawise distribution of population of Scheduled castes
& Scheduled tribes, 2011.
Sl.
No
India / State/
District/
Taluka
S. C.
Popula-
tion
S.T.
Popula-
tion
% of
S.C.
to
total
Popul
ation
% of S.T.
to total
Population
1 2 3 4 5 6
1. India 20,13,78,086 10,42,81,034 16.63 8.61
2. Goa 25,449 1,49,275 1.74 10.23
(i)
North- Goa 17,606 56,606 2.15 6.92
Tiswadi 3,209 18,785 1.81 10.60
Bardez 5,933 1,654 2.50 0.70
Pernem 3,070 46 4.05 0.06
Bicholim 2,264 4,492 2.31 4.59
Sattari 1,205 4,030 1.89 6.31
Ponda 1,925 27,599 1.16 16.64
(ii)
South-Goa 7,843 92,669 1.22 14.47
Sanguem 730 14,290 1.12 21.94
Canacona 173 13,657 0.38 30.23
Quepem 931 25,290 1.15 31.15
Salcete 3,443 32,562 1.17 11.06
Mormugao 2,566 6,870 1.66 4.44
Source: Directorate of Census Operations, Goa
-16-

14. Distribution of population by major religious communities, 2011.
Sl.
No
Religious
Communities
Population as per 2011 Census % to total
population Males Females Total
1 2 3 4 5 6
1. Hindus 499587 464290 963877 66.08
2. Muslims 63814 57750 121564 8.33
3. Christians 171964 194166 366130 25.10
4. Sikhs 863 610 1473 0.10
5. Buddhists 574 521 1095 0.08
6. Jains 580 529 1109 0.08
7. Other religions
& Persuations 143 115 258 0.02
8.
Religion not
stated 1615 1424 3039 0.21
Total
739140 719405 1458545 100.00
Source: Directorate of Census Operations, Goa
-17-
15. All India population by States/Union Territories, 2011.
Sl.
No. India/State/Union Territory Total Persons
India 1,21,05,69,573
States
1. Andhra Pradesh 8,45,80,777
2. Arunachal Pradesh 13,83,727
3. Assam 3,12,05,576
4. Bihar 10,40,99,452
5. Goa 14,58,545
6. Gujarat 6,04,39,692
7. Haryana 2,53,51,462
8. Himachal Pradesh 68,64,602
9. Karnataka 6,10,95,297
10. Kerala 3,34,06,061
11. Madhya Pradesh 7,26,26,809
12. Maharashtra 11,23,74,333
13. Manipur 25,70,390
14. Meghalaya 29,66,889
15. Mizoram 10,97,206
16. Nagaland 19,78,502
Contd.
-18-

15. All India population of States/Union Territories, 2011 (Concld.)
Sl.
No. India/State/Union Territory Total Persons
States
17. Orissa (Odisha) 4,19,74,218
18. Punjab 2,77,43,338
19. Rajasthan 6,85,48,437
20. Sikkim 6,10,577
21. Tamil Nadu 7,21,47,030
22. Tripura 36,73,917
23. Uttar Pradesh 19,98,12,341
24. (Uttaranchal) Uttarakhand 1,00,86,292
25. Jharkhand 3,29,88,134
26. Chattisgarh 2,55,45,198
27. Jammu & Kashmir 1,25,41,302
28. West Bengal 9,12,76,115
Union Territories
29. Andaman & Nicobar Islands 3,80,581
30. Chandigarh 10,55,450
31. Dadra & Nagar Haveli 3,43,709
32. Daman & Diu 2,43,247
33. Delhi 1,67,87,941
34. Lakshadweep 64,473
35. Pondicherry (Puducherry) 12,47,953
Source: Directorate of Census Operations, Goa
-19-
16. All India sexwise population by States/Union Territories 2011.
Sl.
No.
India/State/
UnionTerritory
Population
Males Females
India 62,31,21,843 58,74,47,730
States
1. Andhra Pradesh 4,24,42,146 4,21,38,631
2. Arunachal Pradesh 7,13,912 6,69,815
3. Assam 1,59,39,443 1,52,66,133
4. Bihar 5,42,78,157 4,98,21,295
5. Goa 7,39,140 7,19,405
6. Gujarat 3,14,91,260 2,89,48,432
7. Haryana 1,34,94,734 1,18,56,728
8. Himachal Pradesh 34,81,873 33,82,729
9. Karnataka 3,09,66,657 3,01,28,640
10. Kerala 1,60,27,412 1,73,78,649
11. Madhya Pradesh 3,76,12,306 3,50,14,503
12. Maharashtra 5,82,43,056 5,41,31,277
13. Manipur 12,90,171 12,80,219
14. Meghalaya 14,91,832 14,75,057
15. Mizoram 5,55,339 5,41,867
16. Nagaland 10,24,649 9,53,853
Contd.
-20-

16. All India sexwise population by States/Union Territories, 2011
(Concld.)
Sl.
No.
India/State/
UnionTerritory
Population
Males Females
States
17. Orissa(Odisha) 2,12,12,136 2,07,62,082
18. Punjab 1,46,39,465 1,31,03,873
19. Rajasthan 3,55,50,997 3,29,97,440
20. Sikkim 3,23,070 2,87,507
21. Tamil Nadu 3,61,37,975 3,60,09,055
22. Tripura 18,74,376 17,99,541
23. Uttar Pradesh 10,44,80,510 9,53,31,831
24. West Bengal 4,68,09,027 4,44,67,088
25. Uttaranchal(Uttarakhand) 51,37,773 49,48,519
26. Jharkhand 1,69,30,315 1,60,57,819
27. Chattisgarh 1,28,32,895 1,27,12,303
28. Jammu & Kashmir 66,40,662 59,00,640
Union Territories
29. Andaman & Nicobar 2,02,871 1,77,710
30. Chandigarh 5,80,663 4,74,787
31. Dadra & Nagar Haveli 1,93,760 1,49,949
32 Daman & Diu 1,50,301 92,946
33. Delhi 89,87,326 78,00,615
34. Lakshadweep 33,123 31,350
35. Pondicherry(Puducherry) 6,12,511 6,35,442
Source: Directorate of Census Operations, Goa
-21-
17. All India literacy by States/Union Territories 2011.
Sl.
No.
India/State/
UnionTerritory
Total Literates
(7 +)
Persons Literacy rate
(% )
India 76,34,98,517 73.0
States
1. Andhra Pradesh 5,05,56,760 67.0
2. Arunachal Pradesh 7,66,005 65.4
3. Assam 1,91,77,977 72.2
4. Bihar 5,25,04,553 61.8
5. Goa 11,65,487 88.7
6. Gujarat 4,10,93,358 78.0
7. Haryana 1,65,98,988 75.6
8. Himachal Pradesh 50,39,736 82.8
9. Karnataka 4,06,47,322 75.4
10. Kerala 2,81,35,824 94.0
11. Madhya Pradesh 4,28,51,169 69.3
12. Maharashtra 8,15,54,290 82.3
13. Manipur 17,68,181 79.2
14. Meghalaya 17,85,005 74.4
15. Mizoram 8,48,175 91.3
16. Nagaland 13,42,434 79.6
Contd.
-22-

17. All India literacy by States/Union Territories 2011 (Concld.)
Sl.
No. India/State/
UnionTerritory
Total Literates
(7 +)
Persons Literacy rate
(% )
States
17. Orissa (Odisha) 2,67,42,595 72.9
18. Punjab 1,87,07,137 75.8
19. Rajasthan 3,82,75,282 66.1
20. Sikkim 4,44,952 81.4
21. Tamil Nadu 5,18,37,507 80.1
22. Tripura 28,04,783 87.2
23. Uttar Pradesh 11,43,97,555 67.7
24. Uttaranchal(Uttarakhand) 68,80,953 78.8
25. Jharkhand 1,83,28,069 66.4
26. Chattisgarh 1,53,79,922 70.3
27. Jammu & Kashmir 70,67,233 67.2
28. West Bengal 6,15,38,281 76.3
Union Territories
29. Andaman & Nicobar 2,94,281 86.6
30. Chandigarh 8,05,438 86.0
31. Dadra & Nagar Haveli 2,23,230 76.2
32. Daman & Diu 1,88,406 87.1
33. Delhi 1,27,37,767 86.2
34. Lakshadweep 52,553 91.8
35. Pondicherry (Puducherry) 9,57,309 85.8
Source: Directorate of Census Operations, Goa.
-23-
III. AGRICULTURE
18. Land utilization pattern, 2016-17.
Sl.
No Item
Area in Hectares % age to total
reported area
2016-17
1 2 3 4
1.
Total reported area
according to village
papers for land utilization
361113 100.00
2. Area under forest 125473 34.75
3.
Land not available for
cultivation 37137 10.28
4. Other uncultivated land:
(i) Permanent pastures
& other grazing land
1305 0.36
(ii) Land under
miscellaneous tree
crops and groves not
included in net area sown
580 0.16
(iii) Cultivable waste
including fallow land
and current fallow
66480 18.41
5. Net area sown 130138 36.04
6. Area sown more than once 24583 -
7. Gross cropped area 154721 -
Source: Directorate of Agriculture, Tonca, Caranzalem, Goa
-24-

19. Estimates of total area under principal crops and
Irrigated area, 2016-17.
(In hectares)
Sl.
No
Crop
Total area
under the
crop
% to total
cropped
area
Irrigated
area
1 2 3 4 5
1. Rice
i) Kharif 27630 17.86 -
ii) Rabi 13193 8.53 13193
2. Ragi 0 0 0
3. Pulses 5887 3.81 5745
4. Groundnut 1689 1.09 1352
5. Arecanut 1809 1.17 1809
6. Coconut 25913 16.75 3282
7. Cashewnut 56735 36.67 -
8. Sugarcane 897 0.58 897
9. Mango & Banana 7355 4.75 2244
10. Vegetable 7379 4.77 4293
11. Pineapple 383 0.25 383
12. Other fruits 3934 2.54 1892
13. Oil Palm 836 0.54 836
14. Pepper 777 0.50 777
15. Tree Spices 205 0.13 205
16. Sweet Potato 52 0.03 52
17. Kokum 47 0.03 -
Total area sown under all
crops (1 to 17 ) 154721 100.00 36960
Source: Directorate of Agriculture, Tonca, Caranzalem, Goa
-25-
20. Production Estimates of Paddy, Rice & Ragi Crops in
Kharif season, 2016-17.
(In tonnes)
Sl.
No
State / District /
Taluka Paddy Rice Ragi
1 2 3 4 5
1. Goa 115665 77109 0
(i)
North – Goa 56147 37429 0
Tiswadi 15497 10332 -
Bardez 24279 16184 -
Pernem 11807 7870 -
Bicholim 2741 1827 -
Sattari 1823 1216 -
(ii) South – Goa 59518 39680 0
Sanguem 1701 1134 -
Ponda 4664 3110 -
Dharbandora 2267 1511 -
Canacona 10696 7130 -
Quepem 13791 9194 -
Salcete 24696 16465 -
Mormugao 1703 1136 -
Source: Directorate of Agriculture, Tonca, Caranzalem, Goa
-26-

21. Estimates of average yield of Paddy, Rice and Ragi Crops in
Kharif season, 2016-17.
(Kgs/hectare)
Sl.
No State / District/
Taluka Paddy Rice
Ragi
1 2 3 4 5
1. Goa 4186 2791 0
(i) North – Goa 4300 2867 0
Tiswadi 4025 2683 -
Bardez 4442 2961 -
Pernem 4325 2883 -
Bicholim 4493 2995 -
Sattari 4557 3040 -
(ii) South – Goa 4083 2722 0
Sanguem 3822 2548 -
Ponda 3986 2658 -
Dharbandora 4049 2699 -
Canacona 4211 2807 -
Quepem 3963 2642 -
Salcete 4129 2359 -
Mormugao 4258 2839 -
Source: Directorate of Agriculture, Tonca, Caranzalem, Goa
-27-
22. Progress under Soil Conservation, 2016-17.
Sl.
No. Description 2016-17
1 2 3
1. Area Protected by bunds (in ha)
a) New Construction -
b) Repairs 457.87 ha
2. Length (in kms)
a) New Construction -
b) Repairs 13.03 kms.
3. Expenditure (Rs. in lakh)
a) New Construction -
b) Repairs 1437.18
c) Subsidies 26.26
Source: Directorate of Agriculture, Tonca, Caranzalem, Goa
-28-

23. Number of agricultural implements & machinery,
in Animal Husbandry Farms, 2016-17.
Sl.
No Item Number
1 2 3
1. Hand operated implements
i. Sprayers and dusters 5 nos.
2 Plant protection equipments & engines etc.
i. i. Electric pumpsets 12 nos.
3. Power Tillers, Tractors & other implements
i. Power Tillers for agricultural purposes -
ii. Tractors used for agricultural purposes 4
iii. Mould board ploughs 2
iv. Disc Harrow 2
4. Levellers 2
5. Other power operated equipments
i.Threshers (paddy) -
ii. Chaff Cutters 2
iii. Sugarcane Crushers -
Source: Directorate of Animal Husbandry & Veterinary Services.
-29-
24. District wise number of operational holdings according to size
class as per Agricultural Census 2010-11
Sl.
No
Size Class
(hectares)
Number of operational holdings.
North Goa South Goa Goa
1 2 3 4 5
1. Below 0.5 25532 16882 42414
2. 0.5 - 1.0 10988 6498 17486
3. 1.0 - 2.0 4994 4823 9817
4. 2.0 - 3.0 2230 2167 4397
5. 3.0 - 4.0 671 639 1310
6. 4.0 - 5.0 421 481 902
7. 5.0 - 7.5 473 302 775
8. 7.5 - 10.0 208 125 333
9. 10.0 - 20.0 248 151 399
10. 20.0 & above 126 61 187
Total 45891 32129 78020
Source: Directorate of Planning, Statistics & Evaluation
-30-

25. District wise area of operational holdings according to size class
as per Agricultural Census 2010-11
Sl.
No
Size Class
(hectares)
Area Operated in Hactares
North Goa South Goa Goa
1 2 3 4 5
1. Below 0.5 8767.44 5339.36 14106.80
2. 0.5 - 1.0 8558.40 5437.68 13996.08
3. 1.0 - 2.0 8865.40 8725.92 17591.32
4. 2.0 - 3.0 6125.68 5964.28 12089.96
5. 3.0 - 4.0 2428.30 2252.05 4680.35
6. 4.0 - 5.0 1949.92 2257.42 4207.34
7. 5.0 - 7.5 3141.32 2099.09 5240.41
8. 7.5 - 10.0 1859.65 1070.06 2929.71
9. 10.0 - 20.0 3730.28 2407.22 6137.50
10. 20.0 & above 5948.33 2065.83 8014.16
Total 51374.72 37618.91 88993.63
Source: Directorate of Planning, Statistics & Evaluation
NOTE: Data presented above is as per the final input tables received from
the Ministry of Agriculture.
-31-
IV ANIMAL HUSBANDRY
26. District wise number of livestock (Crossbred Cattle) as per 19th
Livestock Census 2012
Sl.
No. Item North
Goa
South
Goa Goa
1 2 3 4 5
1. Crossbred Males
Upto 1.5 years 630 645 1275
Over 1.5 years
a) Used for Breeding Only 117 135 252
b) Used for Draught Only 65 166 231
c) Used for both Draught+
Breeding 35 31 66
d) Others 11 21 32
Total Crossbred Males 858 998 1856
2. Crossbred Females
Under 1 year 1587 1036 2623
1 to 2.5 years 1579 1232 2811
Over 2.5 years
a) In milk 3940 3587 7527
b) Dry 1332 853 2185
c) Not yet calved 245 224 469
d) Others 23 32 55
Total Crossbred
Females 8706 6964 15670
Total crossbred cattle 9564 7962 17526
Source: Directorate of Animal Husbandry and Veterinary services.
-32-

27. District wise number of livestock (Indigenous Cattle) as per 19th
Livestock Census 2012
Sl.
No. Item North
Goa
South
Goa Goa
1 2 3 4 5
1. Indigenous Males
Upto 2 years 1999 1722 3721
Over 2 years
a) Used for Breeding Only 819 985 1804
b) Used for Draught Only 2638 6703 9341
c) Used for both Draught +
Breeding 1106 576 1682
d) Others 283 73 356
Total Males 6845 10059 16904
2. Indigenous Females
Under 1 year 2765 1603 4368
1 to 3 years 2534 1773 4307
Over 3 years
a) In milk 4913 3475 8388
b) Dry 2732 2277 5009
c) Not yet calved 461 263 724
d) Others 208 46 254
Total Females 13613 9437 23050
Total Indigenous cattle 20458 19496 39954
Total Cattles (Crossbred
+ Indigenous) 30022 27458 57480
Source: Directorate of Animal Husbandry and Veterinary services.
-33-
28. District wise number of Livestock (Buffaloes) as per 19th Livestock
Census 2012
Sl.
No. Item North
Goa
South
Goa Goa
1 2 3 4 5
1. Buffaloes Males
Upto 2 years 1784 1192 2976
Over 2 years
a) Used for Breeding Only 629 484 1113
b) Used for Draught Only 834 786 1620
c) Used for both Draught +
Breeding 551 229 780
d) Others 169 46 215
Total Males 3967 2737 6704
2 Buffaloes Females
Under 1 year 2996 1575 4571
1 to 3 years 2572 1731 4303
Over 3 years
a) In milk 6612 4757 11369
b) Dry 2275 1550 3825
c) Not yet calved 465 433 898
d) Others 86 42 128
Total Females 15006 10088 25094
Total Buffaloes (M & F) 18973 12825 31798
Source: Directorate of Animal Husbandry and Veterinary services.
-34-

29. District wise total number of livestock and poultry as per 19th
Livestock Census 2012
Sl.
No. Item
North
Goa
South
Goa Goa
1 2 3 4 5
1. Cattles 30022 27458 57480
2. Buffaloes 18973 12825 31798
3. Pigs 8730 34837 43567
4. Goats 5871 7087 12958
5. Horses 4 21 25
6. Dogs 24759 27564 52323
7. Rabbits 121 114 235
8. Elephants 4 9 13
9. Poultry(Backyard) 59481 71917 131398
10. Poultry(Birds in farm) 127746 33052 160798
11. Stray Cattles 4301 2882 7183
12. Stray Dogs 10889 5436 16325
Total Livestock 290901 223202 514103
Source: Directorate of Animal Husbandry and Veterinary services.
-35-
30. General information relating to Animal Husbandry and
Veterinary Services, 2016-17.
Sl.
No Item Unit 2016-17
1 2 3 4
1. Veterinary hospitals Nos. 5
2. Veterinary Dispensaries Nos. 23
3. Mobile Veterinary Clinic (Ambulance) Nos. 2
4. Government livestock farm Nos. 2
5. Government piggery farm Nos. 1
6. Government poultry farm Nos. 1
7. Fodder seed production farm Nos. 1
8. Farmers Training Centre Nos. 1
9. Disease Investigation Unit Nos. 1
10. Veterinary surgeons Nos. 43+ 1 on
contract
11. Extension officers Nos. 9
12. Stockmen/veterinary/poultry Assistants Nos. 90+ 1 on
contract
13. Amount of subsidy distributed Rs. in lakh 4107.30
a. Poultry Development Rs. in lakh 1.96
b. Piggery Development Rs. in lakh 0.00
c. Dairy Development Rs. in lakh 4099.90
d. Fodder & Feed Development Rs. in lakh 5.44
14. Key village scheme
a. Key village Centre Nos. 1
b. Sub- Centre Nos. 50
Contd.
-36-

30. General information relating to Animal Husbandry
and Veterinary Services 2016-17 (Concld.)
Sl.
No Item Unit
2016-17
1 2 3 4
15. Artificial Insemination performed
(Total)
No of A.I.
performed
17014
a. Crossbred Cows (CBC) 15069
b. Non-Descript Cows (ND) 656
c. Indigenous Cows 170
d. Buffaloes 1119
16. (ii) Calves Born (Total)
No. of Calves Born
5452
a. Crossbred Cows (CBC) 4730
b. Non-Descript Cows (ND) 255
c. Indigenous Cows 63
d. Buffaloes 404
17. (iii) Castration Performed Nos. 3
18. Vaccination performed Nos. 2,13,361
a. Cattle & Others Nos. 1,89,352
b. Poultry vaccination Nos. 14,015
c. Anti-Rabies - Dogs vaccination Nos. 8,464
d. Anti-Rabies – Other Animals (Post-Bite) Nos. 1,530
19. Cases Treated Nos. 3,04,019
a. Large animals Nos. 1,91,294
b. Small animals Nos. 38,399
c. Poultry Nos. 69,442
d. Others Nos. 4,884
20. No. of Dairy Co-operative Societies Nos. Goa Dairy=178
SUMUL = 35
Total = 213
21. No. of Modern Abettoir Nos. 1
22. No.of Dairy Plants Nos. 3
23. Egg and Poultry Meat Marketing Centres Nos. 1
Source: Directorate of Animal Husbandry and Veterinary Services.
-37-
V. FISHERIES
31. Month-wise quantity & value of fish catch, 2016.
Sl.
No. Month
Marine Inland
Quantity
of fish
catch (In
Tonnes)
Value
(Rs. In
Lakh)
Quantity
of fish
catch (In
Tonnes)
Value
(Rs. In
Lakh)
1 2 3 4 5 6
1. January 8174 12383 399 642
2. February 6651 9861 294 550
3. March 4538 7596 354 584
4. April 4339 7283 261 502
5. May 5244 7994 326 599
6. June 76 152 333 673
7. July 1096 2908 357 717
8. August 7429 14192 363 719
9. September 7606 12880 347 708
10. October 15479 20361 369 687
11. November 19785 22984 485 902
12. December 20636 18946 515 897
Total 101053 137540 4403 8180
Source: Directorate of Fisheries, Panaji- Goa.
-38-

32. Variety wise quantity & value of marine
fish catch, 2016.
Sl.
No Variety of Fish
2016
Quantity
(In tonnes)
Value
(Rs. In Lakh)
1 2 3 4
1. Mackerel 19512 27706
2. Sardines 33326 22466
3. Cat fish 738 846
4. Shark fish 585 885
5. Seer fish 2802 11782
6. Prawns 6295 20150
7. Pomfrets 902 3767
8. Cuttle fish 2021 3788
9. Others 34872 46150
TOTAL 101053 137540
Source: Directorate of Fisheries, Panaji-Goa.
-39-
33. Disposal of marine fish catch during 2016.
Sl.
No Method of Disposal
Quantity in tonnes
1 2 3
1.
Marketed fish
90948
2.
Sundried
5053
3.
Salted
3031
4.
Miscellaneous including
Manure
2021
Total 101053
Source: Directorate of Fisheries, Panaji-Goa.
-40-

34. Quantity and value of frozen shrimps and other fish
exported from Goa, 2016 (Provisional)
Sl.
No Item 2016
1 2 3
1. Export of frozen shrimps
i) Quantity ( In metric tonnes ) 1840
ii) Value ( Rs. in lakh ) 8232
2. Bulk of frozen fish
i) Quantity ( In metric tonnes ) 36369
ii) Value ( Rs. in lakh) 51422
3. Total
i) Quantity ( In metric tonnes ) 38209
ii) Value ( Rs. in lakh) 59654
Source: The Marine Products Export Development Authority, Mala,
Panaji-Goa.
-41-
35 . Number of fishing Crafts registered during 2016
Sl.
No. Item Number
1 2 3
1a. Fishing Crafts (Mechanised Boats)
i. Gill netters(OBM) 52
ii. Trawlers/Purseiners 16
iii. Liners -
iv. Others -
Total (1a) 68
1b. Fishing Crafts (Non-Mechanised Boats) 73
Total (1a) + (1b) 141
Source: Directorate of Fisheries, Panaji-Goa.
-42-

36 . Number of fishing gears registered during 2016
Sl.
No. Item Number
1 2 3
1. Fishing Gears
i. Sea Gill nets 92
ii. River Gill nets 14
iii. Singuel nets 2
iv. Trawl nets 6
v. Purse-seine nets 7
vi. Barriers net 2
vii. Drag net -
viii. Sluice gate net -
ix. Stake net -
x. Hook and line -
Total 123
Source: Directorate of Fisheries, Panaji-Goa.
-43-
VI FORESTS
37. Total area under forest & additional area brought under
Forest plantation in 2016-17.
Source: Department of Forests.
* Area estimated earlier by Sawant Committee and Karapurkar Committee,
was approximately 67 Sq. Km. After ground verification and truthing the
total area found was actually 42.42 Sq. Km., however the matter is
subjudice.
-44-
Sl.
No Item Unit Total
1 2 3 4
1. Area under forest Sq. Kms. 1225
a) State owned " 1225
b) Private (Est.) " 42.42*
2. Area brought under plantation
during the year
(i) New plantation Ha.
(a) Casuarinas/Acacia " 0.5
(b) Mangroves " -
(c) Mixed " 61
(d) Canes “ 4.5
(e) Medicinal plants " -
(f) Bamboos " 1
(g) Jatropa " -
(h) Garcania " -
(i) Others “ -
Block plantation Ha. -
Avenue plantation R/Kms. 9
(ii) Enrichment Ha
(a) Mixed sapling " 23
(b) Cashew " -
(c) Rubber " -
d) Bamboo " -
3. Number of labour units engaged Mandays 8227.5
4. Amount spent in plantation work Rs. In lakh 27.12

38. Quantity and value of forest produce during 2016-17.
Sl.
No Item
Quantity (in numbers) Value realized
(Rs. in lakh) North
Goa
South
Goa Total
1 2 3 4 5 6
1. Canes (Nos. ) - - - -
2. Bamboos (Nos.)
a. Govt. - - - -
b. Pvt. 22000 22000 6.60
3. Timber ( Cu. Mt.)
a. Govt. 453.816 35.433 489.249 32.13
b. Pvt. 9066.841 1089.12 10155.961 504.527
4 Firewood (Cu. Mt.)
a. Govt. 1188.669 33.95 1222.619 5.29
b. Pvt. 16139.54 648.68 16788.219 64.55
5 Poles (Nos.)
a. Govt. 279 10 289 0.17
b. Pvt. 177 12 189 0.15
.
Source: Department of Forests.
-45-
VII INDUSTRIES
39. General Information on Industries Sector for the years,
2012-13 & 2013-14
Sl.
No Item Unit 2012-13 2013-14
1 2 3 4 5 1. Factories covered by
Annual Survey of
Industries
No. 597 618
2. Productive capital Rs. in lakh 1005709 1142162
a. Fixed capital " 827836 793409
b. Working capital " 177873 348753
3. Invested capital " 1339474 1319622
4. Outstanding loan " 231396 453209
5. Employment No. 55831 56684
a. Workers " 37338 39618
b. Other than worker " 18493 17066
6. Emoluments Rs. in lakh 149616 167754
a. Wages to workers " 56390 67967
b. Salaries to others
& other benefits "
93226 99787
contd.
-46-

39. General information on Industries Sector for the years,
2012-13 & 2013-14 (Concld.)
Sl.
No Item Unit 2012-13 2013-14
1 2 3 4 5
7. Inputs Rs. in lakh 2527235 2539663
a. Fuel consumed " 137762 133488
b. Material consumed " 1857417 1932100
c. Other expenditure " 532056 474075
8. Depreciation " 72468 75499
9. Gross output " 3659659 3379150
a. Net sale value " 3101397 3011500
b. Net balance stock " -5921 -3552
of finished Goods " c. Other output " 558262 367650
10. Value added by
Manufacturing "
1059957 763987
a. Percentage to gross 28.96 22.61
output %
b. Percentage to 105.39 66.89
Productive Capital %
c. Per person engaged Rs. 1898510 1347800
Source: Directorate of Planning, Statistics & Evaluation.
-47-
40. Index of Industrial Production, 2013-14.
Industry
code
(2-digit)
NIC - 2004
Industry Group
Industry
Group
product
weight
2013-14
1 2 3 4
A MANUFACTURING SECTOR 15. Manufacture of food products and
beverages 51.84 222.43
17. Manufacture of textiles 21.46 953.95
18. Manufacture of wearing apparel,
dressing and dyeing of fur 0.03 0
20. Manufacture of wood and of products
of wood and cork, except furniture,
manufacture of articles of straw and
plaiting materials
0.26 102.37
21. Manufacture of paper and paper
products 3.43 63.56
22. Publishing , printing and reproduction
of recorded media 5.56 49.67
23. Manufacture of coke, refined
petroleum products and nuclear fuel 59.10 96.03
24. Manufacture of chemicals and
chemical products 420.65 54.32
25. Manufacture of rubber and plastic
products 52.36 175.42
Contd.
-48-

40. Index of Industrial Production, 2013-14.
Industry
code
(2-digit)
NIC - 2004
Industry Group
Industry
Group
product
weight
2013-14
1 2 3 4
26. Manufacture of other non-metallic
mineral product 12.05 369.66
27. Manufacture of basic metals 72.61 35.56
28. Manufacture of fabricated metal
products, except machinery and
equipment
9.67 200.02
29. Manufacture of machinery &
equipment n.e.c. 14.66 117.69
30. Manufacture of office, accounting and
computing machinery 23.06 73.63
31. Manufacture of electrical machinery
and apparatus n.e.c. 18.86 47.91
32. Manufacture of radio, television, &
communication equipment & apparatus 4.00 83.14
33. Manufacture of medical ,precision and
optical instrument ,watches & clocks 20.47 64.50
34. Manufacture of motor vehicle, trailers
& Semi trailers 7.98 67.03
35. Manufacture of other transport
equipment 3.65 9.35
36. Manufacture of furniture,
manufacturing n.e.c. 4.07 22.01
Manufacturing Index 805.75 106.54
Contd.
-49-
40. Index of Industrial Production, 2013-14 (Concld.)
Industry
code
(2digit)
NIC - 2004
Industry group Weight 2013-14
1 2 3 4
B MINING SECTOR
13. Mining of metal
Ore 136.82 0.68
Mineral Index 136.82 0.68
C ELECTRICITY SECTOR
40.
Electricity ,Gas,
Steam & water
supply
57.43 72.42
Electricity Index 57.43 72.42
Combined IIP(A+B+C) 1000.00 90.09
Source: Directorate of Planning, Statistics & Evaluation
-50-

VIII MINERALS
41. Quantity of mineral production, 2016-17.
(in lakh tonnes)
Sl.
No Item Quantity
1 2 3
1. Iron Ore 200.00
2. Manganese Ore 0.0015
3. Bauxite 0.475
4. All Minerals 200.48
Source: Directorate of Mines & Geology, Panaji-Goa.
-51-
IX ELECTRICITY
42. Energy Purchased and Sold, 2010-11 to 2016-17.
(MKWH)
* Actual (unaudited)
# Estimated ** Actual
## Sold as per APR approved by JERC.
^ Sold as per business plan approved by JERC.
Source: Department of Electricity, Panaji-Goa.
-52-
Sl.
No Year Purchased Sold
1 2 3 4
1. 2010-11 3621.07 2727.00*
2. 2011-12 3740.19 2746*
3. 2012-13 3485.19 2885#
4. 2013-14 3558.2 2962*
5. 2014-15 3733.96 3114.00
6. 2015-16 4040.79** 3233.00##
7. 2016-17 4055.95** 3351.81^

43. Allocation of Power from Central Sector Power
Generating Station 2015-16
Sl.
No Station
(Peak Hrs. 18.00 - 22.00)
Shares from
firm
Allocation
(MW)
Shares from
unallocated
Allocation
(MW)
Total
Allocation
(MW)
1 2 3 4 5
1. KSTPS
NTPC/Coal based
210 2.73 212.73
2. KSTPS-7
4.5 1.29 5.79
3. VSTPS-I 35 2.43 37.43
4. VSTPS-II 12 1.84 13.84
5. VSTPS-III 10 1.84 11.84
6. VSTPS-IV 11.2 2.58 13.78
7. SipatStage-I
] 20 5.1 25.1
8. SipatStage-II 10 1.75 11.75
9. MSTPS-I 11.2 2.58 13.78
10. KGPP
NTPC/Gas based - 12.37 12.37
11. GGPP - 12.63 12.63
12. KAPP
NPCIL/Nuclear
based
15 0.67 15.67
13 TAPP-3&4 11 2.27 13.27
Total WR 349.9 50.08 399.98
RSTPS SR NTPC/Coal based
100 - 100
Total Coal/Gas/Nuclear
449.9 50.08 499.98
Contd.
Source : Department of Electricity, Panaji-Goa.
-53-
43. Allocation of Power from Central Sector Power
Generating Stations 2015-16 (Concld.)
Sl.
No Station
Off Peak Hrs. (00 to 18.00 & 22.00 to
24.00)
Shares
from firm
Allocation
(MW)
Shares from
unallocated
Allocation
(MW)
Total Allocation
(MW)
1 2 6 7 8
1. KSTPS
NTPC/Coal
based
NTPC/Gas
based
NPCIL/Nuclear
based
]
210 4.38 214.38
2. KSTPS-7 4.5 2.07 6.57
3. VSTPS-1 35 3.91 38.91
4. VSTPS-II 12 2.95 14.95
5. VSTPS-III 10 2.95 12.95
6. VSTPS-IV 11.2 4.13 15.33
8. SipatStage-1 20 8.19 28.19
9. SipatStage-II 10 2.81 12.81
10. MSTPS-I 11.2 4.13 15.33
11. KGPP - 12.37 12.37
12. GGPP - 12.63 12.63
12. KAPP 15 1.07 16.07
13 TAPP-3&4 11 3.63 14.63
Total WR 349.9 65.22 415.12
RSTPS SR NTPC/Coal based 100 - 100
Total Coal/Gas/Nuclear 449.9 65.22 515.12
Source: Department of Electricity, Panaji-Goa.
KSTPS: Korba Super Thermal Power Station. VSTPS: Vindhyachal Super Thermal Power
Station. KGPP: Kawas Gas power Project. GGPP: Gandhar Gas power Project. KAPP:
Kakrapar Atomic Power Project. TAPP: Tarapur Atomic Power Project. MSTPS: Mauda
Super Thermal Power Station. RSTPS SR: Ramagundum Super Thermal Power Station.
-54-

44. Allocation of Power from Central Sector Power
Generating Station 2016-17
Sl.
No Station
(Peak Hrs. 18.00 - 22.00)
Shares from
firm
Allocation
(MW)
Shares from
unallocated
Allocation
(MW)
Total
Allocation
(MW)
1 2 3 4 5
1. KSTPS 210 0.56 210.56
2. KSTPS-7
4.5 0.26 4.76
3. VSTPS-I 35 0.5 35.5
4. VSTPS-II 12 0.38 12.38
5. VSTPS-III 10 0.38 10.38
6. VSTPS-IV 11.2 0.53 11.73
7. VSTPS-V 5.18 0.26 5.44
8. SipatStage-I
] 20 1.04 21.09
8. SipatStage-II 10 0.36 10.36
9. MSTPS-I 11.2 0.53 11.73
10. MSTPS-II 7.25 0.35 7.6
10. KGPP 0 12.37 12.37
11. GGPP 0 12.63 12.63
12. KAPP 15 0.19 15.19
13 TAPP-3&4 11 0.46 11.46
14 RSTPS 100 - 100
Total 462.33 30.8 493.18
Contd.
Source: Department of Electricity, Panaji-Goa.
-55-
44. Allocation of Power from Central Sector Power
Generating Stations 2016-17 (Concld.)
Sl.
No Station
Off Peak Hrs. (00 to 18.00 & 22.00 to
24.00)
Shares
from firm
Allocation
(MW)
Shares from
unallocated
Allocation
(MW)
Total
Allocation
(MW)
1 2 6 7 8
1. KSTPS 210 2.22 212.22
2. KSTPS-7 4.5 1.04 5.54
3. VSTPS-1 35 1.97 36.97
4. VSTPS-II 12 1.49 13.49
5. VSTPS-III 10 1.49 11.49
6. VSTPS-IV 11.2 2.09 13.29
7. VSTPS-V 5.18 1.04 6.22
7. Sipat Stage-I 20 4.13 24.13
8. Sipat Stage-II 10 1.42 11.42
9. MSTPS-I 11.2 2..09 13.29
10. MSTPS-II 7.25 1.38 8.63
11. KGPP - 12.37 12.37
11. GGPP - 12.63 12.63
12. KAPP 15 0.75 15.75
13 TAPP-3&4 11 1.83 12.83
14 RSTPS 100 - 100
Total 462.33 47.94 510.27
Source: Department of Electricity, Panaji-Goa.
KSTPS: Korba Super Thermal Power Station. VSTPS: Vindhyachal
Super Thermal Power Station. KGPP: Kawas Gas power Project.
GGPP: Gandhar Gas power Project. KAPP: Kakrapar Atomic
Power Project. TAPP: Tarapur Atomic Power Project.
MSTPS: Mauda Super Thermal Power Station. RSTPS: Ramagundum
Super Thermal Power Station.
-56-
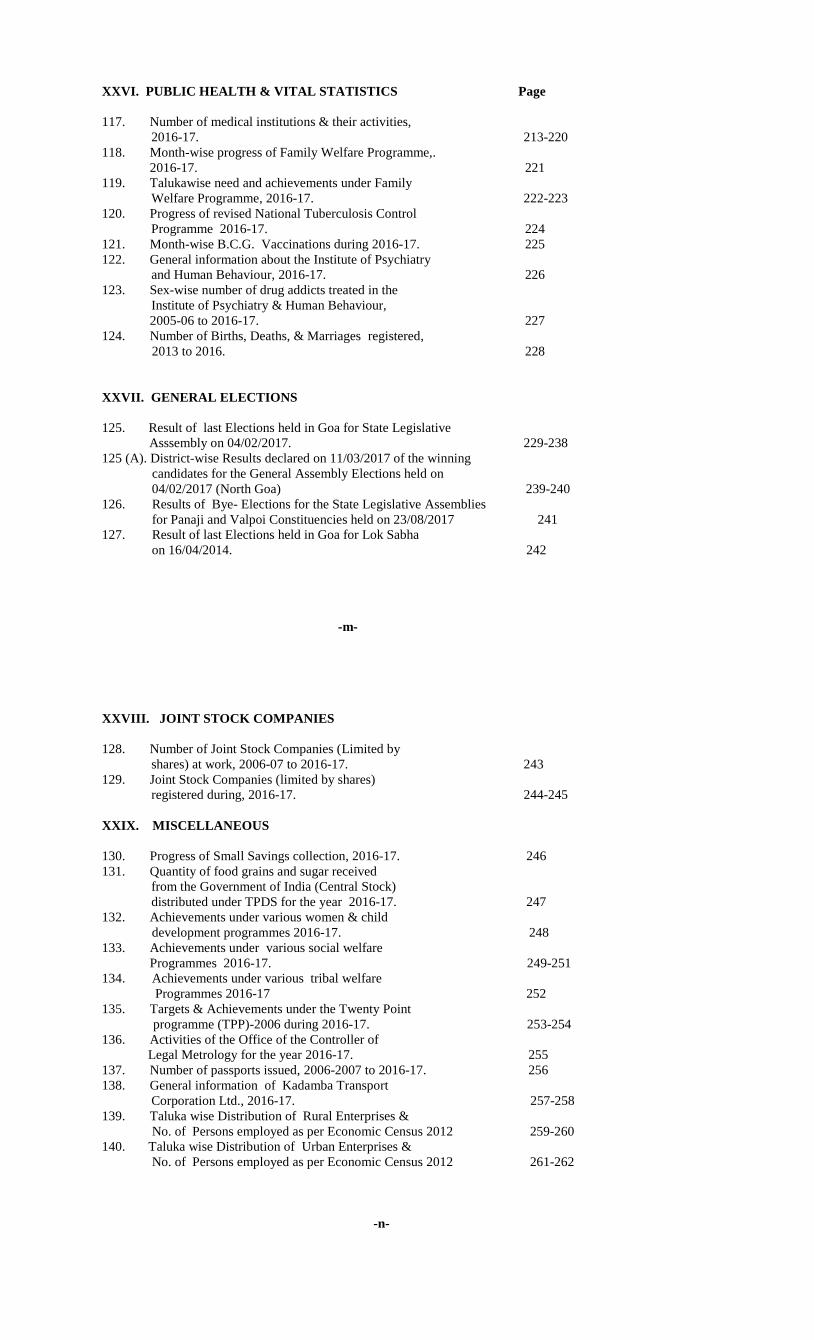
45. Generation of power within the State, 2015-16 and 2016-17
Sl.
No Item Unit
2015-16 2016-17
Contracted
capacity
Contracted
capacity
1 2 3 4 5
I Co-generation
1 M/s Goa Energy Pvt. Ltd. (GEPL-Co-generation) MW 12-14 MW 12-14 MW
2 M/s Goa Sponge Power Ltd.(GSPL-Co-generation) MW 1-2 MW 1-2 MW
3 M/s Vedanta Limited MW 2 MW 2 MW
Source: Department of Electricity.
-57-
46. Electricity consumed during 2015-16 and 2016-17.
Sl.
No. Category of Consumer
Consumption in (Mkwh)
2015-16 2016-17
1 2 3 4
A LOW TENSION SUPPLY
1(a) Tariff LTD/Domestic and Non-
commercial 764 866.96
(b) Tariff LTD/Low Income Group 2 1.10
(c ) Tariff LTD/Domestic mixed 8 12.27
2 Tariff LTC/ Commercial 281 295.17
3 (a) Tariff LTP/ Motive power 188 111.96
(b) Tariff LTP/Ice Manufacturing 8 7.87
(c) Tariff LTP/ Mixed ( Hotel
Industries) 5 4.39
4. Tariff LTAG/Agriculture 25 23.86
5. Tariff LTAG/Public lighting 40 36.95
6. Tariff LT PWW/Public Water
works 6 5.56
7. Hoarding /sign board - -
Total LT Category 1327 1366.09
Contd.
-58-

46. Electricity consumed during 2015-16 and 2016-17 (Concld.)
Sl.
No. Category
Consumption in (Mkwh)
2015-16 2016-17
1 2 3 4
B HIGH TENSION SUPPLY
8. Tariff HT-Mixed 136 226.54
9(a) Tariff HTI/Industrial 637 638.66
(b) Tariff HTI/Hotel Industries 143 147.99
(c) Tariff HTI/Ice Manufacturing 2 1.23
10.
HT Industrial
(FerroMetallurgical/Steel melting/
power Intensive/Steel rolling)
576 561.19
11. Tariff HTAG/ Agriculture 6 6.08
12. EHTI/ Industrial 175 179.45
13. HT PW/Public water supply and
sewage 144 153.24
14. HT MES/ Defence establishments 27 26.89
15. HT Industrial (Steel rolling) - -
16. Tariff HT industries (IT High Tech). 21 22.38
17. HTD/Domestic - -
Total HT Category 1867 1963.65
C TEMPORARY SUPPLY
18. Tariff LT/ Temporary 38 22.08
19. Tariff HT/ Temporary - -
TOTAL SALES 3232 3352.16
Source: Department of Electricity, Panaji-Goa. Note: The total figures for Low Tension, High Tension & Temporary
supply of Electricity will not match due to rounding off the figures.
-59-
X. WATER SUPPLY
47. Zonewise daily consumption of water, 2016-17.
Sl.
No. Item
Total no.
of
metered
consu-
mers
Daily average of water consumed
in Cu. Mts.
Individual
metered
connecti-
ons
Water
consu-
med by
public
taps
Total
water
Consumed
(in cu.m.)
(4 + 5)
1 2 3 4 5 6
1. OPA NETWORK
a. Panaji-zone 31827 34002 0 34002
b. Ponda-zone 33594 33467 500 33967
2. ASSONORA NETWORK
a. Mapusa- zone 37287 68628 60 68688
b. Porvorim-zone 11920 15264.50 0 15264.50
c. Calangute-zone 5792 7672 0 7672
d. Bicholim-Zone
(Part I) 1067 1067 2 1069
3. PERNEM NETWORK
a. Pernem-zone 16985 11266 0 11266
4. VALPOI NETWORK
a. Valpoi-zone 9921 8833 470 9303
Contd.
-60–

47. Zonewise daily consumption of water, 2016-17 (Concld.)
Sl.
No. Item
Total no.
of
metered
consu-
mers
Daily average of water consumed
in Cu. Mts.
Individua
l metered
connecti-
ons
Water
consu-
med by
public
taps
Total
water
Consumed
1 2 3 4 5 6
5. SANQUELIM NETWORK
a. Bicholim-zone
(part II) 10969 10969 9 10978
b. Sanquelim-zone 7184 7184 1 7185
c. Sanquelim 3222 2718 30 2748
6. SALAULIM NETWORK
a. Sanguem- zone 5812 5433 4812 10245
b. Dharbandora-zone 5528 4311 0 4311
c. Quepem-zone 8700 15227 816 16043
d. Margao-zone 67774 80124 0 80124
e. Vasco-zone 23848 38691 130 38821
7. CANACONA NETWORK
a. Canacona-zone 7008 6900 0 6900
Total – All zones 288438 351756.50 6830 358586.50
Source: Public Works Department
-61-
XI BANKING AND INSURANCE
48. Number of Banking Offices, 2009-10 to 2016-17.
Sl.
No Year No. of Banking Offices
1 2 3
1. 2009-10 547
2. 2010-11 598
3. 2011-12 643
4. 2012-13 674
5. 2013-14 694
6. 2014-15 753
7. 2015-16 787
8. 2016-17 819
Source: Economic Survey 2017-18
-62-

49. Annual Growth Rate of Deposits and credit from
March 2009 to March 2017
(Rs. in crores)
Sl.
No
Financial
year ending Deposits Credits
1 2 3 4
1. March 2009 25596 8082
2. March 2010 31223 8940
3. March 2011 34164 11121
4. March 2012 44594 11818
5. March 2013 39661 12490
6. March 2014 47799 15725
7. March 2015 54748 16643
8. March 2016 63339 19385
9. March 2017 66078 18991
Source : Lead Bank, Economic Survey 2017-18
-63-
50. Loan sanctioned &disbursed by EDC since
inception from 1975-76 to 2016-17. (Rs. in lakh)
Sl.
No Year
Loan
Sanctioned
Loan
Disbursed
1 2 3 4
1. 1975-76 15.48 6.19
2. 1976-77 103.50 51.68
3. 1977-78 127.87 66.95
4. 1978-79 107.25 61.20
5. 1979-80 162.54 81.11
6. 1980-81 241.97 176.50
7. 1981-82 349.92 244.93
8. 1982-83 497.04 274.75
9. 1983-84 503.63 356.36
10. 1984-85 579.66 448.79
11. 1985-86 1606.45 722.70
12. 1986-87 1495.63 954.88
13. 1987-88 2312.86 1469.71
14. 1988-89 2070.24 1086.90
15. 1989-90 2233.64 1506.98
16. 1990-91 2211.15 1764.42
17. 1991-92 1947.34 2233.48
Contd.
-64-

50. Loan sanctioned & disbursed by EDC since inception
from 1975-76 to 2016-17 (Concld.)
(Rs. in lakh) Sl.
No Year
Loan
Sanctioned
Loan
Disbursed
1 2 3 4
18. 1992-93 2057.16 1777.71
19. 1993-94 3010.64 1583.58
20. 1994-95 3656.15 1754.78
21. 1995-96 6010.89 2881.23
22. 1996-97 7884.74 4675.37
23. 1997-98 12688.48 8326.51
24. 1998-99 5848.96 5129.28
25. 1999-00 7208.86 4139.93
26. 2000-01 2614.81 3793.46
27. 2001-02 3318.52 1394.50
28. 2002-03 1806.65 1470.92
29. 2003-04 921.81 788.85
30. 2004-05 3615.33 2236.59
31. 2005-06 4668.52 995.13
32. 2006-07 10541.77 10452.57
33. 2007-08 12611.45 6203.91
34. 2008-09 2518.81 6085.87
35. 2009-10 4034.64 3633.70
36. 2010-11 5303.62 4601.27
37. 2011-12 3639.31 3718.64
38. 2012-13 28058.38 24076.78
39. 2013-14 27490.69 24587.52
40. 2014-15 14937.93 17046.88
41. 2015-16 34073.41 16750.35
42. 2016-17* 23992.29 31987.98
TOTAL 249079.99 201600.84
Source: Economic Development Corporation Ltd.
*Figures for FY.2016-17 are provisional.
-65-
51. Loans sanctioned & disbursed by NABARD during the
Year 2016-17 for investment credit (Refinance)
(Rs. in crores)
Sl.
No Sector
Loan
Sanctioned
Refinance to
Commercial
Banks
Loan
Disbursed
Refinance to
Commercial
Banks
1 2 3 4
1. Minor Irrigation - -
2. Land Development - -
3. Farm mechanization - 0.05
4. Plantation/Horticulture - -
5. Dairy Development -
6. Poultry Development - -
7. Marine Fisheries - -
8. NFS - 147.30
9. Rural Housing - -
10. Self Help Groups - 1.41
11. Miscellaneous - -
Total - 148.76
Source: National Bank for Agriculture & Rural Development.
.
-66-

52A. Loans sanctioned & disbursed by NABARD during
the year 2016-17 for Rural infrastructure development.
(Rs. in crores)
Sl.
No Sector Amount
1 2 3
A SANCTIONS
1. Salaulim LIS Augmentation -
2. Ponda Sewerage Scheme – Phase I -
3. Tuem Irrigation/RDWS -
4. Mandur/Chicalim Health Centres -
TOTAL SANCTIONS -
B DISBURSEMENTS
1. Irrigation Projects 33.42
2. Rural Bridges 4.15
3. Rural Roads 13.14
4. Rural Drinking Water Supply 8.87
5. Rural Sanitation 13.77
6. Primary Health Centres 18.21
TOTAL DISBURSEMENTS 91.56
Source: National Bank for Agriculture & Rural Development
-67-
52B. Other Assistance/Loan Sanctioned during the year 2016-17
Rs. in crores
Sr.
No. Sector Amount
1 2 3
A. NABARD Infrastructure Development Assistance (NIDA)
I SANCTIONS
1. Bridge over River Mandovi -
TOTAL SANCTIONS -
II DISBURSEMENTS
1 Sewerage Projects 10.00
2. Bridge over River Mandovi 53.00
TOTAL DISBURSEMENTS 63.00
B. Direct Financial Assistance for Rural Housing under Off
Farm Sector Promotion Fund (OFSPF)
I DISBURSEMENTS
1. Rural Housing and Sanitation -
TOTAL DISBURSEMENTS -
Source: National Bank for Agriculture & Rural Development
-68-

53. Insurance Business 2016-17.
Sl.
No. Type of Insurance
Unit
Year
2016-17
1 2 3 4
Life Insurance *
1. New Policies No. 73,241
2. Sum Assured on new Policies Rs. in Lakh 177369
3. Premium paid on new policies Rs..in Lakh 18807.31
General Insurance **
(a) Fire
1. Policies No. 12147
2. Premium paid Rs. in crores 17.27
(b) Marine
1. Policies No. 4429
2. Premium paid Rs. in crores 18.77
( c ) Automobile
1. Policies No. 234213
2. Premium paid Rs. in crores 63.26
(d) Miscellaneous
1. Policies No. 19621
2. Premium paid Rs. in crores 42.05
Total General Insurance
1. Policies No. 270410
2. Premium paid Rs. in crores 141.35
Source: * Relates to Life Insurance Corporation of India (LIC)
** United India : Panaji & Margao, Oriental: Panaji, Sanvordem,
Margao & Vasco. New India Assurance: Panaji, Vasco, Ponda,
Mapusa & Margao.
-69-
XII CO-OPERATION
54. Number of Co-operative Societies, their membership
and financial position, 2016-17 (Provisional)
(Amount in crores)
Sl.
No
Item State / District
Goa North Goa South Goa
1 2 3 4 5
1. Number of Societies 4632 2610 2022
2. Number of Members 1212743 910660 302083
3. Share Capital 337.4477 210.4534 126.9943
4. Working Capital 6850.8144 5822.8163 1027.9981
5. Deposits 5310.3270 4736.2300 574.0970
6. Loans Advanced 2352.4018 1879.1093 473.2925
7. Loans Outstanding 3572.8514 2911.1291 661.7223
8. Sales 724.2627 648.7169 75.5458
9. Profits 2584 1316 1268
10 Loss 601 509 92
11 No. of soc. with no
profit no loss 1447 785 662
Source: Office of the Registrar of Co-operative Societies, Panaji, Goa.
-70-

55. Functioning of consumer stores in North-Goa, 2016-17.
( Amount in crores)
Sl.
No Item
Wholesale
Central
Stores
Primary
Stores Total
1 2 3 4 5
1. Number of Stores 0 46 46
2. Number of Members 0 21781 21781
3. Share Capital 0 0.492 0.492
4. Total Purchase Value 0 9.392 9.392
5. Total sales 0 8.829 8.829
6. Societies not functioning 0 11 11
7. Societies having profits
a) Number 0 27 27
b) Amount 0 0.624 0.624
8. Societies having loss
a) Number 0 8 8
b) Amount 0 0.204 0.204
Source: Office of the Registrar of Co-operative Societies, Panaji, Goa.
-71-
56. Functioning of consumer stores in South–Goa, 2016-17.
(Amount in crores)
Sl.
No Item
Wholesale
Central
Stores
Primary
Stores Total
1 2 3 4 5
1. Number of stores 0 22 22
2. Number of members 0 13334 13334
3. Share capital 0 0.1322 0.1322
4. Total purchase value 0 9.4713 9.4713
5. Total sales 0 9.9407 9.9407
6. Societies not functioning 0 0 0
7. Societies having profits
a) Number 0 16 16
b) Amount 0 0.08 0.08
8. Societies having loss
a) Number 0 6 6
b) Amount 0 0.02 0.02
Source: Office of the Registrar of Co-operative Societies, Panaji, Goa.
-72-

57. Functioning of consumer stores in Goa State, 2016-17.
(Amount in Crores)
Sl.
No Item
Wholesale
Central
Stores
Primary
Stores Total
1 2 3 4 5
1. Number of stores 0 68 68
2. Number of members 0 35115 35115
3. Share capital 0 0.6246 0.6246
4. Total purchase value 0 18.8636 18.8636
5. Total sales 0 18.7693 18.7693
6. Societies not functioning 0 11 11
7. Societies having profits
a) Number 0 43 43
b) Amount 0 0.7004 0.7004
8. Societies having loss
a) Number 0 14 14
b) Amount 0 0.2260 0.2260
Source: Office of the Registrar of Co-operative Societies, Panaji, Goa.
-73-
58A. Type of Co-operative Banks / Societies with membership,
share capital, deposits, loans and working capital,
North–Goa, 2016-17. (Amount in Crores)
Sl.
No Type of Co-operative Societies/Banks
No. of
Banks/
Societies
No. of
Members
1 2 3 4
1. Goa State Co-operative Bank 1 41515
2. Urban Co-operative Banks 4 302736
3. Urban Credit Co-op. Societies 91 303141
4. Salary Earners Co-op. Credit Societies 205 51584
5. Consumer Co-operative Societies 64 32594
6. Dairy Co-operative Societies 120 15666
7. Farming Co-operative Societies 8 114
8. Fisheries Co-operative Societies 13 1075
9. Housing Co-operative Societies 1221 14367
10. Industrial Co-op Societies 23 3205
11. Marketing Co-operative Societies 6 9835
12. Poultry Co-operative Societies 1 70
13. Processing Co-operative Societies 5 2215
14. Service Co-operative Societies 49 71960
15. Transport Co-operative Societies 3 149
16. Labour Co-op. Societies 6 293
17. Panivatap Co-operative Societies 60 2919
18. Sangh & Union Federation 3 20115
19. General Co-operative Societies 28 4527
20. Producers /Resources Co-operative
Societies 7 1266
21. Multipurpose Societies 48 24094
22. Self Help Group Cooperative Societies 644 7220
23. Market Committee 0 0
TOTAL 2610 910660
Contd.
-74-

58A Type of Co-operative Banks / Societies with membership,
share capital, deposits, loans and working capital,
North–Goa, 2016-17. (Amount in Crores)
Sl.
No.
Type of Co-operative
Societies/Banks
Share
Capital Deposits
1 2 5 6
1. Goa State Co-operative Bank 53.01 2227.88
2. Urban Co-operative Banks 68.32 1920.46
3. Urban Credit Co-op. Societies 17.47 430.39
4. Salary Earners Co-op. Credit
Societies 30.71 63.29
5. Consumer Co-operative Societies 0.78 4.70
6. Dairy Co-operative Societies 0.20 0.00
7. Farming Co-operative Societies 0.01 0.00
8. Fisheries Co-operative Societies 0.02 0.00
9. Housing Co-operative Societies 3.84 6.06
10. Industrial Co-op Societies 0.26 0.02
11. Marketing Co-operative Societies 3.17 22.71
12. Poultry Co-operative Societies 0.01 0.00
13. Processing Co-operative Societies 0.48 4.36
14. Service Co-operative Societies 3.40 50.22
15. Transport Co-operative Societies 0.01 0.00
16. Labour Co-op. Societies 0.01 0.00
17. Panivatap Co-operative Societies 0.01 0.00
18. Sangh & Union Federation 27.47 1.44
19. General Co-operative Societies 0.86 1.94
20. Producers/Resources Co-operative
Societies 0.02 0.00
21. Multipurpose Societies 0.77 2.76
22. Self Help Group Cooperative
Societies 0.03 0.00
23. Market Committee 0.00 0.00
TOTAL 210.86 4736.23
Contd.
-75-
58A. Type of Co-operative Banks /Societies with membership,
share capital, deposits, loans & working capital,
North–Goa, 2016-17. (Amount in Crores)
Sl.
No
Type of Co-operative
Societies/Banks
Loans Working
Capital Advanced Outstanding
1 2 7 8 9
1. Goa State Co-operative Bank 442.0520 1232.1668 2439.0262
2. Urban Co-operative Banks 354.0565 1020.5275 2134.0268
3. Urban Credit Co-op. Societies 992.5753 412.8448 530.9358
4. Salary Earners Co-op. Credit Soc. 66.2446 189.6896 290.6485
5. Consumer Co-operative Societies 0.0000 0.3500 63.3531
6. Dairy Co-operative Societies 0.0000 0.0000 7.3657
7. Farming Co-operative Societies 0.0000 0.0000 1.7980
8. Fisheries Co-operative Societies 0.0000 0.0000 5.4250
9. Housing Co-operative Societies 3.6410 16.9582 245.9119
10. Industrial Co-op Societies 0.0000 0.0000 0.4199
11. Marketing Co-operative Societies 1.9778 2.1400 37.3971
12. Poultry Co-operative Societies 0.0000 0.0000 0.0060
13. Processing Co-operative Societies 0.0000 0.0000 1.0374
14. Service Co-operative Societies 8.1145 28.7885 45.4439
15. Transport Co-operative Societies 0.0000 0.0000 0.0002
16. Labour Co-op. Societies 0.0000 0.0000 0.0026
17. Panivatap Co-operative Societies 0.0000 0.0000 0.9301
18. Sangh & Union Federation 0.0000 0.1178 0.7699
19. General Co-operative Societies 1.4261 2.2873 14.6559
20. Producers/Resources Co-operative
Societies 0.0000 0.0000 0.3182
21. Multipurpose Societies 2.8928 5.2586 8.7060
22. Self Help Group Cooperative
Societies 0.0000 0.0000 0.0312
23. Market Committee 0.0000 0.0000 0.0000
TOTAL 1872.98 2911.13 5828.21
Contd.
-76-

58A. Type of Co-operative Banks / Societies with membership,
share capital, deposits, loans and working capital,
North–Goa, 2016-17. (Amount in Crores)
Sl.
No.
Type of Co-operative
Societies/Banks Sales
Profit
No. of
Societies
Amount
(Rs. in crores)
1 2 10 11 12
1. Goa State Co-operative Bank 0.0000 0 0.00
2. Urban Co-operative Banks 0.0000 3 3.29
3. Urban Credit Co-op. Societies 0.0000 54 17.59
4. Salary Earners Co-op. Credit Soc. 0.0000 176 7.42
5. Consumer Co-operative Societies 83.3695 34 1.95
6. Dairy Co-operative Societies 27.2027 115 1.29
7. Farming Co-operative Societies 0.0042 4 0.06
8. Fisheries Co-operative Societies 2.6603 11 0.06
9. Housing Co-operative Societies 0.0096 760 3.89
10. Industrial Co-op Societies 2.6470 13 0.09
11. Marketing Co-operative Societies 349.4788 6 4.07
12. Poultry Co-operative Societies 0.0000 0 0.00
13. Processing Co-operative Societies 11.6926 0 0.00
14. Service Co-operative Societies 16.8328 29 1.49
15. Transport Co-operative Societies 0.0000 1 0.00
16. Labour Co-op. Societies 0.0000 4 0.01
17. Panivatap Co-operative Societies 0.0000 41 0.26
18. Sangh & Union Federation 152.4500 1 0.02
19. General Co-operative Societies 0.0000 22 0.23
20. Producers/Resources Co-
operative Societies 0.0006 0 0.00
21. Multipurpose Societies 2.3696 29 0.18
22. Self Help Group Cooperative
Societies 0.0000 13 0.01
23. Market Committee 0.0000 0 0.00
TOTAL 648.72 1316 41.91
Contd.
-77-
58A. Type of Co-operative Banks / Societies with membership,
share capital, deposits, loans and working capital
North – Goa, 2016-17 (Concld.)
(Amount in Crores)
Sl..
No.
Type of Co-operative
Societies/Banks
Loss No. of
Societies
with no
loss/profit
No. of
Societies
Amount
(Rs. in
crores)
1 2 13 14 15
1. Goa State Co-operative Bank 1 67.3004 0
2. Urban Co-operative Banks 1 8.9998 0
3. Urban Credit Co-op. Societies 15 8.4769 22
4. Salary Earners Co-op. Credit Soc. 6 3.7568 23
5. Consumer Co-operative societies 10 0.4896 20
6. Dairy Co-operative Societies 2 0.0190 3
7. Farming Co-operative Societies 2 0.0027 2
8. Fisheries Co-operative Societies 1 0.0023 1
9. Housing Co-operative Societies 408 0.8541 53
10. Industrial Co-op Societies 6 0.3181 4
11. Marketing Co-operative Societies 0 0.0000 0
12. Poultry Co-operative Societies 1 0.0011 0
13. Processing Co-operative Societies 4 0.2784 1
14. Service Co-operative Societies 15 3.3149 5
15. Transport Co-operative Societies 1 0.0000 1
16. Labour Co-op. Societies 1 0.0017 1
17. Panivatap Co-operative Societies 7 0.2250 12
18. Sangh & Union Federation 1 4.3000 1
19. General Co-operative Societies 5 0.1796 1
20. Producers/Resources Co-
operative Societies 3 0.0058 4
21. Multipurpose Societies 7 0.1231 12
22. Self Help Group Cooperative Societies
12 0.0017 619
23. Market Committee 0 0.0000 0
TOTAL 509 98.6510 785
Source: Office of the Registrar of Co-operative Societies, Panaji, Goa.
-78-

58B. Type of Co-operative Banks / Societies with membership,
share capital, deposits, loans and working capital
South –Goa, 2016-17. (Amount in Crores)
Sl.
No Type of Co-operative Societies/Banks
No. of
Banks/
Societies
No. of
Members
1 2 3 4
1. Goa State Co-operative Bank 0 0
2. Urban Co-operative Banks 2 65151
3. Urban Credit Co-op. Societies 39 124109
4. Salary Earners Co-op. Credit Societies. 63 19247
5. Consumer Co-operative Societies 22 13334
6. Dairy Co-operative Societies 59 7366
7. Farming Co-operative Societies 7 544
8. Fisheries Co-operative Societies 8 725
9. Housing Co-operative Societies 1096 18349
10. Industrial Co-op. Societies 5 41
11. Marketing Co-operative Societies 4 9286
12. Poultry Co-operative Societies 1 40
13. Processing Co-operative Societies 2 3565
14. Service Co-operative Societies 32 26304
15. Transport Co-operative Societies 1 152
16 Labour Co-op. Societies 5 158
17 Panivatap Co-operative Societies 32 1062
18 Sangh & Union Federation 0 0
19 General Co-operative Societies 2 138
20. Producers/Resources Co-operative
Societies 3 519
21. Multipurpose Societies 5 1481
22 Self Help Group Cooperative Societies 633 9732
23. Market Committee 1 780
TOTAL 2022 302083
Contd.
-79-
58B. Type of Co-operative Banks / Societies with membership,
share capital, deposits, loans and working capital
South –Goa, 2016-17. (Amount in Crores)
Sl.
No Type of Co-operative Societies/Banks
Share
Capital Deposits
1 2 3 4
1. Goa State Co-operative Bank 0 0
2. Urban Co-operative Banks 11.14 339.8568
3. Urban Credit Co-op. Societies 19.52 89.9321
4. Salary Earners Co-op. Credit Societies. 17.99 117.9188
5. Consumer Co-operative Societies 0.13 0.0000
6. Dairy Co-operative Societies 0.35 0.0000
7. Farming Co-operative Societies 0.01 0.0000
8. Fisheries Co-operative Societies 0.01 0.0120
9. Housing Co-operative Societies 0.06 12.9182
10. Industrial Co-op. Societies 0.00 0.0000
11. Marketing Co-operative Societies 0.0016 0.0363
12. Poultry Co-operative Societies 0.00 0.0000
13. Processing Co-operative Societies 77.21 0.4472
14. Service Co-operative Societies 0.24 8.6858
15. Transport Co-operative Societies 0.00 0.0000
16 Labour Co-op. Societies 0.01 0.0000
17 Panivatap Co-operative Societies 0.10 0.0035
18 Sangh & Union Federation 0.00 0.0000
19 General Co-operative Societies 0.03 0.0000
20. Producers/Resources Co-operative
Societies 0.01 0.0000
21. Multipurpose Societies 0.09 1.2637
22 Self Help Group Cooperative Societies 0.19 0.0000
23. Market Committee 0.00 3.0225
TOTAL 127.09 574.0970
Contd.
-80-

58B. Type of Co-operative Banks / Societies with membership,
share capital, deposits, loans and working capital
South – Goa, 2016-17.
(Amount in Crores)
Sl.
No
Type of Co-operative
Societies/Banks
Loans Working
Capital Advanced Outstanding
1 2 7 8 9
1. Goa State Co-operative Bank 0.0000 0.0000 0.0000
2. Urban Co-operative Banks 192.2081 233.0698 577.6289
3. Urban Credit Co-op. Societies 180.8718 171.8027 173.1246
4. Salary Earners Co-op. Credit
Societies 66.2446 117.4388 165.2513
5. Consumer Co-operative Societies 0.0000 86.3450 1.1812
6. Dairy Co-operative Societies 0.0000 0.0229 5.8804
7. Farming Co-operative Societies 0.0000 0.0000 0.5539
8. Fisheries Co-operative Societies 0.0000 0.0132 5.4250
9. Housing Co-operative Societies 0.0000 1.6002 0.8521
10. Industrial Co-op. Societies 0.0000 0.0000 0.5820
11. Marketing Co-operative Societies 0.0135 0.0135 0.0480
12. Poultry Co-operative Societies 0.0000 0.0000 0.0328
13. Processing Co-operative Societies 4.1636 30.9094 6.9446
14. Service Co-operative Societies 21.3873 20.3511 34.0844
15. Transport Co-operative Societies 0.0006 0.0048 0.0000
16. Labour Co-op. Societies 0.0000 0.0000 0.8900
17. Panivatap Co-operative Societies 0.0000 0.0000 0.3022
18. Sangh & Union Federation 0.0000 0.0000 0.0000
19. General Co-operative Societies 0.0000 0.0000 0.0143
20. Producers/Resources Co-
operative Societies 0.0000 0.0000 0.0353
21. Multipurpose Societies 0.9655 0.9509 1.8076
22. Self Help Group Cooperative
Societies 0.0000 0.0000 0.0000
23. Market Committee 0.0000 0.0000 53.3594
TOTAL 465.855 662.5223 1027.998
Contd.
-81-
58B. Type of Co-operative Banks / Societies with membership,
share capital, deposits, loans and working capital
South – Goa, 2016-17.
(Amount in Crores)
Sl.
No.
Type of Co-operative
Societies/Banks Sales
Profit
No. of
Societies
Amount
(Rs. in
crores)
1 2 10 11 12
1. Goa State Co-operative Bank 0.0000 0 0.0000
2. Urban Co-operative Banks 0.0000 2 0.8446
3. Urban Credit Co-op. Societies 0.0000 22 1.1037
4. Salary Earners Co-op. Credit Societies 0.0000 59 3.0562
5. Consumer Co-operative Societies 534.8147 16 0.0543
6. Dairy Co-operative Societies 27.1073 56 1.0514
7. Farming Co-operative Societies 0.0000 3 0.0897
8. Fisheries Co-operative Societies 0.0000 7 1.2726
9. Housing Co-operative Societies 0.0000 1057 0.4286
10. Industrial Co-op. Societies 0.0000 3 0.0412
11. Marketing Co-operative Societies 2.0245 2 0.2386
12. Poultry Co-operative Societies 0.0000 1 0.2386
13. Processing Co-operative Societies 31.5017 0 0.0000
14. Service Co-operative Societies 3.9890 21 0.3457
15. Transport Co-operative Societies 0.0000 0 0.0000
16. Labour Co-op. Societies 0.0000 3 0.0007
17. Panivatap Co-operative Societies 0.0000 9 0.0263
18. Sangh & Union Federation 0.0000 0 0.0000
19. General Co-operative Societies 0.0000 0 0.0000
20. Producers/Resources Co-operative
Societies 0.0006 3 0.0038
21. Multipurpose Societies 1.2985 3 0.0733
22. Self Help Group Cooperative Societies 0.0000 0 0.0000
23. Market Committee 0.0000 1 0.0048
TOTAL 600.7357 1268 8.8741
Contd.
-82-

58B. Type of Co-operative Banks / Societies with membership,
share capital, deposits, loans and working capital
South – Goa, 2016-17 (Concld.)
(Amount in crores)
Sl.
No
Type of Co-operative
Societies/Banks
Loss No. of
Societies
with no
loss/
profit
No. of
Societies Amount
1 2 13 14 15
1. Goa State Co-operative Bank 0 0.0000 0
2. Urban Co-operative Banks 0 0.0000 0
3. Urban Credit Co-op. Societies 17 250.2900 0
4. Salary Earners Co-op. Credit Soc. 4 0.0662 0
5. Consumer Co-operative Societies 6 0.0225 0
6. Dairy Co-operative Societies 2 0.0021 1
7. Farming Co-operative Societies 1 0.0003 3
8. Fisheries Co-operative Societies 0 0.0000 1
9. Housing Co-operative Societies 24 0.0435 15
10. Industrial Co-op. Soc. 0 0.0000 2
11. Marketing Co-operative Societies 2 0.0047 0
12. Poultry Co-operative Societies 0 0.0036 0
13. Processing Co-operative Soc. 2 92.5158 0
14. Service Co-operative Societies 11 0.0176 0
15. Transport Co-operative Societies 0 0.0000 1
16 Labour Co-op. Societies 2 0.0048 0
17 Panivatap Co-operative Societies 17 0.0048 6
18 Sangh & Union Federation 0 0.0000 0
19 General Co-operative Societies 2 0.0027 0
20. Producers/Resources Co-operative
Societies 0 0.0000 0
21. Multipurpose Societies 2 0.0000 0
22. Self Help Group Cooperative
Societies 0 0.0000 633
23. Market Committee 0 0.0000 0
TOTAL 92 342.98 662
Source: Office of the Registrar of Co-operative Societies, Panaji, Goa.
-83-
59. Functioning of Primary Agricultural credit societies,
North–Goa, 2016-17. (Amount in Crores)
Sl.
No. Particulars
Primary
Agricultu-
ral Credit
Societies
Farmers
Service
Societies
Total
1 2 3 4 5
1. Societies 44 2 46
2. Members 61076 20683 81759
3. Paid up capital
i Members Paid up capital 13.2397 0.5304 13.7701
ii Government Paid up capital 1.9121 0.2448 2.1569
Total 13.6267 0.7752 14.4019
4. Reserve and other funds 2.1047 0.0005 2.1052
5. Working capital 34.5406 0.0196 34.5602
6. Deposits 60.1148 0.6263 60.7411
7. Agricultural loan operations
(i) Societies giving advances 14 0 14
(ii) Members to whom such
32.7087advances are given 0 0 0
(iii) Amount22 advanced during
the year 32.7087 0.0000 32.7087
(iv) Villages covered 22 0 22
Contd.
-84-

59. Functioning of Primary Agricultural credit societies,
North–Goa, 2016-17 (Concld.)
(Amounti in Crores)
Sl.
No. Particulars
Primary
Agricultu
ral Credit
Societies
Farmers
Service
Societies
Total
1 2 3 4 5
8. Borrowings
(i) Government 1.6626 0.0000 1.6626
(ii) Central Finance agencies 0.0000 0.0000 0.0000
(iii) Others 1.4994 0.0001 1.4995
9. Loans outstanding 13.4940 0.0056 13.4996
10. Loans overdue 4.3248 0.0030 4.3278
11. Investments 0.0034 0.0000 0.0034
12. Sales 10.3228 0 10.3228
(i) Agricultural requisites 5.8650 0.0066 5.8716
(ii) Consumer goods 4.4578 0.0067 4.4645
13. Profits
(i) No. of Societies 26 1 27
(ii) Amount 0.1744 0.0003 0.1747
14. Loss
(i) No. of Societies 13 0 13
(ii) Amount 31.7641 0.0232 31.7873
Source : Office of the Registrar of Co-operative Societies, Panaji, Goa.
-85-
60. Functioning of Primary Agricultural credit
societies, South-Goa, 2016-17.
(Amount in Crores)
Sl.
No. Particulars
Primary
Agricultural
Credit
Societies
Farmers
Service
Societies
Total
1 2 3 4 5
1. Societies 32 0 32
2. Members 26121 0 26121
3. Paid up capital
i. Members Paid up capital 0.8813 0 0.8813
ii. Government Paid up capital 0.0204 0 0.0204
Total (i + ii) 0.9017 0 0.9017
4. Reserve and other funds 1.7885 0 1.7885
5. Working capital 20.0985 0 20.0985
6. Deposits 9.1771 0 9.1771
7. Agricultural loan operations
(i) Societies giving advances 6 0 6
(ii) Members to whom such
advances are given 0 0 0
(iii) Amount advanced during
the year 8.1265 0.0000 8.1265
(iv) Villages covered 30 0 30
Contd.
-86-

60. Functioning of Primary Agricultural credit
societies, South–Goa, 2016-17 (Concld.)
(Amount in Crores)
Sl.
No. Particulars
Primary
Agricultural
Credit
Societies
Farmers
Service
Societies
Total
1 2 3 4 5
8. Borrowings 3.7522 0.0000 3.7522
(i) Government 0.0051 0.0000 0.0051
(ii) Central Finance agencies 0.0000 0.0000 0.0000
(iii) Others 3.7471 0.0000 3.7471
9. Loans outstanding 10.4486 0.0000 10.4486
10. Loans overdue 1.5515 0.0000 1.5515
11. Investments 3.3264 0.0000 3.3264
12. Sales 6.9983 0.0000 6.9983
(i) Agricultural requisites 0.2740 0.0000 0.2740
(ii) Consumer goods 6.7242 0.0000 6.7242
13. Profits
(i) No. of Societies 21 0 21
(ii) Amount 1.5004 0.0000 1.5004
14. Loss
(i) No. of Societies 11 0 11
(ii) Amount 0.33 0.0000 0.33
Source: Office of the Registrar of Co-operative Societies, Panaji, Goa.
-87-
XIII PRICES
61. Consumer price index numbers for the middle
Class non-manual employees in Goa, 2016.
(Revised Base : 1982-83 = 100 w.e.f. July 1990 onwards)
Month/
Year
General Index Food,
Beverages
& Tobacco
Index
Fuel &
Light Index Old Base Revised
Base
1 2a 2b 3 4
January, 2016 4033 1456 1832 791
February, 2016 4061 1466 1847 791
March, 2016 4069 1469 1857 792
April, 2016 4080 1473 1860 793
May, 2016 4086 1475 1862 793
June, 2016 4091 1477 1865 795
July, 2016 4100 1480 1873 794
August, 2016 4116 1486 1880 795
September, 2016 4094 1478 1874 795
October, 2016 4105 1482 1879 797
November, 2016 4080 1473 1854 798
December, 2016 4149 1498 1893 798
Average for the year
2016 4089 1476 1865 794
Contd.
-88-

61. Consumer price index numbers for the middle class
non-manual employees in Goa, 2016 (Concld.)
(Revised Base : 1982-83 = 100 w.e.f. July 1990 onwards)
Month/
Year
Housing
Index
Clothing
Bedding &
Footwear
Index
Miscellaneous
Index
1 5 6 7
January, 2016 531 1153 1420
February, 2016 531 1144 1431
March, 2016 531 1151 1425
April, 2016 531 1155 1432
May, 2016 531 1158 1436
June, 2016 531 1154 1438
July, 2016 536 1148 1433
August, 2016 536 1153 1440
September, 2016 536 1145 1424
October, 2016 536 1149 1430
November, 2016 536 1160 1435
December, 2016 536 1171 1457
Average for the
year 2016 534 1153 1433
Note:- 1) Applied conversion factor 2.77 to col.2(b) to derive index on Old
Base, 1966=100.
2) This index number series is being compiled by the Directorate of
Planning, Statistics and Evaluation, Panaji Goa. Prices are collected
on weekly and monthly basis from a number of retail shops in Goa
State.
-89-
62. Consumer price index numbers for industrial
workers (Labour class) in Goa, 2016.
(Revised Base : 2001=100 w.e.f. Jan’2006 onwards)
Month/
Year
General Index
Food
group
Index
Pan,
Supari,
&
Intox-
icants
Index
Old Base (1966=100)
Revised
base (1982=100)
Revised
Base (2001=100)
1 2a 2b 2c 3 4
January, 2016 5284 1554 278 316 212
February, 2016 5284 1554 278 316 212
March, 2016 5322 1565 280 319 213
April, 2016 5474 1610 288 335 213
May, 2016 5588 1643 294 338 216
June, 2016 5645 1660 297 344 217
July, 2016 5664 1666 298 345 220
August, 2016 5645 1660 297 343 220
September, 2016 5607 1649 295 338 220
October, 2016 5474 1610 288 323 220
November, 2016 5227 1537 275 313 211
December, 2016 5417 1593 285 317 222
Average for the
year 2016 5469 1609 288 329 216
Contd.
-90-

62. Consumer price index numbers for the industrial
workers (Labour class) in Goa, 2016 (Concld.)
(Revised Base : 2001=100 w.e.f. Jan’2006 onwards)
Month/
Year
Fuel &
Light
Index
Housing
Index
Clothing,
Bedding
&
Footwear
Index
Miscellaneous
Index
1 5 6 7 8
January, 2016 201 320 230 222
February, 2016 201 320 230 222
March, 2016 200 320 230 222
April, 2016 200 320 231 218
May, 2016 302 320 231 227
June, 2016 304 320 231 227
July, 2016 302 326 231 227
August, 2016 302 326 231 226
September, 2016 300 326 231 227
October, 2016 301 326 231 227
November, 2016 301 326 230 221
December, 2016 305 326 229 226 Average for the
year 2016 268 323 231 224
Note:- 1) Applied conversion factor 3.40 to col. 2(b) to derive General Index on base,
1966=100
2) Applied conversion factor 5.59 to col. 2(c) to derive General Index on base, 1982=100
3) The industrial workers consumer price index numbers are being compiled by Labour Bureau, Shimla. The prices are however, collected by the Directorate
of Planning, Statistics & Evaluation, Porvorim - Goa and supplied weekly to the
Labour Bureau, Shimla.
-91-
63. Average retail prices of Some important commodities
Consumed by the middle class people in Goa, 2016.
(in Rs.)
Sl.
No Commodity Unit Retail prices
1 2 3 4
1. Rice kg. 33.67
2. Rice boiled ’’ 49.20
3. Wheat khandwa ’’ 30.56
4. Tur dal ’’ 146.40
5. Gram dal ’’ 100.20
6. Coconut oil ’’ 174.40
7. Vanaspati ’’ 93.69
8. Beef ’’ 231.80
9. Goat’s Meat ’’ 428.00
10. Fresh fish ’’ 100.90
11. Eggs Dozen 56.00
12. Milk buffalo Litre 48.25
13. Dry chillies Kg. 194.20
14. Masala powder ’’ 590.00
15. Potato ’’ 24.86
Contd.
-92-

63. Average retail prices of some important commodities
consumed by the middle class people in Goa, 2016 (Concld.)
(in Rs.)
Sl.
No Commodity Unit Retail Prices
1 2 3 4
16. Onion kg. 20.49
17. Tomato ” 28.39
18. Cabbage ” 27.47
19. Coconut Each 18.56
20. Banana Dozen 47.93
21. Mango Per 100 5018.18
22. Lemon Dozen 45.53
23. Cashewnuts kg. 779.50
24. Sugar ” 38.30
25. Gur ” 47.75
26. Cashew liquor 750 ml. 150.00
27. Tea leaf kg. 278.75
28. Fire wood 15 kgs. 121.80
29. Kerosene Litre 15.83
30. Electricity K. watts 1.30
Source: Directorate of Planning, Statistics and Evaluation, Porvorim – Goa.
-93-
64 . Average wholesale prices of some important commodities in
Panaji, Margao & Mapusa towns, 2016.
(in Rs.)
Sl.
No Commodity Unit Panaji Margao Mapusa
1 2 3 4 5 6
1. Rice - Raw, fine Quintal 3595.83 3582.34 3579.17
2. Rice - Raw, coarse ’’ 2752.08 2736.38 2743.75
3. Wheat - khandwa ’’ 2864.58 2893.67 2906.25
4. Tur dal ’’ 14121.08 14115.64 14108.33
5. Gram dal ’’ 9747.92 9723.21 9762.50
6. Coconut oil 15 kgs. 1800.00 1816.65 1804.17
7. Dry chillies –Byadgi Quintal 17108.33 16966.42 16812.50
8. Salt - local Bag of 60
kgs. 622.92 610.26 614.58
9. Coconut Per 1000 12529.17 12132.43 11741.67
10. Pepper kg. 976.21 965.37 979.75
11. Banana (Sal dati - Local) Per 100 302.08 305.68 298.54
12. Cashewnut with husk kg. 625.00 626.33 625.00
13. Cashew liquor 18 bottles
of 750 ml. 2610.00 2675.00 2520.00
14. Tiles Per 1000 9455.21 10459.56 9448.96
15. Cement Bag of 50
kgs. 341.25 363.64 359.67
16. Firewood Khandi N.R/N.A 3065.38 N.R/N.A
Source: Directorate of Planning, Statistics and Evaluation, Porvorim - Goa.
N.R/N.A - Not Reported/Not Available
-94-

XIV TRANSPORT AND COMMUNICATION
65. Length of roads by type of surface 2013-14.
( in kms.)
Sl.
No Category
Total
Length
Surface Roads
Cement
Concrete
Black
Topped
1 2 3 4 5
1. Roads under PWD 5044.58 0.38 4333.88
2. Roads under Municipalities 1234.18 29.95 1049.70
3. Roads under Panchayats 1148.002 10.095 423.692
4. Roads under Forest 146.415 - 56.823
Total Roads 7573.177 40.425 5864.095
Sl.
No Category
Unsurfaced Roads
Water
Bound
Macadem
Motorable Non
Motorable
(1) (2) 6 7 8
1. Roads under PWD 40.93 669.39 -
2. Roads under Municipalities 78.69 73.56 2.28
3. Roads under Panchayats 178.895 370.798 164.522
4. Roads under Forest - 76.292 13.3
Total Roads 298.515 1190.04 180.102
Source 1) Public Works Department
(2) Directorate of Municipal Admn
(3) Directorate of Panchayats
(4) Department of Forests.
-95-
66. Talukawise length of roads under Village
Panchayats 2013-14.
( in kms.)
Sl.
No Category
Total
Length
Surface Roads
Cement
Concrete
Black
topped
1 2 3 4 5
1. Goa
A. North Goa
1 Tiswadi 95.000 2.000 28.000
2 Bardez 118.780 4.610 58.320
3 Pernem 7.060 - -
4 Bicholim 291.022 2.965 81.612
5 Sattari 624.650 0.320 227.610
B. South Goa
6 Sanguem 6.600 - 6.400
7 Ponda 4.040 - -
8 Dharbandora 4.090 - -
9 Canacona 0.820 - -
10 Quepem 23.700 - 19.700
11 Salcete - - -
12 Mormugao 2.350 0.200 2.050
Total 1148.002 10.095 423.692
Contd.
-96-

66. Talukawise length of roads under Village
Panchayats 2013-14 (Concld.)
(in kms.)
Sl.
No Category
Unsurfaced Roads
Water
Bound
Macadem
Motorable Non-
motorable
1 2 6 7 8
1. Goa
A. North Goa
1 Tiswadi 0.500 42.00 7.500
2 Bardez 2.000 37.780 16.070
3 Pernem - - -
4 Bicholim 30.015 125.545 50.885
5 Sattari 144.380 164.473 87.867
B. South Goa
6 Sanguem - - 0.200
7 Ponda - - -
8 Dharbandora - - -
9 Canacona - - -
10 Quepem 2.000 1.000 1.000
11 Salcete - - -
12 Mormugao - - 1.000
Total 178.895 370.798 164.522
Source: Directorate of Panchayats.
-97-
67. Number of Motor Vehicles Registered during 2016-17.
Sl.
No. Type of Vehicle
No. of vehicles
1 2 3
1. Motor Cycles on hire 1746
2. Motor Cycles and Scooters 56926
3. Private Cars and Jeeps 18267
4. Motor Cabs (Taxis) 1269
5. Goods Vehicles 1530
6. Buses/Mini-Buses(including KTC) 385
7. Tractors/Others 168
8. Autorickshaws
107
9. Govt. Vehicles
05
Total 80403
Source: Directorate of Transport
-98-

68. Number of Motor Vehicles on Live Register 2016-17.
Sl.
No Type of Vehicle No. of vehicles
1 2 3
1. Motor Cycles on hire 27073
2. Motor Cycles and Scooters 853421
3. Private Cars and Jeeps 251034
4. Motor Cabs (Taxis) 19698
5. Goods Vehicles 62363
6. Buses/Mini-Buses ( including KTC) 11888
7. Tractors/others 3888
8. Autorickshaws 4411
9. Government Vehicles 4868
Total 1238644
Source: Directorate of Transport
-99-
69. Number of Motor Vehicles in Operation 2016-17.
Sl.
No Type of Vehicle No. of Vehicles
1 2 3
1. Motor Cycles on hire 27034
2. Motor Cycles and Scooters 852441
3. Private Cars and Jeeps 249726
4. Motor Cabs (Taxis) 19545
5. Goods Vehicles 62064
6. Buses/Mini-Buses (including KTC) 11831
7. Tractors/ Others 3666
8. Autorickshaws 4336
9. Government vehicles 4832
Total 1235475
Source : Directorate of Transport
-100-

70. Distance from Panaji town to other towns by Road 2016-17.
Sl.
No
Name of the
Town Route Kms. Miles*
1 2 3 4 5
1. Margao Via Ponda 47 29.21
2. Margao Via Agacaim-Cortalim 33 20.51
3. Vasco-da-Gama Via Agacaim-Cortalim 27 16.78
4. Ponda Via Ribandar-Old Goa 29 18.02
5. Quepem Via Ponda-Sanvordem 71 44.13
6. Quepem Via Agacaim-Cortalim-Margao 48 29.83
7. Sanguem Via Ponda-Sanvordem 70 43.51
8. Sanguem Via Agacaim-Cortalim-Margao 61 37.91
9. Chauri(Canacona) Via Ponda-Margao 88 54.69
10. Chauri(Canacona) Via Agacaim-Cortalim-Margao 70 43.51
11. Valpoi Via Ponda-Usgao 60 37.29
12. Valpoi Via Betim-Bicholim-Sanquelim 55.7 34.62
13. Mapusa Via Betim 12 7.46
14. Bicholim Via Mapusa 33 20.51
15. Pernem Via Mapusa 25 15.54
*MILES = KMS. DIVIDED BY 1.609
Source: Public Works Department
-101-
71. Details of Navigability of inland waterways of Goa rivers
for the year 2016-17.
River
Navigability limits for Small
Country craft
Navigability limits for
large country craft and
mine ore Barges
Upto
Approx.distance
from mouth of
river or that its
tributary dis-
tance from main
river
(in kms)
Upto
Approx.dist-
ance from
mouth of
river or that
its tributary
distance
from main
river (km)
Tiracol Bandem
Sawantwadi 27 Torxem 23
Chapora Ibrahimpur 32 Salem 29
Mandovi
Zaranim via
Goa Br. To
S. of Isle of
Diwar
66
Gangem
via Goa
Br. To S.
of Isle of
Diwar
48
Naroa
branch of
Mandovi
river to N.
of isle of
Diwar
Fully
navigable 10
Fully
navigable 10
Candepar
branch Santana 26 Pilliem 13
Contd.
-102-
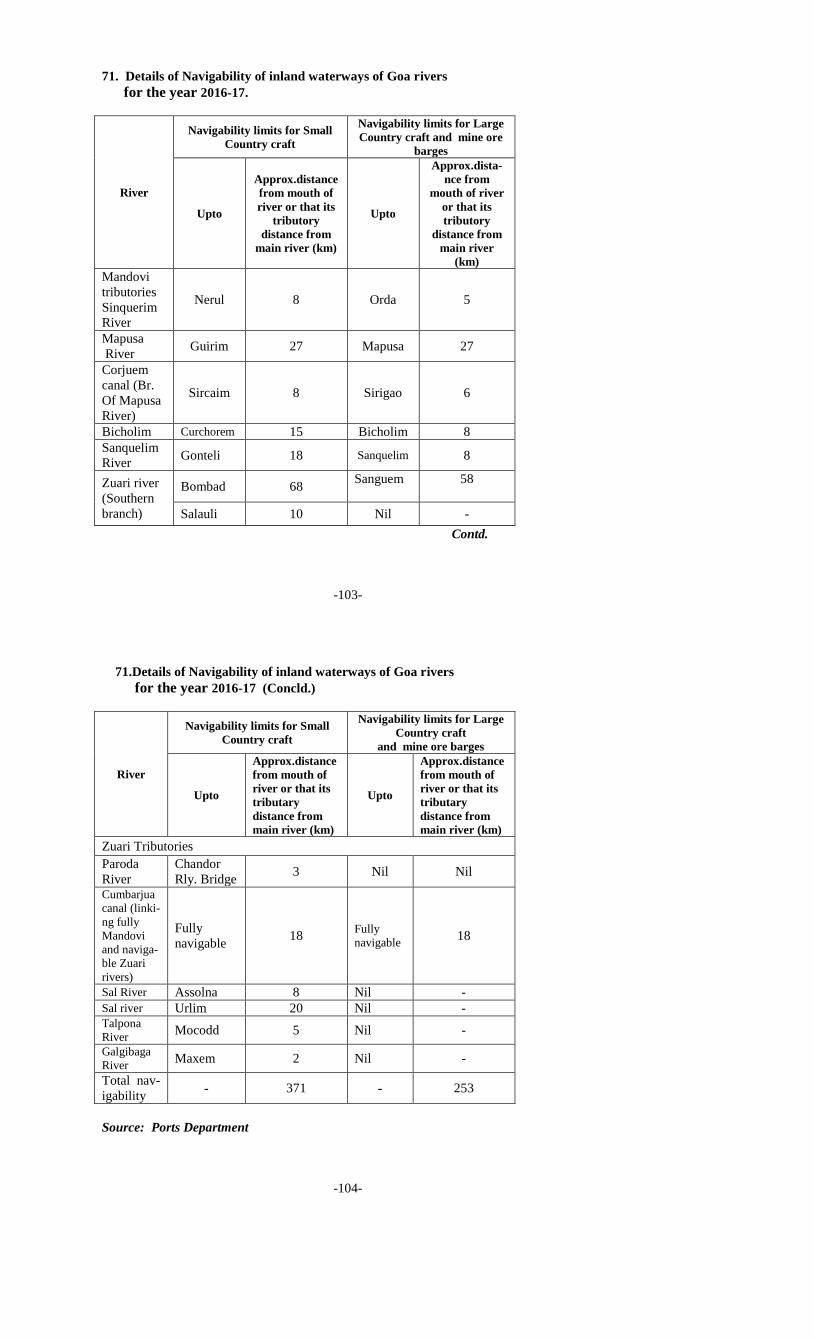
71. Details of Navigability of inland waterways of Goa rivers
for the year 2016-17.
River
Navigability limits for Small
Country craft
Navigability limits for Large
Country craft and mine ore
barges
Upto
Approx.distance
from mouth of
river or that its
tributory
distance from
main river (km)
Upto
Approx.dista-
nce from
mouth of river
or that its
tributory
distance from
main river
(km)
Mandovi
tributories
Sinquerim
River
Nerul 8 Orda 5
Mapusa
River Guirim 27 Mapusa 27
Corjuem
canal (Br.
Of Mapusa
River)
Sircaim 8 Sirigao 6
Bicholim Curchorem 15 Bicholim 8
Sanquelim
River Gonteli 18 Sanquelim 8
Zuari river
(Southern
branch)
Bombad 68 Sanguem
58
Salauli 10 Nil -
Contd.
-103-
71.Details of Navigability of inland waterways of Goa rivers
for the year 2016-17 (Concld.)
River
Navigability limits for Small
Country craft
Navigability limits for Large
Country craft
and mine ore barges
Upto
Approx.distance
from mouth of
river or that its
tributary
distance from
main river (km)
Upto
Approx.distance
from mouth of
river or that its
tributary
distance from
main river (km)
Zuari Tributories
Paroda
River
Chandor
Rly. Bridge 3 Nil Nil
Cumbarjua
canal (linki-
ng fully
Mandovi
and naviga-
ble Zuari
rivers)
Fully
navigable 18
Fully
navigable 18
Sal River Assolna 8 Nil -
Sal river Urlim 20 Nil - Talpona
River Mocodd 5 Nil -
Galgibaga
River Maxem 2 Nil -
Total nav-
igability - 371 - 253
Source: Ports Department
-104-

72. Table showing the number of ferry boats operating
on various routes of Goa 2016-17.
Sl.
No Name of the route
Number of
Ferry boats
operating
2016-17
A MANDOVI RIVER
1. Panaji-Betim 3
2. Ribandar-Chorao 5
3. Vaxim-Amboi 1
4. Old Goa- Piedade 2
5. St. Pedro-Diwar 2
6. Sarmanaus-Tonca 2
7. Amona-Khandola -
8. Pomburpa-Chorao 1
9. Calvim-Carona -
10. Aldona-Corjuem -
11. Narva-Diwar 1
12. Volvoi-Surla-Maina 2
13. Cumbarjuem-Gaundalim 1
14. Tolto-Dhauji 1
TOTAL (A) 21
Contd.
-105-
72.Table showing the number of ferry boats operating
on various routes of Goa 2016-17 (Concld.)
Sl.
No Name of the route
Number of
Ferry boats
operating
2016-17
B ZUARI RIVER
1. Cortalim-Madkai 2
2. Durbhat-Rassaim 2
3. Dona Paula-Mormugao -
4. Raia-Shiroda 2
5. Agassim-Cortalim -
6. Adpai-Rassai 1
TOTAL (B) 7
C CHAPORA RIVER
1. Siolim-Chopdem -
2. Camurlim-Tuem 1
TOTAL (C) 1
D TIRACOL RIVER
1. Kerim-Tiracol 1
2. Kiranpani-Aronda -
TOTAL (D) 1
E SAL RIVER
1. Cavelossim-Assolna -
TOTAL (E) 0
GRAND TOTAL (A+B+C+D+E) 30
Source: Ports Department
-106-

73 . Road traffic accidents during the year 2016-17.
Sl.
No. Year / Item Goa
North
Goa
South
Goa
1 2 3 4 5
1. No. of motor accident cases
reported 4247 1894 2353
2. No. of Persons killed in motor
Accidents 337 149 188
3. No. of Persons injured in motor
Accidents 2020 700 1320
4. No. of vehicles involved in road
traffic accidents 7100 3287 3813
Source: Police Department.
-107-
74. Number of Post offices, Telephone exchanges, Telephone
Sets and Public call offices, for the year 2016-17.
Sl.
No Item
North
Goa
South
Goa Total
1 2 3 4 5
I
Post Offices
i) Urban 28 26 54
ii) Rural 130 73 203
II Letter boxes 297 585 882
III Exchanges
i) Telephone exchanges 90 54 144
V
Telephones
i) Telephone sets
(Telephone Connections) 64096 52428 116524
VI Public call offices
(STD/PCOs) 635 339 974
Source: (1) Office of the Sr. Superindent of Post, Mapusa ;
(2) Office of the GM (Telecom), BSNL, Panaji.
-108-

XV POLICE,CRIMES AND PRISONS
75. Number of police stations with staff strength
and crimes reported during 2016-17.
Sl.
No. Item
North
Goa
South
Goa Goa
1 2 3 4 5
1. Police Stations 11 16 27
2. Police Out-posts 16 26 42
3. Existing Strength of staff
including Officers 1409 1308 2717
4. Cognizable crimes reported during the year
a. Rioting 83 50 133
b. Murder 13 15 28
c. Kidnapping / abducting 59 46 105
d. Dacoity 2 1 3
e. Robbery 9 10 19
f. House breaking 92 80 172
g. Cheating 85 71 156
h. Criminal breach of trust 28 15 43
i. Thefts 250 200 450
j. Other crimes 830 882 1712
TOTAL (4) 1451 1370 2821
Source: Police Department.
-109-
76. Number of Prisons & Prisoners in jails 2016-17.
Sl.
No. Item
Central Jail,
Colvale
Sub Jail cum
Judicial Lockup,
Sada, Vasco
Male Male Female
1 2 3 4
1. Places of confinement Colvale Sub Jail, Sada
2. Prisoners at the
beginning of the year 212 181 30
3. Prisoners admitted
during the year 499 377 36
4. Total (2+3) 711 558 66
5. Number of prisoners
discharged 474 458 36
6. Balance at the end of
the year (4-5) 237 100 30
Source: Inspectorate General of Prisons.
-110-

XVI TOURISM
77. Talukawise number of boarding and lodging
houses and total bed capacity, 2016-17.
Sl.
No.
State/District/
Taluka
Number of
Hotels Beds
1 2 3 4
1. Goa 3506 63458
(i)
North Goa 2794 41728
Tiswadi 336 9927
Bardez 2163 29781
Pernem 281 1774
Bicholim 10 204
Sattari 4 42
(ii) South Goa 712 21730
Sanguem 2 12
Ponda 25 889
Dharbandora 6 307
Canacona 62 1270
Quepem 6 206
Salcete 533 16513
Mormugao 78 2533
Source: Directorate of Tourism
-111-
78. Talukawise number of foreign and domestic tourists
arrival during 2016-17.
Sl.
No
State/District/
Taluka
Number of
Domestic
Tourists
Foreign
Tourists
1 2 3 4
1. Goa 5686761 735676
(i) North Goa 4469468 439060
Tiswadi 2058887 220029
Bardez 1927817 166405
Pernem 457411 40065
Bicholim 13857 5589
Sattari 0 0
(ii) South Goa 1217293 296616
Sanguem 26219 8439
Ponda 11496 6972
Dharbandora 0 0
Canacona 38284 22949
Quepem 0 0
Salcete 1091230 229258
Mormugao 61560 35970
Source: Directorate of Tourism
-112-

XVII FOREIGN TRADE
79. Commodity-wise (G.R.T.) distribution of ships handled
at Mormugao Port, 2016-17.
{G.R.T. i. e. Gross Registered Tonnage in ‘000 tonnes)
Sl.
No.
Commodity
2016-17
No. of ships G.R.T.
1 2 3 4
I.
EXPORTS
a) Iron ore & iron ore pellets 154 6683777
b) Other ores 0 0
c) Alumina 4 77924
d) Others 175 2973440
II.
TOTAL (a to d) 333 9735141
IMPORTS
a) P.O.L. 78 2051081
b) Liquid chemicals 33 544864
c) Fertilizers 11 215057
d) Coal & coke 198 9031134
e) Others 107 3208972
TOTAL (a to e) 427 15051108
III TOTAL ( I + II ) 760 24786249
IV Vessels not handled any Cargo(pax vls). 36 1966462
V GRAND TOTAL ( III + IV ) 796 26752711
Source: Mormugao Port Trust
-113-
80A. Commodity-wise foreign/coastal distribution of the
traffic handled by Indian & foreign ships at
Mormugao Port, (Exports) 2016-17
(Qty in MetricTonnes)
Type of
Commodity
Coastal
Total
Foreign
By
Indian
Ships
By
Foreign
ships
By
Indian
Ships
By
Foreign
ships
Total
1 2 3 4 5 6 7
EXPORTS
Iron ore 0 87450 87450 507935 14127466 14635401
Iron ore
Pellets 0 0 0 0 0 0
Total 0 87450 87450 507935 14127466 14635401
Granite 0 0 0 0 290322 290322
Container
Cargo 15858 2959 18817 32888 80294 113182
Tareweight
of Container 1714 374 2088 14038 19984 34022
Iron & Steel 8875 28618 37493 0 103415 103415
H.R. Coils 36157 43019 79176 29796 1711728 1741524
Calcined
Alumina 0 0 0 0 47150 47150
Pig Iron/slag 0 0 0 0 140350 140350
Machinery 31 1055 1086 0 1405 1405
Total 62635 76025 138660 76722 2394648 2471370
Total Exports 62635 163475 226110 584657 16522114 17106771
Contd.
-114-

80A. Commodity-wise foreign/coastal distribution of the
traffic handled by Indian & foreign ships at
Mormugao Port, (Exports) 2016-17 (Concld.)
(Qty in Metric Tonnes)
Type of Commodity
Total
Total By Indian
ships
By Foreign
ships
1 8 9 10
EXPORTS
Iron ore 507935 14214916 14722851
Iron ore pellets 0 0 0
Total 507935 14214916 14722851
Granite 0 290322 290322
Container cargo 48746 83253 131999
Tareweight of Container 15752 20358 36110
Iron & Steel 8875 132033 140908
H.R. Coils 65953 1754747 1820700
Calcined Alumina 0 47150 47150
Pig Iron/slag 0 140350 140350
Machinery 31 2460 2491
Total 139357 2470673 2610030
Total Exports 647292 16685589 17332881
Source: Mormugao Port Trust
-115-
80B. Commodity-wise foreign/coastal distribution of the
traffic handled by Indian & foreign ships at
Mormugao Port (Imports) 2016-17. (Qty in Metric Tonnes)
Type of
Commodity
Coastal
Total
Foreign
Total By
Indian
Ships
By
Foreign
ships
By
India
n
Ships
By
Foreign
ships
1 2 3 4 5 6 7
IMPORTS
P.O.L. 575833 41706 617539 0 9012 9012
Phosphoric
acid 0 0 0 0 335703 335703
Caustic
soda 0 0 0 0 20315 20315
Ammonia 0 0 0 0 62452 62452
Other Oil 0 0 0 0 25891 25891
MOP 0 0 0 0 179045 179045
Urea 0 0 0 0 20513 20513
Coking
coal 60030 56901 116931 0 8348699 8348699
Met. Coke 0 0 0 91905 879367 971272
R.P. Coke 0 0 0 0 802835 802835
Thermal
coal 0 0 0 0 2513933 2513933
Contd.
-116-

80B. Commodity wise foreign/coastal distribution of the
traffic handled by Indian & foreign ships at
Mormugao Port (Imports) 2016-17. (Qty in Metric Tonnes)
Type of
Commodity
Coastal Total Foreign
Total By
Indian
Ships
By
Foreign
ships
By
Indian
Ships
By
Foreign
ships
1 2 3 4 5 6 7
IMPORTS
Container 53682 16218 69900 45422 83732 129154
Tareweight of
Container 5132 1503 6635 11849 16984 28833
Iron Ore 0 0 0 0 330282 330282
Nickel 0 0 0 0 6617 6617
Bentonite 1800 0 1800 0 0 0
Wood Chips 0 0 0 0 368694 368694
Limestone 0 0 0 138641 670338 808979
H.R. Coils 3776 0 3776 0 0 0
Machinery 711 500 1211 0 0 0
Gypsum 0 0 0 0 68400 68400
Total Imports 700964 116828 817792 287817 14742812 15030629
Total Exports
& Imports 763599 280303 1043902 872474 31264926 32137400
Transhipment
of liquid cargo 0 0 0 0 0 0
Total traffic 763599 280303 1043902 872474 31264926 32137400
Contd.
-117-
80B. Commodity-wise foreign/coastal distribution of the
traffic handled by Indian & foreign ships at
Mormugao Port (Imports) 2016-17.
(Qty in Metric Tonnes)
Type of
Commodity
Total
Total By Indian Ships By Foreign Ships
1 8 9 10
IMPORTS
P.O.L. 575833 50718 626551
Phosphoric acid 0 335703 335703
Caustic soda 0 20315 20315
Ammonia 0 62452 62452
Other oil 0 25891 25891
MOP 0 179045 179045
Urea 0 20513 20513
Coking coal 60030 8405600 8465630
Met. Coke 91905 879367 971272
R.P. Coke 0 802835 802835
Thermal coal 0 2513933 2513933
Contd.
Source: Mormugao Port Trust
-118-
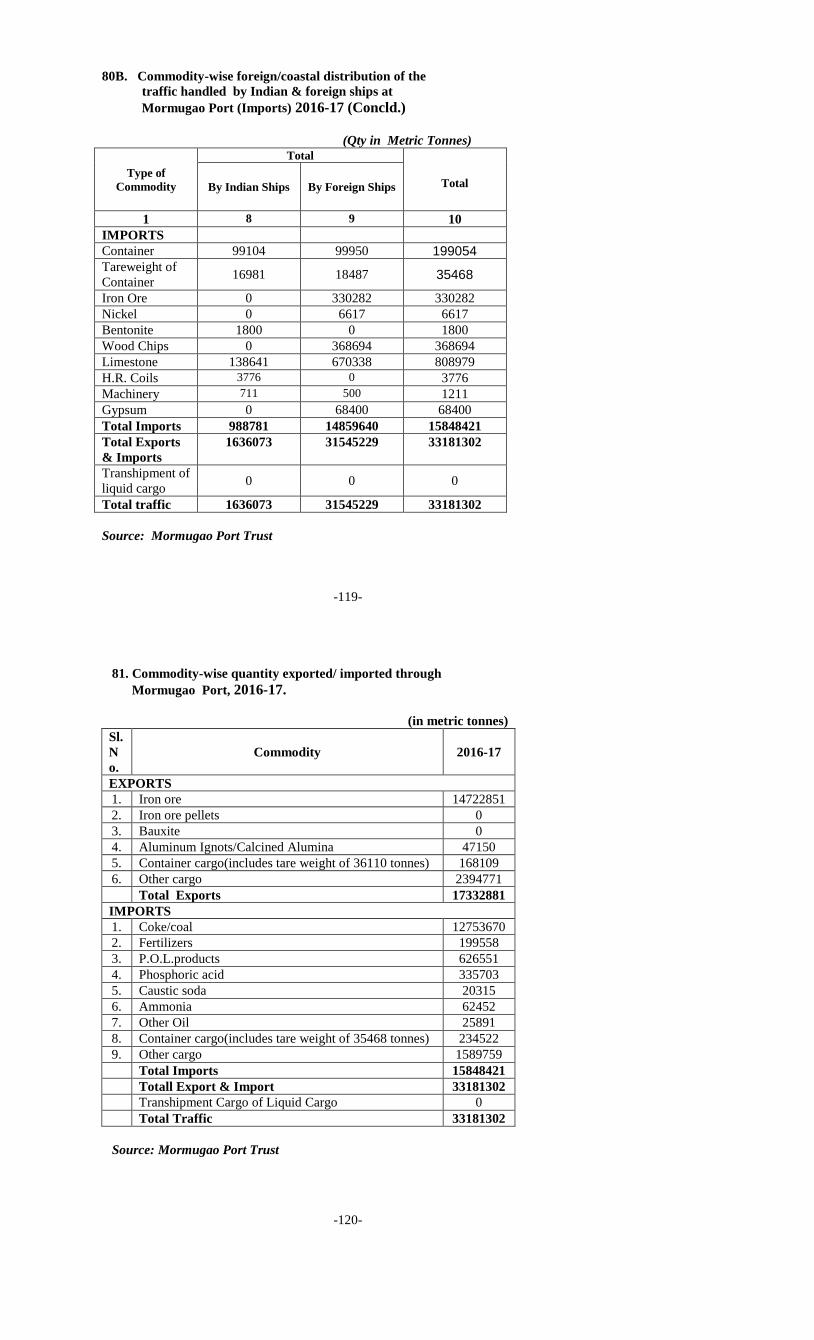
80B. Commodity-wise foreign/coastal distribution of the
traffic handled by Indian & foreign ships at
Mormugao Port (Imports) 2016-17 (Concld.)
(Qty in Metric Tonnes)
Type of
Commodity
Total
Total By Indian Ships By Foreign Ships
1 8 9 10
IMPORTS
Container 99104 99950 199054
Tareweight of
Container 16981 18487 35468
Iron Ore 0 330282 330282
Nickel 0 6617 6617
Bentonite 1800 0 1800
Wood Chips 0 368694 368694
Limestone 138641 670338 808979
H.R. Coils 3776 0 3776
Machinery 711 500 1211
Gypsum 0 68400 68400
Total Imports 988781 14859640 15848421
Total Exports
& Imports
1636073 31545229 33181302
Transhipment of
liquid cargo 0 0 0
Total traffic 1636073 31545229 33181302
Source: Mormugao Port Trust
-119-
81. Commodity-wise quantity exported/ imported through
Mormugao Port, 2016-17.
(in metric tonnes)
Sl.
N
o.
Commodity 2016-17
EXPORTS
1. Iron ore 14722851
2. Iron ore pellets 0
3. Bauxite 0
4. Aluminum Ignots/Calcined Alumina 47150
5. Container cargo(includes tare weight of 36110 tonnes) 168109
6. Other cargo 2394771
Total Exports 17332881
IMPORTS
1. Coke/coal 12753670
2. Fertilizers 199558
3. P.O.L.products 626551
4. Phosphoric acid 335703
5. Caustic soda 20315
6. Ammonia 62452
7. Other Oil 25891
8. Container cargo(includes tare weight of 35468 tonnes) 234522
9. Other cargo 1589759
Total Imports 15848421
Totall Export & Import 33181302
Transhipment Cargo of Liquid Cargo 0
Total Traffic 33181302
Source: Mormugao Port Trust
-120-

82A. Trade (Imports ) through Mormugao Port
by Principal Countries, 2016-17.
(Qty. in 000’ tonnes)
Sl.
No. Origin Quantity
1. Australia 7683
2. Belgium 16
3. Benin 4
4. Brazil 42
5. Chile 20
6. China 518
7. Canada 288
8. Germany 3
9. Ghana 7
10. Indonesia 842
11. Iran 15
12. Israel 44
13. Japan 3
14. Jordan 145
15. Korea 1
16. Mauritania 1
17. Morocco 309
18. Mozambique 624
Tare weight not included Contd.
Source: Mormugao Port Trust
-121-
82A . Trade (Imports ) through Mormugao Port
by Principal Countries, 2016-17 (Concld.)
(Qty. in 000 tonnes)
Sl.
No. Origin Quantity
19. Netherlands 3
20. Oceania Pis 1
21. Oman 303
22. Phillippines 70
23. Qatar 56
24. Russia 497
25. Singapore 2
26. Saudi Arabia 39
27. South Africa 2098
28. Sri Lanka 55
29. Togo 1
30. Thailand 1
31. UAE 447
32. USA 844
33. UK 3
34. Vietnam 17
35. Coastal 811
TOTAL 15813
Tare weight not included
Source: Mormugao Port Trust
-122-

82B . Trade (Exports ) through Mormugao Port
by Principal Countries, 2016-17 (Qty. in 000’ tonnes)
Sl.
No. Destinations Quantity
1. Africa 1
2. Australia 2
3. Bangladesh 21
4. Belgium 632
5. Burma 15
6. Canada 1
7. China 14346
8. France 21
9. Germany 2
10. Ghana 3
11. Guinea 1
12. Italy 412
13. Indonesia 55
14. Ireland 1
15. Japan 386
16. Korea 6
17. Kenya 66
18. Mozambique 1
19. Mexico 44
20. Malaysia 148
21. New Zealand 1
22. Nigeria 2
23. Oman 1
24. Philippines 1
25. Portugal 82
26. Qatar 1
27. Saudi Arabia 1
28. Singapore 3
29. Spain 397
30. Sri Lanka 2
31. Sudan 5
32. Tanzania 2
33 Thailand 99
34. Togo 1
35. UAE 101
36. Uganda 1
37. UK 87
38. USA 91
39. Vietnam 31
40. Coastal 224
TOTAL 17297
Tare weight not included
Source: Mormugao Port Trust
-123-
83A. Commodity-wise & month-wise export trade through
Mormugao Port, 2016-17. ( in metric tonnes)
Sl.
No Commodity April May June July
1 2 3 4 5 6
EXPORT
Ores and Allied Products
1. IronOre 1777786 1737954 346959 54790
2. Iron Ore pellets 0 0 0 0
3. Total (1+2) 1777786 1737954 346959 54790
4. Bauxite 0 0 0 0
5. Total Ores(3+4) 1777786 1737954 346959 54790
General cargo
6. Container cargo 9447 12140 7056 7049
7. Container Tare Weight 2897 2706 2989 2359
8. Calcined Allumina 0 5250 0 5150
9. Granite 21258 33439 29229 22988
10. H.R.Steel Coils 80299 84598 64323 116900
11. Iron and Steel 0 20124 11702 8698
12. Machinery 0 0 1095 1055
13. Pig Iron 0 22000 0 20000
14. Total (6 to 13) 113901 180257 116394 184199
15. Total Exports (5+14) 1891687 1918211 463353 238989
Contd.
-124-

83A. Commodity- wise &month-wise exports trade through
Mormugao Port, 2016-17.
(in metric tonnes)
Sl.
No Commodity Aug. Sept. Oct. Nov.
1 2 7 8 9 10
Export
Ores and Allied Products
1. IronOre 0 54411 964398 1808889
2. Iron Ore pellets 0 0 0 0
3. Total (1+2) 0 54411 964398 1808889
4. Bauxite 0 0 0 0
5. Total Ores(3+4) 0 54411 964398 1808889
General cargo
6. Container cargo 6891 12241 18185 18148
7. Container Tare Weight 2609 3346 3174 3834
8. Calcined Allumina 0 15750 0 0
9. Granite 37602 28699 0 26154
10. H.R. steel coils 166094 174220 147400 193555
11. Iron and steel 19177 0 249 10025
12. Machinery 310 18 0 0
13. Pig Iron 20000 0 0 0
14. Total (6 to 13) 252683 234274 169008 251716
15. Total Exports (5+14) 252683 288685 1133406 2060605
Contd.
-125-
83A. Commodity wise & month wise exports trade through
Mormugao Port, 2016-17 (Concld.)
(in metric tonnes)
Source: Mormugao Port Trust
-126-
Sl.
No Commodity Dec Jan Feb Mar Total
1 2 11 12 13 14 15
Export
Ores and Allied Products
1. IronOre 2343407 1768726 1428458 2437073 14722851
2. Iron Ore pellets 0 0 0 0 0
3. Total (1+2) 2343407 1768726 1428458 2437073 14722851
4. Bauxite 0 0 0 0 0
5. Total Ores(3+4) 2343407 1768726 1428458 2437073 14722851
General cargo
6. Container cargo 14134 9522 7488 9698 131999
7. Container Tare Weight 4359 3608 2416 1813 36110
8. Calcined Allumina 0 5474 5026 10500 47150
9. Granite 45863 0 45090 0 290322
10. H.R. Steel Coils 175142 188466 170280 259423 1820700
11. Iron and steel 0 10540 39503 20890 140908
12. Machinery 0 0 0 13 2491
13 Pig Iron 0 22000 23874 32476 140350
14. Total (6 to 13) 239498 239610 293677 334813 2610030
15. Total Exports (5+14) 2582905 2008336 1722135 2771886 17332881

83B. Commodity-wise & month-wise imports trade through
Mormugao Port, 2016-17.
(in metric tonnes)
Sl.
No Commodity
April
May
June
July
1 2 3 4 5 6
Import Liquid Bulk
1. Caustic soda 6959 7355 0 0
2. Liquid ammonia 9400 4001 4000 2951
3. Edible Oil 0 0 2993 0
4. Phosphoric acid 21416 37510 29328 8386
5. P.O.L. 60231 51107 42693 35695
6. Total (1 to 5) 98006 99973 79014 47032
Fertilizers
7. Muriate of Potash 17500 18000 19800 12500
8. Urea 0 0 0 0
9. Total (7 to 8) 17500 18000 19800 12500
Other General Cargo
10. Coke raw. Pet. 59999 25000 123864 95498
11. Met. coke 151450 87896 78166 88164
12. Thermal Coal 449443 525389 80000 224970
13. Coking Coal 632601 643051 679997 668449
14. Container cargo 24241 11309 21273 13397
15. Container Tare Weight 3419 2182 2876 2778
16. Iron Ore Pellets 0 5526 66514 75000
17. Nickel Product 0 0 0 0
18. Limestone 0 57135 34360 0
19. Gypsum 0 0 0 0
20. Machinery 253 458 0 0
21. H.R.Coils 0 0 0 0
22. Bentonite 0 0 0 0
23. Wooden Chips 0 40330 42132 26641
24. Total (10 to 23) 1321406 1398276 1129182 1194897
25. Total Imports (6+9+24) 1436912 1516249 1227996 1254429
26. Total Exports & Imports (15+25) 3328599 3434460 1691349 1493418
27. Transhipment of Cargo 0 0 0 0
28. Total Traffic (26+27) 3328599 3434460 1691349 1493418
Contd.
-127-
83B. Commodity wise & month wise imports trade through
Mormugao Port, 2016-17.
(in metric tonnes)
Contd.
Contd.
-128-
Sl.
No Commodity Aug Sept Oct Nov
1 2 7 8 9 10
Import Liquid Bulk
1. Caustic soda 0 0 6001 0
2. Liquid ammonia 0 0 9200 6000
3. Edible Oil 5891 5000 6495 0
4. Phosphoric acid 9777 39324 30540 19366
5. P.O.L 49233 61299 52560 45071
6. Total (1 to 5) 64901 105623 104796 70437
Fertilizers
7. Muriate of Potash 0 0 39000 22000
8. Urea 0 0 10985 0
9. Total (7 to 8) 0 0 49985 22000
Other General Cargo
10. Coke raw. pet 52501 78455 32488 99811
11. Met. coke 129799 140692 91905 48710
12. Thermal Coal 224815 82482 76820 55750
13. Coking coal 748372 623879 691278 633305
14. Container cargo 16631 12800 15758 16808
15. Container Tare Weight 4332 2835 2876 3746
16. Iron Ore Pellets 0 0 0 0
17. Nickel Product 0 0 6617 0
18. Limestone 0 193347 101170 211117
19. Gypsum 0 0 0 0
20. Machinery 0 0 0 0
21. H. R.Coils 0 0 0 0
22. Bentonite 0 0 0 0
23. Wooden Chips 51744 41920 40668 0
24. Total (10 to 23) 1228194 1176410 1059580 1069247
25. Total Imports (6+9+24) 1293095 1282033 1214361 1161684
26. Total Exports& Imports (15+25) 1545778 1570718 2347767 3222289
27. Transhipment of Cargo 0 0 0 0
28. Total Traffic (26+27) 1545778 1570718 2347767 3222289

83 B. Commodity wise &month wise imports trade through
Mormugao Port, 2016-17 (Concld.)
(in metric tonnes)
Sl.
No Commodity Dec Jan Feb Mar Total
1 2 11 12 13 14 15
Import Liquid Bulk
1. Caustic soda 0 0 0 0 20315
2. Liquid ammonia 4200 6500 8000 8200 62452
3. Edible Oil 0 0 5512 0 25891
4. Phosphoric acid 28263 40948 31972 38873 335703
5. P.O.L 53475 69177 46584 59426 626551
6. Total (1 to 5) 85938 116625 92068 106499 1070912
Fertilizers
7. Muriate of Potash 0 34120 0 16125 179045
8. Urea 0 0 0 9528 20513
9. Total (7 to 8) 0 34120 0 25653 199558
Other General Cargo
10. Coke raw. pet 69547 115169 50503 0 802835
11. Met. coke 46350 31500 31500 45140 971272
12. Thermal Coal 0 276946 281506 235812 2513933
13. Coking coal 763369 751455 696971 932903 8465630
14. Container cargo 22882 14325 13209 16421 199054
15. Container Tare Weight 3895 2155 1851 2523 35468
16. Iron Ore Pellets 112005 71237 0 0 330282
17. Nickel Product 0 0 0 0 6617
18. Limestone 211850 0 0 0 808979
19. Gypsum 0 31865 0 36535 68400
20. Machinery 0 500 0 0 1211
21. H.R.Coils 0 1895 1881 0 3776
22. Bentonite 0 0 0 1800 1800
23. Wooden Chips 41981 40810 27500 14968 368694
24. Total (10 to 23) 1271879 1337857 1104921 1286102 14577951
25. Total Imports (6+9+24) 1357817 1488602 1196989 1418254 15848421
26 Total Exports & Imports (15+25) 3940722 3496938 2919124 4190140 33181302
27. Transhipment of Cargo 0 0 0 0 0
28. Total Traffic (26+27) 3940722 3496938 2919124 4190140 33181302
Source : Mormugao Port Trust.
-129-
XVIII PUBLIC FINANCE
84. Budget at a Glance 2016-17.
(Rs. in lakh)
Sl.
No Item
2014-15
Actuals
2015-16
Revised
Estimates
2016-17
Budget
Estimates
1 2 3 4 5
I REVENUE ACCOUNT
1. Tax revenue and non-tax
revenue (excluding grants-in-
aid)
712211.65 830912.51 988462.19
2. Grants-in-aid & contributions 56656.20 64427.54 75733.87
3. Total revenue receipts 768867.85 895340.05 1064196.06
4. Expenditure on revenue
account 741023.44 909049.79 1048313.95
Surplus (+) or Deficit (-) (+)27844.41 (-)13709.74 (+)15882.11
II CAPITAL ACCOUNT
1. Loans and advances 995.25 1883.92 1719.88
2. Internal debt of the State Govt 213144.39 125802.50 136842.63
3. Loans & advances from Central
Government 20287.94 23637.60 24806.25
Contd.
-130-
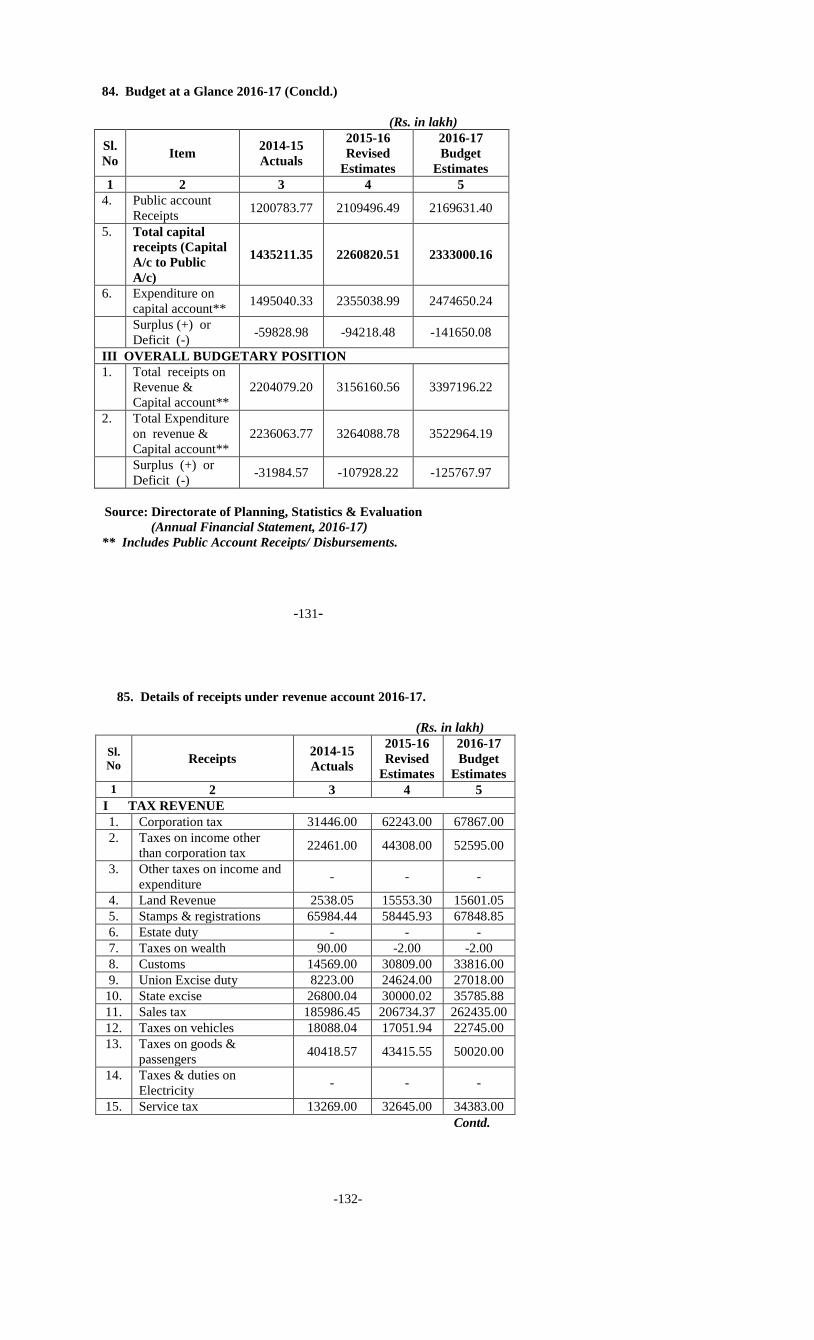
84. Budget at a Glance 2016-17 (Concld.)
(Rs. in lakh)
Sl.
No Item
2014-15
Actuals
2015-16
Revised
Estimates
2016-17
Budget
Estimates
1 2 3 4 5
4. Public account
Receipts 1200783.77 2109496.49 2169631.40
5. Total capital
receipts (Capital
A/c to Public
A/c)
1435211.35 2260820.51 2333000.16
6. Expenditure on
capital account** 1495040.33 2355038.99 2474650.24
Surplus (+) or
Deficit (-) -59828.98 -94218.48 -141650.08
III OVERALL BUDGETARY POSITION
1. Total receipts on
Revenue &
Capital account**
2204079.20 3156160.56 3397196.22
2. Total Expenditure
on revenue &
Capital account**
2236063.77 3264088.78 3522964.19
Surplus (+) or
Deficit (-) -31984.57 -107928.22 -125767.97
Source: Directorate of Planning, Statistics & Evaluation
(Annual Financial Statement, 2016-17)
** Includes Public Account Receipts/ Disbursements.
-131-
85. Details of receipts under revenue account 2016-17.
(Rs. in lakh)
Sl.
No Receipts
2014-15
Actuals
2015-16
Revised
Estimates
2016-17
Budget
Estimates
1 2 3 4 5
I TAX REVENUE
1. Corporation tax 31446.00 62243.00 67867.00
2. Taxes on income other
than corporation tax 22461.00 44308.00 52595.00
3. Other taxes on income and
expenditure - - -
4. Land Revenue 2538.05 15553.30 15601.05
5. Stamps & registrations 65984.44 58445.93 67848.85
6. Estate duty - - -
7. Taxes on wealth 90.00 -2.00 -2.00
8. Customs 14569.00 30809.00 33816.00
9. Union Excise duty 8223.00 24624.00 27018.00
10. State excise 26800.04 30000.02 35785.88
11. Sales tax 185986.45 206734.37 262435.00
12. Taxes on vehicles 18088.04 17051.94 22745.00
13. Taxes on goods &
passengers 40418.57 43415.55 50020.00
14. Taxes & duties on
Electricity - - -
15. Service tax 13269.00 32645.00 34383.00
Contd.
-132-

85. Details of receipts under revenue account, 2016-17.
(Rs. in lakh)
Sl.
No Receipts
2014-15
Actuals
2015-16
Revised
Estimates
2016-17
Budget
Estimates
1 2 3 4 5
16 Other taxes & duties on
commodities & services 49776.48 32173.08 37199.95
Total tax revenue 479650.07 598001.19 707312.73
II NON – TAX REVENUE
1. Interest receipts 1718.12 2752.70 2348.18
2. Dividends & profits 181.91 334.42 119.60
3. Public service commission 11.14 20.11 20.07
4. Police 588.92 1009.20 835.70
5. Jails 2.66 3.00 4.10
6. Supply & Disposals - - -
7. Stationery & Printing 203.51 222.12 321.00
8. Public works 327.00 244.18 478.72
9. Other adm. services 12345.00 13310.20 17647.26
10. Contribution & recoveries
towards pension & other
retirements benefits
139.24 254.00 263.00
11. Miscellaneous general
services 3901.50 4576.02 4941.02
12. Education ,sports Art &
Culture 1717.43 1950.00 1943.09
13. Medical & public health 1181.83 2710.74 2698.08
Contd.
-133-
85. Details of receipts under revenue account, 2016-17.
(Rs. in lakh)
Sl.
No Receipts
2014-15
Actuals
2015-16
Revised
Estimates
2016-17
Budget
Estimates
1 2 3 4 5
14. Family welfare 0.01 0.05 0.05
15. Water supply & sanitation 10189.33 14575.02 16262.24
16. Housing 71.44 70.31 78.18
17. Urban Development 4466.89 5350.00 5665.00
18. Information & publicity 0.11 3.30 3.30
19. Welfare of SCs, STs & OBC 64.30 0.51 0.57
20. Labour & employment 644.21 755.76 723.71
21. Social security & welfare 13.82 832.30 1229.79
22. Crop husbandry 157.53 151.37 163.01
23. Animal husbandry 180.87 264.20 267.20
24. Dairy development 71.57 90.50 121.50
25. Fisheries 266.91 302.59 255.10
26. Forestry & wildlife 429.63 415.27 389.21
27. Cooperation 93.72 64.22 86.57
28. Other Agri. programme 3.18 5.52 5.10
29. Other rural dev. Programme 2.10 3.27 1.56
30. Major & medium irrigation 1580.64 3930.21 1181.36
31. Minor irrigation 1051.61 1238.12 1058.25
32. Power 132166.47 149717.00 168775.00
Contd.
-134-

85 . Details of receipts under revenue account, 2016-17.
(Concld.)
(Rs. in lakh)
Sl.
No. Receipts
2014-15
Actuals
2015-16
Revised
Estimates
2016-17
Budget
Estimates 1 2 3 4 5
33. Village & small industries 345.72 473.67 633.11
34. Industries 30.28 15.02 14.01
35. Non-Ferrous mining &
Metallurgical industries 53034.99 20510.84 43927.50
36. Ports & light houses 786.85 1072.45 1948.00
37. Roads & bridges 3365.86 4604.71 5531.11
38. Inland Water transport 166.59 194.10 322.10
39. Tourism 846.54 690.20 690.20
40. Civil supplies 12.33 6.29 7.01
41. Other General economic
services 199.82 187.83 189.90
Total Non-Tax Revenue 232561.58 232911.32 281149.46
III GRANTS-IN-AID AND CONTRIBUTION
1. Grants-in-aid from central Govt. 56656.20 64427.54 75733.87
2. State’s share of union excise
Duties - - -
Total Grants-In-Aid and Contributions 56656.20 64427.54 75733.87
IV TOTAL REVENUE (I+II+III) 768867.85 895340.05 1064196.06
Source: Directorate of Planning, Statistics & Evaluation
(Annual Financial Statement, 2016-17)
-135-
86. Details of expenditure under revenue account 2016-17.
(Rs. in lakh )
Sl.
No Disbursement
2014-15
Actuals
2015-16
Revised
Estimates
2016-17
Budget
Estimates
1 2 3 4 5
I NON –
DEVELOPMENT
EXPENDITURE
236952.81 263520.47 310650.62
A. GENERAL
SERVICES 236952.81 263520.47 310650.62
1. Parliament/State/Union
Territory /Legislature 1956.70 1972.00 2110.00
2. President, Vice
President/Governor/
Administrator of
UnionTerritories
470.71 565.50 706.56
3. Council of Ministers 163.42 190.00 186.00
4. Administration of justice 4284.84 6340.93 8027.95
5. Elections 1807.64 1264.00 1500.43
6. Land Revenue 943.05 1301.20 1425.00
7. Stamps and Registration 807.39 1028.43 1112.00
8. State Excise 1279.53 1302.71 2167.30
Contd.
-136-
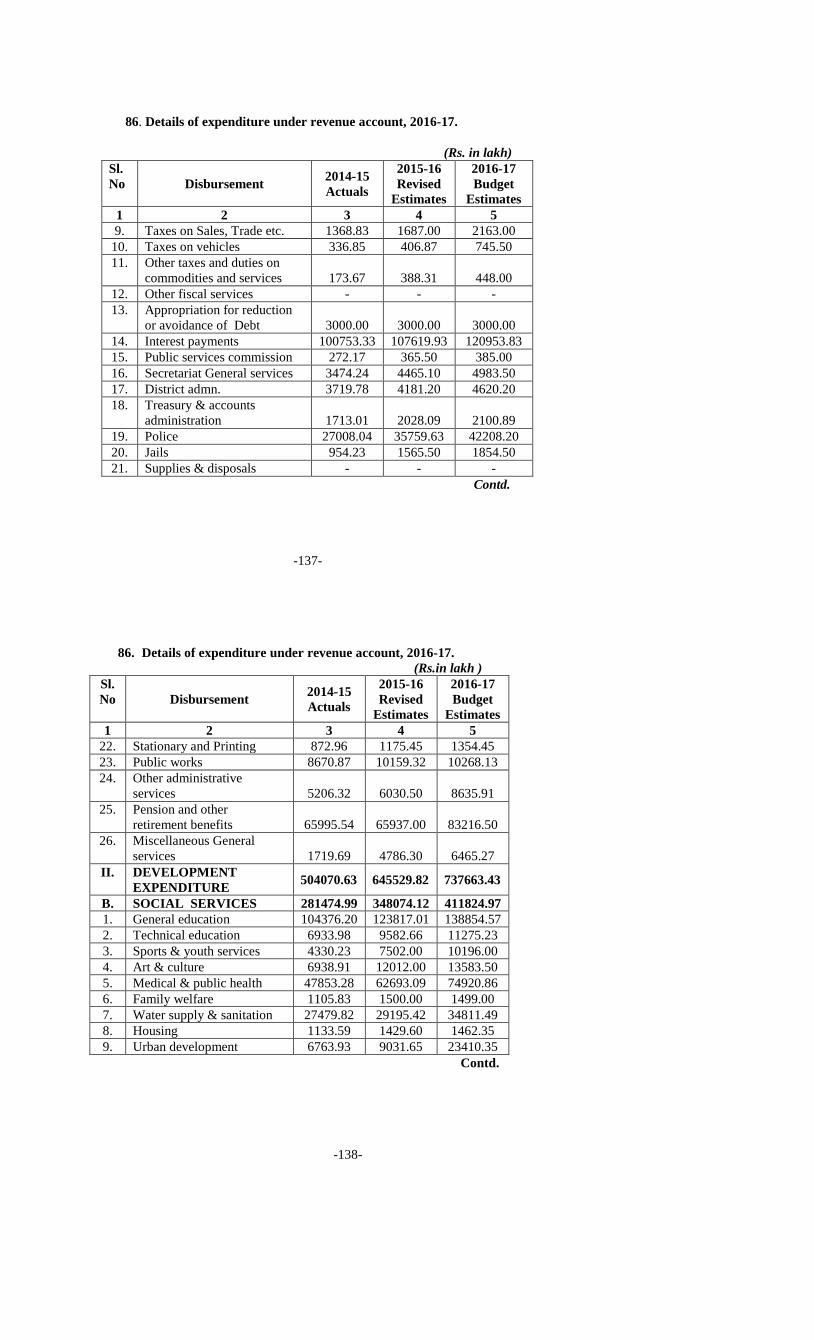
86. Details of expenditure under revenue account, 2016-17.
(Rs. in lakh)
Sl.
No Disbursement 2014-15
Actuals
2015-16
Revised
Estimates
2016-17
Budget
Estimates
1 2 3 4 5
9. Taxes on Sales, Trade etc. 1368.83 1687.00 2163.00
10. Taxes on vehicles 336.85 406.87 745.50
11. Other taxes and duties on
commodities and services 173.67 388.31 448.00
12. Other fiscal services - - -
13. Appropriation for reduction
or avoidance of Debt 3000.00 3000.00 3000.00
14. Interest payments 100753.33 107619.93 120953.83
15. Public services commission 272.17 365.50 385.00
16. Secretariat General services 3474.24 4465.10 4983.50
17. District admn. 3719.78 4181.20 4620.20
18. Treasury & accounts
administration 1713.01 2028.09 2100.89
19. Police 27008.04 35759.63 42208.20
20. Jails 954.23 1565.50 1854.50
21. Supplies & disposals - - -
Contd.
-137-
86. Details of expenditure under revenue account, 2016-17.
(Rs.in lakh )
Sl.
No Disbursement 2014-15
Actuals
2015-16
Revised
Estimates
2016-17
Budget
Estimates
1 2 3 4 5
22. Stationary and Printing 872.96 1175.45 1354.45
23. Public works 8670.87 10159.32 10268.13
24. Other administrative
services 5206.32 6030.50 8635.91
25. Pension and other
retirement benefits 65995.54 65937.00 83216.50
26. Miscellaneous General
services 1719.69 4786.30 6465.27
II. DEVELOPMENT
EXPENDITURE 504070.63 645529.82 737663.43
B. SOCIAL SERVICES 281474.99 348074.12 411824.97
1. General education 104376.20 123817.01 138854.57
2. Technical education 6933.98 9582.66 11275.23
3. Sports & youth services 4330.23 7502.00 10196.00
4. Art & culture 6938.91 12012.00 13583.50
5. Medical & public health 47853.28 62693.09 74920.86
6. Family welfare 1105.83 1500.00 1499.00
7. Water supply & sanitation 27479.82 29195.42 34811.49
8. Housing 1133.59 1429.60 1462.35
9. Urban development 6763.93 9031.65 23410.35
Contd.
-138-

86. Details of expenditure under revenue account, 2016-17.
(Rs. in lakh) Sl.
No Disbursement 2014-15
Actuals
2015-16
Revised
Estimates
2016-17
Budget
Estimates
1 2 3 4 5
10. Information and publicity 1528.88 3253.20 3716.20
11. Welfare of SC/ST/OBC classes 11341.40 10885.00 16562.00
12. Labour and employment 4340.33 5473.23 8660.06
13. Social security & welfare 54688.26 67355.52 68161.47
14. Nutrition 1861.51 1604.24 1852.74
15 Relief on account of natural
calamities 587.60 2413.00 2472.90
16 Secretariat social services 211.24 326.50 386.25
C ECONOMIC SERVICES 222595.64 297455.20 325838.36
1. Crop husbandry 9069.52 16650.06 18082.35
2. Soil and water conservation 184.41 308.60 290.20
3. Animal husbandry 2375.72 4656.16 4916.86
4. Dairy development 4240.42 6198.19 8927.76
5. Fisheries 3863.01 4904.67 4744.89
6. Forestry & wildlife 4469.25 4972.23 4971.43
Contd.
-139-
86. Details of expenditure under revenue account, 2016-17.
(Rs. in lakh)
Sl.
No Disbursement 2014-15
Actuals
2015-16
Revised
Estimates
2016-17
Budget
Estimates
1 2 3 4 5
7. Food storage and warehousing 179.92 414.25 648.01
8. Agricultural research &
Education 233.42 332.40 343.90
9. Co-operation 1039.78 1396.96 1849.47
10. Other Agricultural Prog. 97.51 108.88 133.80
11. Rural employment 1944.66 4159.42 4847.00
12. Other rural development
programmes 5633.15 10983.00 13841.71
13. Hill areas 538.80 1197.04 1281.51
14. Major & medium irrigation 4026.33 8995.13 7442.00
15. Minor irrigation 3600.65 4634.87 4769.25
16. Command area developmemt 897.64 1114.45 1186.10
17. Flood control & drainage 1568.50 1770.00 1710.00
18. Power 132078.63 146096.48 158840.90
19. Non conventional source
of Energy 1.21 190.20 300.30
20. Village & small industries 1699.65 4406.04 8504.65
21. Industries 4570.78 5296.21 8704.10
Contd.
-140-

86. Details of expenditure under revenue account, 2016-17.
(Concld.)
(Rs. in lakh)
Sl.
No Disbursement 2014-15
Actuals
2015-16
Revised
Estimates
2016-17
Budget
Estimates
1 2 3 4 5
22. Non-Ferrous mining &
Metallurgical industries 4798.36 9093.36 7480.36
23. Other outlays on industries
& minerals 115.50 550.00 4400.00
24. Ports & light houses 668.03 872.75 930.66
25. Civil Aviation 32.35 1000.00 722.00
26. Roads & bridges 14204.75 15737.22 15160.53
27. Road transport 8632.42 15771.60 16019.80
28. Inland water transport 3312.89 3350.00 3813.00
29. Other scientific research 242.19 557.90 701.23
30. Ecology & environment 320.88 893.46 1271.00
31. Secretariat economic
services 893.53 2767.40 3429.50
32. Tourism 5593.99 15287.25 10980.00
33. Census, Surveys &
Statistics 641.18 1586.06 2675.98
34. Civil supplies 591.04 826.51 1335.31
35. Other General economic
Services 235.57 376.45 582.80
III GRAND TOTAL (I+II) 741023.44 909049.79 1048313.95
Source: Directorate of Planning, Statistics & Evaluation
(Annual Financial Statement, 2016-17)
-141-
87. Details of receipts under capital account, 2016-17.
( Rs. in lakh)
Sl.
No Receipts
2014-15
Actuals
2015-16
Revised
Estimates
2016-17
Budget
Estimates
1 2 3 4 5
I Total capital account
Receipts 234427.58 151324.02 163368.76
1. Loans and advances 995.25 1883.92 1719.88
2. Loans & advances from
Central Govt. 20287.94 23637.60 24806.25
3. Internal debt of the
State Government 213144.39 125802.50 136842.63
II Total capital account
disbursements 287134.70 340446.73 400805.27
III Capital account surplus
(+)or deficit (-) (-)52707.12 (-)189122.71 (-)237436.51
IV Public account receipts 1200783.77 2109496.49 2169631.40
V Public account
disbursements 1207905.63 2014592.26 2073844.97
VI Public account surplus (+)
or deficit (-) (-)7121.86 94904.23 95786.43
Source: Directorate of Planning, Statistics & Evaluation
(Annual Financial Statement, 2016-17)
-142-

88. Details of expenditure under capital account, 2016-17.
(Rs.in lakh)
Sl.
No Disbursements
2014-15
Actuals
2015-16
Revised
Estimates
2016-17
Budget
Estimates
1 2 3 4 5
I. DEVELOPMENT
EXPENDITURE 92960.33 200830.35 275830.43
1. Capital outlay on education,
sports, Art & culture 13511.58 25643.29 30553.73
2. Capital outlay on medical &
public health 1687.39 8548.52 10390.05
3. Capital outlay on water
supply & sanitation 11608.90 20543.52 37979.21
4. Capital outlay on housing 11.56 34.00 34.00
5. Capital outlay on urban
development 12.36 85.00 14685.00
6. Capital outlay on welfare of
SC/ST/OBC 958.50 1820.00 5483.65
7. Capital outlay on social
security & welfare 56.61 400.00 497.70
8. Capital outlay on other social
services 0.00 31.00 380.00
9. Capital outlay on crop
husbandry 331.69 1381.01 3372.11
10. Capital outlay on soil &
water conservation 896.45 930.00 950.00
Contd.
-143-
88. Details of expenditure under capital account, 2016-17.
(Rs. in lakh)
Sl.
No Disbursement
2014-15
Actuals
2015-16
Revised
Estimates
2016-17
Budget
Estimates
1 2 3 4 5
11. Capital outlay on animal
husbandry 25.08 550.00 525.00
12. Capital outlay on fisheries 281.71 2107.00 2077.00
13. Capital outlay on forestry &
wild life - 301.00 2260.00
14. Capital outlay on
plantations - - -
15. Capital outlay on food,
storage & warehousing 30.21 - -
16. Capital outlay on Agricultu-
ral Research & education - 20.00 20.00
17. Capital outlay on Co-operation 711.16 538.68 522.65
18. Capital outlay on other rural
development programme 14.67 3055.00 2565.00
19. Capital outlay on hill areas 101.64 233.00 233.00
20. Capital outlay on Major &
medium irrigation 1364.22 2219.50 2707.69
21. Capital outlay on minor
irrigation 6081.82 7297.00 7303.50
Contd.
-144-

88. Details of expenditure under capital account, 2016-17.
(Rs. in lakh)
Sl.
No Disbursement
2014-15
Actuals
2015-16
Revised
Estimate
s
2016-17
Budget
Estimates
1 2 3 4 5
22. Capital outlay on command
area development 673.78 2021.20 1672.00
23. Capital outlay on flood
control projects 5756.56 6250.00 6200.00
24. Capital outlay on power
projects 16879.33 58017.50 62354.50
25. Capital outlay on non con -
ventional source of energy - 100.00 400.00
26. Capital outlay on village
and small industries 1693.82 2280.05 2885.00
27. Capital outlay on non-
ferrous mining and
metallurgical industries
- 10.00 15.00
28. Capital outlay on industries
& minerals - - -
29. Capital outlay on ports &
light houses 13.45 1122.00 802.00
30. Capital outlay on civil
aviation - 6000.00 13900.00
31. Capital outlay on roads &
bridges 23050.28 34502.89 44120.64
32. Capital outlay on road
transport 1069.53 2800.00 2815.00
Contd.
-145-
88. Details of expenditure under capital account, 2016-17 (Concld.)
(Rs. in lakh)
Sl.
No Disbursement 2014-15
Actuals
2015-16
Revised
Estimates
2016-17
Budget
Estimates
1 2 3 4 5
33. Capital outlay on inland
water transport 323.68 1513.00 1793.00
34. Capital outlay on other
transport services - - -
35. Capital outlay on other
scientific & environment
research
82.95 3100.00 3600.00
36. Capital outlay on tourism 5731.40 7376.19 12734.00
37. Capital outlay on other
economic services - - -
II Non-Development
Expenditure 194174.37 139616.38 124974.84
1. Capital outlay on Gen.
services 30600.03 89560.90 66590.51
2. Internal Debt of the State
Government 140529.98 45569.39 51417.80
3. Loans & advances from
central Govt. 2752.02 2910.93 5833.93
4. Loans and advances 292.34 1575.16 1132.60
5. Appropriation to
contingency fund 20000.00 - -
Source: Directorate of Planning, Statistics & Evaluation
(Annual Financial Statement, 2016-17)
-146-

XIX. FIVE YEAR PLANS 89A. Expenditure by major heads of development
during the Annual Plan 2016-17.
(Rs. in lakh)
Sl. No. Major Heads/Minor Heads of
Development
Reconciled
Expenditure
1 2 3
I Agriculture & Allied Activities 22529.36
II Rural Development 8610.32 III Special Areas Programmes 766.18
IV Irrigation & Flood Control 20255.03
V Energy 25775.30
VI Industry & Minerals 6768.23
VII Transport 43759.38 VIII Science, Technology &
Environment 13957.71
IX General Economic Services 18938.17
X Social Services 196222.94
XI General Services 18992.54
TOTAL ALL SECTORS 376575.16
-147-
89B. Expenditure by major heads/sub-heads of development
during the Annual Plan 2016-17.
(Rs. in lakh)
Sl.No Major Heads/Minor Heads of Development Reconciled
Expenditure
1 2 3
I AGRICULTURE & ALLIED ACTIVITIES 22529.36
1. Crop husbandry 7625.74
2. Horticulture 5114.99
3. Soil & water conservation (incl. control of
shifting Cult.) 335.40
4. Animal husbandry 1093.53
5. Dairy Development 4915.60
6. Fisheries 2747.40
7. Food, Storage & Warehousing 0.00
8. Agriculture Research & Education 22.31
9. Co-operation 674.39
10. Other Agricultural Programmes
a) Agriculture marketing & Quality control 0.00
II RURAL DEVELOPMENT 8610.32
1. Special Programmes for Rural
Development 1237.90
a) Goa Gram Samrudhi Yojana (GGSY) 480.00
b) Goa Grameen Urja Yojana (GGUY) 0.00
c) Retirement Benefit Scheme for DRDA 100.00
d) SC 0.00
e) ST 0.00
f) District Rural Development Agency
Administration 657.90
g) Pradhan Mantri Gram Sadak Yojana
(PMGSY) 0.00
2. Rural Employment 604.92
a) Swarnjayanti Gram Swarozgar Yojana
(SGSY) renamed as “Aajiveeka” switched to
National Rural Livelihood Mission (NRLM)
30.00
b) Mahatma Gandhi National Rural
Employment Guarantee Scheme
(MGNREGS)
473.16
c) National Rural Livelihood Mission
(NRLM) 101.76
3. Land Reforms 268.89
4. Other Rural Development Programmes 6498.61
a) Community Development & Panchayats 6498.61
Contd.
-148-
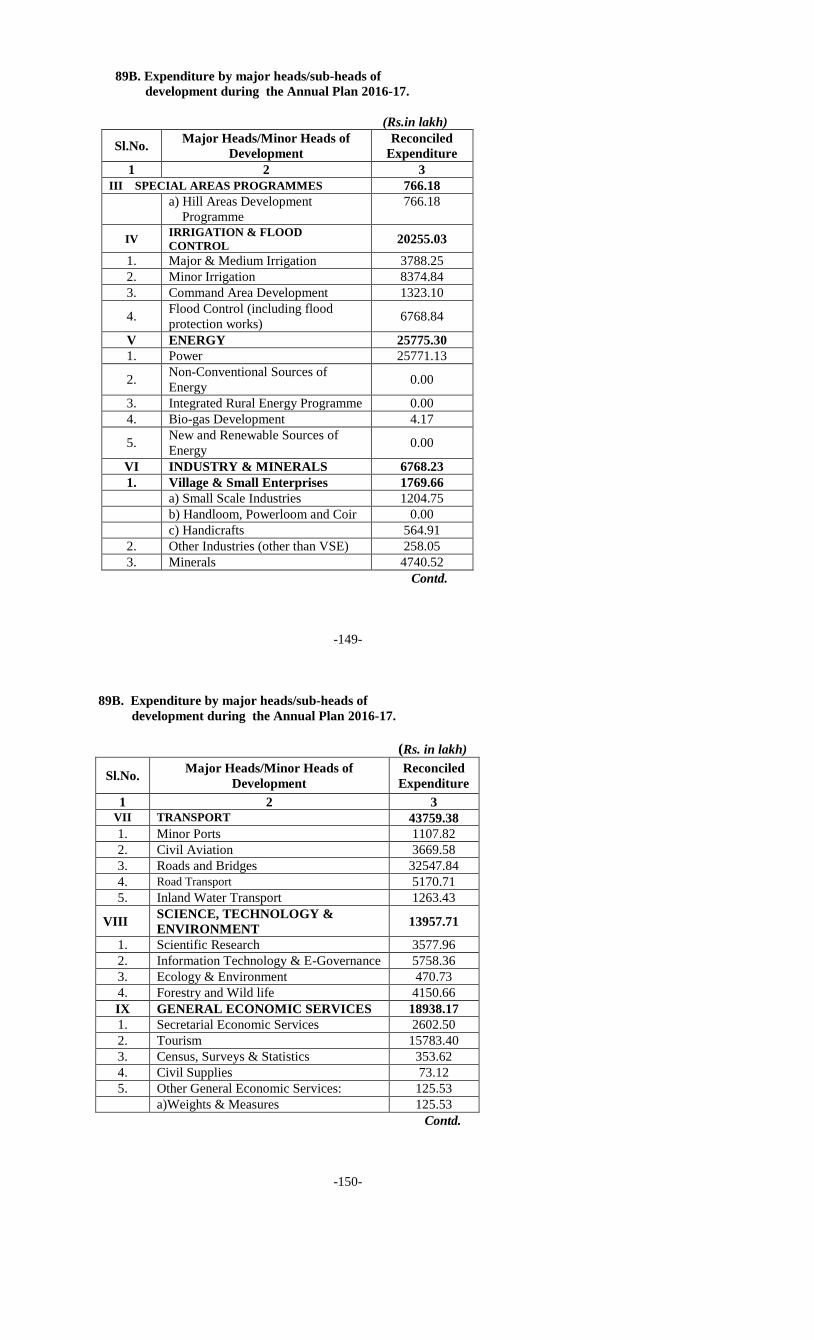
89B. Expenditure by major heads/sub-heads of
development during the Annual Plan 2016-17.
(Rs.in lakh)
Sl.No. Major Heads/Minor Heads of
Development
Reconciled
Expenditure
1 2 3
III SPECIAL AREAS PROGRAMMES 766.18
a) Hill Areas Development
Programme
766.18
IV IRRIGATION & FLOOD
CONTROL 20255.03
1. Major & Medium Irrigation 3788.25
2. Minor Irrigation 8374.84
3. Command Area Development 1323.10
4. Flood Control (including flood
protection works) 6768.84
V ENERGY 25775.30
1. Power 25771.13
2. Non-Conventional Sources of
Energy 0.00
3. Integrated Rural Energy Programme 0.00
4. Bio-gas Development 4.17
5. New and Renewable Sources of
Energy 0.00
VI INDUSTRY & MINERALS 6768.23
1. Village & Small Enterprises 1769.66
a) Small Scale Industries 1204.75
b) Handloom, Powerloom and Coir 0.00
c) Handicrafts 564.91
2. Other Industries (other than VSE) 258.05
3. Minerals 4740.52
Contd.
-149-
89B. Expenditure by major heads/sub-heads of
development during the Annual Plan 2016-17.
(Rs. in lakh)
Sl.No. Major Heads/Minor Heads of
Development
Reconciled
Expenditure
1 2 3
VII TRANSPORT 43759.38
1. Minor Ports 1107.82
2. Civil Aviation 3669.58
3. Roads and Bridges 32547.84
4. Road Transport 5170.71
5. Inland Water Transport 1263.43
VIII SCIENCE, TECHNOLOGY &
ENVIRONMENT 13957.71
1. Scientific Research 3577.96
2. Information Technology & E-Governance 5758.36
3. Ecology & Environment 470.73
4. Forestry and Wild life 4150.66
IX GENERAL ECONOMIC SERVICES 18938.17
1. Secretarial Economic Services 2602.50
2. Tourism 15783.40
3. Census, Surveys & Statistics 353.62
4. Civil Supplies 73.12
5. Other General Economic Services: 125.53
a)Weights & Measures 125.53
Contd.
-150-

89B. Expenditure by major heads/sub-heads of
development during the Annual Plan 2016-17.
(Rs. in lakh)
Sl. No.
Major Heads/Minor Heads of
Development
Reconciled
Expenditure
1 2 3
X SOCIAL SERVICES 196222.94
1. General Education 20481.81
a)Elementary Education/
Secondary Education 13069.46
b)Higher Education 7205.63
c)Language Development 206.72
2. Technical Education 5290.26
3. Sports 10361.00
4. Youth Services 75.45
5. Art & culture 7160.08
Contd.
-151-
89B. Expenditure by major heads/sub-heads of
development during the Annual Plan 2016-17.
(Rs. in lakh)
Sl. No.
Major Heads/Minor Heads of
Development
Reconciled
Expenditure
1 2 3
6. Medical &Public Health 30439.90
i) Primary Health care 4294.45
ii) Secondary Health care 2450.88
iii) Tertiary Health care/ Super
Speciality Services 8282.93
Goa Medical college 4620.82
Goa Dental college 3509.10
I.P.H.B 112.01
Strengthening of Goa College
of Pharmacy 41.00
iv) Medical Education &
Research 3118.33
Goa Medical college 1939.40
Goa Dental college 849.48
I.P.H.B 0.57
Pharmacy 40.87
Nursing Education 288.01
v) E.S.I. 2371.54
vi) Control of Diseases 6.58
vii) Other Programmes
a) Other Health programmes 9518.53
b) Food and Drugs
Administration 396.66
7. Water Supply & Sanitation 27090.20
Contd.
-152-

89B. Expenditure by major heads/sub-heads of
development during the Annual Plan 2016-17.
(Rs. in lakh)
Sl. No.
Major Heads/Minor Heads of
Development
Reconciled
Expenditure
1 2 3
8. Housing 666.23
i)Rural Housing 524.94
ii)Urban Housing 141.29
9.
Urban Development
(Including State capital
projects & slum area
develop.)
11541.28
a) Urban development 11541.28
10. Information & Publicity 1913.83
Contd.
-153-
89B. Expenditure by major heads/sub-heads of
development during the Annual Plan 2016-17.
(Rs in lakh)
Sl. No.
Major Heads/Minor Heads of
Development
Reconciled
Expenditure
1 2 3
11. Development of SCs /STs and
OBCs 15273.30
12. Labour & employment 2376.55
a) Labour welfare 584.99
i) Labour and Labour Welfare 548.85
ii) Social security for Labour 36.14
iii) Women and Child Labour 0.00
b) Employment Services 33.90
c) Craftsmen Training
(ITI’s/Apprenticeship training) 1551.88
d) Factories & Boilers 205.78
Contd.
-154-

89B. Expenditure by major heads/sub-heads of
development during the Annual Plan 2016-17.
(Rs. in lakh)
Sl. No.
Major Heads/Minor Heads of
Development
Reconciled
Expenditure
1 2 3
13. Social Security & Social Welfare 26716.98
a) Insurance Scheme for the Poor
through GIC etc. 0.00
b) National Social Assistance
Programme & Annapurna 0.00
c) Welfare of Handicapped (Includes
assistance for Voluntary
Organisations)
44.57
d) Social Defence (Includes Drug
Addicts, Rehabilitation Programmes,
HIV/AIDS etc.
141.16
e) Others 26531.25
14. Empowerment of Women &
Development of Children 36836.07
a) Empowerment of Women 19672.14
b) Development of Children (Includes
Integrated Child Development
Services, Balwadi Nutrition
Programme, Day Care Centres etc.)
15581.78
c) Nutrition 1582.15
Contd.
-155-
89B. Expenditure by major heads/sub-heads of
development during the Annual Plan 2016-17. (Concld.)
(Rs. in lakh)
Sl.No.
Major Heads/Minor Heads of
Development
Reconciled
Expenditure
1 2 3
XI GENERAL SERVICES 18992.54
1. Jails 1322.42
2. Stationery & Printing 0.00
3. Public works 815.30
4. Other Administrative Services 16854.82
i) Judicial administration 1038.23
ii) Accounts 103.72
iii) Finance 15100.00
iv) Notary services 12.99
v) Police 37.05
vi) Collectorate - SouthGoa 317.04
vii) Home 245.79
viii) Excise 0.00
TOTAL ALL SECTORS 376575.16
Source: Directorate of Planning, Statistics & Evaluation
-156-

XX. STATE INCOME
90A. Net State Domestic Product (NSDP) at market price by Industry
of origin at current prices for base year 2011-12
Sl.
No Industry Group
2015-16 (P)
Rs. in lakh
2016-17 (Q)
Rs. in lakh
1 2 3 4
1. Agriculture, forestry, fishing & Livestock 344091 415047
1.1 Agriculture 144211 164041
1.2 Livestock 43305 51915
1.3 Forestry & logging 25860 33419
1.4 Fishing 130715 165672
2. Mining & quarrying 26389 80248
Sub-Total (Primary) 370481 495295
3. Manufacturing 2046290 2519599
4. Construction 189753 249468
5. Electricity, gas & water supply 181562 201864
Sub-Total (Secondary) 2417605 2970930
6. Trade, hotels & restaurants 320019 351426
6.1 Trade & Repair Services 282516 309822
6.2 Hotel and Restaurant 37503 41604
7. Transport, storage , communications &
Services related to Broadcasting 152568 193563
Contd.
-157-
90A. Net State Domestic Product (NSDP) at market price by Industry
of origin at current prices for the base year 2011-12 (Concld.)
Sl.
No
Industry Group
2015-16 (P)
Rs. in lakh
2016-17 (Q)
Rs. in lakh
1 2 3 4
7.1 Railways 13926 15008
7.2 Transport by other means 99373 132603
7.2.1 Road transport 38269 41446
7.2.2 Water transport 9176 9055
7.2.3 Air transport 39878 70215
7.2.4 Service incidental to transport 12050 11886
7.3 Storage 303 338
7.4 Communications 38966 45615
8. Financing services 248979 266886
9. Real Estate & ownership of dwelling
& business services
369622 410789
10. Public administration 309286 347937
11. Other services 206971 241981
Sub-Total (Tertiary) 1607446 1812582
12. Total NSVA at basic prices 4395532 5278807
13. Taxes on products 569464 631334
14. Subsidies on products 42755 33091
15. Net State Domestic Product 4922241 5877050
16. Population 00’ 15050 15160
17. Per Capita Income (Rs.) 327059 387668
Source: Directorate of Planning, Statistics & Evaluation
P (Provisional) & Q (Quick)
-158-

90B. Net State Domestic Product (NSDP) at market price by Industry
of origin at constant prices for base year 2011-12
Sl.
No. Industry Group
2015-16 (P)
Rs. in lakh
2016-17 (Q)
Rs. in lakh
1 2 3 4
1. Agriculture, forestry, fishing & Livestock 202772 214369
1.1 Agriculture 93005 92913
1.2 Livestock 32488 37513
1.3 Forestry & logging 13829 14724
1.4 Fishing 63451 69219
2. Mining & quarrying 32749 152030
Sub-Total (Primary) 235521 366399
3. Manufacturing 1807410 2157622
4. Construction 154344 191943
5. Electricity, gas & water supply 156571 170620
Sub-Total (Secondary) 2118325 2520184
6. Trade, Hotels & restaurants 235709 240772
6.1 Trade & Repair Services 208134 212309
6.2 Hotel and Restaurant 27575 28462
7. Transport, storage, Communications &
Services related to Broadcasting 135681 170535
Contd.
-159-
90B. Net State Domestic Product (NSDP) at market price by Industry
of origin at constant prices for the base year 2011-12 (Concld.)
Sl.
No. Industry Group
2016-17 (P)
Rs. in lakh
2016-17 (Q)
Rs. in lakh
1 2 3 4
7.1 Railways 11768 12157
7.2 Transport by Other means 90751 120507
7.2.1 Road transport 18353 16892
7.2.2 Water transport 7182 6817
7.2.3 Air transport 36769 65092
7.2.4 Service incidental to transport 28447 31705
7.3 Storage 235 248
7.4 Communications 32926 37623
8. Financing Services 232545 245620
9. Real Estate & Ownership of dwelling
& business services
297175 316099
10 Public Administration 237311 251586
11. Other Services 161213 178529
Sub-Total (Tertiary) 1299632 1403141
12. Total NSVA at basic prices 3653477 4289724
13. Taxes on products 405608 411390
14. Subsidies on products 35785 26782
15. Net State Domestic Product 4023300 4674331
16. Population 00’ 15050 15160
17. Per Capita Income (Rs.) 267329 308333
Source: Directorate of Planning, Statistics & Evaluation
P (Provisional) & Q (Quick)
-160-

XXI LOCAL BODIES
91. Income and expenditure of the Village Panchayats,
2016-17.
Sl.
No. Item 2016-17
1 2 3
1. Number of Panchayats 191
2. Income
a) Grants from Government 6761.1
b) Other Grants 1068.12
c) Proceeds of taxes, fees, etc. 3773.9
d) Others 2412.4
TOTAL INCOME(Rs. in lakh) 14015.52
3. Expenditure
a) Administration 2894.9
b) Sanitation & Public health 1195.39
c) Public works 4669.23
d) Planning & development 59.5
e) Education & culture 126.82
f) Social welfare 91.46
g) Miscellaneous 977.05
h) Others 196.34
TOTAL EXPENDITURE (Rs. in lakh) 10210.69
Source: Directorate of Panchayats.
-161-
91A. Talukawise income and expenditure of the Village Panchayats,
2016-17.
Contd.
-162-
Sr.
No Items
Taluka
Tiswadi Bardez Pernem Bicholim
1 2 3 4 5 6
1. Income a) Grants from Government 611.80 1071.05 1432.02 615.06
b) Other Grants 36.85 238.6 247.39 57.89
c) Proceeds of taxes, fees, etc. 711.88 1668.41 68.08 76.63
d) Others 344.14 780.21 203.85 84.65
TOTAL INCOME (Rs. in lakh) 1704.67 3758.27 1951.34 834.23
2. Expenditure
a) Administration 320.06 632.95 274.80 232.99
b) Sanitation & Public health 157.70 251.88 18.00 34.71
c) Public works 695 1427.89 486.22 301.02
d) Planning & development 6.76 4.78 0.00 0
e) Education & culture 8.69 30.18 4.70 6.09
f) Social welfare 6.40 35.13 2.9 10.75
g) Miscellaneous 215.28 197.56 102.28 56.42
h) Others 30.93 38.33 34.16 2.28
TOTAL EXPENDITURE (Rs.
in lakh) 1440.82 2618.70 923.06 644.26

91A. Talukawise income and expenditure of the Village Panchayats,
2016-17.
Contd.
-163-
91A. Talukawise income and expenditure of the Village Panchayats,
2016-17 (Concld.)
Source: Directorate of Panchayats.
-164-
Sr.
No Items
Taluka
Sattari Ponda Sanguem Dharbandora
1 2 7 8 9 10
1. Income a) Grants from Government 338.56 742.86 298.30 217.78
b) Other Grants 86.2 170.92 17.08 4.03
c) Proceeds of taxes, fees,
etc.
45.72 315.58 16.92 99.54
d) Others 68.22 237.97 49.34 62.45
TOTAL INCOME (Rs. in
lakh)
538.7 1467.33 381.64 383.8
2. Expenditure
a) Administration 148.22 316.32 76.2 81.92
b) Sanitation & public health 9.02 65.32 15.51 13.14
c) Public works 161.11 302.87 92.6 87.38
d) Planning & development 0.54 1.12 0.78 24.18
e) Education & Culture 1.81 30.40 5.01 3.6
f) Social welfare 0.99 7.66 2.74 2.77
g) Miscellaneous 25.9 102.16 29.65 27.02
h) Others 0 15.40 6.37 7.63
TOTAL EXPENDITURE (Rs.
in lakh) 347.59 841.25 228.86 247.64
Sr.
No Items
Taluka Canacona Quepem Salcete Mormugao
1 2 11 12 13 14
1. Income
a) Grants from Govenment 297.85 497.4 451.07 187.35
b) Other Grants 45.29 25.42 20.93 117.52
c) Proceeds of taxes, fees, etc. 24.77 34.14 460.6 251.63
d) Others 63.63 75.88 263.48 178.58
TOTAL INCOME(Rs. in lakh) 431.54 632.84 1196.08 735.08
2. Expenditure
a) Administration 94.8 125.91 375.46 215.27
b) Sanitation & public health 14.81 54.31 375.46 185.53
c) Public works 106 223.48 284.22 501.44
d) Planning & development 0.00 2.23 17.46 1.65
e) Education & culture 1.96 3.36 26.37 4.65
f) Social welfare 0.34 0.79 8.9 12.09
g) Miscellaneous 39.69 56.18 61.61 63.30
h) Others 27.01 4.15 20.83 9.25
TOTAL EXPENDITURE(Rs.
in lakh) 284.61 470.41 1170.31 993.18

91B. Important achievements of the Village Panchayats, 2016-17
Sl.
No Item 2016-17
1 2 3
Important Achievements
a) Construction of Village paths & Roads,
(in kms/meters) 209.58
b) Repairs of Village Paths & Roads (in
kms/meters) 20.742
c) Construction of motorable roads. 21.263
d) Compost pits dug (nos.) 12
e) Trees planted (in nos.) 982
f) Construction of school building 0
g) Repairs of School building 1
h) Drinking water wells constructed (nos.) 10
i) Drinking water wells repaired (nos.) 88
j) Construction of culverts (nos.) 16
k) Construction of Panchayat Ghars (nos.) 5
l) Foot bridges constructed 3
m) Toilets constructed 33
n) Dressing rooms constructed 2
o) Constructions of steps (mts) 18.014
p) Constructions of gutter (mts) 9.427
q) Crematorium constructed 16.20
r) Construction of drains/ Ret. Walls (mts) 37.829
Source: Directorate of Panchayats
-165-
91C. Talukawise important achievements of the Village Panchayats,
2016-17.
Contd.
-166-
Sr.
No Items
2016-17
Tiswadi Bardez Pernem Bicholim
1 2 3 4 5 6
1. Important Achievements
a) Construction of village paths
& roads (In kms/meters) 77.48 114.14 3.042 1.395
b) Repairs of village path &
roads, (In kms/meters) - 9.17 880 4.385
c) Construction of motorable
roads. 2.48 16.425 - 1.145
d) Compost pits dug (nos.) - 12 0 -
e) Trees planted (in nos) - 105 50 35
f) Construction of school
building - - - -
g) Repairs of school building - 1 - -
h) Drinking water wells
constructed,(nos.) - 2 1 -
i) Drinking water wells
repaired (nos.) - 1 35 10
j) Construction of culverts
(nos.) - 13 - 1
k) Construction of Panchayat
Ghars (nos.) - - - 1
l) Foot bridges constructed - - - 1
m) Toilets constructed - 3 1 20
n) Dressing rooms constructed - 1 - -
o) Construction of steps (mts) - - 451 mts 10 km
p) Construction of gutter (mts) 67 mts 2000 mts 890.6 2285 mts
q) Crematorium constructed - 200 mts 2 -
r) Construction of drains/
Ret. Walls (mts) 23 kms 6268 mts 620 230

91 C. Talukawise important achievements of the Village Panchayats,
2016-17.
Contd.
-167-
91 C. Talukawise important achievements of the Village Panchayats,
2016-17 ( Concld.)
Source: Directorate of Panchayats
-168-
Sr.
No Items 2016-17
Sattari Ponda Sanguem Dharbandora
1 2 7 8 9 10
1. Important Achievements
a) Construction of village paths
& roads (in kms/meters) 2.045 0.2 7.2 0.425
b) Repairs of village path &
roads, (in kms/meters) 0.22 0.736 - 2.41
c) Construction of motorable
roads. 0.785 - - -
d) Compost pits dug (nos.) - - - -
e) Trees planted (in nos.) - 250 - 230
f) Construction of school
building - - - -
g) Repairs of School building - - - -
h) Drinking water wells
constructed (nos.) 2 - - -
i) Drinking water wells repaired
(Nos.) 6 4 1
10-Repairs
22-cleared
& desilted
j) Construction of culverts (nos.) - - - -
k) Construction of Panchayat
Ghars (nos.) 1 1 - -
l) Foot bridges constructed - - - 2
m) Toilets constructed - 3 - -
n) Dressing rooms constructed - - - -
o) Constructions of steps (mts) 0.173 0.086 - 250 mts
p) Constructions of gutter (mts) 0.75 0.573 - 500 mts
q) Crematorium constructed - 3 - 1
r) Construction of drains/
Ret. Walls (mts) 0.235 0.222 280.35 mts 70 mts
Sr.
No Items
2016-17
Canacona Quepem Salcete Mormugao
1 2 11 12 13 14
1. Important Achievements
a) Construction of village
paths & roads (in
kms/meters)
0.900 1.28 - 1.473
b) Repairs of village path &
Roads, (in kms/meters) - 0.087 500 mts 2.354
c) Construction of
motorable roads. - 0.12 0.088 0.22
d) Compost pits dug (nos.) - - - -
e) Trees planted (in nos.) - - 312 -
f) Construction of school
building - - - -
g) Repairs of school
building - - - -
h) Drinking water wells
constructed,(nos.) 2 3 - -
i) Drinking water wells
repaired (nos.) 9 1 7 4
j) Construction of culverts
(nos.) - 2 - -
k) Construction of
Panchayat Ghars (nos.) 1 - 1 -
l) Foot bridges constructed - - - -
m) Toilets constructed 1 - - 5
n) Dressing room
constructed - 1 - -
o) Constructions of steps
(mts) 7 0.055 - -
p) Constructions of gutter
(mts) 3 570 mts 611 mts 238 mts
q) Crematorium constructed - - 10 -
r) Construction of drains/
Ret. Walls (mts) 2 170 282 4465

92. Receipts and expenditure of Municipal Corporation/Councils,
2016-17.
(Rs. in lakh)
Sl.
No
State/District/
Municipality
2016-17
Receipts Expenditure
(1) (2) (3) (4)
Goa
1. North – Goa
Panaji(CCP)* 3502.00 2639.00
Mapusa 2106.02 2020.19
Pernem 213.60 83.02
Bicholim 926.04 867.31
Valpoi 292.43 224.65
Sanquelim 434.44 364.98
2. South – Goa
Sanguem 293.23 418.42
Ponda 837.52 724.23
Canacona 497.50 288.45
Quepem 433.34 318.02
Curchorem-Cacora 444.98 369.90
Margao 1999.09 2216.34
Cuncolim 416.71 326.93
Mormugao 1927.29 1345.70
*CCP Corporation of city of Panaji
Source: Directorate of Municipal Administration
-169-
93. Distribution of income of Municipal Corporation /Councils,
2016-17.
(Rs. in lakh)
Sl.
No Item Total
(1) (2) (3)
INCOME
1. Municipal rates and Taxes
a) Octroi 1629.25
b) Taxes on house and land 2473.04
c) Others 581.96
2. Receipts from:
a) Realisation under special acts 0.01
b) Markets 377.72
c) Slaughter houses 0.00
d) Rent for houses and lands 895.90
e) Other fees & revenue 3285.91
3. Income from Other sources:
a) Government grants 2800.08
b) Interest on receipts 801.94
c) Miscellaneous 713.27
d) Security deposit/EMD/Loans &
Advances 765.11
4. Total Income 14324.19
Contd.
-170-

93. Distribution of income of Municipal Corporation /Councils,
2016-17.
(Rs. in lakh)
Contd.
*CCP Corporation of city of Panaji Contd.
-171-
93. Distribution of income Municipal Corporation /Councils,
2016-17.
(Rs. in lakh)
Contd.
-172-
Sr.
No
Items / Income
CCP / Municipal Councils
CCP*
Mapusa
Pernem
Bicholim
1 2 4 5 6 7
1. Municipal Rate &Taxes
a) Octroi 208.00 252.73 0.00 84.15
b) Taxes on house &
land
1330.00 289.23 4.16 47.01
c) Others 0.00 219.67 0.12 20.04
2. Receipts from:
a) Realisation under
special acts
0.00 0.00 0.00 0.00
b) Markets 0.00 120.25 8.44 13.09
c) Slaughter houses 0.00 0.00 0.00 0.00
d) Rent for houses and
land
88.00 288.13 0.91 95.79
e) Other fees and
revenue
1496.00 505.01 63.93 99.25
3. Income from other sources:
a) Government Grants 0.00 350.51 82.77 400.30
b) Interest on receipts 370.00 47.39 38.76 40.13
c) Miscellaneous 10.00 0.00 11.01 0.00
d) Security Deposit/EMD/
Loans & Advances
0.00 33.10 3.50 126.28
4. Total Income 3502.00 2106.02 213.60 926.04
Sr.
No
Items / Income Municipal Councils
Valpoi Ponda Sanquelim Sanguem
1 2 8 9 10 11
1. Municipal Rate &Taxes
a) Octroi 55.91 103.29 82.73 63.78
b) Taxes on house & land 15.94 72.19 35.35 3.98
c) Others 22.75 109.75 89.40 3.23
2. Receipts from:
a) Realisation under
special acts
0.01 0.00 0.00 0.00
b) Markets 10.54 35.26 10.62 1.30
c) Slaughter houses 0.00 0.00 0.00 0.00
d) Rent for houses and
land
19.04 23.23 3.95 35.46
e) Other fees and revenue 8.52 105.16 19.68 7.97
3. Income from other sources:
a) Government Grants 81.46 257.31 77.64 83.14
b) Interest on receipts 24.91 88.27 47.70 54.92
c) Miscellaneous 47.09 35.86 58.17 28.79
d) Security Deposit/
EMD/Loans & Advances
6.26 7.20 9.20 10.66
4. Total Income 292.43 837.52 434.44 293.23

93. Distribution of income of Municipal Corporation / Councils,
2016-17.
(Rs. in lakh)
Contd.
-173-
93. Distribution of income of Municipal Corporation /Councils,
2016-17. (Concld.)
(Rs. in lakh)
Source: Directorate of Municipal Administration
*There was a wrong entry entered on the cash book for the year
2015-16 with regards to Margao Municipal Council on Income
from Interest on receipts. Based on the corrections done on the
Audit report (- 186.02) entry is shown for the year 2016-17.
-174-
Sr.
No Items/ Income
Municipal Councils
Canacona Quepem Curchorem-
Cacora
1 2 12 13 14
1. Municipal Rate &Taxes
a) Octroi 84.15 82.39 99.43
b) Taxes on house
& land
14.60 16.84 14.48
c) Others 14.94 4.91 8.48
2. Receipts from:
a) Realisation under
special acts
0.00 0.00 0.00
b) Markets 19.59 16.07 8.58
c) Slaughter houses 0.00 0.00 0.00
d) Rent for houses and
land
9.10 14.06 17.45
e) Other fees and revenue 62.90 62.52 55.71
3. Income from other sources:
a) Government Grants 110.46 163.73 159.00
b) Interest on receipts 113.56 35.24 36.68
c) Miscellaneous 31.53 29.54 9.32
d) SecurityDeposit/
EMD/Loans & Advances
36.67 8.04 35.85
4. Total Income 497.50 433.34 444.98
Sr.
No Items / Income
Municipal Councils
Margao Cuncolim Mormugao
1 2 15 16 17
1. Municipal Rate &Taxes
a) Octroi 208.20 82.39 222.10
b) Taxes on house &land 400.04 21.21 208.01
c) Others 76.76 3.93 7.98
2. Receipts from:
a) Realisation under
special acts
0.00 0.00 0.00
b) Markets 49.80 36.00 48.18
c) Slaughter houses 0.00 0.00 0.00
d) Rent for houses and
land
52.38 31.73 216.67
e) Other fees and revenue 582.61 82.06 134.59
3. Income from Other sources:
a) Government Grants 359.48 115.67 558.61
b) Interest on receipts -186.02* 20.18 70.22
c) Miscellaneous 154.51 16.87 280.58
d) SecurityDeposit/
EMD/Loans & Advances
301.33 6.67 180.35
4. Total Income 1999.09 416.71 1927.29

93A. Distribution of expenditure of Municipal Corporation/
Councils, 2016-17.
(Rs. in lakh)
Sl.
No Item Total
1 2 3
EXPENDITURE
1. General Administration 8472.07
2. Public safety
a) Public lighting 72.53
b) Others 92.66
c) Public safety 10.33
Total 175.52
3. Public Health Conveniences and Instructions
a) Water Safety 9.74
b) Drainage, conservancy and sanitary 97.74
c) Public garden 80.22
d) Public works 1354.72
e) Public instructions 22.11
Total 1564.53
4. Miscellaneous
a) Repayment of loans and interest etc. 219.50
b) Others 1775.52
Total 1995.02
Total Expenditure 12207.14
Contd.
-175-
93A. Distribution of expenditure of Municipal Corporation /Councils,
2016-17.
(Rs. in lakh)
Contd.
-176-
Sr.
No Items CCP / Municipal Councils
1 2 4 5 6 7
Expenditure
Corp.of
the City
of
Panaji
Mapusa
Pernem
Bicholim
1. General Administration 2295.00 1522.48 77.59 658.51
Total (1) 2295.00 1522.48 77.59 658.51
2. Public Safety
a) Public lighting 7.00 19.90 0.00 7.44
b) Others 0.00 0.00 0.00 1.65
c) Public safety 0.00 0.00 0.00 0.00
Total (2) 7.00 19.90 0.00 9.09
3. Public Health Conveniences and Instructions
a) Water Safety 1.00 3.67 0.00 0.09
b) Drainage, conservancy
and sanitary
0.00 10.21 0.00 13.66
c) Public garden 1.00 16.15 0.00 0.03
d) Public works 135.00 447.78 2.82 106.57
e) Public Instructions 0.00 0.00 0.00 1.24
Total (3) 137.00 477.81 2.82 121.59
4. Miscellaneous
a) Repayment of loans
and interest etc.
187.00 0.00 0.00 0.00
b) Others 13.00 0.00 2.61 78.12
Total (4) 200.00 0.00 2.61 78.12
Total Expenditure
(1+2+3+4) 2639.00 2020.19 83.02 867.31
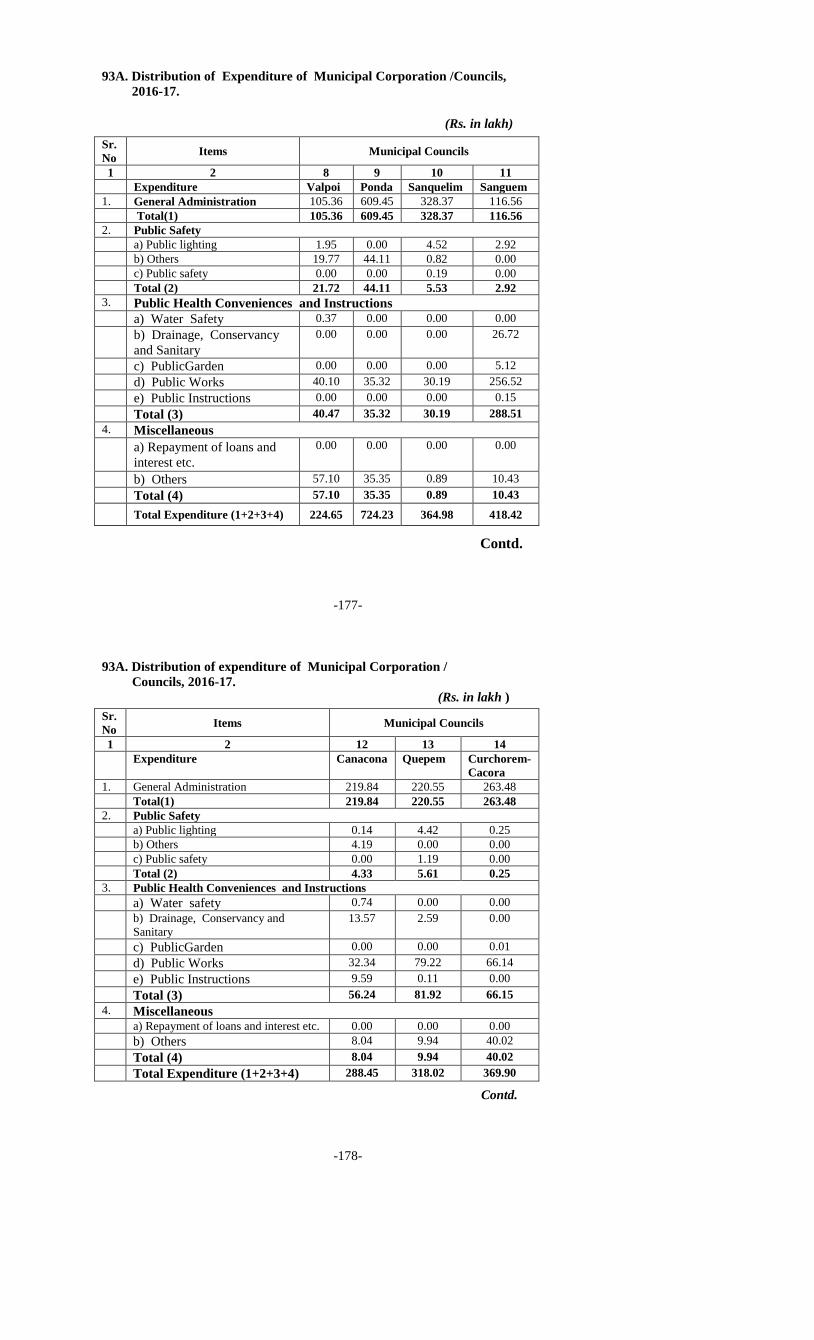
93A. Distribution of Expenditure of Municipal Corporation /Councils,
2016-17.
(Rs. in lakh)
Contd.
-177-
93A. Distribution of expenditure of Municipal Corporation /
Councils, 2016-17.
(Rs. in lakh )
Contd.
-178-
Sr.
No Items Municipal Councils
1 2 8 9 10 11
Expenditure Valpoi Ponda Sanquelim Sanguem
1. General Administration 105.36 609.45 328.37 116.56
Total(1) 105.36 609.45 328.37 116.56
2. Public Safety
a) Public lighting 1.95 0.00 4.52 2.92
b) Others 19.77 44.11 0.82 0.00
c) Public safety 0.00 0.00 0.19 0.00
Total (2) 21.72 44.11 5.53 2.92
3. Public Health Conveniences and Instructions
a) Water Safety 0.37 0.00 0.00 0.00
b) Drainage, Conservancy
and Sanitary
0.00 0.00 0.00 26.72
c) PublicGarden 0.00 0.00 0.00 5.12
d) Public Works 40.10 35.32 30.19 256.52
e) Public Instructions 0.00 0.00 0.00 0.15
Total (3) 40.47 35.32 30.19 288.51
4. Miscellaneous
a) Repayment of loans and
interest etc.
0.00 0.00 0.00 0.00
b) Others 57.10 35.35 0.89 10.43
Total (4) 57.10 35.35 0.89 10.43
Total Expenditure (1+2+3+4) 224.65 724.23 364.98 418.42
Sr.
No Items Municipal Councils
1 2 12 13 14
Expenditure
Canacona Quepem Curchorem-
Cacora
1. General Administration 219.84 220.55 263.48
Total(1) 219.84 220.55 263.48
2. Public Safety
a) Public lighting 0.14 4.42 0.25
b) Others 4.19 0.00 0.00
c) Public safety 0.00 1.19 0.00
Total (2) 4.33 5.61 0.25
3. Public Health Conveniences and Instructions
a) Water safety 0.74 0.00 0.00
b) Drainage, Conservancy and
Sanitary
13.57 2.59 0.00
c) PublicGarden 0.00 0.00 0.01
d) Public Works 32.34 79.22 66.14
e) Public Instructions 9.59 0.11 0.00
Total (3) 56.24 81.92 66.15
4. Miscellaneous
a) Repayment of loans and interest etc. 0.00 0.00 0.00
b) Others 8.04 9.94 40.02
Total (4) 8.04 9.94 40.02
Total Expenditure (1+2+3+4) 288.45 318.02 369.90

93A. Distribution of expenditure of Municipal Corporation /
Councils, 2016-17 (Concld.) (Rs in lakh)
Source: Directorate of Municipal Administration
-179-
XXII TAXES
94. Customs Revenue collected for the years 2014-15, 2015-16 & 2016-17.
(Rs. in Crores)
Sl.
No. Article 2014-15 2015-16 2016-17
1 2 3 4 5
I. Imports (Basic and Additional Duties)
1. Chemicals including drugs &
medicines 9.7 10.83 14.03
2. Machinery 7.42 7.3 4.83
3. Iron & steel 3.03 2.5 22.07
4. Motor vehicles & parts thereof 0.02 0 0
5. Wood, pulp, paper, parts and articles
thereof 3.87 10.93 0.47
6. Rubber & articles thereof 5.23 0.04 49.31
7. Copper 0.02 0 3.18
8. Zinc 3.09 0 0
9. Petroleum etc. 64.740 86.81 98.31
10 All other articles 783.70 957.36 1575.67
GrossTotal (1 to 10) 880.82 1075.77 1767.87
Contd.
-180-
Sr.
no Items Municipal Councils
1 2 15 16 17
Expenditure
Margao Cuncolim Mormugao
1. General Administration 648.59 268.00 1138.29
Total (1) 648.59 268.00 1138.29
2. Public Safety
a) Public lighting 19.26 0.49 4.24
b) Others 0.00 0.00 22.12
c) Public safety 8.95 0.00 0.00
Total (2) 28.21 0.49 26.36
3. Public Health Conveniences and Instructions
a) Water safety 3.87 0.00 0.00
b) Drainage, conservancy and
sanitary
10.10 0.00 20.89
c) Public garden 57.91 0.00 0.00
d) Public works 39.37 41.44 41.91
e) Public instructions 7.14 0.00 3.88
Total (3) 118.39 41.44 66.68
4. Miscellaneous
a) Repayment of loans and
interest etc.
0.00 0.00 32.50
b) Others 1421.15 17.00 81.87
Total (4) 1421.15 17.00 114.37
Total Expenditure(1+2+3+4) 2216.34 326.93 1345.70
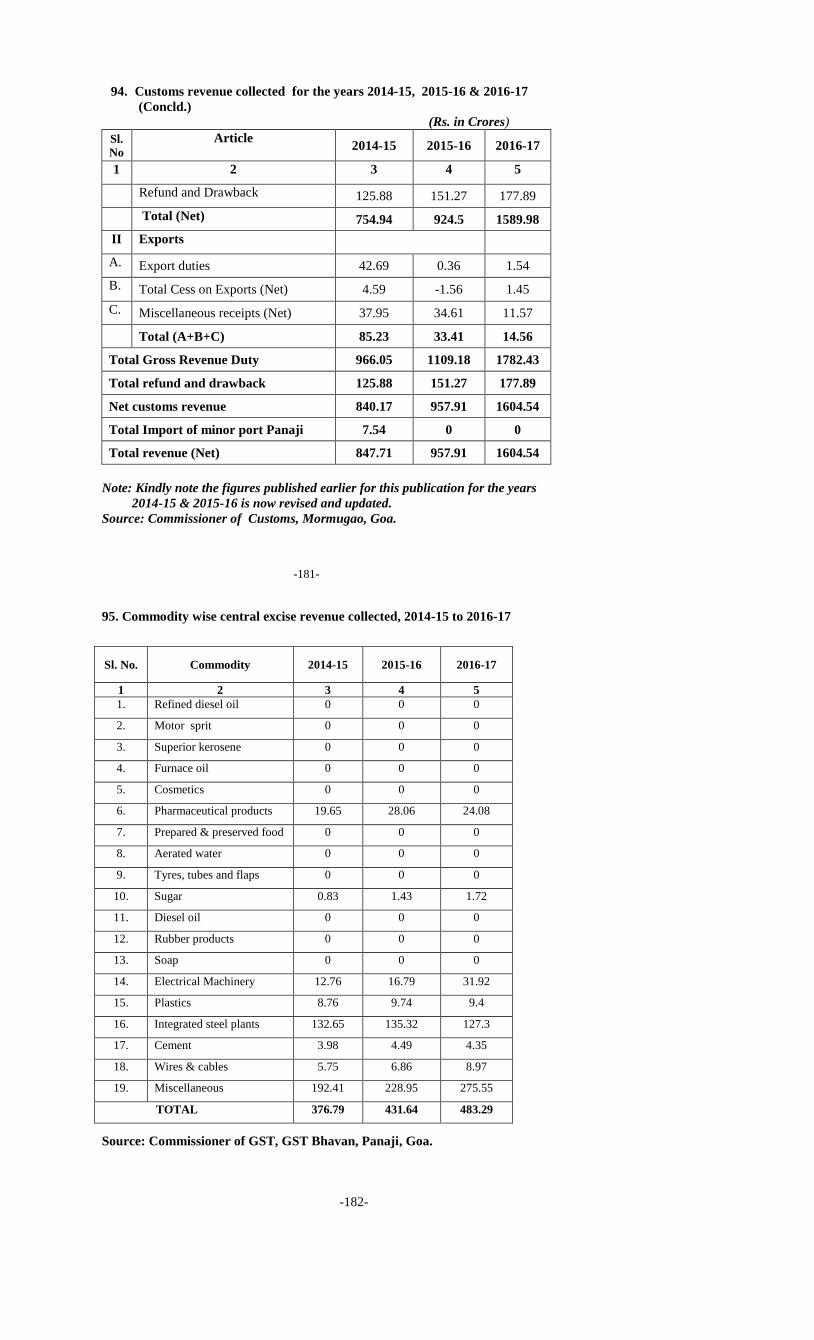
94. Customs revenue collected for the years 2014-15, 2015-16 & 2016-17
(Concld.)
(Rs. in Crores)
Sl.
No
Article
2014-15 2015-16 2016-17
1 2 3 4 5
Refund and Drawback 125.88 151.27 177.89
Total (Net) 754.94 924.5 1589.98
II Exports
A. Export duties 42.69 0.36 1.54
B. Total Cess on Exports (Net) 4.59 -1.56 1.45
C. Miscellaneous receipts (Net) 37.95 34.61 11.57
Total (A+B+C) 85.23 33.41 14.56
Total Gross Revenue Duty 966.05 1109.18 1782.43
Total refund and drawback 125.88 151.27 177.89
Net customs revenue 840.17 957.91 1604.54
Total Import of minor port Panaji 7.54 0 0
Total revenue (Net) 847.71 957.91 1604.54
Note: Kindly note the figures published earlier for this publication for the years
2014-15 & 2015-16 is now revised and updated.
Source: Commissioner of Customs, Mormugao, Goa.
-181-
95. Commodity wise central excise revenue collected, 2014-15 to 2016-17
Source: Commissioner of GST, GST Bhavan, Panaji, Goa.
-182-
Sl. No. Commodity 2014-15 2015-16 2016-17
1 2 3 4 5
1. Refined diesel oil 0 0 0
2. Motor sprit 0 0 0
3. Superior kerosene 0 0 0
4. Furnace oil 0 0 0
5. Cosmetics 0 0 0
6. Pharmaceutical products 19.65 28.06 24.08
7. Prepared & preserved food 0 0 0
8. Aerated water 0 0 0
9. Tyres, tubes and flaps 0 0 0
10. Sugar 0.83 1.43 1.72
11. Diesel oil 0 0 0
12. Rubber products 0 0 0
13. Soap 0 0 0
14. Electrical Machinery 12.76 16.79 31.92
15. Plastics 8.76 9.74 9.4
16. Integrated steel plants 132.65 135.32 127.3
17. Cement 3.98 4.49 4.35
18. Wires & cables 5.75 6.86 8.97
19. Miscellaneous 192.41 228.95 275.55
TOTAL 376.79 431.64 483.29
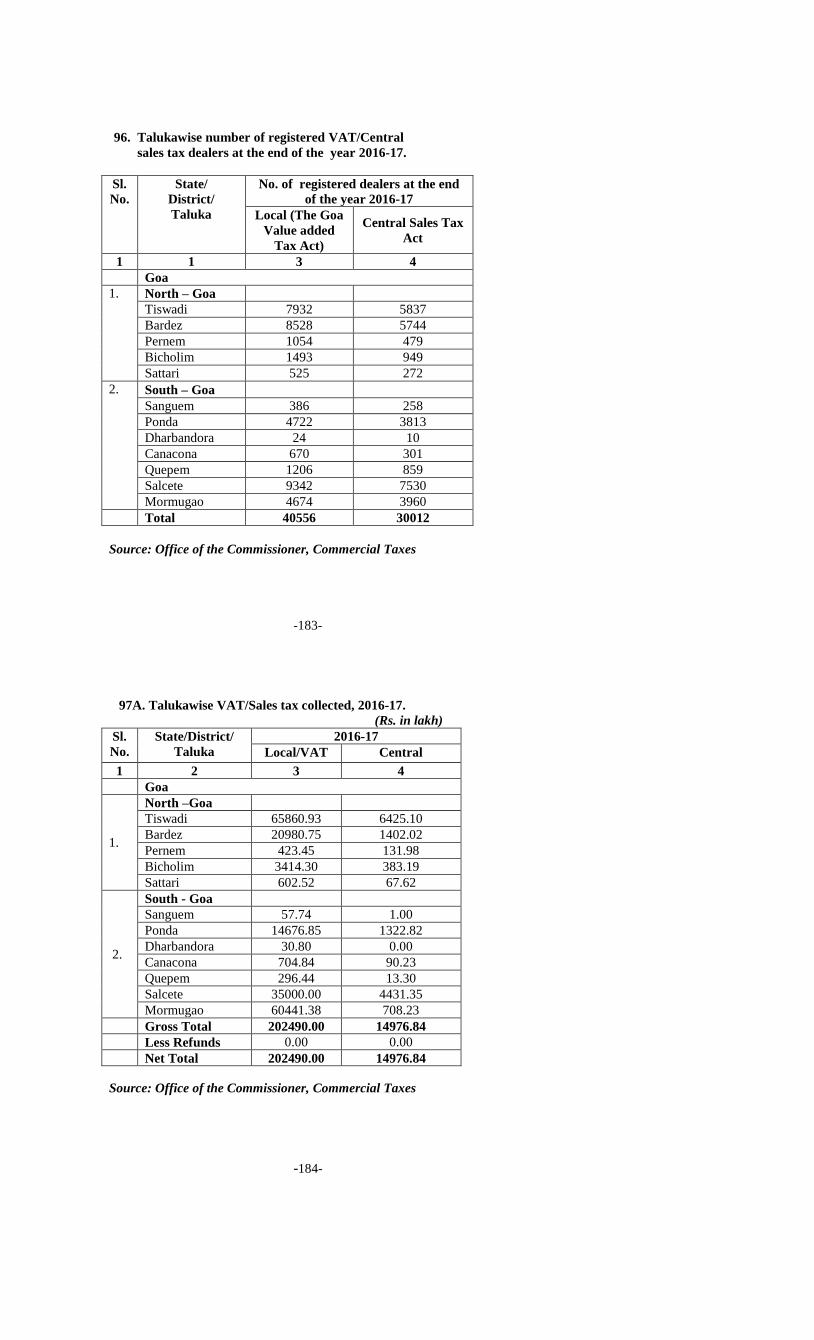
96. Talukawise number of registered VAT/Central
sales tax dealers at the end of the year 2016-17.
Sl.
No.
State/
District/
Taluka
No. of registered dealers at the end
of the year 2016-17
Local (The Goa
Value added
Tax Act)
Central Sales Tax
Act
1 1 3 4
Goa
1. North – Goa
Tiswadi 7932 5837
Bardez 8528 5744
Pernem 1054 479
Bicholim 1493 949
Sattari 525 272
2. South – Goa
Sanguem 386 258
Ponda 4722 3813
Dharbandora 24 10
Canacona 670 301
Quepem 1206 859
Salcete 9342 7530
Mormugao 4674 3960
Total 40556 30012
Source: Office of the Commissioner, Commercial Taxes
-183-
97A. Talukawise VAT/Sales tax collected, 2016-17.
(Rs. in lakh)
Sl.
No.
State/District/
Taluka
2016-17
Local/VAT Central
1 2 3 4
Goa
1.
North –Goa
Tiswadi 65860.93 6425.10
Bardez 20980.75 1402.02
Pernem 423.45 131.98
Bicholim 3414.30 383.19
Sattari 602.52 67.62
2.
South - Goa
Sanguem 57.74 1.00
Ponda 14676.85 1322.82
Dharbandora 30.80 0.00
Canacona 704.84 90.23
Quepem 296.44 13.30
Salcete 35000.00 4431.35
Mormugao 60441.38 708.23
Gross Total 202490.00 14976.84
Less Refunds 0.00 0.00
Net Total 202490.00 14976.84
Source: Office of the Commissioner, Commercial Taxes
-184-

97B. Talukawise Entertainment tax, Luxury tax, and
Entry tax collected, 2016-17 (Rs. in lakh)
Sl.
No.
State/District/
Taluka
Entertainment
Tax
Luxury Tax Entry Tax
1 2 3 4 5
Goa
1.
North – Goa
Tiswadi 16290.17 4057.11 7742.55
Bardez 0.00 6007.04 352.25
Pernem 0.00 122.01 8.41
Bicholim 0.00 16.72 638.78
Sattari 0.00 2.95 112.72
2.
South – Goa
Sanguem 0.00 0.00 0.00
Ponda 0.00 25.45 3198.10
Dharbandora 0.00 0.00 0.72
Canacona 20.80 1463.76 1831.54
Quepem 0.00 7.99 2.00
Salcete 25.00 1789.03 4273.58
Mormugao 0.00 1867.83 26807.40
Gross Total 16335.97 15359.89 44968.05
Less Refunds 0.00 0.00 0.00
Net Total 16335.97 15359.89 44968.05
Source: Office of the Commissioner , Entertainment Tax
-185-
98. Income tax, Corporate tax, and Other taxes
Collected, 2016-17.
(Rs. in Crores)
Sl.
No. Item Amount
1 2 3
1. Income Tax 574.90
2. Corporate Tax 704.7
3. Other Taxes 45.7
Total 1325.3
Source: Office of the Commissioner, Income Tax
-186-

XXIII EXCISE 99 A. Talukawise number of shops licenced to sell liquor,
2016-17 (Retail)
Sl.
No
State/
District/
Taluka
Retail sale of
IMFL &
CL For
consumption
Retail sale of
IMFL &
CL in sealed
bottles
2016-17
1 2 3 4
Goa
1.
North – Goa
Tiswadi 817 263
Bardez 1982 607
Pernem 420 138
Bicholim 300 55
Sattari 160 18
2.
South – Goa
Sanguem 216 18
Ponda 647 129
Dharbandora 0 0
Canacona 363 56
Quepem 401 58
Salcete 1495 376
Mormugao 498 91
Source: Office of the Commissioner of Excise, Panaji-Goa.
-187-
99B. Talukawise Number of shops licensed to sell
liquor, 2016-17. (Wholesale)
Sl.
No.
State/District/
Taluka
Wholesale of
IMFL
Wholesale of
CL
2016-17
1 2 3 4
Goa
1.
North – Goa
Tiswadi 28 6
Bardez 73 27
Pernem 10 5
Bicholim 4 2
Sattari 4 5
2.
South – Goa
Sanguem 0 1
Ponda 13 3
Dharbandora 0 0
Canacona 11 11
Quepem 10 6
Salcete 44 17
Mormugao 6 1
Source: Office of the Commissioner of Excise, Panaji-Goa..
-188-
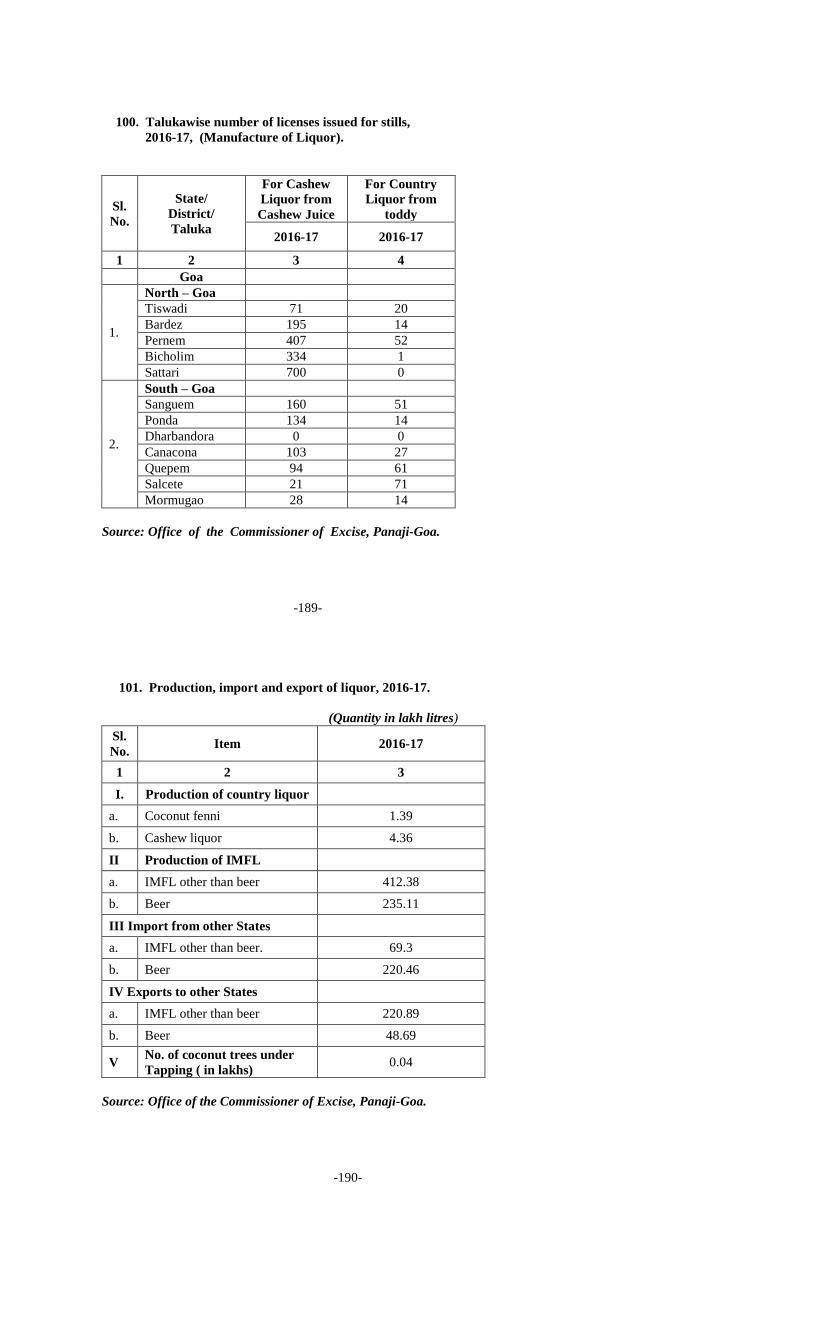
100. Talukawise number of licenses issued for stills,
2016-17, (Manufacture of Liquor).
Sl.
No.
State/
District/
Taluka
For Cashew
Liquor from
Cashew Juice
For Country
Liquor from
toddy
2016-17 2016-17
1 2 3 4
Goa
1.
North – Goa
Tiswadi 71 20
Bardez 195 14
Pernem 407 52
Bicholim 334 1
Sattari 700 0
2.
South – Goa
Sanguem 160 51
Ponda 134 14
Dharbandora 0 0
Canacona 103 27
Quepem 94 61
Salcete 21 71
Mormugao 28 14
Source: Office of the Commissioner of Excise, Panaji-Goa.
-189-
101. Production, import and export of liquor, 2016-17.
(Quantity in lakh litres)
Sl.
No. Item 2016-17
1 2 3
I. Production of country liquor
a. Coconut fenni 1.39
b. Cashew liquor 4.36
II Production of IMFL
a. IMFL other than beer 412.38
b. Beer 235.11
III Import from other States
a. IMFL other than beer. 69.3
b. Beer 220.46
IV Exports to other States
a. IMFL other than beer 220.89
b. Beer 48.69
V No. of coconut trees under
Tapping ( in lakhs) 0.04
Source: Office of the Commissioner of Excise, Panaji-Goa.
-190-

102. Excise revenue receipts collected, 2016-17.
(Rs. in lakh)
Sl.
No. Item 2016-17
1 2 3
1. Country Spirits 178.63
2. Malt liquor 8914.52
3. Liquor
a) Library cess 1298.37
b) Health surcharge 480.72
c) Application Fees 1628.07
4. Foreign liquor and spirits 637.16
5. Denatured & commercial spirits 6.40
6. Medicinal & toilet preparations
containing alcohol 536.44
7. Wines 605.33
8. Indian made foreign liquor 13849.91
9. Spirits 1152.64
10. Sales to canteen stores departments 6.65
11. Licences 1367.35
12. Fines and confiscations 17.11
13. Others receipts 321.47
14. Other Administrative Service 0.16
Total 31000.93
Source: Office of the Commissioner of Excise, Panaji-Goa.
-191-
XXIV LABOUR AND EMPLOYMENT
103. Working of Employment Exchanges, 2016-17.
Sl.
No. Item
Year
2016-17
1 2 3
1. No. of exchanges and sub-exchanges 2
2. Registration during the year 21675
3. Vacancies notified during the year 2629
4. Percentage of vacancies notified to total
registrations during the year 12.13
5.
Applicants placed in employment during
the year 1738
6.
Number of job seekers on the live
register at the end of the year 1,17,738
7. Percentage of vacancies notified during
the year to the total number of job
seekers in the live registers at the end of
the year.
2.233
Source: Regional Employment Exchange, Panaji-Goa
-192-
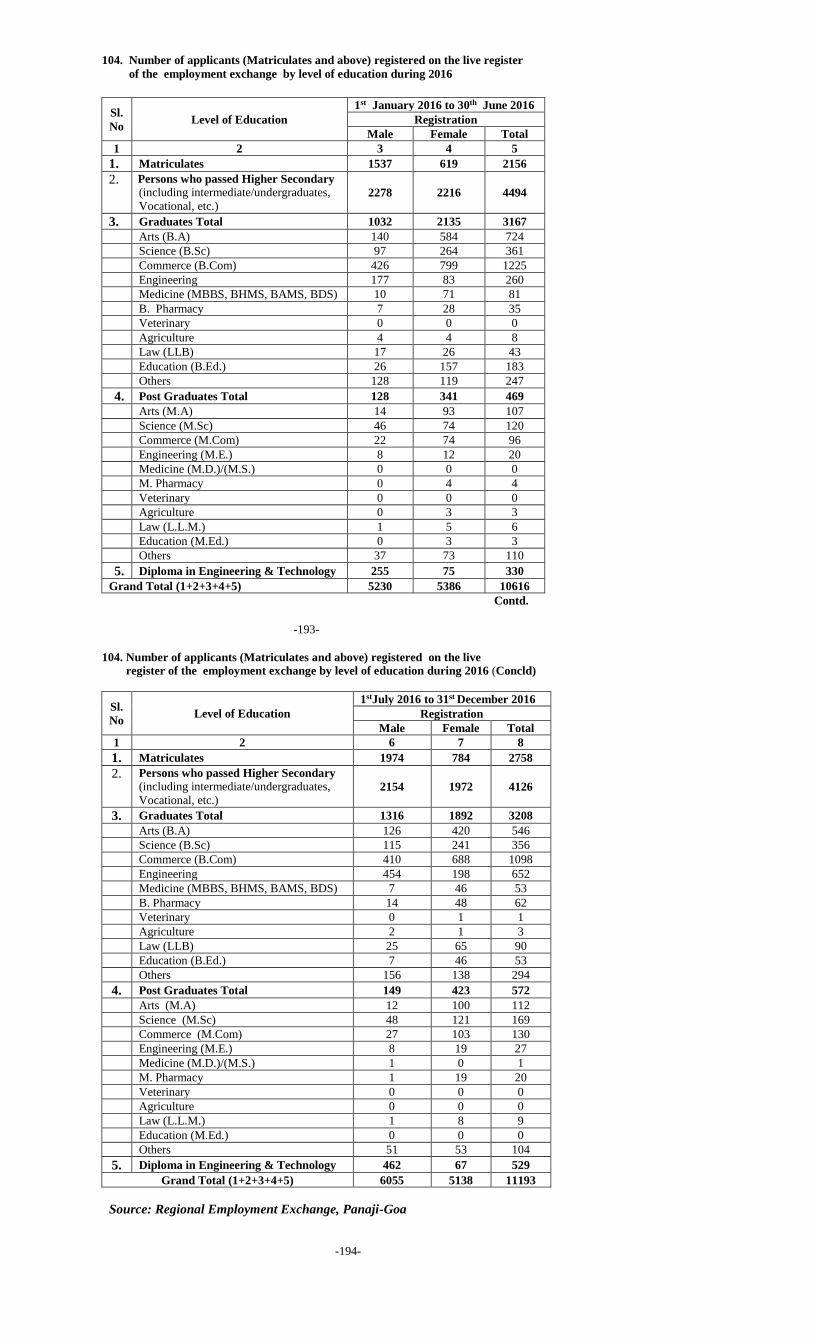
104. Number of applicants (Matriculates and above) registered on the live register
of the employment exchange by level of education during 2016
Sl.
No Level of Education
1st January 2016 to 30th June 2016
Registration
Male Female Total
1 2 3 4 5
1. Matriculates 1537 619 2156
2. Persons who passed Higher Secondary (including intermediate/undergraduates,
Vocational, etc.) 2278 2216 4494
3. Graduates Total 1032 2135 3167
Arts (B.A) 140 584 724
Science (B.Sc) 97 264 361
Commerce (B.Com) 426 799 1225
Engineering 177 83 260
Medicine (MBBS, BHMS, BAMS, BDS) 10 71 81
B. Pharmacy 7 28 35
Veterinary 0 0 0
Agriculture 4 4 8
Law (LLB) 17 26 43
Education (B.Ed.) 26 157 183
Others 128 119 247
4. Post Graduates Total 128 341 469
Arts (M.A) 14 93 107
Science (M.Sc) 46 74 120
Commerce (M.Com) 22 74 96
Engineering (M.E.) 8 12 20
Medicine (M.D.)/(M.S.) 0 0 0
M. Pharmacy 0 4 4
Veterinary 0 0 0
Agriculture 0 3 3
Law (L.L.M.) 1 5 6
Education (M.Ed.) 0 3 3
Others 37 73 110
5. Diploma in Engineering & Technology 255 75 330
Grand Total (1+2+3+4+5) 5230 5386 10616
Contd.
-193-
104. Number of applicants (Matriculates and above) registered on the live
register of the employment exchange by level of education during 2016 (Concld)
Sl.
No Level of Education
1stJuly 2016 to 31st December 2016
Registration
Male Female Total
1 2 6 7 8
1. Matriculates 1974 784 2758
2. Persons who passed Higher Secondary (including intermediate/undergraduates,
Vocational, etc.) 2154 1972 4126
3. Graduates Total 1316 1892 3208
Arts (B.A) 126 420 546
Science (B.Sc) 115 241 356
Commerce (B.Com) 410 688 1098
Engineering 454 198 652
Medicine (MBBS, BHMS, BAMS, BDS) 7 46 53
B. Pharmacy 14 48 62
Veterinary 0 1 1
Agriculture 2 1 3
Law (LLB) 25 65 90
Education (B.Ed.) 7 46 53
Others 156 138 294
4. Post Graduates Total 149 423 572
Arts (M.A) 12 100 112
Science (M.Sc) 48 121 169
Commerce (M.Com) 27 103 130
Engineering (M.E.) 8 19 27
Medicine (M.D.)/(M.S.) 1 0 1
M. Pharmacy 1 19 20
Veterinary 0 0 0
Agriculture 0 0 0
Law (L.L.M.) 1 8 9
Education (M.Ed.) 0 0 0
Others 51 53 104
5. Diploma in Engineering & Technology 462 67 529
Grand Total (1+2+3+4+5) 6055 5138 11193
Source: Regional Employment Exchange, Panaji-Goa
-194-

105. Number of applicants (Matriculates and above) who got placement from the
live register of the employment exchange by level of education during 2016.
Sl
No Level of Education
1stJan 2016 to 30thJune 2016
Placement
Male Female Total
1 2 3 4 5
1. Matriculates 46 8 54
2. Persons who passed Higher Secondary (including intermediate/undergraduates,
Vocational, etc.) 48 21 69
3. Graduates Total 75 89 164
Arts (B.A) 8 13 21
Science (B.Sc.) 11 6 17
Commerce (B.Com.) 15 10 25
Engineering 6 2 8
Medicine (MBBS, BHMS,BAMS,BDS) 0 0 0
B. Pharmacy 0 2 2
Veterinary 0 0 0
Agriculture 0 0 0
Law (LLB) 1 4 5
Education (B.Ed.) 9 45 54
Others 25 7 32
4. Post Graduates Total 70 49 119
Arts (M.A.) 3 2 5
Science (M.Sc.) 1 4 5
Commerce (M.Com.) 1 2 3
Engineering (M.E.) 0 0 0
Medicine (M.D.)/(M.S.) 0 0 0
M. Pharmacy 0 0 0
Veterinary 0 0 0
Agriculture 0 0 0
Law (L.L.M.) 0 0 0
Education (M.Ed.) 1 1 2
Others 64 40 104
5. Diploma in Engineering & Technology 19 1 20
Grand Total (1+2+3+4+5) 258 168 426
Contd.
-195-
105. Number of applicants (Matriculates and above) who got placement from the live
register of the employment exchange by level of education during 2016 (Concld.)
Sl
No Level of Education
1stJuly 2016 to 31stDecember 2016
Placement
Male Female Total
1 2 6 7 8
1. Matriculates 113 5 118
2. Persons who passed Higher Secondary (including intermediate/undergraduates,
Vocational, etc.) 59 1 60
3. Graduates Total 168 33 201
Arts (B.A) 3 4 7
Science (B.Sc) 0 1 1
Commerce (B.Com) 7 10 17
Engineering 0 1 1
Medicine (MBBS,BHMS,BAMS,BDS) 0 0 0
B. Pharmacy 0 0 0
Veterinary 0 0 0
Agriculture 0 0 0
Law (LLB) 0 0 0
Education (B.Ed.) 4 13 17
Others 154 4 158
4. Post Graduates Total 269 18 287
Arts (M.A) 0 1 1
Science (M.Sc) 2 3 5
Commerce (M.Com) 2 0 2
Engineering (M.E.) 0 0 0
Medicine (M.D.)/(M.S.) 0 0 0
M. Pharmacy 0 0 0
Veterinary 0 0 0
Agriculture 0 0 0
Law (L.L.M.) 0 0 0
Education (M.Ed.) 0 0 0
Others 265 14 279
5. Diploma in Engineering & Technology 49 1 50
Grand Total (1+2+3+4+5) 658 58 716
Source: Regional Employment Exchange, Panaji-Goa
-196-

106. Number of job seekers (Matriculates and above) on the live register of the
employment exchange as on Dec. 2016 by level of education
Source: Regional Employment Exchange, Panaji-Goa.
.-197-
107. Loss of Mandays due to strikes and lockouts,
2006 to 2016.
Sl.
No. Year
No. of work
stoppage due to
No. of workers
involved
No. of mandays
lost
Strikes Lock-
outs Strikes
Lock-
outs Strikes
Lock-
Outs
1 2 3 4 5 6 7 8
1. 2006 - - - - - -
2. 2007 - - - - - -
3. 2008 - - - - - -
4. 2009 - - - - - -
5. 2010 - 7 - 350 - 10500
6. 2011 1 - 250 - 2250 -
7. 2012 1 - 75 - 1162.5 -
8. 2013 2 - 1375 - 63570 -
9. 2014 - - - - - -
10. 2015 - - - - - -
11. 2016 2 - 158 - 1288 -
Source: Office of the Commissioner, Labour
-198-
Sl.
No Level of Education
Number of Job seekers on the Live
Register at the end of the year
2016
Male Female Total
1 2 3 4 5
1. Matriculates 18894 9473 28367
2. Persons who passed Higher Secondary (including intermediate/undergraduates,
Vocational, etc.) 14801 20764 35565
3. Graduates Total 13276 28119 41395
Arts (B.A) 1837 6882 8719
Science (B.Sc) 1357 3536 4893
Commerce (B.Com) 5863 10823 16686
Engineering 2063 1143 3206
Medicine (MBBS,BHMS,BAMS,BDS) 96 423 519
B. Pharmacy 82 357 439
Veterinary 2 8 10
Agriculture 21 16 37
Law (LLB) 293 948 1241
Education (B.Ed.) 191 1961 2152
Others 1471 2022 3493
4. Post Graduates Total 1786 4766 6552
Arts (M.A) 215 1398 1613
Science (M.Sc) 416 1062 1478
Commerce (M.Com) 442 1261 1703
Engineering (M.E.) 57 63 120
Medicine (M.D., M.S.) 7 13 20
M. Pharmacy 20 77 97
Veterinary 0 3 3
Agriculture 3 8 11
Law (L.L.M.) 33 91 124
Education (M.Ed) 5 14 19
Others 588 776 1364
5. Diploma in Engineering & Technology 3102 783 3885
Grand Total (1+2+3+4+5) 51859 63905 115764

108. Trade Unions, 2012 to 2016
Sl.
No. Item
Year
2012 2013 2014 2015 2016
1 2 3 4 5 6 7
1. No. of Trade Unions
a) Registered 253 265 273 282 290
b) Submitting returns 80 46 74 36 42
2. Membership at the end of the year
a) Males 61320 7586 56435 6827 13666
b) Females 6487 726 4693 598 1154
c) Total 67807 8312 61128 7425 14820
3. Income including
balance carried over
from previous year
(Rs. in lakh)
305.56 139.44 311.43 133.43 164.63
4. Expenditure (Rs. in
lakh) 185.86 46.77 146.26 50.43 80.16
5. Balance of funds at
the close of the year
(Rs. in lakh)
119.70 92.67 165.17 83.00 84.47
Source: Office of the Commissioner, Labour
-199-
109. General information pertaining to the employees of the
State Government Departments, Grants-in-Aid Institutions
and State Public Sector Undertakings in Goa as on
1st January, 2015.
Sl.
No. Particulars
Number of Employees in
State
Govern-
ment
Depart-
ments
GIA
Institu-
tions
State Public
Sector Under-
taking
Total
1 2 3 4 5 6
1. Total no. of
Employees 41878 15636 3742 61256
2. Male
Female
29467
12411
6711
8925
3182
560
39360
21896
3. a. Regular 35522 13166 2940 51628
b. Ad-hoc 1686 659 229 2574
c. Work Charge 3335 15 - 3350
d. Others # 1335 1796 573 3704
3
Scheduled Caste
Scheduled Tribe
Other Backward
Class
1852
3267
6179
239
599
1487
73
253
382
2164
4119
8048
Contd.
#:- Others include employees on consolidated salary, contract, part-time, hour lecture
basis, etc.
-200-

109. General information pertaining to the employees of the
State Government Departments, Grants-in-Aid Institutions
and State Public Sector Undertakings in Goa as on
1st January, 2015 (Concld.)
Sl.
No
Particulars
Number of Employees in
State
Govern-
ment
Depart-
ments
GIA
Institu-
tions
State
Public
Sector
Under-
taking
Total
1 2 3 4 5 6
4. Employees as per group
Group A
Group B
Group C
Group D
Others #
1410
1492
30388
7253
1335
588
4037
6469
2746
1796
68
149
2378
574
573
2066
5678
39235
10573
3704
5. Largest Government
department and
No. of employees
Police Department with 7399 employees
forms 17.67% of the total number of
employees in Government Departments
6.
6
.
Largest GIA institution
and
No. of employees
School Education Department with 10307
employees forms 65.92% of the total
number of employees in Grant in Aid
Institutions
7. Largest SPSU &
No. of employees
Kadamba Transport Corporation with 2056
employees forms 54.94% of the total
number of employees in SPSU.
#:- Others include employees on consolidated salary, contract, part-time, hour
lecture basis, etc.
Source : Directorate of Planning, Statistics & Evaluation, Porvorim-Goa.
-201-
XXV EDUCATION
110. Number of schools, colleges and enrollment
during the academic Year 2016-17.
(in number)
Sl.
No Item 2016-17
1 2 3
I. Primary Level (Classes I to IV) *
1. a) No. of Primary schools (I –IV) 1181
Central Schools -
b) No. of Middle schools having Primary
department (I – VII) -
c) No. of High / higher secondary Schools
having primary department
(I –X / I – XII)
256/48
Central Schools -
Total No. of Schools at Primary Level 1181
2. Enrollment of Students 96467
II. Middle Level (Classes V to VII) *
1. a) No. of Middle schools (I/V-VII)(I/V-I/VII) 68
b) No. of Secondary/higher secondary schools
having middle department (I-X / I-XII) 398
Total No. of Schools at Middle Level 466
2. Enrollment of Students 71162
III. Secondary level (Classes VIII to X) *
1. a) No. of Secondary Schools 401
b) No. of Higher Secondary Schools with secondary
department -
Total No. of Schools at Secondary Level 401
2. Enrollment of Students 71789
Contd.
-202-

110. Number of schools, colleges and enrollment during
the academic Year 2016-17 (Concld.)
(in number)
Sl.
No Item 2016-17
1 2 3
IV. Higher Secondary Level (Classes XI to XII) * 1. a) No. of Higher Secondary Schools 99
Central Schools -
2. Enrollment of Students 36046
V. Colleges for General Education # 1. Number 29
2. Enrollment (Undergraduate Students) 8703
VI. Colleges for Professional Education $
1. Number 15
2. Enrollment 8785
VII. Institution for Professional & Technical Education (Pre-Metric Level) $$
a) Number 10
b) Enrollment 773
Source: *: Directorate of Education
#: Relates to institutions under Directorate of Higher Education
$: Relates to institutions under Directorate of Technical Education
$$ : Directorate of Skill Development & Entrepreneurship .
-203-
111. Sexwise out-turn of matriculates, 2006-07 to 2016-17.
Sl.
No Year
No. of students passed
Boys Girls Total
1 2 3 4 5
1. 2006-07 6684 6670 13354
2. 2007-08 6260 6391 12651
3. 2008-09 6521 6602 13123
4. 2009-10 7578 7195 14773
5. 2010-11 7178 6860 14038
6. 2011-12 5541 4879 10420
7. 2012-13 8393 8334 16727
8. 2013-14 7802 7777 15579
9. 2014-15 8576 8587 17163
10. 2015-16 8888 9178 18066+330(Exempted)=18396
11. 2016-17 8504 8921 17425+596(Exempted)=18021
Source: Directorate of Education.
-204-

112. Out-turn of graduates and Post-graduates during the year,
2016-17.
Sl.
No. Degree Courses
No. of students
passed during
2016-17
1 2 3
1. B.A. 1181
2. B.Sc. 610
3. B.Com. 2005
4. BCA 293
5. BBA 382
6. B ped. 47
7. BSW 5
8. BSc(HC) 30
9. B.Ed. 296
10. B.Ed (Special) 23
11. M.A. 365
12. M.Sc. 355
13. M.Com. 363
14. BA, L.L.B 62
15. L.L.B. Degree 72
16. L.L.B. (Hon.) 07
Source : Goa University.
-205-
112 (A) Number of students graduated in Professional courses
in the year 2017.
Sl.
No. Degree/Diploma Courses
No. of students
graduated in 2017
1 2 3
1. Bachelor of Engineering 1065
2. Master of Engineering 108
3. Bachelor in Pharmacy 72
4. MBBS 94
5. Bachelor in Dental Studies 21
6. Bachelor in Homeopathic Medical Sciences 37
7. MD/MS 43
8. Bachelor in Ayurvedic Medical Sciences 25
9. Master in Pharmacy 53
10. B.Sc. Nursing 102
11. Bachelor in Fine Arts 11
12. Bachelor of Architecture 43
13. Master of Dental Studies 23
14. Master in Sciences Hydrography 4
15. Medical Diploma 18
16. M.Sc. Nursing 13
Source: Goa University.
-206-

113. Number of sports coaching camps organized
and participants attended, 2016-17.
Sl.
No Type of games
played (Events)
2016-17
Camps
Organized
Participants
1 2 3 4
1. Athletics 6 150
2. Football 5 130
3. Volleyball 3 70
4. Basketball 7 150
5. Kabaddi 7 150
6. Hockey 3 75
7. Table Tennis 6 40
8. Mallakhamb 4 20
9. Throw ball 2 30
10. Boxing 5 90
11. Kho-Kho 1 30
12. Rope Skipping 6 60
13. Chess 6 50
14. Taekwondo 6 80
15. Swimming & Diving 6 100
16. Total (1 to 15) 73 1225
Contd.
-207-
113. Number of sports coaching camps organized
and participants attended, 2016-17 (Concld.)
Sl.
No Type of games played
(Events)
2016-17
Camps
Organized
Participants
1 2 3 4
17. Rifle Shooting 6 60
18. Judo 5 80
19. Baseball 6 150
20. Cricket 3 90
21. Netball 1 20
22. Roller Skating 6 50
23. Gymnastics 6 60
24. Archery 3 50
25. Badminton 6 60
26. Squash 6 30
27. Tennis Ball Cricket 4 80
28. Beach Volleyball 6 36
29. Yoga 4 40
30. Squay Martial Arts 6 120
31. Total (17 to 30) 68 926
Grand Total (16+31) 141 2151
Source : Directorate of Sports and Youth Affairs
-208-

114. Pre-national, summer & Diet coaching camps organized for boys & girls for the year 2016-17.
Contd.
-209-
114. Pre-national, summer & Diet coaching camps organized for boys & girls for the year 2016-17 (Concld.)
Sl.
No
Type of games
played (Events)
Pre-national
Coaching camps
organized
Summer
Coaching camps
organized
Diet Coaching
camps organized
Camps
Partici-
pants
Camps
Partici-
pants
Camps
Partici-
pants
1 2 3 4 5 6 7 8
17. Rifle Shooting 6 60 - - - -
18. Judo 5 80 - - - -
19. Baseball 6 150 - - - -
20. Cricket 3 90 - - - -
21. Netball 1 20 - - - -
22. Roller Skating 6 50 - - - -
23. Gymnastics 6 60 - - - -
24. Archery 3 50 - - - -
25. Badminton 6 60 - - - -
26. Squash 6 30 - - - -
27. Tennis Ball Cricket 4 80 - - - -
28. Beach Volleyball 6 36 - - - -
29. Yoga 4 40 - - - -
30. Squay Martial Arts 6 120 - - - -
31. Total (17 to 30) 68 926 - - - -
Grand Total (16+ 31) 136 2001 - - 5 150
Source : Directorate of Sports and Youth Affairs
-210-
Sl.
No
Type of games
played (Events)
Pre-national
Coaching camps
organized
Summer
Coaching camps
organized
Diet Coaching
camps organized
Camps
Partici-
pants
Camps
Partici-
pants
Camps
Partici-
pants
1 2 3 4 5 6 7 8
1. Athletics 6 150 - - - -
2. Football 4 100 - - 1 30
3. Volleyball 2 40 - - 1 30
4. Basketball 6 120 - - 1 30
5. Kabaddi 6 120 - - 1 30
6. Hockey 3 75 - - - -
7. Table Tennis 6 40 - - - -
8. Mallakhamb 4 20 - - - -
9. Throw ball 2 30 - - - -
10. Boxing 5 90 - - - -
11. Kho-Kho - - - - 1 30
12. Rope Skipping 6 60 - - - -
13. Chess 6 50 - - - -
14. Taekwondo 6 80 - - - -
15. Swimming & Diving 6 100 - - - -
16. Total (1 to 15) 68 1075 - - 5 150

115. Month wise birth registered for the year 2016.
Sr.
No. Month
2016
Normal Delayed Total
1. January 1474 141 1615
2. February 1519 118 1637
3. March 1828 98 1926
4. April 1849 105 1954
5. May 1489 113 1602
6. June 1738 124 1862
7. July 1705 97 1802
8. August 2043 114 2157
9. September 1935 76 2011
10. October 2168 96 2264
11. November 2169 96 2265
12. December 1693 83 1776
Total 21610 1261 22871
Source: Directorate of Planning, Statistics & Evaluation.
-211-
116. Talukawise birth registered for the year 2016.
Sr.
No Taluka 2016 #
Normal Delayed Total
1. Tiswadi 6478 99 6577
2. Bardez 4643 227 4870
3. Pernem 747 82 829
4. Bicholim 58 36 94
5. Sattari 118 48 166
North Goa 12044 492 12536
6. Sanguem 91 44 135
7. Ponda 1490 201 1691
8. Dharbandora 498 63 561
9. Canacona 5291 274 5565
10. Quepem 16 26 42
11. Salcete 33 45 78
12. Mormugao 2147 116 2263
South Goa 9566 769 10335
Goa State Total 21610 1261 22871
Source: Directorate of Planning, Statistics & Evaluation # Information is as per calendar year.
-212-

XXVI PUBLIC HEALTH AND VITAL STATISTICS
117. Number of medical institutions & their activities, 2016-17
(in number)
Sl.
No Item
State / District
Goa North Goa South
Goa
1 2 3 4 5
1. GOVERNMENT HOSPITALS
1. No. of hospitals 31 13 18
2. Patients treated outdoor 905519 517785 387734
3. Patients treated indoor 206406 154061 52345
4. Deliveries conducted 11110 7198 3912
5. Beds 2983 1972 1011
II. PRIVATE HOSPITALS
1. No. of hospitals (P) 119 52 67
2. Deliveries conducted 6406 2544 3862
3. Beds (P) 2768 1301 1467
III. RURAL MEDICAL DISPENSARIES
1. No. of rural medical
dispensaries 30 16 14
2. Patients treated outdoor 44185 20379 23806
Contd. (P) - Provisional
-213-
117. Number of medical institutions & their activities, 2016-17.
(in number)
Sl.
No. Item
State / District
Goa North
Goa
South Goa
1 2 3 4 5
IV. COMMUNITY HEALTH CENTERS
1. No. of Community Health
Centers 4 2 2
2. Patients treated outdoor 95291 38834 56457
3. Patients treated indoor 7504 2781 4723
4. Deliveries conducted 270 107 163
5. Beds 190 70 120
V. PRIMARY HEALTH CENTERS (With attached beds)
1. No. of Primary Health
Centers 14 7 7
2. Patients treated outdoor 214341 147065 67276
3. Patients treated indoor 8575 4914 3661
4. Deliveries conducted 176 130 46
5. Beds 279 160 119
VI. PRIMARY HEALTH CENTERS (Without beds)
1. No. of Primary Health
Centers 10 4 6
2. Patients treated outdoor 56388 24093 32295
Contd.
-214-

117. Number of medical institutions and their activities, 2016-17.
(in number)
Sl.
No Item
State / District
Goa North Goa South Goa
1 2 3 4 5
VII. URBAN HEALTH CENTERS
1. No. of Urban Health
Centers (including 1 under
GMC).
5 3 2
2 Outdoor Patients 17567 17359 208
VIII MEDICAL DISPENSARIES
1. No. of medical
dispensaries 1 - 1
2. Patients treated outdoor 4060 0 4060
IX SUB CENTERS
1. No. of sub-centers 214 109 105
X DENTAL CLINICS (Government)
1. No. of Dental clinics 28 16 12
2. No. of Patients treated 43945 30391 13554
3. New cases 20448 14881 5567
4. Total attendance 43253 30047 13206
5. Students covered under
dental check up in schools 43331 22719 20612
Contd.
-215-
117. Number of medical institutions and their activities, 2016-17.
(in number)
Sl.
No Item
State / District
Goa North Goa South Goa
1 2 3 4 5
XI. T. B. CONTROL PROGRAMME
1. T.B. cases detected
(New) 1246 798 448
XII. NATIONAL FILARIA CONTROL PROGRAMME
1. Persons examined in
night blood survey 35152 16990 18162
2. New carrier detected &
treated 0 0 0
3. Old carrier detected &
treated 0 0 0
4. Persons with external
manifestation 135 75 60
5. Person examined &
treated at OPD Filaria
Clinics
0 0 0
6. Domiciliary visits
carried out 0 0 0
Contd.
-216-

117. Number of medical institutions & their activities, 2016-17.
(in number)
Contd.
-217-
117. Number of medical institutions and their activities, 2016-17.
(In number)
Sl.
No
Item
State / District
Goa North Goa South Goa
1 2 3 4 5
Sterilisation
3. Male 10 3 7
4. Female 2656 1367 1289
5. IUD insertions 1328 698 630
6. C.C. users 36045 20404 15641
7. O.P. users 1812 674 1138
8. Post Partum Centres 3 2 1
MTP Centers
9. Government 12 6 6
10. Private 82 59 23
11. MTPs performed 609 367 242
XVI . SCHOOL HEALTH PROGRAMME
1.
No. of students
examined 315685 156176 159509
Contd.
-218-
Sl.
No. Item
State / District
Goa North
Goa South Goa
1 2 3 4 5
XIII. NATIONAL MALARIA ERADICATION PROGRAMME
1. Active surveillance 205775 135109 70666
2. Passive surveillance 145355 94794 50561
3. Mass survey 48748 34162 14586
4. Total 399878 264065 135813
5. Total positive cases
detected 739 549 190
XIV. LEPROSY CONTROL PROGRAMME
1. Population surveyed 1516220 850578 665642
2. New cases detected 130 73 57
3. Cases cured 91 10 81
XV FAMILY WELFARE PROGRAMME
Family welfare centers
1. Urban 6 3 3
2. Rural 31 14 17

117. Number of medical institutions and their activities, 2016-17.
(in number)
Sl.
No. Item
State / District
Goa North Goa South Goa
1 2 3 4 5
2. No. of students found
defective 14199 7595 6604
3. No. of Students vaccinated
with T.T.
37921
17621
20300
3a. 10 years TT 19866 8831 11035
3b 10 to 16 years TT 18055 8790 9265
4 B.C.G. vaccinations 18696 10198 8498
XVII. STD CONTROL PROGRAMME
1. No. of STD clinics 3 1 2
2. No. of STD cases
(excluding GMC) 3426 1343 2083
3. No. of old STD cases - - -
4. Persons found positive 4 3 1
5. Conducted VDRL test on
STD patients 8375 3310 5065
6. Conducted VDRL Test on
Antenatal patients 10187 5231 4956
7. Antenatal patients found
positive 0 0 0
Contd.
-219-
117. Number of medical institutions and their activities 2016-17. (concld.)
(in number)
Sl.
No Item
State / District
Goa North
Goa South Goa
1 2 3 4 5
XVIII. CONTROL OF BLINDNESS
1. No. of Intra ocular
operations performed 11705 6826 4879
2. No. of Eye Camps
organized 55 22 33
3. No.of patients examined 149223 91832 57391
XIX. AYURVEDA DISPENSARY
1. No. 25 13 12
2. Patients treated outdoor 30195 14929 15266
XX. HOMEOPATHIC DISPENSARY
1. No. 14 6 8
2. Patients treated outdoor 42237 23027 19210
Source: Directorate of Health Services
-220-

118. Month-wise progress of family welfare programme,
2016-17.
(in number)
Sl.
No. Month
Sterilisation
Performed
Intra Uterine
Device
(IUD) Inserted
Condom
Pieces
Distributed
1 2 3 4 5
1. April, 2016 205 116 20837
2. May, 2016 236 92 20701
3. June, 2016 233 95 23055
4. July , 2016 257 153 26599
5. August,2016 228 111 28263
6. Sept., 2016 189 104 28489
7. Oct., 2016 231 143 33976
8. Nov., 2016 234 102 36580
9. Dec., 2016 225 104 35356
10. Jan., 2017 235 105 39844
11. Feb., 2017 186 111 32849
12. March, 2017 207 92 33901
TOTAL 2666 1328 360450
Source: Directorate of Health Services
-221-
119. Talukawise need & achievements under Family welfare
programme, 2016-17.
(in number)
Sl.
No.
State/
District/
Taluka
Family Planning Methods 2016-17
C.C. users O.P. users
Service
need
Achieve-
ments
Service
need
Achieve-
ments
(1) (2) (3) (4) (5) (6)
1. Goa State 10275 36045 3508 1812
(i) North Goa 4579 20404 1528 674
Tiswadi 1446 5532 513 242
Bardez 1618 8737 526 230
Pernem 611 2659 192 75
Bicholim 689 1715 222 60
Sattari 215 1761 75 67
(ii) South Goa 5696 15641 1980 1138
Sanguem 125 126 80 56
Ponda 1327 4873 420 438
Dharbandora 303 569 61 21
Canacona 300 1308 95 28
Quepem 747 2112 361 85
Salcete 1482 4809 530 448
Mormugao 1412 1844 433 62
Contd.
-222-

119. Talukawise need & achievements under
Family welfare programme, 2016-17 (Concld.)
(in number)
Sl.
No State/
District/
Taluka
Family Planning Methods, 2016-17.
Sterilization Performed IUD Insertions
Service
need
Achieve-
ments
Service
need
Achieve-
ments
(1) (2) (7) (8) (9) (10)
1. Goa State 4324 2666 2763 1328
(i) North Goa 1991 1369 1211 698
Tiswadi 648 838 379 269
Bardez 613 478 419 295
Pernem 247 4 146 28
Bicholim 318 43 189 75
Sattari 165 6 78 31
(ii) South Goa 2333 1297 1552 630
Sanguem 87 67 60 39
Ponda 384 208 332 193
Dharbandora 78 0 66 55
Canacona 143 16 71 4
Quepem 424 26 252 43
Salcete 560 678 437 177
Mormugao 657 302 334 119
Source: Directorate of Health Services
-223-
120. Progress of revised National Tuberculosis control
programme, 2016-17.
(in number)
Sl.
No. Item
State/District
2016-17
Goa North
Goa
South
Goa
1 2 3 4 5
1. Total X-ray examinations
1a New N.A. N.A. N.A.
1b. Old N.A. N.A. N.A.
2. Total sputum examination 22844 17146 5698
2a. New 19002 14556 4446
2b. Old 3842 2590 1252
3. New pulmonary cases detected 787 505 282
3a. Sputum positive 584 370 214
3b. Sputum negative 203 135 68
4. New extra pulmonary cases 459 293 166
5. T.B cases detected (New)
Total (3 & 4) 1246 798 448
6. New cases from outside Goa This data is not applicable
since every patient whether
Goan or non-Goan is put on
treatment
7. Patients under treatment at the end of
the year 1573 1010 563
8. Patients who have completed
treatment 365 229 136
Source: Directorate of Health Services
-224-

121. Month-wise B.C.G. vaccinations during 2016-17.
( in number)
Sl.
No Month B.C.G. Vaccinations
1 2 3
1. April, 2016 1610
2. May, 2016 1615
3. June 2016 1465
4. July, 2016 1493
5. August, 2016 1567
6. Sept., 2016 1632
7. Oct., 2016 1637
8. Nov., 2016 1842
9. Dec., 2016 1518
10. Jan., 2017 1473
11. Feb., 2017 1501
12. March, 2017 1343
Total 18696
Source: Directorate of Health Services
-225-
122. General information about the Institute of Psychiatry
and Human Behaviour, 2016-17.
(in number)
Sl.
No. Item 2016-17
(1) (2) (3)
1. No. of hospitals functioning 1
2. No. of doctors 27
3. No. of nurses 54
4. No. of beds 190
5. No. of indoor patients 1472
5a. Male 1000
5b. Female 472
6. No. of outdoor patients 52131
6a. Male 28343
6b. Female 23788
7. No. of patients discharged 1284
7a. Male 898
7b. Female 386
8. No. of deaths occurred in the hospital 4
8a. Male 1
8b. Female 3
9. No. of patients escaped from the hospital 2
9a. Male 1
9b. Female 1
10. Bed occupancy rate 114%
Source: Institute of Psychiatry & Human Behavior, Bambolim Goa.
-226-

123. Sex-wise number of drug addicts treated in the
Institute of Psychiatry and Human Behaviour,
2005-06 to 2016-17.
Sl.
No. Year Male Female Total
(1) (2) (3) (4) (5)
1. 2005 -06 3 1 4
2. 2006 -07 12 2 14
3. 2007 -08 12 3 15
4. 2008 -09 20 3 23
5. 2009 -10 15 0 15
6. 2010 -11 15 2 17
7. 2011 -12 31 2 33
8. 2012-13 59 1 60
9. 2013-14 84 2 86
10. 2014-15 69 6 75
11. 2015-16 55 7 62
12. 2016-17 28 2 30
Source: Institute of Psychiatry& Human Behaviour, Bambolim Goa.
-227-
124. Number of Births, Deaths and Marriages registered,
2013 to 2016.
Sl.
No Item
2013 #
2014 #
2015 #
2016 #
(1) (2) (3) (4) (5) (6)
1. No. of normal live births 21667 21415 21727 21610
2. Birth rate per 1000
population 14.58 14.29 14.39 14.2
3. No. of still births 199 180 189 143
3a Still Birth rate (per 1000
live births) 9.18 8.41 8.70 6.62
4. No. of normal deaths 12196 12692 12738 13130
5. Death rate per 1000
population 8.21 8.47 8.43 8.63
6. No. of marriages 14020 11919 12473 11713
Source: Directorate of Planning, Statistics & Evaluation
# Information is as per calendar year.
-228-

XXVII GENERAL ELECTIONS
125. Result of last elections held in Goa for State Legislative Assembly on 04/02/2017.
Contd.
-229-
Sr.
No Item
Name of the Constituency Mandrem Pernem Bicholim Tivim
1 2 3 4
1 Total contesting candidates 7 8 5 4
2 Total No. of Electors
i. Male 15679 15857 12935 13102
ii. Female 15683 15490 13016 13465
Total 31362 31347 25951 26567
3 Party wise & NOTA votes polled in the EVM
i. INC 16225 1005 1734 10957
ii. BJP 9097 9501 10481 10140
iii. MGP 671 15411 9770 -
iv. NCP 234 123 - 274
v. UGDP - - - -
vi. Shiv Sena - - - -
vii. AAP 616 305 354 698
viii. Goa Forward Party (GFP) - - - -
ix. Goa Vikas Party - 179 - -
x. Goa Praja Party - 70 314 -
xi. Goa Su-raj Party - - -
xii. Goa Suraksha Manch - - - -
xiii. Samajwadi Janata Party (Chandrashekhar) - - - -
xiv. Niz Goenkar Revolution Front Party - - - -
xv. Communist Party of India (CPI) - - - -
xvi. Bahujan Mukti Party 57 104 - -
xvii
.
United Goans Party - - - -
xvii
i.
Ambedkarite Party of India - - - -
xix. Sanjay Krishnarao Prabhu Dessai (IND) 100 - - -
xx. NOTA (None of the above) 411 465 218 178
Total 27411 27163 22871 22247
4 Sex wise votes polled in the EVM (includes NOTA)
i. Male 13286 13508 11194 10634
ii. Female 14125 13655 11677 11611
Total 27411 27163 22871 22245
5 Sex-wise Percentage of votes polled in the EVM (includes NOTA)
i. Male 84.74 85.19 86.54 81.16
ii. Female 90.07 88.15 89.71 86.23
Total 87.40 86.65 88.13 83.73
6 Votes Polled
i. In the Postal Ballot (includes NOTA) 555 567 435 313
ii. Votes rejected (Postal Ballot) 105 91 46 70
Total 660 658 481 383
7 a. Total votes recorded in EVM at Polling Stations 27411 27163 22871 22247
b. Total votes polled through Postal Ballot paper 660 658 481 383
Total votes polled (a+b) 28071 27821 23352 22630
8. Votes polled (NOTA)
i. In the Postal Ballot 4 4 3 1
ii. In the EVM 411 465 218 178
Total 415 469 221 179
9. Tender Votes 0 0 2 2

125. Result of last elections held in Goa for State Legislative Assembly on 04/02/2017.
Contd.
-230-
Sr.
No Item
Name of the Constituency
Mapusa Siolim Saligao Calangute
5 6 7 8
1 Total contesting candidates 7 8 6 3
2 Total No. of Electors
i. Male 14215 13704 12820 12028
ii. Female 14592 14457 13140 12510
Total 28807 28161 25960 24538
3 Party wise & NOTA votes polled in the EVM
i. INC 3004 - 1607 7291
ii. BJP 10836 8595 7518 11075
iii. MGP 4091 - - -
iv. NCP 287 273 - -
v. UGDP - - - -
vi. Shiv Sena - - 423 -
vii. AAP 2304 1841 1321 1456
viii. Goa Forward Party (GFP) - 10103 9658 -
ix. Goa Vikas Party - - - -
x. Goa Praja Party - - - -
xi. Goa Su-raj Party 102 - - -
xii. Goa Suraksha Manch - 518 - -
xiii. Samajwadi Janata Party (Chandrashekhar) - - - -
xiv. Niz Goenkar Revolution Front Party - - - -
xv. Communist Party of India - - 148 -
xvi. Bahujan Mukti Party - 115 - -
xvii. United Goans Party - - - -
xviii
.
Ambedkarite Party of India - - - -
xix. Domnic Alphonso (IND) 1541 - - -
xx. Mukesh Sawant (IND) - 73 - -
xxi. Patric Savio Almeida (IND) - 1491 - - xxii. NOTA (None of the above) 402 212 166 171
Total 22567 23221 20841 19993
4 Sex wise votes polled in the EVM (includes NOTA)
i. Male 11018 11085 10099 9529
ii. Female 11549 12137 10742 10467
Total 22567 23222 20841 19996
5 Sex-wise Percentage of votes polled in the EVM (includes NOTA)
i. Male 77.51 80.89 78.78 79.22
ii. Female 79.15 83.95 81.75 83.67
Total 78.34 82.46 80.28 81.49
6 Votes Polled
i. In the Postal Ballot (includes NOTA) 197 275 187 91
ii. Votes rejected (Postal Ballot) 13 37 23 30
Total 210 312 210 121
7 a. Total votes recorded in EVM at Polling Stations 22567 23221 20841 19993
b. Total votes polled through Postal Ballot paper 210 312 210 121
Total votes polled (a+b) 22777 23533 21051 20114
8. Votes polled (NOTA)
i. In the Postal Ballot 7 0 5 1
ii. In the EVM 402 212 166 171
Total 409 212 171 172
9. Tender Votes 0 0 0 1

125. Result of last elections held in Goa for State Legislative Assembly on 04/02/2017.
Contd.
-231-
Sr.
No Item
Name of the Constituency
Porvorim Aldona Panaji Taleigao
9 10 11 12
1 Total contesting candidates 6 6 7 4
2 Total No. of Electors
i. Male 11985 13227 10648 13405
ii. Female 12338 14204 11555 14454
Total 24323 27431 22203 27859
3 Party wise & NOTA votes polled in the EVM
i. INC - 4917 - 11389
ii. BJP 6860 9300 7808 8536
iii. MGP 219 2976 -
iv. NCP - 140 62 -
v. UGDP - - - -
vi. Shiv Sena - - - -
vii. AAP 839 3247 1927 1960
viii. Goa Forward Party (GFP) - - - -
ix. Goa Vikas Party - - - -
x. Goa Praja Party - - - -
xi. Goa Su-raj Party - - - -
xii. Goa Suraksha Manch - - 318 -
xiii. Samajwadi Janata arty (Chandrashekhar) 133 - - -
xiv. Niz Goenkar Revolution Front Party - - - -
xv. Communist Party of India - - - -
xvi. Bahujan Mukti Party - - - -
xvii. United Goans Party - - 6766 -
xviii
.
Ambedkarite Party of India - - - -
xix. Rohan Khaunte (IND) 11024 - - -
xx. Wilbur Ticlo (IND) 144 - - -
xxi. Anandrao N. Nagvenkar (IND) - 642 - - xxii. Dilip Ghadi (IND) - - 36 -
xxiii
.
Parshuram Dodamani (IND) - - 20 -
xiv. Vijay More (IND) - - - 113
xxv. NOTA (None of the above) 170 194 171 250
Total 19389 21416 17108 22248
4 Sex wise votes polled in the EVM (includes NOTA)
i. Male 9312 9913 8117 10434
ii. Female 10077 11503 8992 11814
Total 19389 21416 17109 22248
5 Sex-wise Percentage of votes polled in the EVM (includes NOTA)
i. Male 77.70 74.95 76.23 77.84
ii. Female 81.67 80.98 77.82 81.74
Total 79.71 78.07 77.06 79.86
6 Votes Polled
i. In the Postal Ballot (includes NOTA) 267 190 231 308
ii. Votes rejected (Postal Ballot) 43 43 63 39
Total 310 233 294 347
7 a. Total votes recorded in EVM at Polling Stations 19389 21416 17108 22248
b. Total votes polled through Postal Ballot paper 310 233 294 347
Total votes polled (a+b) 19699 21649 17402 22595
8. Votes polled (NOTA)
i. In the Postal Ballot 6 2 4 2
ii. In the EVM 170 194 171 250
Total 176 196 175 252
9. Tender Votes 0 0 0 1

125. Result of last elections held in Goa for State Legislative Assembly on 04/02/2017.
Contd.
-232-
Sl
No Item
Name of the Constituency St. Cruz St. Andre Cumbarjua Maem
13 14 15 16
1 Total contesting candidates 9 10 5 8
2 Total No. of Electors
i. Male 13457 9732 12147 13386
ii. Female 14251 11209 12905 13725
Total 27708 20941 25052 27111
3 Party wise & NOTA votes polled in the EVM
i. INC 6130 7981 3927 7343
ii. BJP 5497 2978 12225 12238
iii. MGP 2674 2360 - -
iv. NCP 75 322 - 527
v. UGDP - - - -
vi. Shiv Sena - - - -
vii. AAP 1686 970 2378 524
viii. Goa Forward Party (GFP) - - - -
ix. Goa Vikas Party - - - -
x. Goa Praja Party - - - -
xi. Goa Su-raj Party - 47 - -
xii. Goa Suraksha Manch - - - 2284
xiii. Samajwadi Janata Party (Chandrashekhar) - - - -
xiv. Niz Goenkar Revolution Front Party - - - -
xv. Communist Party of India (CPI) 105 - - -
xvi. Bahujan Mukti Party - - - -
xvii. United Goans Party - - - -
xviii. Ambedkarite Party of India - - - -
xix. Helena Lourenco (IND) 224 - - -
xx. Jose Lopes (IND) 61 - - -
xxi. Rodolfo Louis Fernandes (IND) 5187 - - -
xxii. Ahwin Menino Rosario (IND) - 29 - -
xxiii. Dhaku Arjun Madkaikar (IND) - 1274 - -
xxiv. Simao Aleixo Caiado (IND) - 143 - -
xxv. Sunil Savlo Kerkar (IND) - 97 - -
xxvi. Prasad Harmalkar (IND) - - 461 -
xxvii. Vishal Volvoikar (IND) - - 973 -
xxviii
.
Ashok Anant Gaonkar (IND) - - - 141
xxix. Deepkumar D. Mapari (IND) - - - 159
xxx. Prabhakar Laxman Gaonkar (IND) - - - 173
xxxi. NOTA (None of the above) 298 150 341 377
Total 21937 16351 20305 23766
4 Sex wise votes polled in the EVM (includes NOTA)
i. Male 10431 7273 9467 11592
ii. Female 11507 9078 10838 12174
Total 21938 16351 20305 23766
5 Sex-wise Percentage of votes polled in the EVM (includes NOTA)
i. Male 77.51 74.73 77.94 86.60
ii. Female 80.75 80.99 83.98 88.70
Total 79.18 78.08 81.05 87.66
6 Votes Polled
i. In the Postal Ballot (includes NOTA) 278 203 251 342
ii. Votes rejected (Postal Ballot) 45 2 40 41
Total 323 205 291 383
7 a. Total votes recorded in EVM at Polling
Stations 21937 16351 20305 23766
b. Total votes polled through Postal Ballot paper 323 205 291 383
Total votes polled (a+b) 22260 16556 20596 24149
8. Votes polled (NOTA)
i. In the Postal Ballot 5 2 7 0
ii. In the EVM 298 150 341 377
Total 303 152 348 377
9. Tender Votes 1 0 0 0

125. Result of last elections held in Goa for State Legislative Assembly on 04/02/2017.
Contd.
-233-
Sl
No Item
Name of the Constituency
Sanquelim Poriem Valpoi Priol
17 18 19 20
1 Total contesting candidates 7 5 4 4
2 Total No. of Electors
i. Male 13032 15400 14326 14562
ii. Female 13173 15278 14503 14998
Total 26205 30678 28829 29560
3 Party wise & NOTA votes polled in the EVM
i. INC 7807 14597 13210 423
ii. BJP 9906 10710 7698 -
iii. MGP - 466 3199 10190
iv. NCP 841 - - -
v. UGDP - - - -
vi. Shiv Sena - - - -
vii. AAP 407 402 407 454
viii. Goa Forward Party (GFP) - - - -
ix. Goa Vikas Party - - - -
x. Goa Praja Party - - - -
xi. Goa Su-raj Party 72 - - -
xii. Goa Suraksha Manch 3779 - - -
xiii. Samajwadi Janata Party (Chandrashekhar) - - - -
xiv. Niz Goenkar Revolution Front Party - - -
xv. Communist Party of India - - - -
xvi. Bahujan Mukti Party - - - -
xvii. United Goans Party - - - -
xviii
.
Ambedkarite Party of India - - -
xix. Mahesh Shantaram Parab (IND) 218 - - -
xx. Ajit Sadanand Mhalshekar (IND) - 284 - -
xxi. Govind Gaude (IND) - - - 14865
xxii. NOTA (None of the above) 324 549 362 447
Total 23354 27008 24876 26379
4 Sex wise votes polled in the EVM (includes NOTA)
i. Male 11494 13396 12131 12860
ii. Female 11860 13612 12745 13520
Total 23354 27008 24876 26380
5 Sex-wise Percentage of votes polled in the EVM (includes NOTA)
i. Male 88.20 86.99 84.68 88.31
ii. Female 90.03 89.10 87.88 90.15
Total 89.12 88.04 86.29 89.24
6 Votes Polled
i. In the Postal Ballot (includes NOTA) 346 588 450 566
ii. Votes rejected (Postal Ballot) 45 111 56 35
Total 391 699 506 601
7 a. Total votes recorded in EVM at Polling Stations 23354 27008 24876 26379
b. Total votes polled through Postal Ballot paper 391 699 506 601
Total votes polled (a+b) 23745 27707 25382 26980
8. Votes polled (NOTA)
i. In the Postal Ballot 5 3 0 1
ii. In the EVM 324 549 362 447
Total 329 552 362 448
9. Tender Votes 0 0 0 0

125. Result of last elections held in Goa for State Legislative Assembly on 04/02/2017.
Contd.
-234-
Sl
No Item
Name of the Constituency
Ponda Shiroda Marcaim Mormugao
21 22 23 24
1 Total contesting candidates 5 6 5 6
2 Total No. of Electors
i. Male 15710 13759 13327 10989
ii. Female 14843 14499 13654 10433
Total 30553 28258 26981 21422
3 Party wise & NOTA votes polled in the EVM
i. INC 9343 11005 1249 8241
ii. BJP 6380 6162 3381 8286
iii. MGP 3693 5725 16583 -
iv. NCP - - - -
v. UGDP - - - -
vi. Shiv Sena - - - 49
vii. AAP 519 579 958 265
viii. Goa Forward Party (GFP) - - - -
ix. Goa Vikas Party - - -
x. Goa Praja Party - - - -
xi. Goa Su-raj Party - - -
xii. Goa Suraksha Manch - - - -
xiii. Samajwadi Janata Party(Chandrashekhar) - - - -
xiv. Niz Goenkar Revolution Front Party - - - -
xv. Communist Party of India - - - -
xvi. Bahujan Mukti Party - - - -
xvii. United Goans Party - - - -
xviii. Ambedkarite Party of India - - - -
xix. Rajesh Verekar (IND) 4447 - - -
xx. Diya Chandrakant Shetkar (IND) - 136 - -
xxi. Nilesh Govind Gaonkar - 444 - -
xxii. Hanumant Vasant Naik (IND) - - 240 -
xxiii. Maria Liberata Mendonca (IND) - - - 31
xxiv. Parashuram Umaji Sonurlekar (IND) - - - 47
xxv. NOTA (None of the above) 248 190 369 148
Total 24630 24241 22780 17067
4 Sex wise votes polled in the EVM (includes NOTA)
i. Male 12419 11513 11098 8526
ii. Female 12211 12728 11682 8541
Total 24630 24241 22780 17067
5 Sex-wise Percentage of votes polled in the EVM (includes NOTA)
i. Male 79.05 83.68 83.27 77.59
ii. Female 82.27 87.79 85.56 81.87
Total 80.61 85.78 84.43 79.67
6 Votes Polled
i. In the Postal Ballot (includes NOTA) 465 383 576 273
ii. Votes rejected (Postal Ballot) 39 84 106 39
Total 504 467 682 312
7 a. Total votes recorded in EVM at Polling Stations 24630 24241 22780 17067
b. Total votes polled through Postal Ballot paper 504 467 682 312
Total votes polled (a+b) 25134 24708 23462 17379
8. Votes polled (NOTA)
i. In the Postal Ballot 6 4 7 3
ii. In the EVM 248 190 369 148
Total 254 194 376 151
9. Tender Votes 0 0 0 0

125. Result of last elections held in Goa for State Legislative Assembly on 04/02/2017.
Contd.
-235-
Sl
No Item
Name of the Constituency
Vasco Dabolim Cortalim Nuvem
25 26 27 28
1 Total contesting candidates 8 9 10 5
2 Total No. of Electors
i. Male 18416 11332 15308 13167
ii. Female 17185 11146 15152 15030
Total 35601 22478 30460 28197
3 Party wise & NOTA votes polled in the EVM
i. INC 3710 2730 4303 9878
ii. BJP 8634 7111 5592 -
iii. MGP 648 4659 75 -
iv. NCP 4166 1026 - 2864
v. UGDP - - - -
vi. Shiv Sena - - - -
vii. AAP 918 1105 2461 3361
viii. Goa Forward Party (GFP) - - - -
ix. Goa Vikas Party - - 3355 -
x. Goa Praja Party - - 56 -
xi. Goa Su-raj Party - - 255 4279
xii. Goa Suraksha Manch - - - -
xiii. Samajwadi Janata Party (Chandrashekhar) - - - -
xiv. Niz Goenkar Revolution Front Party 59 56 - -
xv. Communist Party of India - - - -
xvi. Bahujan Mukti Party - - - -
xvii. United Goans Party - - 1690 -
xviii. Ambedkarite Party of India - - - -
xix. Gandhi Henriques (IND) 77 - - -
xx. Krishna (Daji) V. Salkar (IND) 7310 - - -
xxi. Kenneth Ian Stewart Silveira (IND) - 129 - -
xxii. Preetam Keluskar (IND) - 108 - -
xxiii. Tara Govind Kerkar (IND) - 123 - --
xxiv. Antonio Vas (IND) - - 5113 -
xxv. Miguel Antonio Rodrigues (IND) - - 176 -
xxvi. Dinesh Bandodkar (IND) - - - 659
xxvii. NOTA (None of the above) 261 167 209 233
Total 25783 17214 23285 21274
4 Sex wise votes polled in the EVM (includes NOTA)
i. Male 12955 8377 11079 9081
ii. Female 12834 8837 12206 12193
Total 25789 17214 23285 21274
5 Sex-wise Percentage of votes polled in the EVM (includes NOTA)
i. Male 70.35 73.92 72.37 68.97
ii. Female 74.68 79.28 80.56 81.12
Total 72.44 76.58 76.44 75.45
6 Votes Polled
i. In the Postal Ballot (includes NOTA) 316 259 201 173
ii. Votes rejected (Postal Ballot) 41 51 29 4
Total 357 310 230 177
7 a. Total votes recorded in EVM at Polling
Stations 25783 17214 23285 21274
b. Total votes polled through Postal Ballot paper 357 310 230 177
Total votes polled (a+b) 26140 17524 23515 21451
8. Votes polled (NOTA)
i. In the Postal Ballot 2 1 1 7
ii. In the EVM 261 167 209 233
Total 263 168 210 240
9. Tender Votes 7 0 1 0

125. Result of last elections held in Goa for State Legislative Assembly on 04/02/2017.
Contd.
-236-
Sl
No Item
Name of the Constituency
Curtorim Fatorda Margao Benaulim
29 30 31 32
1 Total contesting candidates 5 6 4 7
2 Total No. of Electors
i. Male 13653 13976 14069 13679
ii. Female 14531 15001 14381 14923
Total 28184 28977 28450 28602
3 Party wise & NOTA votes polled in the EVM
i. INC 12722 1399 11916 2147
ii. BJP 5080 8969 7849 -
iii. MGP 237 152 211 -
iv. NCP - - - 9327
v. UGDP - - - -
vi. Shiv Sena - - - -
vii. AAP 2688 1466 1817 4155
viii. Goa Forward Party (GFP) - 10351 - -
ix. Goa Vikas Party - - - 486
x. Goa Praja Party - - - -
xi. Goa Su-raj Party - - - 570
xii. Goa Suraksha Manch - - - -
xiii. Samajwadi Janata Party(Chandrashekhar) - - - -
xiv. Niz Goenkar Revolution Front Party - - - -
xv. Communist Party of India - - - -
xvi. Bahujan Mukti Party - - - -
xvii. United Goans Party - - - -
xviii
.
Ambedkarite Party of India - - - -
xix. Jose Paulo Fernandes (IND) 118 - - -
xx. Avin Vishwanath Naik (IND) - 72 - -
xxi. Caetano Rosario Silva (IND) - - - 3971
xxii. Judith Aurelia Baptista (IND) - - - 357
xxiii
.
NOTA (None of the above) 245 219 266 186
Total 21090 22628 22059 21199
4 Sex wise votes polled in the EVM (includes NOTA)
i. Male 9596 10487 10682 9191
ii. Female 11494 12141 11377 12010
Total 21090 22628 22059 21201
5 Sex-wise Percentage of votes polled in the EVM (includes NOTA)
i. Male 70.28 75.04 75.93 67.19
ii. Female 79.10 80.93 79.11 80.48
Total 74.83 78.09 77.54 74.12
6 Votes Polled
i. In the Postal Ballot (includes NOTA) 213 410 294 115
ii. Votes rejected (Postal Ballot) 30 16 13 2
Total 243 426 307 117
7 a. Total votes recorded at Polling Stations 21090 22628 22059 21199
b. Total votes recorded on Postal Ballot paper 243 426 307 117
Total votes polled (a+b) 21333 23054 22366 21316
8. Votes polled (NOTA)
i. In the Postal Ballot 4 1 5 1
ii. In the EVM 245 219 266 186
Total 249 220 271 187
9. Tender Votes 0 0 1 1

125. Result of last elections held in Goa for State Legislative Assembly on 04/02/2017.
Contd.
-237-
Sl
No Item
Name of the Constituency
Navelim Cuncolim Velim Quepem
33 34 35 36
1 Total contesting candidates 7 7 12 5
2 Total No. of Electors
i. Male 13722 14090 14968 15476
ii. Female 13622 14973 16207 15815
Total 27344 29063 31175 31291
3 Party wise & NOTA votes polled in the EVM
i. INC 8104 6361 10293 13283
ii. BJP - 4932 1744 10789
iii. MGP 1776 - - 210
iv. NCP - - 108 -
v. UGDP - - - -
vi. Shiv Sena - 302 - -
vii. AAP 838 3397 3403 1378
viii. Goa Forward Party (GFP) - - 1455 -
ix. Goa Vikas Party 1276 483 - -
x. Goa Praja Party - - - -
xi. Goa Su-raj Party - - 138 251
xii. Goa Suraksha Manch - - - -
xiii. Samajwadi Janata Party(Chandrashekhar) - - - -
xiv. Niz Goenkar Revolution Front Party -- - - -
xv. Communist Party of India - - - -
xvi. Bahujan Mukti Party - - - -
xvii. United Goans Party - - - -
xviii. Ambedkarite Party of India - - 44 -
xix. Avertano Furtado (IND) 5647 - - -
xx. Duarte Pires (IND) 263 - - -
xxi. Edwin Cardozo (IND) 3012 - - -
xxii. Derick Dias (IND) - 111 - -
xxiii. Joaquim Alemao (IND) - 6317 - -
xxiv. Benjamin Silva (IND) - - 5120 -
xxv.. Constancio Fernandes (IND) - - 79 -
xxvi. Edrich Correia (IND) - - 335 -
xxvii. Jose Fernandes (IND) - - 233 -
xxviii
.
Wilson Mazarello (IND) - - 98 -
xxix. NOTA (None of the above) 248 246 258 355
Total 21164 22149 23308 26266
4 Sex wise votes polled in the EVM (includes NOTA)
i. Male 10036 9787 9846 12246
ii. Female 11128 12362 13460 14020
Total 21164 22149 23306 26266
5 Sex-wise Percentage of votes polled in the EVM (includes NOTA)
i. Male 73.14 69.46 65.78 79.13
ii. Female 81.69 82.56 83.05 88.65
Total 77.40 76.21 74.76 83.94
6 Votes Polled
i. In the Postal Ballot (includes NOTA) 187 291 219 396
ii. Votes rejected (Postal Ballot) 3 45 9 14
Total 190 336 228 410
7 a. Total votes recorded in EVM at Polling
Stations 21164 22149 23308 26266
b. Total votes polled through Postal Ballot paper 190 336 228 410
Total votes polled (a+b) 21354 22485 23536 26676
8. Votes polled (NOTA)
i. In the Postal Ballot 1 1 2 2
ii. In the EVM 248 246 258 355
Total 249 247 260 357
9. Tender Votes 0 0 0 1

125. Result of last elections held in Goa for State Legislative Assembly on 04/02/2017 (Concld.)
Source:- Office of the Chief Electoral Officer, Altinho, Panaji-Goa.
Note:- Out of 40 Constituencies, 11 constituencies namely Tivim, Siolim, Calangute, Panaji, St.
Cruz in North Goa, and Priol, Vasco, Benaulim, Velim, Sanvordem , Sanguem in South Goa, the
break-up of Party-wise including NOTA votes polled in the EVM at Sr. No. 3 will not tally with
Sexwise votes polled in the EVM including NOTA at Sr. No. 4 because O/o The Chief Electoral
Officer, Altinho, Panaji, Goa has already finalized the Constituency wise final voters turnout
voting statistics data held on 04/02/2017 as well as the percentage of votes based on the available
data. However, Constituency wise totals of Party-wise and NOTA votes polled in the EVM is
tallying with Form 20 - Final Results Sheets of each Constituency.
-238-
Sl
No Item
Name of the Constituency Curchorem Sanvordem Sanguem Canacona
37 38 39 40
1 Total contesting candidates 4 4 8 5
2 Total No. of Electors
i. Male 12803 13737 12500 16414
ii. Female 13226 14496 13269 16810
Total 26029 28233 25769 33224
3 Party wise & NOTA votes polled in the EVM
i. INC 2768 986 5627 10639
ii. BJP 12515 9069 6554 8476
iii. MGP - 14345 476 395
iv. NCP - - 124 -
v. UGDP - - - -
vi. Shiv Sena - - - -
vii. AAP 2017 - 652 450
viii. Goa Forward Party (GFP) - - - -
ix. Goa Vikas Party - - - -
x. Goa Praja Party - - - -
xi. Goa Su-raj Party - - -
xii. Goa Suraksha Manch 3671 - - -
xiii. Samajwadi Janata Party(Chandrashekhar) - - - -
xiv. Niz Goenkar Revolution Front Party - - - -
xv Communist Party of India - - - -
xvi. Bahujan Mukti Party - - - -
xvii. United Goans Party - - - -
xviii
.
Ambedkarite Party of India - - - -
xix. Balkrishna Marathe (IND) - 152 - -
xx. Dattaprasad Sawardekar (IND) - - 989 -
xxi. Prasad S. Gaonkar (IND) - - 7583 -
xxii. Sudesh Noni Gaunkar (IND) - - 148 -
xxiii
.
Ramesh Tawadkar (IND) - - - 7505
xxiv
.
NOTA (None of the above) 289 302 207 299
Total 21260 24854 22360 27764
4 Sex wise votes polled in the EVM (includes NOTA)
i. Male 9970 11896 10426 13097
ii. Female 11290 12959 11933 14667
Total 21260 24855 22359 27764
5 Sex-wise Percentage of votes polled in the EVM (includes NOTA)
i. Male 77.87 86.60 83.41 79.79
ii. Female 85.36 89.40 89.93 87.25
Total 81.68 88.04 86.77 83.57
6 Votes Polled
i. In the Postal Ballot (includes NOTA) 408 523 323 725
ii. Votes rejected (Postal Ballot) 52 9 8 33
Total 460 532 331 758
7 a. Total votes recorded in EVM at Polling Stations 21260 24854 22360 27764
b. Total votes polled through Postal Ballot paper 460 532 331 758
Total votes polled (a+b) 21720 25386 22691 28522
8. Votes polled (NOTA)
i. In the Postal Ballot 1 3 1 3
ii. In the EVM 289 302 207 299
Total 290 305 208 302
9. Tender Votes 1 0 1 0

125 A. District-wise Results declared on 11/03/2017 of the winning candidates for the General Assembly Elections held on 04/02/2017 (North Goa )
Sl. No.
Name of the Constituency
Name of the Party Affiliation Name of the winning Candidate
Party Symbol
1 2 3 4 5
1. Mandrem Indian National Congress (INC) Dayanand Raghunath Sopte
HAND
2. Pernem Maharashtrawadi Gomantak Party (MGP)
Ajgaonkar Manohar Trimbak
LION
3. Bicholim Bhartiya Janata Party (BJP) Rajesh Patnekar LOTUS
4. Tivim Indian National Congress (INC) Nilkanth Halarnkar HAND
5. Mapusa Bharatiya Janata Party (BJP) Francisco C.J.A. DE Pinto E. Souza
LOTUS
6. Siolim Goa Forward Party Vinoda Datarama paliencar
COCONUT
7. Saligao Goa Forward Party Jayesh Vidyadhar Salgaonkar
COCONUT
8. Calangute Bharatiya Janata Party (BJP) Michael Vincent Lobo LOTUS
9. Porvorim Independent Rohan Khaunte MIKE
10. Aldona Bharatiya Janata Party (BJP) Glenn John Vijay Ambrose E. Souza Ticlo
LOTUS
11. Panaji Bharatiya Janata Party (BJP) Sidharth Sripad Kuncalienker
LOTUS
12. Taleigao Indian National Congress (INC) Jennifer Monserrate HAND
13. St. Cruz Indian National Congress (INC) Antonio Caetano Fernandes
HAND
14. St. Andre Indian National Congress (INC) Francisco Silveira HAND
15. Cumbharjua Bharatiya Janata Party (BJP) Pandurang Arjun Madkaikar
LOTUS
16. Maem Bharatiya Janata Party (BJP) Pravin Zantye LOTUS
17. Sanquelim Bharatiya Janata Party (BJP) Dr. Pramod Pandurang Sawant
LOTUS
18. Poriem Indian National Congress (INC) Pratapsingh Raoji Rane
HAND
19. Valpoi Indian National Congress (INC) Vishwajit Pratapsingh Rane
HAND
Contd.
-239-
125 A. District-wise Results declared on 11/03/2017 of the winning candidates for the General Assembly Elections held on 04/02/2017 (South Goa ) (Concld.)
Source:- Office of the Chief Electoral Officer, Altinho, Panaji-Goa.
-240-
Sl. No.
Name of the Constituency
Name of the Party Affiliation Name of the winning Candidate
Party Symbol
1 2 3 4 5
20. Priol Independent Govind Gaude AUTO RICKSHAW
21. Ponda Indian National Congress (INC) Ravi Sitaram Naik HAND
22. Shiroda Indian National Congress (INC) Suhash Ankush Shirodkar
HAND
23. Marcaim Maharashtrawadi Gomantak Party (MGP)
Ramkrishna alias Sudin Dhavalikar
LION
24. Mormugao Bharatiya Janata Party (BJP) Milind Sagun LOTUS
25. Vasco Bharatiya Janata Party (BJP) Jose Luis Carlos Almeida LOTUS
26. Dabolim Bharatiya Janata Party (BJP) Mauvin Heliodoro Godinho
LOTUS
27. Cortalim Bharatiya Janata Party (BJP) Alina Saldanha LOTUS
28. Nuvem Indian National Congress (INC) Wilfred D’Sa HAND
29. Curtorim Indian National Congress (INC) Aleixo Reginaldo Lourenco
HAND
30. Fatorda Goa Forward Party Vijai Sardesai COCONUT
31. Margao Indian National Congress (INC) Digambar Vasant Kamat HAND
32. Benaulim National Congress Party (NCP) Churchill Alemao CLOCK
33. Navelim Indian National Congress (INC) Luizinho Faleiro HAND
34. Cuncolim Indian National Congress (INC) Clafasio Dias HAND
35. Velim Indian National Congress (INC) Filipe Nery Rodrigues HAND
36. Quepem Indian National Congress (INC) Chandrakant (Babu) Kavlekar
HAND
37. Curchorem Bharatiya Janata Party (BJP) Nilesh Cabral LOTUS
38. Sanvordem Maharashtrawadi Gomantak Party (MGP)
Deepak Prabhu Pauskar LION
39. Sanguem Independent Prasad S. Gaonkar COCONUT FARM
40. Canacona Indian National Congress (INC) Isidore Aleixinho Fernandes
HAND

126. Results of Bye Elections for the State Legislative Assemblies for Panaji and Valpoi Constituencies held on 23/08/2017
Source:- Office of the Chief Electoral Officer, Altinho, Panaji-Goa.
241-
127. Result of last elections held in Goa for Lok Sabha on 16/04/2014.
Source: Office of the Chief Electoral Officer.
-242-
Sl No
Item
Name of the Constituency
Panaji Valpoi
1 2
1 Total contesting candidates 4 3
2 Total No. of Electors
i. Male 10640 14340
ii. Female 11556 14528
Total 22196 28868
3 Party wise & NOTA votes polled in the EVM
i. INC 5059 6101
ii. BJP 9862 16167
iii. Goa Suraksha Manch 220 -
iv. Rohidas Sada Gaonkar (IND) - 316
v. Kenneth Ian Stewart Silveira (IND) 96 -
vi. NOTA (None of the above) 301 454
Total 15538 23038
4 Sex wise votes polled in the EVM (includes NOTA)
i. Male 7544 11657
ii. Female 7994 11381
Total 15538 23038
5 Sex-wise Percentage of votes polled in the EVM (includes NOTA)
i. Male 71.08 81.26
ii. Female 69.01 78.37
Total 70.00 79.80
6 Votes Polled
i. In the Postal Ballot (includes NOTA) - 25
ii. In the EVM (includes NOTA) 15538 23038
Total 15538 23063
7. Votes rejected (Postal Ballot) - 4
8. Votes polled (NOTA)
i. In the Postal Ballot - -
ii. In the EVM 301 454
Total 301 454
9. Tender Votes - 1
10. Winning Candidate Manohar Parrikar Vishwajit Pratapsingh Rane
Sl.
No. Item
Name of the District
North Goa South Goa
1 Total No. of contesting candidates 7 12
2 Total No. of Electors
i. Male 2,55,870 2,72,438
ii. Female 2,59,571 2,72,898
Total 5,15,441 5,45,336
3 Party wise valid votes polled
i. INC 1,32,304 1,66,446
ii. BJP 2,37,903 1,98,776
iii. CPI 5,640 4,437
iv. AAP 15,857 11,246
v. Samajwadi Janata Party (Rashtriya) 3,216 -
vi. All India Trinamool Congress - 11,941
vii. Goa Su-Raj Party - 783
viii. Bahujan Mukti Party - 666
ix. Goemcarancho otrec Asro - 530
x. IND 4,128 7,152
xi IND 1,813 2,586
xii. IND - 790
xiii. IND - 683
Total 4,00,861 4,06,036
4 Sex wise valid votes polled (excluding postal ballots)
i. Male 1,99,489 1,95,128
ii. Female 2,05,701 2,14,329
Total 4,05,190 4,09,457
5 Voting Percentage
i. Male 77.96 71.62
ii. Female 79.25 78.54
Total 78.61 75.08

XXVIII JOINT STOCK COMPANIES 128. Number of Joint Stock Companies
(Limited by shares) at work 2006-07 to 2016-17.
Sl.
No. Year
Type of Company
Public Private Total
1 2 3 4 5
1. 2006-2007 317 4088 4405
2. 2007-2008 384 5322 5706
3. 2008-2009 391 5666 6057
4. 2009-2010 190 3609 3799
5. 2010-2011 193 3905 4098
6. 2011-2012 201 4259 4460
7. 2012-2013 163 4396 4559
8. 2013-2014 161 4543 4704
9. 2014-2015 156 4597 4753
10. 2015-2016 238 5371 5609
11. 2016-2017 246 5668 5914
Source: Registrar of Companies, Panaji-Goa.
-243-
129. Joint Stock Companies (Limited by shares)
registered during 2016-17.
(Rs . in Crores)
Sl.
No Item
No. of Companies Authorised Capital
Public
Limited
Private
Limited
Public
Limited
Private
Limited
(1) (2) (3) (4) (5) (6)
1. Agricultural,
Hunting,
Forestry &
Fishing
- - - -
2. Mining &
Quarrying - 1 00.0100000
3. Manufacturing 3 36 00.1175000 00.5750000
4. Electricity, Gas
& Water - 2 - 00.1100000
5. Constructions - 12 - 00.2150000
6. Wholesale &
Retail Trade,
Restaurants &
Hotels
- 29 - 00.4270000
Contd.
-244-

129. Joint Stock Companies (Limited by Shares)
Registered during 2016-17 (Concld.)
(Rs. in Crores)
Source : Registrar of Companies, Panaji-Goa.
-245-
XXIX MISCELLANEOUS
130. Progress of Small Savings collection , 2016-17.
(Rs. in Crores)
Sl.
No. Item
2016-17
(Margao Post
Office)
2016-17
(Panaji Post
Office)
State
Bank of
India,
Panaji
Branch Gross Net Gross Net
1. Post office Savings account 197.63 31.19 244.78 122.61 -
2. Post office Recurring deposit 71.32 6.27 89.96 211.49 -
3. Post office Time deposit 1TD 12.41 0.49 14.18 18.22 -
4. Post office Time deposit 2TD 1.83 0.77 1.69 4.74 -
5. Post office Time deposit 3TD 1.43 0.53 1.98 4.89 -
6. Post office Time deposit 5TD 3.44 2.35 5.07 13.65 -
7. Monthly Income Scheme 84.04 (-)37.94 103.03 312.37 -
8. Public Provident Fund 10.06 8.87 9.36 77.36 64.06
9. Senior Citizen Scheme 36.33 19.82 41.83 136.02 12.49
10. Sukanya Samruddi - - - - 0.07
11. SSA - - 13.27 26.13 -
12. NSS-92 - - - 0.27 -
13. NSS-87 - - - 28.85 -
TOTAL DEPOSITS 418.49 32.35 525.15 956.60 76.62
Source: Directorate of Small Savings & Lotteries
.
-246-
Sl.
No Item
No. of Companies Authorised capital
Public
Limited
Private
Limited
Public
Limited
Private
Limited
(1) (2) (3) (4) (5) (6)
7. Transport, Storage
& Communications - 9 - 00.1595000
8. Financing
Insurance, Real
Estate & Business
Services
- 13 - 01.2500000
9. Community Social
& Personal Services - 17 - 11.4100000
10. Activities not
adequately defined 5 178 08.6100000 58.1710000
TOTAL 8 297 08.7275000 72.3275000

131. Quantity of Food Grains and Sugar received from the Government
of India (Central Stock) distributed under TPDS for the year 2016-17.
(in metric tonnes)
Sl.
N
o
Particular
Food Grains Total
( 3+4 ) Sugar
Rice Wheat
1 2 3 4 5 6
1. Opening Stock 5285.000 463.000 5748.000 -
2. Quantity
received during
the year
52236.000 7026.000 59262.000 1590.000
3. Sub-total 57521.000 7489.000 65010.000 1590.000
4. Less closing
balance 2587.413 473.353 3060.766 -
5. Total quantity
supplied during the year
54933.587 7015.647 61949.234 1590.000
6. Shortages - - - -
7. Excess - - - -
Source: Directorate of Civil Supplies &Consumer Affairs.
-247-
132. Achievements under various women & child development
programmes 2016-17.
Sl.
No Item 2016-17
1. 2 3
1. Integrated Child Dev. Scheme Projects (Nos.) 12
2a. Anganwadis under ICDS Programme 1256(Operational)
2b . Beneficiaries (Children)/Avg. Per Day 18526
3. Beneficiaries covered under Special/Supplementary
Nutrition Programme (Children, pregnant women &
lactating mothers) average per day
71472
4a. Institutions assisted under the Scheme of children in
need of care and protection 07
4b. Children benefited 346
Source: Directorate of Women & Child Development
-248-

133. Achievements under various social welfare programmes
2016-17.
Sl.
No Item 2016-17
1 2 3
1. Awards for inter-caste Marriages 13 Couples
2. Kanya Dhan for SC Students 49 Girl Students
3. Meritorious Scholarships/Stipend for OBC
Students
5896 Students
4. Welfare of Dhangar Community 323 Beneficiaries
5. Post Matric Scholarships to SC Students 108 Students 6. Grants of Stipends to the Children of those
Engaged in Occupation involving cleaning and
prone to health hazards
18 Students
7. Post Matric Scholarship to OBC Students 1982 Students 8. Pre-Matric Scholarship to OBC Students 159 Students
Contd.
Source : Directorate of Social Welfare.
-249-
133. Achievements under various social welfare programmes
2016-17.
Sl.
No Item 2016-17
1 2 3
9. Merit cum Means Scholarship to Minorities * 114 Students
10. Post Matric Scholarship to Minorities * 239 Students
11. Pre-Matric Scholarship to Minorities 1414 Students
12. Welfare of Handicapped (Scholarships/Stipend) 584 Students
13. Awards for marriages with Disabled Persons 8 Couples
14. Financial Assistance to persons with severe
Disabilities
13 Beneficiaries
15. Award for encouraging disabled persons 5 Beneficiaries
16. Grants to NGOs/Special School for disabilities
for Setting up of Physio Therapy Centre
4 NGOs
17. Scheme for Rehabilitation for person with
disability
1 NGO
18. Setting up of Braille library for visually impaired
persons
2 NGOs
19. Schemes to manage special homes for person
with physical & mental disabilities
2 NGOs
Contd.
Source : Directorate of Social Welfare.
-250-

133. Achievements under various social welfare programmes
2016-17 (concld.)
Sl.
No. Item 2016-17
1 2 3
20. Dayanand Social Security Scheme (Freedom from
Hunger)
1,41,780
Beneficiaries
21. Ummid – Day care centre and Medical Assistance
to Sr. Citizens
28 Centres
22. Bachapan – Social Security cover to Orphan
Children
1 Student
23. Sahayata Ass. To Vol. Org. for Organising Socio-
Cultural activities
4 NGOs
24. Rajiv Awas Yojana 36 Beneficiaries
25. Financial Assistance for Welfare of KIOSK
Owners 11 Beneficiaries
26. Financial Assistance to Self Help Groups 69 SHG’s
27. F.A. to Tiny Entrepreneurs
Padeli, rennder, khajekar, fogeri, chanekar, podders
etc.
556 Beneficiaries
28. Awards for best Social Worker 11 Social Worker 29. Financial Assistance to SC/OBC/Disabled minority
community in nursing courses 87 Students
30. Loans for Physically Handicapped Persons 1 Person
Source : Directorate of Social Welfare .
Note *Merit cum Means Scholarship to Minorities & Post Matric Scholarship
to Minorities Scholarship schemes are 100% Central scheme, hence the
Scholarship is directly transfer to the Students Account by the Central
Government.
-251-
134. Achievements under various Tribal Welfare
Programmes, 2016-17.
Sr.
No
Programme/Schemes
Achievements
Financial
( Rupees
in Lakh)
Physical
1 2 3 4
1. Pre Matric Scholarship to ST students 343.53 7575 Benf.
2. Vidya Laxmi 175.75 703 Benf.
3. Grants to Hostels for ST Students 109.93 8 Hostels
4. Financial Asst. to ST Community in
Nursing Courses
1.13 9 Benf.
5. Antya Sanskar Sahay Yojana 93.81 477 Benf.
6. Gagan Bharari Shiksha Yojana 169.80 2145 Benf.
7. Prashikshan Yatra 93.34 64 Schools
8. Merit based Scholarship and recognition of
High Performance in Board Exams of SSC
& HSSC
93.01 1120 Benf.
9. Post Matric Scholarships to Scheduled
Tribes Students
399.74 4503 Benf.
10. Book Bank 1.65 1 Institution
(44 students)
11. Sahayata 5.23 6 NGOs
Source: Directorate of Tribal Welfare.
-252-

135. Targets & Achievements under the Twenty Point
Programme, (TPP)-2006 during 2016-17.
Item
Code Item Name/Sub Item Name Unit
Target
Achievement
2016-17
1 2 3 4 5
01 A – Employment generation under the National Rural Employment Guarentee(NREG)
01A01 No. of Job cards issued Number - 482
01A02 Employment generated Mandays - 128322
01A03 Wages given in cash Rs. in lakh - 315.01
01 B- Swaranjayanti Gram Swarojgar Yojana
01B01 Individual Swarozgaries Assisted Number - -
01B02 Individual SC Swarozgaries Assisted Number - -
01B03 Individual ST Swarozgaries Assisted Number - -
01B04 Individual women Swarozgaries Assisted Number - -
01B05 Individual Disabled Swarozgaries Assisted Number - -
01E-Self Help Groups (SHG)
01E01 SHGs formed under SGSY Number - -
01E02 To whom income generating activities provided Number - -
03E Distribution of waste land to the landless
03E01 Total Land Distributed Hectare - -
03E02 Land Distributed to SC Hectare - -
03E03 Land Distributed to ST Hectare - -
03E04 Land Distributed to Others Hectare - -
06A – Rural Housing - Indira Awaas Yojana
06A01 Houses constructed Number - 948
06B-EWS/LIG Houses in Urban Areas
06B01 Houses constructed Number - -
07A- Rural Areas National Rural Drinking Water Programme (NRDWP)
07A03 Habitations covered (Partially covered &
Slipped back)
Number - -
07A04 Coverage of water quality affected habitations Number - -
08E – Institutional Delivery
08E01 Delivery in institutions Number - 17516*
Contd.
-253-
135. Targets & Achievements under the Twenty Point
Programme, (TPP)-2006 during 2016-17 (Concld.)
Item
Code
Parameters/
Indicators/
Schemes to be monitored
Unit
Target Achievement
2016-17
1 2 3 4 5
10A –SC-Families Assisted
10A01 SC Families assisted under SCA/SCSP Number - -
10A04 SC students assisted under post-matric
scholarship Number - 108
12A-Universalization of ICDS Scheme
12A01 ICDS Blocks Operational ( Cumulative) Number - 12
12B- Functional Anganwadis
12B01 Anganwadis Functional (Cumulative) Number - 1255
14A- No of urban poor families assisted under Seven Point Chapter
14A01 Poor Families Assisted Number - -
15A- Afforestation (Public & Forest Lands)
15A01 Area Covered Under Plantation Hectares - 37.50
15A02 Seedlings Plantation Number - 31700
17A- Rural Roads -PMGSY
17A01 Length of Road Constructed Kilometer - -
18B-Rajiv Gandhi Grameen Vidyutikaran Yojana
18B01 Villages Electrified Number - -
18D- Energising Pump Sets
18D01 Pumps sets energized Number - 197
*Goa Medical College not included under delivery in Institutions
Note: Targets are fixed by TPP Division, Ministry of Statistics and Programme
Implementation (MOSPI) in respect of items for which targets have been
indicated.
Source: Directorate of Planning, Statistics & Evaluation.
-254-

136. Activities of the Office of the Controller of
Legal Metrology for the year 2016-17.
Sl.
No Item 2016-17
1 2 3
1. No. of Offices/Headquarters 17
2. Total strength of Inspectors and Assistant
controllers 11 + 5 = 16
3. Number of cases booked 564
4. Total no. of cases compounded 561
5. Compounding fees (Rs. Lakh ) Rs. 21,19,000.00
6. Verification fees (Rs. Crore) Rs. 1,66,14,134.00
7. Verification of Weights & Measures
7a. Weights 12395
7b. Measures 3966
7c. Weighing Instruments 43534
7d. Measuring Instruments 5425
Source: Office of the Controller of Legal Metrology, Porvorim, Goa.
-255-
137. Number of Passports issued 2006-07 to 2016-17.
Sl.
No. Year No. of Passports issued
1 2 3
1. 2006-2007 25527
2. 2007-2008 29396
3. 2008-2009 29351
4. 2009-2010 30152
5. 2010-2011 34538
6. 2011-2012 34836
7. 2012-2013 17415
8. 2013-2014 44895
9. 2014-2015 44434
10. 2015-2016 45761
11. 2016-2017 47174
Source: Passport Office.
-256-

138. General information of Kadamba Transport
Corporation Ltd., 2016-17.
Sl.
No Particulars 2016-17
1 2 3
1. Number of depots 4
2. Number of workshop 1
3. Number of bus stands owned by KTC 15
4. Fleet attached as on 31st March:
i)Own Fleet 504
ii)Hired Fleet 4
Total 508
5. Fleet utilization ( in % age) 68%
6. Vehicle utilization (kms./vehicle on
road/day) 228.80
7. Effective kms. operated (in lakhs) 298.98
8. No. of kms. Scheduled per day as on 31st
March 96589
9. No. of scheduled trips per day as on 31st
March 2475
10. No. of staff as on 31st March :
a) Traffic (crew staff) 1518
b) Repairs & Maintenance 254
Contd.
-257-
138. General Information of Kadamba Transport
Corporation, 2016-17 (Concld.)
Sl.
No. Particulars 2016-17
1 2 3
c) Administration /Accounts/Officers 251
Total (a+b+c) 2023
11. Bus-staff ratio (Per bus on road) 5.65
12. Average Tyre performance in kms.
(a) Size (9.00x20) 30690
(b) Size (7.50x16) 27549
13. Breakdown rate per 11,000 kms. 0.36
14. Accident rate per 11,000 kms. 0.03
15. Average diesel consumption
(km. per litre) 4.13
16. Average no. of passengers travelled
per day 93705
17. Earning per km. in paise: (Tentative)
1. Traffic Earning(including
concessional pass scheme
subsidy amount)
2703
2. Other Income 2887
Total Earning (EPKM in
Paise) 5590
18. Cost per km. in Paise (Total)
(including interest and depreciation)
(Tentative)
5704
Source: Kadamba Transport Corporation Ltd.
-258-

139. Taluka wise distribution of Rural Enterprises & No. of persons
employed as per Economic Census 2012.
Sl.
No.
Taluka Outside
HH with
fixed
structure
Outside
HH
without
fixed
structure
Inside
HH
with
fixed
struct-
ure
Grand
total
Total No. of
Handicrafts/
Handloom
Establishment
1 2 3 4 5 6 7
1 Bardez 1848 2048 1038 4934 152
2 Pernem 1105 648 883 2636 84
3 Bicholim 1613 1497 1094 4204 135
4 Sattari 1104 886 1105 3095 107
5 Ponda 1614 1269 943 3826 74
6 Tiswadi 765 433 237 1435 0
North Goa 8049 6781 5300 20130 552
7 Canacona 991 842 608 2441 31
8 Mormugao 554 776 388 1718 13
9 Sanguem &
Dharbandora
1234 920 530 2684 17
10 Quepem 915 837 525 2277 27
11 Salcete 2054 592 511 3157 27
South Goa 5748 3967 2562 12277 115
Total Goa 13797 10748 7862 32407 667
Contd.
-259-
139. Taluka wise distribution of Rural Enterprises & No. of persons
employed as per Economic Census 2012 (Concld.)
Sl.
No.
Taluka No. of persons employed on last working day No. of
esta-
blishment
with 8 or
more
workers
Outside
&
Inside
HH with
fixed
structure
Hired Non-hired Total
Male Female Male Female
1 2 8 9 10 11 12 13 14 1 Bardez 5666 1801 3862 2149 13478 264 2886
2 Pernem 1640 640 1831 930 5041 54 1988
3 Bicholim 5151 1479 3145 4021 13796 281 2707
4 Sattari 2274 811 2380 1182 6647 52 2209
5 Ponda 4267 1884 3105 2264 11520 265 2557
6 Tiswadi 982 367 937 488 2774 40 1002
North Goa 19980 6982 15260 11034 53256 956 13349
7 Canacona 1102 834 1457 1305 4698 101 1599
8 Mormugao 2554 781 1246 631 5212 76 942
9 Sanguem &
Dharbandora
2477 881 1796 823 5977 74 1764
10 Quepem 1054 672 1515 1971 5212 127 1440
11 Salcete 5556 2061 2281 1022 10920 167 2565
South Goa 12743 5229 8295 5752 32019 545 8310
Total Goa 32723 12211 23555 16786 85275 1501 21659
-260-

140. Taluka wise distribution of Urban Enterprises & No. of persons
employed as per Economic Census 2012.
Sl.
No.
Taluka Outside
HH with
fixed
structure
Outside
HH
without
fixed
structure
Inside
HH
with
fixed
struct-
ure
Grand
total
Total No. of
Handicrafts/
Handloom
Establishment
1 2 3 4 5 6 7
1 Bardez 6491 3303 1751 11545 193
2 Pernem 1297 625 493 2415 57
3 Bicholim 2491 815 754 4060 97
4 Sattari 842 283 265 1390 10
5 Ponda 5606 1772 1483 8861 102
6 Tiswadi 6659 1335 891 8885 29
North Goa 23386 8133 5637 37156 488
7 Canacona 971 537 189 1697 13
8 Mormugao 6183 2204 1329 9716 63
9 Sanguem &
Dharbandora
440 103 44 587 5
10 Quepem 2502 858 618 3978 66
11 Salcete 9351 1314 1120 11785 74
South Goa 19447 5016 3300 27763 221
Total Goa 42833 13149 8937 64919 709
Contd.
-261-
140. Taluka wise distribution of Urban Enterprises & No. of persons
employed as per Economic Census 2012 (Concld.)
Sl.
No.
Taluka No. of persons employed on last working day No. of
esta-
blishment
with 8 or
more
workers
Outside
&
Inside
HH with
fixed
structure
Hired Non-hired Total
Male Female Male Femal
e
1 2 8 9 10 11 12 13 14 1 Bardez 15757 4626 9596 2979 32958 575 8242
2 Pernem 1226 453 1931 671 4281 29 1790
3 Bicholim 4563 2863 3270 1877 12573 212 3245
4 Sattari 1846 647 1019 494 4006 60 1107
5 Ponda 14819 6500 7113 5586 34018 666 7089
6 Tiswadi 19199 8980 6236 1812 36227 756 7550
North Goa 57410 24069 29165 13419 124063 2298 29023
7 Canacona 1527 898 1141 923 4489 83 1160
8 Mormugao 15865 4957 6318 2992 30132 435 7512
9 Sanguem &
Dharbandora
351 276 432 126 1185 16 484
10 Quepem 2896 1563 3044 2335 9838 188 3120
11 Salcete 18829 8330 9183 2736 39078 616 10471
South Goa 39468 16024 20118 9112 84722 1338 22747
Total Goa 96878 40093 49283 22531 208785 3636 51770
Source :- Directorate of Planning, Statistics & Evaluation, Porvorim Goa
HH:- Stands for household.
-262-
Related Documents