1 Government Intervention and the CDS Market: A Look at the Market’s Response to Policy Announcements During the 2007-2009 Financial Crisis Caitlin Ann Greatrex and Erick Rengifo This paper adds to the literature on the financial markets’ reaction to government interventions during the 2007- 2009 financial crisis by analyzing the response of US firms’ credit default swap spreads to key government actions. We find that the government measures taken to stabilize both the financial sector and the overall economy were generally well-received by credit default swap (CDS) market participants, reducing perceived credit risk across a broad cross-section of firms. Financial firms responded most favorably to financial sector policies and interest rate cuts, with announcement date abnormal CDS spread changes of -5 and -2 percent, respectively. Non-financial firms responded most favorably to conventional fiscal and monetary policy tools with spread reductions of approximately one percent upon announcement of these measures. Caitlin Ann Greatrex is an Assistant Professor of Economics at Iona College in New Rochelle, NY. Erick Rengifo is an Assistant Professor of Economics at Fordham University in Bronx, NY. nThe credit crisis of 2007–2009 marks a period of extraordinary financial instability. The crisis initially stemmed from an unexpected fall in housing prices which in turn increased delinquencies on subprime mortgages negatively impacting the securities tied to those mortgages. 1 However, the turmoil soon spread throughout the financial system and to the broader global economy. US credit default swap (CDS) markets were among the first to feel the severity of the crisis with the CDX North American Investment Grade index doubling between the beginning of June and the end of July of 2007. As the crisis unfolded, CDS spreads continued to rise while stock market indices started their 1 For more on the causes of the financial crisis, see Acharya, Philippon, Richardson, and Rubin (2009) and Taylor (2008). decline in the fall of 2007 (see Figure 1). What was initially a dislocation in the US subprime market culminated into a global financial crisis by September 2008 with the collapse of Lehman Brothers. The scope of the financial turmoil is widely seen to be the worst since that of the Great Depression. 2 As financial markets became increasingly distressed, confidence was lost and many markets froze up. 3 In an effort to keep the financial stress from spiraling into a global depression, central governments responded with a wide variety of policy initiatives. In the United States – the country in which the turmoil began – central bankers and policymakers were particularly aggressive in their monetary and fiscal policy efforts. Following a discount rate cut in August, 2007, the Federal Reserve initiated a series of ten Federal Funds rate cuts beginning with a fifty basis point cut (from 5.25% to 4.75%) on September 18, 2007 and ending with the Federal Funds rate reaching an effective floor of zero to 25 basis points on December 16, 2008. The United States Congress passed the $150 billion Economic Stimulus Act in February, 2008 only to be followed by the $787 billion American Recovery and Reinvestment Act of 2009. In addition to conventional monetary and fiscal tools, several unprecedented policies and programs were enacted in an effort to “improve the functioning of credit markets, ease financial conditions, and support economic activity.” 4 2 Federal Reserve Chairman Bernanke refers to the financial crisis as “the worst since the Great Depression” in a speech on April 14, 2009, http:// www.federalreserve.gov/newsevents/speech/bernanke20090414a.htm. 3 See Acharya et al. (2009) for an overall discussion of short-term market dislocations and Krishnamurthy (2010) for a discussion of repo market activity during the crisis.

Welcome message from author
This document is posted to help you gain knowledge. Please leave a comment to let me know what you think about it! Share it to your friends and learn new things together.
Transcript
1Greatrex and renGifo – Government intervention and the CdS market
1
Government Intervention and the CDS Market: A Look at the Market’s Response to Policy Announcements During the 2007-2009 Financial Crisis
Caitlin Ann Greatrex and Erick Rengifo
This paper adds to the literature on the financial markets’ reaction to government interventions during the 2007-2009 financial crisis by analyzing the response of US firms’ credit default swap spreads to key government actions. We find that the government measures taken to stabilize both the financial sector and the overall economy were generally well-received by credit default swap (CDS) market participants, reducing perceived credit risk across a broad cross-section of firms. Financial firms responded most favorably to financial sector policies and interest rate cuts, with announcement date abnormal CDS spread changes of -5 and -2 percent, respectively. Non-financial firms responded most favorably to conventional fiscal and monetary policy tools with spread reductions of approximately one percent upon announcement of these measures.
Caitlin Ann Greatrex is an Assistant Professor of Economics at Iona College in New Rochelle, NY. Erick Rengifo is an Assistant Professor of Economics at Fordham University in Bronx, NY.
nThe credit crisis of 2007–2009 marks a period of extraordinary financial instability. The crisis initially stemmed from an unexpected fall in housing prices which in turn increased delinquencies on subprime mortgages negatively impacting the securities tied to those mortgages.1 However, the turmoil soon spread throughout the financial system and to the broader global economy. US credit default swap (CDS) markets were among the first to feel the severity of the crisis with the CDX North American Investment Grade index doubling between the beginning of June and the end of July of 2007. As the crisis unfolded, CDS spreads continued to rise while stock market indices started their
1 For more on the causes of the financial crisis, see Acharya, Philippon, Richardson, and Rubin (2009) and Taylor (2008).
decline in the fall of 2007 (see Figure 1). What was initially a dislocation in the US subprime market culminated into a global financial crisis by September 2008 with the collapse of Lehman Brothers.
The scope of the financial turmoil is widely seen to be the worst since that of the Great Depression.2 As financial markets became increasingly distressed, confidence was lost and many markets froze up.3 In an effort to keep the financial stress from spiraling into a global depression, central governments responded with a wide variety of policy initiatives. In the United States – the country in which the turmoil began – central bankers and policymakers were particularly aggressive in their monetary and fiscal policy efforts. Following a discount rate cut in August, 2007, the Federal Reserve initiated a series of ten Federal Funds rate cuts beginning with a fifty basis point cut (from 5.25% to 4.75%) on September 18, 2007 and ending with the Federal Funds rate reaching an effective floor of zero to 25 basis points on December 16, 2008. The United States Congress passed the $150 billion Economic Stimulus Act in February, 2008 only to be followed by the $787 billion American Recovery and Reinvestment Act of 2009.
In addition to conventional monetary and fiscal tools, several unprecedented policies and programs were enacted in an effort to “improve the functioning of credit markets, ease financial conditions, and support economic activity.” 4
2 Federal Reserve Chairman Bernanke refers to the financial crisis as “the worst since the Great Depression” in a speech on April 14, 2009, http://www.federalreserve.gov/newsevents/speech/bernanke20090414a.htm.
3 See Acharya et al. (2009) for an overall discussion of short-term market dislocations and Krishnamurthy (2010) for a discussion of repo market activity during the crisis.

2 Journal of applied finanCe – no. 1, 2012
Many of these programs were aimed at restoring liquidity to financial markets such as the Term Auction Facility (TAF) introduced in December, 2007 and the Term Asset Backed Securities Loan Facility (TALF) of November, 2008.5 Others sought to provide stability to the financial sector by purchasing troubled assets, guaranteeing liabilities, or injecting capital into financial institutions. The Troubled Asset Relief Program (TARP), introduced on September 19, 2008 and enacted October 3, 2008, authorized the US treasury to purchase up to $700 billion in troubled assets from financial institutions. The Temporary Guarantee Program, also announced on September, 19, 2008, provided up to $50 billion to the money market mutual fund industry. On October 14, 2008, TARP was modified to allocate $250 billion to recapitalizing banks under the Capital Purchase Program (CPP).6
Aside from these systemic programs, the Federal Reserve, Federal Deposit Insurance Corporation (FDIC), and US Treasury took standalone actions aimed at individual institutions including Bear Stearns, AIG, Citigroup, and Bank of America.7 As of March, 2009, the Federal Reserve, US treasury, and FDIC combined had committed an estimated $12.8 trillion to various rescue packages and programs (Pittman and Irving, 2010).
Several authors have been quick to explore the impact of these types of government interventions on financial markets. King (2009) conducts an event study of 52 banks internationally and finds evidence that the government rescue packages benefited creditors at the expense of shareholders. While bank CDS spreads narrowed around the announcement of government interventions, bank stock prices fell implying that the negative effects of diluting existing shareholders and restricting dividends outweighed the positive effect of reducing financial distress for bank stocks. The US was a notable exception to this finding, most 4 Chairman Ben S. Bernanke, “Federal Reserve programs to strengthen credit markets and the economy,” February 10, 2009, http://www.federalreserve.gov/newsevents/testimony/bernanke20090210a.htm.
5 Additional liquidity measures include the Term Securities Lending Facility (TSLF) introduced in March, 2008 and the Money Market Investor Funding Facility (MMIFF) and the Commercial Paper Funding Facility (CPFF) both introduced in October, 2008.
6 A full timeline and description of events during the 2007-2009 financial crisis can be found at http://www.imf.org/external/pubs/cat/longres.cfm?sk=23293.0.
7 $29 billion in term financing was provided to facilitate the takeover of Bear Stearns by JP Morgan in March, 2008. An $85 billion credit extension was provided to AIG on September 16, 2008. The purchase of $40 billion of preferred AIG shares was announced on November 10, 2008 (restructuring the terms of the original agreement). The Treasury and FDIC provided protection to Citigroup against losses on an asset pool of $306 billion on November 23, 2008 and $118 billion of protection was provided to Bank of America on January 16, 2009.
likely due to the attractive terms of its packages. Panetta, Faeh, Grande, Ho, King, Levy, Signoretti, Taboga, and Zaghini (2009) conduct a similar analysis in which they, too, find evidence of reductions in default premia associated with government intervention and a redistribution of resources from shareholders to creditors. Furthermore, Ait-Sahalia, Andritzky, Jobst, Nowak, and Tamirisa (2009) find that several of the governments’ efforts were effective in reducing interbank risk premia as measured by the Libor-OIS spread.
In a study of Japan’s banking crisis, Miyajima and Yafeh (2007) explore the sensitivity of non-financial firms to Japan’s banking crisis of the 1990s and find that not all firms were equally sensitive to the financial sector’s distress. In particular, by analyzing the cross-sectional response of abnormal stock returns around key dates throughout Japan’s crisis, they find that firms with limited access to financial markets (e.g. small, leveraged, low-tech, low credit quality firms) were more severely impacted by Japan’s credit crunch.
Our study extends the work of these authors by comparing and contrasting the reaction of CDS prices for financial and non-financial firms to government interventions during the 2007-2009 financial crisis. As the goal of our paper is to explore the effects of government interventions on the credit markets, we believe that the CDS market is an obvious candidate for such a study due to its sheer magnitude, relative liquidity, and increasingly available pricing data.8 Specifically, we analyze the CDS price reaction of 348 US firms to 23 government-initiated events including 8 liquidity support announcements, 4 fiscal policy announcements, 4 financial sector policy announcements, and 7 interest rate cuts.9 We believe this is the first study to examine the CDS market’s reaction to government interventions using a large cross-section of CDS spreads (as opposed to focusing on CDS premia for financial institutions). We find that the government measures taken to stabilize both the financial sector and the overall economy were generally well-received by CDS market participants, reducing perceived credit risk across a broad cross-section of firms. Financial firms responded most favorably to financial sector policies and interest rate cuts, with announcement date abnormal CDS spread reductions of approximately five and two percent, respectively. Non-financial firms responded most favorably to conventional fiscal and monetary policy tools with spread reductions of approximately one percent upon announcement of these measures.
8 ISDA reports the total notional amount outstanding of credit default swaps is $26.3 trillion as of mid-year 2010. Source: http://www.isda.org/statistics/recent.html#2010mid.
9 As stated in the methodology section, we focus on this narrow subsection of 23 events to minimize contamination issues that are associated with overlapping events in an event study context.
3Greatrex and renGifo – Government intervention and the CdS market
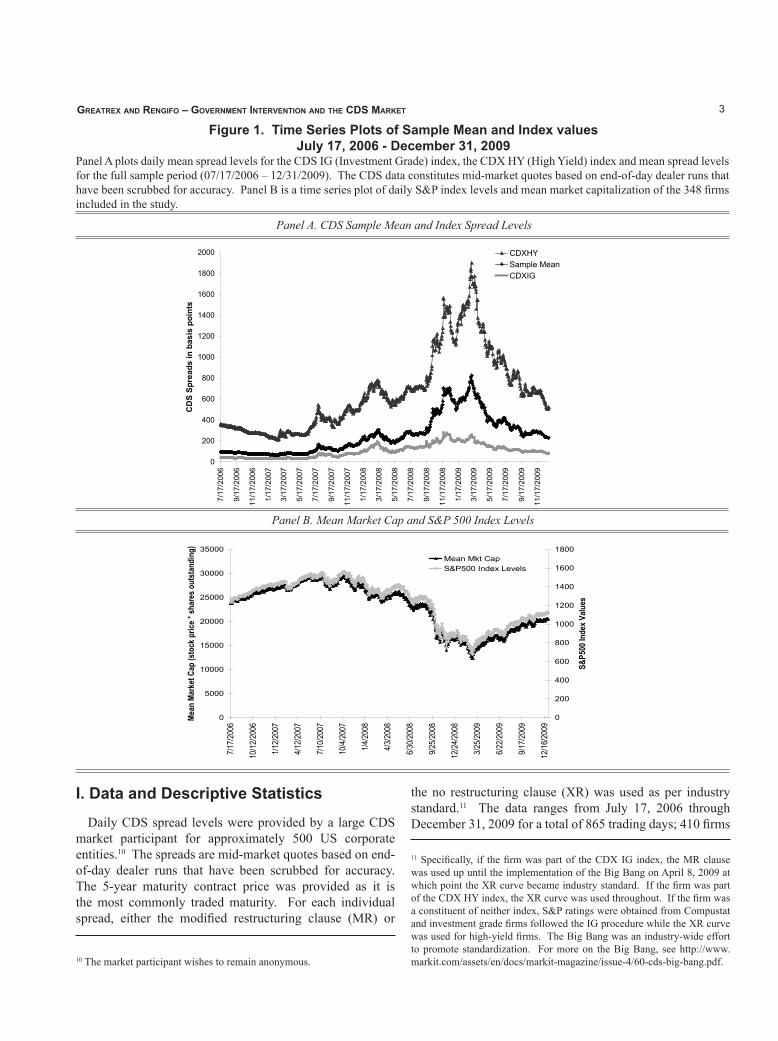
Figure 1. Time Series Plots of Sample Mean and Index valuesJuly 17, 2006 - December 31, 2009
Panel A plots daily mean spread levels for the CDS IG (Investment Grade) index, the CDX HY (High Yield) index and mean spread levels for the full sample period (07/17/2006 – 12/31/2009). The CDS data constitutes mid-market quotes based on end-of-day dealer runs that have been scrubbed for accuracy. Panel B is a time series plot of daily S&P index levels and mean market capitalization of the 348 firms included in the study.
0
200
400
600
800
1000
1200
1400
1600
1800
2000
7/17
/200
6
9/17
/200
6
11/1
7/20
06
1/17
/200
7
3/17
/200
7
5/17
/200
7
7/17
/200
7
9/17
/200
7
11/1
7/20
07
1/17
/200
8
3/17
/200
8
5/17
/200
8
7/17
/200
8
9/17
/200
8
11/1
7/20
08
1/17
/200
9
3/17
/200
9
5/17
/200
9
7/17
/200
9
9/17
/200
9
11/1
7/20
09
CD
S Sp
read
s in
bas
is p
oint
s
CDXHYSample MeanCDXIG
0
5000
10000
15000
20000
25000
30000
35000
7/17
/200
6
10/1
2/20
06
1/12
/200
7
4/12
/200
7
7/10
/200
7
10/4
/200
7
1/4/
2008
4/3/
2008
6/30
/200
8
9/25
/200
8
12/2
4/20
08
3/25
/200
9
6/22
/200
9
9/17
/200
9
12/1
6/20
09
Mean
Mar
ket C
ap (s
tock
pric
e * sh
ares
out
stan
ding
)
0
200
400
600
800
1000
1200
1400
1600
1800S&
P500
Inde
x Valu
esMean Mkt CapS&P500 Index Levels
Figure 1. Time Series Plots of Sample Mean and Index valuesJuly 17, 2006 - December 31, 2009
Panel A plots daily mean spread levels for the CDS IG (Investment Grade) index, the CDX HY (High Yield) index and mean spread levels for the full sample period (07/17/2006 – 12/31/2009). The CDS data constitutes mid-market quotes based on end-of-day dealer runs that have been scrubbed for accuracy. Panel B is a time series plot of daily S&P index levels and mean market capitalization of the 348 firms included in the study.
A. CDS Sample Mean and Index Spread Levels
B. Mean Market Cap and S&P500 Index Levels
Panel A. CDS Sample Mean and Index Spread Levels
Panel B. Mean Market Cap and S&P 500 Index Levels
0
200
400
600
800
1000
1200
1400
1600
1800
20007/
17/2
006
9/17
/200
6
11/1
7/20
06
1/17
/200
7
3/17
/200
7
5/17
/200
7
7/17
/200
7
9/17
/200
7
11/1
7/20
07
1/17
/200
8
3/17
/200
8
5/17
/200
8
7/17
/200
8
9/17
/200
8
11/1
7/20
08
1/17
/200
9
3/17
/200
9
5/17
/200
9
7/17
/200
9
9/17
/200
9
11/1
7/20
09
CD
S Sp
read
s in
bas
is p
oint
s
CDXHYSample MeanCDXIG
0
5000
10000
15000
20000
25000
30000
35000
7/17
/200
6
10/1
2/20
06
1/12
/200
7
4/12
/200
7
7/10
/200
7
10/4
/200
7
1/4/
2008
4/3/
2008
6/30
/200
8
9/25
/200
8
12/2
4/20
08
3/25
/200
9
6/22
/200
9
9/17
/200
9
12/1
6/20
09
Mean
Mar
ket C
ap (s
tock
pric
e * sh
ares
out
stan
ding
)
0
200
400
600
800
1000
1200
1400
1600
1800
S&P5
00 In
dex V
alues
Mean Mkt CapS&P500 Index Levels
Figure 1. Time Series Plots of Sample Mean and Index valuesJuly 17, 2006 - December 31, 2009
Panel A plots daily mean spread levels for the CDS IG (Investment Grade) index, the CDX HY (High Yield) index and mean spread levels for the full sample period (07/17/2006 – 12/31/2009). The CDS data constitutes mid-market quotes based on end-of-day dealer runs that have been scrubbed for accuracy. Panel B is a time series plot of daily S&P index levels and mean market capitalization of the 348 firms included in the study.
A. CDS Sample Mean and Index Spread Levels
B. Mean Market Cap and S&P500 Index Levels
I. Data and Descriptive Statistics
Daily CDS spread levels were provided by a large CDS market participant for approximately 500 US corporate entities.10 The spreads are mid-market quotes based on end-of-day dealer runs that have been scrubbed for accuracy. The 5-year maturity contract price was provided as it is the most commonly traded maturity. For each individual spread, either the modified restructuring clause (MR) or
10 The market participant wishes to remain anonymous.
the no restructuring clause (XR) was used as per industry standard.11 The data ranges from July 17, 2006 through December 31, 2009 for a total of 865 trading days; 410 firms
11 Specifically, if the firm was part of the CDX IG index, the MR clause was used up until the implementation of the Big Bang on April 8, 2009 at which point the XR curve became industry standard. If the firm was part of the CDX HY index, the XR curve was used throughout. If the firm was a constituent of neither index, S&P ratings were obtained from Compustat and investment grade firms followed the IG procedure while the XR curve was used for high-yield firms. The Big Bang was an industry-wide effort to promote standardization. For more on the Big Bang, see http://www.markit.com/assets/en/docs/markit-magazine/issue-4/60-cds-big-bang.pdf.

4 Journal of applied finanCe – no. 1, 2012
Table I. Descriptive StatisticsTable I provides descriptive statistics (mean, median, standard deviation, and number of observations) for CDS spread levels, CDS spread changes, market capitalization, stock returns, credit ratings, leverage ratios, and Tobin’s Q for the 348 firms included in the sample. The statistics are provided for the full sample period (07/17/2006 – 12/31/2009) and for four sub-periods (07/17/2006 – 6/04/2007; 06/05/2007 – 09/13/2008; 9/14/2008 – 03/08/2009; 3/09/2009 – 12/31/2009).
Time Period Variable Mean Median σ NFull Sample CDS level (mid-price in bps) 255 95 515 301,02007/17/2006 – 12/31/2009 %∆CDS (log differences * 100) 0.09 0.00 6.43 300,672
Market cap (in millions) 23,019 9,272 44,052 301,020Stock returns (in percentages) 0.03 0.02 3.69 301,020S&P credit rating 9.13 9.00 3.29 288,900Leverage ratio 0.35 0.30 0.23 272,476Tobin’s Q 1.52 1.35 0.58 277,828
Phase I: Stable Markets CDS level (mid-price in bps) 79 37 104 76,56007/17/2006 – 6/04/2007 %∆CDS (log differences * 100) -0.11 0.00 6.55 76,212
Market cap (in millions) 26,538 11,726 48,255 76,560Stock returns (in percentages) 0.13 0.10 1.56 76,560S&P credit rating 8.88 9.00 3.20 73,386Leverage ratio 0.29 0.25 0.20 72,035Tobin’s Q 1.64 1.46 0.60 72,160
Phase II: Subprime Crisis CDS level (mid-price in bps) 189 85 289 111,70806/05/2007 – 09/13/2008 %∆CDS (log differences * 100) 0.42 0.00 6.43 111,708
Market cap (in millions) 26,298 11,090 48,637 111,708Stock returns (in percentages) -0.05 -0.06 2.84 111,708S&P credit rating 8.95 9.00 3.21 107,214Leverage ratio 0.32 0.27 0.22 105,683Tobin’s Q 1.61 1.44 0.62 105,288
Phase III: Global Crisis CDS level (mid-price in bps) 552 272 860 41,0649/14/2008 – 03/08/2009 %∆CDS (log differences * 100) 0.70 0.00 7.04 41,064
Market cap (in millions) 16,739 5,565 35,443 41,064Stock returns (in percentages) -0.66 -0.63 6.64 41,064S&P credit rating 9.23 9.00 3.27 39,412Leverage ratio 0.45 0.41 0.26 37,824
Tobin’s Q 1.38 1.20 0.52 38,704Phase IV: Recovery CDS level (mid-price in bps) 375 155 665 71,6883/09/2009 – 12/31/2009 %∆CDS (log differences * 100) -0.54 -0.10 5.83 71,688
Market cap (in millions) 17,751 6,592 34,291 71,688Stock returns (in percentages) 0.46 0.19 4.04 71,688S&P credit rating 9.61 9.00 3.45 68,888Leverage ratio 0.41 0.36 0.24 56,934Tobin’s Q 1.30 1.17 0.44 61,676

5Greatrex and renGifo – Government intervention and the CdS market
have the full 865 observations and 348 firms have matching Center for Research in Security Prices (CRSP) stock market data for the full series. It is these 348 firms that are used in the analysis. The firms span a variety of industries and credit ratings. The industry classifications were supplied by the data provider and further mapped to Markit’s industry codings; the credit ratings are Standard and Poor’s long-term domestic issuer credit rating obtained from COMPUSTAT. Financial statement and accounting figures were also obtained from COMPUSTAT. As a proxy for the overall market, both the CDX North American Investment Grade (CDX IG) and the CDX North American High-Yield (CDX HY) index levels were provided by the market participant. The CDX IG is an equally-weighted index of 125 investment grade entities. The CDX HY is comprised of 100 equally-weighted non-investment grade entities.12
Figure 1 plots daily CDX IG, CDX HY, and sample mean spread levels in Panel A while mean market capitalization and S&P index levels are plotted in Panel B. The time series plots indicate that the sample data is representative of the overall market over the period. Even so, descriptive statistics presented in Table I highlight the skewed nature of CDS spreads as the mean spread is 255 basis points compared to the median level of 95 basis points. The data is influenced not only by very high spread levels for extremely distressed firms with high probabilities of imminent default, but also by the varying regimes that characterize the data.
As a rough approximation of these regimes, we break out sample means, medians, and standard deviations into four phases. Phase I consists of roughly the first year of the data set and ranges from July 17, 2006 through June 4, 2007. This is a period of relatively low and stable spreads. Phase II, the subprime phase, ranges from June 5, 2007 until the collapse of Lehman Brothers on September 14, 2008 at which point we enter the global phase (Phase III) of the financial crisis. The identification of the start of the crisis is based on a Markov-switching model used in Nowak et al. (2009) and the start of the global phase is consistent with Ait-Sahalia et al. (2009). Phase IV begins in March 2009, continues through year-end, and is considered the “recovery phase” in which spreads begin to tighten. The start of this last phase is identified based on casual examination of the data itself.
As we move from relatively stable markets into the subprime phase of the crisis, average spreads rise from 79 to 189 basis points and then to 552 basis points during the global phase of the crisis. Median spreads show a similar pattern of rising from 37 to 85 to 272 bps as we progress from Phase I through Phase III and standard deviations increase more than eightfold from 104 to 860 basis points.
12 For more on the CDX indices including their construction and constituents, see www.markit.com.
Not only did the price and volatility of credit risk increase remarkably over this time period, but also as we move from the subprime to the global phase of the crisis, we see a drastic reduction in the market capitalization of firms with average market cap decreasing by one-third from $26.5 billion to $16.7 billion. It is this decrease in the value of equity that is driving the increase in leverage from an average of 29% during the stable markets phase to a height of 45% during the global phase of the financial crisis.
Profitability, as measured by Tobin’s Q, decreases over the four phases from a mean (median) of 1.64 (1.46) in Phase I to a mean (median) of 1.30 (1.17) in Phase IV. Ratings are on a 17-point scale in which AAA equals 1 and defaulted or no rating is 17. An average rating of 9 corresponds to BBB and a standard deviation of three notches indicates a range from A to BB. The rating variable increases modestly over the sample period from a low of 8.88 in Phase I to a high of 9.61 in Phase IV. The relatively modest movement in credit rating is not surprising as rating agencies have made it clear that they value stability in the ratings process. While credit ratings continue to rise in Phase IV, CDS spreads have decreased; this observation is consistent with the notion that credit ratings often lag market indicators.
II. Methodology A. Identifying Key Government-Initiated Actions
First we identify abnormal performance around major government-initiated interventions related to the US financial crisis. The time period under study is one of the most fascinating in recent history, characterized by a succession of highly unprecedented, high-impact events all occurring in a relatively short time span. This is problematic for an event study as overlapping events can cause contamination issues and confound results. To account for this issue, our study relies on a unique database prepared by the International Monetary Fund (IMF) that focuses on key dates pertaining to the financial crisis. The IMF database spans from June 1, 2007 through March 31, 2009 and includes 196 global announcements ranging from fiscal policy to monetary policy actions, liquidity support, and financial sector policies. The database was created based on official press releases, major newspapers, and news search engines and cross-referenced with an extensive list of alternative sources. Special care was taken and a series of filtering criteria was applied to exclude overlapping announcements while ensuring the most newsworthy of announcements were identified.13 Of the 196 global announcements, 84 (43%) are US-related. 13 Readers are referred to Ait-Sahalia et al. (2009), especially Section II.C for more information on its construction. The database itself can be accessed at http://www.imf.org/external/pubs/cat/longres.cfm?sk=23293.0. We are thankful to the IMF for providing access to this data.
6 Journal of applied finanCe – no. 1, 2012
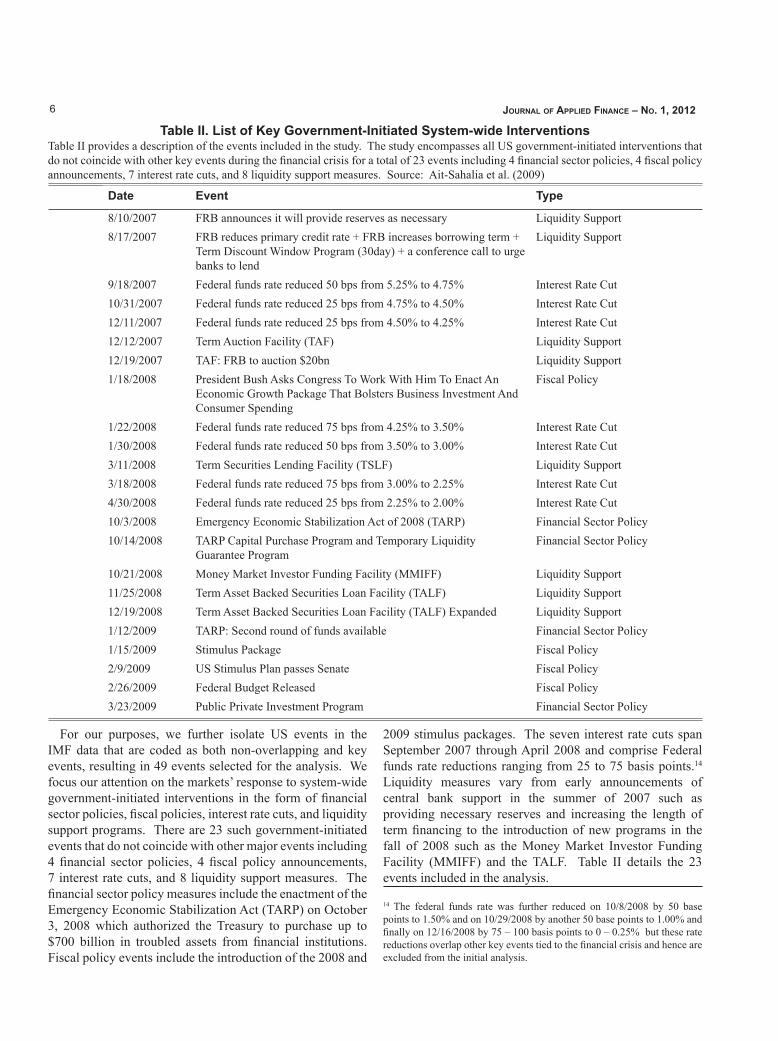
Table II. List of Key Government-Initiated System-wide InterventionsTable II provides a description of the events included in the study. The study encompasses all US government-initiated interventions that do not coincide with other key events during the financial crisis for a total of 23 events including 4 financial sector policies, 4 fiscal policy announcements, 7 interest rate cuts, and 8 liquidity support measures. Source: Ait-Sahalia et al. (2009)
Date Event Type
8/10/2007 FRB announces it will provide reserves as necessary Liquidity Support8/17/2007 FRB reduces primary credit rate + FRB increases borrowing term +
Term Discount Window Program (30day) + a conference call to urge banks to lend
Liquidity Support
9/18/2007 Federal funds rate reduced 50 bps from 5.25% to 4.75% Interest Rate Cut10/31/2007 Federal funds rate reduced 25 bps from 4.75% to 4.50% Interest Rate Cut12/11/2007 Federal funds rate reduced 25 bps from 4.50% to 4.25% Interest Rate Cut12/12/2007 Term Auction Facility (TAF) Liquidity Support12/19/2007 TAF: FRB to auction $20bn Liquidity Support1/18/2008 President Bush Asks Congress To Work With Him To Enact An
Economic Growth Package That Bolsters Business Investment And Consumer Spending
Fiscal Policy
1/22/2008 Federal funds rate reduced 75 bps from 4.25% to 3.50% Interest Rate Cut1/30/2008 Federal funds rate reduced 50 bps from 3.50% to 3.00% Interest Rate Cut3/11/2008 Term Securities Lending Facility (TSLF) Liquidity Support3/18/2008 Federal funds rate reduced 75 bps from 3.00% to 2.25% Interest Rate Cut4/30/2008 Federal funds rate reduced 25 bps from 2.25% to 2.00% Interest Rate Cut10/3/2008 Emergency Economic Stabilization Act of 2008 (TARP) Financial Sector Policy10/14/2008 TARP Capital Purchase Program and Temporary Liquidity
Guarantee ProgramFinancial Sector Policy
10/21/2008 Money Market Investor Funding Facility (MMIFF) Liquidity Support11/25/2008 Term Asset Backed Securities Loan Facility (TALF) Liquidity Support12/19/2008 Term Asset Backed Securities Loan Facility (TALF) Expanded Liquidity Support1/12/2009 TARP: Second round of funds available Financial Sector Policy1/15/2009 Stimulus Package Fiscal Policy2/9/2009 US Stimulus Plan passes Senate Fiscal Policy2/26/2009 Federal Budget Released Fiscal Policy3/23/2009 Public Private Investment Program Financial Sector Policy
For our purposes, we further isolate US events in the IMF data that are coded as both non-overlapping and key events, resulting in 49 events selected for the analysis. We focus our attention on the markets’ response to system-wide government-initiated interventions in the form of financial sector policies, fiscal policies, interest rate cuts, and liquidity support programs. There are 23 such government-initiated events that do not coincide with other major events including 4 financial sector policies, 4 fiscal policy announcements, 7 interest rate cuts, and 8 liquidity support measures. The financial sector policy measures include the enactment of the Emergency Economic Stabilization Act (TARP) on October 3, 2008 which authorized the Treasury to purchase up to $700 billion in troubled assets from financial institutions. Fiscal policy events include the introduction of the 2008 and
2009 stimulus packages. The seven interest rate cuts span September 2007 through April 2008 and comprise Federal funds rate reductions ranging from 25 to 75 basis points.14 Liquidity measures vary from early announcements of central bank support in the summer of 2007 such as providing necessary reserves and increasing the length of term financing to the introduction of new programs in the fall of 2008 such as the Money Market Investor Funding Facility (MMIFF) and the TALF. Table II details the 23 events included in the analysis.
14 The federal funds rate was further reduced on 10/8/2008 by 50 base points to 1.50% and on 10/29/2008 by another 50 base points to 1.00% and finally on 12/16/2008 by 75 – 100 basis points to 0 – 0.25% but these rate reductions overlap other key events tied to the financial crisis and hence are excluded from the initial analysis.
7Greatrex and renGifo – Government intervention and the CdS market
B. Calculating Abnormal Performance
We use an event study approach to isolate the impact of government intervention on CDS spreads. Because the government actions affect all firms simultaneously there is an issue of total clustering which means that the covariances of abnormal spread changes will not equal zero. One method to deal with this is to use a use a multivariate regression model with dummy variables for the event dates. However, MacKinlay (1997) notes that test statistics using this method often have “poor finite sample properties” and “little power against economically reasonable alternatives” (MacKinlay, 1997, p. 27). In light of this quandary, we proceed by estimating abnormal spread changes using both the dummy variable approach as well as a standard market model. We apply a variety of parametric and non-parametric tests to the abnormal spread changes. If the results are consistent across the various models and test statistics, one can be somewhat confident in their robustness.
First we estimate the multivariate regression:
1 2% % ,it t t itCDS CDX Dα β β ε∆ = + ∆ + + (1)
where % itCDS∆ is calculated by taking the log difference in the CDS spread level for firm i between day t and day t-1. As in Acharya and Johnson (2007), in using log differences, we are calculating percentages of percentages and we refer
to these % itCDS∆ as spread changes. tCDX∆% is the log difference in the corresponding CDX index between day t and day t-1 and Dt is a dummy variable set to one if the date is associated with a government action and zero otherwise. The model is then modified to differentiate between the various types of events with dummy variables for financial policies (FIN), fiscal policies (FIS), interest rate cuts (IRCUT), and liquidity support programs (LIQ) each respectively set to one if the date in question corresponds to the announcement of one of these tools and zero otherwise as in Equation (2) below:
1 2 3 4 5% % .it t t t t t itCDS CDX FIN FIS IRCUT LIQα β β β β β ε∆ = + ∆ + + + + +
(2)
Additionally, we use a standard market model to calculate abnormal performance for CDS spread changes. The market model is calculated over a [-60,-21] estimation window as:
% % .it i i t itCDS CDXα β ε∆ = + ∆ + (3)
Abnormal spread changes are calculated as the actual
1 2 3 4 5% % .it t t t t t itCDS CDX FIN FIS IRCUT LIQα β β β β β ε∆ = + ∆ + + + + +
% itCDS∆ minus the model’s prediction for day t where t=0 corresponds to the event date. As in Miyajima and Yafeh (2007), the short estimation window is used due to “the large number and high frequency of events” (p. 2871) over the period, however, a 120-day estimation window is also used to ensure results are not sensitive to this specification.
Acknowledging the fact that the government interventions were responses to a series of events is to acknowledge an endogeneity issue in which the assumption that the error term is orthogonal to the dependent variable is violated. Bernanke and Kuttner (2005, p. 1230) remark that a contemporaneous response of monetary policy to financial markets or if both policy and markets respond jointly to new information violates the orthogonality condition resulting in a downward bias of the size of the policy’s estimated impact. Solutions cited in their paper include narrowing the event window by using intraday data.15 Unfortunately, intraday data is not currently available for CDS prices. In lieu of intraday data, we focus on the most narrow event window possible with our data limitations, one trading day.16
III. Interpretation of Results Results using Equations (1) and (2) are presented in Table
III. The first observation is that the estimated coefficient on
the market, 1β̂ =0.625, is highly significant and consistent across both specifications. Hence, individual spreads are positively correlated with the overall market movements and there is evidence of a systemic component to CDS pricing. Not surprisingly, over this sample, the estimated coefficient on the market for financial firms is somewhat greater than that of non-financial firms (0.705 versus 0.609). Second, the estimated coefficient on the event dummy variable is -0.557 (t=-7.18) indicating that the government actions were interpreted as “good news” by credit markets with spreads decreasing an average of -0.557% upon announcement. With average spreads of 255 basis points over the sample period, this equates to a modest spread reduction of 1.42 basis points which translates to $1,420 on a notional contract of $10,000,000. The reaction of financial firms is greater in magnitude than those of non-financial firms (-1.395% versus -0.407%). The explanatory power of the model is also greater for financial firms (R2=17.5%) than for non-financial firms (R2=13.6%). Overall, Equations (1) and (2) explain approximately 14% of the variation in daily CDS spread changes.
15 The other solution involves a statistical procedure, however, Bernanke and Kuttner (2005) remark that results found using this method are similar to those obtained using the standard approach. 16 Multi-day windows were analyzed and results are available upon request.
8 Journal of applied finanCe – no. 1, 2012
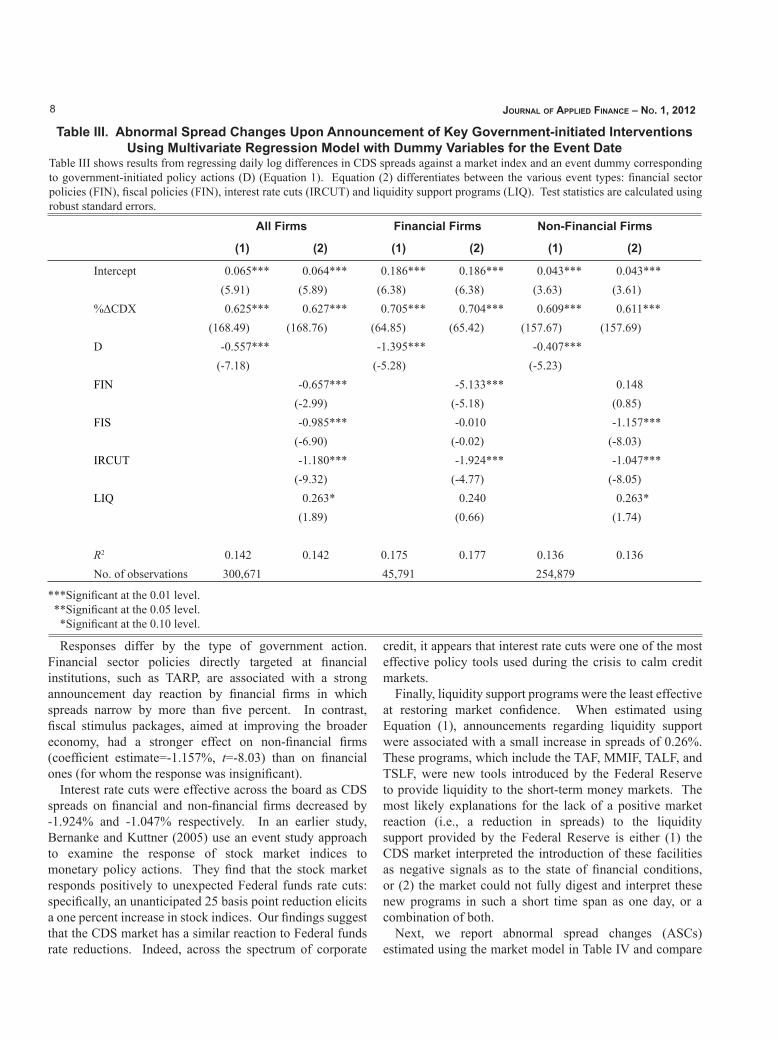
Table III. Abnormal Spread Changes Upon Announcement of Key Government-initiated Interventions Using Multivariate Regression Model with Dummy Variables for the Event Date
Table III shows results from regressing daily log differences in CDS spreads against a market index and an event dummy corresponding to government-initiated policy actions (D) (Equation 1). Equation (2) differentiates between the various event types: financial sector policies (FIN), fiscal policies (FIN), interest rate cuts (IRCUT) and liquidity support programs (LIQ). Test statistics are calculated using robust standard errors.
All Firms Financial Firms Non-Financial Firms
(1) (2) (1) (2) (1) (2)
Intercept 0.065*** 0.064*** 0.186*** 0.186*** 0.043*** 0.043***(5.91) (5.89) (6.38) (6.38) (3.63) (3.61)
%∆CDX 0.625*** 0.627*** 0.705*** 0.704*** 0.609*** 0.611***(168.49) (168.76) (64.85) (65.42) (157.67) (157.69)
D -0.557*** -1.395*** -0.407***(-7.18) (-5.28) (-5.23)
FIN -0.657*** -5.133*** 0.148(-2.99) (-5.18) (0.85)
FIS -0.985*** -0.010 -1.157***(-6.90) (-0.02) (-8.03)
IRCUT -1.180*** -1.924*** -1.047***(-9.32) (-4.77) (-8.05)
LIQ 0.263* 0.240 0.263*(1.89) (0.66) (1.74)
R2 0.142 0.142 0.175 0.177 0.136 0.136No. of observations 300,671 45,791 254,879
Responses differ by the type of government action. Financial sector policies directly targeted at financial institutions, such as TARP, are associated with a strong announcement day reaction by financial firms in which spreads narrow by more than five percent. In contrast, fiscal stimulus packages, aimed at improving the broader economy, had a stronger effect on non-financial firms (coefficient estimate=-1.157%, t=-8.03) than on financial ones (for whom the response was insignificant).
Interest rate cuts were effective across the board as CDS spreads on financial and non-financial firms decreased by -1.924% and -1.047% respectively. In an earlier study, Bernanke and Kuttner (2005) use an event study approach to examine the response of stock market indices to monetary policy actions. They find that the stock market responds positively to unexpected Federal funds rate cuts: specifically, an unanticipated 25 basis point reduction elicits a one percent increase in stock indices. Our findings suggest that the CDS market has a similar reaction to Federal funds rate reductions. Indeed, across the spectrum of corporate
credit, it appears that interest rate cuts were one of the most effective policy tools used during the crisis to calm credit markets.
Finally, liquidity support programs were the least effective at restoring market confidence. When estimated using Equation (1), announcements regarding liquidity support were associated with a small increase in spreads of 0.26%. These programs, which include the TAF, MMIF, TALF, and TSLF, were new tools introduced by the Federal Reserve to provide liquidity to the short-term money markets. The most likely explanations for the lack of a positive market reaction (i.e., a reduction in spreads) to the liquidity support provided by the Federal Reserve is either (1) the CDS market interpreted the introduction of these facilities as negative signals as to the state of financial conditions, or (2) the market could not fully digest and interpret these new programs in such a short time span as one day, or a combination of both.
Next, we report abnormal spread changes (ASCs) estimated using the market model in Table IV and compare
***Significant at the 0.01 level. **Significant at the 0.05 level. *Significant at the 0.10 level.

9Greatrex and renGifo – Government intervention and the CdS market
Table IV. Abnormal Spread Changes Upon Announcement of Key Government-initiated Interventions Using Standard Market Model
Table IV reports abnormal spread changes (ASCs) based on a standard market model for which parameters are estimated over a 40-day estimation window [-60,-21]. Abnormal spread changes are calculated as the actual spread change minus the model’s prediction for the event date, t=0. The standard cross-sectional t-test, Patell’s (1976) test statistic, Boehmer et al.’s (1991) t-statistics, and the sign test are reported to assess statistical significance of the ASCs.
Type of Action
No of obs.
ASC Cross-sectional
t-test
Patell’s (1976) Test
Boehmer’s et al. (1991) t-statistic
% Positive
Sign Test
StatisticAll All Actions 8,004 -0.660 -8.47 -15.54 -8.66 0.46 -7.96
Firms FIN 1,392 -0.936 -4.34 -9.8 -3.92 0.47 -2.25
FIS 1,392 -1.154 -8.06 -9.96 -8.75 0.37 -9.86
IRCUT 2,436 -0.918 -6.84 -11.76 -8.66 0.43 -7.29
LIQ 2,784 -0.051 -0.36 -1.38 -0.70 0.52 1.90
Financial All Actions 1219 -1.688 -6.49 -14.83 -6.36 0.41 -5.99
Firms FIN 212 -4.881 -5.41 -18.59 -5.19 0.37 -3.71
FIS 212 -0.059 -0.12 -0.51 -0.36 0.45 -1.51
IRCUT 371 -2.792 -6.65 -10.72 -6.73 0.33 -6.49
LIQ 424 0.060 0.16 -1.62 -0.69 0.49 -0.39
Non- All Actions 6785 -0.476 -6.02 -10.6 -6.32 0.46 -6.11
Financial FIN 1180 -0.227 -1.2 -2.77 -1.26 0.49 -0.87
Firms FIS 1180 -1.350 -9.37 -10.6 -9.85 0.35 -10.07
IRCUT 2065 -0.581 -4.22 -8.23 -6.31 0.44 -5.17
LIQ 2,360 -0.070 -0.47 -0.82 -0.43 0.52 2.22
them with the dummy variable coefficient estimates reported in Table III. Overall, the results are consistent across the two methodologies. Whereas the dummy variables approach reports an abnormal response of all firms to government actions of -0.557%, the market model abnormal spread changes are estimated to be -0.660%. Using the market model to measure normal performance, again, we find the market reaction is negative and significant for all but the liquidity support announcements and that the strongest reaction, by far, is found in the response of financial firms to financial sector policies. Again, fiscal stimulus announcements elicit the strongest response for non-financial firms and interest rate cuts reduce CDS spreads significantly for both financial and non-financial firms, although the response is stronger for financial firms and weaker for non-financial firms using this methodology.
It is possible that a large reaction by a single firm (or a few firms) could unduly influence our results. For example, upon announcement of former President Bush’s economic stimulus act on January 18, 2008, the average response by
CDS market participants was a -0.92%. However, AIG responded with at 32% increase in its CDS premia from 110 basis points to 145 basis points. To ensure our findings are not unduly influenced by such outliers, we first identify outliers as those CDS spread changes that are more than three standard deviations from the mean. We set a dummy
variable, OUTitD , equal to one if the % itCDS∆ is more than
three standard deviations from the mean and re-estimate equations (1) and (2) including this variable in the model.
We find that the coefficient on OUTitD is both positive and
statistically significant, however, its inclusion in the model does not materially change our findings. Comparing results from Table V with those of Table III, our coefficient on the original event dummy is quite similar (-0.579 versus -0.557 with both coefficients statistically significant at the one percent level). In the standard market model, we exclude these outlier observations from our estimation in Table VI and compare the results with those of Table IV. Again, we

10 Journal of applied finanCe – no. 1, 2012
Table V. Multivariate Regression Results Accounting for Outliers Defined as % CDX∆ more than Three Standard Deviations from the Mean
TableV shows results for Equations (1) and (2) accounting for outliers. Equation (1) regresses daily log differences in CDS spreads against a market index, an event dummy corresponding to government-initiated policy actions (D), and a dummy variable (DOUT) set to one if the percentage change in that firm’s CDS spread is more than three standard deviations from the mean on the event date. Equation (2) further differentiates between the various event types: financial sector policies (FIN), fiscal policies (FIN), interest rate cuts (IRCUT) and liquidity support programs (LIQ). Test statistics are calculated using robust standard errors.
All Firms Financial Firms Non-Financial Firms(1) (2) (1) (2) (1) (2)
Intercept 0.029*** 0.029*** 0.105*** 0.102*** 0.016 0.016(3.15) (3.12) (4.27) (4.17) (1.60) (1.58)
%∆CDX 0.623*** 0.624*** 0.695*** 0.694*** 0.607*** 0.609***(167.43) (167.78) (63.55) (64.49) (156.89) (156.93)
DEVENT -0.579*** -1.562*** -0.414***(-7.39) (-5.76) (-5.30)
FIN -0.731*** -5.784*** 0.128(-3.25) (-5.53) (0.72)
FIS -0.969*** -0.044 -1.140***(-6.83) (-0.10) (-7.91)
IRCUT -1.200*** -2.054*** -1.055***(-9.39) (-4.83) (-8.10)
LIQ 0.245* 0.197 0.249(1.74) (0.53) (1.64)
DOUT 2.185*** 2.184*** 3.953*** 4.094*** 1.730*** 1.725***(5.82) (5.82) (4.89) (5.10) (4.09) (4.08)
R2 0.144 0.144 0.182 0.184 0.137 0.137No. of observations
300,672 45,792 254,880
***Significant at the 0.01 level. **Significant at the 0.05 level. *Significant at the 0.10 level.
find that the results and overall conclusions are consistent. As a final robustness check, in Table VII, we identify outliers based on the influence criteria of Belsley, Kuh, and Welsch (1980). Specifically, we examine the studentized residual, the covariance ratio, the ith element of the hat matrix, and the DFFITS statistics. If the studentized residual is greater than two, the absolute value of the covariance ratio minus one is greater than 3p/n (where p is equal to the number of parameters and n is the number of observations), the ith diagonal of the hat matrix is greater than 2p/n, and the
DFFITS statistic is greater than np /2 , then OUTitD is set
equal to one, otherwise it is set equal to zero. The results show that, while the size of the coefficients and the explanatory power of the model are stronger, the overall conclusions are unchanged.
Furthermore, to ensure findings are not sensitive to the choice of estimation window, we expand the estimation window to the 120-day period that includes the [-140,-21] trading day period. Our findings, reported in Table VIII, are again comparable to those reported in Table IV.17
IV. Conclusion
This paper examines the effects of government intervention during the 2007–2009 financial crisis on CDS prices using a cross-section of 348 firms from both the financial and
17 One exception is that the non-financial firms exhibit small but significant positive mean abnormal spread changes upon announcement of financial sector policies.
11Greatrex and renGifo – Government intervention and the CdS market
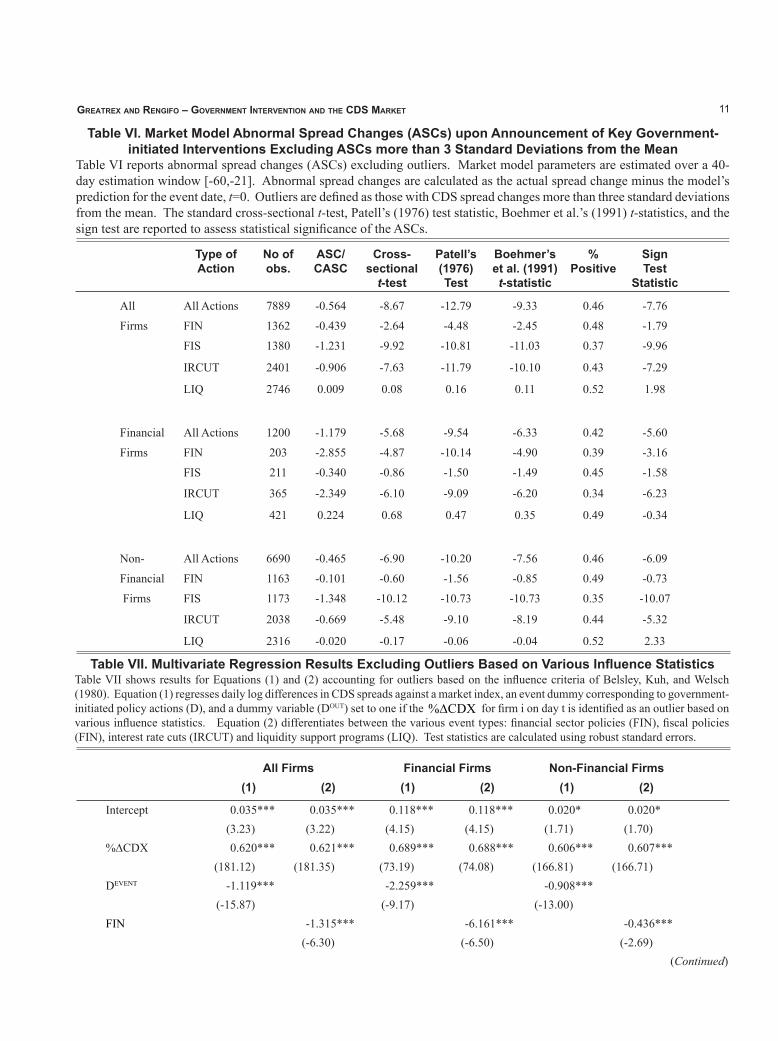
Table VI. Market Model Abnormal Spread Changes (ASCs) upon Announcement of Key Government-initiated Interventions Excluding ASCs more than 3 Standard Deviations from the Mean
Table VI reports abnormal spread changes (ASCs) excluding outliers. Market model parameters are estimated over a 40-day estimation window [-60,-21]. Abnormal spread changes are calculated as the actual spread change minus the model’s prediction for the event date, t=0. Outliers are defined as those with CDS spread changes more than three standard deviations from the mean. The standard cross-sectional t-test, Patell’s (1976) test statistic, Boehmer et al.’s (1991) t-statistics, and the sign test are reported to assess statistical significance of the ASCs.
Type of Action
No of obs.
ASC/ CASC
Cross-sectional
t-test
Patell’s (1976) Test
Boehmer’s et al. (1991) t-statistic
% Positive
Sign Test
Statistic
All All Actions 7889 -0.564 -8.67 -12.79 -9.33 0.46 -7.76
Firms FIN 1362 -0.439 -2.64 -4.48 -2.45 0.48 -1.79
FIS 1380 -1.231 -9.92 -10.81 -11.03 0.37 -9.96
IRCUT 2401 -0.906 -7.63 -11.79 -10.10 0.43 -7.29
LIQ 2746 0.009 0.08 0.16 0.11 0.52 1.98
Financial All Actions 1200 -1.179 -5.68 -9.54 -6.33 0.42 -5.60
Firms FIN 203 -2.855 -4.87 -10.14 -4.90 0.39 -3.16
FIS 211 -0.340 -0.86 -1.50 -1.49 0.45 -1.58
IRCUT 365 -2.349 -6.10 -9.09 -6.20 0.34 -6.23
LIQ 421 0.224 0.68 0.47 0.35 0.49 -0.34
Non- All Actions 6690 -0.465 -6.90 -10.20 -7.56 0.46 -6.09
Financial FIN 1163 -0.101 -0.60 -1.56 -0.85 0.49 -0.73
Firms FIS 1173 -1.348 -10.12 -10.73 -10.73 0.35 -10.07
IRCUT 2038 -0.669 -5.48 -9.10 -8.19 0.44 -5.32
LIQ 2316 -0.020 -0.17 -0.06 -0.04 0.52 2.33
Table VII. Multivariate Regression Results Excluding Outliers Based on Various Influence StatisticsTable VII shows results for Equations (1) and (2) accounting for outliers based on the influence criteria of Belsley, Kuh, and Welsch (1980). Equation (1) regresses daily log differences in CDS spreads against a market index, an event dummy corresponding to government-initiated policy actions (D), and a dummy variable (DOUT) set to one if the % CDX∆ for firm i on day t is identified as an outlier based on various influence statistics. Equation (2) differentiates between the various event types: financial sector policies (FIN), fiscal policies (FIN), interest rate cuts (IRCUT) and liquidity support programs (LIQ). Test statistics are calculated using robust standard errors.
All Firms Financial Firms Non-Financial Firms(1) (2) (1) (2) (1) (2)
Intercept 0.035*** 0.035*** 0.118*** 0.118*** 0.020* 0.020*(3.23) (3.22) (4.15) (4.15) (1.71) (1.70)
%∆CDX 0.620*** 0.621*** 0.689*** 0.688*** 0.606*** 0.607***(181.12) (181.35) (73.19) (74.08) (166.81) (166.71)
DEVENT -1.119*** -2.259*** -0.908***(-15.87) (-9.17) (-13.00)
FIN -1.315*** -6.161*** -0.436***(-6.30) (-6.50) (-2.69)
(Continued)

12 Journal of applied finanCe – no. 1, 2012
Table VII. Multivariate Regression Results Excluding Outliers Based on Various Influence Statistics (Continued)
All Firms Financial Firms Non-Financial Firms(1) (2) (1) (2) (1) (2)
FIS -1.202*** -0.565 -1.315***(-9.25) (-1.45) (-9.71)
IRCUT -1.667*** -2.749*** -1.469***(-14.62) (-7.28) (-12.68)
LIQ -0.490*** -0.737** -0.438***(-3.95) (-2.24) (-3.27)
DOUT 20.241*** 20.208*** 21.863*** 21.903*** 19.545*** 19.488***(60.58) (60.46) (32.77) (32.88) (51.90) (51.67)
R2 0.164 0.164 0.216 0.218 0.153 0.153No. of observations 300,672 45,792 254,880
***Significant at the 0.01 level. **Significant at the 0.05 level. *Significant at the 0.10 level.
Table VIII. Market Model Abnormal Spread Changes (ASCs) Using a 120-day Estimation WindowTable VIII reports abnormal spread changes (ASCs) based on a standard market model for which parameters are estimated over a 120-day estimation window [-140,-21]. Abnormal spread changes are calculated as the actual spread change minus the model’s prediction for the event date, t=0. The standard cross-sectional t-test, Patell’s (1976) test statistic, Boehmer et al.’s (1991) t-statistics, and the sign test are reported to assess statistical significance of the ASCs.
Type of Action
No of obs.
ASC/ CASC
Cross-sectional
t-test
Patell’s (1976) Test
Boehmer’s et al. (1991) t-statistic
% Positive
Sign Test
Statistic
All All Actions 8,004 -0.708 -9.20 -13.97 -10.16 0.45 -9.48
Firms FIN 1,392 -0.462 -2.14 -3.88 -2.04 0.51 0.54
FIS 1,392 -1.317 -9.27 -9.39 -9.96 0.33 -12.44
IRCUT 2,436 -1.369 -10.65 -13.44 -11.95 0.38 -11.71
LIQ 2,784 0.051 0.37 -1.72 -1.21 0.53 3.30
Financial All Actions 1219 -1.581 -6.10 -10.75 -6.51 0.41 -12.97
Firms FIN 212 -5.056 -5.30 -14.65 -5.09 0.37 6.92
FIS 212 -0.270 -0.57 -1.27 -1.48 0.41 -16.67
IRCUT 371 -2.295 -5.89 -7.59 -5.89 0.35 -11.95
LIQ 424 0.124 0.34 0.13 0.11 0.49 -3.9
Non- All Actions 6785 -0.551 -7.09 -10.61 -8.06 0.45 -7.64
Financial FIN 1180 0.364 2.04 1.99 1.23 0.53 2.15
Firms FIS 1180 -1.505 -10.49 -9.66 -10.12 0.32 -12.40
IRCUT 2065 -1.202 -8.96 -11.38 -10.42 0.39 -10.19
LIQ 2,360 0.038 0.25 -1.93 -1.32 0.54 3.83

13Greatrex and renGifo – Government intervention and the CdS market
non-financial sector. We find evidence that CDS spreads responded favorably to government intervention as abnormal spread changes were negative and statistically significant for both financial and non-financial firms. The reaction to government actions was stronger for financial firms than for non-financial ones. Not surprisingly, the financial sector responded most favorably to financial sector policies, for which announcement day abnormal spread reductions were approximately five percent. Announcements of interest rate cuts reduced financial firms ASCs by approximately two percent. Non-financial firms responded most favorably to traditional fiscal and monetary policy measures with abnormal spread reductions of approximately one percent for both fiscal policies and interest rate cuts. These findings are important because, to the best of our knowledge, this is the first study to look at the effects of monetary and fiscal policy on the CDS prices of non-financial firms.
On the whole, we conclude the government efforts to
restore confidence in credit markets were successful when evaluated in an event study context. By design, an event study is a somewhat narrow approach in that it focuses on the immediate market reaction. A more thorough investigation of the long-term implications of these policies would be an important area for future research.
While the credit crisis of 2007-2009 will be remembered as a period of great turmoil in financial markets, the effectiveness of the government’s response will remain an area of considerable debate for many years to come. This study seeks to enrich that debate by providing an empirical examination of the CDS market’s response to government interventions over this timeframe. While only time will tell of the full long-term consequences of these actions, this study finds that - in the short-term context of an event study - the government’s efforts were at least somewhat effective at restoring confidence in credit markets.n
References
Acharya, V.V. and T.C. Johnson, 2007, “Insider Trading in Credit Derivatives,” Journal of Financial Economics 84 (No 1.), 110-141.
Acharya, V.V., T. Philippon, M. Richardson, and N. Roubini, 2009, “A Bird’s Eye-View: The Financial Crisis of 2007-2009: Causes and Remedies,” Prologue in Restoring Financial Stability: How to Repair a Failed System, V.V. Acharya and M. Richardson (Eds.), New York, NY, Wiley.
Aït-Sahalia, Y., J. Andritzky, A. Jobst, S. Nowak, and N. Tamirisa, 2009, “How to Stop a Herd of Running Bears? Market Response to Policy Initiatives during the Global Financial Crisis,” IMF Working Paper.
Belsley, D.A., E. Kuh, and R.E. Welsch, 1980, Regression Diagnostics: Identifying Influential Data and Sources of Collinearity, New York, NY, Wiley.
Bernanke, B.S., 2009, “Four Questions about the Financial Crisis,” Morehouse College, Atlanta, Georgia, April 14, http://www.federalreserve.gov/newsevents/speech/bernanke20090414a.htm.
Bernanke, B.S., 2009, “Federal Reserve Programs to Strengthen Credit Markets and the Economy,” Speech before the Committee on Financial Services, US House of Representatives, Washington, DC, February 10, http://www.federalreserve.gov/newsevents/testimony/bernanke20090210a.htm.
Bernanke, B.S. and K.N. Kuttner, 2005, “What Explains the Stock Market’s Reaction to Federal Reserve Policy?” Journal of Finance 60 (No. 3), 1221-1257.
King, M.R., 2009, “Time to Buy or just Buying Time? The Market Reaction to Bank Rescue Packages,” BIS Working Papers No. 288.
Krishnamurthy, A., 2010, “How Debt Markets have Malfunctioned in the Crisis,” Journal of Economic Perspectives 24 (No. 1), 3-28
MacKinlay, A.C., 1997, “Event Studies in Economics and Finance,” Journal of Economic Literature 35 (No. 1), 13-39.
Miyajima, H. and Y. Yafeh, 2007, “Japan’s Banking Crisis: An Event-study Perspective,” Journal of Banking & Finance 31 (No. 9), 2866-2885.
Nowak, S., J.R. Andritzky, A. Jobst, and N.T. Tamirisa, 2009, “Macroeconomic Fundamentals, Price Discovery and Volatility Dynamics in Emerging Markets,” IMF Working Paper.
Panetta, F., T. Faeh, G. Grande, C. Ho, M. King, A. Levy, F.M. Signoretti, M. Taboga, and A. Zaghini, 2009, “An Assessment of Financial Sector Rescue Programmes,” BIS Papers No. 48.
Pittman, M. and B. Ivry, 2010. “Financial Rescue Nears GDP as Pledges Top $12.8 Trillion (Update1),” Bloomberg, http://www.bloomberg.com/apps/news?pid=20601087&sid=armOzfkwtCA4.
Taylor, J.B., 2008, “The Financial Crisis and the Policy Responses: An Empirical Analysis of What Went Wrong,” Stanford University Working Paper.
Related Documents