University of New Hampshire University of New Hampshire University of New Hampshire Scholars' Repository University of New Hampshire Scholars' Repository Honors Theses and Capstones Student Scholarship Spring 2016 Government Financial Disclosures: The Timeliness of State Government Financial Disclosures: The Timeliness of State Comprehensive Annual Financial Reports Comprehensive Annual Financial Reports Dylan McLeod Bartlett University of New Hampshire, Durham Follow this and additional works at: https://scholars.unh.edu/honors Part of the Accounting Commons Recommended Citation Recommended Citation Bartlett, Dylan McLeod, "Government Financial Disclosures: The Timeliness of State Comprehensive Annual Financial Reports" (2016). Honors Theses and Capstones. 268. https://scholars.unh.edu/honors/268 This Senior Honors Thesis is brought to you for free and open access by the Student Scholarship at University of New Hampshire Scholars' Repository. It has been accepted for inclusion in Honors Theses and Capstones by an authorized administrator of University of New Hampshire Scholars' Repository. For more information, please contact [email protected].

Welcome message from author
This document is posted to help you gain knowledge. Please leave a comment to let me know what you think about it! Share it to your friends and learn new things together.
Transcript

University of New Hampshire University of New Hampshire
University of New Hampshire Scholars' Repository University of New Hampshire Scholars' Repository
Honors Theses and Capstones Student Scholarship
Spring 2016
Government Financial Disclosures: The Timeliness of State Government Financial Disclosures: The Timeliness of State
Comprehensive Annual Financial Reports Comprehensive Annual Financial Reports
Dylan McLeod Bartlett University of New Hampshire, Durham
Follow this and additional works at: https://scholars.unh.edu/honors
Part of the Accounting Commons
Recommended Citation Recommended Citation Bartlett, Dylan McLeod, "Government Financial Disclosures: The Timeliness of State Comprehensive Annual Financial Reports" (2016). Honors Theses and Capstones. 268. https://scholars.unh.edu/honors/268
This Senior Honors Thesis is brought to you for free and open access by the Student Scholarship at University of New Hampshire Scholars' Repository. It has been accepted for inclusion in Honors Theses and Capstones by an authorized administrator of University of New Hampshire Scholars' Repository. For more information, please contact [email protected].
GOVERNMENT
FINANCIAL
DISCLOSURES: THE
TIMELINESS OF STATE
COMPREHESIVE ANNUAL
FINANCIAL REPORTS
Dylan Bartlett
Faculty Advisor: Catherine Plante
Honors Thesis: Spring 2016

1
TABLE OF CONTENTS
INTRODUCTION .................................................................................................................................... 2
WHAT IS A COMPREHENSIVE ANNUAL FINANCIAL REPORT (CAFR)? ............................................................................ 2 WHO ARE THE PRIMARY USERS OF A CAFR? .......................................................................................................... 3 WHY IS TIMELINESS AN IMPORTANT CHARACTERISTIC OF FINANCIAL REPORTING? .......................................................... 4
PREVIOUS STUDIES AND PUBLICATIONS .................................................................................................. 5
DATA AND METHODS............................................................................................................................ 8
DATA COLLECTION ............................................................................................................................................. 8 ANALYSIS OF COMPLETION DATA FOR THE 50 STATES ............................................................................................... 8
Table 1: Days to Complete CAFR (2005 – 2014) ....................................................................................... 9 Table 2: Yearly CAFR Completion Data (2005 – 2014) ............................................................................ 11 Chart 1: Standard Deviation (2005 -2014) .............................................................................................. 12 Chart 2: Average Days to Complete (2005 – 2014)................................................................................. 12 Figure 1: Number of Times State CAFR Published in Later than 6 Months ............................................. 12
DESCRIPTION OF VARIABLES ............................................................................................................................... 13 Table 3: Description of Variables ............................................................................................................ 13
DESCRIPTION OF MODELS ................................................................................................................................. 14 Table 4: Model Description ..................................................................................................................... 14
STATISTICAL METHODOLOGY ............................................................................................................................. 15
RESULTS ............................................................................................................................................ 16
TABLE 5: SUMMARY RESULTS OF SIGNIFICANT INDEPENDENT VARIABLES .................................................................... 17 TABLE 6: SUMMARY RESULTS OF INSIGNIFICANT INDEPENDENT VARIABLES ................................................................. 18 TABLE 7: OVERALL SUMMARY RESULTS................................................................................................................ 19
DISCUSSION OF RESULTS ..................................................................................................................... 19
CONCLUSION ..................................................................................................................................... 24
APPENDIX .......................................................................................................................................... 25
TABLE 8: STATE STATUTES................................................................................................................................. 25 MODEL 1: REGRESSION RESULTS ........................................................................................................................ 28 MODEL 2: REGRESSION RESULTS ........................................................................................................................ 29 MODEL 3: REGRESSION RESULTS ........................................................................................................................ 30 MODEL 4: REGRESSION RESULTS ........................................................................................................................ 31 MODEL 5: REGRESSION RESULTS ........................................................................................................................ 32
WORKS CITED .................................................................................................................................... 33

2
Introduction
What is a Comprehensive Annual Financial Report (CAFR)?
State Governments are required by GASB to release a Comprehensive Annual Financial
Report, or a CAFR, each year. A CAFR can be broken down into three sections: the introductory
section, the financial section, and the statistical section.
The introductory section includes the letter of transmittal, the prior year’s certificate of
achievement for excellence in financial reporting (if one was earned by the state), a list of the
principal officers of the government, and an organizational chart of the government (Miller 12).
The transmittal letter is the key component of this section, it includes the date the report is made
available to the public as well as general information about the state (14). This information can
vary from state to state because this section is not heavily regulated.
The financial section presents the government’s financial statements and schedules, note
disclosures and narrative. This section includes the independent auditor’s report, the
management discussion and analysis, the basic financial statements, required supplementary
information, and combining and individual fund presentations and supplementary info (17). The
basic financial statements are government wide, its component units, and its funds. This is the
most important part of the report as it presents all of the state’s financial information, as well as
the independent auditor’s report.
The statistical section provides additional historical perspective, context, and detail of the
last ten years for the purpose of understanding and assessing a government’s economic condition
(61). This section includes financial trends, revenue capacity, debt capacity, demographics and
economics information, and operating information (62). This section can be extremely useful in
studying how the state has fared over the last ten years in the categories presented.
3
Who are the Primary Users of a CAFR?
According GASB statement No. 1, there are three groups believed to be primary users of
a CAFR: the citizenry, legislative and oversight bodies, and investors and creditors. The
statement further asserts that the four primary uses of a government financial statement are: to
compare actual financial results with the legally adopted budget; to assess the financial condition
of the government as well as the results of operations; to assist in determining compliance with
finance-related laws, rules, and regulations; and to assist in evaluating efficiency and
effectiveness of the government (GASB 11). Essentially the primary users of the CAFR use it to
hold the government financially accountable.
The citizenry has a right to know how their government operates in a financial sense. The
citizenry can use a CAFR to see how their government is spending tax money, how their
government is performing financially, and how effective and efficient their government is. The
citizenry is then able to hold their government accountable and know what their government is
doing.
The legislative and oversight bodies use the CAFR in order to ensure the government’s
spending is in line with the budget and that the government obeys the appropriate laws and
regulations. As elected representatives of the citizenry, it is in this group’s best interest to ensure
that the government is acting for the good of those who elected them.
The investors and creditors are interested in a government’s CAFR so that they can
ensure the government is in compliance with debt covenants, and also to determine the credit
rating of the state. The CAFR is an important resource so that these users can determine each
state’s rate of borrowing.

4
Why is Timeliness an Important Characteristic of Financial Reporting?
Timeliness is an important characteristic of financial reporting. According to paragraph
66 of GASB Concept Statement no. 1:
If financial reports are to be useful, they must be issued soon enough after the
reported events to affect decisions. Timeliness alone does not make information
useful, but the passage of time usually diminishes the usefulness that the
information otherwise would have had. In some instances, timeliness may be so
essential that it may require sacrificing a certain amount of precision or detail.
Sometimes a timely estimate is more useful than precise information that takes a
long time to produce (GASB 20).
Despite this there is no set deadline for government entities, in fact GASB has no actual
authority to set a deadline. However, the Government Finance Officers Association has
established the Certificate of Achievement for Excellence in Financial Reporting Program in
order to encourage state and local governments to produce more transparent and timely CAFRs.
The GFOA says about the program, “The goal of the program is not to assess the financial health
of participating governments, but rather to ensure that users of their financial statements have the
information they need to do so themselves” (GFOA). There is however no penalty for not
participating in the program, or real benefit other than receiving a certificate that can be shown to
users of the CAFR. The real benefit is that a participating government that earns a certificate is
able to show its users that its report has earned an award for quality of reporting, lending to the
report’s dependability.
Conversely, the SEC requires a publicly traded company to release its Form 10-K 90
days after its fiscal year-end for non-accelerated filers (less than $75MM), 75 days after its fiscal
5
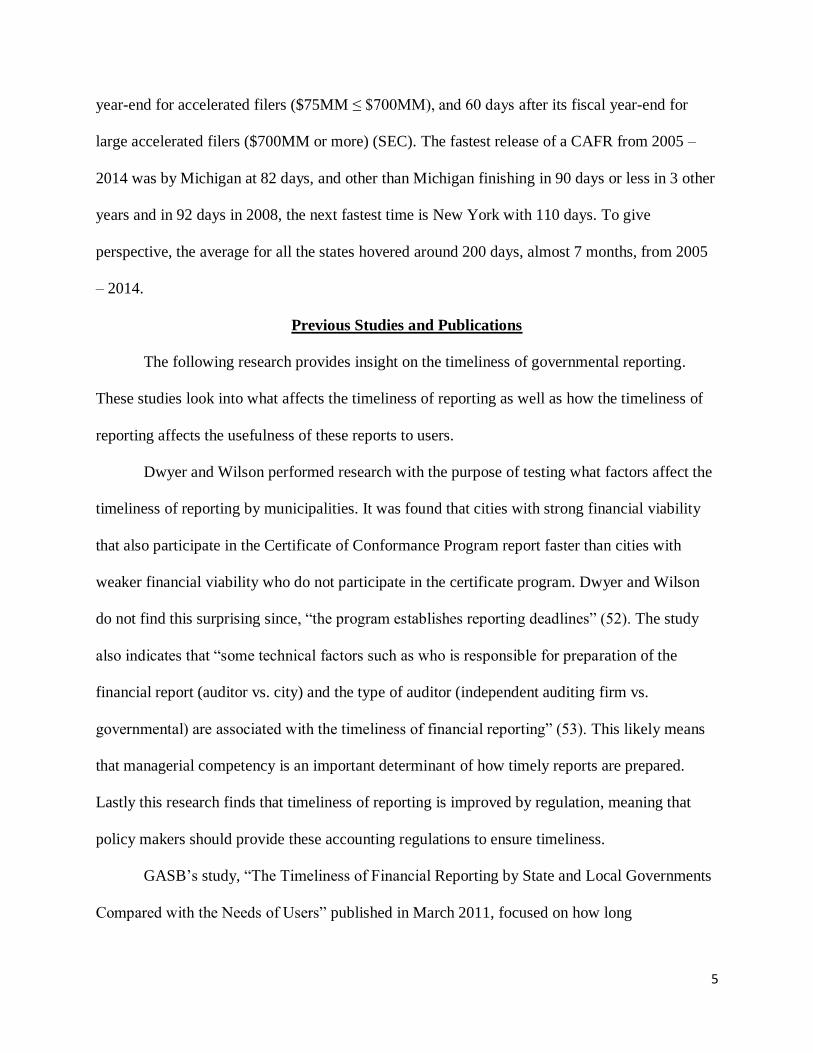
year-end for accelerated filers ($75MM ≤ $700MM), and 60 days after its fiscal year-end for
large accelerated filers ($700MM or more) (SEC). The fastest release of a CAFR from 2005 –
2014 was by Michigan at 82 days, and other than Michigan finishing in 90 days or less in 3 other
years and in 92 days in 2008, the next fastest time is New York with 110 days. To give
perspective, the average for all the states hovered around 200 days, almost 7 months, from 2005
– 2014.
Previous Studies and Publications
The following research provides insight on the timeliness of governmental reporting.
These studies look into what affects the timeliness of reporting as well as how the timeliness of
reporting affects the usefulness of these reports to users.
Dwyer and Wilson performed research with the purpose of testing what factors affect the
timeliness of reporting by municipalities. It was found that cities with strong financial viability
that also participate in the Certificate of Conformance Program report faster than cities with
weaker financial viability who do not participate in the certificate program. Dwyer and Wilson
do not find this surprising since, “the program establishes reporting deadlines” (52). The study
also indicates that “some technical factors such as who is responsible for preparation of the
financial report (auditor vs. city) and the type of auditor (independent auditing firm vs.
governmental) are associated with the timeliness of financial reporting” (53). This likely means
that managerial competency is an important determinant of how timely reports are prepared.
Lastly this research finds that timeliness of reporting is improved by regulation, meaning that
policy makers should provide these accounting regulations to ensure timeliness.
GASB’s study, “The Timeliness of Financial Reporting by State and Local Governments
Compared with the Needs of Users” published in March 2011, focused on how long

6
governments take to release their financial reports as well as how the usefulness of these reports
are affected by the passage of time to users of these statements. The types of governments looked
at included the 50 states, 100 largest counties and localities, and 50 largest independent school
districts and special districts. Largest local and county governments and independent school
districts issued financial reports approximately 6 months after fiscal year-end. State governments
averaged close to 7 months. Special districts average about 4 months (Mead 2). Overall, the
average government is much slower to release its financial statement than is a publicly traded
company.
To determine how the usefulness of governmental financial reports was affected by the
passage of time, GASB sent out surveys via email to three groups determined to be users of these
statements. These groups are the National Federation of Municipal Analysts (NFMA), the
Governmental Research Association (GRA), and the National Association of Legislative Fiscal
Officers (NALFO). These three groups represent the three primary users outlined in GASB’s
Concept Statement No. 1: the NFMA represents investors and creditors, the GRA represents the
citizenry, and the NALFO represents legislative and oversight bodies. The respondents answered
the question, “How useful is or would information be if published [Time Frame] after the end of
the fiscal year?”. This question was answered using a Likert Scale (1 for “not useful at all”; 5 for
“very useful”), for five different time frames: 45 days, 3 months, 6 months, 12 months, and later
than 12 months (6). The results of this question were valuable to GASB so that they could
determine what the users of government financial statements expected in terms of timeliness.
The results of the survey showed that 89% of respondents rated information received in
45 days as “very useful,” while only 44% of respondents rated information received in 3 months
as “very useful,” and less than 9% of respondents rated information received in 6 months as
7
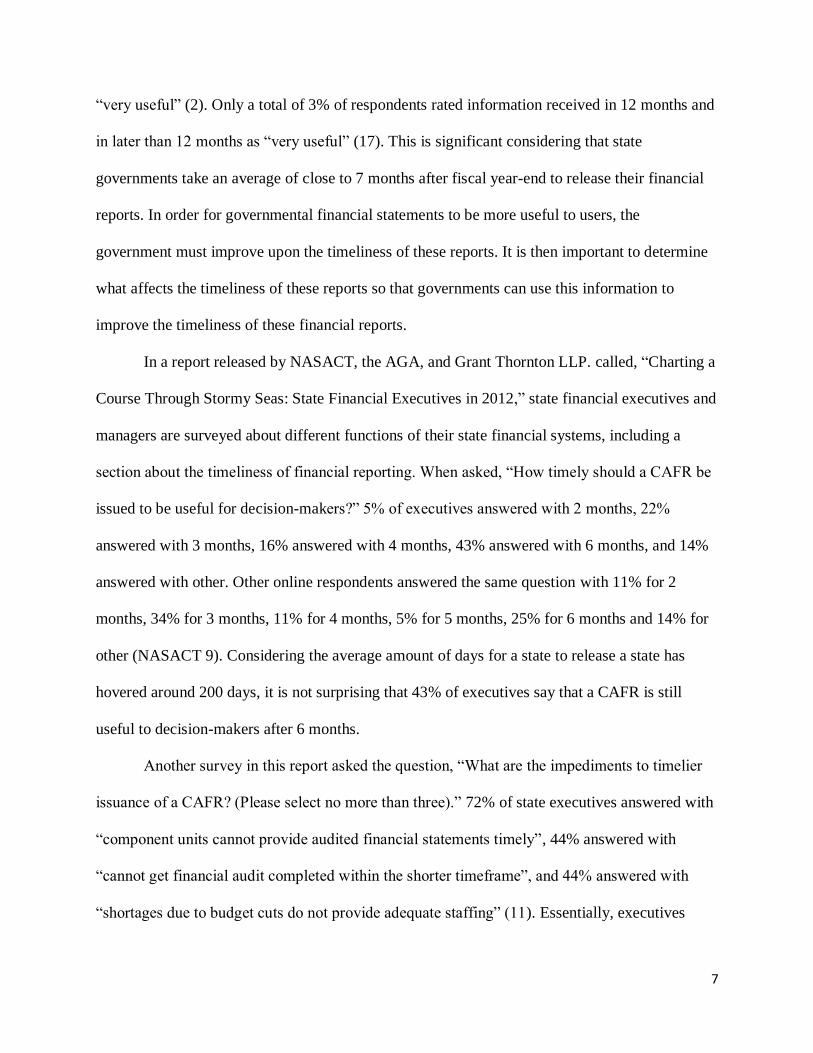
“very useful” (2). Only a total of 3% of respondents rated information received in 12 months and
in later than 12 months as “very useful” (17). This is significant considering that state
governments take an average of close to 7 months after fiscal year-end to release their financial
reports. In order for governmental financial statements to be more useful to users, the
government must improve upon the timeliness of these reports. It is then important to determine
what affects the timeliness of these reports so that governments can use this information to
improve the timeliness of these financial reports.
In a report released by NASACT, the AGA, and Grant Thornton LLP. called, “Charting a
Course Through Stormy Seas: State Financial Executives in 2012,” state financial executives and
managers are surveyed about different functions of their state financial systems, including a
section about the timeliness of financial reporting. When asked, “How timely should a CAFR be
issued to be useful for decision-makers?” 5% of executives answered with 2 months, 22%
answered with 3 months, 16% answered with 4 months, 43% answered with 6 months, and 14%
answered with other. Other online respondents answered the same question with 11% for 2
months, 34% for 3 months, 11% for 4 months, 5% for 5 months, 25% for 6 months and 14% for
other (NASACT 9). Considering the average amount of days for a state to release a state has
hovered around 200 days, it is not surprising that 43% of executives say that a CAFR is still
useful to decision-makers after 6 months.
Another survey in this report asked the question, “What are the impediments to timelier
issuance of a CAFR? (Please select no more than three).” 72% of state executives answered with
“component units cannot provide audited financial statements timely”, 44% answered with
“cannot get financial audit completed within the shorter timeframe”, and 44% answered with
“shortages due to budget cuts do not provide adequate staffing” (11). Essentially, executives
8
either need financial information faster or they need a larger budget to hire more people to work
on the CAFR to be able to issue a CAFR in a timely manner. Another interesting point is that
31% of executives say that “there is little real pressure from any group to produce it more
timely” (11). This lends to the idea that states may increase the timeliness of reporting if they
are held accountable, if they are given deadlines, and if given feedback by users. The lack of
timeliness of reporting by states and by their component units could realistically be fixed by
more stringent regulation of when these documents need to be completed.
Data and Methods
Data Collection:
This research examines the release dates of each of the 50 states CAFR from the years
2005 – 2014. After studying the number of days it took for each state to complete their annual
CAFR in the years 2005 – 2014, information about each state was collected from sources
including the CAFR of each state, the U.S Census Bureau, the statutes of each state pertaining to
the state government’s preparation of its CAFR, and from websites containing information on
election data. Data was collected from these sources to determine the characteristics of each state
and its government.
Analysis of Completion Data for the 50 States:
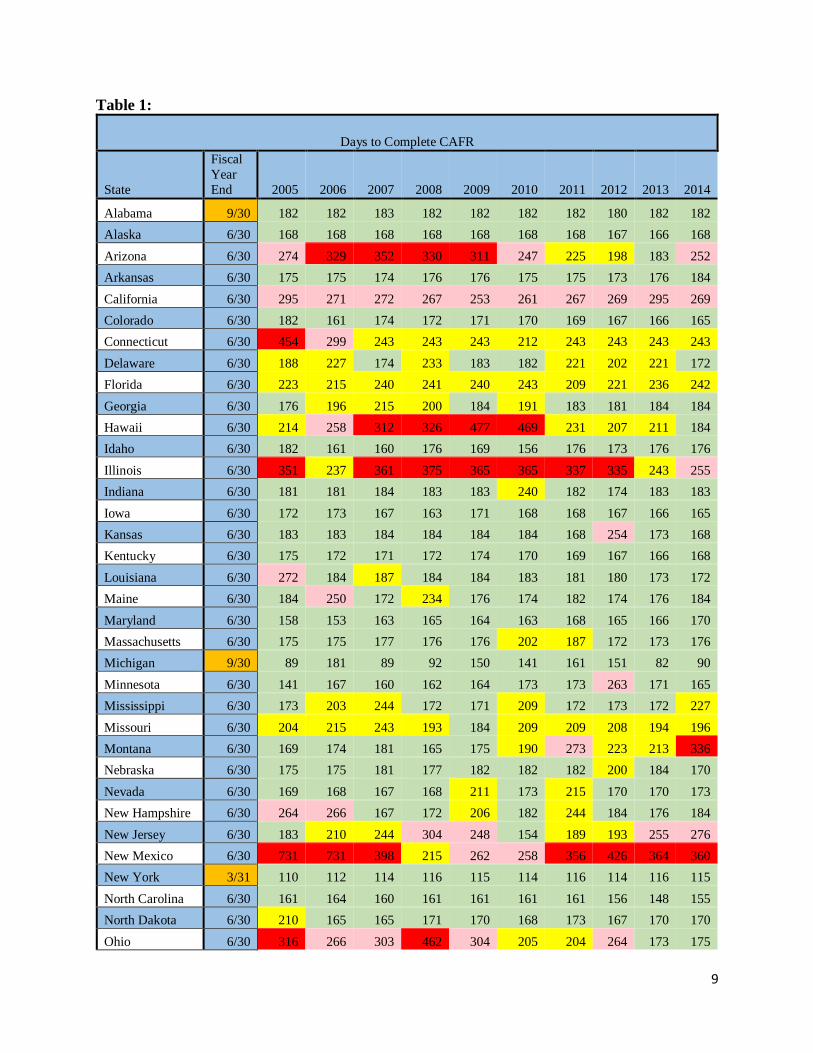
Table 1 shows how many days it took for each state to complete and publish its CAFR
after its fiscal year-end, as well as each state’s fiscal year-end. Numbers highlighted in green
indicate that the state completed its annual CAFR in 6 months or less, yellow indicates the state
finished in 6 – 8 months, light red indicates the state finished in 8 – 10 months, and the darker
red indicates that the state finished any time after 10 months.
9
Table 1:
Days to Complete CAFR
State
Fiscal
Year
End 2005 2006 2007 2008 2009 2010 2011 2012 2013 2014
Alabama 9/30 182 182 183 182 182 182 182 180 182 182
Alaska 6/30 168 168 168 168 168 168 168 167 166 168
Arizona 6/30 274 329 352 330 311 247 225 198 183 252
Arkansas 6/30 175 175 174 176 176 175 175 173 176 184
California 6/30 295 271 272 267 253 261 267 269 295 269
Colorado 6/30 182 161 174 172 171 170 169 167 166 165
Connecticut 6/30 454 299 243 243 243 212 243 243 243 243
Delaware 6/30 188 227 174 233 183 182 221 202 221 172
Florida 6/30 223 215 240 241 240 243 209 221 236 242
Georgia 6/30 176 196 215 200 184 191 183 181 184 184
Hawaii 6/30 214 258 312 326 477 469 231 207 211 184
Idaho 6/30 182 161 160 176 169 156 176 173 176 176
Illinois 6/30 351 237 361 375 365 365 337 335 243 255
Indiana 6/30 181 181 184 183 183 240 182 174 183 183
Iowa 6/30 172 173 167 163 171 168 168 167 166 165
Kansas 6/30 183 183 184 184 184 184 168 254 173 168
Kentucky 6/30 175 172 171 172 174 170 169 167 166 168
Louisiana 6/30 272 184 187 184 184 183 181 180 173 172
Maine 6/30 184 250 172 234 176 174 182 174 176 184
Maryland 6/30 158 153 163 165 164 163 168 165 166 170
Massachusetts 6/30 175 175 177 176 176 202 187 172 173 176
Michigan 9/30 89 181 89 92 150 141 161 151 82 90
Minnesota 6/30 141 167 160 162 164 173 173 263 171 165
Mississippi 6/30 173 203 244 172 171 209 172 173 172 227
Missouri 6/30 204 215 243 193 184 209 209 208 194 196
Montana 6/30 169 174 181 165 175 190 273 223 213 336
Nebraska 6/30 175 175 181 177 182 182 182 200 184 170
Nevada 6/30 169 168 167 168 211 173 215 170 170 173
New Hampshire 6/30 264 266 167 172 206 182 244 184 176 184
New Jersey 6/30 183 210 244 304 248 154 189 193 255 276
New Mexico 6/30 731 731 398 215 262 258 356 426 364 360
New York 3/31 110 112 114 116 115 114 116 114 116 115
North Carolina 6/30 161 164 160 161 161 161 161 156 148 155
North Dakota 6/30 210 165 165 171 170 168 173 167 170 170
Ohio 6/30 316 266 303 462 304 205 204 264 173 175
10
Oklahoma 6/30 242 181 213 183 184 183 183 214 184 184
Oregon 6/30 184 182 174 207 183 175 202 172 212 183
Pennsylvania 6/30 176 175 173 182 206 175 165 172 166 172
Rhode Island 6/30 232 182 283 283 280 183 175 173 172 171
South Carolina 6/30 153 144 138 135 157 170 161 342 229 175
South Dakota 6/30 232 297 369 347 274 324 356 271 257 240
Tennessee 6/30 173 174 160 165 405 272 182 174 166 172
Texas 8/31 181 181 182 180 179 181 176 175 174 180
Utah 6/30 137 136 143 157 146 141 120 111 115 127
Vermont 6/30 182 184 215 176 170 173 176 180 171 171
Virginia 6/30 167 167 167 165 167 167 168 167 166 168
Washington 6/30 174 171 167 170 176 153 145 138 131 123
West Virginia 6/30 235 248 275 273 241 243 228 215 228 274
Wisconsin 6/30 167 168 167 164 164 163 174 166 164 165
Wyoming 6/30 168 175 215 184 210 183 180 174 173 172
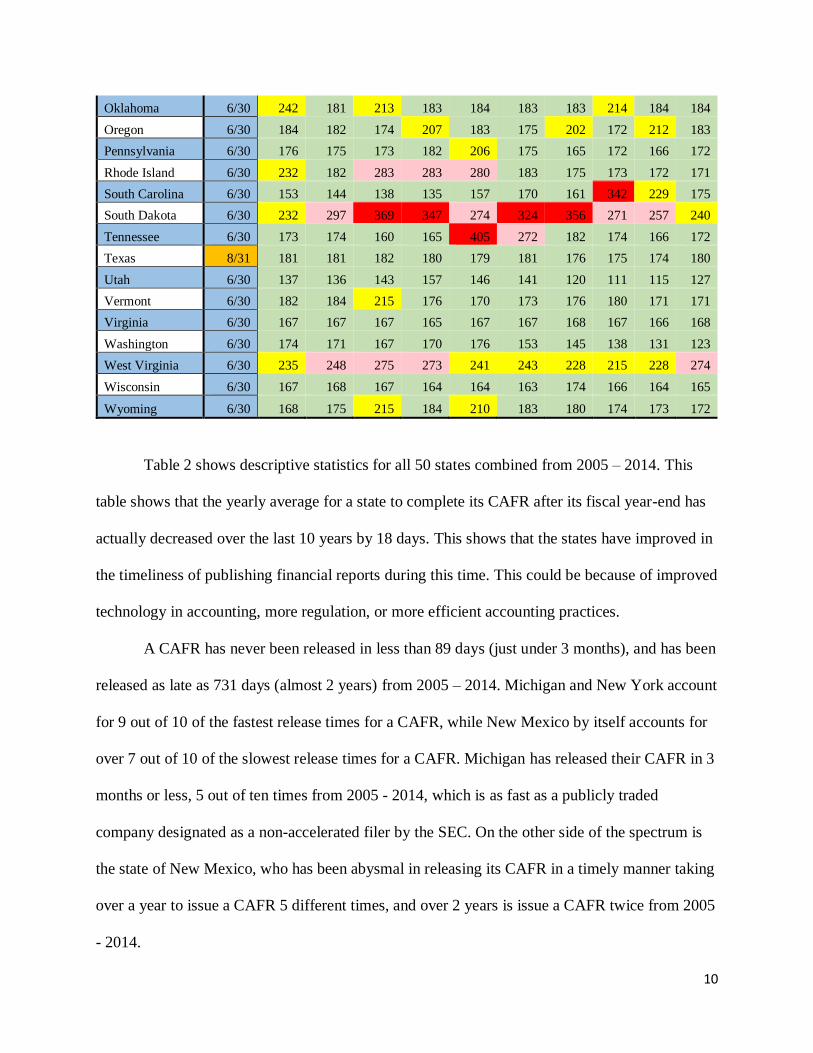
Table 2 shows descriptive statistics for all 50 states combined from 2005 – 2014. This
table shows that the yearly average for a state to complete its CAFR after its fiscal year-end has
actually decreased over the last 10 years by 18 days. This shows that the states have improved in
the timeliness of publishing financial reports during this time. This could be because of improved
technology in accounting, more regulation, or more efficient accounting practices.
A CAFR has never been released in less than 89 days (just under 3 months), and has been
released as late as 731 days (almost 2 years) from 2005 – 2014. Michigan and New York account
for 9 out of 10 of the fastest release times for a CAFR, while New Mexico by itself accounts for
over 7 out of 10 of the slowest release times for a CAFR. Michigan has released their CAFR in 3
months or less, 5 out of ten times from 2005 - 2014, which is as fast as a publicly traded
company designated as a non-accelerated filer by the SEC. On the other side of the spectrum is
the state of New Mexico, who has been abysmal in releasing its CAFR in a timely manner taking
over a year to issue a CAFR 5 different times, and over 2 years is issue a CAFR twice from 2005
- 2014.

11
The median shows that about half the states finished in the encouraged 6-month time
frame in the time from 2005 to 2014, while the other half did not. The decrease in the median
also indicates that at least the faster half of the states are faster issuing a CAFR in 2014 than in
2005.
Table 2:
Yearly CAFR Completion Data (2005-2014)
2005 2006 2007 2008 2009 2010 2011 2012 2013 2014
Yearly Average (Days) 209 206 206 205 208 198 196 198 187 191
Least Time (Days) 89 112 89 92 115 114 116 111 82 90
Most Time (Days) 731 731 398 462 477 469 356 426 364 360
Median (Days) 181.5 181 179 178.5 182.5 182 181.5 174.5 173.5 175
Chart 1 is a histogram showing the number of states that had similar standard deviations
from 2005 – 2014. This chart is helpful in determining how many states consistently finish their
CAFR around the same time every year, and how many are not so consistent.
Chart 2 is another histogram showing the number of states that took a similar amount of
time to complete their CAFR. This chart displays the average completion time of the 50 states
from 2005 – 2014, broken down into four categories. Like the median in Table 2, Chart 2 shows
that half the states finish in 6 months or less, but goes further to breakdown how many states on
average finish in 6 – 8 months, in 8 – 10 months, and in 10 months or more.

12
Chart 1: Chart 2:
Figure 1 below shows a map of the 50 states, color coded by number of times a state took more
than 6 months to release its CAFR. The key takeaway from this figure is that there are really no
geographical groupings to be seen on which states consistently finished in 6 months or less, and
which states did not. This indicates that the geographical region a state is located in does not
impact how timely a state is in releasing its CAFR.
Figure 1: Number of Times State CAFR Published in Later than 6 Months
Key:
Always published CAFR in 6 months or less
1-3 CAFRS published later than 6 months
4-5 CAFRS published later than 6 months
6+ CAFRS published later than 6 months
Never published CAFR in 6 months or less
13
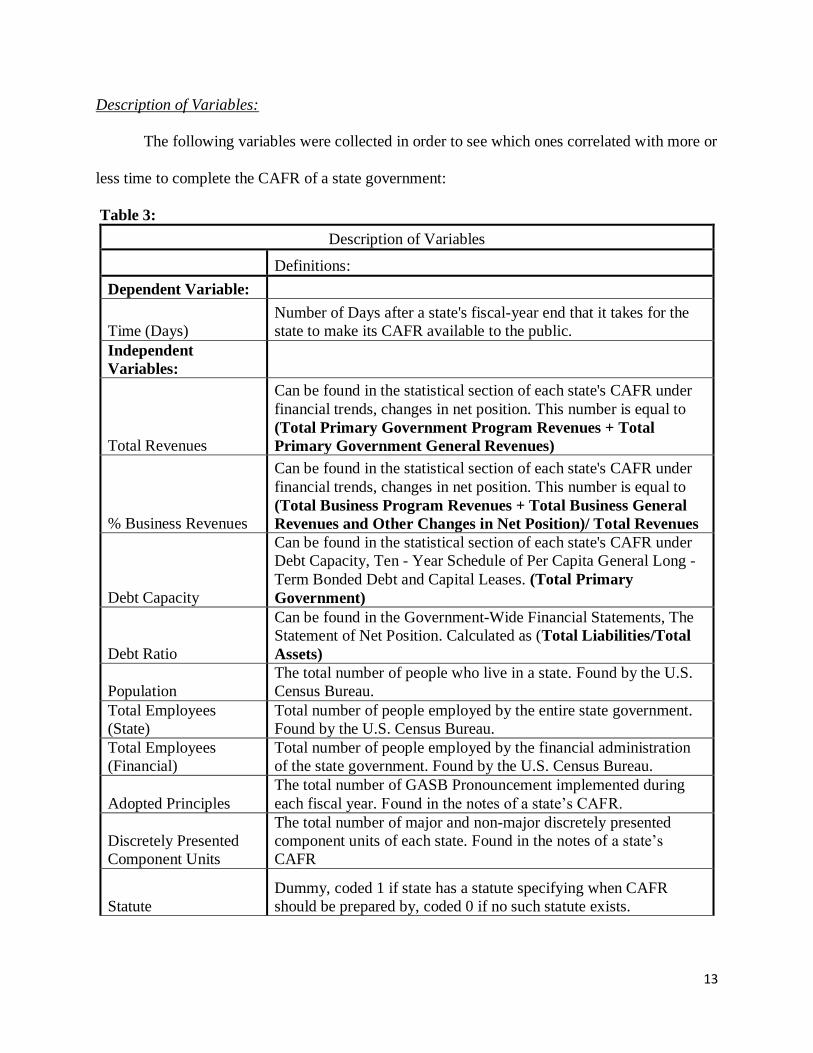
Description of Variables:
The following variables were collected in order to see which ones correlated with more or
less time to complete the CAFR of a state government:
Table 3:
Description of Variables
Definitions:
Dependent Variable:
Time (Days)
Number of Days after a state's fiscal-year end that it takes for the
state to make its CAFR available to the public.
Independent
Variables:
Total Revenues
Can be found in the statistical section of each state's CAFR under
financial trends, changes in net position. This number is equal to
(Total Primary Government Program Revenues + Total
Primary Government General Revenues)
% Business Revenues
Can be found in the statistical section of each state's CAFR under
financial trends, changes in net position. This number is equal to
(Total Business Program Revenues + Total Business General
Revenues and Other Changes in Net Position)/ Total Revenues
Debt Capacity
Can be found in the statistical section of each state's CAFR under
Debt Capacity, Ten - Year Schedule of Per Capita General Long -
Term Bonded Debt and Capital Leases. (Total Primary
Government)
Debt Ratio
Can be found in the Government-Wide Financial Statements, The
Statement of Net Position. Calculated as (Total Liabilities/Total
Assets)
Population
The total number of people who live in a state. Found by the U.S.
Census Bureau.
Total Employees
(State)
Total number of people employed by the entire state government.
Found by the U.S. Census Bureau.
Total Employees
(Financial)
Total number of people employed by the financial administration
of the state government. Found by the U.S. Census Bureau.
Adopted Principles
The total number of GASB Pronouncement implemented during
each fiscal year. Found in the notes of a state’s CAFR.
Discretely Presented
Component Units
The total number of major and non-major discretely presented
component units of each state. Found in the notes of a state’s
CAFR
Statute
Dummy, coded 1 if state has a statute specifying when CAFR
should be prepared by, coded 0 if no such statute exists.

14
Is State Auditor
Elected?
Dummy, coded 1 if state elects its state auditor, coded 0 if the state
auditor is appointed by the legislature or the governor, or if the
state is audited by an independent auditing firm.
Is Auditor CPA?
Dummy, coded 1 if auditor of the state's CAFR is a CPA or if the
state is audited by an auditing firm, coded 0 if the auditor is not a
CPA.
Credit Rating (S&P)
The credit earning earned by each state for each year 2005 – 2014.
Ratings go from lowest to highest: A-, A, A+, AA-, AA, AA+,
AAA. To run the regression, the rankings were replaced with the
numbers 1 – 7; 1 being the lowest and 7 being the highest.
Description of Models:
Table 4 below breaks down the composition of all the models. A green cell marked with
a X indicates that an independent variable is included in the model the X is listed under. The
table also gives the time period the model covers, as well as the sample size of the model.
Table 4:
Model Description
Independent Variables: Model 1 Model 2 Model 3 Model 4 Model 5
Time Period 2005 - 2014 2010 - 2014 2005 - 2014 2005 - 2014 2005 - 2014
Sample Size 500 250 500 500 500
Total Revenues X X X X
% Business Revenues X X
Debt Capacity X X X X
Debt Ratio X
Population X X X X
Total Employees
(State) X X
Total Employees
(Financial) X X
Adopted Principles X
Discretely Presented
Component Units X
Statute X X X X
Is State Auditor
Elected? X X
Is Auditor CPA? X X
Credit Rating (S&P) X X X X

15
Model 1 was designed to test for all the variables that could be obtained for the entire
period from 2005 – 2014. Due to limitations in the availability of state CAFRs from the years
2005 – 2009, the data on three independent variables could not be reliably found and therefore
these variables could not be included in model 1. These variable are debt ratio, adopted
principles, and discretely presented component units.
Model 2 was designed to test for all of the variables, but only for the years 2010 – 2014.
This was because the data for the three variables that could not be included in model 1 was
reliably found in every state’s CAFR for the years 2010 – 2014. Since there was no missing data
all the data could be used, but because the years 2005 – 2009 could not be included the number
of observations dropped from 500 to 250.
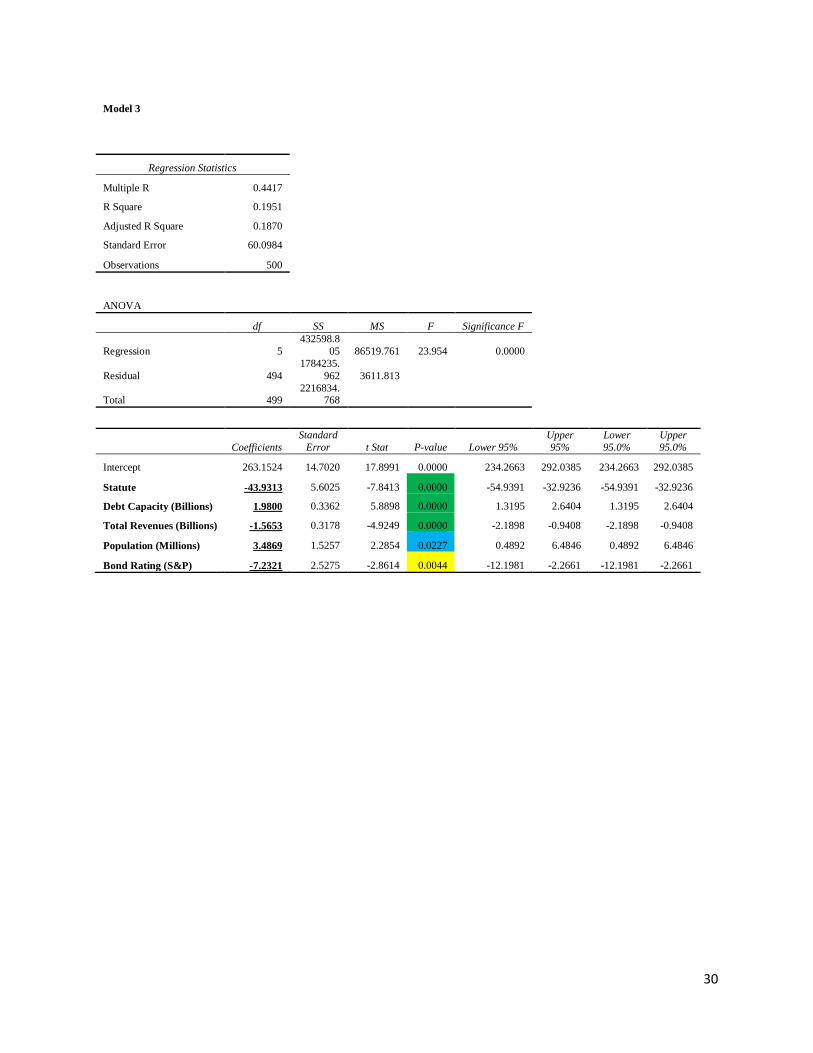
Model 3 was designed to test for all of the five independent variables that were deemed to
have a significant p-value, <.05 in both models 1 and 2, in order to potentially get better
regression results.
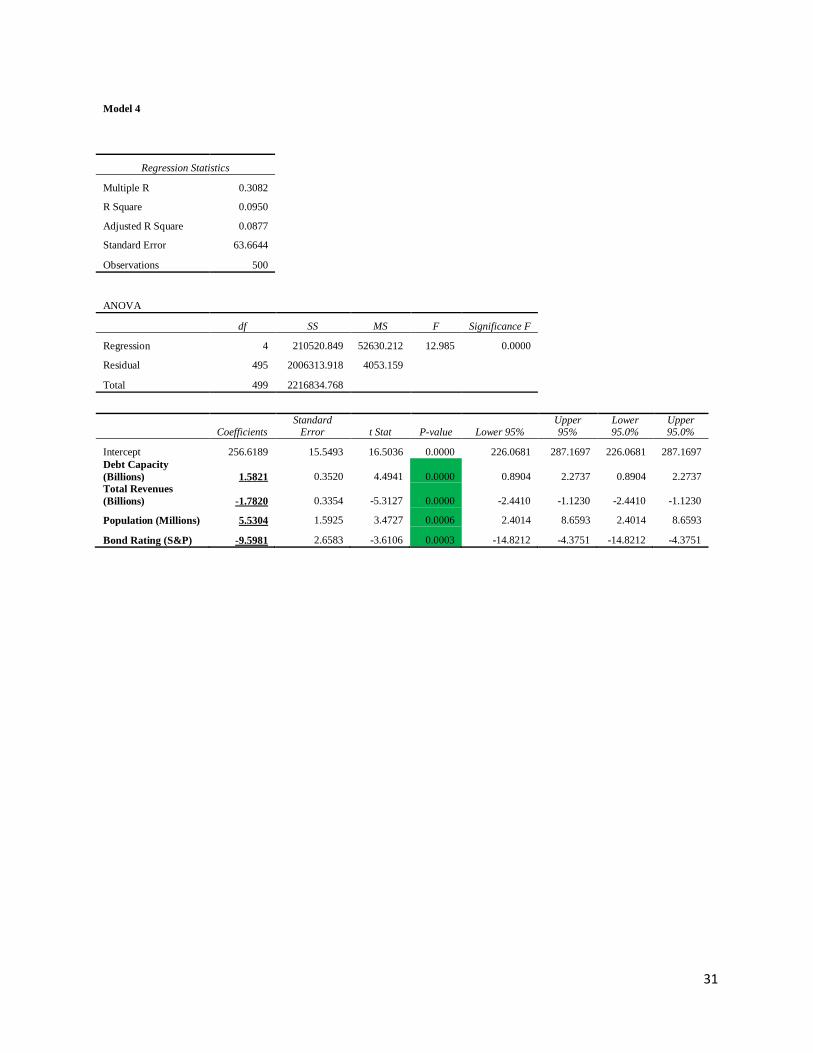
Models 4 and 5 were designed to break up model 3 to analyze the variables based on type
of independent variable. Model 4 includes debt capacity, total revenues, population, and credit
rating to determine what effect the measures of financial health and state size have on when a
state CAFR is released. Model 5 is a single regression for the statute variable to determine what
effect this variable has by itself on when a state CAFR is released.
Statistical Methodology:
The relationships between the chosen independent variables and the dependent variable
were tested by running multiple linear regressions for models 1 – 4. A single linear regression
was run for model 5. All regressions were run using excel, and are included in the appendix.

16
Results
Table 5 below summarizes the results of the independent variables from the 5 models.
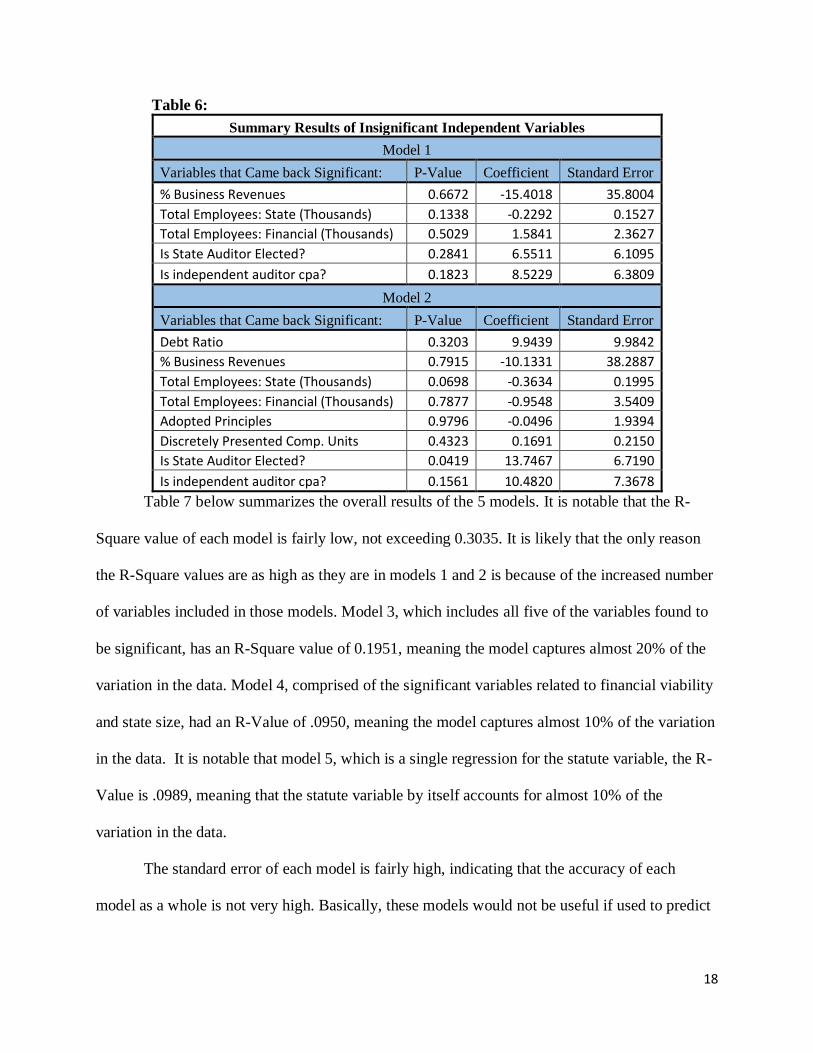
Table 6 summarizes the results of the insignificant independent variables from models 1 and 2.
The variables listed are the ones that were determined to be significant in each model. Regardless
of which model was run, the same variables came back as significant in every one.
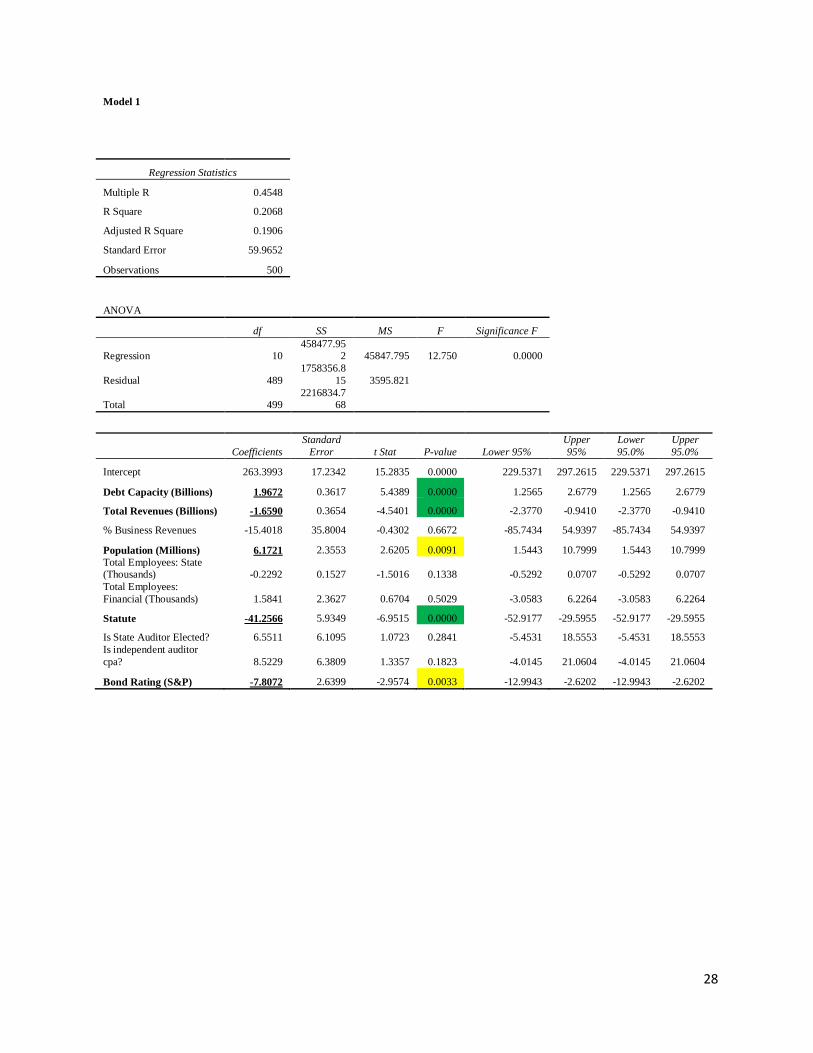
A variable was determined to be significant if the P-Value < 0.05. Interestingly, all the
variables (except for population in model 3) came back with a P-Value < 0.01, which is a good
sign that these variables are actually statistically significant in these models. The strongest
variables seemed to be statute and debt capacity, because the regressions consistently calculated
them to have a P-Value < 0.0001.
The coefficient shows the effect each variable had on the number of days it took for a
state to release its CAFR. A negative coefficient indicates that a higher value of the variable
decreased the amount of time it took for a state to release its CAFR, while a positive coefficient
indicates that a higher value of the variable increased the amount of time it took for a state to
release its CAFR. Interestingly in every model the statute, total revenues, and credit rating (S&P)
variables consistently decreased how long a government took to release its CAFR, while the debt
capacity and population variables consistently increased how long a government took to release
its CAFR. The statute variable also consistently had the greatest effect, decreasing the release
time of a CAFR by over a month in each model.
The standard error of each variable indicates that the variability of each variable is
relatively small, with the biggest being from the statute variable. This is not surprising that the
statute variable was run through the models using a dummy variable, 1 for yes there is a statute
specifying a deadline, 0 for no there is no such statute. Also the fact that different states require

17
different deadlines contributes to the higher standard error. All other variables’ standard errors
are relatively small indicating low variability in these variables.
Table 5:
Summary Results of Significant Independent Variables
Model 1
Variables that Came Back Significant: P-Value Coefficient Standard Error
Debt Capacity (Billions) 0.0000 1.9672 0.3617
Total Revenues (Billions) 0.0000 -1.6590 0.3654
Population (Millions) 0.0091 6.1721 2.3553
Statute 0.0000 -41.2566 5.9349
Credit Rating (S&P) 0.0033 -7.8072 2.6399
Model 2
Variables that Came Back Significant: P-Value Coefficient Standard Error
Debt Capacity (Billions) 0.0000 2.4768 0.5740
Total Revenues (Billions) 0.0040 -1.6610 0.5721
Population (Millions) 0.0052 7.8221 2.7709
Statute 0.0000 -33.8839 6.6375
Credit Rating (S&P) 0.0062 -8.4154 3.0458
Model 3
Variables that Came Back Significant: P-Value Coefficient Standard Error
Statute 0.0000 -43.9313 5.6025
Debt Capacity (Billions) 0.0000 1.9800 0.3362
Total Revenues (Billions) 0.0000 -1.5653 0.3178
Population (Millions) 0.0227 3.4869 1.5257
Credit Rating (S&P) 0.0044 -7.2321 2.5275
Model 4
Variables that Came Back Significant: P-Value Coefficient Standard Error
Debt Capacity (Billions) 0.0000 1.5821 0.3520
Total Revenues (Billions) 0.0000 -1.7820 0.3354
Population (Millions) 0.0006 5.5304 1.5925
Credit Rating (S&P) 0.0003 -9.5981 2.6583
Model 5
Variables that Came Back Significant: P-Value Coefficient Standard Error
Statute 0.0000 -42.4358 5.7386
18
Table 6:
Summary Results of Insignificant Independent Variables
Model 1
Variables that Came back Significant: P-Value Coefficient Standard Error
% Business Revenues 0.6672 -15.4018 35.8004
Total Employees: State (Thousands) 0.1338 -0.2292 0.1527
Total Employees: Financial (Thousands) 0.5029 1.5841 2.3627
Is State Auditor Elected? 0.2841 6.5511 6.1095
Is independent auditor cpa? 0.1823 8.5229 6.3809
Model 2
Variables that Came back Significant: P-Value Coefficient Standard Error
Debt Ratio 0.3203 9.9439 9.9842
% Business Revenues 0.7915 -10.1331 38.2887
Total Employees: State (Thousands) 0.0698 -0.3634 0.1995
Total Employees: Financial (Thousands) 0.7877 -0.9548 3.5409
Adopted Principles 0.9796 -0.0496 1.9394
Discretely Presented Comp. Units 0.4323 0.1691 0.2150
Is State Auditor Elected? 0.0419 13.7467 6.7190
Is independent auditor cpa? 0.1561 10.4820 7.3678
Table 7 below summarizes the overall results of the 5 models. It is notable that the R-
Square value of each model is fairly low, not exceeding 0.3035. It is likely that the only reason
the R-Square values are as high as they are in models 1 and 2 is because of the increased number
of variables included in those models. Model 3, which includes all five of the variables found to
be significant, has an R-Square value of 0.1951, meaning the model captures almost 20% of the
variation in the data. Model 4, comprised of the significant variables related to financial viability
and state size, had an R-Value of .0950, meaning the model captures almost 10% of the variation
in the data. It is notable that model 5, which is a single regression for the statute variable, the R-
Value is .0989, meaning that the statute variable by itself accounts for almost 10% of the
variation in the data.
The standard error of each model is fairly high, indicating that the accuracy of each
model as a whole is not very high. Basically, these models would not be useful if used to predict

19
how long it will take a state to release its CAFR. These models are more useful in determining
which variables are significant, and how significant these variables are.
Table 7:
Overall Summary Results
Models: R-Square
Adjusted
R-Square
Standard
Error Observations
Model 1 0.2068 0.1906 59.9652 500
Model 2 0.3035 0.2651 44.8966 250
Model 3 0.1951 0.1870 60.0984 500
Model 4 0.0950 0.0877 63.6644 500
Model 5 0.0989 0.0971 63.3328 500
Discussion of Results
Of all the variables tested it was found that debt capacity, total revenues, population,
credit rating (S&P), and having a statutory deadline for a state CAFR all have a significant effect
on when a state CAFR is issued.
The variables related to financial viability seem to indicate that states that are better off
financially tend to issue a CAFR faster than less financially viable states. The results indicate
that states with more general long-term bonded debt and capital leases tend to take a longer
amount of time to issue a CAFR, while states with more earned in total revenues tend to take a
shorter amount of time to issue a CAFR. This could be because states have more resources
available to put towards timely and efficient reporting, or that states will report faster if they
have good news to report to users. The results also show that a state with a better credit rating
will issue its CAFR significantly earlier than other states. This results make sense because
receiving better credit ratings can decrease borrowing rates for a state, which can act a big
motivator for completing a timely report. Conversely, for the same reason it would make sense

20
for states who issue timely CAFRs to have better credit ratings. Overall, it appears as though a
state that is better run financially also issues its CAFR in a timelier manner.
The results for the population variable are indicate that a greater population leads to less
timely reporting. This could mean that bigger states take longer because there is more to report
on than in smaller states. There are however some outliers that stand out that refute this claim
including New York, Michigan, and North Carolina being among the 5 fastest states to issue a
CAFR on average from 2005 – 2014, while all being among the 10 most populated states over
that same time. At the same time there are states that back this claim including, Florida, Ohio,
California, and Illinois are among the 10 slowest states to issue a CAFR on average from 2005 –
2014, and are also among the 7 most populated states over that same time. If this is taken into
account alongside the results of the statute variable, it is interesting to note that New York,
Michigan, and North Carolina all have a statute specifying some sort of deadline for the CAFR,
while Ohio, California, and Illinois do not. Florida actually does have a deadline, but it is on
February 28, which the state actually does adhere to every year from 2005 -2014. This could
mean that larger states that are not regulated by some sort of statutory deadline are more prone to
release a CAFR later due to lack of a deadline and because there is more to report on. The results
for the population variable by itself does not explain the timeliness of a state CAFR, but does
seem more relevant if taken into account with other variables.
The most significant finding is that states with a statutory deadline for when to complete
its CAFR will do so significantly faster than a state without one. This is not surprising
considering the preparer of the CAFR is required by law to submit a CAFR in a certain amount
of time. Table 8, included in the appendix, indicates whether a state has a statutory deadline,
when that deadline is, the state’s average completion time and date from 2005 – 2014, and how
21
many times a state published their CAFR later than the established deadline. It is interesting to
note that states with these established deadlines rarely if ever missed the deadline, and if they did
it was not by much. This finding supports Dwyer and Wilson’s finding that timeliness of
reporting can be improved by regulation from the appropriate authorities.
It is rather surprising that size of government is not considered significant, but this is
likely because not everyone works on preparing the CAFR. Unfortunately, the exact number of
people who helped to prepare a CAFR could not be found reliably for every state. It is also
surprising that the number of component units does not show any significance in when a CAFR
is issued. This could again relate to managerial competency, meaning that states with better
organization and communication strategies report faster regardless of size or complexity.
Debt ratio coming back as statistically insignificant could be because only debt related to
bonds matters. Also percentage of total revenues that are business revenues coming back
insignificant signifies that it does not matter where the revenues come from, only the amount
earned by the state.
The variables concerning whether a state auditor is elected and whether the independent
auditor is a CPA coming back insignificant could signal that who the auditor is and how they get
their job does not bear weight on the timeliness of a CAFR. The other variables seem to suggest
the problems with timeliness come before the audit as it is. However, it would be interesting to
look more in depth into the characteristics of the preparer of the CAFR and the auditors,
especially since a lot of the variables seem to indicate that a government is well run.
Other reasons related to some states releasing a CAFR later than other states include,
faulty/outdated accounting systems, difficulty implementing some accounting pronouncements,
and late submissions of financial statements by component units. These variables could not be
22
measured in a way that would work in a regression, because these reasons are instead
explanations given by different states for the lack of timeliness in reporting.
Illinois is an example of a state with an inadequate financial reporting process that
prevents the state from completing its CAFR in a timely manner. In Illinois’s statewide financial
statement audit for the year ended June 30, 2014, the auditor general of Illinois writes:
Accurate and timely financial reporting problems continue to exist even though
the auditors have: 1) continuously reported numerous findings on the internal
controls (material weaknesses and significant deficiencies), 2) commented on the
inadequacy of the financial reporting process of the State, and 3) regularly
proposed adjustments to financial statements year after year. These findings have
been directed primarily towards major State agencies under the organizational
structure of the Office of the Governor and towards the Office of the State
Comptroller (Illinois 5).
The above quotation from Illinois’s annual report on the statewide financial statement audit
indicates a lack of managerial competency in the Illinois government. However, Illinois has
taken a couple of steps to address the timeliness of their reports by issuing two public acts:
public act 97 – 408 and public act 97 – 1055. Public act 97 – 408, establishes a deadline for state
agencies and component units to submit their financial statements to the state comptroller, while
public act 97 – 1055 establishes a financial reporting standards board to help improve upon the
state’s overall quality of reporting (5). Since these two acts have become effective the time to
issue a CAFR has decreased significantly, but still not to average levels. This point can also be
used to illustrate the use of statutes to improve the timeliness of state financial reporting.

23
Alaska’s governor came out and said that the Alaska CAFR is going to be published late
due to difficulties implementing a new accounting standard. Alaska’s administration
commissioner Sheldon Fischer wrote a letter to legislative leaders saying that the state was
having issues implementing the new rule requiring the disclosure of state and local government
entities pension obligations (Herz). This illustrates that it is not the amount of new accounting
pronouncements implemented that affect the timing of a CAFR, but a state’s ability to implement
a standard. This likely reflects a state’s managerial competency and the efficiency and
effectiveness of the accounting systems as well as the accounting protocols of a state.
Late submissions of financial statements by component units of states is an important
reason why a state may release its CAFR later than other states. It would be interesting to study
the dates that component units and state agencies submitted their financial statements to the state
versus when a CAFR was published, but unfortunately this data could not be easily found. It is
however interesting to note that Michigan, one of the fastest states to issue a CAFR from 2005 –
2014, has a fiscal year-end for component units on June 30, while the state’s fiscal year end is on
September 30, this gives the component units an ample amount of time to complete their
financial statements and has allowed Michigan to be able to release a CAFR in 3 months or less
5 out of 10 times over the last 10 years (Barrett and Greene). This also relates to the survey by
NASACT, AGA, and Grant Thornton LLP, in which 72% of state executives said that
component units were not timely in submitting financial statements. This indicates that if states
were to give their component units more time to prepare financial statements, the state as a
whole could be better able to release its CAFR in a timelier fashion.
Support from the top is also another important factor in how long it takes a state
government to produce its CAFR. The acting state auditor of Hawaii, Jan Yamane, said that,

24
“Basically, the governor said it was very important that financial reporting become more timely
because it was affecting bond ratings.” Hawaii then went from having one of the slowest
issuance times, 469 days in 2010, to having a time that is better than average, 184 days in 2014
(Barrett and Greene). This supports the point that better management practices can have a
positive effect on the amount of time it takes for a state government to issue a CAFR. It also
points out that bond ratings are a motivator to produce a CAFR in a timelier manner.
An example of a state with good management practices is Utah, one of the fastest states
to issue its CAFR from 2005 – 2014.
Utah developed a spreadsheet to identify the places in the process where the state
had trouble gathering information for financial reports. Reformers worked on
identifying the major tasks, when they could be done and how fast they could be
done. Success depended on coordinating schedules, communicating with other
agencies about the importance of timeliness and doing lots of training (Barrett and
Greene).
This quotation is further evidence showing that effective organization and communication are
among the most important things for a state to be good at in order to achieve timely reporting.
Conclusion
The results and the evidence from other sources as a whole seem to point towards the fact
that a state that is held accountable by upper management, by statutory requirements, and that is
financially sound tends to release its CAFR sooner than states without such characteristics. It can
be concluded that states that are better managed issue timelier reports. Also public policy makers
should also consider implementing deadlines for submission of financial reports for the state and
component units to improve the timeliness of reporting.

25
Appendix
Table 8: State Statutes
State
Statute that
Pertains to State
CAFR
Does the
Statute Specify
Deadline for
CAFR?
Dead
line
Average
Days to
Complete
CAFR
Average
Date of
Completion
Number of
Late
Publications
(2005 -2014)
Alabama
Alabama Code -
Section 41-4-3 (5) No 181.9
Alaska
Alaska Code -
Section 37-05-210 Yes
16-
Dec 167.7 14-Dec 0
Arizona
Arizona Revised
Statutes- Section
35-131 No
270.1
Arkansas
Arkansas Code-
19-4-517 (2012) No
175.9
California
California
Government
Code: Section
12460 No 271.9
Coloradoa
Colorado Revised
Statutes: Section
24-30-204 (2013) Yes
20-
Sep 169.7 16-Dec
Connecticut
Connecticut
General Statutes:
Section 3-115
(2012) No 266.6
Delaware
Delaware Code:
Section 8313 No 200.3
Florida
Florida Statutes:
Section 216-102
(3) (2015) Yes
28-
Feb 231 16-Feb 0
Georgia
Official Code of
Georgia
Annotated,
Section 50-5B-3
(a)(7) No
189.4
Hawaii No 288.9
Idaho
Idaho Code
Section 67-1001 Yes 1-Jan
170.5 17-Dec 0
Illinois
15 Illinois
Compiled
Statutes- 405/19.5 No 322.4
Indiana
Indiana Code:
Section 4-10-13-2
(2)(b) Yes
31-
Dec 187.4 3-Jan 1
Iowa
Iowa Code:
8A.502 (8) No 168
Kansas
Kansas Statutes:
75-3735 Yes
31-
Dec 186.5 2-Jan 1
Kentuckya
Kentucky Revised
Statutes: 48.800
(2013) No
28-
Sep 170.4 17-Dec

26
Louisiana
Louisiana Revised
Statutes: 39.80
(2014) Yes
31-
Dec 190 6-Jan 2
Mainea
Maine Revised
Statutes: 5-4-143-
1547 (1) Yes
1-
Nov 190.6 6-Jan
Maryland
Maryland State
Finance and
Procurement Code
2-102 (2013) Yes
The
10th
day
after
the
2nd
Wed
nesd
ay in
Janu
ary 163.5 10-Dec 0
Massachusetts
Massachusetts
General Laws:
Part 1, Title 2,
Chapter 7A,
Section 12 (c) Yes
The
2nd
Wed
nesd
ay in
Janu
ary 178.9 25-Dec 0
Michigan
Section 494,
Public Act 431 of
1984 Yes
29-
Mar 122.6 30-Jan 0
Minnesota
Minnesota
Statutes: 16A.50
(2015) Yes
31-
Dec 173.9 20-Dec 1
Mississippi
Section 27-104-4,
Mississippi Code
Annotated (1972) Yes
31-
Dec 191.6 7-Jan 4
Missouri No 205.5
Montana
Title 17, Chapter
2, Part 110,
Montana Code
Annotated No 209.9
Nebraska None Found No 180.8
Nevada
Nevada Revised
Statutes 227.110 No 178.4
New
Hampshire
New Hampshire
Revised Statutes
Annotated 21-I:8
II (a) Yes
31-
Dec
204.5 20-Jan 4
New Jersey
New Jersey
Statutes: 52:27B-
46 Yes
1-
Mar 225.6 10-Feb 4
New Mexico
New Mexico
Statute: 6-5-4.1
(2013) No 410.1
New York
Chapter 405,
Laws of 1981 Yes
28-
Jul 114.2 23-Jul 0

27
North
Carolinaa
General Statutes:
143B-426.39 Yes
31-
Oct 158.8 5-Dec
North Dakota
North Dakota
Century Code:
Section 54-44-04
(14) No 172.9
Ohio
Ohio Revised
Code: Section
126.21 No 267.2
Oklahoma
Oklahoma
Statutes: 62-34.10 No 195.1
Oregon
Oregon Revised
Statutes: 291.040 Yes
27-
Dec 187.4 3-Jan 7
Pennsylvania
Executive Order
No. 1984-3, dated
October 11, 1984 No 176.2
Rhode Island
Section 35-6-1 of
the General Laws No 213.4
South Carolina No 180.4
South Dakota
South Dakota
Codified Law 4-4-
6 No 296.7
Tennessee
Tennessee Code
Annotated 4-3-
1007 No 204.3
Texas
Texas
Government
Code: Title 10,
Subtitle C,
Chapter 2101,
Subchapter A,
Section 2101.011 No 178.9
Utah
South Dakota
Codified Law 4-4-
6 No 133.3
Vermont
Vermont Statutes
Annotated,
Section 182(a)(8) Yes
31-
Dec 179.8 26-Dec 1
Virginia
Section 2.2-813 of
the Code of
Virginia Yes
15-
Dec 166.9 13-Dec 0
Washington
Revised Code of
Washington
43.88.027 Yes
31-
Dec 154.8 1-Dec 0
West Virginia
West Virginia
Code 5A-2-33 (8) No 246
Wisconsin No 166.2
Wyoming
Wyoming
Statutes: 9-1-
4023(a)(v) Yes
31-
Dec 183.4 30-Dec 2 a: The deadline for the state requires the CAFR to be submitted to the legislature or governor by
that date, not issued to the public.
28
Model 1
Regression Statistics
Multiple R 0.4548
R Square 0.2068
Adjusted R Square 0.1906
Standard Error 59.9652
Observations 500
ANOVA
df SS MS F Significance F
Regression 10 458477.95
2 45847.795 12.750 0.0000
Residual 489
1758356.8
15 3595.821
Total 499 2216834.7
68
Coefficients
Standard
Error t Stat P-value Lower 95%
Upper
95%
Lower
95.0%
Upper
95.0%
Intercept 263.3993 17.2342 15.2835 0.0000 229.5371 297.2615 229.5371 297.2615
Debt Capacity (Billions) 1.9672 0.3617 5.4389 0.0000 1.2565 2.6779 1.2565 2.6779
Total Revenues (Billions) -1.6590 0.3654 -4.5401 0.0000 -2.3770 -0.9410 -2.3770 -0.9410
% Business Revenues -15.4018 35.8004 -0.4302 0.6672 -85.7434 54.9397 -85.7434 54.9397
Population (Millions) 6.1721 2.3553 2.6205 0.0091 1.5443 10.7999 1.5443 10.7999
Total Employees: State (Thousands) -0.2292 0.1527 -1.5016 0.1338 -0.5292 0.0707 -0.5292 0.0707
Total Employees:
Financial (Thousands) 1.5841 2.3627 0.6704 0.5029 -3.0583 6.2264 -3.0583 6.2264
Statute -41.2566 5.9349 -6.9515 0.0000 -52.9177 -29.5955 -52.9177 -29.5955
Is State Auditor Elected? 6.5511 6.1095 1.0723 0.2841 -5.4531 18.5553 -5.4531 18.5553
Is independent auditor
cpa? 8.5229 6.3809 1.3357 0.1823 -4.0145 21.0604 -4.0145 21.0604
Bond Rating (S&P) -7.8072 2.6399 -2.9574 0.0033 -12.9943 -2.6202 -12.9943 -2.6202

29
Model 2
Regression Statistics
Multiple R 0.5509
R Square 0.3035
Adjusted R Square 0.2651
Standard Error 44.8966
Observations 250
ANOVA
df SS MS F Significance F
Regression 13 207272.019 15944.001 7.9099 0.0000
Residual 236 475705.581 2015.701
Total 249 682977.600
Coefficients Standard
Error t Stat P-value Lower 95% Upper 95%
Lower 95.0%
Upper 95.0%
Intercept 250.2200 23.2721 10.7519 0.0000 204.3725
296.067
6
204.372
5
296.067
6
Debt Ratio 9.9439 9.9842 0.9960 0.3203 -9.7256 29.6134 -9.7256 29.6134
Debt Capacity (Billions) 2.4768 0.5740 4.3147 0.0000 1.3459 3.6077 1.3459 3.6077
Total Revenues (Billions) -1.6610 0.5721 -2.9035 0.0040 -2.7880 -0.5340 -2.7880 -0.5340
% Business Revenues -10.1331 38.2887 -0.2647 0.7915 -85.5643 65.2981 -85.5643 65.2981
Population (Millions) 7.8221 2.7709 2.8229 0.0052 2.3632 13.2810 2.3632 13.2810
Total Employees: State
(Thousands) -0.3634 0.1995 -1.8216 0.0698 -0.7564 0.0296 -0.7564 0.0296
Total Employees: Financial (Thousands) -0.9548 3.5409 -0.2696 0.7877 -7.9306 6.0210 -7.9306 6.0210
Adopted Principles -0.0496 1.9394 -0.0256 0.9796 -3.8703 3.7712 -3.8703 3.7712
Discretely Presented Comp.
Units 0.1691 0.2150 0.7867 0.4323 -0.2544 0.5926 -0.2544 0.5926
Statute -33.8839 6.6375 -5.1049 0.0000 -46.9601 -20.8076 -46.9601 -20.8076
Is State Auditor Elected? 13.7467 6.7190 2.0459 0.0419 0.5098 26.9835 0.5098 26.9835
Is independent auditor CPA? 10.4820 7.3678 1.4227 0.1561 -4.0330 24.9971 -4.0330 24.9971
Bond Rating (S&P) -8.4154 3.0458 -2.7629 0.0062 -14.4158 -2.4149 -14.4158 -2.4149
30
Model 3
Regression Statistics
Multiple R 0.4417
R Square 0.1951
Adjusted R Square 0.1870
Standard Error 60.0984
Observations 500
ANOVA
df SS MS F Significance F
Regression 5
432598.8
05 86519.761 23.954 0.0000
Residual 494
1784235.
962 3611.813
Total 499 2216834.
768
Coefficients
Standard
Error t Stat P-value Lower 95%
Upper
95%
Lower
95.0%
Upper
95.0%
Intercept 263.1524 14.7020 17.8991 0.0000 234.2663 292.0385 234.2663 292.0385
Statute -43.9313 5.6025 -7.8413 0.0000 -54.9391 -32.9236 -54.9391 -32.9236
Debt Capacity (Billions) 1.9800 0.3362 5.8898 0.0000 1.3195 2.6404 1.3195 2.6404
Total Revenues (Billions) -1.5653 0.3178 -4.9249 0.0000 -2.1898 -0.9408 -2.1898 -0.9408
Population (Millions) 3.4869 1.5257 2.2854 0.0227 0.4892 6.4846 0.4892 6.4846
Bond Rating (S&P) -7.2321 2.5275 -2.8614 0.0044 -12.1981 -2.2661 -12.1981 -2.2661
31
Model 4
Regression Statistics
Multiple R 0.3082
R Square 0.0950
Adjusted R Square 0.0877
Standard Error 63.6644
Observations 500
ANOVA
df SS MS F Significance F
Regression 4 210520.849 52630.212 12.985 0.0000
Residual 495 2006313.918 4053.159
Total 499 2216834.768
Coefficients Standard
Error t Stat P-value Lower 95% Upper 95%
Lower 95.0%
Upper 95.0%
Intercept 256.6189 15.5493 16.5036 0.0000 226.0681 287.1697 226.0681 287.1697
Debt Capacity
(Billions) 1.5821 0.3520 4.4941 0.0000 0.8904 2.2737 0.8904 2.2737
Total Revenues
(Billions) -1.7820 0.3354 -5.3127 0.0000 -2.4410 -1.1230 -2.4410 -1.1230
Population (Millions) 5.5304 1.5925 3.4727 0.0006 2.4014 8.6593 2.4014 8.6593
Bond Rating (S&P) -9.5981 2.6583 -3.6106 0.0003 -14.8212 -4.3751 -14.8212 -4.3751

32
Model 5
Regression Statistics
Multiple R 0.3145
R Square 0.0989
Adjusted R Square 0.0971
Standard Error 63.3328
Observations 500
ANOVA
df SS MS F Significance F
Regression 1 219337.052 219337.052 54.683 0.0000
Residual 498 1997497.715 4011.039
Total 499 2216834.768
Coefficients Standard
Error t Stat P-value Lower 95% Upper 95%
Lower 95.0%
Upper 95.0%
Intercept 218.2310 3.7190 58.6796 0.0000 210.9241 225.5380 210.9241 225.5380
Statute -42.4358 5.7386 -7.3948 0.0000 -53.7106 -31.1610 -53.7106 -31.1610

33
Works Cited
Barrett, Kathrine, and Richard Greene. "Financial Reports: Better Late Than Never?" Governing
the States and Localities. E.Republic, 5 Nov. 2015. Web. 3 Apr. 2016.
Dwyer, Peggy D., and Earl R. Wilson. "An Empirical Investigation of Factors Affecting the
Timeliness of Reporting by Municipalities." Journal of Accounting and Public Policy 8.1
(1989): 29-55. Business Source Corporate [EBSCO]. Web. 23 Mar. 2016.
Government Finance Officers Association (GFOA). "Certificate of Achievement for Excellence
in Financial Reporting Program (CAFR Program)." GFOA.org. Government Finance
Officers Association of the United States and Canada, 2014. Web. 03 May 2016.
Governmental Accounting Standards Board (GASB). Concepts Statement No. 1: Objectives of
Financial Reporting. Norwalk, Connecticut: Governmental Accounting Standards Board,
May 1987. Web. 20 Mar. 2016.
Herz, Nathaniel. "Alaska's Annual Financial Report Is Late, and the Governor Has an Excuse."
Governing the States and Localities. E.Republic, 17 Dec. 2015. Web. 3 Apr. 2016.
Illinois State Government, Office of Auditor General. Annual Report. By William G. Holland.
Chicago, Illinois: Illinois State Government Office of Auditor General, 1 Mar. 2015.
Web. 25 Mar. 2016.
Kopp, Nancy. "Faster, Cheaper, Better: Demands for Financial Reporting from State
Governments." CSG Knowledge Center. The Council of State Governments, 1 July 2011.
Web. 25 Mar. 2016.
Mead, Michael. The Timeliness of Financial Reporting by State and Local Governments
Compared with the Needs of Users. Norwalk, CT: Governmental Accounting Standards
Board, Mar. 2011. Web. 3 Mar. 2016.

34
NASACT, AGA, and Grant Thornton LLP. Charting a Course Through Stormy Seas: State
Financial Executives in 2012. Rep. NASACT, Aug. 2012. Web. 5 Apr. 2016.
National Association of State Comptrollers. Time to Complete the States’ CAFRs, Fiscal Years
2005, 2006, 2007, 2008, and 2009. NASACT, PDF.
National Association of State Comptrollers. Time to Complete the States’ CAFRs, Fiscal Years
2010, 2011, 2012, 2013, and 2014. NASACT, PDF.
Securities and Exchange Commission (SEC). "Fast Answers." SEC.gov. Securities and Exchange
Commission (SEC), 26 June 2009. Web. 2 Apr. 2016.
Related Documents