Please cite this paper as: Charbit, C. (2011), “Governance of Public Policies in Decentralised Contexts: The Multi-level Approach”, OECD Regional Development Working Papers, 2011/04, OECD Publishing. http://dx.doi.org/10.1787/5kg883pkxkhc-en OECD Regional Development Working Papers 2011/04 Governance of Public Policies in Decentralised Contexts THE MULTI-LEVEL APPROACH Claire Charbit JEL Classification: H1, H5, H6, H7, R1

Welcome message from author
This document is posted to help you gain knowledge. Please leave a comment to let me know what you think about it! Share it to your friends and learn new things together.
Transcript
Please cite this paper as:
Charbit, C. (2011), “Governance of Public Policies inDecentralised Contexts: The Multi-level Approach”, OECDRegional Development Working Papers, 2011/04, OECDPublishing.http://dx.doi.org/10.1787/5kg883pkxkhc-en
OECD Regional Development WorkingPapers 2011/04
Governance of PublicPolicies in DecentralisedContexts
THE MULTI-LEVEL APPROACH
Claire Charbit
JEL Classification: H1, H5, H6, H7, R1

2
OECD REGIONAL DEVELOPMENT WORKING PAPERS
This series is designed to make available to a wider readership selected studies on regional
development issues prepared for use within the OECD. Authorship is usually collective, but principal
authors are named.
The papers are generally available only in their original language English or French with a summary in
the other if available.
The opinions expressed in these papers are the sole responsibility of the author(s) and do not
necessarily reflect those of the OECD or the governments of its member countries.
Comment on the series is welcome, and should be sent to either [email protected] or the Public
Governance and Territorial Development Directorate, 2, rue André Pascal, 75775 PARIS CEDEX 16,
France.
---------------------------------------------------------------------------
OECD Regional Development Working Papers are published on
www.oecd.org/gov/regional/workingpapers
---------------------------------------------------------------------------
Applications for permission to reproduce or translate all or part of this material should be made to:
OECD Publishing, [email protected] or by fax 33 1 45 24 99 30.
© OECD 2011

3
ABSTRACT
The ability of sub national governments to “better spend”, by identifying relevant paths for
territorial competitiveness and effective delivery of public services, is largely enshrined in their
institutional background. Rather than isolated actors, sub national authorities and central governments
are “mutually dependent”. In this context, and for a majority of OECD member and non-member
countries, the key underlying question is not whether to “decentralise or not” or even opt for a specific
decentralisation model, but to look at ways to improve capacity and co-ordination among public
stakeholders at different levels of government to increase efficiency, equity and sustainability of
public spending. This question of “multi level governance” is therefore accurate, whatever the
constitutional framework of countries, federal or unitary.
This paper provides: first, a methodology to diagnose multi level governance challenges; and,
second, examples of tools used by OECD countries to bridge co-ordination and capacity “gaps”. This
approach has been inspired by OECD regional development policy work, as regional development
policy relies both on the diversity of territorial situations and the coherence of regional strategies at the
national level. In practice, it has already been tested in a variety of public policies such as public
investment, water, and innovation, which all contributed to enrich it with concrete sectoral evidence
and experience.
JEL classification: H1, H5, H6, H7, R1
Key words: Multi-Level Governance; Intergovernmental Relationships; Decentralisation; Sub-
national Governments; Local and State governments; Regional Development
4
TABLE OF CONTENTS
Introduction................................................................................................................................ 5 1. Decentralisation and regional data in OECD countries: a call for multi-level
governance approach ................................................................................................................. 6 1.1 Fiscal decentralisation in OECD countries ...................................................................... 6 1.2. Three apparent paradoxes in decentralisation trends ...................................................... 9 1.3. The need for multi level governance approaches .......................................................... 13
2. Identifying co-ordination challenges: proposal for a multi-level governance
methodology ............................................................................................................................ 13 3. Improving the effectiveness of policymaking: what mechanisms for addressing
co-ordination and capacity difficulties across levels of government? ..................................... 16 4. Multi level governance in different policy contexts ............................................................ 18
4.1 Multi-level governance of public investment: lessons from the crisis ........................... 18 4.2 Why multi-level governance matters for fiscal consolidation strategies? ...................... 19 4.3 Multilevel governance: a prerequisite for integrated water policy ................................. 20
Conclusion: Reforming decentralisation: specific political economy challenges ................... 21
BIBLIOGRAPHY ....................................................................................................................... 22
Tables
Table 1. Examples of indicators used by different OECD countries to measure
sub national service delivery ............................................................................... 12
Table 2. “Mind the gaps” : a diagnosis tool for co-ordination and capacity
challenges ............................................................................................................ 16
Table 3. Bridge the co-ordination and capacity gaps : some instruments and
country examples ................................................................................................. 17
Figures
Figure 1. Decentralisation in OECD countries ..................................................................... 6 Figure 2. Participation of each level of government in Health spending, 2009 .................... 7 Figure 3. Revenue Structure of Sub National Governments (2009) ..................................... 8 Figure 4. Decentralisation in OECD countries ..................................................................... 9 Figure 5. GDP per person of the poorest and richest TL3 regions; 2007 ........................... 10 Figure 6. Change in ratio between the richest and the poorest regions .............................. 11 Figure 7. SNGs as a share of total public investment, 2008 ............................................... 18
Boxes
Box 1. About the efficiency-equity tradeoff ......................................................................... 8 Box 2. The decentralisation debate: traditional arguments ................................................. 14
5
GOVERNANCE OF PUBLIC POLICIES IN DECENTRALISED CONTEXTS:
THE MULTI-LEVEL APPROACH1
Introduction
The crisis has provided an opportunity to enhance public interest in how governments function
and reinforced the expectation that governments need to adapt and change. Indeed, difficulties
encountered in implementing successful changes (like regulation reforms, post shocks policies), in
particular for the provision of essential goods and services, reveal the importance, influence and
complexity of institutional background. A prerequisite to reforming and increasing effectiveness of
public policy is to identify the stakeholders involved in the design and implementation stages. Given
their interdependency, a first step is to set-up an “institutional mapping” of their roles and
responsibilities to clarify their relationships. In particular, sub national governments play a key role in
public policies. Why is it both imperative and difficult to associate them in the achievement of
ambitious and broad agendas such as the OECD “stronger, fairer and cleaner economies” target, or the
Europe 2020 agenda for “smart, inclusive and sustainable” economies?
Sub national governments are affected by the “yoyo game”, from recovery policies based on huge
public spending, to fiscal consolidation programmes, which drastically restrict them. Many local and
regional authorities have faced financial difficulties as a consequence of the global crisis and current
consolidation plans. This could lead to a reduction in the quantity and/or quality of public goods and
services provided, as well as cuts in planned investments, precisely when public action is considered
crucial for long term recovery.
The ability of municipalities and regions to “better spend”, by identifying relevant paths for
territorial competitiveness, “do more with less”, is largely enshrined in their institutional background.
Rather than isolated actors, sub national authorities and central governments are “mutually dependent”
(OECD, 2009a; Charbit and Michalun, 2009). In this context, and for a majority of OECD member
and non-member countries, the key underlying question is not whether to “decentralise or not” or even
opt for a specific decentralisation model, but to look at ways to improve capacity and co-ordination
among public stakeholders at different levels of government to increase efficiency, equity and
sustainability of public spending2. This question of “multi level governance” is therefore accurate,
whatever the constitutional framework of countries, federal or unitary.
This paper provides: first, a methodology to diagnose multi level governance challenges; and,
second, examples of tools used by OECD countries to bridge co-ordination and capacity “gaps”3. This
approach has been inspired by OECD regional development policy work, as regional development
policy relies both on the diversity of territorial situations and the coherence of regional strategies at the
national level. In practice, it has already been tested in a variety of public policies such as public
1 This paper reflects the analysis and studies carried out within the OECD Regional Policy Division (Public
Governance and Territorial Development Directorate). The author would like to express her gratitude
to colleagues who contributed to the multi-level governance programme, who made this synthesis
paper possible, and have both enriched this multilevel governance approach and used it in different
projects: Aziza Akhmouch, Dorothée Allain-Dupré, Camila Vammalle and Varinia Michalun. 2 Coordination among stakeholders encompasses a great variety of institutional modalities in a continuum that
goes from quasi integration to market type mechanisms; cooperative arrangements are in between
these two extrema (for the initial development of this perspective applied to the analysis of market
economies, see Richardson 1990). 3 The paper does not intend to provide a survey of the literature on multilevel governance, which can be found in
selected references quoted in the bibliography.

6
investment, water, and innovation, which all contributed to enrich it with concrete sectoral evidence
and experience.
The chapter is organised in four main sections. It begins with a brief presentation of the variety of
decentralisation situations in OECD countries. Then, section two presents a multi-level governance
methodology for assessing co-ordination and capacity difficulties. Section three presents a series of
mechanisms used by OECD countries to address these challenges. The fourth section provides
illustrations of this multi-level governance approach in different policy fields. Political economy
challenges for reforming decentralisation arrangements between levels of government in OECD
countries will be underlined in a conclusive section.
1. Decentralisation and regional data in OECD countries: a call for multi-level governance
approach
Sub national governments (SNGs) are facing financial difficulties as a consequence of the global
crisis and current consolidation plans. These difficulties could lead to a reduction in their contribution
to national policy objectives. While SNGs represent on average, 15% of GDP, 22% of public
revenues, 31% of public spending, and are responsible for about 64% of public investment in OECD
countries, there is a great variety of situations among countries.
1.1 Fiscal decentralisation in OECD countries4
Some unitary countries, especially Scandinavian ones, like Denmark and Sweden, reach
comparable level of spending ratio (rate of sub national spending on total public spending) and of
revenue ratio (rate of sub national revenues on total public revenues) than federal countries (like
Canada or Switzerland) (Figure 1). Some common explanations can be mentioned for understanding
the great variety of OECD countries decentralisation features.
Figure 1. Decentralisation in OECD countries
Share of Sub-central governments in general government revenues and expenditure, 2009 (1)
Note: Decentralisation is measured by the share of sub-national governments in total public revenues and spending. General government revenues and expenditure are broken out between central government, sub-national governments (local and, when available, intermediate) and social security. As the share of social security revenues and spending varies widely between countries (from 4.4% in Denmark to 45.3% of spending in France), this has a significant impact on the remaining shares of central and sub-national governments. (1) Or latest year available: 2008 for Canada, Hungary, New Zealand, Switzerland and the United States; 2007 for Korea. (2) Excluding transfers received from other levels of government. (3) Excluding transfers paid to other levels of government.
Source: OECD National Accounts.
4 Data used in this section are accessible on the web site of the OECD Network on Fiscal Relations across Levels
of Government, http://www.oecd.org/ctp/federalism.
Reve
nue
s (
2)
Expenditure (3)
7
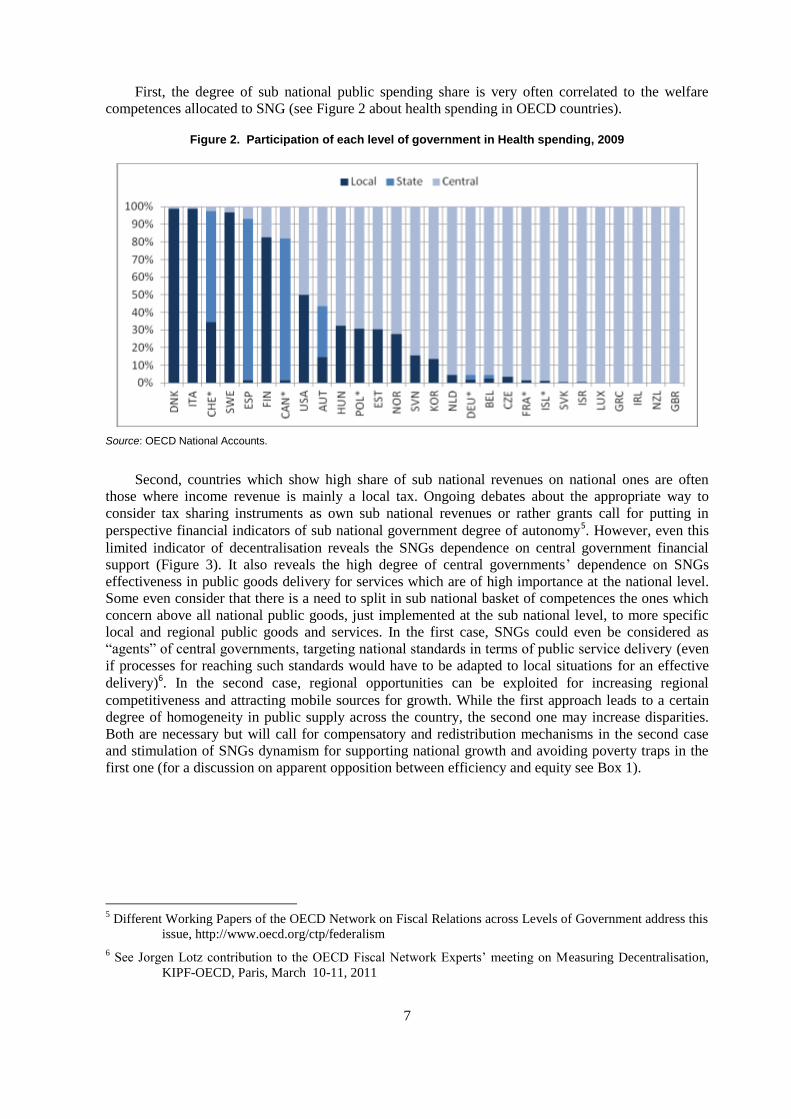
First, the degree of sub national public spending share is very often correlated to the welfare
competences allocated to SNG (see Figure 2 about health spending in OECD countries).
Figure 2. Participation of each level of government in Health spending, 2009
Source: OECD National Accounts.
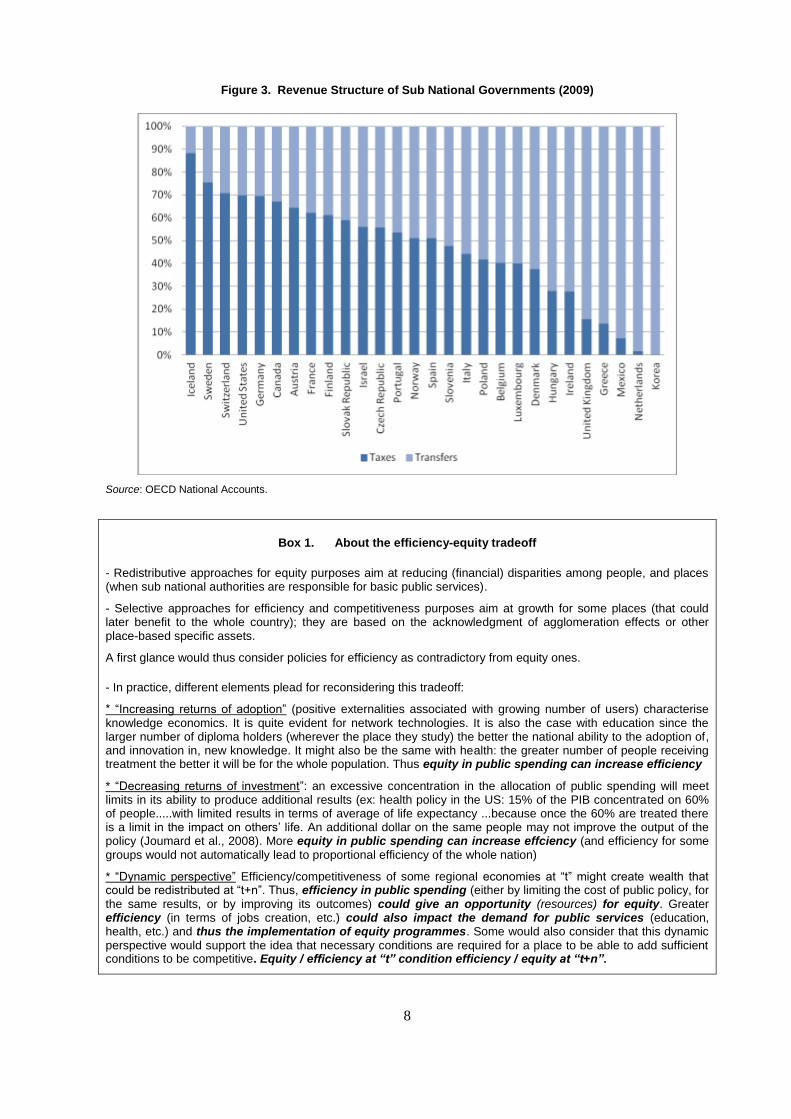
Second, countries which show high share of sub national revenues on national ones are often
those where income revenue is mainly a local tax. Ongoing debates about the appropriate way to
consider tax sharing instruments as own sub national revenues or rather grants call for putting in
perspective financial indicators of sub national government degree of autonomy5. However, even this
limited indicator of decentralisation reveals the SNGs dependence on central government financial
support (Figure 3). It also reveals the high degree of central governments’ dependence on SNGs
effectiveness in public goods delivery for services which are of high importance at the national level.
Some even consider that there is a need to split in sub national basket of competences the ones which
concern above all national public goods, just implemented at the sub national level, to more specific
local and regional public goods and services. In the first case, SNGs could even be considered as
“agents” of central governments, targeting national standards in terms of public service delivery (even
if processes for reaching such standards would have to be adapted to local situations for an effective
delivery)6. In the second case, regional opportunities can be exploited for increasing regional
competitiveness and attracting mobile sources for growth. While the first approach leads to a certain
degree of homogeneity in public supply across the country, the second one may increase disparities.
Both are necessary but will call for compensatory and redistribution mechanisms in the second case
and stimulation of SNGs dynamism for supporting national growth and avoiding poverty traps in the
first one (for a discussion on apparent opposition between efficiency and equity see Box 1).
5 Different Working Papers of the OECD Network on Fiscal Relations across Levels of Government address this
issue, http://www.oecd.org/ctp/federalism
6 See Jorgen Lotz contribution to the OECD Fiscal Network Experts’ meeting on Measuring Decentralisation,
KIPF-OECD, Paris, March 10-11, 2011
8
Figure 3. Revenue Structure of Sub National Governments (2009)
Source: OECD National Accounts.
Box 1. About the efficiency-equity tradeoff
- Redistributive approaches for equity purposes aim at reducing (financial) disparities among people, and places (when sub national authorities are responsible for basic public services).
- Selective approaches for efficiency and competitiveness purposes aim at growth for some places (that could later benefit to the whole country); they are based on the acknowledgment of agglomeration effects or other place-based specific assets.
A first glance would thus consider policies for efficiency as contradictory from equity ones.
- In practice, different elements plead for reconsidering this tradeoff:
* “Increasing returns of adoption” (positive externalities associated with growing number of users) characterise knowledge economics. It is quite evident for network technologies. It is also the case with education since the larger number of diploma holders (wherever the place they study) the better the national ability to the adoption of, and innovation in, new knowledge. It might also be the same with health: the greater number of people receiving treatment the better it will be for the whole population. Thus equity in public spending can increase efficiency
* “Decreasing returns of investment”: an excessive concentration in the allocation of public spending will meet limits in its ability to produce additional results (ex: health policy in the US: 15% of the PIB concentrated on 60% of people.....with limited results in terms of average of life expectancy ...because once the 60% are treated there is a limit in the impact on others’ life. An additional dollar on the same people may not improve the output of the policy (Joumard et al., 2008). More equity in public spending can increase effciency (and efficiency for some groups would not automatically lead to proportional efficiency of the whole nation)
* “Dynamic perspective” Efficiency/competitiveness of some regional economies at “t” might create wealth that could be redistributed at “t+n”. Thus, efficiency in public spending (either by limiting the cost of public policy, for the same results, or by improving its outcomes) could give an opportunity (resources) for equity. Greater efficiency (in terms of jobs creation, etc.) could also impact the demand for public services (education, health, etc.) and thus the implementation of equity programmes. Some would also consider that this dynamic perspective would support the idea that necessary conditions are required for a place to be able to add sufficient conditions to be competitive. Equity / efficiency at “t” condition efficiency / equity at “t+n”.
9
1.2. Three apparent paradoxes in decentralisation trends
Without further developing on fiscal dimensions of relations between levels of government three
main (somewhere paradoxical) conclusions can be underlined(OECD, 2009b):
i. Sub national responsibilities in spending have increased but there is still a strong dependency on
central governments for resources
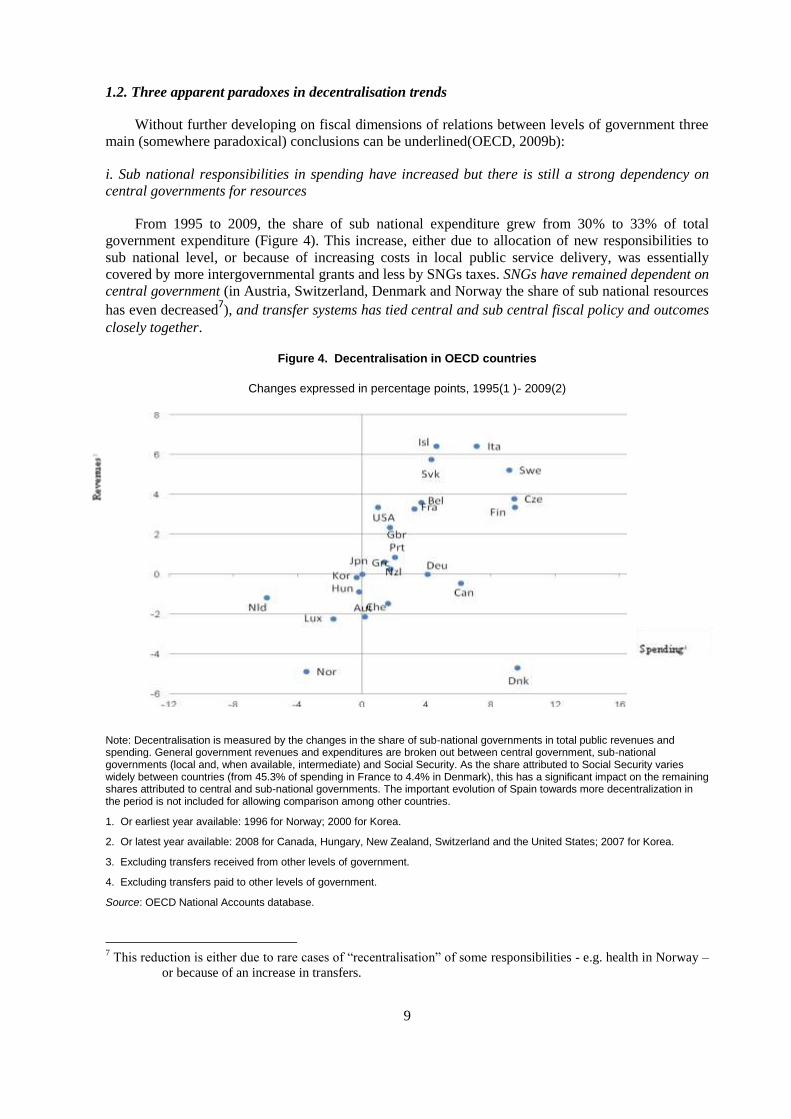
From 1995 to 2009, the share of sub national expenditure grew from 30% to 33% of total
government expenditure (Figure 4). This increase, either due to allocation of new responsibilities to
sub national level, or because of increasing costs in local public service delivery, was essentially
covered by more intergovernmental grants and less by SNGs taxes. SNGs have remained dependent on
central government (in Austria, Switzerland, Denmark and Norway the share of sub national resources
has even decreased7), and transfer systems has tied central and sub central fiscal policy and outcomes
closely together.
Figure 4. Decentralisation in OECD countries
Changes expressed in percentage points, 1995(1 )- 2009(2)
Note: Decentralisation is measured by the changes in the share of sub-national governments in total public revenues and spending. General government revenues and expenditures are broken out between central government, sub-national governments (local and, when available, intermediate) and Social Security. As the share attributed to Social Security varies widely between countries (from 45.3% of spending in France to 4.4% in Denmark), this has a significant impact on the remaining shares attributed to central and sub-national governments. The important evolution of Spain towards more decentralization in the period is not included for allowing comparison among other countries.
1. Or earliest year available: 1996 for Norway; 2000 for Korea.
2. Or latest year available: 2008 for Canada, Hungary, New Zealand, Switzerland and the United States; 2007 for Korea.
3. Excluding transfers received from other levels of government.
4. Excluding transfers paid to other levels of government.
Source: OECD National Accounts database.
7 This reduction is either due to rare cases of “recentralisation” of some responsibilities - e.g. health in Norway –
or because of an increase in transfers.

10
ii. The absence of convergence of GDP among regions calls for central government interventions:
equalisation and customisation
Figure 5. GDP per person of the poorest and richest TL3 regions; 2007 (as a % of national average)
Note: some of these disparities are due to commuting in metropolitan areas (such as London) which increases the output of places where people work but do not reside. Additional regional disparities indicators in terms of income per capita, a better measure to assess if regions are poorer or richer will soon be available (OECD, 2011d).
While SNGs have more responsibilities, convergence of GDP among regions remains limited.
Regional differences in GDP per capita within countries are often substantial and larger than among
OECD countries (Figure 5). While disparities among OECD countries were reduced over the past 20
years, regional differences often were not. In several places, regional disparities have even worsened
over time.
The economic recession had a much differentiated impact on the loss of jobs within OECD
countries, and increased disparities (OECD, 2011c and d). In addition public funds will be tighter
over the next few years. The gap between richer and poorer regions is likely to widen in many
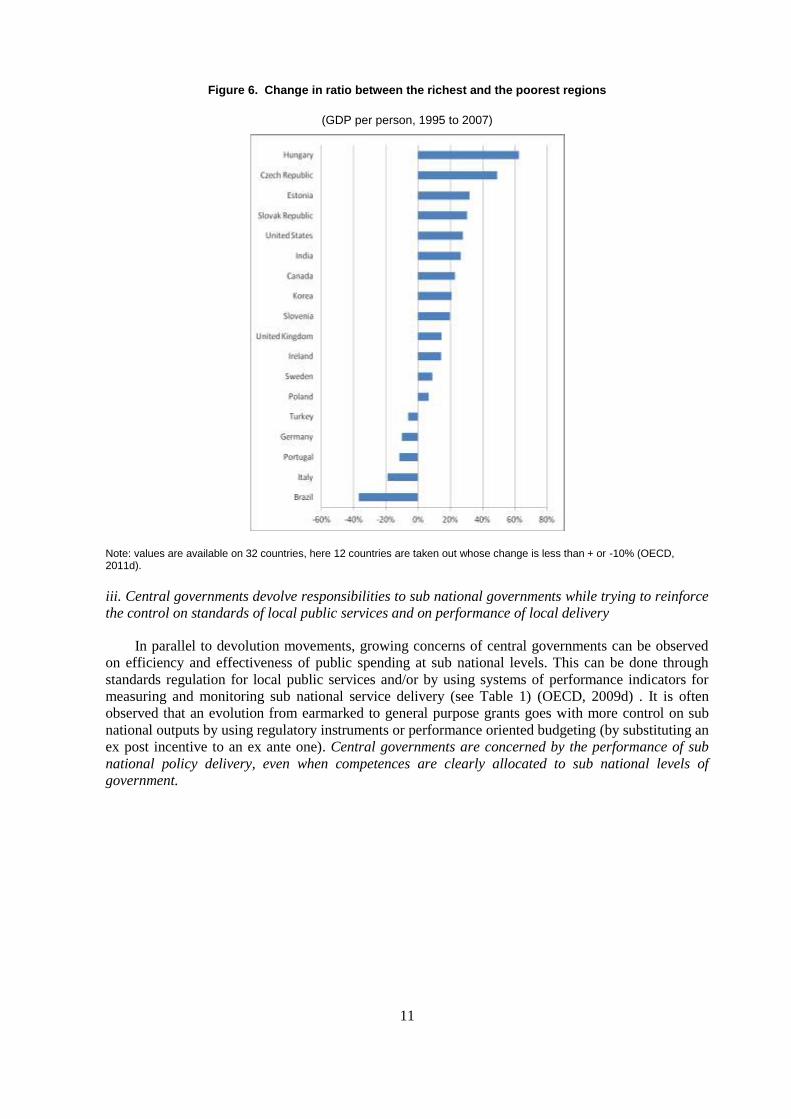
countries as the public spending axe falls. This sign of “differences” among places calls for central
government interventions for equalising access to public goods (as often required by national
constitutions) and for customising regional development policies since disparities exist and remain
(Figure 6).
11
Figure 6. Change in ratio between the richest and the poorest regions
(GDP per person, 1995 to 2007)
Note: values are available on 32 countries, here 12 countries are taken out whose change is less than + or -10% (OECD, 2011d).
iii. Central governments devolve responsibilities to sub national governments while trying to reinforce
the control on standards of local public services and on performance of local delivery
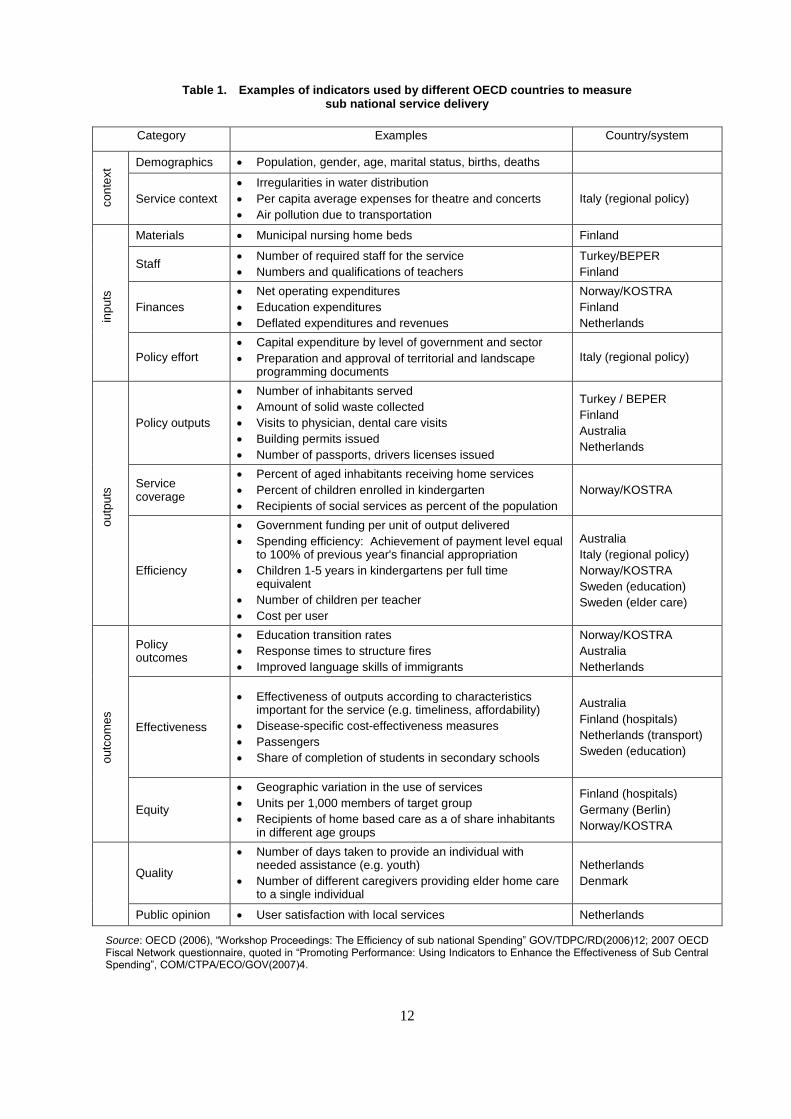
In parallel to devolution movements, growing concerns of central governments can be observed
on efficiency and effectiveness of public spending at sub national levels. This can be done through
standards regulation for local public services and/or by using systems of performance indicators for
measuring and monitoring sub national service delivery (see Table 1) (OECD, 2009d) . It is often
observed that an evolution from earmarked to general purpose grants goes with more control on sub
national outputs by using regulatory instruments or performance oriented budgeting (by substituting an
ex post incentive to an ex ante one). Central governments are concerned by the performance of sub
national policy delivery, even when competences are clearly allocated to sub national levels of
government.
12
Table 1. Examples of indicators used by different OECD countries to measure sub national service delivery
Category Examples Country/system
co
nte
xt Demographics Population, gender, age, marital status, births, deaths
Service context
Irregularities in water distribution
Per capita average expenses for theatre and concerts
Air pollution due to transportation
Italy (regional policy)
inp
uts
Materials Municipal nursing home beds Finland
Staff Number of required staff for the service
Numbers and qualifications of teachers
Turkey/BEPER
Finland
Finances
Net operating expenditures
Education expenditures
Deflated expenditures and revenues
Norway/KOSTRA
Finland
Netherlands
Policy effort
Capital expenditure by level of government and sector
Preparation and approval of territorial and landscape programming documents
Italy (regional policy)
ou
tpu
ts
Policy outputs
Number of inhabitants served
Amount of solid waste collected
Visits to physician, dental care visits
Building permits issued
Number of passports, drivers licenses issued
Turkey / BEPER
Finland
Australia
Netherlands
Service coverage
Percent of aged inhabitants receiving home services
Percent of children enrolled in kindergarten
Recipients of social services as percent of the population
Norway/KOSTRA
Efficiency
Government funding per unit of output delivered
Spending efficiency: Achievement of payment level equal to 100% of previous year's financial appropriation
Children 1-5 years in kindergartens per full time equivalent
Number of children per teacher
Cost per user
Australia
Italy (regional policy)
Norway/KOSTRA
Sweden (education)
Sweden (elder care)
ou
tco
mes
Policy outcomes
Education transition rates
Response times to structure fires
Improved language skills of immigrants
Norway/KOSTRA
Australia
Netherlands
Effectiveness
Effectiveness of outputs according to characteristics important for the service (e.g. timeliness, affordability)
Disease-specific cost-effectiveness measures
Passengers
Share of completion of students in secondary schools
Australia
Finland (hospitals)
Netherlands (transport)
Sweden (education)
Equity
Geographic variation in the use of services
Units per 1,000 members of target group
Recipients of home based care as a of share inhabitants in different age groups
Finland (hospitals)
Germany (Berlin)
Norway/KOSTRA
Quality
Number of days taken to provide an individual with needed assistance (e.g. youth)
Number of different caregivers providing elder home care to a single individual
Netherlands
Denmark
Public opinion User satisfaction with local services Netherlands
Source: OECD (2006), “Workshop Proceedings: The Efficiency of sub national Spending” GOV/TDPC/RD(2006)12; 2007 OECD Fiscal Network questionnaire, quoted in “Promoting Performance: Using Indicators to Enhance the Effectiveness of Sub Central Spending”, COM/CTPA/ECO/GOV(2007)4.
13
1.3. The need for multi level governance approaches
Interdependencies between levels of government can be of different nature: institutional (when
the allocation of roles and responsibilities is not exclusive); financial (when central and sub national
governments are co-funders of public spending in regions) and socio-economic (when issues and/or
outcomes of public policy at one level have impact on other regions and the national level). In such
context, a full separation of responsibilities and outcomes in policy making cannot be achieved. Even
in countries as federalised as the US, the federal government has progressively increased its role
through intergovernmental regulations imposed on state and local governments through direct to more
indirect actions that force sub national levels policy change. The U.S. Advisory Commission on
Intergovernmental Relations has even provided a taxonomy of “federally induced costs”, which
suggests discrete policy actions the federal government can take with impacts on state and local costs
(Posner, 2008, pp287).
There is no one optimal level of decentralisation (neither per public policy field nor for the whole
public administration), since the sharing of competencies and its implementation remain strongly
country specific (Box 2). However, multi-level governance is always required for managing public
policies in a decentralised context. Multi-level governance (MLG), here, is the term used to
characterise the relationship between public actors situated at different administrative levels8, which is,
in the US literature often referred to as “intergovernmental relationships”. MLG therefore refers to
the explicit or implicit sharing of policy-making authority, responsibility, development and
implementation at different administrative and territorial levels, i.e. (i) across different ministries
and/or public agencies at central government level (upper horizontally), (ii) between different layers of
government at local, regional, provincial/state, national and supranational levels (vertically), and (iii)
across different actors at sub national level (lower horizontally). The focus here will be limited to these
types of interactions between public authorities while “multi-level governance” approaches often
includes also interaction between public and private entities (profit or non profit ones), in particular
citizens and businesses. For the development of such a comprehensive approach to the issues of
“commons” at the community level see Ostrom et al. (2010)
2. Identifying co-ordination challenges: proposal for a multi-level governance methodology
Managing the relationship between levels of government, while not new, has become
increasingly complex as countries continue to decentralise and also recentralise, fiscal, political and
administrative competences. How can governments both customise public policy to be adapted to
specific contexts, avoiding the “one fits all” approach, and develop coherence among the diversity of
sub national characteristics and strategies? In the absence of an optimal model, how can countries
identify and assess MLG challenges in order to improve the effectiveness of public policies in
decentralised contexts?
8 In the US literature “intergovernmental” management is a frequent terminology for dealing with similar issues,
in particular in the context of the American federalism (Conlan and Posner, 2008)
14
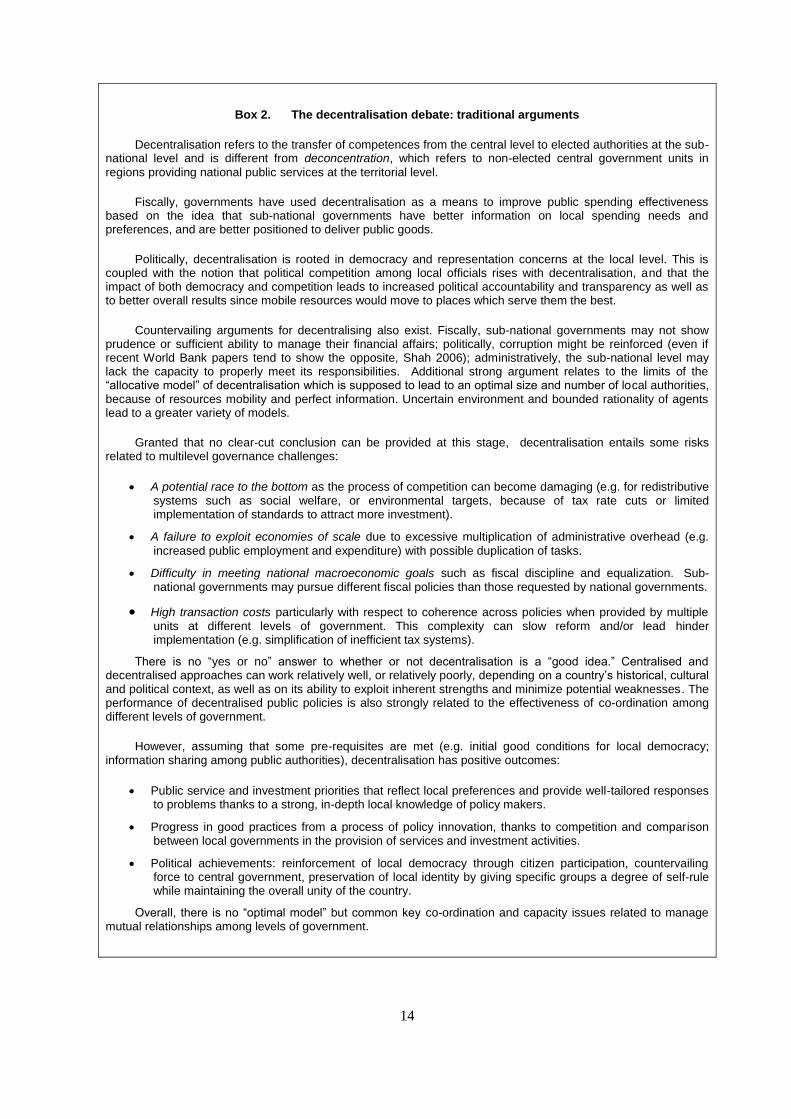
Box 2. The decentralisation debate: traditional arguments
Decentralisation refers to the transfer of competences from the central level to elected authorities at the sub-national level and is different from deconcentration, which refers to non-elected central government units in
regions providing national public services at the territorial level.
Fiscally, governments have used decentralisation as a means to improve public spending effectiveness based on the idea that sub-national governments have better information on local spending needs and preferences, and are better positioned to deliver public goods.
Politically, decentralisation is rooted in democracy and representation concerns at the local level. This is coupled with the notion that political competition among local officials rises with decentralisation, and that the impact of both democracy and competition leads to increased political accountability and transparency as well as to better overall results since mobile resources would move to places which serve them the best.
Countervailing arguments for decentralising also exist. Fiscally, sub-national governments may not show prudence or sufficient ability to manage their financial affairs; politically, corruption might be reinforced (even if recent World Bank papers tend to show the opposite, Shah 2006); administratively, the sub-national level may lack the capacity to properly meet its responsibilities. Additional strong argument relates to the limits of the “allocative model” of decentralisation which is supposed to lead to an optimal size and number of local authorities, because of resources mobility and perfect information. Uncertain environment and bounded rationality of agents lead to a greater variety of models.
Granted that no clear-cut conclusion can be provided at this stage, decentralisation entails some risks related to multilevel governance challenges:
A potential race to the bottom as the process of competition can become damaging (e.g. for redistributive systems such as social welfare, or environmental targets, because of tax rate cuts or limited implementation of standards to attract more investment).
A failure to exploit economies of scale due to excessive multiplication of administrative overhead (e.g.
increased public employment and expenditure) with possible duplication of tasks.
Difficulty in meeting national macroeconomic goals such as fiscal discipline and equalization. Sub-national governments may pursue different fiscal policies than those requested by national governments.
High transaction costs particularly with respect to coherence across policies when provided by multiple units at different levels of government. This complexity can slow reform and/or lead hinder implementation (e.g. simplification of inefficient tax systems).
There is no “yes or no” answer to whether or not decentralisation is a “good idea.” Centralised and decentralised approaches can work relatively well, or relatively poorly, depending on a country’s historical, cultural and political context, as well as on its ability to exploit inherent strengths and minimize potential weaknesses. The performance of decentralised public policies is also strongly related to the effectiveness of co-ordination among different levels of government.
However, assuming that some pre-requisites are met (e.g. initial good conditions for local democracy; information sharing among public authorities), decentralisation has positive outcomes:
Public service and investment priorities that reflect local preferences and provide well-tailored responses to problems thanks to a strong, in-depth local knowledge of policy makers.
Progress in good practices from a process of policy innovation, thanks to competition and comparison between local governments in the provision of services and investment activities.
Political achievements: reinforcement of local democracy through citizen participation, countervailing force to central government, preservation of local identity by giving specific groups a degree of self-rule while maintaining the overall unity of the country.
Overall, there is no “optimal model” but common key co-ordination and capacity issues related to manage mutual relationships among levels of government.

15
In order to answer these questions, the initial task consists in clearly identifying who is in charge
of what, in terms of design, regulation, budget and implementation of the policy field that government
wish to improve. Triviality in this “institutional mapping” approach is just apparent: many actors will
be revealed as overlapping in some functions with others, depending on others’ conditional decisions
and being influenced by the use of one administrative tool or another. Overlapping per se is not a
concern if co-ordination among stakeholders in the public policy delivery is effective. If not, various
co-ordination “gaps” can explain some failure in efficiently managing public policies.
Sometimes the emergence of new issues (environmental concerns, demographic evolutions, etc.)
as such may even not be at the origin of an overlap, but rather, on the contrary, generate the opposite,
i.e. a “vacuum” due to the absence of clear definition of competence and related allocation to one or
another public actor. Again the question of capacity to address this issue and co-ordination with other
stakeholders will be crucial.
Seven dominant “gaps” question multi-level governance of public policy: information, capacity,
fiscal, policy, administrative, objective and accountability (Table 2). All countries are confronted with
these challenges for the implementation of public policies strategies, but with some variation in the
extent to which they are met and according to different policy fields. Rather than considering policy
coherence as one component – amongst others – of public governance, this approach argues that it is
essentially through better coherence of public action that outcomes of public policies such as
efficiency, equity and sustainability can be achieved. This statement is not naive: co-ordination does
not come without costs. However since levels of government cannot avoid to deal with their
interaction for providing public services the key question relates to the identification of obstacles to
and solutions for improving it.
i) The information gap is characterised by information asymmetries between levels of
government when designing, implementing and delivering public policies. Sometimes the
information gap results from strategic behaviours of public actors who may prefer to not
reveal too clearly their strengths and weaknesses, especially if allocation of responsibility is
associated to conditional granting. However, it is often the case that the very information
about territorial specificities is not perceived by the central decision maker as well as sub
national actors may be ignorant about capital objectives and strategies.
ii) The capacity challenge arises when there is a lack of human, knowledge or infrastructural
resources available to carry out tasks, regardless to the level of government (even if, in
general, SNGs are more considered as suffering from such difficulty than central
government).
iii) The fiscal gap is represented by the difference between sub national revenues and the
required expenditures for SNGs to meet their responsibilities and implement appropriate
development strategies. In a more dynamic perspective, fiscal difficulties also include
mismatch between budget practices and policy needs: in the absence of multi-annual budget
practices for example, SNGs may face uncertainty in engaging appropriate spending, and the
absence of flexibility in spending which is very beneficial in uncertain environment. A too
strict earmarking of grants may also impede appropriate fungibility of resources and limit
sub national ability to deliver adapted policies.
iv) The policy challenge results when line ministries take purely vertical approach to be
territorially implemented, while SNGs are best placed to customise complementarities
between policy fields and concretise cross-sectoral approaches. Limited co-ordination among
line ministries may provoke heavy administrative burden, different timing and agenda in
managing correlated actions, etc. It can even lead to strong inconsistencies and readability
concerns when objectives of sectoral policy-makers are contradictory.
v) The administrative gap occurs when the administrative scale for policy making, in terms of
spending as well as strategic planning, is not in line with functional relevant areas. A very
16
common case concerns municipal fragmentation which can lead jurisdictions to set
ineffective public action by not benefitting from economies of scale. Some specific policies
also request very specific, and often naturally fixed, boundaries.
vi) The objective gap refers to different rationalities from national and sub national policy-
makers which create obstacles for adopting convergent strategies. A common example deals
with political parties’ belonging, which may lead to opposed approaches. In such a case
divergences across levels of government can be “politically” used for cornering the debate
instead of serving a common good. Even without any difference in political “color” from the
central government, a Mayor may prefer serving his/her local constituencies, instead of
aligning decisions to national broader objectives which may be perceived as contradictory.
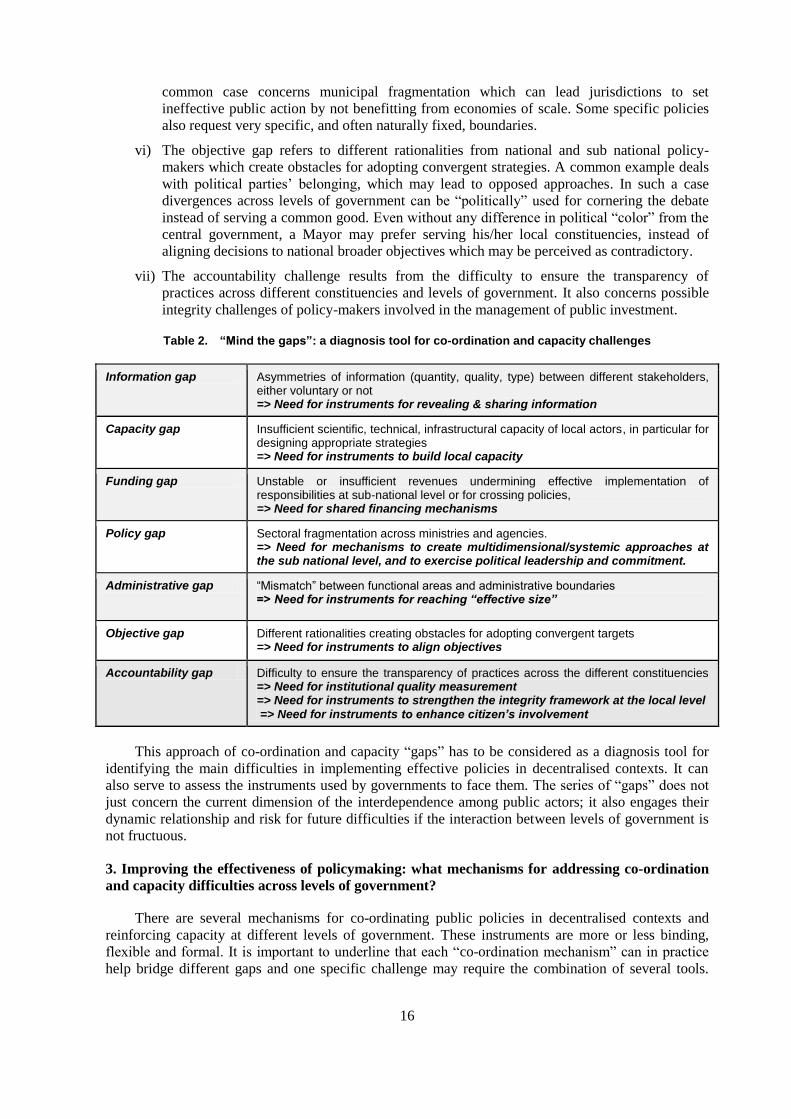
vii) The accountability challenge results from the difficulty to ensure the transparency of
practices across different constituencies and levels of government. It also concerns possible
integrity challenges of policy-makers involved in the management of public investment.
Table 2. “Mind the gaps”: a diagnosis tool for co-ordination and capacity challenges
Information gap Asymmetries of information (quantity, quality, type) between different stakeholders, either voluntary or not => Need for instruments for revealing & sharing information
Capacity gap Insufficient scientific, technical, infrastructural capacity of local actors, in particular for designing appropriate strategies => Need for instruments to build local capacity
Funding gap Unstable or insufficient revenues undermining effective implementation of responsibilities at sub-national level or for crossing policies, => Need for shared financing mechanisms
Policy gap Sectoral fragmentation across ministries and agencies. => Need for mechanisms to create multidimensional/systemic approaches at the sub national level, and to exercise political leadership and commitment.
Administrative gap “Mismatch” between functional areas and administrative boundaries => Need for instruments for reaching “effective size”
Objective gap Different rationalities creating obstacles for adopting convergent targets => Need for instruments to align objectives
Accountability gap Difficulty to ensure the transparency of practices across the different constituencies => Need for institutional quality measurement => Need for instruments to strengthen the integrity framework at the local level => Need for instruments to enhance citizen’s involvement
This approach of co-ordination and capacity “gaps” has to be considered as a diagnosis tool for
identifying the main difficulties in implementing effective policies in decentralised contexts. It can
also serve to assess the instruments used by governments to face them. The series of “gaps” does not
just concern the current dimension of the interdependence among public actors; it also engages their
dynamic relationship and risk for future difficulties if the interaction between levels of government is
not fructuous.
3. Improving the effectiveness of policymaking: what mechanisms for addressing co-ordination
and capacity difficulties across levels of government?
There are several mechanisms for co-ordinating public policies in decentralised contexts and
reinforcing capacity at different levels of government. These instruments are more or less binding,
flexible and formal. It is important to underline that each “co-ordination mechanism” can in practice
help bridge different gaps and one specific challenge may require the combination of several tools.
17
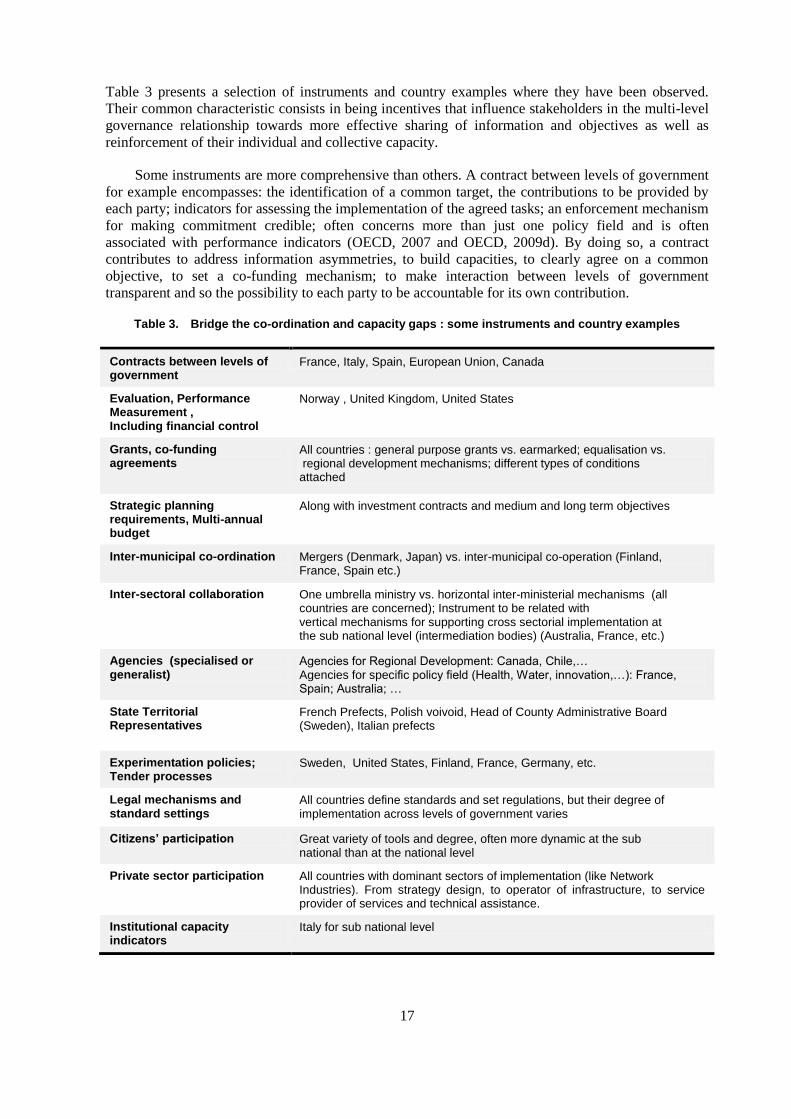
Table 3 presents a selection of instruments and country examples where they have been observed.
Their common characteristic consists in being incentives that influence stakeholders in the multi-level
governance relationship towards more effective sharing of information and objectives as well as
reinforcement of their individual and collective capacity.
Some instruments are more comprehensive than others. A contract between levels of government
for example encompasses: the identification of a common target, the contributions to be provided by
each party; indicators for assessing the implementation of the agreed tasks; an enforcement mechanism
for making commitment credible; often concerns more than just one policy field and is often
associated with performance indicators (OECD, 2007 and OECD, 2009d). By doing so, a contract
contributes to address information asymmetries, to build capacities, to clearly agree on a common
objective, to set a co-funding mechanism; to make interaction between levels of government
transparent and so the possibility to each party to be accountable for its own contribution.
Table 3. Bridge the co-ordination and capacity gaps : some instruments and country examples
Contracts between levels of government
France, Italy, Spain, European Union, Canada
Evaluation, Performance Measurement , Including financial control
Norway , United Kingdom, United States
Grants, co-funding agreements
All countries : general purpose grants vs. earmarked; equalisation vs. regional development mechanisms; different types of conditions attached
Strategic planning requirements, Multi-annual budget
Along with investment contracts and medium and long term objectives
Inter-municipal co-ordination Mergers (Denmark, Japan) vs. inter-municipal co-operation (Finland, France, Spain etc.)
Inter-sectoral collaboration One umbrella ministry vs. horizontal inter-ministerial mechanisms (all countries are concerned); Instrument to be related with vertical mechanisms for supporting cross sectorial implementation at the sub national level (intermediation bodies) (Australia, France, etc.)
Agencies (specialised or generalist)
Agencies for Regional Development: Canada, Chile,… Agencies for specific policy field (Health, Water, innovation,…): France, Spain; Australia; …
State Territorial Representatives
French Prefects, Polish voivoid, Head of County Administrative Board (Sweden), Italian prefects
Experimentation policies; Tender processes
Sweden, United States, Finland, France, Germany, etc.
Legal mechanisms and standard settings
All countries define standards and set regulations, but their degree of implementation across levels of government varies
Citizens’ participation Great variety of tools and degree, often more dynamic at the sub national than at the national level
Private sector participation All countries with dominant sectors of implementation (like Network Industries). From strategy design, to operator of infrastructure, to service provider of services and technical assistance.
Institutional capacity indicators
Italy for sub national level

18
One instrument is not necessarily exclusive. For example financial control that often goes with
grants, is just one instrument for better spending and addressing financial challenges. It needs to be
complemented with other types of performance indicators, which go beyond budget execution by
mobilising information on inputs and outcomes oriented measures; to allow for possible flexible ways
in using funds, etc. The main recommendation then consists in assessing each mechanism according to
its contribution to solving identified co-ordination “gaps”. This methodological suggestion then needs
to be implemented in an in depth way, fostering on specific public policy, co-ordination challenge, or
objectives the country is looking for.
4. Multi level governance in different policy contexts
The methodology which has been suggested so far has already been implemented in various
policy fields. Multi-level governance challenges and specific responses have also been illustrated in
different public administration areas (regulatory, budgetary and human resources reform; Charbit, C.
and M. Michalun (eds) (2009). The present section draws extensively from OECD recent work and
publications on governance of public investment, sub national finances and water policy.
4.1 Multi-level governance of public investment: lessons from the crisis9
The economic crisis revealed and crystallised multi-level governance (MLG) challenges inherent
to decentralised political systems. All countries have encountered certain MLG gaps when
implementing their investment strategies for the recovery. SNGs are crucial partners since they are
responsible for 65 % on average of public investment spending in OECD countries (Figure 7).
Figure 7. SNGs as a share of total public investment, 2008
9 Sections 4.1 and 4.2 derive from Allain-Dupré, D.(2011) “Multi-level governance of public investment: lessons
from the crisis”, OECD Regional Development Policy Working Papers – available at
www.oecd.org/gov/regional/workingpapers and OECD (2011), Making the most of public investment in a
tight fiscal environment: multi-level governance lessons from the crisis, OECD Publishing, Paris.

19
Four challenges have been particularly important across levels of government: i) the fiscal
challenge, and the difficulty of co-financing investment; ii) the capacity challenge, linked to
inadequate resources, staffing or processes for rapid, efficient and transparent implementation of
investment funding; iii) the policy challenge, and the difficulty of exploiting synergies across different
sectors and policy fields; and iv) the administrative challenge, and the fragmentation of investment
projects at the local level.
Investment stimulus funding was allocated quickly, but spending has followed slowly. At the end
of 2010, many countries had allocated more than 90% of their funds, in part through local
governments. Spending has been slow, however, and there are significant variations across policy
areas. The “rapidity” criterion predominated in the selection of projects. Requirements for the use of
funding have had a strong influence on the type of projects selected by sub-national governments.
During the recession, micro-scale short-term infrastructure projects conducted at the municipal level
could easily meet the criteria for eligibility. The emphasis on speed in getting funds committed,
although understandable as a goal, has probably overshadowed planning for maximum economic
impact. Overall, the focus has been on spreading resources across the territory rather than targeting for
territorial impact.
During the crisis, co-ordination across levels of government has proven critical for targeting
investment priorities, ensuring coherence in fiscal policy and facilitating the implementation of
national strategies. While some countries were able to mobilise existing co-ordination mechanisms,
others had to create them. For example, Australia, Canada and France had co-ordination mechanisms
that could be strengthened and used promptly (Regional Development Agencies in Canada, the
Council of Australian Governments in Australia, contractual arrangements in France). In other
countries, the crisis provided an opportunity to set up new ones. In Sweden, “regional co-ordinators”
were created to co-ordinate policies and resources from different levels of government. In the United
States, both the federal government and states have created new institutions, teams and platforms to
co-ordinate the federal, states and agency levels.
Beyond actors and institutions, the right strategies make a critical difference. The tensions in
investment plans between the short and the long term can be mitigated if there are well-defined
strategies, flexible enough to be adjusted in response to the crisis. In responding to the crisis, regional
policy and related governance instruments have been valuable for prioritising investment. In France,
for example, regional policy tools such as inter-governmental contractual agreements helped to
identify better targets quickly and to channel new central investment funding more effectively.
4.2 Why multi-level governance matters for fiscal consolidation strategies?
As stimulus packages are phased out, many countries are planning some combination of tax
increases and spending cuts in 2011 and in the following years. In a short span of time (2009-11), most
OECD countries have rapidly moved from highly expansive fiscal policies to the tightest in decades.
Collectively, these budget cuts may amount to a tightening of some 1.25% of global GDP (IMF,
2010). Just as co-ordination of levels of government was important to implement recovery measures,
multi-level governance mechanisms are necessary to manage consolidation and tailor expenditure cuts
and investment priorities to local needs. What is important in periods of expanding expenditure is even
more relevant in times of budget cuts, as these are intrinsically more difficult. Spending cuts tend to be
better accepted when they are balanced by positive objectives such as long-term development and
investment.
The crisis will have a prolonged effect on fiscal relations across levels of government. In many
OECD countries, the financial situation of sub-national governments has already worsened
significantly. Gross borrowing of western European sub-national governments is expected to reach
EUR 262 billion in 2010, up more than 44% since 2007. Local public investment, stimulated in 2008-
09, is now a target of cuts in many regions and seems in some cases to be used as an adjustment

20
variable. The lasting impact of the crisis on sub-national finances will differ across regions: the long-
term impact of the crisis will persist in regions with structural problems, which were harder hit by the
crisis, and this will intensify the fiscal challenges these regions will have to meet. To address these
challenges, a one-size-fits-all approach will not be appropriate.
Many OECD countries are requiring sub-national governments to participate in consolidation
efforts, either by reducing their funding or increasing the control over their budgets. In Italy, for
example, the 2010 update of the Domestic Stability Pact sets the burden carried by regions and local
governments. Accounting practices of central and sub-national governments have also been
harmonised to increase the transparency of public accounts and the accountability of sub-central
governments. Italy is also switching from a definition of historical costs to a definition of standard
requirements and standard costs for public services so as to provide sub-national governments with
appropriate incentives. In Spain, the Autonomous Communities have agreed to present accounts
quarterly instead of annually to increase budget transparency. Canada is also asking its sub-national
governments to implement strategic reviews and to reallocate 5% of their budgets each year. In the
United Kingdom, the new government proposes to increase the level of decentralisation, but in
exchange local governments will need to modernise their public sector to do “better” with less
(Vammalle and Gaillard, 2011).
Any successful deficit reduction plan requires the strong involvement of sub-national
governments. Credible incentives can encourage local actors to reveal their specific knowledge and
development potential, information that is particularly needed in times of tight budget constraints. Not
only the fiscal gap, but also the policy, information and capacity gaps, run the risk of worsening,
thereby shift the problem from the centre to the regions, in the absence of appropriate co-ordination
efforts at all levels of government. The same multi-level governance instruments (contracts,
performance indicators, inter-governmental committees, etc.) can be used for both fiscal recovery and
consolidation strategies, in order to: i) accommodate appropriate budget cuts for short-term fiscal
consolidation; and ii) invest in what can unlock each region’s potential, restore growth and build
resilient regions.
4.3 Multilevel governance: a prerequisite for integrated water policy10
The “water crisis” that many countries face nowadays is essentially a crisis of governance as in
practice water policy reform faces complexity due to the multiplicity of actors, institutional inertia and
related multilevel governance challenges
Decentralisation of water policies over the past decades has resulted in a dynamic relationship
with mutual dependence between public actors at all levels of government. Though sub national actors
have inherited from increasing responsibilities, they do not always have the competence to decide on
the financial allocation required to meet these needs or to generate local public revenues, thus creating
a “funding gap”. Understanding multilevel governance challenges in water policy requires a holistic
approach to co-ordination gaps (OECD, 2011a). As OECD 2011 report on multilevel governance of
water policy shows, a country facing a sectoral fragmentation of water roles and responsibilities across
ministries and public agencies (policy gap) may also suffer from contradictory targets between these
public actors (objective gap), which may not favour the sharing of information because of silo
approaches (information gap) and is likely to undermine capacity building at sub national level
10 This section extensively draws on Akhmouch A.(2011) “Multi-level Governance of Water Policy in OECD
Countries”, OECD Regional Development Policy Working Papers – available at
www.oecd.org/gov/regional/workingpapers and OECD (2011a) Water public governance in OECD countries:
a multi-level perspective, OECD Publishing, Paris

21
(capacity gap) since local actors, users and private actors would have to multiply efforts to identify the
right interlocutor in the central administration.
Meeting these challenges requires innovative policy but also institutional responses to be
designed, especially in the current context of fiscal constraints and climate change calling for effective
and integrated policies. Water governance can be improved by means of better integration of territorial
specificities and better co-ordination between public actors in charge of designing, regulating and
implementing water policies across ministries, public agencies and between levels of government.
Promoting co-ordination and capacity-building is a large and critical step toward bridging multilevel
governance gaps in water policy.
There are several options for co-ordinating water policies across ministries and public agencies.
Inter-ministerial bodies, committees and commissions are the main governance tools used in upper
horizontal co-ordination of water policy and many OECD countries (France, Belgium, Chile etc.) have
created a platform for dialogue and action between public actors in charge of water policy at central
government level. Formal co-ordinating bodies such as ad hoc high level structures and central agency
are also frequently used by governments for horizontal co-ordination (COAG in Australia,
CONAGUA in Mexico). The line ministry, holding a dominant responsibility on water, is often the
main tool adopted for ensuring inter-departmental and inter-ministerial co-ordination (UK). Co-
ordination groups of experts and inter-agency programmes are also widespread, especially in EU
countries in the framework of the Water Framework Directive implementation.
In addition, in OECD region, there is a wide variety of mechanisms for co-ordinating water
policies across levels of government. These embrace the consultation of private actors (including
citizens’, water users associations and civil society), financial transfers and incentives across levels of
government (e.g. earmarked v. general purposes grants for financing infrastructure), co-ordination
agencies, contractual arrangements, multi-sectoral conferences, performance indicators, regulations,
shared databases, river basin organizations, regulation and performance indicators, shared databases,
river basin organizations and other intermediate bodies.
Conclusion: Reforming decentralisation: specific political economy challenges
Multi-level governance challenges occur in institutional frameworks which are very country
specific. Making institutional background evolve and implementing decentralisation reforms is often a
complex and long process (Charbit and Vammalle, 2010). Decentralisation is not a one-off policy
change; it is an on-going process where the end point of accountable and efficient local governments
may well take many decades to achieve. In addition, in the process of institutional change, inertia and
resistance can occur from those who have benefited from the previously centralised system, especially
in terms of power, information and decision.
Some lessons can be learned from the observation of various country cases (Blöchliger and
Vammalle, 2011) such as the use of bundling several elements of reform and compensation
mechanisms in order to obtain the support of various stakeholders (urban and rural, wealthier and
poorer SNGs); and the possibility to align different political parties thanks to a clear political
willingness and leadership. Such a configuration for changing the conditions of MLG issues and tools
is not always reachable. “Procedural improvements” in multi-level governance is often considered as a
good alternative to big decentralisation changes. This chapter has provided guiding principles for
identifying in different contexts what types of improvement may be needed and suggest various tools
for implementing them.
22
BIBLIOGRAPHY
Akhmouch, Aziza (2011 Forthcoming) “Multi-level Governance of Water Policy in OECD
Countries”, OECD Regional Development Policy Working Papers – available at
www.oecd.org/gov/regional/workingpapers.
Allain-Dupré, D.(2011) “Multi-level governance of public investment: lessons from the crisis”, OECD
Regional Development Policy Working Papers, www.oecd.org/gov/regional/workingpapers.
Blöchliger, Hansjörg and Camila Vammalle (2011, to be published): Reforming Fiscal Federalism and
Local Government. Lessons from OECD Countries, OECD Publishing, Paris.
Blöchliger, Hansjörg , Claire Charbit, José Maria Pinero Campos, Camila Vammalle (2010) “Sub-
central Governments and the Economic Crisis: Impact and Policy Responses”, Economic
Department Working Papers, N°752, OECD.
Charbit, Claire and Varinia Michalun, eds (2009), "Mind the gaps: Managing Mutual Dependence in
Relations among Levels of Government", OECD Working Papers on Public Governance, No.
14, OECD Publishing, © OECD. doi:10.1787/221253707200.
Charbit, Claire and Camila Vammalle (2010), “Modernising government” in Making Reform Happen:
lessons from OECD countries, OECD Publishing, Paris..
Conlan, Timothy J. and Posner, Paul L. (eds) (2008) Intergovernmental Management for the 21st
Century, Brookings Institution Press, U.S.
Joumard, Isabelle , Christophe André, Chantal Nicq, Olivier Chatal, (2008), "Health Status
Determinants: Lifestyle, Environment, Health Care Resources and Efficiency," OECD
Economics Department Working Papers N° 627, OECD Publishing, Paris.
OECD (2011a, Forthcoming) Water governance in OECD countries: a Multi-Level approach, OECD
Publishing, Paris.
OECD (2011b), Making the most of public investment in a tight fiscal environment: multi-level
governance lessons from the crisis, OECD Publishing, Paris.
OECD (2011c, Forthcoming) Regional Outlook, OECD Publishing, Paris.
OECD (2011d) Regions at a Glance, OECD Publishing, Paris.
OECD (2010a) Restoring Fiscal Sustainability: Lessons for the Public Sector, OECD, Paris.
OECD (2009a), OECD Policy Brief: Bridging the Gaps between Levels of Government, OECD, Paris.
OECD (2009b), Regions Matter: Economic Recovery, Innovation and Sustainable Growth, OECD,
Paris.
23
OECD (2009c), Multi-level Regulatory Capacity in Australia, (GOV/PGC/REG(2009)13), OECD,
Paris.
OECD (2009d) Governing Regional Development Policy: the use of performance indicators, OECD
Publishing, Paris.
OECD (2007); Linking Regions and Central Governments: contracts for regional development, OECD
Publishing, Paris.
Ostrom, Elinor, Amy R. Poteete, Marco A. Janssen (2010), Working Together: Collective Action, the
Commons, and Multiple Methods in Practice, Princeton University Press, Princeton, NJ.
Posner, Paul L. (2008) “Mandates: The Politics of Coercive Federalism”, in Conlan, Timothy J. and
Posner, Paul L. (eds) Intergovernmental Management for the 21st Century, Brookings
Institution Press, U.S.
Richardson, George B. (1990) Information and Investment, Clarendon Press, Oxford
Shah, Anwar (2006), “Corruption and decentralized public governance”, World Bank Policy Research
Working Paper Series N° 3824, Washington.
Vammalle, Camila and Norbert Gaillard (2011 Forthcoming), “Fiscal policy in a tight fiscal context:
the sub-national government perspective”, in: Institutional and Financial Relations across
Levels of Government in a Tight Fiscal Context, KIPF/OECD Publications
Related Documents