Interim report January-June 2015 1 Gothenburg, July 17, 2015 GUNNEBO INTERIM REPORT JANUARY – JUNE 2015 The CEO’s comments on the second quarter Order intake increased organically by 14% during the second quarter. Several major orders were received during the quarter, including one in Indonesia from OKI Pulp & Paper worth MUSD 25, and a five-year framework agreement with Stockholm’s public transport company, SL, for project planning and installation of ticket gates at new and existing metro stations. During the second quarter net sales amounted to MSEK 1,516, an organic decrease of 4% mainly attributable to weak sales in Asia. The weak development in the state-owned banks in India continued during the quarter. In Europe organic net sales remained relatively unchanged, while Region Americas saw an increase in organic net sales. One-off costs during the quarter burdened profit by MSEK 22, relating to cost adaptations in Europe and changes in the Group Executive Team. Adaptation of fixed costs in Europe will remain a high priority for the Group. Operating profit excluding items of a non-recurring nature amounted to MSEK 102 (98) during the quarter, and the operating margin to 6.7% (6.9%). Susanne Larsson was appointed the new CFO of Gunnebo during the quarter. She will take up her post in mid- August and will be part of the Gunnebo Group Executive Team. Henrik Lange, President and CEO Gunnebo AB

Welcome message from author
This document is posted to help you gain knowledge. Please leave a comment to let me know what you think about it! Share it to your friends and learn new things together.
Transcript

Interim report January-June 2015
1
Gothenburg, July 17, 2015
GUNNEBO
INTERIM REPORT
JANUARY – JUNE 2015
The CEO’s comments on the second quarter
Order intake increased organically by 14% during the second quarter. Several major orders were received during
the quarter, including one in Indonesia from OKI Pulp & Paper worth MUSD 25, and a five-year framework
agreement with Stockholm’s public transport company, SL, for project planning and installation of ticket gates at
new and existing metro stations.
During the second quarter net sales amounted to MSEK 1,516, an organic decrease of 4% mainly attributable to
weak sales in Asia. The weak development in the state-owned banks in India continued during the quarter. In
Europe organic net sales remained relatively unchanged, while Region Americas saw an increase in organic net
sales.
One-off costs during the quarter burdened profit by MSEK 22, relating to cost adaptations in Europe and changes
in the Group Executive Team. Adaptation of fixed costs in Europe will remain a high priority for the Group.
Operating profit excluding items of a non-recurring nature amounted to MSEK 102 (98) during the quarter, and the
operating margin to 6.7% (6.9%).
Susanne Larsson was appointed the new CFO of Gunnebo during the quarter. She will take up her post in mid-
August and will be part of the Gunnebo Group Executive Team.
Henrik Lange, President and CEO Gunnebo AB

Interim report January-June 2015
2
In Brief
Full year
MSEK 2015 2014 2015 2014 2014
Order intake 1,662 1,330 3,427 2,836 5,433
Net sales 1,516 1,419 2,913 2,669 5,557
Operating profit before depreciation (EBITDA) 105 162 158 201 440
Operating margin before depreciation (EBITDA), % 6.9 11.4 5.4 7.5 7.9
Operating profit excl. non-recurring items1)
102 98 140 136 366
Operating margin excl. non-recurring items, %1)
6.7 6.9 4.8 5.1 6.6
Operating profit (EBIT) 80 141 109 159 352
Operating margin (EBIT), % 5.3 9.9 3.8 6.0 6.3
Profit/loss for the period 51 106 40 103 227
Earnings per share, SEK2)
0.64 1.40 0.51 1.36 2.98
Free cash flow -42 44 -185 -24 223
2) Earnings per share before dilution
April-June Jan-June
1) Items of a non-recurring nature amounted to MSEK -22 (43) for the period April - June and to -31 Mkr (23) for
the period January-June
SECOND QUARTER 2015
Order intake increased to MSEK 1,662 (1,330), organically it increased by 14%.
Net sales totalled MSEK 1,516 (1,419), organically a decrease of 4%.
Operating profit decreased to MSEK 80 (141) and the operating margin to 5.3% (9.9%).
Operating profit excluding items of a non-recurring nature amounted to MSEK 102 (98) and the operating margin to 6.7% (6.9%).
Profit after tax for the period totalled MSEK 51 (106).
Earnings per share were SEK 0.64 (1.40).
Free cash flow amounted to MSEK -42 (44).
JANUARY – JUNE 2015
Order intake increased to MSEK 3,427 (2,836), organically it increased by 9%.
Net sales totalled MSEK 2,913 (2,669), organically a decrease of 3%.
Operating profit decreased to MSEK 109 (159) and the operating margin to 3.8% (6.0%).
Operating profit excluding items of a non-recurring nature amounted to MSEK 140 (136) and the operating margin to 4.8% (5.1%).
Profit after tax for the period totalled MSEK 40 (103).
Earnings per share were SEK 0.51 (1.36).
Free cash flow amounted to MSEK -185 (-24).

Interim report January-June 2015
3
Regional review
Order intake
April-June Jan-June Full year
MSEK 2015 2014 2015 2014 2014
Region Europe, Middle East & Africa 918 908 2,098 1,978 3,620
Region Asia-Pacific 412 232 685 490 987
Region Americas 332 190 644 368 826
Total 1,662 1,330 3,427 2,836 5,433
Net sales
April-June Jan-June Full year
MSEK 2015 2014 2015 2014 2014
Region Europe, Middle East & Africa 962 925 1,849 1,767 3,644
Region Asia-Pacific 273 281 518 502 1,029
Region Americas 281 213 546 400 884
Total 1,516 1,419 2,913 2,669 5,557
Operating profit/loss, excl non-recurring items
April-June Jan-June Full year
MSEK 2015 2014 2015 2014 2014
Region Europe, Middle East & Africa 35 30 40 29 109
Region Asia-Pacific 34 42 47 66 140
Region Americas 33 26 53 41 117
Total 102 98 140 136 366
Operating margin, excl non-recurring items
April-June Jan-June Full year
% 2015 2014 2015 2014 2014
Region Europe, Middle East & Africa 3.6 3.2 2.2 1.6 3.0
Region Asia-Pacific 12.5 14.9 9.1 13.1 13.6
Region Americas 11.7 12.2 9.7 10.3 13.2
Total 6.7 6.9 4.8 5.1 6.6
Non-recurring items
April-June Jan-June Full year
MSEK 2015 2014 2015 2014 2014
Region Europe, Middle East & Africa -16 51 -24 32 -1
Region Asia-Pacific -3 -5 -4 -6 -9
Region Americas -3 -3 -3 -3 -4
Total -22 43 -31 23 -14
Operating profit/loss
April-June Jan-June Full year
MSEK 2015 2014 2015 2014 2014
Region Europe, Middle East & Africa 19 81 16 61 108
Region Asia-Pacific 31 37 43 60 131
Region Americas 30 23 50 38 113
Total 80 141 109 159 352

Interim report January-June 2015
4
Region EMEA Europe, Middle East & Africa (EMEA) is the Group’s largest region. It is divided into eight sub-regions: Nordic,
Central Europe, Southern Europe, UK/Ireland, France, Eastern Europe, Middle East and Africa.
Gunnebo’s offering in EMEA comprises cash handling, safes and vaults, entrance security and electronic security,
along with security-related service, and is available on most markets. The largest customer segments are bank,
retail, CIT companies, mass transit, public and commercial properties, as well as industrial and high-risk sites.
April – June 2015 Order intake in EMEA fell organically by 5% due to weak demand primarily in Southern Europe and the Middle
East. However, demand was better and order intake increased in France, Central Europe and South Africa.
Net sales decreased organically by 2%. Consolidation in the bank sector continued during the quarter,
contributing to lower sales of physical security products such as safes and vaults. Sales to the retail sector
increased due to higher demand for products and solutions in entrance security and cash handling.
Operating profit excluding items of a non-recurring nature increased to MSEK 35 (30) and the operating margin
was 3.6% (3.2%). During the second quarter, items of a non-recurring nature totalled MSEK -16 (51).
QUARTER IN BRIEF
A large French airport chooses Gunnebo to supply entrance security
A UK bank orders SafeStore Auto, a first for Gunnebo in the UK
Stockholm’s public transport company, SL, signs a five-year framework agreement for project planning and installation of ticket gates
FACTS EMEA
SVP: Morten Andreasen
Sales companies: 20 Nordic: Denmark, Norway, Sweden Central Europe: Austria, Belgium, Germany,
Luxembourg, Netherlands, Switzerland Southern Europe: Italy, Portugal, Spain France Eastern Europe: Czech Republic, Hungary,
Poland UK/Ireland Middle East: UAE Africa: South Africa
Region Europe, Middle East & Africa
April-June Jan-June Full year
MSEK 2015 2014 2015 2014 2014
Order intake 918 908 2,098 1,978 3,620
Organic growth, % -5 0
Net sales 962 925 1,849 1,767 3,644
Organic growth, % -2 -2
Operating profit/loss excl. non-recurring items 35 30 40 29 109
Operating margin excl. non-recurring items, % 3.6 3.2 2.2 1.6 3.0
Non-recurring items -16 51 -24 32 -1
Operating profit/loss 19 81 16 61 108
Percentage of Group
sales: 63%

Interim report January-June 2015
5
Region Asia-Pacific Asia-Pacific is divided into four sub-regions: India, China, Australia/New Zealand and South-East Asia. In addition
Gunnebo has a wide network of Channel Partners on many of the region’s markets.
Gunnebo’s offering in Asia-Pacific mainly comprises the sale of safes and vaults for the bank sector, entrance
security for public and commercial properties, and for industrial and high-risk sites and mass transit. There is also
a growing business in security-related service and cash handling in the region.
April – June 2015 Order intake in Region Asia-Pacific increased organically by 61%. The improvement is mainly attributable to a
major fire protection equipment order in Indonesia worth MUSD 25. Deliveries will begin in the third quarter of
2015 and are expected to extend over several years. Otherwise, demand was weak on many of the markets.
Net sales decreased organically by 20% due to lower sales primarily in India, but also in China and Indonesia.
Operating profit excluding items of a non-recurring nature amounted to MSEK 34 (42), which equates to an
operating margin of 12.5% (14.9%). Items of a non-recurring nature burdened the operating profit by
MSEK -3 (-5).
QUARTER IN BRIEF
OKI Pulp & Paper signs a several-year fire protection order for a new paper mill in Indonesia
Samsung orders entrance security for a development centre
Gunnebo China opens a sales office in Shenzhen to enhance proximity to customers
FACTS ASIA-PACIFIC
SVP: Sacha de La Noë
Sales companies: 8 Australia/New Zealand India China South-East Asia: Indonesia, Malaysia, Singapore, South Korea
Region Asia-Pacific
April-June Jan-June Full year
MSEK 2015 2014 2015 2014 2014
Order intake 412 232 685 490 987
Organic growth, % 61 20
Net sales 273 281 518 502 1,029
Organic growth, % -20 -17
Operating profit/loss excl. non-recurring items 34 42 47 66 140
Operating margin excl. non-recurring items, % 12.5 14.9 9.1 13.1 13.6
Non-recurring items -3 -5 -4 -6 -9
Operating profit/loss 31 37 43 60 131
Percentage of Group
sales: 18%
Interim report January-June 2015
6
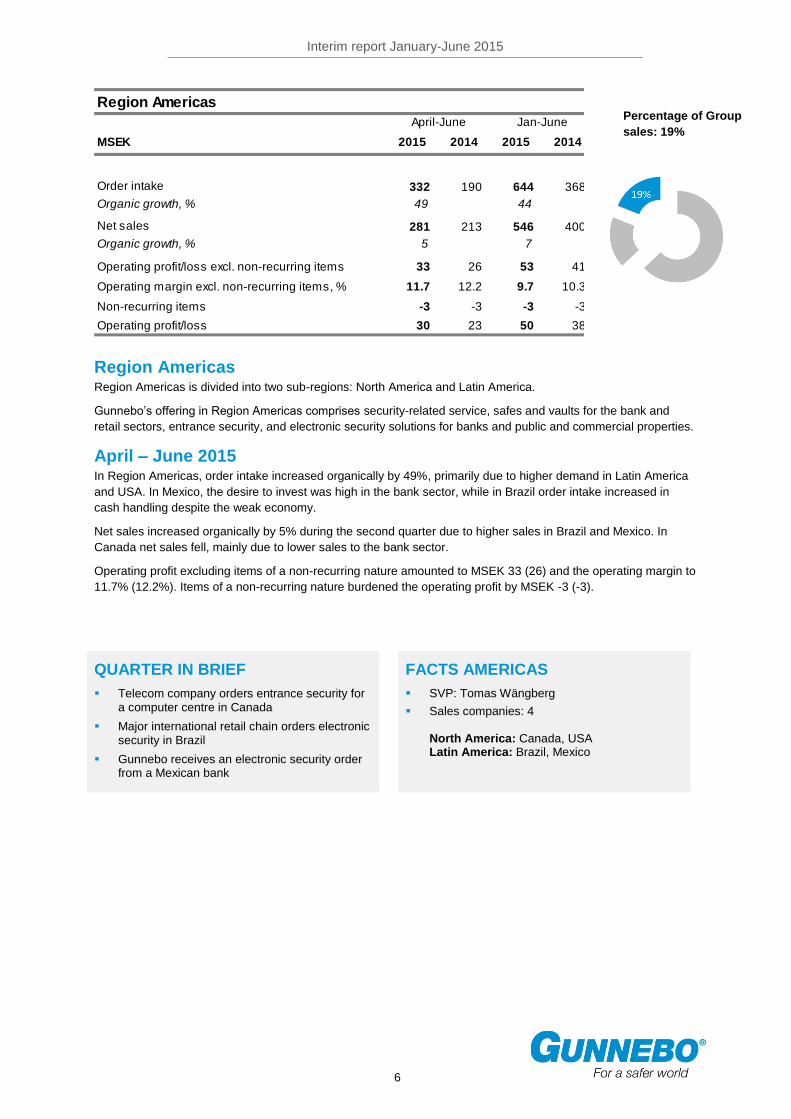
Region Americas Region Americas is divided into two sub-regions: North America and Latin America.
Gunnebo’s offering in Region Americas comprises security-related service, safes and vaults for the bank and
retail sectors, entrance security, and electronic security solutions for banks and public and commercial properties.
April – June 2015 In Region Americas, order intake increased organically by 49%, primarily due to higher demand in Latin America
and USA. In Mexico, the desire to invest was high in the bank sector, while in Brazil order intake increased in
cash handling despite the weak economy.
Net sales increased organically by 5% during the second quarter due to higher sales in Brazil and Mexico. In
Canada net sales fell, mainly due to lower sales to the bank sector.
Operating profit excluding items of a non-recurring nature amounted to MSEK 33 (26) and the operating margin to
11.7% (12.2%). Items of a non-recurring nature burdened the operating profit by MSEK -3 (-3).
QUARTER IN BRIEF
Telecom company orders entrance security for a computer centre in Canada
Major international retail chain orders electronic security in Brazil
Gunnebo receives an electronic security order from a Mexican bank
FACTS AMERICAS
SVP: Tomas Wängberg
Sales companies: 4 North America: Canada, USA Latin America: Brazil, Mexico
Region Americas
April-June Jan-June Full year
MSEK 2015 2014 2015 2014 2014
Order intake 332 190 644 368 826
Organic growth, % 49 44
Net sales 281 213 546 400 884
Organic growth, % 5 7
Operating profit/loss excl. non-recurring items 33 26 53 41 117
Operating margin excl. non-recurring items, % 11.7 12.2 9.7 10.3 13.2
Non-recurring items -3 -3 -3 -3 -4
Operating profit/loss 30 23 50 38 113
Percentage of Group
sales: 19%

Interim report January-June 2015
7
APRIL – JUNE 2015
Order intake and net sales The Group’s order intake during the second quarter of 2015 improved to MSEK 1,662 (1,330). Organically, order
intake increased by 14%.
Net sales totalled MSEK 1,516 (1,419). Organically, sales decreased by 4%.
Financial results Operating profit decreased to MSEK 80 (141) and the operating margin to 5.3% (9.9%). The decline in the figures
can be explained by a capital gain of MSEK 73 relating to divestment of operations, which boosted operating
profit in the comparison period (i.e. the second quarter of 2014). Currency effects had a positive impact of
MSEK 13.
Items of a non-recurring nature amounted to MSEK -22 (43) and comprised restructuring costs related to Europe
as well as costs related to changes made at senior management level. Operating profit excluding items of a non-
recurring nature amounted to MSEK 102 (98), which equates to an operating margin of 6.7% (6.9%).
JANUARY – JUNE 2015
Order intake and net sales During January-June 2015, the Group’s order intake increased by MSEK 591 to MSEK 3,427 (2,836). Organically,
the order intake increased by 9%.
Net sales totalled MSEK 2,913 (2,669). Organically, sales decreased by 3%.
Financial results Operating profit amounted to MSEK 109 (159) and the operating margin to 3.8% (6.0%). Currency effects had a
positive impact of MSEK 27.
Restructuring costs, along with certain other expenses of a non-recurring nature, burdened the result by
MSEK -31 (23) in total. The majority of these costs are associated with workforce reductions in Europe and
changes in management. Operating profit adjusted for items of a non-recurring nature amounted to MSEK 140
(136), which equates to an operating margin of 4.8% (5.1%).
Net financial items fell to MSEK -26 (-19) due to negative currency effects attributable to financial receivables and
liabilities. Group profit after financial items amounted to MSEK 83 (140). Net profit for the period totalled MSEK 40
(103), and earnings per share attributable to the parent company’s shareholders were SEK 0.51 (1.36) per share.
Capital expenditure and depreciation/amortisation Investments made in intangible assets and property, plant and equipment during the period totalled MSEK 48
(28). Depreciation/amortisation amounted to MSEK 49 (42).
Cash flow Cash flow from operating activities decreased compared to the same period last year as the result of higher
working capital tied up, and amounted to MSEK -141 (-5). Payments related to restructuring measures burdened
the cash flow by MSEK 25 (27).
Cash flow from investing activities amounted to MSEK -65 (58). The decrease on 2014 is primarily attributable to
the disposal and acquisition of operations.
Free cash flow, i.e. operating cash flow after deductions for net financial items affecting cash flow and paid tax,
decreased to MSEK -185 (-24).
Liquidity and financial position The Group’s liquid funds at the end of the period amounted to MSEK 350 (447 at the beginning of the year).
Equity amounted to MSEK 1,668 (1,694 at beginning of year) and the equity ratio to 34% (35% at beginning of
year).

Interim report January-June 2015
8
The fall in equity can mainly be explained by the dividend paid to shareholders, which burdened equity by
MSEK 76. Translation differences in foreign operations, reported in other comprehensive income, had a positive
effect on equity of MSEK 3.
Net debt increased by MSEK 264 to MSEK 1,303 (1,039 at beginning of year), primarily due to an increase in
working capital tied up and the shareholder dividend.
The debt/equity ratio totalled 0.8 (0.6 at beginning of year). Net debt excluding pension commitments amounted to
MSEK 885 (613 at beginning of year).
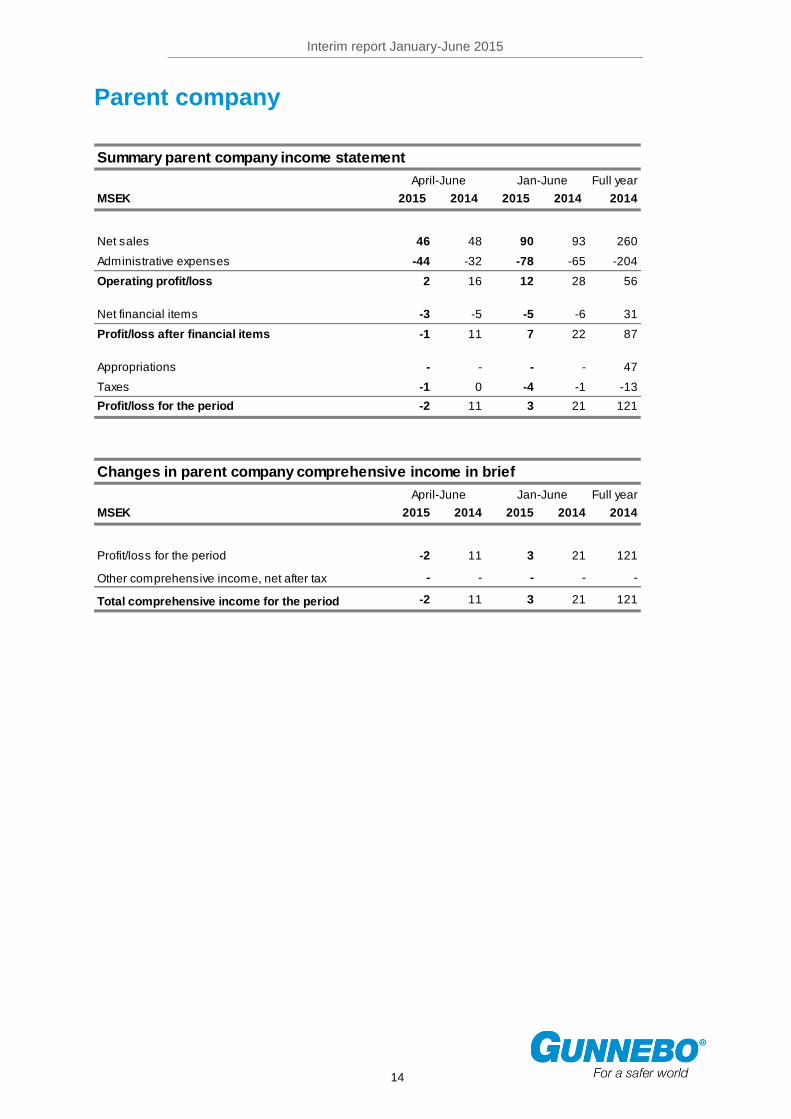
Parent company The Group’s parent company, Gunnebo AB, is a holding company which has the main task of owning and
managing shares in other Group companies, as well as providing Group-wide services. Net sales for the period
January-June totalled MSEK 90 (93). Net profit for the period amounted to MSEK 3 (21).
Employees The number of employees at the end of the period was 5,620 (5,670 at beginning of year). The number of
employees outside of Sweden at the end of the period was 5,447 (5,498 at beginning of year).
Share data Earnings per share after dilution were SEK 0.51 (1.36). The number of shareholders totalled 11,700 (12,400).
Transactions with related parties There have been no transactions with related parties during the period that affect Gunnebo’s position and result to
any significant extent.
Events after the closing day No significant events occurred after the closing day.
Accounting principles Gunnebo complies with the International Financial Reporting Standards adopted by the EU, and the official
interpretations of these standards (IFRIC). The Interim Report for the Group has been prepared in accordance
with the Annual Accounts Act and IAS 34 Interim Financial Reporting, and the Interim Report for the parent
company has been prepared in accordance with the Annual Accounts Act and the recommendation of the
Swedish Financial Reporting Board, RFR 2 Accounting for Legal Entities. The same accounting principles and
methods of calculation have been used as in the latest annual report. New and amended IFRS standards and
interpretations from IFRIC which take effect as of 2015 have not had any significant effect on the Group’s financial
statements.
Significant risks and uncertainties The Group’s and parent company’s significant risks and uncertainties include operational risks in the form of raw
material risks, product risks, insurance risks and legal risks. In addition there are for example financial risks such
as financing risks, liquidity risks, interest rate risks and currency risks, as well as credit and counterparty risks.
The Group’s risk management is described in more detail on pages 44-47 of Gunnebo’s 2014 Annual Report, and
in Note 3. Gunnebo considers this risk description to still be correct.

Interim report January-June 2015
9
Financial goals
The Group shall earn a minimum return on capital employed of 15%
and an operating margin of at least 7% in the long term
The equity ratio shall not fall below 30%
The Group shall achieve organic growth of at least 5%
This interim report is a translation of the original report in Swedish which has not been reviewed by the company’s
auditors.
Certification
The Board of Directors of Gunnebo AB hereby certifies that this interim report provides a true and fair overview of
the business, financial position and results of the parent company and the Group, and describes significant risks
and uncertainty factors with which the company and the companies in the Group are faced.
Gothenburg, July 17, 2015 Martin Svalstedt Chairman
Tore Bertilsson Göran Bille Charlotte Brogren Board member Board member Board member
Bo Dankis Eva Elmstedt Mikael Jönsson Board member Board member Board member
Crister Carlsson Henrik Lange Irene Thorin Board member President and CEO Board member
Interim report January-June 2015
10
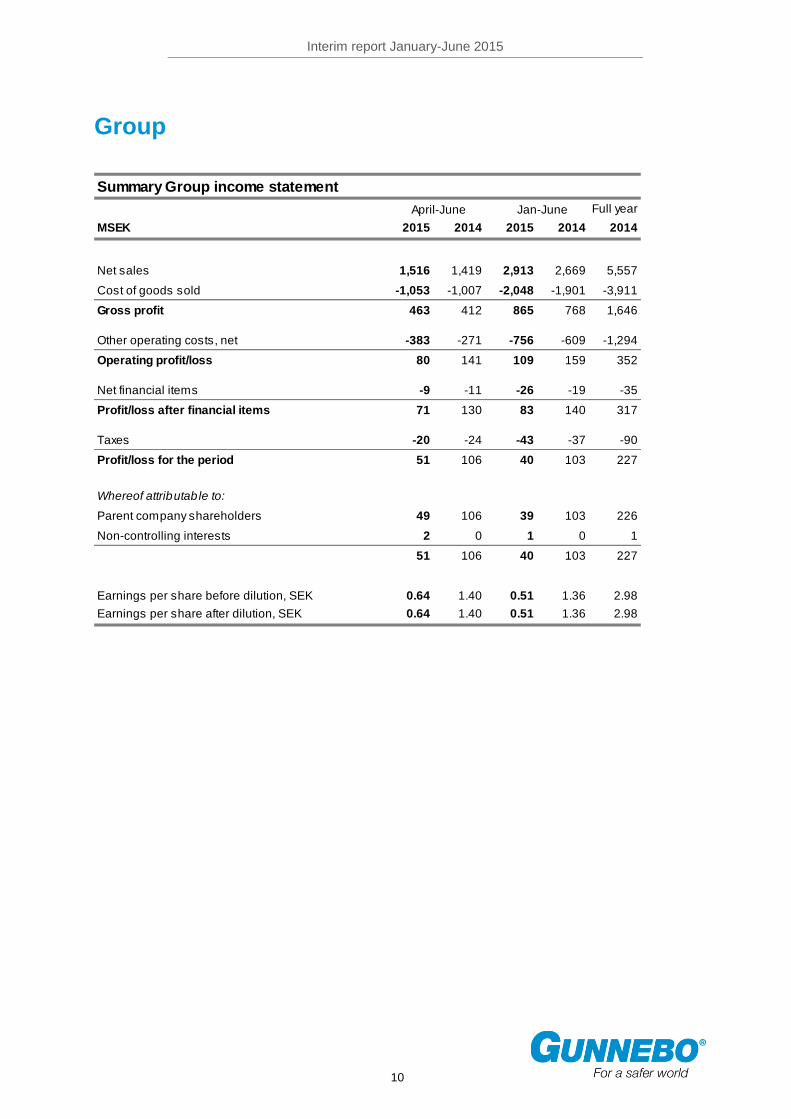
Group
Summary Group income statement
April-June Jan-June Full year
MSEK 2015 2014 2015 2014 2014
Net sales 1,516 1,419 2,913 2,669 5,557
Cost of goods sold -1,053 -1,007 -2,048 -1,901 -3,911
Gross profit 463 412 865 768 1,646
Other operating costs, net -383 -271 -756 -609 -1,294
Operating profit/loss 80 141 109 159 352
Net financial items -9 -11 -26 -19 -35
Profit/loss after financial items 71 130 83 140 317
Taxes -20 -24 -43 -37 -90
Profit/loss for the period 51 106 40 103 227
Whereof attributable to:
Parent company shareholders 49 106 39 103 226
Non-controlling interests 2 0 1 0 1
51 106 40 103 227
Earnings per share before dilution, SEK 0.64 1.40 0.51 1.36 2.98
Earnings per share after dilution, SEK 0.64 1.40 0.51 1.36 2.98

Interim report January-June 2015
11
Statement of comprehensive income in brief
April-June Jan-June Full year
MSEK 2015 2014 2015 2014 2014
Profit/loss for the period 51 106 40 103 227
Other comprehensive income for the period
Items that will not be reclassified subsequently to profit or
loss
Actuarial gains and losses* 7 - 7 - -30
Total items that will not be reclassified to profit or loss
subsequently 7 - 7 - -30
Items that may be reclassified subsequently to profit or
loss
Translation differences in foreign operations -44 38 3 51 94
Hedging of net investments* 0 2 -3 2 5
Cash-flow hedges* 3 -4 2 -5 -7
Total items that may be reclassified to profit or loss
subsequently -41 36 2 48 92
Total other comprehensive income -34 36 9 48 62
Total comprehensive income for the period 17 142 49 151 289
Whereof attributable to:
Parent company shareholders 17 141 50 149 287
Non-controlling interests 0 1 -1 2 2
17 142 49 151 289
*Net of taxes
Summary Group balance sheet
30 June 31 Dec
MSEK 2015 2014 2014
Goodwill 1,486 1,366 1,490
Other intangible assets 196 168 185
Property, plant and equipment 302 302 304
Financial assets 14 15 16
Deferred tax assets 329 322 339
Inventories 763 687 694
Current receivables 1,439 1,341 1,350
Liquid funds 350 292 447
Total assets 4,879 4,493 4,825
Equity 1,668 1,540 1,694
Long-term liabilities 1,532 1,415 1,449
Current liabilities 1,679 1,538 1,682
Total equity and liabilities 4,879 4,493 4,825

Interim report January-June 2015
12
Changes in Group equity in brief
Jan-June Full year
MSEK 2015 2014 2014
Opening balance 1,694 1,463 1,463
Total comprehensive income for the period 49 151 289
Non-cash issue* 1 - 10
Share-based remuneration 0 - -
New share issue* 0 2 8
Dividend -76 -76 -76
Utgående balans 1,668 1,540 1,694
Varav innehav utan bestämmande inflytande 23 18 24
*Refers to purchase price for the Dissamex acquisition consisting of shares in Gunnebo Mexico
**Refers to the issue of shares to participants in incentive programmes
Summary Group cash flow statement
April-June Jan-June Full year
MSEK 2015 2014 2015 2014 2014
Cash flow from operating activities before changes in
working capital 72 68 76 84 246
Cash flow from changes in working capital -93 -10 -217 -89 25
Cash flow from operating activities -21 58 -141 -5 271
Net investments -21 -14 -44 -19 -48
Acquisition of operations -20 - -21 - -44
Divestment of operations - 77 - 77 77
Cash flow from investing activities -41 63 -65 58 -15
Change in interest-bearing receivables and liabilities 159 -54 178 -96 -180
New share issue 0 2 0 2 8
Dividend -76 -76 -76 -76 -76
Cash flow from financing activities 83 -128 102 -170 -248
Cash flow for the period 21 -7 -104 -117 8
Liquid funds at the beginning of the period 345 288 447 392 392
Translation difference in liquid funds -16 11 7 17 47
Liquid funds at the end of the period 350 292 350 292 447

Interim report January-June 2015
13
Summary Group operating cash flow statement
April-June Jan-June Full year
MSEK 2015 2014 2015 2014 2014
Operating profit/loss 80 141 109 159 352
Adjustment for non-cash items 21 -41 35 -13 40
Cash flow from changes in working capital -93 -10 -217 -89 25
Net investments -21 -14 -44 -19 -48
Operating cash flow -13 76 -117 38 369
Net financial items affecting cash flow -6 -9 -27 -14 -33
Taxes paid -23 -23 -41 -48 -113
Free cash flow -42 44 -185 -24 223
Reconciliation to profit/loss after financial items
April-June Jan-June Full year
MSEK 2015 2014 2015 2014 2014
Region Europe, Middle East & Africa 19 81 16 61 108
Region Asia-Pacific 31 37 43 60 131
Region Americas 30 23 50 38 113
Operating profit/loss 80 141 109 159 352
Net financial items -9 -11 -26 -19 -35
Profit/loss after financial items 71 130 83 140 317
Sales by market
April-June Jan-June Full year
2015 2014 2015 2014 2014
France 16% 18% 17% 19% 19%
USA 9% 8% 9% 8% 9%
India 7% 7% 8% 8% 8%
UK 6% 5% 6% 5% 6%
Spain 4% 5% 4% 4% 4%
Germany 4% 4% 4% 4% 4%
Mexico 4% 1% 4% 1% 1%
Sweden 3% 4% 3% 4% 4%
Canada 3% 3% 3% 3% 3%
Belgium 3% 3% 3% 3% 3%
Others 41% 42% 39% 41% 39%
Total 100% 100% 100% 100% 100%
Interim report January-June 2015
14
Parent company
Summary parent company income statement
April-June Jan-June Full year
MSEK 2015 2014 2015 2014 2014
Net sales 46 48 90 93 260
Administrative expenses -44 -32 -78 -65 -204
Operating profit/loss 2 16 12 28 56
Net financial items -3 -5 -5 -6 31
Profit/loss after financial items -1 11 7 22 87
Appropriations - - - - 47
Taxes -1 0 -4 -1 -13
Profit/loss for the period -2 11 3 21 121
Changes in parent company comprehensive income in brief
April-June Jan-June Full year
MSEK 2015 2014 2015 2014 2014
Profit/loss for the period -2 11 3 21 121
Other comprehensive income, net after tax - - - - -
Total comprehensive income for the period -2 11 3 21 121

Interim report January-June 2015
15
Summary parent company balance sheet
30 June 31 Dec
MSEK 2015 2014 2014
Other intangible assets 5 7 6
Property, plant and equipment 2 2 2
Financial assets 1,713 1,726 1,716
Current receivables 61 54 27
Liquid funds 0 3 0
Total assets 1,781 1,792 1,751
Equity 1,412 1,379 1,485
Current liabilities 369 413 266
Total equity and liabilities 1,781 1,792 1,751
Changes in parent company equity in brief
Jan-June Full year
MSEK 2015 2014 2014
Opening balance 1,485 1,432 1,432
Total comprehensive income for the period 3 21 121
New share issue* 0 2 8
Dividend -76 -76 -76
Closing balance 1,412 1,379 1,485
*Refers to the issue of shares to participants in incentive programmes

Interim report January-June 2015
16
Key ratios for the Group
Key ratios
Jan-June Full year
2015 2014 2014
Gross margin, % 29.7 28.8 29.6
Operating margin before depreciation (EBITDA) excl.
non-recurring items, % 6.5 6.7 8.2
Operating margin before depreciation (EBITDA), % 5.4 7.5 7.9
Operating margin (EBIT) excl. non-recurring items, % 4.8 5.1 6.6
Operating margin (EBIT), % 3.8 6.0 6.3
Profit margin (EBT), % 2.9 5.3 5.7
Return on capital employed, %1)
10.0 11.4 12.1
Return on equity, %1)
10.0 12.5 14.7
Capital turnover rate, times 1.8 1.8 1.8
Equity ratio, % 34 34 35
Interest coverage ratio, times 5.3 8.4 9.6
Debt/equity ratio, times 0.8 0.7 0.6
Data per share
Jan-June Full year
2015 2014 2014
Earnings per share before dilution, SEK 0.51 1.36 2.98
Earnings per share after dilution, SEK 0.51 1.36 2.98
Equity per share, SEK 21.59 20.03 21.93
Free cash flow per share, SEK -2.42 -0.33 2.94
No. of shares at end of period, thousands 76,185 75,987 76,174
Average no. of shares, thousands 76,175 75,920 75,979
1) During the last tw elve-month period

Interim report January-June 2015
17
Quarterly data, MSEK
Income statement 1 2 3 4 1 2 3 4 1 2
Net sales 1,155 1,325 1,314 1,477 1,250 1,419 1,314 1,574 1,397 1,516
Costs of goods sold -827 -918 -908 -1,036 -894 -1,007 -922 -1,088 -995 -1,053
Gross profit 328 407 406 441 356 412 392 486 402 463
Other operating costs, net -327 -350 -345 -338 -338 -271 -315 -370 -373 -383
Operating profit/loss 1 57 61 103 18 141 77 116 29 80
Net financial items -9 -7 -8 -51 -8 -11 -8 -8 -17 -9
Profit/loss after financial
items -8 50 53 52 10 130 69 108 12 71
Taxes -4 -16 -21 -4 -13 -24 -33 -20 -23 -20
Profit/loss for the period -12 34 32 48 -3 106 36 88 -11 51
Key ratios
Gross margin, % 28.4 30.7 30.9 29.9 28.5 29.0 29.8 30.9 28.8 30.5
Operating margin, % 0.1 4.3 4.6 7.0 1.5 9.9 5.9 7.4 2.0 5.3
Operating profit (EBIT) excl.
non-recurring items, MSEK 11 69 93 133 38 98 82 148 38 102
Operating profit (EBIT) excl.
non-recurring items, % 0.9 5.2 7.1 9.0 3.1 6.9 6.2 9.4 2.7 6.7
Earnings per share, SEK 1)
-0.16 0.45 0.39 0.61 -0.04 1.40 0.47 1.15 -0.13 0.64
1) Before dilution
2013 2014 2015

Interim report January-June 2015
18
Notes
Note 1 Non-recurring items per function
Jan-June incl.
non-recurring
items
Non-recurring
items
Jan-June excl.
non-recurring
items
MSEK 2015 2015 2015
Net sales 2,913 - 2,913
Cost of goods sold -2,048 3 -2,045
Gross profit 865 3 868
Gross margin 29.7% 29.8%
Other operating costs, net -756 28 -728
Operating profit/loss 109 31 140
Operating margin 3.8% 4.8%

Interim report January-June 2015
19
Definitions
Capital employed Total assets less interest-free provisions and liabilities
Capital turnover rate Net sales in relation to average capital employed
Debt/equity ratio Net debt in relation to equity
Earnings per share
Profit after tax attributable to the parent company’s shareholders divided by the average number of shares outstanding
EBITDA Operating profit before depreciation/amortisation and write-downs on intangible assets and property, plant and equipment
Equity per share Equity attributable to the shareholders of the parent company divided by the number of shares at the end of the period
Equity ratio Equity as a percentage of the balance sheet total
Free cash flow per share Cash flow from operating and investing activities, excluding acquisitions and divestments, divided by the average number of shares in issue after dilution
Interest coverage ratio Profit after financial items plus interest costs, divided by interest costs
Net debt Interest-bearing provisions and liabilities less liquid funds and interest-bearing receivables
Operating cash flow Cash flow from operating activities, after capital expenditure but before net financial items affecting cash flow and tax paid
Organic growth Growth in net sales, or order intake, adjusted for acquisitions, divestments and exchange rate effects
Operating margin Operating profit as a percentage of net sales
Profit margin
Profit after financial items as a percentage
of net sales
Return on equity Profit for the year as a percentage of average equity
Return on capital employed Operating profit plus financial income as a percentage of average capital employed
Financial Calendar
Interim report January-September 2015 October 21, 2015
Year-end release 2015 February 4, 2016
Annual General Meeting 2016 April 12, 2016
Interim report January-March 2016 April 27, 2016
Gunnebo AB (publ)
Box 5181 SE-402 26 GÖTEBORG Tel: +46 (0)10-2095 000 Fax: +46 (0)10-2095 010 Reg. no. 556438-2629 e-mail: [email protected] www.gunnebogroup.com
The Gunnebo Security Group is a global leader in security products, services and solutions with an offering covering cash handling, safes and vaults, entrance security and electronic security for banks, retail, CIT, mass transit, public & commercial buildings, and industrial & high-risk sites.
The Group has an annual turnover of MSEK 5,600 and 5,700 employees in 32 countries across Europe, the Middle East & Africa, Asia-Pacific and the Americas as well as a network of Channel Partners on 100 additional markets.
For a safer world
Related Documents