COMMUNITY INITIATIVE PROGRAMME INTERREG IIIA Italia – Slovenia 2000 - 2006 GORIZIA NOVA – MODELPLAN Models for the sustainable development of the border area GORIZIA NOVA THE URBAN AREA GORIZIA – NOVA GORICA AS A MODEL FOR EUROPE Final report DEPARTMENT OF GEOGRAPHICAL AND HISTORICAL SCIENCES UNIVERSITY OF TRIESTE Project cofinanced by the European Union through the ERDF within the framework of Interreg IIIA Italy-Slovenia under the direction of the Autonomous Region Friuli Venezia Giulia

Welcome message from author
This document is posted to help you gain knowledge. Please leave a comment to let me know what you think about it! Share it to your friends and learn new things together.
Transcript
COMMUNITY INITIATIVE PROGRAMME INTERREG IIIA
Italia – Slovenia 2000 - 2006
GORIZIA NOVA – MODELPLAN
Models for the sustainable development of the border area
GORIZIA NOVA
THE URBAN AREA GORIZIA – NOVA GORICA AS A MODEL FOR EUROPE
Final report
DEPARTMENT OF GEOGRAPHICAL AND HISTORICAL SCIENCES
UNIVERSITY OF TRIESTE
Project cofinanced by the European Union through the ERDF within the framework of Interreg IIIA Italy-Slovenia under the direction of the Autonomous Region Friuli Venezia Giulia

SUMMARY
FOREWORD
1. THE MODEL PLAN RESEARCH
2. THE REFERENCE SCENARIOS
2.1. THE EUROPEAN FRAMEWORK
2.2. THE TERRITORIAL DYNAMICS IN THE REPUBLIC OF SLOVENIA
2.3. THE TERRITORIAL DYNAMICS IN FRIULI VENEZIA GIULIA
3. THE ENTRY OF SLOVENIA IN THE EU: THE AREAS CONCERNED
3.1. THE REFERENCE MACROAREA
3.2. THE GRADUATION OF AREAS
3.3. THE REFERENCE URBAN CENTRE
4. THE FUNDAMENTAL ELEMENTS OF THE SOCIOECONOMIC FABRIC
4.1. THE DEMOGRAPHIC BALANCE
4.2. THE SOCIOECONOMIC CONTEXT
4.3. THE ECONOMIC AND EMPLOYMENT STRUCTURE
5. THE ECONOMIC-TERRITORIAL SCENARIOS AND THE DYNAMICS OF A
COMMON DEVELOPMENT
5.1. THE NEW STRATEGIC LINES
5.2. THE INDUSTRIAL FUNCTION
5.3. UNIVERSITY AND RESEARCH
5.4. THE RETAIL TRADE ISSUE
5.5. THE RENOVATION OF THE HISTORICAL CENTRE
5.6. THE TOURISM-CULTURAL FUNCTION
5.7. THE HEALTH SECTOR
6. THE PLANNING QUESTION
6.1. STRATEGIC VARIABLES IN THE TERRITORIAL DYNAMICS
6.2. TOWARDS A DYNAMIC MODEL OF TERRITORIAL DEVELOPMENT
6.3. STANDARDIZING CARTOGRAPHICAL BASIS
6.4. STANDARDIZING INTERVENTION SCALES
6.5. THE STANDARDIZATION OF PLANS
7. MODELS OF TRANSBORDER PLANNING
7.1. THE REFERENCE PLANNING FRAMEWORK
7.2. THE HYPOTHESES ADVANCED
7.3. THE USE OF REMOTE SENSING IMAGES
8. EXAMPLES OF TRANSBORDER PROJECTS
8.1. AIRPORT PROJECTS
8.2. THE “SABOTIN” PROJECT
8.3. RENOVATION OF AN URBAN AREA
CONCLUSIONS
TABLES
BASIC BIBLIOGRAPHY

FOREWORD
The entry of Slovenia into the European Union (April 2004) and even more so its future adoption of the
European currency (January 2007) are the preconditions for a gradual process of a territorial reshaping
at the Italian eastern border.
In the particular case of Gorizia, the chief town of one of the smallest Italian provinces, the conditions
are ripening for a rejoining of its urban area with that of the new town - sprung up directly over the
border in 1947 – which had been named Nova Gorica. One of the most startling products of the “cold
war”, the urban duplication is but the last stage of the dissolution of an ancient historical and
geographical unit – the Prince County of Gorizia and Gradisca – carried out in the aftermath of the first
world war.
When correctly considered within this framework, the issue of Gorizia peripheralization goes along with
the marginalization of a much wider territory. In fact, both Gorizia provinces, the Italian and the
Slovenian one, suffer marginalization within the respective states. On the other side, both strive to
safeguard their autonomy towards the neighbouring provinces, constantly trying to subdue, if not to
absorb, them. The fall of the border, which will be final when Slovenia joins the Schengen system, is
bound to lead in a very short time to the restoration of a territorial continuity which even a close net of
border posts (as many as 21) has not been able to preserve in time. As far as Gorizia and Nova Gorica
are concerned, they are bound to merge into one urban area which, although belonging to two different
States, is no doubt going to have a common future. Of course, delicate issues of economic, cultural and
planning nature will have to be tackled. Politics will certainly find solutions, however complex, but the
question is if and to what extent will the two towns, once merged, be able to resume their role of
territorial coordination which is undoubtedly their own.

The two Gorizia provinces have roughly the same population (120,000 the Goriška area, 130,000 the
Italian one), while their respective surfaces are widely different (2,325 sq km in Slovenia, just 470 in
Italy). It is worth while considering that a simple addition of the populations of the two neighbouring
municipal districts gives a town of 73,000 inhabitants (data 2002), equally distributed between the two
entities although with a very different density (which would result in an average of 215 inhs/sq km).
With such values, considered within the urban network of the region Friuli Venezia Giulia, the new
town would rank as third in the region, not very far from Udine, and as third in Slovenia as well, in this
case not very far from Maribor.1
The effect of the overlaying or of the abolition of boundaries in redesigning urban networks could not
find a more striking example than this. We would like to suggest now a name for this “new” town,
which already exists although geography is not yet aware of it. It is a name which would give the same
dignity to both its components and underline its Slav and Latin heritage alike, a name reminding of its
roots, deep into European history: Gorizia Nova.
1 To complete the picture, let us recall that also Klagenfurt has, like the aforementioned towns, around 90.000 inhabitants.
1. THE MODEL PLAN RESEARCH
The programmed activity has been carried out from July 2003 to August 2006 and has produced, beside the
present report, three advancement reports (not reproposed here), a book already published and a GIS, already
submitted to the Regional Administration, beside eleven papers presented at scientific meetings in Italy and
abroad (cf. list Papers and communication).
In order to divulge the various activities seven open sessions have been organized (cf. list Meetings and
conferences). Other divulgation activities have been carried out by means of communication to the press and
through a special web page (cf. list Papers and communication).
As far as the targets of the project are concerned, the areas formed by the two towns of Gorizia and Nova
Gorica (cf. ch. 3) have been identified and described in their components, defining the economic-territorial
scenarios and the dynamics of common development (cf. chs. 2, 5). The main elements of the Italian and
Slovenian socio-economical fabric have also been defined in order to plan a future sustainable development
and to jointly plan its territorial development (cf. ch. 4) so as to guide the following planning projects both
on wide and on detail scale (cf. ch. 5).
As to the expected results at transborder level, a contribution has been given towards the development of
new forms of joint environmental and territorial planning (cf. chs. 6, 7, 8). Data, studies and researches on
the environment and the territory aiming at carrying out joint initiatives, improving the information flow
through the exchange of information among the structures charged with preparing and implementing
projects, particularly public subjects (by means of meetings, seminars, panel meetings, website etc.).
A contribution has been given towards the enhancement of the architectonical, cultural and environmental as
well as towards the renovation of areas the potentials of which have been negatively influenced by the
existence of the border (cf. in particular ch. 8, which does not anyway explore all planning activities, as
expounded in the Second Report). This way, a greater attention towards issues such as respect of
environment, sustainable development and protection of territory has been encouraged, in the attempt to
overcome existing law, administration, language and culture barriers, thus contributing to the development of
common standards and system harmonization.
Following the directions of the Guidance Committee, we have tried to cooperate with the Agency for
Regional Development of Nova Gorica, which has been included in the panel of privileged partners. A
particular attention has been devoted to the Mount Sabotino area, owing to its naturalistic importance. To
this aim, a multimedia product (GIS) has been produced and submitted to the Administration together with
the Second Report, an overall project for the exploitation of the area for tourism and recreation purposes. The
area has been studied not only for its importance from an aesthetical-landscape/naturalist/historical and

archaeological point of view, but it has also been included in planning proposals through the identification of
a network of paths beginning both in Italian and in Slovenian territory, enriched with information points and
landscape preservation (fireproof) barriers.
As far as the panel of privileged partners is concerned, this has been set up with representatives of Italian and
Slovenian public authorities as illustrated below.
The aim of the panel was to build a connection network with both formation and information character to
bring into contact subjects charged with planning related issues in order to contribute to the development of
the project in its different evolution stages. The long-term objective has been to establish a practice of
consultation and identification of viable solutions to reach a transborder planning with a continuous
character. This activity has been carried out via e-mail to transmit work documents, supported by the special
interactive section realized in the webpage of the project. A secretarial service has also been set up.
The partners contacted, however, have not been particularly ready to cooperate, overburdened as they were
with the multifarious commitments of their institutional activities. Despite the difficulty to fix a suitable
calendar, there have been three meetings, on 2.4.2004 (Gorizia, University of Trieste pole), 30.9.2004 (Nova
Gorica, municipal seat) and 15.1.2005 (Gorizia, University of Trieste pole).
The web structure is still open and will continue to work as a linking structure with the interested
Authorities, which were meant to be the permanent core of a work group of variable geometry and which we
mean to invite shortly in order to adequately bring out and divulge the results synthesized in this report.
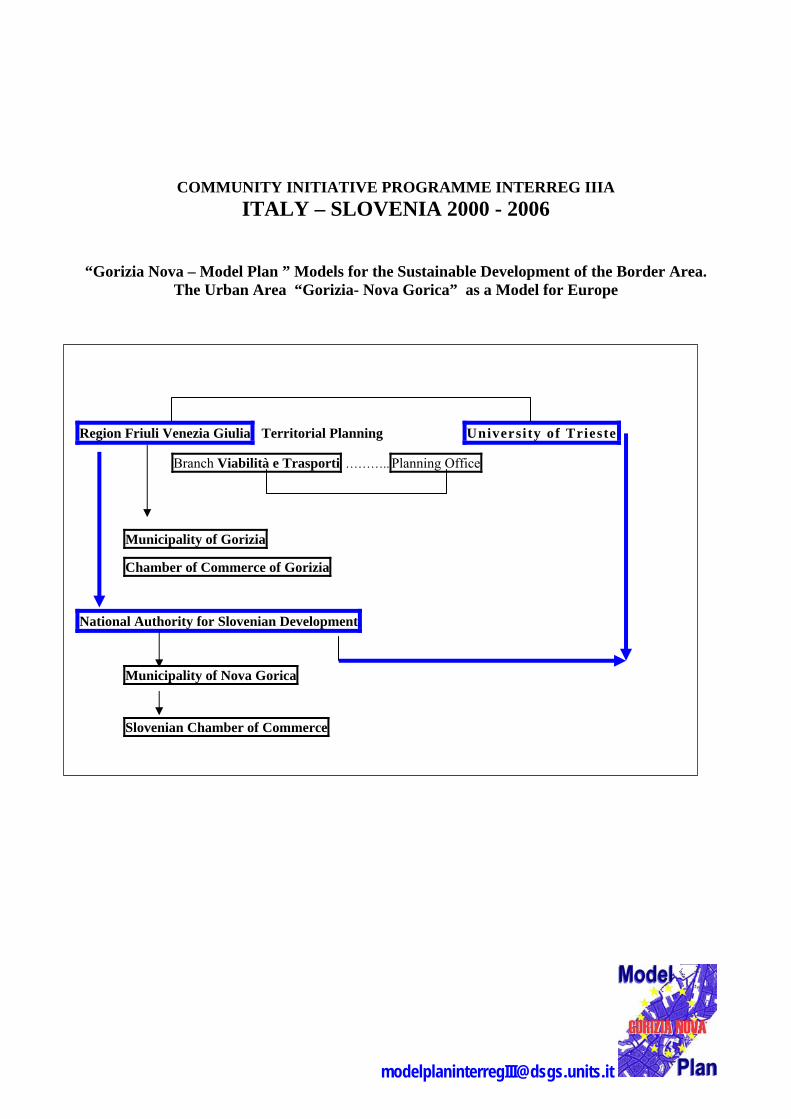
COMMUNITY INITIATIVE PROGRAMME INTERREG IIIA ITALY – SLOVENIA 2000 - 2006
“Gorizia Nova – Model Plan ” Models for the Sustainable Development of the Border Area. The Urban Area “Gorizia- Nova Gorica” as a Model for Europe
Region Friuli Venezia Giulia Territorial Planning University of Trieste
Branch Viabilità e Trasporti ……….. Planning Office
Municipality of Gorizia
Chamber of Commerce of Gorizia
National Authority for Slovenian Development
Municipality of Nova Gorica
Slovenian Chamber of Commerce
MEETINGS AND EVENTS*
1. Transplan and Modelplan: Projects and Proposals for a Transborder Territorial Planning, Gorizia,
University of Trieste Pole, 4th December, 2003 organized by the Department of Geographical and
Historical Sciences in cooperation with the Province of Gorizia;
2. Gorizia – Nova Gorica: Joint Transborder Territorial Planning ,Gorizia, University of Trieste Pole
in cooperation with the Province of Gorizia;
3. Processes of Transborder Integration (Gorizia and Nova Gorica), Gorizia, University of Trieste
Pole, 15th January 2005, Round Table organized by the Department of Geographical and Historical
Sciences;
4. Gorizia Nova Model Plan – An Italian-Slovenian Experience of Cooperation in the Making (G.
Battisti), seminar within the course Globalization and European Integration: An Italian Vision,
University of Hannover, 14th May, 2005;
5. Gorizia Nova – Model Plan. Models for the Sustainable Development of the Border Area. Sector
Reports, Trieste, Faculty of Formation Sciences (seat of Via Tigor, 22), 16th June, 2006 organized
by the Department of Geographical and Historical Sciences;
6. Gorizia Nova – Model Plan. Models for the sustainable development in the border area. Summary
Reports, Trieste, Faculty of Education (Technological Pole, via d’Alviano), 8th September, 2006
organized by the Department of Geographical and Historical Sciences;
7. Seminary for staff going to employ the material produced, Trieste, Faculty of Education
(Technological Pole, via d’Alviano), 8th September, 2006 (p.m.) organized by the Department of
Geographical and Historical Sciences.
* Meetings 1, 2, 3,and 5 have been enriched by cartographical exhibitions.

PAPERS AND COMMUNICATION
- Gorizia Nova – Model Plan. Modelli per lo sviluppo sostenibile nell’area di confine. L’area urbana
“Gorizia – Nova Gorica” come modello per l’Europa. I Rapporto. Trieste, February 2004;
- Gorizia Nova – Model Plan. Modelli per lo sviluppo sostenibile nell’area di confine. L’area urbana
“Gorizia – Nova Gorica” come modello per l’Europa. II Rapporto, Trieste, February 2005;
- Gorizia Nova – Model Plan. Modelli per lo sviluppo sostenibile nell’area di confine. L’area urbana
“Gorizia – Nova Gorica” come modello per l’Europa. III Rapporto, Trieste, February 2006;
- Gorizia Nova – Model Plan: The Gorizia – Nova Gorica Urban Area As a Model for Europe (G.
Battisti, A. Battistoni, D. Umek), 30° Congress of the International Geographical Union, Glasgow,
August 2004 (Session: Monitoring Cities of Tomorrow);
- Historical Cartography as a Tool to Study the Urban Evolution: GIS Methodologies applied to
Three Historical Maps (A. Battistoni, O. Selva), 30° Congress of the International Geographical
Union, Glasgow, August 2004 (Poster Session);
- Produzione di cartografia tematica unitaria per le aree transfrontaliere: il caso di Gorizia e Nova
Gorica (M. Mastronunzio, F. Klevisser), XXIX Italian Geographical Congress (Palermo, Sept. 2004);
- Verso una pianificazione integrata in un territorio transfrontaliero. Il caso di Gorizia e Nova Gorica
(A. Battistoni), XXIX International Geographical Congress (Palermo, September 2004);
- La produzione di cartografia tematica unitaria per l’area transfrontaliera di Gorizia e Nova Gorica
(A. Battistoni), VIII ASITA National Conference (Perugia, November 2004);
- Integrazione delle cartografie nazionali per le aree transfrontaliere. Un caso applicativo: l’area
urbana di Gorizia – Nova Gorica (A. Favretto, M. Mastronunzio), International Meeting “Friuli
Venezia Giulia After the Enlargement of the European Union” (Gorizia, January 2005);
- Ditto, with variations, National Congress of the Italian Association of Cartography (Trieste, April
2005);
- I contributi del progetto Modelplan (A. Favretto), Final Meeting of the Transplan Project (Nova
Gorica, April 2004);
- Classification and Thematic Mapping in a GIS Environment. Software Functionalities and
Methodologies Applied to the Gorizia and Nova Gorica Case (A. Favretto ed.), Dept. of
Geographical and Historical Sciences, University of Trieste, Faculty of Science and Technologies,
University of Coimbra, 2005;
- Esperienze di pianificazione territoriale nell’area di confine. Il progetto Gorizia Nova – Model Plan
(G. Battisti, International Meeting “Osimo. International Context 30 Years After the Treaty”
(Capodistria/Koper, November 2005);
- Gorizia Nova: A Binational Urban Area in Third Millennium Europe (G. Battisti), I.G.V.
Conference Borderscapes: Spaces in Conflicts / Symbolic Places / Network of Places (Trento, June
2004);
- Contribution (G. Battisti) to the Round Table “Openings Along the Border”, organized by the
Faculty of Architecture, University of Trieste (Gorizia, Auditorium of Friuli Culture, June 2006);
- Setting up of a web page dedicated to Model Plan, May 2004. A new web page has been
inserted in the site of the University of Trieste, at first on the server of the Gorizia University
Pole, than on that of the Faculty of Education in Trieste. Both under the address
http://scfor2s.univ.trieste.it/scfor/docwww/dsgs/modelplan and through the home page of the
Faculty of Education at the entry Progetto Modelplan, there are: description of the project, list of
activities, programmes of meetings, summaries of papers, texts of the three Reports (2004, 2005 and
2006) as well as a double series of the cartographies derived from the research. An interactive
section with reserved access has been placed at the disposal of the panel of privileged partners.
2. THE REFERENCE SCENARIOS
2.1 THE EUROPEAN FRAMEWORK
In order to evaluate the prospects of the urban area considered, a number of anticipatory scenarios has been
collected concerning the prospects of some key sectors – namely, transport and energy consumption – for the
European Union comprising 15, 25 and 30 member countries, with projections by 2010, 2015, 2020, 202025
and 2030 (cf. Appendix sub 1, Tables 1-5). The picture is completed by an analysis of the structural
evolution of passenger and goods transport in a 25 member Europe. In particular, data on Austria, Italy,
Slovenia, Czech Republic, Poland, Slovakia, Rumania and Turkey have been collected.
For a Europe with 25 members data show a slowing down in the increase rate of passenger transports, the
historical maximum of which should date back to 1995. Since 2000 dynamics have privileged goods
transport with a long wave to last until 2030.
Since 20005 also the goods transport is expected to slow down in comparison with the increase in GNP, a
sign that the “information society” is going to transform the economy of our continent. Within the EU, the
expected increase concerns only the new partners, including those who are still on the waiting list.
They have all experienced significant decreases in the Nineties, but reveal different temporal dynamics.
Considering the goods sector, Hungary and Slovenia should reach the peak within 2010 and then reduce their
rates. Poland, Czechia, Slovakia and Romania instead ought to take off in the second decade. The same
applies to Turkey. which after the boom of the Nineties alternates increasing and decreasing rates at every
turn of the decade.
A factor of the utmost importance for the future of the area considered is undoubtedly the Paneuropean
Corridor No. 5. The socioeconomic characteristics of the Slovenian, Croatian and Hungarian provinces
interested by the Corridor are described by a ISDEE study through a set of 29 indicators concerning their
territorial, demographic and economic profile, human resources, employment, concerns, DIA (direct
investments from abroad) presence.2
In order to better evaluate the position of the Gorizia area in the context of the development prospects
triggered by infrastructural projects linked to the Corridor, 48 territorial districts from Lyon to the Ukrainian
border have been selected. They are administrative units of the greatest detail made available by the EU, of
2 Population, percentage of national total, settlement density, density as against national density, average wages, ratio/ national data, per capita investments, ratio/national data, higher education rate, ratio/national data, employment in R & D, ratio/national data, unemployment rate, ratio/national data, rate of unskilled unemployed people, ratio/national data, number of firms, ratio/national data, firm density, ratio/national data, firm staff, ratio/national data, cumulated DIA, ratio/national data, number of firms with DIA, percentage on total, ratio/national data (cf. C. Campobasso, “Potenziali ricadute socio-economiche in Slovenia e Ungheria nelle aree contigue al Corridoio 5”, in L’Italia, ‘Europa centro-orientale e i Balcani, cit., pgs. 116-128).

the size of Italian provinces: 8 of them are in France, 22 in Italy, 8 in Slovenia and 10 in Hungary. The
values concerning total employment and gdp in the years 2000 – 2003. The results have been mapped (cf.
Appendix, sub 1, Tables 9-13).
The area chosen differs both from the one of ISDEE and from the several configurations reported in the
AlpenCors study, the authors of which underline how in such cases geography is not necessarily that strict.
Since urban and regional development is influenced by pre-existing settlement trends, the area we have taken
into consideration takes on the meaning of “an economic space subject to a gradual process of development
in which interdependence, specialization, dimension and hierarchy change in relation to the setting up of the
infrastructure”.3
In the maps the indicators of the potential commercial traffic which is going to gravitate on the Corridor are
clearly visible. It stands out that Northern Italy is the most productive area in the system. The leading role of
the Milan province is not at all diminished by the new Province of Lodi.4 East of Veneto there is an area with
wide development chances, in which only the Budapest district stands out. Very clear is the development
deficit in the various border areas. Among them, the Gorizia province and the Goriška, as well as the
province of Trieste and the Obalno-Kraška show at the same time low levels of activity summed to modest
dynamics. The challenge is precisely to transform periphery in a new central area, taking advantage of the
shifting towards east of European economy.
The weight and the Economic Trends in the Countries Using the Italian-Slovenian Border Crossing,
considering the foreign trade data in the years 2003, 2005, 2008, have also been mapped. To give a useful
historical reference, a map of the areas interested in the interregional economic cooperation during the cold
war period has also been supplied. It is the first definition of the Alpe Adria territory, at that time limited to
the Region Friuli Venezia Giulia, the Land Carinthia and the Republic of Slovenia. Within its boundaries,
around Gorizia and Nova Gorica, the belt of facilitated trade provided for in the Udine Agreements (about 30
km depth on both sides). Even more detailed, the two areas where the clearing mechanisms have been
enforced until the end of the Eighties, boosting the border economy of both towns.
A picture of the trade trends between the countries interested in the Italian – Slovenian border posts (Table 14, Appendix sub 1) shows that Italy plays a major role, much greater than Russia. The latter however goes on with its international opening at a very lively pace, supported above all by its oil and gas exports. The figures, at present inflated by the high prices of hydrocarbons, should be higher than the expectations we have reported. Considering the need to renew the economic apparatus of this vast country and the relationships between the two countries, this means a growing market for Italian exports, in part over land routes.
3 AlpenCors – Alpen Corridor South, Linee guida per una politica del territorio, Regione Veneto, Venezia 2005, p. 37. 4 If we consider for example the high tech industry, the specialization index for Northern Italy is around 1.8 and 2.5, second only – in the whole area Lisbon - Kiev – to the Switzerland, and like Czechia and some German Länder
Even without considering Russian trade, it stands out that Gorizia lies in a strategic position in the North-
South, East-West relationships. This is mirrored by the growing number of border crossings, which in 2003
almost equal those of the Fernetti border post, about 6 million tons.5
The heart of the former Austro-Hungarian empire – Austria, Czechia, Slovakia, Hungary – taken as a whole
has already higher figures than Italy and, in the former Socialist countries, significantly higher development
rates than its old UE partners.6
Together with Poland, this world increasingly gravitates towards Germany, thus highlighting the
competitiveness which has been troubling Italy since the nineteenth century and which marks the urgent need
for the implementation of Corridor 5 on part of our country. The prospects for the new EU partners, i.e.
Romania, Bulgaria and, in a still far future, Ukraine are of a considerably smaller momentum.7
In this case, the problem is to be seen in the light of the yet unresolved Balkan issue, involving the
“products” of the definitive disintegration of Tito’s Yugoslavia. Beyond the sometimes modest economic
potential of these small countries it is necessary to understand that they play a decisive role in the setting up
of the new transcontinental communication routes future partners are aiming at. These routes are all
alternatives to Corridor 5 and as such could divert the expected flows from the Gorizia area. Considering the
area under study, suffice it to mention the Paneuropean Corridors no. 4 and 7 through Budapest and Vienna,
no. 10 through the heart of Slovenia, no. 5 and 8 ending in the sea. A further diversion of traffic might be the
consequence of the high speed railway lines along the route which has now been decided upon i.e. from
Mestre to Trieste and beyond via Ronchi. Gorizia would thus remain outside the main axis, the one which is
bound to progressively convey the intermodal trade taken over from the road network.
Statistics concerning daily transit at the international border posts in Friuli Venezia Giulia in 2003 are as
follows: Gorizia 2,504 heavy vehicles, 1,194 of which with over 400 km. This means that in future it will be
possible to load 48% of this traffic (considering present data) on high speed/capacity trains, thus bypassing
Gorizia Nova. The remaining traffic, although with a smaller range, would be – considering 2003 data –
5 Between 1996 and 2003 the increase in the goods traffic by land between Italy and the 14 countries of Eastern Europe is around 5% per year (with an increase of 74,1% for land and a decrease of 27,8% for rail; cf. T. Favaretto, 2005). In other words, the whole increase must be credited to the traffic by land, all the more so when taking into account an already outdated, not very efficient railway system. Moreover, the entry of the new UE partners is challenging the whole of the route in several places. For Italy, the critical point is the Mestre link road and it must be said that in 2004 the border post of Dolga Vas, between Slovenia and Hungary, had an increase of 79% for lorries and even more for cars. 6 The estimates of real GDP increase in 2007 are 4% for Slovenia, 2.5% for Hungary, 4.5% for Bulgaria, 4-4.5% for Poland, 5-5.3% for Romania, 5.5-6% for Russia, 6% for Slovakia and 5% for Turkey. 7 Cf. Ch. Sellar, “L’Ucraina in Europa: quale futuro?” in Un pianeta diviso. Contributi alla geografia dei popoli e dei confini,a cura di G. Battisti, University of Trieste, Department of Geographical and Historical Sciences, Trieste 2002, pp. 201-225.

3,161 heavy good vehicles and 1,453 light goods vehicles as well as 9,202 cars.8 It is however a range
covering all relationships as far as the whole of Lombardy and a large part of Bavaria, Austria and Hungary.
It remains now to ascertain whether, and to what extent, these residual flows will be capable of triggering
development processes in the Gorizia area. The answer can only come from the common will on part of the
entrepreneurs to diversify the service offered (see logistic platform) as well as from the ability of the political
class to support the more promising initiatives.
Its transformation from a stop to a crossing (if not a “load breaking”) point repeats in a certain way a
phenomenon happened in the last fifty years in Trieste, where the gradual decline of its emporium functions
linked to the port have changed the town economic structure from a port centre to a “inland” settlement,
leading to a sort of “continentalization” of the town itself..
For Gorizia (and to a lesser extent for Nova Gorica) the shifting of the border is tantamount to a virtual
“moving away from the sea”, seen as a local resource, remaining in the Trieste metaphor. The functions
linked to the border will move farther, reaching the new border i.e. the future eastern border of the EU, at
present the border between Slovenia and Croatia, between Croatia and Hungary, between Hungary and
Ukraine, Romania and Serbia.
As Croatia is going to connect to the UE through an association treaty in a near future, also the Slovenian –
Croatian border is probably only temporary, so that it is already possible to envisage the hypothesis if a
border between Croatia and Bosnia-Herzegovina.
As can be easily seen when reading a common geographical map, the distances between Gorizia – Nova
Gorica and this new set of boundaries prevent the spontaneous establishing of economically significant links
between the existing and the future boundaries. This in turn implies a sudden loss of activity with no
possibility whatsoever for an automatic survival of at least a part of the firms and of the related jobs.
This is the starting point from which to operate in order to prevent the total loss of considerable assets
consisting of investments, relationships and competences now present in Gorizia in just a couple of years
after the shifting of the Community boundaries. As long as the border compels to a stop, it represents a
starting point for lorry drivers, who begin to count the maximum length allowed by law (i.e. 8 hours without
rest) starting from the border line. This enables us to imagine the width - both east and west of the border –
of the trade area now encompassing Gorizia – Nova Gorica..
This way it would be possible to cover almost the whole of Hungary, almost reaching Sarajevo in the south-
east direction and the Milan area to the west.
8 Cf. AlpenCors, pp. 56-57.

As there would no longer be a stop at the Italian-Slovenian border, we could begin to calculate starting from
the first compulsory stop at a border (for example, tomorrow at the Slovenian-Croatian border, the day after
at the Croatian-Bosnian and Croatian-Ukrainian one.
However, to obtain a more precise zoning it is necessary to calculate limits starting from the places of Origin
and Destination of the goods now going through the customs inspection area for transport vehicles. For this
reason we have begun to collect the relative data by tickling off the documents preserved in this structure.
The complexity of the procedures adopted by SDAG has enabled us to rely at present on two sets of statistics
concerning the first eight months of 2002 and 2003.
Anyway, these data are traditionally considered representative of the traffic going through the customs
inspection area. They are then projected on a 12-month period so as to obtain yearly figures. Although
making some reservations about this procedure, it has been decided to use the 2003 data in order to get a
first assessment of the potential in the above mentioned gravitation area.
The result – a preliminary one, as we wish to underline – can be seen in the Appendix sub 1 (tables 15-18).
The result we wish to obtain following this line of investigation – in the hypothesis a stop point near the
Gorizia agglomeration still existing after Slovenia enters the Schengen area - is to test the possibility that
this stop, at first just as a technical one, can be used for an economic exploitation of the goods in transit
(processing, assembling, trade). At the same time, strategic advice could be given for the new economic
dynamics which will hopefully start in the local context.
The first ten goods (in terms of quantity) and further ten (in terms of statistical value) have been selected
among those which have gone through custom inspection in the Gorizia area, both in import and in export,
in the first 8 months of 2003. They are quite poor goods categories concerning long distance trade which
could not easily be exploited in the Gorizia district. Anyway, it has been decided to consider three import
and three export items referring to the bigger quantities: natural gas transported on trucks, paper, raw and
corrugated cardboard (export), firewood, solid sugars and polymers of vinyl chloride (import).
The preconditions are as follows: for exported paper and cardboard, the chance their being used for the
packaging of goods should the hoped for hypothesis of a transformation of the customs inspection area for
transport vehicles into an international logistic platform come true or for recycling activities, in the new
prospects opened up by the redistribution on national ground of the treatment for the different waste
categories, possibly also in the context of a transborder cooperation (cf. the hypothesis put forward for the
Trieste incinerator).
As far as import is concerned, sugars might be of interest for industries of the food sector, which has a
tradition in Gorizia, while PVC could be used as raw material for many products of the plastic industry.
Let us point out that this should be merely considered as a general indication. For the time being it would be
useful just to explore the feasibility of such a procedure, besides the effectiveness of the hypothesis. In the
first place, in fact, the burdensome procedures related to the reading and decoding of the customs data has
enabled the analysis of just 50% of the records.
The goods typology shown in the enclosed Tables – and confirmed by the analysis carried out in the past –
reveals the need of a close scrutiny of the whole goods range to single out the niche sectors and subsectors –
sometimes present just in small amounts - for which it seems feasible to start in situ processing.
2.2 THE TERRITORIAL DYNAMICS IN THE REPUBLIC OF SLOVENIA
The settlement structure in the Republic of Slovenia is one of the two main backgrounds in which the
development prospects of the Gorizia – Nova Gorica urban agglomeration are to be set. The Tables in the
Appendix sub 2 enable the appraisal of the situation existing by 1991, i.e. the starting point on which the
present dynamics in the independent Slovenia is centred.
The image given is that of a mainly rural State, where urban features emerge here and there, along a line
running parallel to the route of the railways lines towards Austria: Lubiana – Kranj – Jesenice (Villach) to
the west, Lubiana – Celje – Maribor to the east. Isolated, the areas of Ptuj and Murska Sobota at the estreme
east, while on the opposite end there are the Istrian centres of Isola and Pirano. On the whole, this settlement
structure has been inherited, directly or indirectly, from the Austro-Hungarian Empire and as such it depends
on its development logic, going back to the second half of the nineteenth century. .
In the eleven years between the two censuses it is however possible to observe a significant redistribution of
population.
Taking into due account the transition from a rural situation to an urban one, in the area between 300 and 350
square kilometres9 it appears clear that almost the whole of the Slovenian territory has reached the stage of
the great transformation and a substantial part of it has overcome this target. Very clear appears a
concentration in the central and northern part of the country, which stretches as an arc between the two main
towns, immediately east of Lubiana and west of Maribor. Although the division in classes seems simplified
and somehow a neutral one, what stands particularly out is the extreme increase recorded over the whole
territorial arc which surrounds at practically 360° the capital city.
Owing to a strongly reduced birth rate and the lack of migration flows from abroad (as has constantly been
the case in Slovenia since the Fifties), the increase in the settled population is an unequivocal indicator of the
9 G. Battisti, “L’aumento della popolazione e la sua concentrazione territoriale”, in G. Corna Pellegrini (cur.), Milano ’50/’70. La trasformazione sociale e geografica del territorio milanese dagli anni ’50 agli anni ’70, Milano, Amministrazione Provinciale 1977.
presence of localized economic processes. In turn, such processes, considering their geographical location,
cannot but be related to the presence of the central pole of what is to be considered as a perfect territorial
system.
In its pattern of metropolitan centre Lubiana is therefore to be seen as the beating heart of the new
independent Slovenia, a regional metropolis which aims at being the “motor” of the national economy. From
this point of view it is possible to recognize the presence, in an outer belt, of two further rings – both
incomplete - of developing municipalities.
This enables us to acknowledge, around the centre concerned, the presence of that typical process of
accelerated urban expansion long known in literature under the name of urbanized region or of metropolitan
region, a sign that the neighbouring republic has decidedly taken the path of capitalistic development,
although without abdicating control of macroprocesses under way in its territory.
In front of this dynamics, phenomena taking place around the other urban poles – Maribor and Koper – are
of course of lesser importance. In this case, we might even argue that there are two different and backward
stages of the urbanization process. In the coast centre of Koper there is the growth of a settlement of a
reduced size at the beginning within a quite wide administrative territory. As is well known, this is the
objective basis for a political case which has been opened at national level on the advisability of
dismembering the municipality in a number of separated districts. As a matter of fact, Koper takes part, as a
driving sector, in the taking off of the whole Slovenian coast, where the concentration area has long been the
coastal space.
Koper repeats then some way the development process that characterized the port city of Trieste some time
ago, grafting on a polycentric structure dating back in ancient times and unwinding in a linear sequence like
the links in a chain. Hence the rise of a new coast conurbation, although of reduced size, which forms the
eastern segment of the wider urban system which has developed since the XVIII century in the middle and
western part of the Gulf of Trieste.10
As such, the Koper area has its own characteristics which makes it differ from the territorial situation of
Lubiana. The latter seems to be more similar to the Maribor “case”. A town in the hinterland, just behind the
Austrian-Slovenian border, the chief town of Istrian Slovenia resembles somehow the situation of Nova
Gorica, being detached from its reference centre – Graz – of which it is demographically and economically
weaker. At present, the distance does not allow to further proceed towards a definition of “couple of towns”
on the two sides of a border which has experienced immediately after the first world war those cases of
10 G. Battisti, “The Coastline Conurbation of Upper Adriatic. Towards Functional Integration at the EEC’s Eastern Border”, Proceedings, 27th Int. Geogr. Congr., Washington 1992.
ethnical cleansing fated to heavily condition the second postwar period in the Istria-Quarnero area. For all
these reasons, the transborder relationships in the area have developed to a significantly lesser extent than
those in the area bordering on Italy.
As a consequence, Maribor is a separate system, with ambitions of economic and cultural development
which not seldom make it compete with Lubiana, as is the case with the university. As happens for Lubiana,
it is possible to observe the presence of an almost uninterrupted development belt, although characterized by
lesser homogeneousness in the rates of demographic increase. All this would lead us to the conclusion that
we are witnessing similar processes, although at a still underdeveloped level from a temporal point of view.
When considering the development of the three aforementioned poles, it is clear that the areas located along
both the east and west land borders are less advantaged. Somehow this seems to be a legacy of the negative
effects caused by the geopolitical location of Slovenia over the fifty years of the “cold war”, locked as it was
between the western block, and for it Italy, on one side and the eastern one, notably Hungary, on the other.
Both areas are characterized by a demographic decrease, a real depopulation along the Hungarian border.
The last data bear witness to the hardships of the processes of economic restructuring both in Slovenia and in
Hungary. This is no doubt going to pose a management problem, as this area will only marginally be eligible
for EU contributions, already being in all respects an “infracommunity” border area.
Less serious seems the situation on the Italian border, where the most critical situations repeat to a smaller
extent the depopulation of the neighbouring mountain areas in Friuli Venezia Giulia.
In this respect, with the exception of the coast area, it is possible to grasp a certain likeness with the western
parts of Poland, once belonging to the Prussian State, now experiencing a considerable delay compared to
the rest of the country.
From this outline we can identify, in the Republic of Slovenia, the existence of a stable development corridor
hinging on Lubiana as a crossroad for traffic (in a wide sense) flowing along the NW-SE direction between
Austria and Croatia, that is to say between a “non aligned” country and the other republics once belonging to
the dissolved Federal Yugoslavia. Besides, it is the historical location of the country during the “cold war”
which best reveals its vocation of link between Central Europe and the Balkan world.
Something similar could be said also about the area centred on Maribor, but in this case the process appears
to be at a still early stage. The situation is worsened by the fact that in this case there is a substantial spill-
over from the central point, whereas, as far as Lubiana is concerned, this phenomenon is quite smaller and a
wholly physiological one.
In the context described, the position of Nova Gorica is rather weak, with a positive dynamics mainly centred
around the small municipalities of Brda, S. Peter and Merna-Kostanjevica and with a link to the Lubiana area

over the territory of Ajdovscina. The town seems therefore to be the terminus of a wide, not adequately
developed, area stretching northwards to the state border. It is however located along the seam of a rather
weak and allocentred development line which is apparently dependent on Lubiana.
2.3 THE TERRITORIAL DYNAMICS IN FRIULI VENEZIA GIULIA
Quite different is the situation in Friuli Venezia Giulia. The reading of the Tables in the Appendix sub 2
leads us to underline a basically static picture of the regional settlement. The single substantial data (with the
exception of the well known case of Trieste) is the decrease in the municipality of Udine, the residential
density of which drops by 5.3% in the ten years 1991-2001, thus bringing the town under the level of
100.000 inhs/sq km. This is however not worrying, in that other districts (Tavagnacco, Campoformido,
Pasian di Prato, Remanzacco, Moimacco) around the town are increasing.
The dramatic demographic drop in the whole mountain area is going on much the same way in the Carnia
and Tarvisio areas, where the only noteworthy settlement is Tolmezzo-Villa Santina. The regional dynamics
appears concentrated on the right side of the river Tagliamento, where a development line can be detected
starting from Maniago and going down toward the Portogruaro area.
All things considered, in the year 2001 only two areas have significant density rates: Pordenone and Sacile.
The dynamics is however centred on a ring of settlements around Pordenone, among which Roveredo,
Zoppola, Chions, Pasian di Prato stand out as the leaders in the development in this area.
Looking eastwards, in the Isonzo area there is a satisfactory dynamics around Monfalcone (Ronchi dei
Legionari, Staranzano, Turriaco) in a handful of small municipalities which, like Villa Vicentina in the
province of Udine, are attracting migration flows out of the major centres of Venezia Giulia. A certain
vitality, although to a lesser extent, can be noticed in the southern Friuli lowlands, short of the lagoon arc,
in Latisana-Lignano, Palazzolo dello Stella – Carlino to the west and Terzo d’Aquileia, Torviscosa to the
east.
Although the mere demographic data cannot certainly be used to put forward final conclusions, it is difficult
not to mention the feeling of disorder emerging from the analysis of population movements in the ten years
considered. Only the agglomerations around Pordenone and Monfalcone show a certain territorial coherence,
in a context characterized by a rather stiff settlement pattern.
In the regional territory there is a widespread urbanization modelled on the neighbouring Veneto, a pattern
still characterized by a limited number of agglomerations hinging on the historical centres now chief towns
of provinces, viz. Pordenone, Gorizia, Udine e Trieste. They are now flanked by two emerging units,
although with limited size. The first is the Monfalcone-Ronchi conurbation, small from a spatial point of

view but far from negligible as to population and settled economic activities. The second is the area of the
Mideastern lowland, still at a primitive stage from a spatial viewpoint but endowed with interested dynamics.

3. THE ENTRY OF SLOVENIA IN THE EU: THE AREAS CONCERNED
3.1 THE REFERENCE MACROAREA
The Table Density of population in Friuli Venezia Giulia and Slovenia allows now a comparison between the
territorial situations on the two sides of the border at the beginning of the third millennium. The
complementarity of the two areas is clearly visibile: on the one side a ripe territorial structure, characterized
by the final stage of a process of territorial concentration going from inland to coast counters a substantially
balanced distribution testifying the presence of a genre de vie now almost everywhere at urban levels in the
Slovenian territory.
If the expansion of the tertiary industry has already absorbed this country as well, in Friuli Venezia Giulia
the process has led to the emerging of very high urbanization levels. We are confronted with two situations,
typical of different and subsequent stages in the evolution of a territory with some analogies in the
development of the Slovenian coast area, in turn closely following the previous dynamics of the Trieste area
to the south-west and north-west the reduction of population along the mountain side of the border belt.
This image enables us to put back into perspective the judgement on the Upper Isonzo Valley which might
have been put forward on the basis of the cartograms previously examined and even to conjecture a possible
osmosis between the population on the two sides of the border.
A deeper analysis of the issue can be gained through the examination of the age pyramids. The old age index
highlights a certain heaviness spread along the whole western border arc of Slovenia, as if to foreshadow a
structure which was typical of the old Littoral Austrian province. The geographical distribution of the index
of demographic dependency tends to worsen the picture outlined by the old age index in the mountain areas
Friuli Venezia Giulia. The index of the active population structure as well presents a difference among the
two scenes clearly corresponding to the different duration of the processes of economic development. As to
the index of turnover of the active population, the situation is in both cases characterized by a worrying
ageing of the working classes which casts long shadows on the sustainability in time of the activity levels in
the territory and might have a negative impact on the development processes under way.
As to the territorial distribution of dynamics, Slovenia shows interest in a development involving the
territorial arc stretching southwest of its chief town; possibly overturning the historically consolidated
situation, it would express a sufficiently balanced territorial policy. The same applies to the Maribor area,
while the Koper area plays a particular role. Friuli Venezia Giulia shows a much higher level of entropy,
where positive elements are concentrated in the Pordenone lowland, where the foreseeable linkage to the
development axis towards Portogruaro shows the possibility of an integration even at the level of
development models with the neighbouring region Veneto.
Standing by tradition, the comparisons have been repeated enlarging the perspective to a reference macroarea
including the Istrian County in Croatia. The resulting situation is the peripheral character of the latter. A
similar situation – linked to low levels of economic activity, save isolated exceptions on the western coast –
emerges from a more detailed analysis limited to the two statistic regions of Goriška and Obalno Kraska in
Slovenia, using for the former Yugoslavia territories demographic data at the level of local settlements.
Another research, extended to the west in order to include Veneto, has enabled to schematically represent
urbanization models in the two Italian regions and in the Republic of Slovenia.
3.2 THE GRADUATION OF AREAS
Before tackling the question of the area surrounding the towns Gorizia and Nova Gorica it is necessary to
decide how to define these towns, or better, the town already made up of the union of the two adjoining
centres.
Here comes up again the unresolved question of the polymorphic nature of the urban concept. It has found a
great number of answers in literature, each of them functional to a given definition of the problem. On one
side there are those who tend to privilege the physical fact of an uninterrupted built area, on the other those
who favour the entity of relationships between detached settlements.
Just a rough summation of the two major municipalities facing each other along the border would give a
seeming balance as to population (more than 35,000 inhabitants on both sides according to the last census).
The result, as mirrored by cartography, would however be extremely unbalanced considering territorial
dimension and spatial structure of the whole settlement and consequently of its economic activities.
It would in fact be a twofold mistake, in that besides connecting urban zones with a vast, still rural,
surrounding area, wide urbanized areas belonging to minor municipalities along the border would be left out.
Were the latter also included, as in Table 10, we would have a maxiarea of 294.3 sq km with almost 83,000
inhabitants: a less excluding entity, but an exaggerated one from a spatial point of view.
A dimensional rearrangement of surfaces, be it as it may, cannot have an easy solution. The municipality of
Nova Gorica stretches over 309 sq km, over 7 times Gorizia (41.11 sq km). In Italy, only the province of
Gorizia would have an administrative area of a similar width: it has anyway 466.02 sq km (50% more than
Nova Gorica) and four times as much population. Setting aside the different political-administrative status,
such a solution would convey the image of an annexationist will, so that not even a technical hypothesis in
this direction would make sense. The only neutral fact would be the number of settlements – 47 in the
municipality of Nova Gorica, many more in the 25 municipalities of the Province of Gorizia. It appears
unavoidable to go back to maps trying to cut out areas from each side of the border liable to be compared.
A possible solution is presented in the Table Gorizia – Nova Gorica: summation of functional areas. Taking
into due account that the urban settlement of Nova Gorica has coordination and public service functions for
the whole of the Goriška area, it undoubtedly has the same functions for the other 46 settlements of the
municipality. Now it is necessary to find an area gravitating for similar reasons on the urban centre of
Gorizia.
A solution can come from the service area of the Centre for Employment in Gorizia, coinciding with the Alto
Isonzo District of the Autorithy for Social Services No. 2, i.e. 16 municipalities with 71,011 inhabitants (end
2004) and 219.18 sq km. Together with the municipality of Doberdò, we would have the area of Gorizia
School District thus totalling 240.03 sq km and 72,469 inhabitants. Such a surface could be compared,
although the population is twice as large. There is no doubt that from the viewpoint of the areas interested in
Slovenia’s entry in the EU the two areas considered could be the core of one district which - naturally united
by the gravitation along the hydrographical track of the Isonzo river – could be the reference point for a
territorial reorganization of urban services around the two towns. Due to territorial contiguity the
reorganization should also include the Slovenian municipalities of Kanal, Šmartno, Miren-Kostanjevica. We
would thus obtain a quite compact area, with our town as its barycentre.
3.3 THE REFERENCE URBAN CENTRE
In order to come to a first definition of the reference urban centre a practical, albeit clearly imprecise
solution has been chosen. This is just the beginning of a discussion which is not likely to come to an early
conclusion since its scope goes well beyond the academic world.
The Table Gorizia Nova: settlement density per districts in Gorizia and Nova Gorica places singles out a
group of contiguous areas with high density which covers almost the whole municipality of Gorizia and 50%
of the local settlements on the other side of the border.11
Here the disorganized character of the settlement system can be clearly seen. It is a historical heritage linked
to morphology. Note the interruption (actually, a neat margin) of Mt. Sabotino and, in Slovenian territory,
the Panovec area which separates Solkan – Nova Gorica – Kromberk from Šempeter–Vrtojba. Clearly
legible is the pattern of rural settlements, which in turn have benefited by several development chances
arisen in different ways and times. In the chosen graduation the discriminant value has been set at 351
inhs/sq km, certainly taking into account an urban context. The resulting urban centre is quite a compact one,
aligned along the SW-NE direction on the two sides of the border and surrounded by a belt of territories in
transition from rural to urban. Not far away, a ring of minor centres. In a clockwise direction, the “cluster”
Miren – Orehovlje – Bilje, immediately to the south the historical town of Gradisca, on the right bank of the
11 Cf. chapter 6 to see why districts in Gorizia, and local settlements in Slovenia, have been chosen.

Isonzo river, the built-up area of Dobrovo in the Slovenian Collio, the town of Kanal to the north and the
village of Dornberk to south east. They are the boundary of a territorial system which still has a high
percentage of nature such as to act as a “buffer belt” for the future expansion dynamics of the urban core.
The latter has mature characters, having much many times more than 1.500 inhs/sq km in the town districts
Centro, Montesanto-Piazzutta, Straccis, Campagnuzza and S. Rocco–S. Anna in Gorizia and in the
settlement of Nova Gorica.
All this proves very effectively that Gorizia Nova is one town, not only a urbanized area with conurbation
processes.
Looking at the neighbouring districts it can be seen that the dynamics under way in the Municipality of Nova
Gorica will soon lead to the creation of a high density ring (>500 inhs/sq km) around the main settlement,
only limited by the political will to safeguard areas with a high environmental value.
This model is typical of a monocentric urban area, in which the real heart of the system – although it might
sound as a paradox – is the border line. The soaring density profiles approaching the centre is a characteristic
of growing towns, so that we are far from the phenomenon of the metropolitan growth as is happening for
instance in Trieste and Udine. This is in line with the present stage of the life cycle of middle-small towns
which can be observed all over the industrialized world. Thanks not only to their quality of life and the
reserves of productive factors, the free space available for house building projects and the assets in terms of
human and financial resources but also for the greater efficiency of the available services they are the
privileged targets of migratory flows of manpower and capitals. This gives good reasons to hope in a good
future for this community.
Moving from central areas to the whole of the area characterized by high density values and taking as a
dividing line the threshold of 351 inhs/sq km it is possible to attempt a first proposal to mark the boundary of
the territory around the border to be subjected to a joint or at least negotiated planning.
The result can be seen in the Table Gorizia Nova. Hypothetical Boundary of the Joint Planning Area. It
shows that the management of the territorial evolution process implies the participation of at least 4
municipal bodies: Gorizia and Šempeter-Vrtojba for the whole of their territory, Nova Gorica and Miren-
Kostanjevica just for a part of it. This entails a much more complex problem than the simple cooperation
reached up to now, especially because Šempeter-Vrtojba has belonged for some time to the municipality of
Nova Gorica. To take into account also the evolution, under way both in Italy and in Slovenia, of
relationships between local authorities, it is necessary to refer for the Italian side at least the municipality of
Savogna d‘Isonzo, which in its northern area shares with Gorizia the airport zone and the planned industrial
area. For the Italian side, it is necessary to refer to the new-born municipality of Renče-Vogrsko, no longer
belonging to Nova Gorica after a referendum (March 2006) which will be enforced in January 2007. The
area would then have 71,311 inhabitants(of which 33,922 in Slovenia), distributed on a surface of 13,477 ha
(of which 8,457 in Slovenia), with a density of 529 inhs/sq km (in Slovenia: 401.1).
The choice made enables to: a) consider the whole area the density of which is undoubtedly a urban one; b)
interest the whole transborder belt; c) leave adequate expansion space to the urban centres both in Italy and
in Slovenia; d) solve the problem of the areas with joint planning in Italy, in particular safeguarding the joint
management of the industrial zone and the airport area, in the municipalities of Gorizia e Savogna d’Isonzo;
e) reconnecting all the administrative units derived from the municipality of Nova Gorica; f) to interest a
satisfactory port of the Municipality of Nova Gorica (3,415 ha over 11,109).

4. THE FUNDAMENTAL ELEMENTS OF THE SOCIOECONOMIC FABRIC
4.1 THE DEMOGRAPHIC BALANCE
A comparison between the populations living on the two sides of the border is bound to supply relevant
information. The first impression is basically that of a certain balance between the two communities, both at
the level of a wide area and at municipal level. An analysis of the province of Gorizia and the statistic region
of the Goriška shows that the population of the former – on a significantly smaller surface – outnumbers by
12% the population of the latter ((136.491 inhabitants, as against 120.186 in 2001/2002 censuses). At
municipal level there is instead a slight predominance of Nova Gorica, always on a wider area (36,355
inhabitants as against 35,667).
The impression is that population is concentrated on the Italian side, while surfaces are wider on the
Slovenian one. The analysis of the age structure some years later does not support this conclusion, as the
demographic prevalence west of the border is to be entirely ascribed to the older classes (40 years upwards).
The segment “65 years upwards” alone (23.23% at provincial level at the end of 2004) accounts for 60% of
the surplus. Its contribution to the economic life of the territory comes down to a consumer role and is going
to disappear in the next 10 years owing to natural causes.
Let us recall that at the end of the Nineties the life expectancy at birth in the Province was 75,4 for men and
81,2 years for women, roughly in line with regional data (75,4 and 81,7 respectively).
We are already suffering under the consequences of this situation, for instance through a streamlining of
hospital services which are increasingly turning towards health care. There is anyway more at stake, since
the progressive reduction in the adult population is bound to trigger a vicious circle with negative effects. On
the one hand it implies a reduction in the demand for public services with an initial increase in the per capita
expenditure, followed by a reduction in the number of users. On the other hand it causes a standing reduction
in the yield of taxation due to the decrease both of the amount of pensions and of consumes (combined effect
age plus death rate). The question is not a new one: it is the leitmotiv of several alarming statistical analyses
concerning both national and EU level. Cf. the research of the Berlin Institut für Bevőlkerung und
Entwicklung.12
From the point of view of the territorial management it is also necessary to consider that an increasing
number of housing facilities are no longer occupied as a consequence of the massive disappearance of certain
age groups. On the one end this is bound to reduce the housing pressure, while on the other a considerable
12 S. Krőhnert, F. Mediens, R. Klingholz, Die demographische Lage der Nation. Wie zukunftfähig sind Deutschlands Regionen?, D.T.V., München 2006; cf. also H. Birg, Die demographische Zeitwende. Der Bevőlkerungsrückgang in Deutschland und Europa, C. H. Beck, München 2001 (4a, 2005).
reduction in the real estate value is to be expected as a consequence of a sinking demand. Not always can
such effects be clearly foreseen, since they are disguised by inflation and other factors. We have to consider
that real estate value are the basis on which lies the ultimate solvency of financial institutions and the
property of Public Authorities, especially those concerned with social security.
This causes automatic reactions trying to support the market despite a high number of empty housing units,
as happens for example in the bordering town of Trieste.
The solution many are proposing, following foreign experience, is of course immigration. This process has
been under way for a long time both in Italy and in the area considered. At province level, at the end of 2004
there were 6,201 foreign residents, with a 15.5% increase on the previous year. It is a significant number,
above the regional average, the second highest after the province of Udine (+20.78%). 37% of these new
inhabitants of Gorizia (2,297) live in the town itself, where the increase is more moderate (+9.75%). There
are even larger increases in Monfalcone (451 units, + 28.76%) and Ronchi (45 units, +16.19%), where the
demand of manpower is of course greater.
Taking into account a very low dynamics in the bordering municipalities – in San Floriano and Savogna
there is a decrease – it is easy to understand how the arrival of immigrants, foreigners included, have greatly
counterbalanced the decrease in population, and more than that, has been a consequence of it. The decrease
is however extremely high: 14.6% as against a maximum amount of 42,778 (census 1971).13 At province
level the maximum amount goes back to the 1981 census (144,726 inhabitants). The decline begins in 1982
and continues until the end of the Nineties, then there is a reverse dynamics.
Let us however not forget that recent ISTAT predictions14 envisage a decrease in population from almost
58.5 million (January 2005) to 52 million by 2050. And this taking into account foreigners (1,334,889
according to the last census).15 The decline is expected around 2010. The strategical data to be considered is
therefore the birth rate, sunk in the last forty years from 2.41 children per woman (census 1961) to 1.33
(estimate 2004), to be compared with the aging and dependency rate (see Appendix, Tables sub 4.9).
The issue of immigration in a border area which has been defined as recently as thirty years ago through two
world wars followed by a “cold war” is a very delicate subject indeed. The entrance of Slovenia in the EU is
an event of historical importance, the only capable of giving a new stability to the region.
13 As a matter of fact, the registry offices of the municipalities show a maximum of 43.918 at the end of the Seventies: this would imply a decrease by 17%, but it is well known that one of the census purposes is to verify situations which sometimes are not updated. On the same basis, there would be a maximum province population of 145.435 inhs. as average in 1972-1974 (cf. Socioeconomical analysis of the Province of Gorizia). 14 Cf. L’Italia in cifre, ISTAT, Roma 2005. 15 But by 1.1.2005, according to ISTAT, in Italy there were about 2.7 million foreign residents, which would probably double every three years (cf. Fondazione ISMU, Undicesimo Rapporto sulle Migrazioni 2005, F. Angeli, Milano 2006, p. 33.

In the demographic context expounded before, the principle of communicating vessels enables the
spontaneous activation of a population flow from the Slovenian to the Italian side. As for the composition
per nationality, at the end of 2000 the 71.4% of the foreigners living in the province was made up by people
coming from countries outside the European community, and as many as 60.5% come from the 5 republics
born of the dissolution of the PFR of Yugoslavia. However, only 12.7% (443 units) were of Slovenian
nationality.
The numbers does not change significantly over the following years, so that no significant flow of Slovenian
citizens towards Italy is to be expected. There are several longstanding causes: the differences in the cost of
living, the situation of the labour market in both countries (the unemployment rate in Slovenia is very much
the same as in Friuli Venezia Giulia) and finally the demographic dynamics, which also in Slovenia is not
such to favour a surplus of manpower eligible for emigration. Moreover, after the entrance in the EU the
emigration to Italy is no longer attractive as it used to be, i.e. to take advantage of a market economy.
The needs linked to a further economic take-off of the middle-upper Isonzo valley and the contiguousness
between the urban settlements of Gorizia and Nova Gorica make a possible change in residence less
attractive. As a matter of fact, to live in Italy it is sufficient a transboundary commuting such as the one
which has developed in time and which interests, more east, also the towns of Trieste and Koper. Up to now,
limited movements, as can be seen by the decreasing dynamics of movements at border posts (cf. Tables 1,
2).
In this respect, the new element is the abolition on part of Italy (July, 2006) of the suspension on the free
movement of workers coming from the new EU partner states. This will enable the regularization of the
cross-border commuters, who will abandon unofficial work thus contributing to the formation of a common
labour market.
4.2 THE SOCIOECONOMIC CONTEXT
To restart a stagnating economy with several symptoms of decline, plans are required which introduce new
dynamics able to modify existing trends.
Among the three classical economic sectors, agriculture is less and less interesting for community policies as
a consequence of the new horizons opened up by globalization. Anyhow, agriculture is not a significant
sector for urban economies, with the exception of structures specialized in collecting and preserving products
or in the wholesale trade over long distances, which is only marginally the case in Gorizia.
Until a couple of decades ago, industry was a leading sector in urban growth, but is now in a sluggish phase
as far as Gorizia is concerned. The potential of the town has been absorbed long time ago by the
development of Nova Gorica and Šempeter-Vrtojba. In the meantime, these areas have reached in turn the
saturation level, also owing to globalization. Since mass production is being transferred to developing
countries, it is not possible to hope for a significant industrial development in areas lacking all productive
factors: plenty of capitals, low cost manpower and land as well as the willingness to pay in terms of
environmental degradation.
Only the tertiary sector, a many-sided sector which has always been a characteristic of urban settlements, can
therefore yield significant results in terms of turnover and jobs.
Bureaucracy, both public and private, is not likely to produce a significant increase in activity, since the
demand for office staff has sunk after the widespread introduction of informatics. Considering, at least on the
Italian side, the growing burden on national budget, a real increase in recruitments appears improbable. The
Gorizia area, in demographic terms, being the smallest Italian province, it cannot hope in the creation of new
institutions. Moreover, the entry of Slovenia in the EU and, what is more, in the Schengen system16 as well
as the new currency (euro) imply a staff reduction in all those areas (surveillance at border posts, military
defence of the border, customs control, treatment of goods transit documents etc.) which were once
considered essential for both communities.
The data supplied differ, but on the Italian side this would mean the loss of about 1,000 people (defence
soldiers and civilians, 17 policemen and customs officers, moneychangers, staff linked to the transport of
goods on trucks and services for retail and wholesale trade). These data mirror the reduction, partly
experienced since the Nineties, of the typical sectors of a border economy: defence, customs, customs
inspection area for transport vehicles, international trade.
The reduction affects of course also the Slovenian side, but to a lesser extent in proportion to the population,
the different importance of the border (on the Italian side the military apparatus was meant to be able to repel
an attack by the Warsaw Pact since Italy, within NATO, had vouched for Yugoslavian independence), the
different development level of the institutions in a semi-planned economy.
The return to a market economy, with the ensuing liberalization of private initiative, also implies an end to
the traditional position advantages enjoyed by Gorizia retail trade, as had happened in Trieste.
The relevant data, concerning retail shops show a downturn in the number of firms (from 790 in 2002 to 774
in 2005) with a constant increase in sale surfaces (from 47,249 to 53,921 sq m), a clear sign that a
restructuring of the trade network is under way.
16 The date has not been fixed yet. 17 In 1996 the Brigade “Gorizia” has been disbanded, with a loss of about 300 units.

4.3 THE ECONOMIC AND EMPLOYMENT STRUCTURE
The per capita income is a very good index to estimate the wealth and the economic development of a
country. According to 2002 data18 Gorizia ranks twenty-sixth among the 103 Italian provinces with a per
capita income of 22,041.42 euro/year corresponding to a quality of life well over the national average. In the
following years the data are however less favourable.
An ISTAT study19 has drawn an economic map of Italy in terms of economic development and productive
structure splitting the peninsula into six blocks, each containing groups of towns characterized by the same
economic and social profile, analyzing from demographic and production data to data linked to people’s
income and savings, from consumption and employment level to the role played by the large-scale retail
trade.
In this framework Gorizia ranks first in the first group, named “rich and industrious Italy” together with
other 39 provinces, most of which in the Middle and Northern area with a third of the national population.
The high value of the economic indicators, all above national average, show that the 28 Northern regions
grouped in this class represent a rich and not very urbanized country, with low levels of tertiary industry but
considerable percentages of jobs in the industrial sector, high employment rates and high savings, with less
importance of the agricultural sector but a noteworthy percentage in the large-scale retail trade.
In the year 2004 as well, following the trend of previous years, entrepreneurial initiatives in the province of
Gorizia have increased. There have been 860 new firms, with a birth rate of 7.3%, as against 709 closures,
with a death rate of 6.1%.: a surplus of 151 firms, with a 1.3% development rate. Data without agriculture –
which has had a balance deficit ever since 1998 – would give a surplus of 184, with a 2.2 % development
rate.
At the end of 2004, owing to in- and outflows and to variations, there were 11,871 registered firms, i.e. 152
more than 2003. More important still, to follow the dynamics of economic activity, data concerning active
firms: 10,481 at the end of 2004, 83 more than 2003; the activity rate, that is the ratio between active and
registered firms, was 88,3%.
After disaggregating data, a particularly active role is played by the trade sector, and in it by retail trade both
in the town of Gorizia and in Nova Gorica, traditionally linked to this activity which accounts for 15.5% of
the 28.8 percentage of the sector in the whole province. Production as well covers a good part of the activity
in the province, which has 12,270 people working in 1,173 firms. The agricultural sector, although
constantly declining (from 2,826 firms in 1990 to 1,678 in 1999) still has 2,414 active people. Over the
whole of the region there are almost 35,000 firms, with a decrease by almost 40% against 1990 data. 18 Go.L.D. Observatory. 19 Go.L.D. Observatory.

The tertiary sector is on the whole the prevailing one, with a relative specialization in the traffic system and
then in tourism. The classification would therefore be slightly different when considering only active firms:
28.4% in trade (and 15.9% retail alone), 14.2 both in building industry and in agriculture, 12.1% in
manufacturing industry.
A sector comparison between data of the added value in the province also highlights a great development of
the tertiary sector. In the province of Gorizia 76.2% of the added value in 2003 is to be ascribed to services,
ca, 5 point above national and regional average, which in turn conceals a deep unbalance between Pordenone
(59.4%) and Trieste (83.1%). Agriculture is always a marginal sector (2.1%), although with a slight
improvement as against previous years.
One-man businesses, which in 2004 were 57.9% of registered firms and 64.8% of active firms, still are the
most striking phenomenon, in absolute and percentage values, both for new entries (583, i.e. 67.8% of the
total) and closures (530, i.e. 74.8%). The companies boast the highest development rate (3.8%) deriving from
a 7.7% birth rate and a 3.9% death rate, while partnerships and one-man businesses have a 0.3%
development rate. Let it be mentioned, however, that little more of 2/3 among companies are active.
At the end of 2004, in an atmosphere of economic uncertainty, the increase in the number of firms goes on
totalling 11,871 units (10,481 of which fully active) maintaining the disaggregated percentage which
highlights the clear prevalence of the trade segment..
In the last three years there has been a surplus of firms, especially in the building and personal service
sectors, only partially linked to the technological and informatics tertiary. In order to better understand the
real entrepreneur layout in Gorizia we have to distinguish between firms born out of a entrepreneur turnover
(usually considered lacking in structure since they depend on support actions, are not sufficiently flexible,
yield low profits and have limited development chances) from those born thanks to a renewal in the
productive fabric which are dynamic, innovative and do no depend on external support.
Gorizia has an entrepreneur structure of the former kind. It has the lowest entrepreneur rate in the North East
and only 55% new entries are real new firms, as against 61% at national level. The number of ceased firms
or firms taken over by new investors is instead above average.
Looking down at municipal level, Gorizia data show a total of 2,441 firms, 897 of which with employees;
almost 37% of registered firms rely on salaried employees, while the total number of workers reach 9,990
units with 6,444 employees (in percentage values, over two thirds of the total workforce).
As far as the entrepreneurs’ age is concerned, half of them are between 30 and 49 years old; the two extreme
segments represent ca. 7% each and rest (36%) comprises entrepreneurs between 50 and 69 years.
A quick look at the labour market shows that in the province 78% of working people (43,000) are employees
and it is the tertiary sector which shows a progressive increase when compared to the other economic
sectors.
The tradition of retail trade linked to the history of Gorizia, an emporium centre of the Isonzo and Vipacco
valley, has been releasing crisis signals for a long time. This crisis is due in the first place to a weakening of
Slovenian demand, worsened by the fierce competitiveness of the large-scale retail trade which has
established in the surrounding area. In this respect let us mention that in the near future there is going to be a
market saturation in the range of action of the great trade centres now located in the wide belt linking the
Monfalcone and Udine areas. These considerations bring to light an area, the Slovenian one, which is not yet
developed now but is going to become a competitive market immediately near the town of Gorizia, with its
growing gnp and a positive per capita income.
The Study Centre of the Unioncamere has singled out an indicator of infrastructural assets, comparing it to
indicators of potential demand. The resulting rates of relative infrastructural assets give values of 100 for the
entire national economy and values over or under 100 for territories with more or fewer relative
infrastructural assets compared with national average. Comparing levels of average infrastructural assets in
2004, the province of Gorizia has a very good rating, with average infrastructural assets 65.9% over national
average (42.1% excluding ports). Deficiencies are reported only as far as the motorway network is concerned
(which has been improved, but not as much as the exceptional increase in goods and people traffic would
have required) and in a particularly serious way sanitary structures and education. As a matter of fact, the
road system has several weak points, above all because it has to absorb commercial traffic: the Gorizia-
Udine and the Vallone main roads are clearly saturated. The lacking adjustment of the slip road and not least
the problems of the Mestre by-pass cause serious consequences for our province too. The railway network is
up to now not much used, although the system can also rely on the infrastructures of the railway
terminal/interport Cervignano del Friuli, and the airport in Ronchi dei Legionari is only marginally used for
commercial purposes (little more than 700 tons). The enlargement of the European Community poses
however new problems, and offers new prospects, as far as transboundary infrastructures are concerned,
from the reconversion process of Gorizia customs inspection area for transport vehicles to plans concerning
Corridor no. 5. Compared to the situation in the Nineties, Gorizia has however been able to hold the position
reached.
As far as Nova Gorica is concerned, the economic development has not been constant in time and the
mountainous area in the north has weighed on the development of the whole region. The alpine range and the
wide valleys typical of the area have promoted tourism, local wines, and dairy production, possible in
pasture land.

But when considering the economic and cultural development in Nova Gorica and surrounding settlements
we are faced with a different situation. Here there has been a development linked to industrial activities
concentrated in the hinterland which have in turn triggered a chain reaction through the production in the
only three key sectors for the development of local economy: production of instruments and electronic
components, food and drink industry, furniture and wood products.20 Thanks to its geostrategic position and
the proximity to the industrialized cities in North Italy, the Goriška region aims at a wider development in
the service sector, which has already yielded very good results in terms of regional gross product. The border
has also contributed to a general development thanks to the transport and logistic system, through Italian and
Slovenian firms which have been working on both sides of the border up to the declaration of free exchange
which has formally taken place on 1st May, 2004.
Over the years there have been several development initiatives in common projects between the two border
systems aiming at creating small and middle firms. They have been however hampered by the lack of funds.
At present, according to data21 Slovenia is the first for active population on its territory (27,841 employees
as against 4,511 looking for a job).
All in all, there are 812 firms in Nova Gorica (the same as in 2001), while there are 10,114 employees (a
slight decrease compared with the previous year) so that the workforce in the area totals 10,401. In the case
of the Slovenian Gorizia, too, the most represented activities are those linked to trade besides those
dependent on tertiary services and manufactory activity. The entrepreneur structure as well is mainly based
on the activity of small firms flanked by great companies, which on the whole are quite rare.
As for the tertiary functions, Nova Gorica is for Slovenia a centre of mesoregional level. Its gravitation area
covers the whole Isonzo valley, i.e. the whole of the Goriška as well as the Municipalities of Komen, Vipava
and Ajdovscina, while Cerkno e Idrija are under a joint influence.
The population served is estimated (1999) in 114,042 units with just a slight decrease in comparison to the
estimate made by Vrišer in 1990 (118.261). The position is confirmed by a contemporary survey according
to which the town is on the second level (immediately after the capital town, in a ranking of 6 development
levels).22
20 The most important industrial activities in the whole administrative region of the Goriška are: Iskra Avtoelektrika, HIT, Primorje, Fructal, Salonit, Eta, Kolektor, Hydria, Meblo, Textile Ajdovščina, Alpkomerc, Salonit, Lipa, AET, MIP. 21 Institute of Macroeconomic Analysis and Development, 2002 22 J. Nared, “The development level of Slovenian municipalities and their development perspectives”, in Geografski Vestnik 2002, pp. 33-46.

On a microregional level, i.e. referring to the most usual relationships, the survey made by Cigale through a
questionnaire in elementary schools23 perfectly coincides with the Slovenian part of the central functional
area of Gorizia Nova (cf. Appendix, n. 16 sub 3).
23 D. Cigale, “Central places in Slovenia and their spheres of influence in 1999”, in Geografski Vestnik, 2000, p. 52.
5. THE ECONOMIC-TERRITORIAL SCENARIOS AND THE DYNAMICS
OF A COMMON DEVELOPMENT
5.1 THE NEW STRATEGIC LINES
The boldest hypotheses for an economic cooperation put forward at the time of the “cold war” – cf. the
document enclosed to the Osimo Treaty in 1976 – was based on a transborder integration founded on an
international division of labour, in turn implying a permanent gap between the two economies. In this case:
the creation of production activities and wholesale trade in situ, both in function of given port terminals.
The globalization now under way for over fifteen years has however reduced productive chances as such in
all European countries with a consolidated industrialization. At the same time, it has altered the
competitiveness of countries joining the EU, which, while increasing their production costs, are reaching a
better productivity, technology and market access.
In this context, mature areas like the Italian Venezia Giulia and the whole of Slovenia (enjoying for several
years a per capita income over Italian national average) have to face the delocation of production as
something inescapable.
Is this true on a macro level, the question is what are the prospects for single areas with competition
advantages. But this is not the case in our study area. The future integration between Gorizia and Nova
Gorizia could have been seen in the past as the recomposition of a fabric which starting from a given
historical point has gone two different development paths, the tertiary sectors as the continuation of
traditional activity for Gorizia, industry as an economic plus ideological choice for Nova Gorica. Summed
up, the two towns would give the image of a potentially well-balanced economy.
The change we are witnessing sees instead the post-industrial moving forward from both sides of the border,
since Gorizia is losing its last productions (industry being now concentrated at provincial level in the
Monfalcone area),24 Nova Gorica is reducing its industrial sector in favour of a developing tertiary sector. A
tertiary sector which is no longer what it used to be in the past, as the two towns no longer are the advanced
posts of two different world but begin to take on a new central position in the heart of Europe. Hence the
need to exploit the prospects of the tertiary sector, especially by means of some significant creations: the
University for both centres, tourism linked to gambling for Nova Gorica and some other projects: the
megacasino in Nova Gorica and the mega stores in Gorizia.
24 cf. § 5.2.

5.2 THE INDUSTRIAL FUNCTION
The distribution of industrial settlements in the Gorizia area is the result of two different dynamics, of which
the former is based on great productive units concentrated to the east of the Isonzo river (shipbuilding, iron,
mechanic and textile industry), the latter, to the west, based on a fabric of small- and middle-sized industries,
which are in fact a continuation of the Veneto and Friuli model also for their typology. With the collapse of
the great concerns triggered at international level by oil shocks, in the ’80 the economic picture has deeply
changed. In particular, the shipbuilding industry as a monoculture in the Monfalcone area has changed
through a process which sees a multiplication of activities, the exit of the state enterprises and a swarm of
activities supported by private initiative, characterized by fewer place restrictions and therefore more
scattered on the territory.
Behind the sector there is, anyway, public support, which for Gorizia means the “industrial free zone”
(1948), the “Rotation Fund for the Development of Economic Initiatives in the Provinces of Trieste and
Gorizia” (1955), the “Gorizia Fund” (1975) and the following “Gorizia Packet” (1986), the “Law on the
Border Areas” (1991) and finally the European Structural Funds (Objective 2), all instruments devoting most
of the allocated financial means to support and develop industries.
To guarantee on the one side economic efficiency, on the other a more satisfactory urban structure, it is
necessary that public policies, especially regional government policies are based on a correct vision of the
territorial size of industrial dynamics.
In a study promoted by the Regional Direction of Territorial Planning two industrial agglomerations were
singled out in the Province of Gorizia, centred on Gorizia and Monfalcone respectively.25 The aggregation
made at the time could be subject to some criticism, for instance for the inclusion of an essentially tourist
resort like Grado in the Monfalcone industrial area, or the lacking awareness of the functional relationships
established beyond the province border, between the zones of Cormons and Manzano (“chair triangle”).
A symmetrical approach can be observed in a recent study of the Province Administration.26 The settlements
chosen are grouped following a criterion of “homogenity” into 4 districts, depending on 3 different sectors.
The Gorizia district (territory of Gorizia: municipalities of Gorizia and Savogna), of Monfalcone
(Monfalcone lowland: Monfalcone, Ronchi, Staranzano, Turriaco, San Canzian and San Pier d’Isonzo,
25 Cf. Il sistema industriale nel Friuli Venezia Giulia, Trieste 1995. At the time the following municipalities were considered all together: Gorizia, Capriva, Cormons, Farra d’Isonzo, Gradisca, Mariano, Medea, Moraro, Mossa, Romans d’Isonzo, Sagrado, San Floriano, San Lorenzo, Savogna d’Isonzo and Villesse, as well as Monfalcone, Ronchi dei Legionari, Doberdò, Fogliano-Redipuglia, Grado, San Canzian d’Isonzo, San Pier d’Isonzo, Staranzano and Turriaco. 26 S. Boato e F. Graziati (eds.), La costruzione del piano territoriale provinciale, Gorizia 2002.
Fogliano-Redipuglia, Sagrado) and in the upper plain: Gradisca (Mariano, Romans, Villesse, Gradisca) and
Cormons areas (Cormons, San Lorenzo, Mossa, Capriva).
The subdivision is based on the characteristics of enterprises (more linked to public support on Gorizia and
Monfalcone), and on the prevailing production typologies (chair production in the Cormons area,
shipbuilding in the Monfalcone area, etc.).
In fact, the spreading of industrial initiatives has lead to a distribution of financial means in relation to each
detailed industrial plan (P.I.P.), so that at the beginning of the third millennium 22 different zones in the
territory of the province had been helped. Considering the spatial dimension of the Province, one may
wonder if a strategy aiming at the productive specialization of single areas has a future without an efficient
local detailed plan (P.T.P.C.).
Furthermore, the high speed of change of industrial systems triggered by globalization is not to be
underestimated (cf. the present crisis of the chair district), so that it seems advisable, also considering the
increasingly important role played by the regional government in the new context of the European
Community, to favour a coordination plan proposed by the same.
In Friuli Venezia Giulia there are at present 12 regional programmatic industrial zones, for which 10
consortia have been created. According to Regional Law 18.1.1999 No. 3 they have been transformed from
local authorities into public economic authorities. Two of them work within the province of Gorizia: the
Consortium for the Industrial Development of the Port of Monfalcone and the Consortium for the
Development of Industry and Handicraft in Gorizia. The former, set up according to Law 6.7.1964 on the
same year, comprises the Municipality of Monfalcone, the Province and the Chamber of Commerce of
Gorizia (with a share of about 90%) and 12 municipalities in the Isonzo area (Ronchi dei Legionari, San
Canzian d’Isonzo, Staranzano, Fogliano-Redipuglia, Turriaco, San Pier d’Isonzo, Cormons, Gradisca
d’Isonzo, Mariano del Friuli, Romans d’Isonzo, Villesse and Doberdò del Lago) plus the Consortium for the
Reclamation of the Isonzo Plain and 29 firms settled in the territory.
The latter was born in 1968, on the basis of regional laws, with the participation of the Municipalities of
Gorizia (42%) and Savogna d’Isonzo (9%), the Province (21%), the Chamber of Commerce of Gorizia (8%),
the Friulcassa S.p.A. (18%) plus 4 firms settled. The total surface (105 ha) is divided into 2 zones, the
smaller of which is already occupied.
On a surface of 85 ha in the south part of Gorizia, between the village of S. Andrea and the Municipality of
Savogna, there are at present 45 firms on 63 ha with 830 employees (December 2005). Of the remaining 22
ha, 5 are still free (and 3 already alloocated), the rest will be used to create a service centre, public parks and

gardens and a service road network. All this on the basis of the Infraregional Territorial Plan of the zone
Gorizia – S. Andrea approved at the end of 2005.27
The Monfalcone area – 527 ha with 129 settled firms altogether – is instead characterized by scattered
surfaces, divided between the Lisert industrial zone, the historical industrial zone of the municipality of
Monfalcone, the Schiavetti – Brancolo area, the Staranzano and Ronchi dei Legionari areas. The Lisert area
spreads over 247 ha (of which 147 already urbanized and 100 available for further settlements). There are 42
settled firms, mainly in the electronics, nautical, electromechanical and plastic sectors. In turn, it is divided
into 3 subareas: Lisert North, East-West canal (seat of the nautical pole), Lisert port (at the back of the trade
yard, housing the firms directly linked to it: transport sector, paper, metal carpentry, chemistry,
thermoelectric plant).
The historical industrial area houses in particular the activity of Fincantieri and Ansaldo, to which a
outsourcing area is linked (interesting the municipalities of Monfalcone and Staranzano) with 59 firms active
in the engineering industry, production of bolts, valves and the like.
This area continues in the Staranzano industrial zone, a handicraft housing 25 firms active in various sectors
(carpentry, mechanic, food, house building industry, services etc,). Since 1985, near the airport of Friuli
Venezia Giulia there has been the industrial zone of Ronchi dei Legionari (3 firms), created at first in
function of the local airport industry.
The coexistence of two consortia for the industrial development not very far from each other, both
significantly supported by the Province Administration, requires of course coordination prospects which
derive from the need to rationalize economic policies and the policies of territorial management.
The ensemble of the interested municipalities is in fact but the anticipation of a chain of administrative areas
liable to accept industrial initiatives according to the requirements of the Regional Law covering the whole
eastern part of the province. From the point of view of a correct management of the territory doubts could be
vented as to an alternation model between residential zones and productive activities which risk repeating the
situation of the region Veneto. On the other side, the need to find areas and the emergence of new industrial
typologies can merge, within a central control, in a way which does not clash with the target of
comprehensive sustainability of the territory.
Both consortia have adjusted their structure according to Regional Law 3/99 and therefore benefit from the
same support instruments. The aforementioned law expresses a logic of cooperation between consortia, since 27 The Plan provides for area for productive investments (industries, small industries) and other strictly linked activities (warehouses, storage, research, technologic equipment), road system, services (including retail sale not over 400 sq m), garden and parks. All in all, the productive areas provided for in the municipal land use plan (PRGC) of the two municipalities are 171.7 ha.

an excessive number of detailed industrial plans would imply renouncing an implementing planning liable to
influence the distribution of industrial investments on a regional level. Such a cooperation can be reached
through the coordination of activities, the joint development of projects or the fusion of the authorities
charged with infraregional planning. Considering the peculiarity of the territory and the fact that the areas are
not adjoining ones, the most suitable instrument could be the setting up of a services company which can
offer a coordinated support to initiatives interesting a district, discontinuous as it may be, of such a size as to
make this service economical.
The Monfalcone consortium, for its part, in a phase of approval of the industrial land use plan (P.T.I.) is
carrying out an intervention policy, within the single relevant industrial zones, aiming at creating a system
together with the territory of the province in the sectors of consulting, research, industrial planning,
marketing. It has therefore seized the chances offered by the Regional Law 2/2002 to operate in the sectors
of energy saving and reduction of environmental impact, even in the management of tourism products.
The present situation has of course a certain impact on this issue. The industrial zone of Gorizia, which is
benefiting from an already approved P.T.I., has practically used up the areas at present available and foresees
to relaunch its activity involving other municipalities.28
A more careful analysis shows that the most suitable surface for a further industrial development could be
found in the area of the “Amedeo di Savoia Duca d’Aosta” airport. This would be an optimal location of a
considerable size (153 free ha, 60% of which in the municipality of Gorizia), such as to guarantee significant
settlements. It is near the two districts of the industrial zone, from which it is partially separated by the
motorway and railway route (so that there would be an easy link). What is more, it is bordering to the west
on the airport. For all these reasons, it would be an ideal solution to give to Gorizia a further, wide-ranging,
industrial space. Hence the “particular favour” of the municipal administration put forward in the Gorizia
2010 document (p. 107).
Beyond any consideration of environmental nature, it is necessary to underline that the population has up to
now fiercely opposed any proposal of change in the use of the airport, and now the times of the “great
industrialization” seem to be gone forever.29
The BIC – Business Innovation Centre – an incubation instrument for innovative production is to be
functionally linked to the Gorizia industrial zone, cf. at § 5.3 the opening of the Area Science Park. Settled
in the customs inspection area for transport vehicles, from 1995 to 2003 it has attracted 27 initiatives,
creating 181 new jobs. Nine of them, with 115 employed people, were still active, occupying over 90% of
28 The PRG in force provides for a new industrial zone in Lucinico, supported by the implementation of a new linkage to the road and motorway system. 29 On the prospects of reuse of the area concerned, cf. the Tables in Appendix sub 6.
the available space (2,900 q m out of 4,400). Investments on innovation are vital in a context in which there
is no clear vocation towards specific sectors and the existing structure – about 200 firms with around 2,600
employees, only partially belonging to the manufacturing sector in the strict sense30 - appears to be tilting
towards mature sectors. Hence the hypothesis concerning the creation of a textile pole to somehow help this
crisis sectors, as well as a food pole based on the potentiality of the territory.
The picture comprises service activity, more than real production. Here again comes to the foreground the
increasingly strong shift to the tertiary sector in the chief town of the province already hinted at in the
previous paragraph, a situation that in this context appears as the cornerstone of a planning activity for the
Slovenian territory.
On the other side, the size reached by the Monfalcone area – 556 firms with 11,184 employees in the
municipalities belonging to the Consortium (data 2001) in a context of production diversification witness a
consolidated situation revolving around the shipyard town.
Should we identify, according to the district logic sponsored by the Italian economic school, the Cormons
area, parameters would but slightly differ: 67 firms with 1,166 employees, that together with Capriva, Mossa
and San Lorenzo would bring to life a local mini-system of 94 firms and 1,549 employees.
5.3 UNIVERSITY AND RESEARCH
Since spring 2006 Nova Gorica can at last boast its own university, deriving from the transformation of its
Polytechnic (only comprising applied-science faculties).31 A historical event indeed, as the newborn
institution is the fourth university in Slovenia after Lubjana, Maribor and Koper, but formally the first in the
area which for the time being has been named Gorizia Nova.
It must be however mentioned that among the 5 courses of 1st level/undergraduate existing at present 3 are
probably going to be transferred outside the town, i.e. two to Ajdovsčina (Viticulture and Oenology, Applied
Sciences) and the third (Environmental Sciences) to Gorizia, so as not to wear the socio-cultural fabric of
Gorizia Nova.
As far as the 5 postgraduate courses are concerned, 3 of them are at present being held outside the area
considered: in Postumia (Karst Sciences), in Lubiana (Intercultural Studies), in Venice (Architectural and
Environmental Preservation).
There are also some courses in Nova Gorica which are held by the local People’s/Open University
(Specialization Master in Management) as well as the European Faculty of Law, recently opened and
30 The data refer to the Municipality of Gorizia (census 2001) and does not include house building and water and energy production. For Savogna there are 15 firms and about one hundred employed. 31 Founded in 1995 as School for Environmental Sciences, it had been renamed Polytechnic in 1998.

autonomously managed, which is starting activity in the academic year 2006-2007 with a teaching staff of
32.
On the Italian side there are the detached seats of both Udine and Trieste University, which have been
operating for about fifteen years, but Gorizia as such has no own university. Its younger sister has therefore
crossed first the finish line. This because the same distance of the two chief towns from Gorizia, summed to
the limited demographical weight of the latter, in fact prevented the creation of a third regional university,
fuelling at the same time a fierce competition between the existing ones.
First came Trieste, and occupied the former Minor Seminary in via d’Alviano, the much younger Udine
university shortly following suit. Udine soon displayed great energy and inventiveness, producing an
extensive range of initiatives met by a considerable success in terms of students enrolled. At first targeting a
mass demand for professional skills, it then gradually opened up to research. On the other hand, Trieste, with
an established tradition of over eighty years and the solid structure of its main seat, has proved less able to
grow locally despite the quality of its didactical offer (see Table 4).
The Authority for University Studies in Gorizia shares out its resources among the two competing
universities but does not rule out the possibility of creating an independent university, for instance thanks to
a possible international initiative. In this framework noteworthy is the activity of the International Institute
for European Studies, a trust based on I.S.I.G. which comprises the two universities in Friuli-Venezia Giulia
and other seven universities in middle East Europe. This institute prepares international experts through a
Research Doctorate and a number of masters, entirely held in English. The recent event of the Slovenian
university being raised to the status of universitas studiorum will no doubt stimulate cooperation and several
initiatives are already under way. For details on the potential of the area served, cf. Table 5.
In addition to the scientific-technological labs in Nova Gorica32, Gorizia Nova can rely on I.S.I.G., a long-
established institution in the field of social sciences, as well as on E.R.S.A. and C.E.T.A. for the scientific
side. The latter is a relatively young, but very active, institution born of the cooperation of the two
universities, joined recently by A.R.S.T.
The quite recent prospects of enlargement and strengthening of the Centre for Theoretical and Applied
Ecology are as a matter of fact linked to the opening in Gorizia of the Trieste-based Area for Scientific and
Technological Research which envisages the creation of a technological pole for the development of applied
research in the room left free by the Business Innovation Centre in the customs inspection area for transport
vehicles. The initiative follows three directions: energy and environment (based on the activity of C.E.T.A.),
32 Two research centres (Atmospheric Research, Environmental and Sport Physiology), four labs (Physics of Cosmic Particles, Environmental Research, Epitaxy and Nanostructures, Multiphase Processes) besides an Institute for cultural studies.

agroindustrial (projects in cooperation with the Institute for Plant Nutrition), and information technology
(CRESM lab of the Marconi Institute). While planning to transfer part of its activity from the Trieste offices,
it addresses new and established concerns both within and beyond the region. The interface with the
concerns, charged with the management of the pole, will be provided by a Centre for territorial exploitation
to be implemented in cooperation with the University of Udine.
Worth mentioning is also the Regional Centre for Agricultural Experimentation, whose vineyard (about 3 ha)
is to be moved, possibly outside the province, owing to the need for business areas to be set up in the
neighbourhood of Viale III Armata. Further, the Observatory for Plant Diseases, also under regional
administration, as well as the Experimental Institute for Plant Nutrition, a peripheral branch of C.R.A., and
the Gorizia labs of A.R.P.A. with a staff of 40, inclusive of 24 technicians.
More details on these structures can be found in Table 6.
University and non-university structures together give an employment figure little short of 750 units (among
which 630 teaching staff); 33 in addition, there are the 29 members of the teaching staff for the Postgraduate
Degree in Viticulture, Oenology and Wine Markets in Cormons, the result of cooperation among the
universities of Padua, Verona and Udine. Altogether, the size of a university of average status with a
satisfactory distribution of courses, covering curricula and branches of the Faculty of Arts, Modern
Languages, Political Sciences, Mathematics, Physics and Natural Sciences, Engineering. A positive factor to
highlight is that, compared with other areas (viz. Pordenone), at present there are no significant course
duplications despite the border.
It must however be mentioned that quite a large part of staff (considering both professors/researchers and
auxiliaries) works for a given length of time; among teaching staff, structured professors amount to about
one hundred people. Since the role of structured, resident staff is of paramount importance for a university
seat to take off, it follows that, despite the multifarious initiatives (house building included), we are still very
far from such a stage. The total amount of students – about 3.350, of which 89% centred on Gorizia
structures – is evidence of yet a limited size, although the economic contribution to the local urban fabric is
not to be underestimated. In fact, this number equals 10% of the population on the Italian side of the border.
The student attraction area, variable in time and according to the different degrees, reaches, as far as Nova
Gorica is concerned, the Goriška, with few arrivals from the rest of Slovenia and from abroad. The planned
opening of detached seats in the Alto Isontino area is probably going to increase the number of students, still
fewer than those in Gorizia despite the consistent number of professors.
33 The figure is rounded up to include all teaching staff of Nova Gorica University, i.e. also those working in other seats.
As a matter of fact, the Slovenian policy of investing in the scientific-technological sector stands out when
compared to the choice of Italian universities to privilege the humanistic-social sector which undoubtedly
attracts the majority of young people. The Slovenian choice is consistent with the growth guidelines originally
decided upon for the local community, but the tenuous attraction towards scientific studies, far from being
limited to Italy, extends to the whole of the Western world, not only Europe. This is going to influence students
of the new university, while birth rate has also stabilized around the figures of the “old continent”.
On the Italian side, we have proceeded to define the attraction area. Data are available in detail above all for
the university of Trieste. As far as the Slovenian counterpart is concerned, considering the limited amount of
students we have defined the area comprising their places of origin as communicated by the university. The
result, in terms of consolidated attraction, can be read in Appendix, sub 3.
As for future prospects, the history of Italian universities (among which Udine is a typical example) shows
that, once attained a certain level of political consensus, independently of the presence of a critical mass in
situ, detached structures ends up severing the link with the main seat. In this case, a long term fusion or at
least an operative joint activity between both sides of the border is highly predictable. The world of science
and culture is by definition international, even leaving aside the EU as a common framework into which this
kind of initiatives can be taken thanks to European financial support.
The three universities give a particular importance, each in a different way, to the learning of languages. This
is an essential factor in a border area which aims at reaching a new unity. At the same time, more attention is
given to fields of research and didactic which can be of interest to the local economic structures.
As for the attraction area, the Nova Gorica plan is but a part of the attempt of this young town to enhance its
service role towards the Goriška and prevent this zone – which some would like to become a political-
administrative region – from gravitating around Koper and being absorbed by the neighbouring Obalno
Kraška. What is sure is that several courses are – and will be - distributed among different seats, so that the
contribution this new-born university can give in the short run to the development of Nova Gorica, if not of
Gorizia Nova, remains questionable.
The choice of Udine to place in Gorizia two courses of high attraction, on the other hand, has moved to the
main town of the Isonzo area a catchment area which would otherwise gravitate towards Udine. Had no
courses been available, all this area had looked upon Trieste, although to a smaller extent owing to the
distance.
Most attractive in geographical terms is however the Degree Course in International and Diplomatic
Sciences opened by Trieste University, strictly linked to the territory’s unique vocation which it highlights. It
has however the setback – which could be considered a quality, i.e. restricted entry. It attracts students from
all Italy and from abroad and can count on a market niche significantly higher than other scientific-
technological courses.
The policies implemented by the two regional universities (Trieste and Udine) in Gorizia reveal attention to
future developments, that is to say autonomy has been neither considered nor prepared. In this regard, the
experience of Udine, where Trieste hat incautiously opened a whole Faculty, has been a lesson. Therefore
only some degree courses have been opened, sometimes belonging to incomplete curricula (only
undergraduate or graduate ones) following the logic of an unfortunate university reform imposed in 2001.
At present. Udine is offering two complete curricula (from two Faculties)34, Trieste just one.35
The articulation, or better, disarticulation of the courses would therefore make a possible detachment of
Gorizia quite difficult. It would affect two universities as well as the future of the university pole created in
Pordenone by the Italian universities.
From another point of view, the demographic crisis in both countries, the crisis of national revenue finance in
Italy and the minimum prerequisites on teaching staff imposed by Italian law might lead within a decade to a
chance of institutional cooperation between the two universities in the region Friuli Venezia Giulia, at
present engaged in a sort of game of chess on the regional area and beyond. The extreme hypothesis, which
might however come true, is the creation of a comprehensive regional university with a polycentric structure,
unifying the whole range of present initiatives.
In the latter case, should at the time be the joint ventures rumoured now, the new university of Nova Gorica
would have to go autonomously its growth path. At present structured in five undergraduate and one
graduate schools, it now offers a variety of complete curricula, of which just a humanistic one. The
supporting structures, such as the Evard Rusjan Foundation and the Primorska Technological Park are being
connected.
Expected numbers are 800 students in 2006/07, 1,000 in four years, reaching 5,000 in a couple of decades.
The determination of the Slovenian counterpart stands out on the background of an uncertain, not
coordinated policy on the Italian side. They have seized the opportunity of starting the first positive
transborder initiative in the sector. Even before being promoted to university, the Nova Gorica Polytechnics
has purchased in Gorizia a building - formerly a secondary school for the Slovenian minority - in which to
place the School for Environmental Studies, maybe as a joint venture with the University of Trieste.
34 Translators/Interpreters and Public Relations. 35 Economy of Tourism and Environment. In 2005/06 the other course – Territorial Policy – has been opened only for the undergraduate course.

5.4 THE RETAIL TRADE ISSUE
In Friuli Venezia Giulia trade accounts at present for 20.5% of the employed, 32.5% of active firms and
16,9% of total income.
At the level of sales points, the retail trade has an average of employed people and produced income per
unity over national average in all four provinces. In spite of all that, there are symptoms of a permanent
crisis, especially among small and middle-sized shops, caused by structural transformations of the sector and
a certain slowing down in the consumption dynamics.
Territorial data have particolar importance. From a structural point of view, the small “neighbourhood” sales
point is still dominating in all provinces. The diffusion of automobiles has given rise, as in the neighbouring
Veneto region, to a widespread residential fabric which at first leads to a multiplication of sales point but in
the long run favours the creation of large structures which gradually interest the areas crossed by the main
roads. The big retail trade counts more and more on the mobility of consumers: in more than 98
municipalities there are structures with more than 400 sq m and 12 commercial centres and complexes.
This of course helps to deprive urban centres of customers and shops, thus causing a change in the settlement
pattern which in the end loses its typical traits to resemble American models. Competition interests no longer
single sales point within the same settlement, but localized integrated systems, sometimes in neighbouring
municipalities.
The General Planning study underlying the Regional Plan for the Large-scale retail trade identifies 22
systems, spread over 41 municipalities, in which concentrate 72% of sales points and 74% of relating
surfaces. The Plan itself lay down its aims of rationalization and development according to the trends
observed in the more advanced regions.36
Starting from the estimated potential market demand 19 municipalities have been selected which have areas
capable of housing up to 21 large-scale retail trade structures, i.e. complexes of at least provincial (from 15
to 35,000 sq m), interprovincial (35 – 45,000 sq m), or international (45 – 70,000 sq m) relevance. In the 9
resulting gravitation areas (cf. Table 20), two of which – Gorizia and the Monfalcone area – interest the
province of Gorizia – 8 catchment areas of potential customers have been identified. Among them there is
not Monfalcone, which already has 2 commercial centres, a great warehouse and 9 supermarkets besides a
hypermarket in Ronchi dei Legionari.
36 The reference territorial system is given by 8 basins encompassing several municipalities (one of which, i.e. no.2, comprises the province of Gorizia), municipalities with over 30,000 inhabitants and those housing in their territory infrastructure with high polarization potentiality (motorway tollgates, border post of first category and assimilated, tourist ports and civil airports, regional fair seats), municipalities included within mono- or plurimunicipal commercial systems defined in the Large Scale Retail Trade Plan (art.8 bis Regional Law 19.4.99 no. 8 and following).

The Gorizia area has been selected for two enterprises, in Gorizia and Villesse. The estimates on the value of
the regional retail market are about 6 billion by 2004 (3.7 in the non-food sector), as follows: 4.7 billion
(78%) from purchases of the residents, 0.7 billion (11.7%) from foreigners, 0.5 billion (8.2%) from tourism,
2% from customers from Veneto. Over 1 billion would come from customers living outside their reference
area: 280 million for food, 780 for non food products. For the province of Gorizia (140,242 inhabitants),
these figures mean 0,256 thousand million for food, 0,375 for non food. The subdivision according to
gravitation areas for the Gorizia area (73,003 ab.) is 138 million food, 201 non food; for the Monfalcone
area (67,239 ab.), 119 million food, 174 non food.
Residents would account for 76% (as against 15% foreigners) for the Gorizia area, 58% (as against 9%
foreigners) for the Monfalcone area.
Starting from the dimensional subdivision of sales points as in the DGR 23.4.99 no. 1278, in the region the
small retail accounts for 23.5% of the surface (20.23 in the food, 25.45 in the non food) and the large-scale
retail trade for 38% (41.30 food, 35.99 non food). The limits imposed by the Regional Plan to the large-scale
retail trades are 65% for food, 60% for non food. For the small retail, the limits are quite low: 25% and 20%
respectively.
Taking into account the critical situations recorded in the territory (food in the southern Friuli Lowland, food
and non food in Gorizia, non food in Trieste) it is easy to understand that we are on the threshold of a social
transformation of historical importance. Everybody agrees with the importance of guaranteeing a minimum
survival to the neighbourhood retail trade. It is vital for the weakest part of population and especially for
aged people, so that the middle sized sector will have to pay for the massive expansion of the large-scale
retail trade. That is to say that class of dealers who work efficiently in the non food sector employing other
people, since the food sector has already reached a noticeable size, particularly as regards cooperation.37
In the above mentioned case of the Gorizia area, the values reported in the General Planning study assess the
market share of small retail at 31.12% (31.98% for large-scale retail trade), divided as follows: 18.08% and
49.39 respectively for food, 31.97% and 24.14% respectively for non food.
Theoretically possible settlements would interest in Gorizia further 7,000 sq m in the food, 12,000 sq m in
the non food sector, in Villesse 3.000 and 63,000 sq m respectively. According to the probable evolution of
the market shares, Gorizia would record, for the non food sector, a reduction by 50% at small retail level and
by over 2/3 at middle retail level, as against an increase by over 70% in the large-scale retail trade. For the
37 Neighbourhood retail sales points (with sale surface under 100 sq m, later under 200 sq m for special cases), middle size (100-800 sq m) and large size sales points (over 800 sq m).

food sector the decrease would be more limited and acceptable, as in this sector the area in very attractive for
small retail. Estimated repercussions in the Villesse area ought to be less worrying.
On this basis, permission has been given to exploit further 6,000 sq m in the food and 19,000 in the non food
sectors in Gorizia and 6,000 and 25,000 respectively in Villesse according to parameters aiming at
preventing desertification effects on the already existent commercial fabric.
However, in view of the limited extension of the territory considered, there is going to be not only a
competition among structures of different typology and dimension but a real war among great concerns.
Consumer-related figures (potential catchment areas) cannot in fact be summed up. As all commercial
structures are more or less aligned along the A4, it is quite easy to foresee competition among the structures
of Trieste-Muggia, Monfalcone Villesse, not mentioning the southern Friuli lowland or the Udine area.
Without commenting on single initiatives, it can be said that the development expected for the Gorizia area
are around 12,000 sq m in the food, 44,000 in the non food sector, almost the same dimension in the Trieste
area, where the choice of the Muggia location let us imagine a deliberate attempt to drain the flows of Trieste
customers and the hoped for future customers from Slovenian and Croatian Istria. In the latter case it must
however take into account the consequences of the present development in the retail system, especially in the
town of Rjeka/Fiume, where Italian intrapreneurs are literally replicating the biggest Trieste commercial
centre.38
The case of Rijeka (but also that of Lubiana) shows that it is right to suggest caution as to the expectations
concerning customer flows along the East-West direction.
If, in fact, the expected increase in the families’ income is going to lead to a progressive increase in
consumption, it is but natural that people living in former Socialist country will make their purchases mainly
in the retail structures which are being opened, and will be opened in even larger numbers, in their countries.
It is true that the regained freedom of movement is bound to increase tourism towards the West, but
excessive expectations regarding purchasing power of eastern customers would be out of place.
A SWG survey39 on the purchases of foreigners in Friuli Venezia Giulia (cf. the Plan for Large-scale retail
trade) highlights that Slovenian and Croatians tend to appreciate good prices more than quality and
38 In 1973 in Fiume opens the first commercial centre (Korzo), followed by Rijeka in 1978. In 2002 a Slovenian commercial chain opens Tuš (later renamed Plodina); in 2005 there are two new department stores (Peuc, Metro), in 2006 the Tower Center-Shopping Rjeka, with 1,200 sq m commercial space and 2,000 park places: altogether, 4 commercial centres and 2 department stores. 39 53.8% of the Slovenian sample and 11.1% of the Croatian sample shop in Gorizia for food and home cleaning articles. The average expenditure is 110 (Slovenians) and 137 € (Croatians). For clothes, shoes and accessories we have 36.6% and 14.1% respectively (154 and 175 € respectively). However, only 3.8% of the sample declare to shop at least every two weeks for food, 2,5% for clothes.

trademark. It should be however noted, as far as the town of Gorizia is concerned. that the border post data
show a significantly higher decrease in the local movement as against international movement, a sign of less
interest towards Italian structures. In the studies made for the Plan for the Large-scale retail trade the
amount of the sales to foreigners (almost all Slovenians and Croatians) total for Gorizia almost 70 million €
(42.2 non food).
In 2004 the Commerciale Goriziana s.r.l. submits a proposal for a commercial centre to be built along the
south-east quadrant of the municipality of Gorizia, the eastern border of which would coincide with the State
border. The project refers to the Zone of strategic transformation provided for in the municipal land use plan
(PRG) 2001, in the document “Park for great facilities”. The initiative, comprised in the Sector Plan for
Commerce, has required a variation (no. 14) to the detailed municipal plan (PRDG), which has been adopted
at the same time (City Council resolution no. 24 of 20.07.05). In the variation, the perimeter of the “Park for
great facilities” is widened, as the new HC zone interests only a section of the territory concerned. It is
located in an area which borders on via III Armata on the west, the transborder railway sidetrack between
the Udine-Gorizia-Trieste line in Italy and the Transalpine line in Slovenia to the south, on the State border
on the east and on the hospital area on the north. It is a typical transborder project, which for the economic
size and the surface involved would need a new urban planning of the area. Besides other things a new
entrance into the town of Gorizia and the HC zone directly linked to the motorway in Slovenian territory.
Such a wide-ranging project, a real transborder one, would require the cooperation between the municipality
administrations of both countries.

5.5 THE RENOVATION OF THE HISTORICAL CENTRE
The commerce plan adopted by the Municipality of Gorizia mainly concerns the large-scale retail trade to be
located in the peripheral areas of the municipality itself, with the exception of the covered market (2,700 sq
m food, 500 non food) and of via S. Chiara (3,000 sq m non food).
Even accepting as reliable the reassuring prospects contained in the Regional Plan, it is necessary to face the
problem of the future of central areas after the total disappearance of the border effect and the realization of
the planned structures.
In the framework of this study, the present commercial system of central Gorizia has been considered. It is
made up of several streets (Carducci, Arcivescovado, Piazza Vittoria, via Restello, via Oberdan, corso Italia),
in the middle-northern part of the town and houses the core of the retail sales points, mainly small and
middle size shops which offer common goods and cluster according to the ware typology.
A great part of the customers come from Slovenia, particularly from Nova Gorica, either because some
goods are difficult to find over the border or for the lower prices, which VAT reimbursement makes still
lower. This underlines the structural weakness of the system, which risks collapsing once the situations is
normalized (entry of Slovenia into the Schengen system, adoption of euro). This all the more because the
above mentioned new initiatives planned for the adjoining area are at the end of one of the town main access
roads and as such are bound to drain at the origin the customer flow directed to the centre.
The solutions proposed start from a revision of the road system to favour public transport, pedestrian zones
and bicycles. This would enable to find the necessary space to increase public areas and therefore enrich
urban equipment. This way, it could be tried to move again the barycentre of the town into this area, which
represents the historical centre and the Austrian town and as such enjoys a historical and cultural heritage
liable to enlarge its scope beyond its present limits. It must be considered that this area is in fact the historical
centre of the whole urban complex we have named Gorizia Nova and from this point of view any
enhancement is going to get a good return in commercial value when crossing the border is no longer
perceived as such.
For example, an hypothesis for an urban restructuring has been developed for a place next to the border,
piazza S. Antonio (cr. § 8.3).
5.6 THE TOURISM-CULTURAL FUNCTION
Despite the several initiatives in situ, especially in the cultural field, tourism as a significant sector for the
economy of the town of Gorizia is still more a hope than a fact. As happens in Trieste, the accommodation
sector, compared with other activities (trade, study, etc.), expresses an auxiliary function rather than an
autonomous offer. The town is attractive, but does not possess elements capable of attracting significant
tourist flows. Moreover, it lacks a modern and efficient promotion structure. This is the task of the newly
founded “Turismo Friuli Venezia Giulia”, but also of the municipal administration, as laid down by the
reform of the tourism sector recently completed by the Regional Government.
It still is the centre of a short range movement area, suited for trips on the outskirts, with a chance for having
quality meals.40 Efforts are therefore to be made in order to create attractive structures for customers willing
to spend the night in town and quality hotels of economically sustainable size. Structures of this kind are
being planned in neighbouring Slovenia.
Structures specialized in gambling have always been an important sector in Slovenian economy. Particularly
important in this respect is the HIT group in Nova Gorica, made up of 9 companies managing at present 7
structures, a multinational active in 5 States (Slovenia, Montenegro, Bosnia-Herzegovina, Serbia, Dutch
Antilles). Its turnover in 2005 has been more than 260 million euro.41
Altogether, in the Goriška there are 7 casinos, 4 of them in the municipality of Nova Gorica, 1 in Šempeter-
Vrtojba and 1 in Renče-Vogrsko, so that the Slovenian part of Gorizia Nova has 5 casinos, of which the 3
more important belong to the HIT group and one to the municipal administration.
The new town appears already as a small “capital town” of gambling, located as it is 150 km from Venice
(which houses the nearest Italian casino), only 20 minutes by car from the nearest international airport
(Ronchi dei Legionari). Gambling, in turn, is strictly linked to the accommodation sector. In the area
considered, 3 casinos, including the 2 main ones (Park, Perla) are located inside hotels. All in all, the hotel
structure in Nova Gorica has 8 structures with over 800 beds, a number which is going to increase after the
building of a new hotel and the renovation of an existing one, both in the town centre.
HIT has recently signed an agreement with the American Harrah’s of Las Vegas for a megacomplex worth
700 million dollars. It would include a 4,500 sq m casino with 1,500 slot machines and 70 gaming tables, a
congress centre with the same surface, a 3,000-seat concert hall, a wellness centre, a commercial centre as
well as a restaurant, a bar and a night club, the whole linked to a 800-1,200 bed hotel.
40 Interviews with hotelkeepers reveals that not seldom foreign tourists cancel bookings after realizing that half a day is sufficient to do all the sightseeing. 41 That is to say, 17% of the Slovenian yearly income from tourism activities.

As we can see, it is an integrated complex of tourist-recreational services which reminds of the great holiday
cruisers made in Italy, in Monfalcone shipyards. 2,000 people will be employed at the beginning, 2,500 when
working at full capacity with returns of around 420 million euro per year, not to count the benefit on other
economic sectors.
A structure to be located in the border belt, potentially addressing over 8 million people over 18 years in a
range of 250 km from Nova Gorica, which soar to 26 million in a range of 500 km.42
From this multinational area covering Italy, Austria and Croatia (plus Bosnia and Montenegro) 1.9 million
foreign customers have reached Slovenian casinos in 2005.
Over twenty years HIT has therefore established itself among the most important managers of game and
entertainment centres in Europe. By offering free time quality alternatives, it is now facing the challenge of
the European integration through the above mentioned project, for the time being in a stalemate as Slovenian
legislation requires that 80% of capital be in national hands.
42 Twice as much as the maximum size of Slovenia. In the fourth quarter 2005 visitors of all Slovenian casinos have been almost 650,000, 76% of which from abroad (Statični Urad Republike Slovenije).

5.7 THE HEALTH SECTOR
Health is, as is well known, a sector of great social but also economic importance, moreover halfway
between public service in a traditional sense and private industry, at present possible intra moenia as well.
As far as health is concerned, in Gorizia the sector employs 1,100 units (out of the 2,300 of the province),
with a catchment area linked to the National Health District No. 1 Alto Isontino of 71,011 people (by
31.12.2004), that is the fourth greatest in the region Friuli Venezia Giulia (cf. in Appendix, sub 3, the Table
Municipalities Belonging to the Social-sanitary District of the Northern Isonzo Area).
The request for a renovation of the hospital in the Basaglia Park, an ideal chance to integrate the service with
the quite near structures in Nova Gorica, has not yet been decided upon because of the alternative of a new
hospital centre (Fatebenefratelli) in Italian territory, mainly for national patients. Considering the
demographic trends of Municipality and Province as well as the greater accessibility of hospitals in
Trieste/Udine on one side, in Lubiana on the other it is easy to understand that the Regional Health Plan is
right in considering a reduction in structures. Hence the importance of a coordination of services with Italian-
Slovenian cooperation as provided for in the project Health With No Borders.
The possible decisions of the regional government of Friuli Venezia Giulia are also to be taken into account.
They are considering a merger of the existing Health Service Authorities, bringing their number from 6 to 3.
6. THE PLANNING QUESTION
6.1 STRATEGIC VARIABLES IN THE TERRITORIAL DYNAMICS
The new context at the beginning of the third millennium a.C. opens up for the Gorizia area a number of
issues which must be studied in depth if people living there are to have a future.
The first issue is the overcoming of the border as a constraint which has influenced territorial planning. In
some ways this role has been less negative than it might be considered, as it has been the first reason of the
birth of Nova Gorica and therefore of a continuing - although separate - development of the town of Gorizia.
On the other hand, the Socialist choice made by Slovenia in 1945 has enabled, thanks to the principle of
communicating vessels, alternating flows of economic interchange between the two sides of the border.
Flows that state authorities have endeavoured to facilitate through a number of agreements signed in Udine
and giving rise to an area of favoured transit along all the Italian-Slovenian border.43
The second issue, deriving from the first, is the acknowledgement of the situation established in 50 years of
freedom, which requires a coordination of economic and territorial policies so as to rationalize development
processes in the two neighbouring towns.
The third issue, in turn referring back to the previous one, concerns the Italian side and is the need to
redefine once again the functions of Gorizia, since the role of border centre the town had tailored for itself
now belongs to the past. In short, it is necessary to reinvent a new centrality for a settlement rich in history
and strong points.
In parallel, on the other side of the border it is necessary to support a further evolution of Nova Gorica and
its territory, not only in a framework of coordination as has been said before, but above all taking into
account the deep changes which have taken place in the economy of Slovenia and the continent in the last 15
years.
In order to reach these aims we ought to give back an accessibility at European level to the area considered,
an area which also in a non-war period has blocked the local situation and where the borderline was marked
by trenches and an array of nuclear mines.
These five basic issues must undoubtedly be developed in the framework of the great geopolitical processes
now under way, from EU enlargement to globalization. They require however the ability to translate into
planning guidelines and prescriptions the reconversion and development strategies which have been and will
be adopted.
43 cf. in Appendix sub 3, Tav. 13.
6.2 TOWARDS A DYNAMIC MODEL OF TERRITORIAL DEVELOPMENT
The possibility of founding the complex structure of territory on specific indicators lies at the basis of any
research aiming at the creation of system models capable of representing the main mechanisms regulating
dynamics on the earth surface. Although science has enabled us in the last decades to make astonishing
progress both in the understanding of phenomena and in the ability to submit convincing simulations (see the
increasing reliability of weather forecasts), we still are quite far from our target.
For example, even as far as the great issue of the increase and spreading of human activities on the earth is
concerned, analyses so far have not given reliable results without underlining the need to be very careful in
kind and scale of interventions.44 If this is true on a worldwide scale, it is much more difficult to reach
significant results on the local scale, which is the main scope of territorial planning. This is proved very well
by weather forecasts, often confronted with the many characteristics of territories which cannot be included
in an system of equations working for large surfaces.
If this is true for models including quantities answering physical laws, the task to harmonize in unifying
formulas variables representing at the same time physical, biological, economical and social entities is all the
more difficult.
After a number of attempts made during the present research we have reached the same conclusion of V.
Vagaggini and G. Dematteis, according to whom “the practical realization of such a paradigm finds
enormous obstacles and, remaining within the neopositivist thought, the leading one in this sector, is also
impossible from a conceptual point of view”.
This leads us on the one side to look for indicators as homogeneous as possible, that is to say coming from
similar thematic areas, on the other to reduce their number resorting, if possible, to single indicators.
As far as territory is concerned, the measuring of its evolution requires in the first place the choice of
privileged values. For example, when considering the issue from an environmentalist point of view, the
percentage of territory – in terms of surface – in a condition of “natural” balance can be a good indicator.
Unfortunately, from the point of view of a planning activity including the whole of a given territory – typical
of territorial Authorities – this kind of simplification cannot be accepted. Neither can be accepted, on the
opposite side, the amount of human cover in terms of density. This because of the mobility of population,
tending to live in certain areas and abandoning others, and the need to evaluate any single case according to
the specific “quality” of human concentration. Let us think of the masses of the underprivileged living in
third world metropolis as against the solitude of mountain people in Switzerland.
44 Cf. D. H. Meadows et alii, I limiti dello sviluppo, Mondadori, Milano 1972.
We ought to be able to agree on an evolutionary model of territory measured according to the prevailing
uses. Such a model did exist until the Sixties of last century and was supplied by classical Geography, which
thought in terms of the dichotomic couples town-countryside, agricultural-industrial starting from a
dynamics of economy founded on the “law of the three sectors”.
Unfortunately, with the spread of technology and the transition to the post-industrial, these categories and the
premises on which they are founded are past and gone.
This compels us to fall back on simpler concepts which can describe, if not the various typologies of land
uses and of the forms they take, at least single entities able to represent – and measure – the various
importance of single parts of territory for man. In other terms, we are oriented toward an indicator of socio-
economic kind which can somehow counterbalance the entities with a physical character (in the first place,
space dimensions) used in the analysis model of § 7.3.
We have thus reached a conclusion which might appear rough or too sharp but which, in our opinion, can
meet the requirements of planning activities. In the economic system of the third millennium a. C., founded
on the global market, the most significant sector linked to the choices made on the territory is the value of
real estate.45 Be it the value referring to purchase or use, substitution, dispossession etc., the price of a given
surface is decisive both for the concrete choice of intervention made by private citizens (independently of the
kind of use they choose) both for the related decisions (obligations, authorizations) made by the authorities
governing the territory concerned.
The value of real estate property is indeed the basis on which to calculate the profitability of any economic
activity and is particularly important when estimating the predictable effects of decisions in planning issues,
which are bound to modify – i.e., increase or lower – the aforesaid value. The widespread hostility against
real estate speculation, the common tax evasion and the existence until 1990 of Communism-related systems
have lead to underestimate the importance of this indicator. But in a globalized world, in countries with the
same development levels real estate value tend to be much the same for standard categories of buildings, as
is well proved by the evolution of the real estate market in the former Socialist countries.
As far as Slovenia is concerned, it is noteworthy that the adoption of the euro as from 1st January, 2007 is
going to equalize the unit of measure of values with Italy, so that the goal of creating one real estate within
Gorizia Nova will be reached soon. This of course while abiding by the rules and competences of the
territory governing authorities in the two neighbouring countries. The issue at stake now is the actual
possibility a) to get to know the true value of real estate and b) to regularly monitor its development. It goes
45 The employ of isovalent methods in the study of urban phenomena is over one hundred years old, cf. R. M. Hurd, Principles of City Land Values, New York, The Record & Guide, 1903. On the subject, cf. also E. Bonetti, La localizzazione delle attività al dettaglio, Milano, Giuffrè 1967

without saying that the building taken into consideration, as far as territorial planning is concerned, must lie
within the single planning areas.
In order to fulfil these requirements the International Valuation Standards (and among them the European
Valuation Standards in particular) have been created. They are published by the International Valuation
Standard Committee, an organization founded in 1984 and represented at the United Nations which
comprises the associations of professional valuators all over the world.46 These criteria, aiming at
guaranteeing the objectiveness of estimates and their comparability, have been adopted by the Italian market
in 2002 with the Codex of real estate valuations of Tecnoborsa (a Chamber of Commerce-fostered joint-
stock company).47 These criteria have been also adopted by the major Italian banks as far as the guidelines in
credit granting and amortization assessment are concerned (Basel Committee on Banking Supervision, Basel
2, 2005), enforceable as per January, 2007.
The aforementioned evaluation procedures, based on Market Comparison Approach, Income Capitalization
Approach and Cost Approach, are accessible through a dedicated software – STIMATRIX – distributed
thanks to a particular agreement during training courses organized by the Regional Lab for Retail Trade
Economy (LED) in cooperation with the degree course in Territorial Policy of the University of Trieste in
Gorizia.
According to the comparison principle, real estate valuation identifies homogenous areas of territory. It has
to be repeated for each kind of buildings (residential, tertiary, industrial, their respective areas as well as
agricultural and building areas).
The valuation of sample buildings within the single areas makes it possible to quantify the effects of
planning policies in immediately operational terms for each single area. We can thus rely on a simple
methodology, based on objective data and capable of guiding the choices of public managers in the matter of
territorial planning on both sides of the Italian-Slovenian border.
In order to collect a significant number of estimates for the territory of Gorizia Nova, we have analyzed data
supplied by FIAIP and Agenzia del Territorio as well as estimates on current market prices in Slovenia. Up
to now there is no regular market managed by professional people: this is the heritage of past times when it
was public authorities which cared for housing needs and laws tended to prevent private owners from
making profits through selling prices or rents.
46 http://www.ivsc.org 47 Cf. M. Simonotti, Manuale delle stime immobiliari, Roma, GEOVAL 2005; A. De Marco, G. Bambagioni, M. Simonotti et alii, Codice delle valutazioni immobiliari. Italian Property Valuation Standard, Roma, Tecnoborsa, 2005 (III ed.).

The re-emerging of the real estate market is therefore still dependent on the activity of traditional
intermediaries.
Nevertheless there has been a sudden upswing in prices, of late even higher than in Italy, where in 2005
quotations have basically remained unchanged in the whole Province.48 This may account for the optimistic
statements of the FIAIP provincial president, according to whom “the new, open attitude of Slovenia towards
Europe will produce, although not in the short run, new markets also on the other side of the border which
are bound to boost the number of sold and rented housing units in the centre of Gorizia”.
In order to have an overview of the situation for planning aims we have resorted to data supplied by Agenzia
del Territorio, which are more articulated according to market zones. The results concerning the
Municipality of Gorizia can be seen in Appendix (Tables 17, 18, sub 3).
These data show that there is one urban area, extending over both sides of the border, characterized by values
decreasing from the centre towards the suburban areas. This is consistent with the traditional land use,
mainly residential/tertiary in the centre, increasingly linked to production in the surrounding areas.
At this point it is possible to try and propose a dynamic model linking, in a functional relation, the dynamics
of the real estate market to planning policies. Changes in the values are the result of modifications in the
economic and demographic fabric influencing both demand and supply.
Without taking into account speculation phenomena (which however do anticipate market trends), an
increase in prices generally corresponds to an increase in demand and vice versa. Instead, low prices for a
long time correspond to a standstill in the activity, what in turn causes, in already urbanized areas, what the
Munich school calls “social fallow”.49
For each segment of the real estate market (for example that in the already mentioned Table 17), we will
consider the average prices at the end of the reference years.
We will then calculate the percentage variations in the last five year period.
Generally speaking there may be two situations:
48 According to FIAIP real estate coulisse (cfr. Borsino Immobiliare Regione Friuli-Venezia Giulia 2006, suppl. no. 158 of Corriere Casa Nord-Est, 10.4.2006) a vacant flat in Gorizia historical centre is quoted (first half 2000) between 1,450 and 1,750 € /sq m, while in Nova Gorica and Šempeter pri Gorici beween 1,800 and 2,000. The same applies to the buildings devoted to production and commerce: while in Italy there is a range of 180 – 870 (data supplied by Agenzia del Territorio), in Slovenia we have a range of 500 to 1,000 € (data collected through interviews). 49 The employ of isovalent methods in the study of urban phenomena is over one hundred years old, cf. R. M. Hurd, Principles of City Land Values, New York, The Record & Guide, 1903. On the subject, cf. also E. Bonetti, La localizzazione delle attività al dettaglio, Milano, Giuffrè 1967

a) 0
05
PPP − ⟩ 0 ; b)
0
05
PPP − ⟨ 0
Variations must be compared with those of the general index of price variations, which comprises the
summed values of the five year period.50
In the case a), if we have
0
05
PPP − ⟩ 5 · ∑
=
=
5
0
i
iI
this means that there are significant housing problems, which shows the need to adjust the supply of real
estate stock. Modifications in the directions of the present GRP would be necessary (for example
transforming agricultural land into building areas).
In the case b), if we have51
0
05
PPP − ⟩ 5 · ∑
=
=
5
0
i
iI
we are witnessing a drop in demand. Hence the need to intervene in issues of population, reconversion,
restructuring, new investments etc., obviously according to the availability of areas.
The revitalisation of a settlement fabric showing a scarce demand in the residential sector may require not
only provisions for an economic support to residents or an immigration policy, but also the creation of jobs
according to the availability of the areas needed for economic settlements (commerce, tertiary, production).
The above mentioned checking procedure is to be repeated on a yearly basis (the index enables a continuous
updating, like the Regional Development Plan) analyzing the situations of the single GRP areas in the
various spatial subdivisions of the market. As far as Slovenia is concerned, it is necessary to get under way a
survey procedure. As the market is still at an early stage, it is possible to profitably use all along the
European Valuation Standards worked out by means of the STIMATRIX software.
50 We would propose to use the inflation rate (seen as the ratio between normal PIL and real PIL), that is
0
05
PIL PIL - PIL instead of the consumer price index, which more properly mirrors the cost of living.
51 The variation index of real estate prices is to be considered as an absolute value.

6.3 STANDARDIZING CARTOGRAPHICAL BASIS
The question, how to reach a satisfactory homogenization of Italian and Slovenian cartography, has no easy
solution since the two countries use different reference systems and trigonometrical points,52 which cannot
surprise if we consider the military importance of cartography.
A recent attempt at bypassing this hurdle as far as the border area is concerned is the “International Fire-
Fighting Atlas”,53 covering the provinces of Trieste and Gorizia as well as a portion of the woodland around
Sežana, Slovenia. It is a very precise work containing sensitive data (eg. technological networks etc.) which,
summed to the impossibility of reproducing Slovenian cartography, prevents its distribution to the public.
We have therefore decided to use a two-tier rectification for both versions, i.e. on a 1:100.000 and 1:25.000
scale.
In the first case, we have worked for the Italian side on the CTR 1:5.000 (2003) and on the Basic
Topographic Plan (Topografski Temeljni Načrt). The resulting map has been printed according to CTR
Numerical Friuli Veneziua Giulia with double grid: kilometrical and Gauss Boaga, oriented on Rome –
Monte Mario, according to the international standard WGS-84 with 30”axis.
For the 1:25.000 scale, following maps have been used: the Slovenian State Topographical Map (DTK25)
and the map “Trieste and surroundings and the Isonzo Karst” 1:25.000 by the Slovenska Planinsko Društvo
Trst. The final result uses the Gauss-Krüger projection, in which the Italian cartography with a 100 m net,
while the pass geographical grid (griglia geografica di passo) has coordinates in the WGS-84 system.
For this work we have at first tested the algorithms used in the most widely used GIS applications for the
automatic transformation of different cartographical sources. This procedure has highlighted how the
52 The reference system adopted by the official Slovenian cartography is: Identifier: D48; Datum: MGI Hermannskogel – Hundesheimer Berg; Ellipsoid: Bessel – 1841; Cartographic projection: Gauss - Krüger (inverse cilindrical); Latitude of origin: 0° 0’ 0’’; Central meridian: 15° 0’ 0’’ from Greenwich; False easting: 500.000 m; False northing: -5.000.000 m; Scale factor: 0.9999. The CRS adopted by the Italian official cartography – and by the Numerical Regional Map of the Autonomous Region Friuli-Venezia Giulia – is the following: Identifier: Gauss-Boaga; Datum: Roma (Monte Mario) 1940; Ellipsoid: Hayford 1924 International oriented on Rome – Monte Mario; Cartographic projection: Gauss - Boaga (inverse cilindrical); Latitude of origin: 0° 0’ 0’’; Central meridian: 15° 0’ 0’’ from Greenwich; False easting: 2.520.000 m; False northing: 0 m; Scale factor: 0.9996. The Italian official cartography, especially in its digital version, uses not only the traditional Gauss-Boaga system but also the European middle system as follows: Identifier: UTM ED 50; Datum: European 105’; Ellipsoid: Hayford 1924 International oriented on Potsdam; Cartographic projection: (universal transverse Mercator; Latitude of origin: 0° 0’ 0’’; Central meridian: 9° 0’ 0’’ from Greenwich (fuso 32 N; False easting: 500.000 m; False northing: 0 m; Scale factor: 0.9996. The UTM system (Universal Transverse Mercator) ED50 (European Datum 1950) has been set up after the second world war in order to decide a middle European orientation, thus standardizing national cartographies in one regional European system. The problem of the missing link between Italian and Slovenian cartography has not been solved yet in that the latter has not adopted the UTN ED 40 system. Both national systems (Gauss-Boaga and UTM ED 50) can be clearly identified through a double, well marked kilometrical grid. 53 A. Sgamati – J. Zafran, op. cit., 2006.
presence of residual errors when matching Italian and Slovenian cartography makes it sometimes impossible
to perform sufficiently accurate spatial analyses on a high scale. When coordinates are exchanged between
two local data, for instance, the whole process may generate position errors up to 20 m.
In order to overcome this problem a special methodology has been proposed i.e. through translation of
metrical values54, which can be applied to any map in digital raster format (even resulting from the
digitalization of the paper format) and in vector format when a cartographic source has to be rectified from
the D48 system (adopted by the Italian official cartography and by the Numerical Regional Map of the
Autonomous Region Friuli-Venezia Giulia) to a 1:25.000 scale.
For cartography on a 1:50.000 scale a second geometrical model has been developed (also made up of a
polynomial function of the 1st order) aiming at the same transformation from D48 to Gauss-Boaga system.
The application, the ideal barycentre of which are some GPS’s used to generate the model of metrical values
the II class pedestrian border post Rafut-Pristava, has enabled to significantly reduce the metrical error in
the matching procedure55. The propagation of the error increases of course with the increase in distance
from the barycentre considered, according to a spatial model which is still being worked out.
6.4. STANDARDIZING INTERVENTION SCALES
As for the question concerning the choice of the basic level for transborder planning, the option for the units
which best enable to link plan zoning to reference socioeconomic data has been confirmed. The path chosen
has been that of the minimum spatial levels, i.e. census sections in Italy and local settlements in Slovenia and
Croatia.
In the less urbanized situations characterizing the neighbouring republic, they circumscribe the areas related
to the village community rather than the subareas within urban systems. Also in the Italian case census
sections necessarily refer to inhabited areas, but in the first place it is necessary to verify to what extent the
former can match the latter.
To obtain an empirical demonstration, a comparison has been made between census districts and built–up
areas in the municipalities of Friuli Venezia Giulia. Cartographical processed data show first built-up areas
and then the fabric of census sections. The layer of the built-up surfaces has then been laid upon the grid of
municipal districts and, finally, the layer of sections has been laid upon the previous map.56 This has also
54 Cfr. ”A Translation Model of Metrical Values for a Joint Mapping of the Transborder Areas” in Gorizia Nova – Model Plan, II Report, DSGS-Univ. Trieste, February 2005. 55 1,94 m Longitude (East-x) and 2,94 m Latitude (nord-y) to a maximal distance of 1.500 m from the barycentre in Longitude and 4.000 m in Latitude, with a 17 m error in Longitude and from 4 to 16,5 m in Latitude, reached by direct operation of the software ESRI ArcGIS 8.2. 56 cfr. Gorizia Nova - Model Plan, Secondo Rapporto, DSGS – Univ. di Trieste, February, 2005.

enabled to fully acknowledge the astonishing phenomenon of the settlement continuity now interesting the
greatest part of the region. This is in fact characterized by the topographical connection of separate municipal
units, so that there is a serious question as to the usefulness of municipal plans as instruments for territorial
management.
The issue has been studied in more depth with regard to the Province of Gorizia. In this case, the built-up
continuity on the municipal grid witnesses the existence of a solid urbanized axis already linking Monfalcone
to Farra d’Isonzo, a virtual unit which appears on the point of joining the urban centres of Capriva and San
Lorenzo, in turn not very far from the Gorizia – Mossa couple of towns.
A comparison between the built-up areas and the census sections shows significant coincidences.
The use of sections enables us then to link planning to the fabric of elementary settlements and to their
genesis, which offers the opportunity of immediately considering in significant terms such parameters as
residential density, available surface and distance from built-up area. It also enables to take into account
people’s choices on single proposed interventions or on the relevant planning provisions, thus laying the
foundation of a really sustainable and shared planning.
On this basis we have mapped the socioeconomic documentation gradually found on the study area. The
administrative cartography of the core of the reference area (Friuli Venezia Giulia, western Slovenia and
Istrian County/Croatia) has been sewn together. The comparison between the spatial distribution of the net of
municipalities and places in the three country units pinpoints what has already been shown in the pst, i.e. the
lack of a standard grid.
Slovenian local settlements (Goriška) appear to be better comparable to Italian municipalities, in turn much
smaller than Slovenian ones. This can be seen very clearly by means of a comparison with municipalities in
Obalno Kraška. The same is true for municipalities in Croatian Istria, which however present quite a thick
settlement network, with an average extension between the Italian and the Slovenian one.
All this accounts not only for historical heritage, but also for a different approach to territory of the three sets
of communities, in function of their different levels of economic development. On a still imperfect basis
some statistical processing has been made in order to obtain parameters which would give a better
understanding of present trends in the territory under study.
6.5 THE STANDARDIZATION OF PLANS
From our point of view, the standardization of plans is not just a technical operation aiming at
giving an overview of the present de jure situations on both sides of the border, but has a wider
scope in that it is meant to lead us towards a sensible territorial management system based on
objective data. This requires a standardization on three levels: technical cartography, zoning, spatial
statistical basis. Of these three operations, the first has basically technical contents, allowing the
search for solutions through scientific methodologies as reported in § 6.3. The other two cannot be
modified as they are the result of political-administrative decisions. What can be done in this
context is only to identify units which can be assimilated, for contents in the first case, for spatial
dimension in the second.
As for present planning, the Provincial Administration of Gorizia, within the Transplan Project –
Joint Transborder Territorial Planning,57 has accomplished the joining of town-planning schemes
for the municipalities of its territory and that of Nova Gorica.
The operation, quite accurate, considers a zoning divided into 38 categories. For the present
research, with a prevailing methodological approach, we have chosen a limited number of zones.
This choice is due both to the modifications which are currently being introduced (also concerning
the new legislation on territorial planning passed in Slovenia) and to the wish to support the great
typologies of land use: for economic, residential and public aims.
The standardization of the plans of the municipalities of Gorizia, Nova Gorica and Šempeter-
Vrtojba58 as appears in the annexed cartography (Homogeneous Plan Categories) has been made,
purely as an indication, on seven main land uses, chosen according to a functional approach:
residential, infrastructure, production, tertiary, agriculture, forestry, recreation/tourism, other.
Criteria followed in the standardization are listed in Table 9.
In order to connect planning choices and socio-economic conditions of territory, the zoning
mosaic thus realized has been overlaid with the network of the census sections in Italy and
Slovenia (cf. § 6.4.).
However, the refusal – arrived on 9.5.2006 – of the Statistic Office of the Republic of Slovenia59 to
supply data at this detail level has brought to a further overlaying as follows: census sections in
Italy, settlements in Slovenia.
57 Cf. Linee guida per una pianificazione coordinata dell’area transfrontaliera, Province of Gorizia 2005. 58 Data concerning the GRP of the municipality of Miren-Kostanjevica are being acquired. Some settlements of this municipality have been included in the hypothetical boundary of Gorizia Nova (cf. § 3.3). 59 Attached in Appendix, Chapter 3.

It was not therefore feasible to achieve the standardization level we had aimed at, though it must be
said that a perfect coincidence would have been impossible. The section network, in fact, follows
the settlement pattern and is closer where density is higher. There is therefore a unifying element,
beyond the dimensional scale, where the settlement networks follows more closely this logic of a
geographical, rather than planning, type.
7. MODELS OF TRANSBORDER PLANNING
7.1 THE REFERENCE PLANNING FRAMEWORK
The Slovenian National Strategic Plan, in the part concerning settlement considers Nova Gorica an urban
centre of national importance with an influence range practically covering the whole of the Goriška area,
from the border with Italy to the west to the influence area of the conurbation Jesenice – Radovljca to the
north, Kranj, Lubiana and Postumia to the east, Koper to the south.
It is a very wide space, comparable as to surface to that of the capital city, while the urban size is much more
limited. Despite the lack of resources of a large part of the territory, there would be space enough for a more
important centre. In the chapter devoted to the harmonized development of greater urban areas we can read
that “large cities, which are intensively connected to their wider surroundings, shall be developed as major
urban agglomerations”.60 These provisions are undoubtedly correct and rational from a point of view of
territorial management, but it must be noted, and not only here, that the Plan is based on the idea of a
territorial organization making of Slovenia a sort of great, well-oiled mechanism able to interact with the
outside world with the whole of the resources available. In other words, the basic idea is somehow an
“autarchic” one, a curious feature in a document which has been approved by the National Assembly on
18.6.2004, that is to say after the entry of Slovenia in the EU.
Of course we must take into account the particular transformation process under way in the neighbouring
Republic, which has attained independence for the first time sixteen years ago. After centuries of inclusion
within supranational political units to which they have been to various extents subordinated, it is more than
understandable that Slovenians wish to put order at home first, choosing an organization capable of ensuring
the survival of their State in its unity and identity. Nevertheless it must be mentioned that, while in Friuli
Venezia Giulia emphasis is being put on transborder cooperation on every possible occasion, in the
abovementioned Plan these themes are treated with a great realism, not to be found in Italian praxis.
The controversial passage reads as follows: “Systematic development of the border regions and their centres,
as well as the development of activities which meet not only Slovenian demands but also extend their impact
across the borders balance the impact of large adjacent urban agglomerations, and enable enhanced
integration of border areas with the central Slovenian territory.”61
Later, in the paragraph Integration of Slovenia in the European Space Under Equal Terms, it reads
“…Together with neighbouring countries (Slovenia) shall encourage the formation of transborder regions,
especially in mountainous, poorly accessible areas with numerous problems related to economic and 60 Cf. B. Bartol et al., (eds)., The Spatial Development Strategy of Slovenia, Ministry of the Environment, Spatial Planning and Energy, Office for Spatial Development, Ljubljana 2004, p. 25. 61 Ibidem, p. 19.
demographic decline. To resolve common issues, the creation of development programmes and projects is
also encouraged in other regions along the border with Austria, Italy and Hungary, and particularly along the
European Union border, i.e. the border with Croatia”. Further, “4. One of the aims in the creation of regions
including parts of neighbouring countries is to attract Slovenian minorities, i.e. to reintegrate Slovenian
cultural space. This objective has an economical, historical and political significance for Slovenia. To this
aim, the accessibility of border regions and their centres linked to other Slovenian regions is to be
improved”.62
“5. Accelerated spatial development of Slovenian territory in the gravitational areas of large neighbouring
cities (Trieste, Zagabria, Gorizia, Graz, Rijeka) is promoted in order to ensure the competitiveness of
Slovenian regions compared to its neighbouring regions through planning efficient networks of cities,
economic zones, tourist centres and other activities”.
This opening is then directed not only towards development (for which international funding is explicitly
referred to) but towards an increased Slovenian integration in the border areas, as well as in those over the
border. Once made clear the basic philosophy, we can go back to our territory and underline the more
detailed indications as to the development of the Nova Gorica urban system. The map Polycentric Urban
System and Development of Wider Urban Areas63 shows the creation of a wide urbanized belt linking the
centres of Nova Gorica and Ajdovsčina. To support this and other areas of the same kind an accelerated
development of interurban transport is provided for.
Despite the forecasts concerning transborder regions, no hypothesis is put forward about possible
integrations of settlements. A priority is the fastening of links with border regions through a policy of local
development. The urban area considered in fact connects two Slovenian urban areas.
As to the processes of territorial development, it certainly is correct to imagine a linear development along
the motorway route Nova Gorica – Lubiana. Sure is that the urban area considered begins to the west beyond
the border and the evolution trend triggered by EU enlargement is bound to proceed very quickly there.
Apparently, the awareness of what has happened in the area after 1947 – in practice, the duplication of urban
centres imposed by the new border – is not easily accepted, and not only from the Italian side.64
62 Ibidem, p. 20. 63 Slovenian National Strategic Plan provides for a polycentric urban system, divided into approximately 28 regions centred on one or more centres nearby. In alphabetical order: Ajdovsčina, Celje, Črnomelj, Domžale, Dravograd, Gornja Radgona, Idrica, Ilirska Bistrica, Jesenice, Kočevje, Koper, Kranj, Lendava, Ljubljana, Ljutomer, Maribor, Murska Sobota, Nova Gorica, Novo Mesto, Postojna, Ptuj, Rogaška Slatina, Sevnica, Škofja Loka, Tolmin, Trbovlje, Trzic, Velenje (ibidem, p. 24). 64 If the couple Gorizia – Nova Gorica has been mentioned for decades as a twin cities example, the topic is still taboo for Trieste- Koper. The pre-existence of Capodistria has blurred the picture, but their position on the same Gulf, the massive exodus of Italian population and the development of the maritime-emporial functions once monopoly of Trieste prove that it is in fact the same phenomenon (cf. G. Battisti, Una regione per Trieste. Studio di geografia politica ed
Towns have always been the economic and cultural centres of territories, they represent their identity core
and multiple identities, whether we like it or not, pose problems. Real situations are always plural, supported
by physical identities: two urban structures bound to last in time, neighbours at all effects. Their merger has
therefore to recover to a large extent the missing size scale sensed by Slovenian planners.
7.2 THE HYPOTHESES ADVANCED
Territorial planning does not make sense outside a framework of socioeconomic planning, i.e. it must take
place within a strategic vision aiming at the development of the society settled in a given territory.
To formulate choices – either requiring direct intervention or authorization to intervention – we need
synthetic indicators of territorial compatibility enabling us to appreciate the sustainability in time of
environmental characteristics in a physical-naturalistic sense and of the social and economic structures on the
continuous operativeness of which depends the future of the communities settled there.
In planning procedures it must be possible to associate indicators to a valuation, so as to realize an
environmental and territorial information system helping technicians as well as stakeholders and politicians
in the decision-making process.
There are in theory many types of possible indicators and the actual choice depends finally on the knowledge
we wish to attain in a given case. Generally speaking, we can distinguish between environmental indicators
(biological, physical-dynamical) and indicators deriving from man’s activity (technological/economic/socio-
political).
The list would be exceedingly long. Suffice it to know that the Department of Architectonic and Town
Planning in a recent transborder research on environmental sustainability has listed 98 indicators.65 A closer
examination reveals however that these indicators can have different values according to the aims for which
they are employed. A good example is the case of settled population. This indicator shows at the same time
production and consumption, demand and supply of territory and services, pollution etc. The usefulness of
indicators for our aims depends however, at the same degree of reliability, on the actual availability of the
data required. This availability must meet with the research requirements in space and in time, that is to say it
must be possible to gather data in a homogeneous way, through standardized procedures, on a spatial base to
be sufficiently homogeneous and stabile in time. A large number of indicators available without these
economica (A region for Trieste. A study of political and economical geography), Univ. di Trieste, Ist. Geografia / Fac. Economia e Commercio, Trieste 1979, p. 73-75. 65 I. Garofolo, E. Marchigiani, Linee guida per lo sviluppo sostenibile del territorio transfrontaliero Italia-Slovenia, Trieste, DPAU, 2005

characteristics both under a spatial and a temporal point of view must be therefore rejected from the very
beginning of the research.
A lack of spatial and temporal compatibility is the reason why a great part of the data available in public
databases and of those collected through extemporary research cannot be used however correct is the
statistical metodology on which they are based.
For the aims of the present research, as already said, the issue of spatial homogeneity is particularly
important. In theory, the land register would be the appropriate instrument, were it only updated, and the
same applies to the Ufficio Tavolare, so that their data cannot be taken into consideration for practical use.
It is true that, when preparing the Fifth General Census on Agriculture (October 2000), it had been proposed
to put together the collected data in a spatial grid to be supplied by the Cadastral Administration, but the
latter was not able to prepare the necessary map basis in time. A historical opportunity has thus been lost to
give the country an integrated instrument, considering the irreversible process now long under way to
delegate nationals functions to the Regions on the one side, to European level on the other.
This is all the more serious in that data concerning agriculture refer to a fabric of census sections not only
inhomogeneous in comparison with cadastral sections but also different from the sections used for the
following (2001) censuses of people, housing, industries and commerce. The result is that the basic
knowledge available on the country is fragmented over three different spatial sets, thus frustrating any
possibility of crossing and comparing data.
We might think there is a continuous lack of will in developing the level of knowledge of the national
situation. This would be however in line with what happens elsewhere in Europe. In Germany, for example,
after the reunification, it has been decided not to carry out any new census, resorting to sample surveys when
data are needed.
Under these conditions, in the present research we have decided to choose indicators coming from a
cartography founded on units singled out on an administrative basis. On the one side we have therefore made
reference to real estate values (cf. § 6.2), on the other to data acquired through remote sensing techniques (cf.
§ 7.3). That is to say we have decided in favour of a processing of factual data, in the first case of a
socioeconomic character, in the second of a physical-naturalistic kind.
For the former type of data we have resorted to sampling, for the latter to total coverage of areas. The
resulting images of the territory studied are therefore very much reliable, in that they are “true” from an
objective point of view and absolutely precise when it comes to rectification
7.3 THE USE OF REMOTE SENSING IMAGES
7.3.1 THE TECNICAL PROBLEM Satellite images have been long offering a continuous coverage in time of the whole of our study area and the
techniques to process transmitted data allow to monitor with absolute precision a wide set of phaenomena of
territorial interest. These range from the identification of type of vegetal cover, both natural and artificial
(state and typology of cultivation), built-up areas, air quality to the detection of quarries, spilt out polluting
substances, even asbestos on building roofs.
Among all these possibilities we have chosen to experimentally analyze two Landsat 5 TM images covering
the whole of the urban area considered, taken in 1992 and 2003 respectively.
The definition level of images and the spatial extension of typologies is in fact comparable to the size of
census sections and planning zones, so that this appears to supply us with a reliable instrument of territorial
management as far as town-planning is concerned.
The study area (cf. Appendix, Table 1 sub 5) has been subjected to quantitative analyses considering it as a
regional unity in which the borderline – marked on the ground by boundary stones – and the related border
belt, including both neighbouring states, are the core of the region itself. The typologies of land cover have
been detected, quantified and analyzed in detail in their evolution dynamics without considering their
national character, that is to say as belonging to a regional unity.
The change detection analysis is the process through which information of different periods are compared in
order to determine place and nature of changes over time. It is useful to carry out a qualitative and
quantitative assessment of the situation in a given territory and as an instrument of temporal monitoring.
The interpretation methodology has been that of cross-tabulation, which allows to cross a couple of land
cover thematic maps relating to two subsequent periods as is the case in the two Landsat 5 Tm images which
have been classified. Cross-tabulation is what is called a double–entry table supplying the frequency
corresponding to couples of characters. The result of this analysis can be presented as tables and as maps.
When presented as a table, the result is a matrix listing land cover classes in rows and columns, surfaces (in
pixel numbers or hectares) of each kind of change in single cells. By using this kind of result it is possible,
choosing a given class of land cover in 1992, to analyze its composition in 2003 and vice versa. The map
instead is a spatial symbolization of the variations in which for every patch it is possible to see what was the
land cover at the two different times.

Considering the large number of land cover classes reported in the present study, we have decided to adopt
both formats (tables and diagrams) for our presentation. The use of the cartographical representation of all
changes would in fact have produced unclear thematic cartograms.66
The necessary precondition for the use of this approach is given by the surface of each change typology,
represented in the single cells of the matrix. This datum is obtained through reclassification and masking
procedures67 in a GIS environment on already classified images.
Any single class of landcover of Landsat 5 TM classified in supervised mode has been extracted by means of
a binary reclassification assigning a value of 1 to the class to be extracted, 0 to the others. Each single 1992
class has then been masked with the classified image dating back to 2003.
The result of this procedure is a set of discrete classes which – for number and the pixel position, i.e. also for
surface in hectares – coincides with the previous class (1992) but in fact is also made up of other classes of
land cover –dating back to 2003 – which possibly and partially have taken over the original cover.
At last, extracting from the attributes of the masked classes the number of pixels related to each change class
it is possible to quantify this change in hectares compiling the cross-tabulation.68
Cross-tabulation makes is possible to carry out a both retrospective and evolutionary detailed analysis.
Retrospective in that it can reconstruct the past (1992) of the present land cover typologies (2003) (see
matrix columns). Evolutionary, since it can bring us back to 1992 and analyze the transformation of land
covers in the period of study considered (see matrix rows).
Such a retrospective and evolutionary analysis brings to the creation of seven dynamics classes. This
schematic classification has been adopted to make the interpretation of data in the above mentioned matrix
easier.
These classes have been analytically computed in the matrix but have not been subject to analysis during the
assignation of dynamics classes, since the latter presented in both periods considered a very much reduced
surface (in percentage) compared to the total area examined.
Cross-tabulation, in short, analytically lists all changes intervened among the land cover classes in the period
considered, whereas the subdivision into a limited number of dynamics classes highlight the general trends in
66 The theoretical number of dynamics classes instead is given by the product of the number of classes used for one date for those of the subsequent one. The number of dynamics classes has been intentionally decreased and reduced to seven more general classes in order to get more readable results. 67 The masking procedure, applied on raster images, allows to generate a new image deriving from the selection of pixels with given characteristics. A mask file, created for this purpose, filters pixels on the original image (ERDAS, 1999). 68 For a summary of the procedures followed, cf. Gorizia Nova – Model Plan, III Report (February 2006), Part II and Attachment 3.

the changes among the cover classes in order to give a holistic vision of all changes which have affected
territorial structure .
The analysis of the matrix clearly shows to what extent anthropization dynamics is spread in some land cover
classes traditionally devoted to natural and agricultural use.
7.3.2 THE APPLICATION TO GORIZIA NOVA
A careful examination of the thematic cartography submitted (cf. Appendix sub 5, Tables 1-5) leads to
following conclusions as far as interrelations between border and main land covers are concerned – when
they are characterized at the same time by a significant width of the area and evolutionary dynamics – in the
transborder region considered.
The dramatic decrease (over 50%) in the land cover related to complex cultures (vineyards, orchards, kitchen
gardens) together with the related buildings. It has mainly been caused by hybrid processes of growing
extension or abandonment of cultivations, colonization by mantle vegetation (hedgerows, shrubs), wood
spontaneous growth and reforestation. The process has favoured such land covers as sown grounds, mixed
agricultural-natural areas, broad-leaved and mixed woods.
The decrease has been particularly impressive – i.e. almost total disappearance of the original cover in favour
of other covers – near the borderline and the border belt both on the Italian and the Slovenian side regardless
of the kinds of natural region and landscape interested. As far as the cover of complex cultures mixed with
buildings is concerned, the influence of the border can be noticed both in the discontinuously built-up area of
Gorizia - Nova Gorica-Šempeter/Vrtojba and in the area – more to the south – of the Isonzo plain and of the
northern border of the Isonzo Karst corresponding to the Vipacco river as well as in the belt of the subalpine
landscape of Mt Sabotino.
The decrease in the width of the area, although significant, is less so in proportion to the increase of the
distance from the border, in particular in the scarcely built-up areas with prevailing agricultural or natural
use. The presence of the border and of the functions supported by the same has then brought about a decrease
in the cultural and landscape specialization and an increase in the phenomenon of the abandonment of
cultivations.
Covers characterized by agricultural areas mixed with natural vegetation have been subject, in general terms,
by a noticeable quantitative increase (about 70%) as a consequence of the dramatic decrease in the surface of
the complex covers mixed with buildings. However, in relative terms, about 50% of the areas covered by
mixed agricultural funds with mixed vegetation in 1992 have been subjected to land reconversion becoming
areas to be seeded , cultivations mixed with buildings or discontinuous buildings. The reconversion however,

in this case, does not depend on a smaller or greater distance from the border. Border dynamics therefore, at
least in this study case, do not influence processes of intensification of cultivations and of anthropization.
An isolated case is specialization of cultivations and anthropization, which can be noticed in the forefront of
the borderland, on the Italian side and has affected the area to the north of the Transalpina railway station,
near the international border of Salcano-Solkan. This is also due to the presence of an industrial zone and the
consequent decrease in the area with a natural vocation.
The last type of land cover examined is the one concerning the broad-leaved and mixed woods formations
(except for the coniferous formations of the subalpine belt) considered as a whole since, in the period
considered, the occupied surface does not vary in a significant way. However it must be said that, always in
relative terms, the areas which in 1992 were covered by woods are clearly (i.e. for ca. 20% of the total
surface) influenced by processes of deforestation and antropization.
This phenomenon is widespread in the whole of the transborder region but is increasingly marked towards
the borderline, particularly in the subalpine sectors and along the Vipacco river. In this case, too, there is an
exception proving the rule of the border influence, that is a remarkable deforestation in favour of vineyards
and orchards to the east of the municipality of Šempeter-Vrtojba, in an area which is relatively more far
away from the border.
After this preliminary analysis, a more detailed survey has been carried out on the border belt of Gorizia,
Nova Gorica e Šempeter-Vrtojba.69 We have examined the 4 bordering urban districts of the Municipality of
Gorizia (Piuma – Oslavia - San Mauro, Montesanto - Piazzutta, S. Rocco - S. Anna, S. Andrea) and the 7
border places corresponding to the abovementioned Slovenian municipalities (Nova Gorica, Pristava, Rozna
Dolina, Šempeter pri Gorici, Šmaver, Solkan, Vrtojba).
For this belt the quantitative differences 1992-2003 (in hectares) in the land cover have been worked out in
three large classes: urbanized land, agricultural land, natural soil. The same has been done for dynamics
concerning 5 change classes: naturalization, moderate re-naturalization, non varied, moderate anthropization,
anthropization. The results have been represented through histograms (cf. Appendix, sub 5, Tables 6-8).
Then the data derived from the 5 classes abovementioned have been overlaid to the 11 Italian and Slovenian
territorial units considered, also considering their main uses as reported in the previously harmonized town
planning schemes (cf. § 6.5). The result has then been mapped (cf. Appendix, sub 5, Tables 9-12).
69 In this research phase the decision of including into Gorizia Nova the municipality of Savogna d’Isonzo and the three places of Miren-Kostanjevica had not yet been taken.

It enables us to appreciate on the one side the context of spontaneous dynamics over ten years within the
single planning zones, while on the other to plan an analysis of the possible effects of zoning on the same
dynamics.
The work has been completed by summarizing the modifications observed in the single districts as
histograms (cf. Appendix, sub 5, Tables 13-19).
To comply with the aim of this study, all applications are mainly of a methodological kind. An obvious limit
is of course the number and kind of privileged classes, since it is not conceivable to exploit the whole
potential of territorial analysis offered by remote sensing images. A second limit, which can be noted in the
enclosed maps, is the definition level of images which for the sensor used (aboard Landsat 5) is in the range
of 30 m, i.e. on a graphical scale of 1:150,000.
The choice made among the different possibilities has been determined by the width of the available
spectrum cover as well as by the fact that this is the only satellite enabling comparisons on sufficiently long
temporal sets of data comparable to the time gap between two censuses.
It is obvious that in practice, should we choose shorter time intervals or just analyze static situations, it
would be possible to resort to sensor such as ASTER (satellite Terra, working since 1999) offering a spatial
resolution of 15 m, or the commercial satellite Quickbird 2 (2001) recording high definition panchromatic
and multi-spectrum images (2.44 – 2.88 m). We would thus obtain a resolution corresponding to a 1:75,000
or even a 1:14,000 scale, with a detail level which ought to meet the requirements of territorial planning.70
This would enable to plan a territorial monitoring not only as a support in taking planning decision but also
aimed at controlling dynamics and effects of planning of particular spatial issues. Such controls would be
particularly efficient as far as the physical and naturalistic components of territory are concerned.
70 On the subject, cf. A. Favretto, Strumenti per l’analisi geografica, GIS e telerilevamento, Bologna, Pàtron 2006, pp. 158-167.
8. EXAMPLES OF TRANSBORDER PROJECTS
8.1 AIRPORT PROJECTS
As far as the airport area is concerned, as has been already mentioned a thorough analysis has been carried
out about this infrastructure in its historical development and in its present situation, enriched by a research
on the market chances of a new airport use. On this basis an original hypothesis has been put forward,
founded on the future availability of new generation of aircrafts.
This hypothesis has been worked out so as to reach two different project configurations, for which a
preliminary urban planning analysis has been prepared in order to submit the alternatives in terms of use at a
graph level (cf. Appendix, sub 6, Tables 1-7).
The two alternatives took into account: a) the hypotheses advanced by Gorizia circles (Cultural Association
“Quarto Stormo”) for a reuse of the area for sports and museum purposes together, in a context of
cooperation with Slovenia. This should have brought to the creation of a Italian-Slovenian flight school, with
seats in Merna and Ajsevica; b) the particular value of this area, very wide, next to the border and therefore
attractive for settlements of particular significance, especially in the background of a gradual unification of
the two towns.
In the former case, the importance of the function of air transport would be limited, existing only as a support
to activities linked to the area but oriented towards markets of a different kind. The availability of the new
type of aircraft would have but a scarce significance, the best feature is which is the minimum requirements
as to take off/landing surfaces and approaching path. The “Phoenix” project would however require the
preservation of a rather wide area (at least, 50%) devoted to airport activity , with the exploitation of one of
the two runways. In this hypothesis, technological progress would not play a significant role.
In the latter case, we would have a reversed situation. The chance, theoretical as it may be, to organize a
“airtaxi”-like connection for the new city, for the time being named “Gorizia Nova” (and for which the
existence of a certain potential number of customers has been assessed), would enable to obtain a noticeable
set of advantages.
By keeping an airport, even of reduced dimensions, we would fulfil the wish of those who cherish the
historical memory of the place and of its values, thus enabling an easier change of use. At the same time, we
could actually safeguard a modern airport function, requiring limited (in this case, extremely limited)
dimensions. It must not be ignored, finally, the impact such an hypothesis would have on the entire local
“system”. Just a discussion over the possible introduction of one of the most sophisticated products of
modern technology in a stagnant transborder area would bring along interesting promotional effects.
The aircraft is in fact the fruit of a joint-venture between two of the most important producers of helicopters
in the world, the Agusta-Westland Group and the Bell Aerospace Co. The area would therefore be inserted in
an industrial/commercial plan at the maximum level, with an obvious propulsive effect in a territory no
longer penalized by the restraints imposed by the “cold war”. By the way, the Agusta group has recently won
the order to supply the helicopter fleet for the US President.
Being an innovative aircraft which is going to bring about a revolution in the air transport over distances of
200-400 km, the opening of a connection in Gorizia Nova would bring the new town into a future network
of mid-level centres within the EU.
Until summer 2001 hypothesis a) seemed bound to prevail thanks to a declared (and recently renewed)
interest in a transborder cooperation on part of Slovenia. Later however, the situation, which had remained at
a discussion stage, has cleared in the sense that the project has been dropped. On one side in fact the whole
range of the submitted hypothesis had been adopted by a consortium working in the Campoformido airport.
Historical seat of the Acrobatic National Team – in future also the airfield structures of the Technical
Institute “Malignani” in Udine are going to be transferred there – this airport owns a series of structures
which would make unnecessary the creation of yet another similar facility in Friuli Venezia Giulia. In
addition, the Slovenian wish to exploit the Ajsevica site founding there an Italian-Slovenian airclub and the
creation of a transborder museum route contributes to deprive of significance the Gorizia initiative.
It can therefore come as no surprise that the managers of the Aeroporto di Gorizia Spa are pursuing some
initiatives only on the Italian side: for the time being, just the renovation of some totally dilapidated
buildings, for which necessary funding has been found. The same are considering the idea of a possible
settlement of some firms in the airport area, so that the prospects for a reuse of the area for non-airport aims
is on the agenda again. This would give a new thrust to our hypothesis b), which took it for granted that it
was very difficult to maintain an anachronistic use and therefore proposed to abandon it. It is however true
that the final development of the aircraft has suffered a great delay, so that the submitted hypotheses, both in
terms of operating costs and market prospects, are also to be reconsidered.
8.2. THE “SABOTIN” PROJECT
The attention paid to the Sabotin area derives from a specific request by the Slovenian partner, which ha
acknowledged its highly significant role for a transborder planning. After several investigations carried out
through analysis of satellite images integrated by surveys, an hypothesis for the use of territory for
cultural/gymnastic tourism – on two equipped paths, one on the Italian, the other on the Slovenian side - has
been worked out.
The project can now be considered formally perfect and liable to be translated into planning provisions (cf.
in Appendix, sub 3, Tables 1-10).
The work is completed from a methodological point of view by a transborder didactical proposal for the
subject of environmental education, worked out both for Italian and Slovenian primary schools. This
particular proposal centres around the Gorizia Karst, especially the Gradina Visitor Centre in Doberdò del
Lago.
The study area is located at the junction between Collio and Gorizia Karst geographical regions. Among its
characteristics, besides its exclusive aesthetic-landscape value and the presence of noteworthy historical and
archaeological remains there are the importance of the “landa carsica” habitat and the existence of some
paths already used for excursions. All this has inspired a study incorporating all collected information for an
area of no easy cartographic position owing to the development of the borderline along the ridge of the
mountain.

8.3. RENOVATION OF AN URBAN AREA
The progressive southward shift of the town barycentre, begun in the middle of the Eighteenth century with
the building of the southern railway station has gradually eroded the importance of the historical town. This
fact, together with the constantly increasing car traffic, has deprived some urban sites of any functional and
typological specificity.
For example Piazza S. Antonio, the oldest square in town,71 once housing the monastery and the St. Francis
church of Friars Minor Conventual, later town markets and fairs, over time has lost all its functions. This
valuable urban space with its characteristic colonnade which makes it particularly fascinating has been
abandoned long years among the citizens’ indifference, made just a little more livelier by a couple of bars
which have been opened in the last years under the shadow of the eighteenth-century colonnade.
A renewal project for this place has therefore proposed a number of interventions which aim at bringing out
its beauty by stressing its historical character as has emerged from the study of 5 historical-cartographical
documents analyzed. The aim of this intervention philosophy is to reclaim the urban role of the place, at the
same time offering visitors significant elements to read the formation process and the changes which have
taken place in the square (cf. Appendix, Tables 1-6).
First, the entire part of the place embraced by the colonnade should be brought to level with the road surface
(today it is about a meter under the level both of the colonnade paving and of the pavement). This
intervention, together with the following ones (remodelling of the perimeter of the square and of its paving
using Aurisina stone) aims at giving back to the area its unitary image, with no differences in level to suggest
discontinuity.
As to the paving itself, a path should be realized using stones with different colours and surface finishing in
order to follow the perimeter of the no longer existing St. Anthony church and chapel. This intervention
aims at characterizing the “texture” of the stone paving of the whole area thus discreetly reminding of the
former Franciscan presence, as still does the name of the square.
Another intervention inspired by the ancient religious complex is the garden area planned where via Rabatta
meets St. Anthony Square. As proved by historical-cartographical sources, in this point there was the court in
front of the St. Francis church. Here a small green area named “St. Francis Garden” should be realized,
enriched and inspired by a centuries-old tree dominating the whole square but at present strangled by an
uneven paving actually reaching the base of the trunk and by a parking place. Moreover, the green surface
next to Lantieri Palace will be increased (under the name of “Schönhaus Garden”). The new green space will
71 Stasi D., La strada per il settimo cielo, in “Isonzo-Soča”, no.38, Transmedia S.p.a., Gorizia 2000
exploit the widening of the road which according to the designer are but rarely used by the reduced car traffic
in this area.
The most important piece of street furniture included in the project is the gazebo to be put in the middle of
the square to meet the need of a covered structure to give the square a typical image and a functional identity
at the same time. It should be a metal structure, styled in harmony with the surrounding space and with a
multipurpose role. It could be used for small concerts, thanks to the acoustics given by the “U” form of the
arcade behind, or as a sheltered place for the customers of the bars in the place. Gazebo and arcade together,
finally, could house the markets or fairs to be held in town on special occasions.
For instance the antique exhibition would find here a wider, more adequate place than the present in piazza
Tommaso (Piazzutta). Also a gastronomic event such as “Gusti di frontiera” (Border Tastes) would have
here one more valuable place besides the traditional ones.
Another intervention would be the paving in sampietrini stones of the road between Cavour Square and Via
d’Alviano. Moreover, to emphasize the historical character of this road (the initial stretch of the
Wienerstrasse), there will be a paving made with river cobblestones and stone carriage belts made up of two
long stone paving strips along the road. As to other street furniture, the well (now in central position) should
be moved to the north-west side of the square near the “St. Francis Garden” and there would be some stone
seats on the side of the square facing the street as well as in both gardens.
The project also deals with the aesthetic and functional improvement of public lighting system, to be
redesigned by means of street lamps with an eighteenth-century tourists who, thanks to adequate signposts,
will come to know the story of the monuments and the genesis process of the square.
The project aims at being just a tessera of the general restyling72 of the historical centre of the town. In fact,
the renovation of the complex made up of piazza Sant’Antonio, piazza Cavour, piazza Vittoria, piazza De
Amicis and piazza Tommaseo as well as of the road axis linking them can be found among the provisions of
the “New General Town-Planning Scheme” as an “operative condition” with the task of hand down and at
the same time improve these valuable public spaces. They are indeed an heritage for future generations, but
their present decay depreciate their value.
72 Begun in 2004 with the renovation of Piazza Cavour.
CONCLUSIONS
The end of the “cold war” laid the foundations for a normalization of relations between Italy and Slovenia,
thus offering Friuli Venezia Giulia, Slovenia and Croazia a number of options, each of them accompanied
by problematic issues. All of a sudden we have experienced a situation which under many points of view
brings us back to 1914.
The entry of Slovenia into the EU is a complex operation which is going on gradually although the country
was from the beginning among those better prepared to the great transformation. In 2007, with the adoption
of euro, the value barrier is going to disappear. Moreover, the proposal submitted by the Autonomous Region
Friuli Venezia Giulia of a transboundary integration at more levels within the innovative formula of
Euroregion is also under way. However, for the full liberalization of movements through the border it will be
probably necessary to wait until 2008, since Slovenia is finding it difficult to comply with Schengen
regulations.
As far as our study area is concerned, the challenge is to manage a renewed approach between the two halves
of the Gorizia territory, more than once separated as a consequence of the two world wars. The prerequisites,
demographical and territorial, are there; the point is, which elements can be useful to enable the new
community to fully express its potentialities so as to seize the development opportunities. The key to the
question lies in the economy, so that it can be answered by singling out the most promising sectors. For the
time being, the horizon is dominated by the international division of work due to globalization and it is
therefore easy to suggest that the answer is to be found in the service sector. In particular, in those services
which can support a network of economic enterprises and, what is more, give rise to a managers’ class able
to gradually get control over development processes.
An economic development centred on a number of projects in the tertiary sector could seem less demanding
as far as the pressure on territory and environment is concerned if compared with the old models based on
the manufacturing industry. This is in part the case, but we must not underestimate two aspects linked to the
needs of a post-industrial world.
In an economic system founded on mass consumption it is necessary to take into account the size of
structures today required by the large-scale retail trade, so wide that they cannot be located within urban
centres. Hence the choice of peripheral locations along the thoroughfares, which become the precondition for
the feasibility of trade settlements. In other words, the retail system replaces industry as to the movement of
goods, moreover requiring an unheard-of need for customer mobility.
All this implies an overall redesigning of historical urban structures, which risk being deprived of their most
valuable features. The urban centre loses in centrality and becomes just one among the many elements of a

“car town”, becoming less and less compact. This epoch-making revolution marks the end of the XVIII-XIX
century town planning and is for the communities interested in Gorizia Nova a great chance of development
challenging both border areas. Sites until recently made fruitless by the border overnight reach overnight
rocketing market prices. It is rumoured that the HIT company has bought all the free areas along the border
with Italy in order to take part in the new initiatives. The athmosphere between the neighbouring local
administrations is of great cooperation, as is proved by the initiative of the University of Nova Gorica to
open a branch in Gorizia and by the willingness of the Municipality of Šempeter-Vrtojba to house on its
territory part of the roads necessary to realize great trade, recreational and service projects in the area the
PRG of Gorizia calls “Park of the Great Facilities”. Important here is not only the willingness to support an
initiative on Italian territory, but above all the acceptance of the principle that structures serving great
catchment areas are to be located on the basis of technical-economical rationality and not of the nationality
of territories. This is the equivalent, from a spatial point of view, of the opening of the capital and labour
markets already reached.
Optimism in this respect may sound sometimes excessive, considering the problems posed by the
concentration in a limited area of a number of road axes difficult to coordinate spatially. Another question is
the location in Gorizia of the redevelopment area bound to become a “business park”. One may in fact
wonder if the realization of a structure with big buildings is the best solution for the square in front of the
historical border pass of Casa Rossa (Red House). Perhaps a green area would suit better the spatial texture
of Slovenian territory. At an institutional level, the forthcoming independence of the Municipality of Renče-
Vogrsko can be also seen as a sign of the times.
The event is part of the trend, emerged in Slovenia after the independence, to multiply municipal autonomies
thus breaking down the great municipalities inherited from the socialist system. This had followed the path
opened by the Italian administration, which tended to gradually unify the micro municipalities of the
Austrian administrative network. The rationalization carried on between the two world wars had been
undoubtedly positive from a technical point of view, the one after 1947 a little less; both had in common the
trend to unify coordination and control functions, a typical feature of state-controlled regimes. The political
judgement is of course different. At a closer examination, in the wider Littoral region, which in Gorizia G. I.
Ascoli will name Venezia Giulia, the mergers have been functional to the development needs of the urban
centres. The reverse of the medal are the decisions concerning large areas, for the management of which
there will be increasing coordination problems.
In this case, the trend seems to lead towards a gradual dismantling of the great municipality of Nova Gorica.
Its substitution through a number of local authorities would necessary lead to a redefinition of the powers of
territorial management. The point of view at that time will however be a transborder one. As the Mayor of
Nova Gorica Brulz officially declared (19th April, 2006): “The creation of the Goriška region is important for
us. But even more important is to obtain the acknowledgement of the Gorizia Euroregion so as to give this
area, on this and on the other side of the border, a new chance of development”.
On the Italian side, the new Regional Urban Plan of Friuli Venezia Giulia, now at an advanced stage,
introduces the concept of “joint planning”, giving more autonomy to municipalities and provinces in all
choices concerning the development of their territory. From both sides of the border, therefore, there is a
trend to redistribute town planning powers over the territory.
Moreover, the creation of the Districts for Territorial Development (ASTER) by the Region Friuli Venezia
Giulia within the reform of local autonomies can be a positive instrument to cooperate with the Slovenian
partners, which in turn, thanks to the new Spatial Planning Act (in force since 1.1.2003), have the power to
decide joint strategies of spatial development and detailed spatial plans.
While urban dynamics seem to tend almost automatically towards the aim of a territorial recomposition,
many expectations are linked to the process of further widening of the EU seen as the chance to trigger a
stage of accelerated development in the area considered. On both sides of the border, Gorizia Nova aims in
fact at becoming a strategic junction in the east-west trade. This of course cannot be achieved without a
sound infrastructural policy to be adopted by the two neighbouring countries.
As many researches have proved so far, not least AlpenCors (p. 23): “In the case of Corridor V and of its
central part there is a widespread tension and many critical points, above all an increase in the mobility
demand which in the long run is not compatible with the now available infrastructure both as regards
efficiency and replaceability. The risk of a huge jam is looming, which would cause a clear localization
diseconomy when compared to other east-west routes in particular north of the Alps, already existing
activities would be disadvantaged and potentials for the setting up of new activities and the attraction of
tourists from abroad would decrease”.
The difficulties, both of political and financial nature, arisen recently in our country are threatening to stop
the works for the railway high speed (independently of the routes and projects chosen) and cast a shadow on
a picture which would otherwise be quite a reassuring one.

Table 1
Gorizia Border System: Border Post Movements (Three First Countries) Source: processing of data from Border Police, Gorizia
Extra-Schengen Traffic 2003
Italy Slovenia Croatia TOTAL In Out In Out In Out In Out
January 189,193 187,043 92,627 91,250 2,330 1,018 291,565 281,752 February 189,788 186,821 91,046 85,907 2,310 780 291,224 276,015 March 208,149 201,369 104,706 102,584 2,548 862 326,956 307,801 April 232,290 219,558 109,502 103,241 3,019 1,041 356,987 328,953 May 229,280 219,456 117,995 110,958 3,046 1,009 362,473 335,927 June 219,021 211,787 106,365 104,999 2,920 902 342,317 324,551 July 233,867 227,039 111,653 108,811 3,689 1,285 366,171 348,069 August 243,166 223,679 124,522 117,943 2,127 1,197 382,885 352,096 September 223,661 217,056 111,577 110,203 3,354 1,006 353,768 333,273 October 220,142 218,603 114,576 115,747 3,557 1,144 352,554 339,833 Novembre 203,077 193,784 106,786 103,723 3,299 1,170 328,216 301,701 December 226,482 236,662 132,384 122,848 2,241 1,296 369,765 368,851 TOTAL 2,618,116 2,542,857 1,323,739 1,278,214 34,440 12,710 4,124,881 3,898,822
Table 2
Gorizia Border System: Border Post Movements Source: processing of data from Border Police, Gorizia
Local Traffic 2003
ITALY SLOVENIA In Out In Out
January 154,831 155,080 231,615 228,881 February 142,058 135,529 213,928 211,946 March 160,996 149,022 258,135 253,431 April 162,620 156,589 252,844 248,043 May 164,629 159,110 301,575 296,026 June 160,072 159,470 250,288 245,918 July 168,875 161,633 327,671 325,858 August 176,760 169,709 227,617 223,557 September 166,118 162,879 325,161 316,282 October 163,076 160,176 253,315 254,363 Novembre 162,994 165,483 324,248 314,387 December 166,734 174,303 287,407 276,639 TOTAL 1,949,763 1,908,983 3,253,804 3,195,331
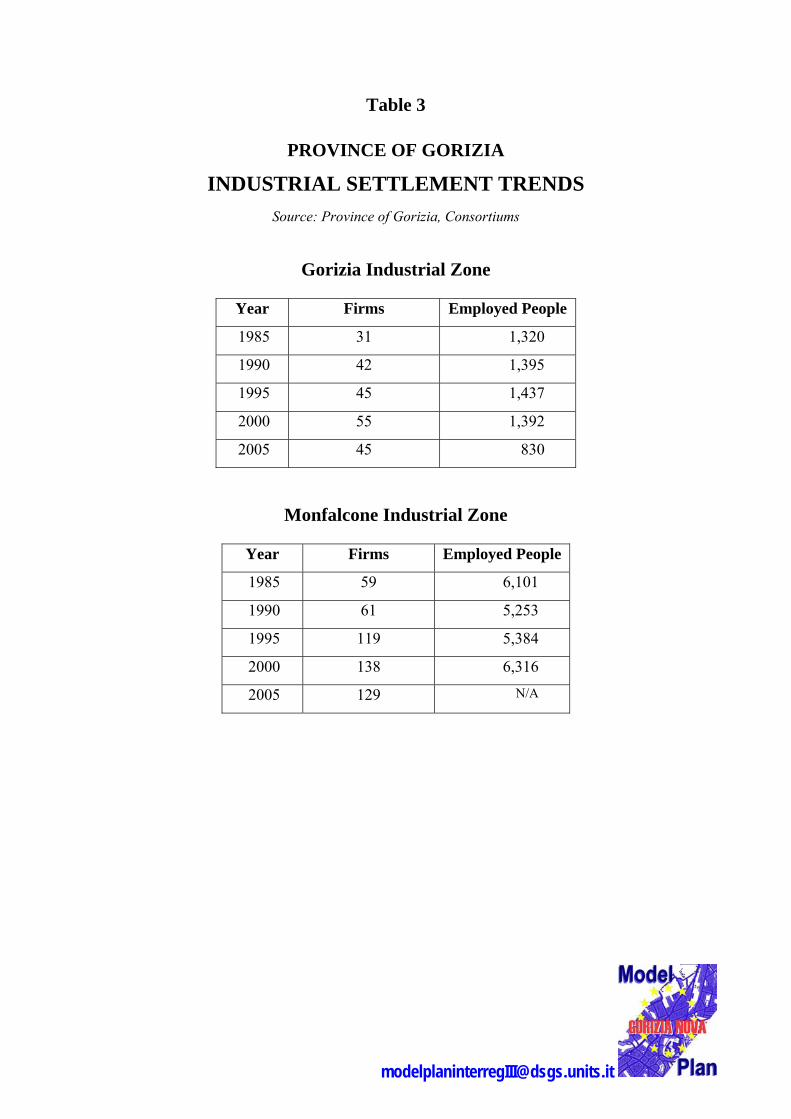
Table 3
PROVINCE OF GORIZIA
INDUSTRIAL SETTLEMENT TRENDS Source: Province of Gorizia, Consortiums
Gorizia Industrial Zone
Year Firms Employed People
1985 31 1,320
1990 42 1,395
1995 45 1,437
2000 55 1,392
2005 45 830
Monfalcone Industrial Zone
Year Firms Employed People
1985 59 6,101
1990 61 5,253
1995 119 5,384
2000 138 6,316
2005 129 N/A

Table 4
ENROLMENT TRENDS UNIVERSITY SEATS OF GORIZIA AND CORMONS
Source: Universities of Trieste, Udine
UNIVERSITY TRIESTE UNIVERSITY UDINE TOTAL Year Courses Enrolments Courses Enrolments Courses Enrolments
1993 4 780 3 25 7 805
1994 4 804 3 74 7 878
1995 4 786 3 115 7 901
1996 4 773 3 138 7 911
1997 4 795 3 169 7 964
1998 4 807 3 624 7 1,431
1999 4 828 3 1,023 7 1,851
2000 4 829 4 1,485 8 2,314
2001 4 779 4 1,825 8 2,604
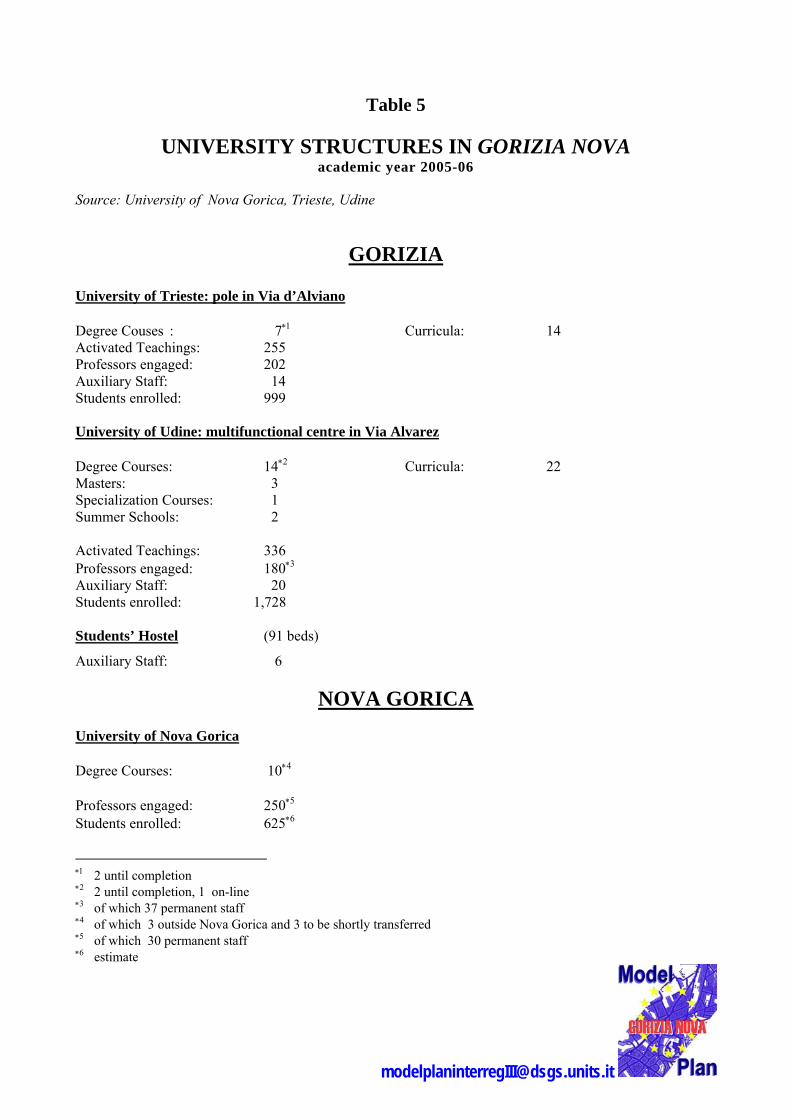
Table 5
UNIVERSITY STRUCTURES IN GORIZIA NOVA academic year 2005-06
Source: University of Nova Gorica, Trieste, Udine
GORIZIA
University of Trieste: pole in Via d’Alviano Degree Couses : 7∗1 Curricula: 14 Activated Teachings: 255 Professors engaged: 202 Auxiliary Staff: 14 Students enrolled: 999 University of Udine: multifunctional centre in Via Alvarez Degree Courses: 14∗2 Curricula: 22 Masters: 3 Specialization Courses: 1 Summer Schools: 2 Activated Teachings: 336 Professors engaged: 180∗3 Auxiliary Staff: 20 Students enrolled: 1,728 Students’ Hostel (91 beds)
Auxiliary Staff: 6
NOVA GORICA University of Nova Gorica Degree Courses: 10∗4 Professors engaged: 250∗5 Students enrolled: 625∗6
∗1 2 until completion ∗2 2 until completion, 1 on-line ∗3 of which 37 permanent staff ∗4 of which 3 outside Nova Gorica and 3 to be shortly transferred ∗5 of which 30 permanent staff ∗6 estimate

Table 6
EXTRAUNIVERSITY RESEARCH STRUCTURES IN GORIZIA NOVA
2006
GORIZIA INSTITUTE OF INTERNATIONAL SOCIOLOGY
Staff:∗ 15 units
Budget 2005:∗1 € 1,500,000
CENTRE FOR THEORETICAL AND APPLIED ECOLOGY
Staff:* 7 units
Budget 2005:* € 600,000
REGIONAL CENTRE FOR AGRICULTURAL EXPERIMENTATION
Staff: 4 units
REGIONAL CENTRE FOR ENVIRONMENTAL PROTECTION (A.R.P.A.)
Staff:* 40 units
OBSERVATORY FOR PLANT DISEASES
Staff: ∗ 5 units
EXPERIMENTAL INSTITUTE FOR PLANT NUTRITION
Staff: ∗ 15 units
∗ Comprises all staff, both permanent and not, with no distinction between researchers and auxiliary staff. ∗1Rounded up figures. ∗ ∗
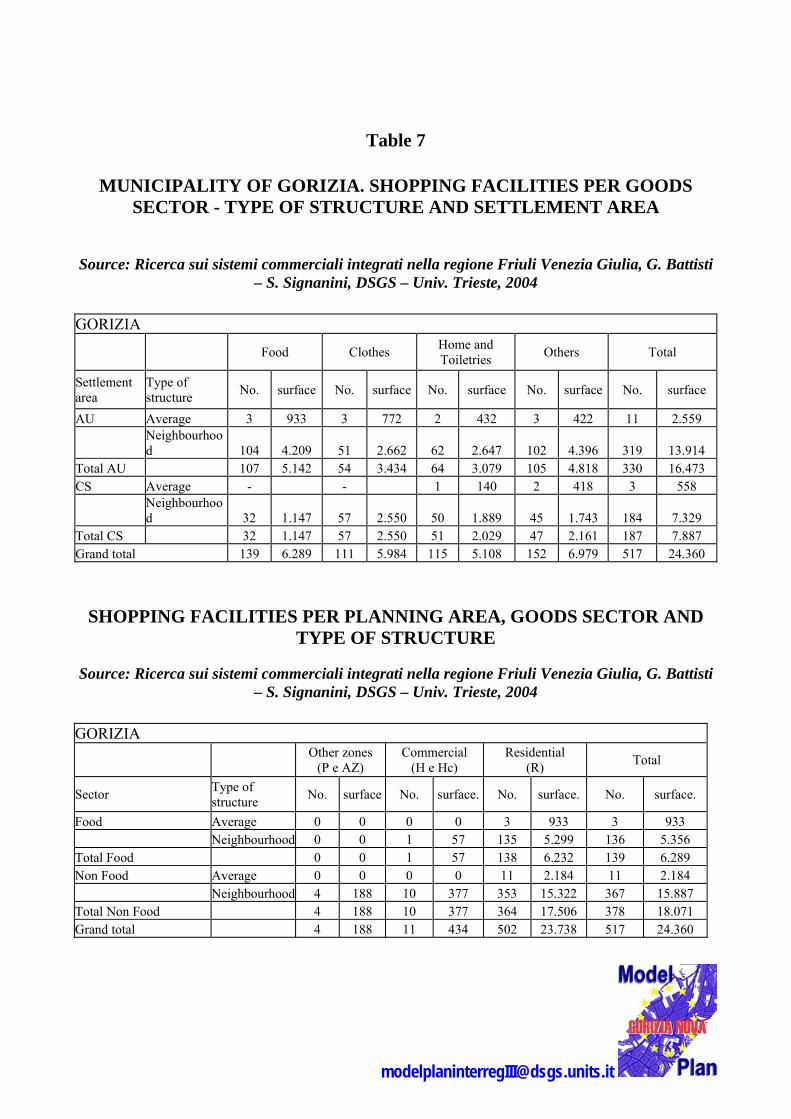
Table 7
MUNICIPALITY OF GORIZIA. SHOPPING FACILITIES PER GOODS SECTOR - TYPE OF STRUCTURE AND SETTLEMENT AREA
Source: Ricerca sui sistemi commerciali integrati nella regione Friuli Venezia Giulia, G. Battisti – S. Signanini, DSGS – Univ. Trieste, 2004
GORIZIA
Food Clothes Home and Toiletries Others Total
Settlement area
Type of structure No. surface No. surface No. surface No. surface No. surface
AU Average 3 933 3 772 2 432 3 422 11 2.559
Neighbourhood 104 4.209 51 2.662 62 2.647 102 4.396 319 13.914
Total AU 107 5.142 54 3.434 64 3.079 105 4.818 330 16.473 CS Average - - 1 140 2 418 3 558
Neighbourhood 32 1.147 57 2.550 50 1.889 45 1.743 184 7.329
Total CS 32 1.147 57 2.550 51 2.029 47 2.161 187 7.887 Grand total 139 6.289 111 5.984 115 5.108 152 6.979 517 24.360
SHOPPING FACILITIES PER PLANNING AREA, GOODS SECTOR AND TYPE OF STRUCTURE
Source: Ricerca sui sistemi commerciali integrati nella regione Friuli Venezia Giulia, G. Battisti – S. Signanini, DSGS – Univ. Trieste, 2004
GORIZIA Other zones
(P e AZ) Commercial
(H e Hc) Residential
(R) Total
Sector Type of structure No. surface No. surface. No. surface. No. surface.
Food Average 0 0 0 0 3 933 3 933 Neighbourhood 0 0 1 57 135 5.299 136 5.356 Total Food 0 0 1 57 138 6.232 139 6.289 Non Food Average 0 0 0 0 11 2.184 11 2.184 Neighbourhood 4 188 10 377 353 15.322 367 15.887 Total Non Food 4 188 10 377 364 17.506 378 18.071 Grand total 4 188 11 434 502 23.738 517 24.360


Table 8
TOURISM IN SLOVENIA 2002 Source: Slovenian Tourism Business Association, 2002
Tourists nights
Total 2.161.960 7.321.061 Slovenians 859.941 3.300.262
Foreigners 1.302.019 4.020.799 Italy 274.792 718.384
Austria 193.442 4.020.799 Germany 229.211 848.418 Croatia 94.176 256.145
Great Britain 46.117 194.021 Holland 38.682 150.345 Russia 15.370 92.553 Israel 31.972 64.142 USA 30.103 69.838
Czech Republic 30.030 62.401 Bosnia 27.770 80.475 France 27.863 63.494 Poland 24.805 56.018 Belgium 23.637 95.241
Switzerland 17.555* 57.920
Tourists in Nova Gorica nights
Total 53.817 91.331
Visitors of Casino Nova Gorica
Total 2.203.538 *data 2001
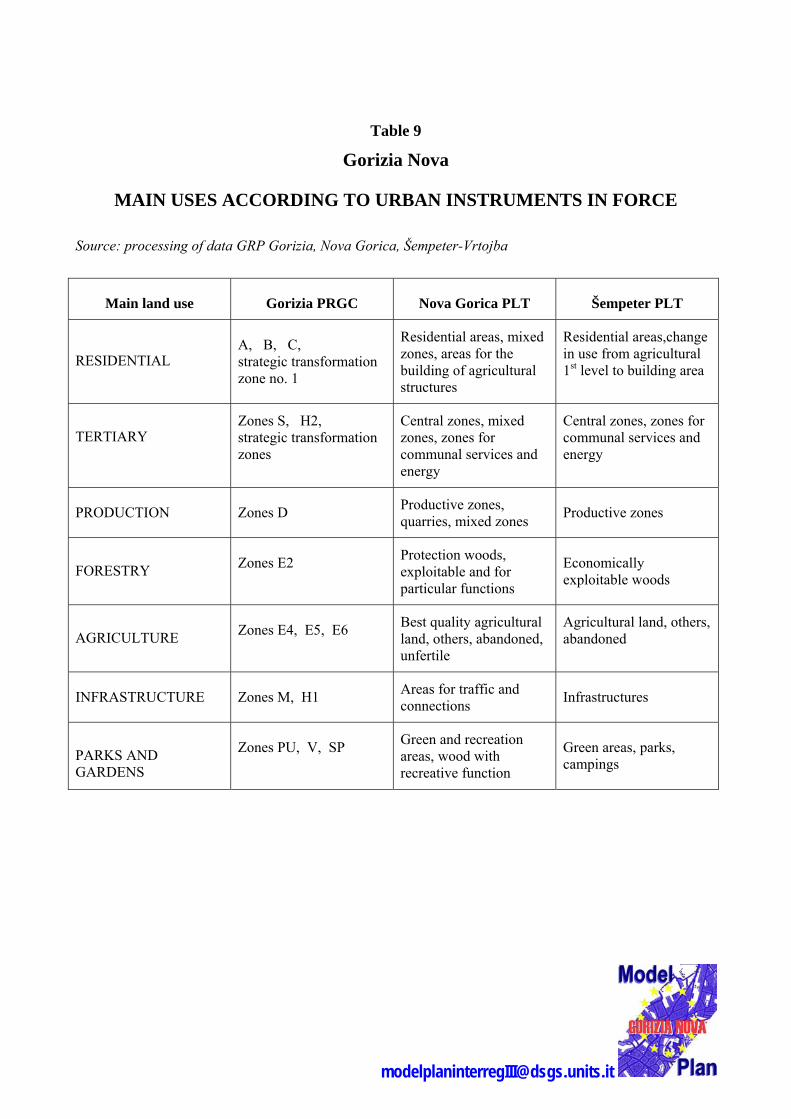
Table 9
Gorizia Nova
MAIN USES ACCORDING TO URBAN INSTRUMENTS IN FORCE
Source: processing of data GRP Gorizia, Nova Gorica, Šempeter-Vrtojba
Main land use Gorizia PRGC Nova Gorica PLT Šempeter PLT
RESIDENTIAL A, B, C, strategic transformation zone no. 1
Residential areas, mixed zones, areas for the building of agricultural structures
Residential areas,change in use from agricultural 1st level to building area
TERTIARY Zones S, H2, strategic transformation zones
Central zones, mixed zones, zones for communal services and energy
Central zones, zones for communal services and energy
PRODUCTION Zones D Productive zones, quarries, mixed zones Productive zones
FORESTRY Zones E2 Protection woods, exploitable and for particular functions
Economically exploitable woods
AGRICULTURE Zones E4, E5, E6 Best quality agricultural land, others, abandoned, unfertile
Agricultural land, others, abandoned
INFRASTRUCTURE Zones M, H1 Areas for traffic and connections Infrastructures
PARKS AND GARDENS
Zones PU, V, SP Green and recreation areas, wood with recreative function
Green areas, parks, campings

Table 10
TRANSBORDER MUNICIPALITIES IN THE GORIZIA AREA
Source: censuses 2001/ 2002
Municipality Inhabitants Surface
ha Density inhs/sq
km
GORIZIA 35,667 4,111 868
SAVOGNA D’ISONZO 1,722 1,641 105
TOTAL ITALY 37,389 5,752 650
NOVA GORICA∗ 35,483 21,109 168
ŠEMPETER-VRTOJBA 6,269 1,965 319
MIREN-KOSTANJEVICA 3,732 604 618
TOTAL SLOVENIA 45,484 23,678 192
GENERAL TOTAL 82,873 29,430 282
∗ comprising the new municipalità of Renče-Vogrsko
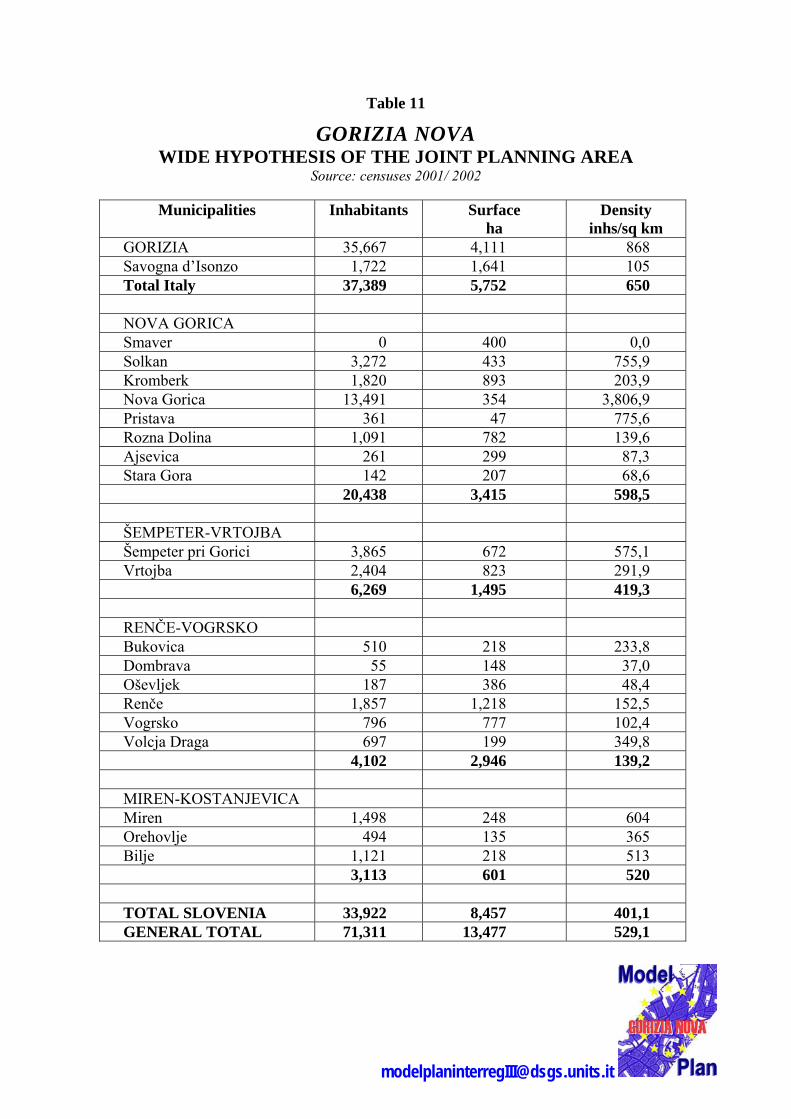
Table 11
GORIZIA NOVA WIDE HYPOTHESIS OF THE JOINT PLANNING AREA
Source: censuses 2001/ 2002
Municipalities Inhabitants Surface ha
Density inhs/sq km
GORIZIA 35,667 4,111 868 Savogna d’Isonzo 1,722 1,641 105 Total Italy 37,389 5,752 650 NOVA GORICA Smaver 0 400 0,0 Solkan 3,272 433 755,9 Kromberk 1,820 893 203,9 Nova Gorica 13,491 354 3,806,9 Pristava 361 47 775,6 Rozna Dolina 1,091 782 139,6 Ajsevica 261 299 87,3 Stara Gora 142 207 68,6 20,438 3,415 598,5 ŠEMPETER-VRTOJBA Šempeter pri Gorici 3,865 672 575,1 Vrtojba 2,404 823 291,9 6,269 1,495 419,3 RENČE-VOGRSKO Bukovica 510 218 233,8 Dombrava 55 148 37,0 Oševljek 187 386 48,4 Renče 1,857 1,218 152,5 Vogrsko 796 777 102,4 Volcja Draga 697 199 349,8 4,102 2,946 139,2 MIREN-KOSTANJEVICA Miren 1,498 248 604 Orehovlje 494 135 365 Bilje 1,121 218 513 3,113 601 520 TOTAL SLOVENIA 33,922 8,457 401,1 GENERAL TOTAL 71,311 13,477 529,1

BASIC BIBLIOGRAPHY
AA.VV., Analisi socio-economica della provincia di Gorizia, Provincia di Gorizia, CCIAA di Gorizia, Gorizia 2002
AA.VV., Gorizia 2001, Nuovo Piano Regolatore Generale, Comune di Gorizia, Gorizia 2002
AA.VV., Linee guida per una pianificazione coordinata dell’area transfrontaliera, Provincia di Gorizia, Gorizia 2005
AA.VV., Piano strategico Gorizia 2010. Idee per crescere in Europa. Comune di Gorizia, Gorizia 2004
AlpenCors – Alpen Corridor South. Linee guida per una politica del Corridoio V, Regione Veneto, Venezia 2005
B. Bartol et al., (eds)., The Spatial Development Strategy of Slovenia, Ministry of the Environment, Spatial Planning and Energy, Office for Spatial Development, Ljubljana 2004
G. Battisti, “Per un’analisi geografica delle aree di confine”. Atti Convegno di Studi in onore di Giorgio Valussi, a cura di G. Battisti e P. Nodari, vol. II, Trieste 1996, pp. 9-23
G. Battisti, (cur.), Un pianeta diviso. Contributi alla geografia dei popoli e dei confini, Università di Trieste, Dipartimento di Scienze Geografiche e Storiche, Trieste 2002
G. Battisti, “Esperienze di pianificazione territoriale nell’area di confine. Il progetto Gorizia Nova – Model Pan”, Glasnik ZRS Koper, st. n. 7, 2005, pp. 79-81
E. Bonetti, La localizzazione delle attività al dettaglio, Giuffrè, Milano 1967
S. Boato, F. Graziati (cur.), La costruzione del piano territoriale provinciale. Linee guida per l’elaborazione del P.T.P.C. della Provincia di Gorizia, Provincia di Gorizia, Gorizia 2002
F. Carli, L’aeroporto di Gorizia. Un nodo strategico per lo sviluppo transfrontaliero: un’ipotesi di riuso, Diss. di laurea in Politica del Territorio, Univ. di Trieste (Fac. di Scienze della Formazione), a. a. 2003–04
D. Cigale, “Centralna naselja v Sloveniji njihova vplivna območja a letu 1999 (Central places in Slovenia and their spheres of influence in 1999)”; in Geografski Vestnik,74-1, 2002, pp. 43-56
Comune di Gorizia, Piano strategico Gorizia 2010: idee per crescere in Europa, Comune di Gorizia, Gorizia 2004
Consorzio per il bacino di traffico delle Province di Trieste e Gorizia, Piano Comprensoriale Trasporti, Vol. I, Udine 1979
V. Drozg, Morfologia vaških naselij sloveniji (Morphology of rural settlements in Slovenia), Geographica Slovenica 27, 1995
A. Favretto, Strumenti per l’analisi geografica, G.I.S. e telerilevamento, Patron, Bologna 2006
T. Favaretto, S. Gobet, L’Italia, l’Europa centro-orientale e i Balcani, Laterza - ISDEE, Roma-Bari 2001
T. Favaretto, “Developments and problems in East West traffic south of the Alps”, in EST-OVEST, 2005, pp. 193-208.
I. Garofolo, E. Marchigiani, Linee guida per lo sviluppo transfrontaliero Italia-Slovenia, Univ. di Trieste – Dip. di Progettazione Architettonica e Urbana, Trieste 2005
A. Gasparini, A. Zago, Gorizia, Nova Gorica e le aree di confine italo-sloveno. C’è un futuro di integrazione differenziata? ISIG, Gorizia 1998
A. Gasparini, Problemi e prospettive dello sviluppo di euroregione sul confine nord-orientale italiano. Il caso del Friuli Venezia Giulia, ISIG, Gorizia 2000

M. Gortani (cur.), Gorizia con le Vallate dell’Isonzo e del Vipacco, Soc. Alpina Friulana, Udine 1930
P. Komjanc, L’area goriziana nel contesto transfrontaliero. Linee guida per il coordinamento della Pianificazione Territoriale ed Urbanistica, Diss. di laurea in Politica del Territorio, Univ. di Trieste (Fac. di Scienze della Formazione), a. a. 2001–02
A. Luchitta, Scritti sulla storia economica di Gorizia e della sua Provincia, Ist. Giuliano Storia, Cultura e Documentazione, Gorizia 2001
G. Maini, “Gorizia”, Enciclopedia monografica del Friuli Venezia Giulia, 1/II Il paese, Udine, Istituto per l’Enciclopedia del Friuli Venezia Giulia, 1971, pp. 825-838
J. Nared, “Razvitost slovenskih občin in nadaljnje razvojne perspectu (The development level of Slovenian municipalities and their development perspectives)”, in Geografski Vestnik, 74-2. 2002. pp. 33-46
B. Pavlin, Sodobne spremembe kmetijske rabe tal v izbranih obmejnih pokrajinskih enotah primorske Slovenije (Contemporary changes in the agricultural use of land in the border landscape units of the Slovene Littoral), Geographica Slovenica, 22 II, 1991
Pokrainsko ranljiva območja v Sloveniji (Landscape vulnerable areas in Slovenia), Geographica Slovenica, 33 I, 2000
Regionalni razvoj v Sloveniji (Regional Development in Slovenia), Geographica Slovenica, 33 II, 2000
C. Sambri, Una frontiera aperta. Indagini sui valichi italo – iugoslavi, I.S.I.G., Gorizia 1970
A. Sgamati, J. Zafran, Atlante internazionale antincendio – Čezmejni Atlas Protipožarnik Objektov, Regione Autonoma Friuli Venezia Giulia – Ispettorato Dipartimentale Foreste di Trieste e Goriia /Zavod za Gozdove Slovenjie – Območna enota Sežana, Trieste – Sežana 2006
SWG (cur.), Indagine sull’atteggiamento dei cittadini del Friuli-Venezia Giulia nei confronti dell’allargamento dell’Unione Europea alla Slovenia, Regione Autonoma Friuli Venezia Giulia, Trieste 2004
G. Valussi, Il confine nordorientale d’Italia, ISIG, Gorizia 2000
G. Valussi, “La fonction internationale de la frontière italo-yugoslave”, Cahiers Géogr. Québec, 1974, n. 43, p. 67-92
Programma di riconciliazione per lo sviluppo di Gorizia, Nova Gorica e Šempeter-Vrtojba (2000-2006), Gorizia, s.d.
LIST OF TABLES 1. BASIC SCENARIOS
SCENARIOS ENVISAGED ACCORDING TO VARIOUS EU CONFIGURATIONS
SCENARIOS ENVISAGED FOR SELECTED EU COUNTRIES
SCENARIOS ENVISAGED FOR SELECTED EU / NON EU COUNTRIES - 1
SCENARIOS ENVISAGED FOR SELECTED EU / NON EU COUNTRIES - 2
SCENARIOS ENVISAGED FOR SELECTED EU / NON EU COUNTRIES - 3
EU 25 – INCREASE IN TRANSPORT ACTIVITY
EU 25 – STRUCTURE OF GOODS TRANSPORT
EU 25 – STRUCTURE OF PASSENGER TRANSPORT ACTIVITY
EU 25 - PASSENGER TRANSPORT ACTIVITY
EUROPEAN URBAN NETWORK – EXTRACT, PAN-EUROPEAN CORRIDOR NR. 5 STATISTICAL AREAS NUTS – 3
PAN-EUROPEAN CORRIDOR NR. 5. STATISTICAL AREAS NUTS – 3
PAN-EUROPEAN CORRIDOR NR. 5. INTERNAL GROSS PRODUCT (MARKET PRICES): 2000 – 2003. STATISTICAL AREAS NUTS - 3
PAN-EUROPEAN CORRIDOR NR. 5. TOTAL EMPLOYMENT (NR EMPLOYED) 2000 – 2003. STATISTICAL AREAS NUTS - 3
ECONOMIC TRENDS IN THE COUNTRIES USING THE ITALIAN-SLOVENIAN BORDER CROSSINGS: AMOUNTS IN BILLION US DOLLARS 2003 – 2005 – 2008
GORIZIA CUSTOMS INSPECTION AREA FOR TRANSPORT VEHICLES: AREA OF ORIGIN OF OUTGOING NATURAL GAS 2003
GORIZIA CUSTOMS INSPECTION AREA FOR TRANSPORT VEHICLES: AREA OF ORIGIN OF OUTGOING PAPER, RAW AND CORRUGATED CARDBOARD 2003
INTERREGIONAL ECONOMIC COOPERATION IN THE ALPS-ADRIA AREA
GORIZIA CUSTOMS INSPECTION AREA FOR TRANSPORT VEHICLES: AREA OF ORIGIN OF INGOING SOLID SUGARS 2003
GORIZIA CUSTOMS INSPECTION AREA FOR TRANSPORT VEHICLES: AREA OF ORIGIN OF INGOING PVC 2003
2. STUDY AREAS POPULATION DENSITY IN FRIULI VENEZIA GIULIA AND SLOVENIA IN 2001/2002
REGIONS VENETO, FRIULI VENEZIA GIULIA, REPUBLIC OF SLOVENIA. URBANIZATION MODEL. NEIGHBOURING ADMINISTRATIVE AREAS AROUND MAIN CENTRES
REFERENCE MACROAREA
FRIULI VENEZIA GIULIA, GORISKA, OBALNO KRASKA, ISTRIAN COUNTY. POPULATION DENSITY – MUNICIPALITIES, PLACES
POPULATION DYNAMICS IN FRIULI VENEZIA GIULIA 1991 - 2001
POPULATION DYNAMICS IN SLOVENIA 1991 - 2002
PROVINCE OF GORIZIA: POPULATION DYNAMICS, 1991 – 2001

PROVINCE OF GORIZIA: POPULATION DYNAMICS ACCORDING TO ZONES, 1991 - 2001
POPULATION DYNAMICS IN THE GORIZIA AREA 1991 - 2001
PROVINCE OF GORIZIA – MUNICIPALITIES. POPULATION DYNAMICS (2003 – 2004)
THE GORIZIA AGGLOMERATION AND THE MONFALCONE CONURBATION
THE GORIZIA AGGLOMERATION. THE TWO BELTS OF NEIGHBOURING MUNICIPALITIES
GORIZIA NOVA. HYPOTHETICAL BOUNDARY OF THE JOINT PLANNING AREA
GORIZIA AND NOVA GORICA. RESIDENTS PER BIRTHYEAR
AGE PYRAMID
GORIZIA – NOVA GORICA: AGGREGATED FUNCTIONAL AREA
GORIZIA NOVA: POPULATION DENSITY PER DISTRICT (GO) AND LOCAL SETTLEMENT (NGO)
GORIZIA NOVA. BOUNDARY DEFINITION FOR JOINT PLANNING AREA
GORIZIA NOVA: WIDE HYPOTHESIS. MOSAIC OF THE SETTLEMENT PROPOSED FOR JOINT PLANNING
3. ECONOMIC STRUCTURE AND EMPLOYMENT PATTERNS GORISKA AND LOCAL WORK SYSTEM IN GORIZIA. WORKFORCE / SECTORS (2002, 2001)
MUNICIPALITY OF NOVA GORICA: ENTREPRENEURS PER ACTIVITY SECTOR, 2002
MUNICIPALITY OF NOVA GORICA: FIRMS PER SECTOR, 1997
MUNICIPALITY OF NOVA GORICA. NUMBER OF FIRMS, 1997
GORIZIA NOVA. FIRMS AND ENTREPRENEUERS IN THE AIRPORT BASIN
MUNICIPALITY OF GORIZIA. NUMBER OF FIRMS PER SECTOR - 2005
MUNICIPALITIES BELONGING TO THE SOCIAL-SANITARY DISTRICT OF THE NORTHERN ISONZO AREA
INTEGRATED COMMERCIAL SYSTEM IN GORIZIA
GORIZIA. GROUPS OF ACTIVITIES AND SPECIALIZATION INDEXES PER COMMERCIAL SYSTEM
GORIZIA. NUMBER OF SHOPPING FACILITIES FOR THE UPPER TEN SPECIALIZATIONS IN THE COMMERCIAL SYSTEM
AUTOMOBILE ISOCHRONES OF 30’ FROM THE SELECTED MUNICIPALITIES
ORIGIN OF STUDENTS ATTENDING UNIVERSITY IN GORIZIA NOVA (ACADEMIC YEAR 2005-06)
STUDENTS ATTENDING UNIVERSITY IN GORIZIA (ACADEMIC YEAR 2005-06)
UNIVERSITY STUDENTS COMING FROM TRIVENETO AREA (TRENTINO ALTO ADIGE, VENETO AND FRIULI VENEZIA GIULIA)
GORIZIA. FUNCTIONAL AREAS: INDUSTRIAL AUTHORITIES, SOCIAL SERVICES
GORIZIA NOVA: FUNCTIONAL AREAS
MUNICIPALITY OF GORIZIA. SPACIAL SUBDIVISIONS OF REAL ESTATE MARKETS
MUNICIPALITY OF GORIZIA: AVERAGE REAL ESTATE QUOTATIONS 2005
4. STATISTICAL AND PLANNING FRAMEWORK PROVINCE OF GORIZIA AND GORISKA REGIJA: CENSUS SECTIONS
GORISKA REGIJA: NETWORK OF CADASTRAL MUNICIPALITIES
GORISKA REGIJA: NETWORK OF PLACES
MUNICIPALITY OF GORIZIA: DISTRICTS AND CENSUS SECTIONS. MUNICIPALITIES OF NOVA GORICA – SEMPETER-VRTOJBA: CENSUS SECTIONS
MUNICIPALITY OF GORIZIA: DISTRICTS AND CENSUS SECTIONS. MUNICIPALITIES OF NOVA GORICA – SEMPETER-VRTOJBA: PLACES
GORIZIA – NOVA GORICA – SEMPETER-VRTOJBA: CENSUS SECTIONS OF THE URBAN AREA
DETAILS OF CENSUS SECTIONS, URBAN AREA OF GORIZIA NOVA (GORIZIA - SOLKAN – NOVA GORICA – PRISTAVA)
DETAILS OF CENSUS SECTIONS, URBAN AREA OF GORIZIA NOVA (GORIZIA S. ANDREA – ROZNA DOLINA - SEMPETER PRI GORICI-VRTOJBA)
MUNICIPALITY OF GORIZIA: DISTRIBUTION OF POPULATION PER CENSUS SECTIONS
GORIZIA: PLANNING AREAS
NOVA GORICA: PLANNING AREAS
GORIZIA – NOVA GORICA: SYNTHETIC HOMOGENIZATION OF PLANNNING CATEGORIES
HOMOGENEOUS PLANNING CATEGORIES: GORIZIA – NOVA GORICA
PLANNING ZONING AND CENSUS SECTIONS: MUNICIPALITIES OF GORIZIA, NOVA GORICA AND SEMPETER-VRTOJBA
PLANNING ZONING AND CENSUS SECTIONS: URBAN AREA OF GORIZIA NOVA (GORIZIA – SOLKAN - NOVA GORICA – PRISTAVA)
PLANNING ZONING AND CENSUS SECTIONS: URBAN AREA OF GORIZIA NOVA (GORIZIA S. ANDREA – ROZNA DOLINA – SEMPETER PRI GORICI – VRTOJBA)
PLANNING ZONING AND CENSUS SECTIONS: MUNICIPALITY OF GORIZIA AND PLACES OF THE MUNICIPALITIES OF NOVA GORICA AND SEMPETER-VRTOJBA
TRANSBOUNDARY BELT – STUDY AREA: GORIZIA DISTRICTS, PLACES OF NOVA GORICA AND VRTOJBA
MUNICIPALITY OF GORIZIA – CENSUS SECTIONS PER DISTRICT
MUNICIPALITY OF GORIZIA – BORDER DISTRICTS. POPULATION PER AGE CLASSES - 2001
MUNICIPALITIES OF NOVA GORICA AND VRTOJBA – BORDER PLACES. POPULATION PER AGE CLASSES - 2002
DENSITY AND ABSOLUTE VALUES OF POPULATION, CENSUS SECTIONS OF THE MUNICIPALITY OF GORIZIA; SOME PLANNING REGULATIONS
DENSITY AND ABSOLUTE VALUES OF POPULATION: CENSUS SECTIONS OF THE MUNICIPALITY OF GORIZIA; SOME PLANNING REGULATIONS
SURFACE/POPULATION RATIO IN GORIZIA DISTRICTS 2001
MUNICIPALITY OF GORIZIA – CENSUS SECTIONS PER URBAN DISTRICT
SURFACE/POPULATION RATIO IN GORIZIA URBAN DISTRICTS 2001
MUNICIPALITY OF GORIZIA – DISTRICT PIUMA: CENSUS SECTIONS

MUNICIPALITY OF GORIZIA – DISTRICT PIUMA: POPULATION PER AGE CLASSES - 2002
MUNICIPALITY OF GORIZIA – DISTRICT PIUMA – OSLAVIA – S. MAURO: PLANNING CATEGORIES
MUNICIPALITY OF GORIZIA – DISTRICT PIUMA – OSLAVIA – S. MAURO: POPULATION PER CENSUS SECTION AND PLANNING ZONE
MUNICIPALITY OF GORIZIA – DISTRICT PIUMA – OSLAVIA – S. MAURO: CENSUS SECTIONS. PERCENTAGE OF AGED PEOPLE
MUNICIPALITY OF GORIZIA – DISTRICT PIUMA – OSLAVIA – S. MAURO: CENSUS SECTIONS. TOTAL RESIDENTS (ABSOLUTE VALUES)
MUNICIPALITY OF GORIZIA – DISTRICT PIUMA – OSLAVIA – S. MAURO: CENSUS SECTIONS. NR. OF BUSINESS PER TYPE OF ACTIVITY
MUNICIPALITY OF GORIZIA – DISTRICT PIUMA – OSLAVIA – S. MAURO: CENSUS SECTIONS. NUMBER OF EMPLOYEES PER TYPE OF ACTIVITY
BORDER DISTRICTS IN THE GORIZIA MUNICIPALITY: ROOMS PER RESIDENT (DATA PER CENSUS SECTION)
MUNICIPALITY OF GORIZIA – BORDER DISTRICTS: INDEX OF STRUCTURAL DEPENDENCE FOR AGED PEOPLE (DATA PER CENSUS SECTION)
MUNICIPALITIES NOVA GORICA AND SEMPETER-VRTOJBA - PLACES: POPULATION DENSITY (PER SQ KM)
MUNICIPALITIES NOVA GORICA AND SEMPETER-VRTOJBA – PLACES. INDEX OF DEMOGRAPHIC (STRUCTURAL) DEPENDENCE
MUNICIPALITIES NOVA GORICA AND SEMPETER-VRTOJBA – PLACES: INDEX STRUCTURAL DEPENDENCE FOR AGED PEOPLE
MUNICIPALITIES NOVA GORICA AND SEMPETER-VRTOJBA – PLACES: PERCENTAGE OF PEOPLE WORKING IN THE FARMING SECTOR
MUNICIPALITIES NOVA GORICA AND SEMPETER-VRTOJBA – PLACES: PERCENTAGE OF PEOPLE WORKING IN INDUSTRY
MUNICIPALITIES NOVA GORICA AND SEMPETER-VRTOJBA – PLACES: PERCENTAGE OF PEOPLE WORKING IN THE TERTIARY SECTOR
MUNICIPALITIES NOVA GORICA AND SEMPETER-VRTOJBA – PLACES: PERCENTAGE OF PEOPLE WORKING IN OTHER SECTORS
MUNICIPALITIES NOVA GORICA AND SEMPETER-VRTOJBA – PLACES: HOUSING SURFACE IN SQM AND SQM/PERSON
MUNICIPALITIES NOVA GORICA AND SEMPETER-VRTOJBA – PLACES: FLATS PER BUILDING YEAR
5. PLANNING MANAGEMENT THROUGH SATELLITE ANALYSIS LANDSAT 5 TM SATELLITE IMAGE: GORIZIA NOVA (GORIZIA AND FIRST SLOVENIAN BORDER BELT)
LAND COVER IN THE AREA OF GORIZIA NOVA (GORIZIA AND FIRST SLOVENIAN BORDER BELT): IMAGE PROCESSING - 1992
LAND COVER IN THE AREA OF GORIZIA NOVA (GORIZIA AND FIRST SLOVENIAN BORDER BELT): IMAGE PROCESSING - 2003
CROSS-TABULATION: IN THE ROWS, LAND COVER CLASSES IN 1992, IN THE COLUMNS, LAND COVER CLASSES IN 2003. READING FROM LEFT AND CHOOSING A LAND COVER CLASS IN 1992 (ROW) IT IS POSSIBLE TO ANALYZE ITS COMPOSITION IN 2003 AS THE SURFACE OF EACH CLASS,

LISTED IN THE CORRESPONDING COLUMN, CAN BE READ IN THE SELECTED CELL. CONSIDERING COLUMNS IT IS POSSIBLE TO QUANTIFY THE EVOLUTION OF A GIVEN LAND COVER CLASS IN 2003 AND THE STATE OF THE SURFACE IN 1992.
SURFACE MODIFICATION (HA) FOR EACH LAND COVER CLASS (1992-2003)
DISTRICTS OF GORIZIA MUNICIPALITY AND BORDERING PLACES IN THE MUNICIPALITIES OF NOVA GORICA AND SEMPETER-VRTOJBA. EVOLUTION OF LAND COVER (92-03)
GORIZIA TRANSBOUNDARY BELT (SEE SATELLITE IMAGE). QUANTITATIVE DIFFERENCES IN LAND COVER (1992 – 2003)
TRANSFORMATION PROCESSES IN THE GORIZIA TRANSBOUNDARY BELT. LAND COVER EVOLUTION TRENDS (1992 – 2003).
DISTRICTS MONTESANTO-PIUMA AND BORDERING PLACES, MUNICIPALITY OF NOVA GORICA: LAND COVER EVOLUTION (92-03) IN PLANNING ZONES
DISTRICTS ROCCO-SANT’ANNA AND SANT’ANDREA: LAND COVER EVOLUTION (92-03) IN PLANNING ZONES
PLACE SEMPETER PRI GORICI: LAND COVER EVOLUTION (92-03) IN PLANNING ZONES
PLACE VRTOJBA: LAND COVER EVOLUTION (92-03) IN PLANNING ZONES FOR AGRICOLTURE AND HOUSING
TRANSBOUNDARY BELT: MUNICIPALITY OF GORIZIA. DEVELOPMENT DYNAMICS IN LAND COVER (1992 – 2003). DISTRICT PIUMA
TRANSBOUNDARY BELT: MUNICIPALITY OF GORIZIA. DEVELOPMENT DYNAMICS IN LAND COVER (1992 – 2003). DISTRICT MONTESANTO
TRANSBOUNDARY BELT: MUNICIPALITY OF GORIZIA. DEVELOPMENT DYNAMICS IN LAND COVER (1992 – 2003). DISTRICT SANT’ANDREA
TRANSBOUNDARY BELT: MUNICIPALITY OF GORIZIA. DEVELOPMENT DYNAMICS IN LAND COVER (1992 – 2003). DISTRICT S. ROCCO – S. ANNA
TRANSBOUNDARY BELT: MUNICIPALITY OF GORIZIA. HOUSING AREAS: DEVELOPMENT DYNAMICS IN LAND COVER (1992 – 2003). DISTRICT MONTESANTO
TRANSBOUNDARY BELT: MUNICIPALITY OF GORIZIA. AGRICOLTURAL AREAS: DEVELOPMENT DYNAMICS IN LAND COVER (1992 – 2003). DISTRICT MONTESANTO
TRANSBOUNDARY BELT: MUNICIPALITY OF GORIZIA. DEVELOPMENT DYNAMICS IN LAND COVER (1992 – 2003). PLANNING ZONINGS. PLACE NOVA GORICA
6. TRANSBOUNDARY PLANNING TRANSBOUNDARY BELT. AMEDEO DUCA AOSTA AIRPORT, GORIZIA
TRANSBOUNDARY BELT. AMEDEO DUCA AOSTA AIRPORT, GORIZIA – PLANNING PROPOSALS 1991 – THE CADET ACADEMY OF THE REVENUE GUARD CORPS
TRANSBOUNDARY BELT. AMEDEO DUCA AOSTA AIRPORT, GORIZIA – PLANNING PROPOSALS 1992 – INTEGRATED DEVELOPMENT AIRPORT PLAN ARCH. F. BRESSAN AND ING. P.DELPIN
TRANSBOUNDARY BELT. AMEDEO DUCA AOSTA AIRPORT, GORIZIA – PLANNING PROPOSALS 2003 – REGIONAL FLIGHT MUSEUM (ARCH. DE GRESSI AND GRAZIATI)
TRANSBOUNDARY BELT. AMEDEO DUCA AOSTA AIRPORT, GORIZIA – PLANNING PROPOSALS 2004 – TRANSBOUNDARY PLANNING PROPOSAL (ARCH. DE GRESSI AND GRAZIATI)
TRANSBOUNDARY BELT. AMEDEO DUCA AOSTA AIRPORT, GORIZIA – PROPOSAL NR. 1: PARTIAL USE OF THE FLIGHT AREA
TRANSBOUNDARY BELT. AMEDEO DUCA AOSTA AIRPORT, GORIZIA – PROPOSAL NR. 2: MINIMAL USE OF THE FLIGHT AREA
TRANSBOUNDARY BELT GORIZIA – NOVA GORICA. A GIS SUPPORTED PROPOSAL FOR JOINT TOURISM DEVELOPMENT ON THE SABOTIN MOUNTAIN
TRANSBOUNDARY BELT GORIZIA – NOVA GORICA. A GIS SUPPORTED PROPOSAL FOR JOINT TOURISM DEVELOPMENT ON THE SABOTIN MOUNTAIN – HISTORICAL CARTOGRAPHY
TRANSBOUNDARY BELT GORIZIA – NOVA GORICA. A GIS SUPPORTED PROPOSAL FOR JOINT TOURISM DEVELOPMENT ON THE SABOTIN MOUNTAIN – ENVIRONMENTAL ANALYSIS
TRANSBOUNDARY BELT GORIZIA – NOVA GORICA. A GIS SUPPORTED PROPOSAL FOR JOINT TOURISM DEVELOPMENT ON THE SABOTIN MOUNTAIN – SURVEYS AND PATHS 1
TRANSBOUNDARY BELT GORIZIA – NOVA GORICA. A GIS SUPPORTED PROPOSAL FOR JOINT TOURISM DEVELOPMENT ON THE SABOTIN MOUNTAIN – SURVEYS AND PATHS 2
TRANSBOUNDARY BELT GORIZIA – NOVA GORICA. A GIS SUPPORTED PROPOSAL FOR JOINT TOURISM DEVELOPMENT ON THE SABOTIN MOUNTAIN – TOURIST HYPERLINKS
TRANSBOUNDARY BELT GORIZIA – NOVA GORICA. A GIS SUPPORTED PROPOSAL FOR JOINT TOURISM DEVELOPMENT ON THE SABOTIN MOUNTAIN – HISTORICAL HYPERLINKS
TRANSBOUNDARY BELT GORIZIA – NOVA GORICA. A GIS SUPPORTED PROPOSAL FOR JOINT TOURISM DEVELOPMENT ON THE SABOTIN MOUNTAIN – PATHS HYPERLINKS
TRANSBOUNDARY BELT GORIZIA – NOVA GORICA. A GIS SUPPORTED PROPOSAL FOR JOINT TOURISM DEVELOPMENT ON THE SABOTIN MOUNTAIN – ENVIRONMENTAL HYPERLINKS
TRANSBOUNDARY BELT GORIZIA – NOVA GORICA. A GIS SUPPORTED PROPOSAL FOR JOINT TOURISM DEVELOPMENT ON THE SABOTIN MOUNTAIN – PLANNING PROPOSALS
GORIZIA – NOVA GORICA: TRANSBOUNDARY BELT. THE STANDARDIZATION OF HISTORICAL CARTOGRAPHY
GORIZIA – NOVA GORICA: TRANSBOUNDARY BELT. EVOLUTION OF THE URBAN FABRIC
GORIZIA – NOVA GORICA: TRANSBOUNDARY BELT. PRESERVED BUILDINGS ON THE BASIS OF HISTORICAL CARTOGRAPHY
GORIZIA – NOVA GORICA: TRANSBOUNDARY BELT. HISTORICAL EVOLUTION OF AN URBAN SITE: SANT’ANTONIO SQUARE
GORIZIA – NOVA GORICA: TRANSBOUNDARY BELT. SANT’ANTONIO SQUARE AT PRESENT
GORIZIA – NOVA GORICA: TRANSBOUNDARY BELT. A PLAN FOR THE RIQUALIFICATION OF THE URBAN FABRIC
Related Documents


