Avention One-Stop Report Google Inc 18 September 2014

Welcome message from author
This document is posted to help you gain knowledge. Please leave a comment to let me know what you think about it! Share it to your friends and learn new things together.
Transcript
Avention One-Stop Report
Google Inc
18 September 2014
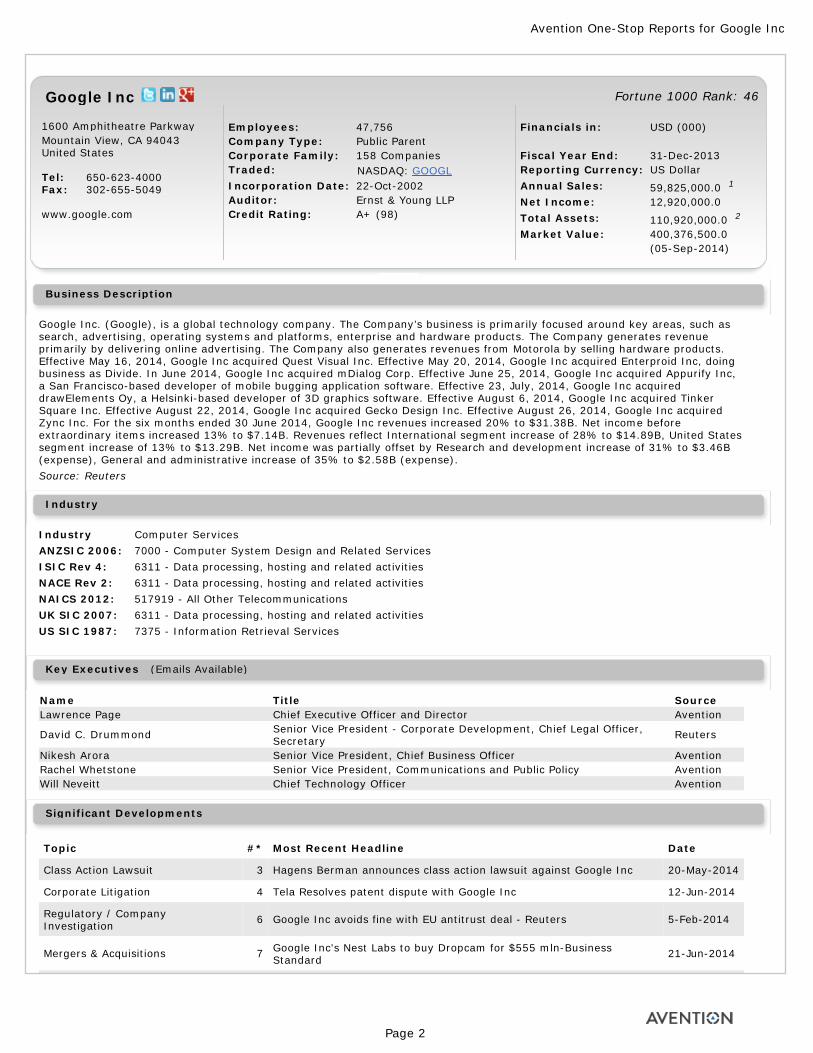
Google Inc Fortune 1000 Rank: 46
1600 Amphitheatre Parkway Mountain View, CA 94043 United States Tel: 650-623-4000 Fax: 302-655-5049 www.google.com
Employees: 47,756 Company Type: Public Parent Corporate Family: 158 Companies Traded: NASDAQ: GOOGLIncorporation Date: 22-Oct-2002 Auditor: Ernst & Young LLP Credit Rating: A+ (98)
Financials in: USD (000)
Fiscal Year End: 31-Dec-2013 Reporting Currency: US Dollar Annual Sales: 59,825,000.0 1
Net Income: 12,920,000.0 Total Assets: 110,920,000.0 2
Market Value: 400,376,500.0 (05-Sep-2014)
Business Description
Google Inc. (Google), is a global technology company. The Company’s business is primarily focused around key areas, such as search, advertising, operating systems and platforms, enterprise and hardware products. The Company generates revenue primarily by delivering online advertising. The Company also generates revenues from Motorola by selling hardware products. Effective May 16, 2014, Google Inc acquired Quest Visual Inc. Effective May 20, 2014, Google Inc acquired Enterproid Inc, doing business as Divide. In June 2014, Google Inc acquired mDialog Corp. Effective June 25, 2014, Google Inc acquired Appurify Inc, a San Francisco-based developer of mobile bugging application software. Effective 23, July, 2014, Google Inc acquired drawElements Oy, a Helsinki-based developer of 3D graphics software. Effective August 6, 2014, Google Inc acquired Tinker Square Inc. Effective August 22, 2014, Google Inc acquired Gecko Design Inc. Effective August 26, 2014, Google Inc acquired Zync Inc. For the six months ended 30 June 2014, Google Inc revenues increased 20% to $31.38B. Net income before extraordinary items increased 13% to $7.14B. Revenues reflect International segment increase of 28% to $14.89B, United States segment increase of 13% to $13.29B. Net income was partially offset by Research and development increase of 31% to $3.46B (expense), General and administrative increase of 35% to $2.58B (expense).Source: Reuters
Industry
Industry Computer Services ANZSIC 2006: 7000 - Computer System Design and Related Services ISIC Rev 4: 6311 - Data processing, hosting and related activities NACE Rev 2: 6311 - Data processing, hosting and related activities NAICS 2012: 517919 - All Other Telecommunications UK SIC 2007: 6311 - Data processing, hosting and related activities US SIC 1987: 7375 - Information Retrieval Services
Key Executives (Emails Available)
Name Title SourceLawrence Page Chief Executive Officer and Director Avention
David C. Drummond Senior Vice President - Corporate Development, Chief Legal Officer, Secretary Reuters
Nikesh Arora Senior Vice President, Chief Business Officer AventionRachel Whetstone Senior Vice President, Communications and Public Policy AventionWill Neveitt Chief Technology Officer Avention
Significant Developments
Topic #* Most Recent Headline Date
Class Action Lawsuit 3 Hagens Berman announces class action lawsuit against Google Inc 20-May-2014
Corporate Litigation 4 Tela Resolves patent dispute with Google Inc 12-Jun-2014
Regulatory / Company Investigation 6 Google Inc avoids fine with EU antitrust deal - Reuters 5-Feb-2014
Mergers & Acquisitions 7 Google Inc's Nest Labs to buy Dropcam for $555 mln-Business Standard 21-Jun-2014
Avention One-Stop Reports for Google Inc
Page 2
Divestitures 1 Lenovo Group Ltd to acquire Motorola Mobility from Google Inc 29-Jan-2014
* number of significant developments within the last 12 months
News
Title DateGoogle EU Ruling Response Vetted as Complaints Pile Up Bayou Buzz (60 Words) 18-Sep-2014
The Wall Street Journal: News Corp says Google is a 'platform for piracy' Atlanta Journal And Constitution (47 Words) 18-Sep-2014
Pre-orders Start Tomorrow for Samsung Galaxy Note 4; Available October 17 Business Wire (1802 Words) 18-Sep-2014
Google ruling response vetted by watchdogs as complaints pile up Livemint.com (459 Words) 18-Sep-2014
Xiaomi Redmi 1S vs. Motorola Moto E vs. Android One Smartphones: Specifications Comparison International Business Times India (1511 Words) 18-Sep-2014
Xiaomi Redmi 1S vs. Motorola Moto E vs. Android One Smartphones: Specifications International Business Times India (1511 Words) 18-Sep-2014
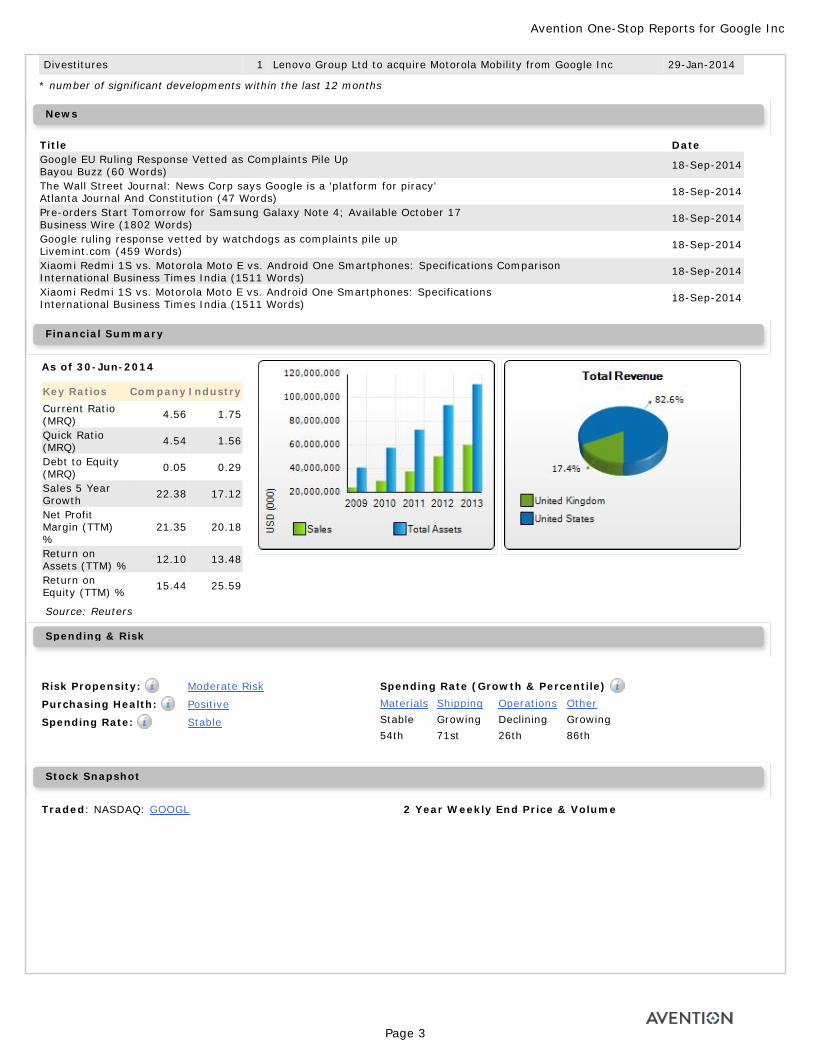
Financial Summary
As of 30-Jun-2014
Key Ratios Company IndustryCurrent Ratio (MRQ) 4.56 1.75
Quick Ratio (MRQ) 4.54 1.56
Debt to Equity (MRQ) 0.05 0.29
Sales 5 Year Growth 22.38 17.12
Net Profit Margin (TTM) %
21.35 20.18
Return on Assets (TTM) % 12.10 13.48
Return on Equity (TTM) % 15.44 25.59
Source: Reuters
Spending & Risk
Risk Propensity: Moderate Risk
Purchasing Health: Positive
Spending Rate: Stable
Spending Rate (Growth & Percentile) Materials Shipping Operations Other Stable Growing Declining Growing54th 71st 26th 86th
Stock Snapshot
Traded: NASDAQ: GOOGL 2 Year Weekly End Price & Volume
Avention One-Stop Reports for Google Inc
Page 3
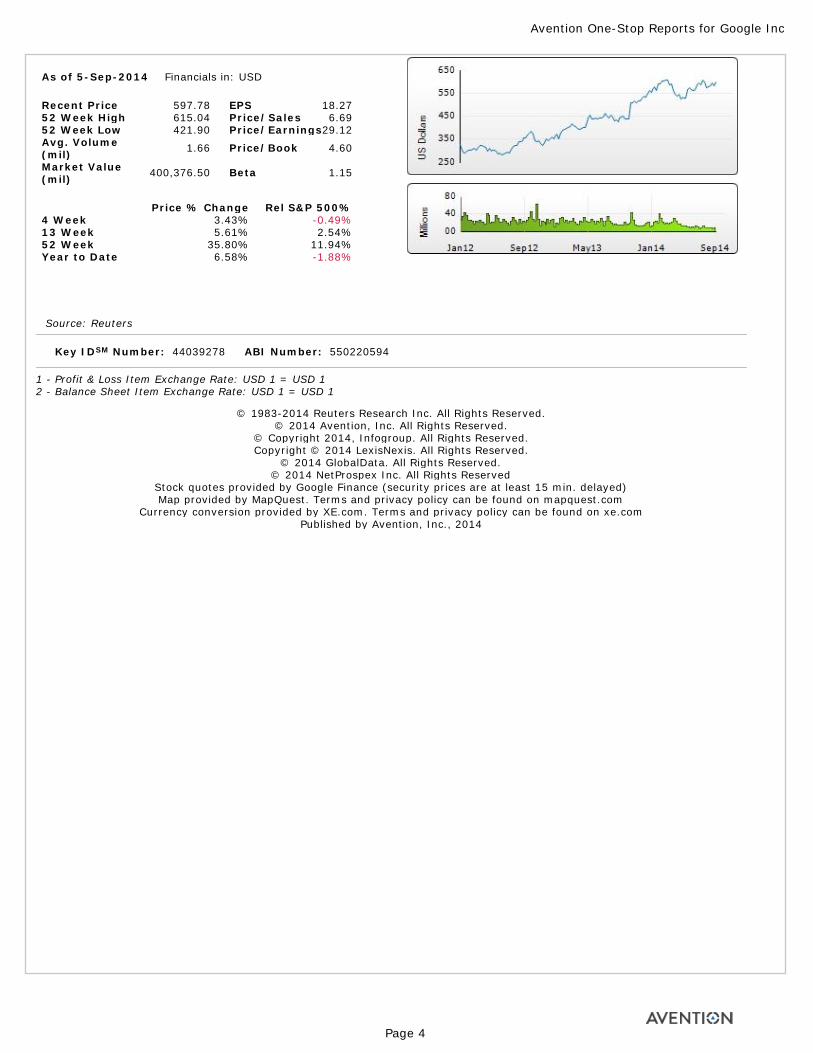
As of 5-Sep-2014 Financials in: USD
Recent Price 597.78 EPS 18.2752 Week High 615.04 Price/Sales 6.6952 Week Low 421.90 Price/Earnings29.12Avg. Volume (mil) 1.66 Price/Book 4.60
Market Value (mil) 400,376.50 Beta 1.15
Price % Change Rel S&P 500%4 Week 3.43% -0.49%13 Week 5.61% 2.54%52 Week 35.80% 11.94%Year to Date 6.58% -1.88%
Source: Reuters
1 - Profit & Loss Item Exchange Rate: USD 1 = USD 1 2 - Balance Sheet Item Exchange Rate: USD 1 = USD 1
Key IDSM Number: 44039278 ABI Number: 550220594
© 1983-2014 Reuters Research Inc. All Rights Reserved.© 2014 Avention, Inc. All Rights Reserved.
© Copyright 2014, Infogroup. All Rights Reserved.Copyright © 2014 LexisNexis. All Rights Reserved.
© 2014 GlobalData. All Rights Reserved.© 2014 NetProspex Inc. All Rights Reserved
Stock quotes provided by Google Finance (security prices are at least 15 min. delayed) Map provided by MapQuest. Terms and privacy policy can be found on mapquest.com
Currency conversion provided by XE.com. Terms and privacy policy can be found on xe.com Published by Avention, Inc., 2014
Avention One-Stop Reports for Google Inc
Page 4
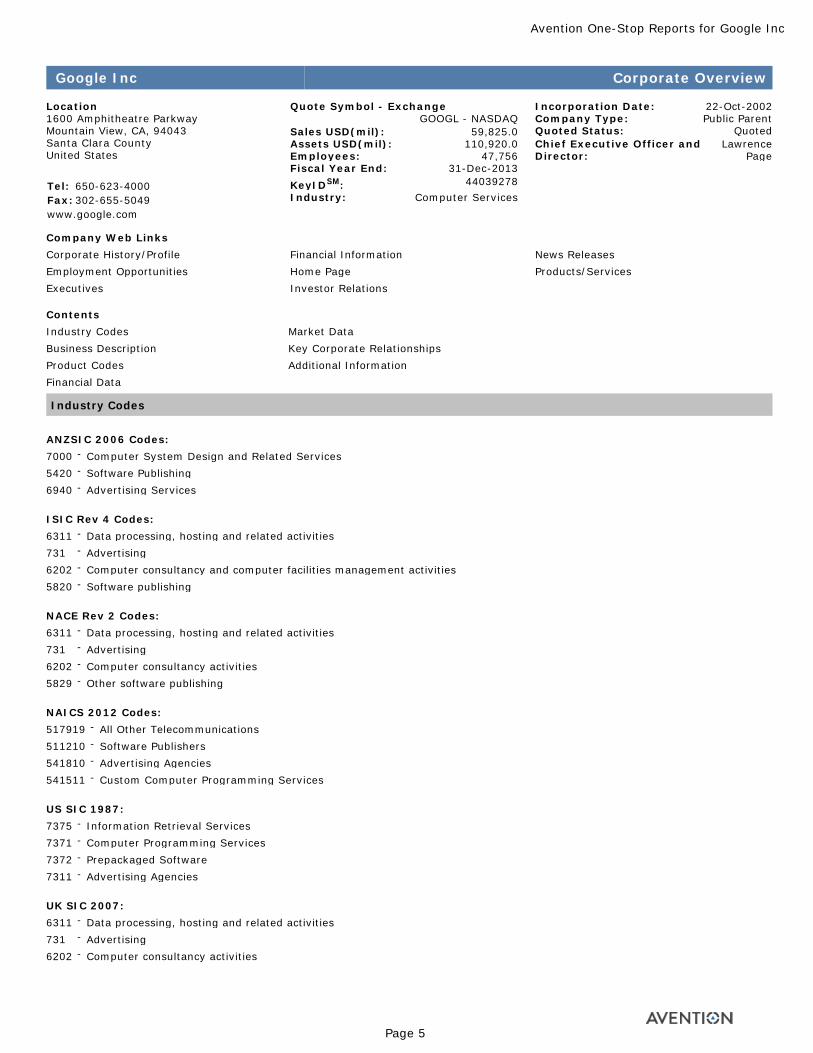
Google Inc Corporate Overview
Location 1600 Amphitheatre Parkway Mountain View, CA, 94043 Santa Clara County United States
Tel: 650-623-4000Fax: 302-655-5049www.google.com
Quote Symbol - ExchangeGOOGL - NASDAQ
Sales USD(mil): 59,825.0Assets USD(mil): 110,920.0Employees: 47,756Fiscal Year End: 31-Dec-2013KeyIDSM: 44039278Industry: Computer Services
Incorporation Date: 22-Oct-2002Company Type: Public ParentQuoted Status: QuotedChief Executive Officer and Director:
Lawrence Page
Company Web LinksCorporate History/ProfileEmployment OpportunitiesExecutives
Financial InformationHome PageInvestor Relations
News ReleasesProducts/Services
ContentsIndustry Codes Business Description Product Codes Financial Data
Market Data Key Corporate Relationships Additional Information
Industry Codes
ANZSIC 2006 Codes:7000 - Computer System Design and Related Services5420 - Software Publishing6940 - Advertising Services
ISIC Rev 4 Codes:6311 - Data processing, hosting and related activities731 - Advertising6202 - Computer consultancy and computer facilities management activities5820 - Software publishing
NACE Rev 2 Codes:6311 - Data processing, hosting and related activities731 - Advertising6202 - Computer consultancy activities5829 - Other software publishing
NAICS 2012 Codes:517919 - All Other Telecommunications 511210 - Software Publishers541810 - Advertising Agencies541511 - Custom Computer Programming Services
US SIC 1987:7375 - Information Retrieval Services7371 - Computer Programming Services7372 - Prepackaged Software7311 - Advertising Agencies
UK SIC 2007:6311 - Data processing, hosting and related activities731 - Advertising6202 - Computer consultancy activities
Avention One-Stop Reports for Google Inc
Page 5
5829 - Other software publishing
Business Description
Google Inc. (Google), incorporated on October 22, 2002, is a global technology company. The Company’s business is primarily focused around key areas, such as search, advertising, operating systems and platforms, enterprise and hardware products. The Company generates revenue primarily by delivering online advertising. The Company also generates revenues from Motorola by selling hardware products. The Company provides its products and services in more than 100 languages and in more than 50 countries, regions, and territories. Effective September 16, 2013, Google Inc acquired Bump Technologies Inc. Effective October 22, 2013, Google Inc acquired FlexyCore, a developer of software. Effective December 6, 2013, Google Inc acquired the entire share capital of SCHAFT Inc. Effective December 14, 2013, Google Inc acquired Boston Dynamics Inc. Effective January 15, 2014, Google Inc acquired Impermium Corp, a developer of SaaS application software. Effective February 7, 2014, Google Inc acquired the remaining 88% interest in Nest Labs Inc. Effective February 21, 2014, Google Inc acquired Spider.io, a provider of online fraud detection services. Effective March 12, 2014, Google Inc acquired Green Throttle Games. In April 2014, Google Inc acquired Titan Aerospace, a Moriarty-based manufacturer of solar-powered drones. Effective May 5, 2014, the Company acquired Rangespan, a provider of information technology services. Effective May 6, 2014, the Company acquired Adometry Inc. Effective May 7, 2014, the Company acquired Appetas Inc, a provider of Website development and design services, and Stackdriver Inc, a Boston-based provider of prepackaged applications software in cloud platform. Effective May 16, 2014, Google Inc acquired Quest Visual Inc. Effective May 20, 2014, Google Inc acquired Enterproid Inc, doing business as Divide. In June 2014, Google Inc acquired mDialog Corp. Effective June 25, 2014, Google Inc acquired Appurify Inc, a San Francisco-based developer of mobile bugging application software. Effective 23, July, 2014, Google Inc acquired drawElements Oy, a Helsinki-based developer of 3D graphics software. Effective August 6, 2014, Google Inc acquired Tinker Square Inc. Effective August 22, 2014, Google Inc acquired Gecko Design Inc. Effective August 26, 2014, Google Inc acquired Zync Inc. Search The Company integrates features into its search service and offers specialized search services to help users tailor their search. The Company also offers product listing advertisements (ads), which include product information, such as product image, price, and merchant information, without requiring additional keywords or ad text. In January 2012, it launched Search plus Your World. During the year ended December 31, 2012, it also introduced Google Now and Google’s Knowledge Graph. Google Now is a search feature that gets the right information at just the right time. It tells the day’s weather before start of a day, how much traffic to expect before you leave for work or school, when the next train will arrive as you’re standing on the platform, or favorite team’s score while they’re playing - all automatically with cards appearing throughout the day at the moment you need them. Google’s Knowledge Graph, enables the user to search for things, people or places that Google knows about-landmarks, celebrities, cities, sports teams, buildings, geographical features, movies, works of arts and more-and enhances Google Search in three ways: find the right thing, get the summary, and go deeper and broader. Advertising The Company’s AdWords is a primary auction-based advertising program, which delivers ads to search queries or Web content. With AdWords, advertisers create text-based ads that then appear beside related search results or Web content on its Websites and on thousands of partner Websites in its Google Network, which is the network of third parties that use its advertising programs to deliver relevant ads with search results and content. The Company also offers AdWords on a cost-per-impression basis that enables advertisers to pay the Company based on the number of times their ads appear on its Websites and the Company’s Google Network Members’ Websites as specified by the advertiser. Its AdSense program enables Websites that are part of the Google Network to deliver ads from its AdWords advertisers that are relevant to the search results or content on Websites. In June 2012, the Company integrated its AdMob technology directly into its AdWords system, which enables advertisers to run campaigns across the more than 300,000 mobile applications running ads by AdMob - all from within the AdWords interface. The Company’s Display advertising consists of videos, text, images, and other interactive ads that run across the Web on computers and mobile devices, including smart phones and handheld computers, such as net books and tablets. The Google Display Network provides advertisers services related to the delivery of display advertising across publishers participating in its AdSense program, publishers participating in the DoubleClick Ad Exchange, and Google-owned sites, such as YouTube and Google Finance. Through its DoubleClick advertising technology, it provides to publishers, agencies, and advertisers the ad serving technology, which is the infrastructure that enables billions of ads to be served each day across the Web. Its DoubleClick Ad Exchange creates a real-time auction marketplace for the trading of display ad space. In addition, YouTube provides a range of video, interactive, and other ad formats for advertisers to reach their intended audience. YouTube’s video advertising solutions give advertisers a way to promote their content to the YouTube community, as well as to associate with content being watched by their target audience. YouTube also offers analytic tools to help advertisers understand their audience and derive general business intelligence. The Company is focused on developing easy-to-use ad products to help advertisers extend their reach, help create revenue opportunities for its publisher partners, and deliver relevant and useful ads to users on the go. Google Mobile extends its products and services by providing mobile-specific features to mobile device users. The Company’s mobile-specific search technologies include search by voice, search by sight, and search by location. Google Mobile also optimizes a number of Google’s applications for mobile devices in both browser and downloadable form. In addition, the Company offers advertisers the ability to run search ad campaigns on mobile devices with mobile-specific ad formats, such as click-to-call ads in which advertisers can include a phone number within ad text. AdMob also offers effective ad units and solutions for application developers and advertisers. The Company provides users with relevant local information. The Company has organized information around more than 80 million places globally from various sources across the Web. Users can find addresses, phone numbers, hours of operation, directions and more for millions of local queries like shops, restaurants, parks and landmarks right on Google.com, on Google Maps and on Google Maps for mobile. Its products and services also help local business owners manage their online presence and connect with potential customers. Operating Systems and Platforms
Avention One-Stop Reports for Google Inc
Page 6
The Company’s Android is a free and open source mobile software platform that any developer can use to create applications for mobile devices and any handset manufacturer can install on a device. Google Chrome OS is an open source operating system with the Google Chrome Web browser as its foundation. Both the Google Chrome OS and the Google Chrome browser are built around the core tenets of speed, simplicity, and security. The Chrome browser runs on Windows, Mac, and Linux computers. Google+ is a new way to share online just like users do in the real world, sharing different things with different people. Google Play is a cloud-based, digital entertainment destination with more than 700,000 applications (apps) and games plus music, movies and books that its users can find, enjoy and share on the Web and on their Android phone or tablet. Google Drive is a place where users can create, share, collaborate, and keep all of their stuff. Google Docs is built right into Google Drive so users can work with others in real time on documents, spreadsheets and presentations and users’ files go everywhere they do. Google Wallet is a virtual wallet that securely stores credit and debit cards, offers, and rewards cards. Users can tap their phone to pay in-store using Google Wallet anywhere contactless payments are accepted - at over 200,000 merchants across the United States. Google TV is a platform that gives consumers the power to experience television and the Internet on a single screen, with the ability to search and find the content they want to watch. The Google TV platform is based on the Android operating system and runs the Google Chrome browser. Enterprise The Company’s enterprise products provide Google technology for business settings. Through Google Apps, which includes Gmail, Google Docs, Google Calendar, and Google Sites, among other features, it provides hosted, Web-based applications that people can use on any device with a browser and an Internet connection. In addition, the Company provides its search technology for use within enterprises through the Google Search Appliance (real-time search of business applications, intranet applications, and public websites), on their public-facing sites with Google Site Search (custom search engine), and Google Commerce Search (for online retail enterprises). The Company also provide versions of its Google Maps Application Programming Interface (API) for businesses (including interactive Google Maps for public and internal Websites), as well as Google Earth Enterprise (a behind-the-company-firewall software solution for imagery and data visualization). Its enterprise solutions have been adopted by a variety of businesses, governments, schools, and non-profit organizations. Motorola The Company’s Motorola business consists of two segments: Mobile segment and Home segment. The Mobile segment is focused on mobile wireless devices and related products and services. The Home segment is focused on technologies and devices that provide video entertainment services to consumers by enabling subscribers to access a variety of interactive digital television services. The Company competes with Facebook, Inc., Twitter Inc., Yahoo! Inc., Microsoft Corporation, eBay Inc., and Amazon.com, Inc.Source: Reuters
More Business Descriptions
Google Inc. (Google), is a global technology company. The Company’s business is primarily focused around key areas, such as search, advertising, operating systems and platforms, enterprise and hardware products. The Company generates revenue primarily by delivering online advertising. The Company also generates revenues from Motorola by selling hardware products. Effective May 16, 2014, Google Inc acquired Quest Visual Inc. Effective May 20, 2014, Google Inc acquired Enterproid Inc, doing business as Divide. In June 2014, Google Inc acquired mDialog Corp. Effective June 25, 2014, Google Inc acquired Appurify Inc, a San Francisco-based developer of mobile bugging application software. Effective 23, July, 2014, Google Inc acquired drawElements Oy, a Helsinki-based developer of 3D graphics software. Effective August 6, 2014, Google Inc acquired Tinker Square Inc. Effective August 22, 2014, Google Inc acquired Gecko Design Inc. Effective August 26, 2014, Google Inc acquired Zync Inc. For the six months ended 30 June 2014, Google Inc revenues increased 20% to $31.38B. Net income before extraordinary items increased 13% to $7.14B. Revenues reflect International segment increase of 28% to $14.89B, United States segment increase of 13% to $13.29B. Net income was partially offset by Research and development increase of 31% to $3.46B (expense), General and administrative increase of 35% to $2.58B (expense).Source: Reuters Internet Search Engine, Data Processing, Publishing & Related ServicesSource: LexisNexis Establishments primarily engaged in providing computer processing and data preparation services. The service may consist of complete processing and preparation of reports from data supplied by the customer or a specialized service, such as data entry or making data processing equipment available on an hourly or time-sharing basis.Source: infoUSA Google Inc. (Google) is a US-based global technology company. It provides products and services related to web search and advertising. The company's sales network comprises more than 85 offices in more than 40 countries. Its sales efforts consist of both online and direct sales channels. Google's offerings are broadly classified into four divisions, namely, Search; Advertising; Operating System and Platforms; and Enterprise. Under Search division, the company handles websites and other online content. It integrates advanced features into its search services and offers specialized search services, which help users to find the necessary information. Its major products and services include Google Web Search, Google Image Search, Google Book Search, Google Scholar, Google Finance, Google News, Google Video, Google Blog Search, iGoogle and Personalized Search, Google Product Search, Google Custom Search, Google Base, and Google Webmaster Tools. Under Advertising, the company offers services such as Google search, AdSense program, Google Display, Google Mobile and Google Local. The company’s Google search offers AdWords, an auction-based advertising program that allows advertisers to create suitable text-based advertisements. These ads are aimed at exploring queries or web content across both Google sites and the web sites of Google Network. Google AdSense delivers AdWords ads to websites of the Google Network. It offers ads apt to the search outcome or content on their web pages. It enables offline media companies to publish ads and audio ads. Google AdSense comprises Google AdSense for Search and Google AdSense for Content. AdSense for search is the online service for distributing related ads from the company's advertisers for displaying the search results on its Google network
Avention One-Stop Reports for Google Inc
Page 7
members’ websites. The AdSense for Content uses automated technology for analyzing the meaning of the content on the web page and provide related ads based on the meaning of such content. Google AdWords's direct sales channels concentrate on global companies with huge advertising budgets, while direct sales teams of AdSense focus on prominent Internet companies. The company's display advertising focuses on advertisers and publishers across geographies. The company also offers its products and services in more than 100 languages across 50 countries. Through Google Mobile, the company focuses on mobile advertising. Google Mobile comprises mobile specific search technologies such as search by voice, search by sight, and search by location. It also optimizes a broad number of its applications for mobile devices in both browser and downloadable form. Through Google Display, the company displays advertisements through video, images, text and other interactive ads across computers, including notebooks and tablets; and smart phones. Google's DoubleClick advertising technology provides ad serving technology, which enables billions of ads to be served each day across the web. Google Display network offers its services to ad publishers involved in DoubleClick Ad Exchange, and the company's owned sites such as YouTube and Google Finance. The company’s Google Local offers its users the necessary and related local information including addresses, phone numbers, hours of operation, directions and various others for local queries such as shops, restaurants, parks and landmarks. The company has a database of 50 million places across the world. Google also offers Google Maps and Google Maps for mobile. Google Maps provides map information that assists users with addresses, businesses and point-to-point driving directions. Under Operating System and Platforms division, the company offers Android, Google Chrome OS and Google Chrome, Google+, Google TV, and Google Books. Android is free, open-source mobile software that assists in the creation applications related to mobile devices and handset manufacturers’ installations. Google Chrome OS is an open source operating system, while Google Chrome is a web browser that can run on Windows, Mac, and Linux operating systems. In June 2011, the company launched its Google+, an online information sharing portal. Through Google TV, the company offers both television and Internet on a single screen. Google TV is developed using Android operating system and runs on Chrome browser. Google Books enables its users to discover, search, and go through the content from online printed books. Through its eBookstore, it sells popular books in electronic book format. Under Enterprise division, Google develops various applications that allow creating, sharing and communicating user-generated information. Some of the applications that the company offers include Google Docs, Google Calendar, Gmail, Google Groups, Google Reader, Orkut, Blogger and Google Sites. The company provides its search technology for use in enterprises through the Google Search Appliance, a real-time search of business applications, intranet applications, and public websites; Google Site Search, a customized search engine, and Google Commerce Search, a search engine for online retail enterprises. It also offers Google Maps Application Programming Interface (API), and Google Earth Enterprise. Google Earth allows users to view and traverse locations across the world using satellite and aerial images and 3D photography. The company caters its enterprise services to businesses, governments, schools, and non-profit organizations. The company's client applications include Google Toolbar, Google Chrome, Google Pack, Picasa, and Google Desktop. Google Toolbar is a free application, which attaches a Google search box to web browsers, while Google Chrome is an open-source browser and Google Pack is a free suite of software programs. Google's Picasa is another free offering that enable users to view, handle, and share their photos, while Google Desktop assists users in executing a full-text search on their computers. The company's Google Labs functions as a testing platform for both its engineers and users. The company displays product prototypes and seeks feedback for their usage and/or improvement. Some of the examples of Google Labs include Picasa for Mac, In Quotes, and Google Audio Indexing. Google Ventures is the venture capital arm of the company that invests in start-up companies or attractive business ventures across a broad range of industries, including consumer Internet, software, hardware, clean-tech, biotech and health care. Green Initiatives comprise Google’s clean energy efforts. With Green Initiatives, Google aims to reduce its carbon footprint, ensure efficient computing and help its employees go green. Google.org is the philanthropic arm of Google. Google.org builds technology products to address global challenges such as climate change, pandemic disease and poverty. It is also active in the area of renewable energy and energy efficiency. It focuses on making renewable energy cheaper than coal-fired power. Through Google.org, Google offers a free electricity usage monitoring tool called Google PowerMeter. This tool provides consumers information on how much energy their homes are consuming. Google PowerMeter receives information from utility smart meters and in-home energy management devices and enables consumers to visualize this information on iGoogle, the user-personalized Google homepage. Google derives a significant portion of its revenue from advertising with the remainder from licensing its web search technology and other related activities. The company’s advertising service is further divided into two categories, namely, Google websites and Google Network Members’ websites. For the fiscal year ended December 31, 2012, the revenue generated from Google websites was $31,221m, as compared to $26,145m in 2011. Google Network Members's Website generated $12,465m in 2012, as compared to $10,386m in 2011, and other revenues were $2,353m in 2011, as compared to $1,374m in 2012. The company's research and development activities focus on product development and the licensing and acquisition of third-party businesses and technology. In addition to its core business, Google invests in several programs such as Google Ventures, Green Initiatives, and Google.org. For the fiscal year ended 2012, the company invested $6.8 billion. Geographically, the company operates business across three segments, namely, the United States (US), the United Kingdom (UK), and Rest of the world (RoW). For fiscal year ended December 2012, the US region accounted for 46 of the company’s total revenue, followed by Rest of the World with 43% and the UK with 11% of revenue.Source: Global Data Google Inc. (Google) is a web search and advertising services provider. The company manages a wide index of websites and other related online content. Google’s business is broadly categorized into four areas, namely, Search; Advertising; Operating System and Platform, and Enterprise. Its portfolio of products and services is classified into Google.com, Applications, Client, Google Maps, Earth and Local, Google Mobile, Google Display, and Android. It offers its products and services in more than 100 languages across 50 countries. The company operates its offices in the Americas, Europe and Asia. Google is headquartered in Mountain View, California, the US. The company's strategic intent lies in expanding its operations through the acquisitions. In line with the strategy, the company acquired Motorola Mobility Holdings, Inc., a provider of advanced mobile media solutions. The acquisition was mainly intended to boost the Android ecosystem and improve mobile computing activities.The company reported revenues of (U.S. Dollars) USD 50,175.00 million during the fiscal year ended December 2012, an increase of 32.37% over 2011. The operating profit of the company was USD 12,760.00 million during the fiscal year 2012, an increase of 9.70% over 2011. The net profit of the company was USD 10,737.00 million during the fiscal year 2012, an increase of 10.27% over 2011.Source: Global Data Founded in 1998, Google is a provider of global technology services that include Web search and advertising. The company maintains a variety of Web sites and other online content that is freely available through Internet connection. Its programs include the Google Image Search, Google Book Search, Google Scholar, Google Finance, Google News and Google Base. Google also offers the AdWords and AdSense programs to various businesses for the promotion of products and services. In addition, the company operates networking and entertainment sites, such as Gmail, Orkut and YouTube. It serves individual users, corporations, universities and government agencies. With a workforce of more than 19,000 employees, Google maintains over 60 offices in nearly 30 countries.
Avention One-Stop Reports for Google Inc
Page 8
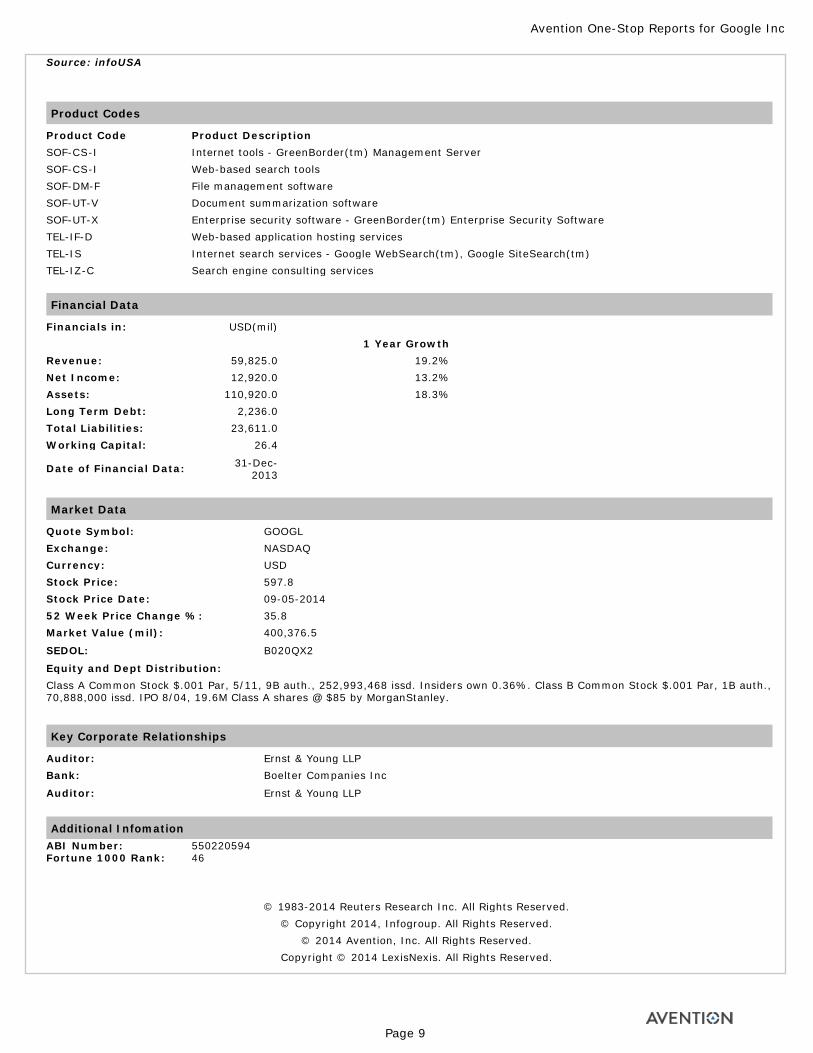
Source: infoUSA
Product Codes
Product Code Product DescriptionSOF-CS-I Internet tools - GreenBorder(tm) Management ServerSOF-CS-I Web-based search toolsSOF-DM-F File management softwareSOF-UT-V Document summarization softwareSOF-UT-X Enterprise security software - GreenBorder(tm) Enterprise Security SoftwareTEL-IF-D Web-based application hosting servicesTEL-IS Internet search services - Google WebSearch(tm), Google SiteSearch(tm)TEL-IZ-C Search engine consulting services
Financial Data
Financials in: USD(mil) Revenue: 59,825.0Net Income: 12,920.0Assets: 110,920.0Long Term Debt: 2,236.0Total Liabilities: 23,611.0Working Capital: 26.4
Date of Financial Data: 31-Dec-2013
1 Year Growth
19.2%13.2%18.3%
Market Data
Quote Symbol: GOOGLExchange: NASDAQCurrency: USDStock Price: 597.8Stock Price Date: 09-05-201452 Week Price Change %: 35.8Market Value (mil): 400,376.5
SEDOL: B020QX2
Equity and Dept Distribution:Class A Common Stock $.001 Par, 5/11, 9B auth., 252,993,468 issd. Insiders own 0.36%. Class B Common Stock $.001 Par, 1B auth., 70,888,000 issd. IPO 8/04, 19.6M Class A shares @ $85 by MorganStanley.
Key Corporate Relationships
Auditor: Ernst & Young LLPBank: Boelter Companies Inc
Auditor: Ernst & Young LLP
Additional InfomationABI Number: 550220594Fortune 1000 Rank: 46
© 1983-2014 Reuters Research Inc. All Rights Reserved. © Copyright 2014, Infogroup. All Rights Reserved.
© 2014 Avention, Inc. All Rights Reserved. Copyright © 2014 LexisNexis. All Rights Reserved.
Avention One-Stop Reports for Google Inc
Page 9

© 2014 GlobalData. All Rights Reserved.
Avention One-Stop Reports for Google Inc
Page 10
Google Inc The Strategic Initiatives report is created using technology to extract meaningful insights from analyst reports about a company's strategic projects and investments. More about Strategic Initiatives
Strategic Initiatives
Key Organizational Changes
The transaction closed on April 17, 2013. All financial results related to Motorola Home were presented as net income (loss) from discontinued operations on the Consolidated Statements of Income. Results of Operations We completed our acquisition of Motorola on May 22, 2012 (the acquisition date). In December 2012, we entered into an agreement for the disposition of the Motorola Home segment, and consequently, financial results related to Motorola Home were presented as net income (loss) from discontinued operations in the Consolidated Statements of Income in all periods presented. In April 2013, we completed the disposition of the Motorola Home segment. Source: GlobalData, August 13, 2014 The transaction is expected to close in 2014. As we evaluate the impact of this agreement, we expect financial results of Motorola Mobile will be presented as net income (loss) from discontinued operations on the Consolidated Statements of Income and assets and liabilities of Motorola Mobile to be disposed of will be presented as held for sale on the Consolidated Balance Sheets beginning in the first quarter of 2014. Subsequent to the acquisition of Motorola, we initiated a restructuring plan of our Motorola business. See Note 9 of Notes to Consolidated Financial Statements included in Item 8 of this Annual Report on Form 10-K for further discussion of this restructuring plan and the associated restructuring charges. Our Google segment revenues increased $9,511 million from 2012 to 2013. Source: GlobalData, August 13, 2014
Partnerships
“One great way to do this is by working with our utility partners like MidAmerican Energy, and we hope this agreement will inspire all of our utilities to work with us in finding ways to increase the supply of clean power.” This agreement represents Google’s seventh and largest renewable energy purchase to date, bringing the total amount of renewable energy Google has contracted for to over one gigawatt (1,000 megawatts). “Google’s significant and growing presence within our service area, along with its long and demonstrated commitment to renewable energy, have been important factors in MidAmerican Energy’s pursuit of renewable power,” said Bill Fehrman, president and CEO, MidAmerican Energy. “In addition to increasing Google’s access to renewable energy, this agreement also reduces energy costs for our customers.”Feb 27, 2014Google and 3TIER Give the World Universal Access to Global Wind and Solar Resource Potential3TIER®, a Vaisala company and global leader in renewable energy assessment and forecasting, announced the public release of wind and solar annual averages from its global datasets as part of Google’s Map Gallery launch.Through its collaboration with Google, 3TIER is excited to make this contribution to the global community and vastly improve access to wind and solar resource information by making it freely available to both researchers and the general public in Google’s popular and widely used platform. Until today, gaining access to high quality global wind and solar resource information from a reliable, consistent source was not an option for most people. Source: GlobalData, August 13, 2014
Planning
It will also include more privacy tools. In addition, the company presented new Android television service, new wearable devices and software that will work in cars. Launch of these innovative products helps the company cater to the changing consumer demands toward mobile computing and serve diverse markets more efficiently.Strengthening Home Automation PortfolioThe company has taken several strategic initiatives to strengthen its home automation offerings. In this direction, in January 2014, the company acquired Nest Labs, Inc. (Nest), one of the leading developers of thermostats and smoke alarms. The acquisition is expected to enhance Google's suite of products and services in the home automation. Source: GlobalData, August 13, 2014 Also, in June 2014, the company, through Nest, acquired Dropcam, Inc., surveillance camera maker in the US. The acquisition further broadens Google’s home automation portfolio. These strategic initiatives may provide the company growth opportunities to expand its presence in home automation market.Penetration of Android Operating SystemStrong market acceptance of Android based smartphones may provide ample growth opportunities for the company. Google’s Android operating system has emerged as the leading mobile operating system worldwide. It is expected that Android will garner more market share in the global smartphone market in the future. Source: GlobalData, August 13, 2014
Product
The Motorola Mobile segment of the company was focused on mobile wireless devices and related products and services. In FY2013, the Motorola Mobile segment accounted for 7.4% of the company’s total revenue. The company's research and development (R&D) activities focus on product development and the licensing and
Avention One-Stop Reports for Google Inc
Page 11
acquisition of third-party businesses and technology. In FY2013, the company invested US$7.9 billion on its R&D activities. Geographically, the company operates business across three segments, namely, the US, the UK, and Rest of the world (RoW). Source: GlobalData, August 13, 2014
Copyright © 2014 GlobalData. All Rights Reserved. Published by Avention, Inc.,Sep, 2014
Avention One-Stop Reports for Google Inc
Page 12

Avention One-Stop Reports for Google Inc
Page 13
Google Inc. (Google) is global technology leader focused on web search and advertising services. Increase in revenue, broad range of service portfolio and robust research & development capabilities are its key strengths, whereas involvement in lawsuits remains major concern area. Going forward, risks associated with intense competition, invalid clicks and security breaches may impact its business operations. However, strengthening home automation portfolio, product launch and penetration of android operating system may offer ample growth opportunities to the company.
Google offers a broad range of services including index of websites and other online content, and online advertising to augment its revenue and profitability. The company provides a comprehensive range of services such as online advertising, online display ads, and mobile advertising. It also offers various platforms and applications including Google Apps, Google Buzz, Google Book Search, Google Checkout, Google News, Google Chrome, Google Play, Google TV, and Google Wave. The company’s future business initiatives include Google Editions, and Google Android Market. The product portfolio of the company also includes Gmail, Web Search, Toolbar, Custom Search Engines, Orkut, Maps, YouTube, Google Image Search, Google Scholar, Google Base, Google Finance, Search Google Co-op, Custom Search, Google Video, Google Docs & Spreadsheets, Google Calendar, Google Desktop, Google Pack, Google Earth, Google Sketchup and Sketchup Pro, Google Mobile, Google Labs, Google AdWords, Google AdSense, and Android. A comprehensive range of service offerings enables the company to attract and retain customers and maximize its market share and revenue.
The company reported increase in revenue in FY2013. The company’s revenue increased by 16.1% from US$50,175 million in FY2012 to US$59,825 million in FY2013. In addition, operating income increased by 8.6% from US$12,760 million in FY2012 to US$13,966 in FY2013, and net income increased by 16.8% from US$10,737 million in FY2012 to US$12,920 million in FY2013. This was primarily due to the increase in paid clicks on Google websites and Google Network Members' websites, which was approximately 25% up from FY2012 to FY2013. Strong financial performance helps the company to maintain its stand in the market.
The strong R&D capabilities of the company enable it to implement innovative technologies and deliver advanced products and services that meet its customers' critical needs. Google has robust research and development (R&D) capabilities. The R&D activities of the company focus on improving the performance of products and developing new technologies. The company’s R&D activities endeavor to develop new online advertising offerings and enhance its technological advantages. Its R&D capabilities enable the company to overcome the technical barriers encountered in the commercialization of search, advertising, operating systems and platforms, and enterprise. The R&D team of the company initiated several projects to enhance and develop various products and technologies. The company leases additional R&D, and sales and support offices across the US. Motorola operates manufacturing facilities, R&D, administrative and sales offices in various US locations, as well as internationally. The company’s R&D expenses were US$5.2 billion, US$6.8 billion, and US$8 billion in 2011, 2012, and 2013, respectively. The R&D department employs 18,593 people..Strong focus on R&D enabled the company to develop innovative products. For instance, in October 2013, the company launched a new smartphone, Nexus 5 with a 5 inch HD display, Snapdragon 800 processor, 4G/LTE and built-in wireless charging. Also, in July 2013, the company launched a refreshed Nexus 7 tablet that delivers the perfect mix of power and portability.
Google Inc
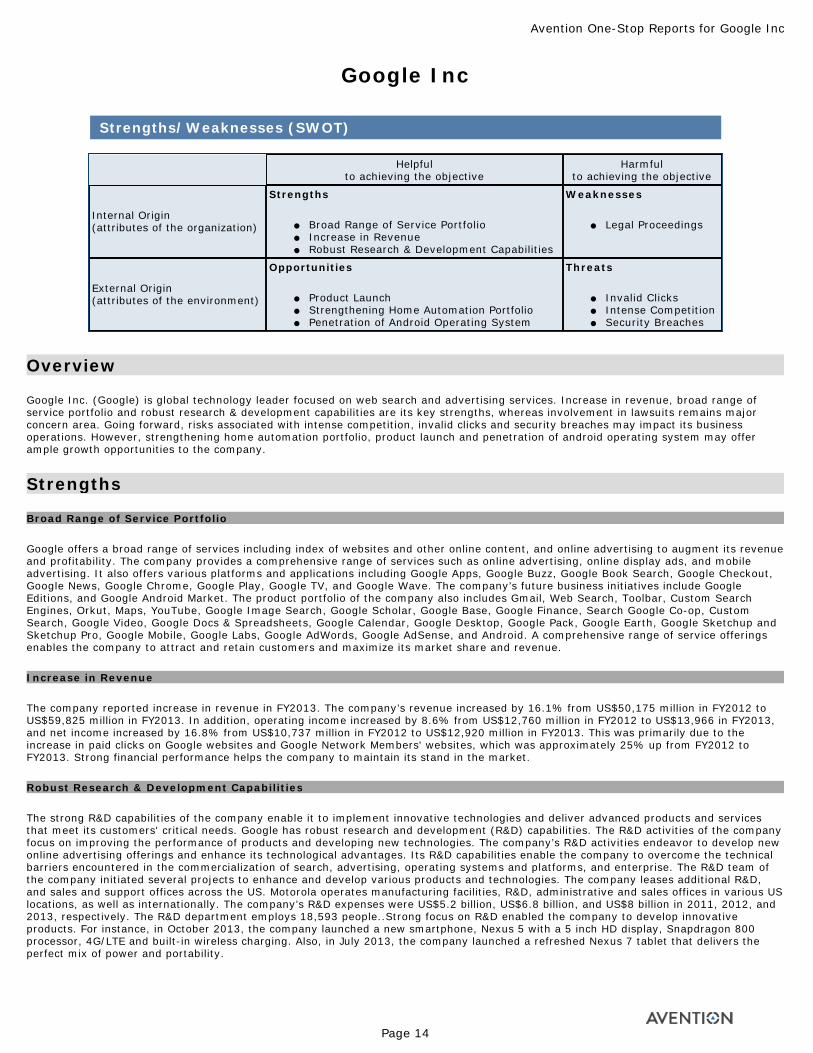
Strengths/Weaknesses (SWOT)
Helpful to achieving the objective
Harmful to achieving the objective
Internal Origin (attributes of the organization)
Strengths
● Broad Range of Service Portfolio ● Increase in Revenue ● Robust Research & Development Capabilities
Weaknesses
● Legal Proceedings
External Origin (attributes of the environment)
Opportunities
● Product Launch ● Strengthening Home Automation Portfolio ● Penetration of Android Operating System
Threats
● Invalid Clicks ● Intense Competition ● Security Breaches
Overview
Strengths
Broad Range of Service Portfolio
Increase in Revenue
Robust Research & Development Capabilities
Avention One-Stop Reports for Google Inc
Page 14
The lawsuits filed against the company may affect its bottom line performance. In May 2014, Hagens Berman, a consumer rights law firm, filed a national class-action lawsuit against Google. It alleges that Google cancels website owners’ AdSense accounts often without explanation shortly before payments are due, and refuses to pay for the ads that ran prior to the cancelation. Also in April 2014, the company, along with three major tech companies agreed to pay a total of US$324 million to settle a lawsuit, which was filled by few tech workers in 2011. The tech workers alleged that four major tech companies including Apple Inc, Google Inc, Intel Inc. and Adobe Systems Inc., together conspired to refrain from soliciting one another's employees in order to avert a salary war. Therefore, lawsuits may result in penalties and fines, and may affect the company’s reputation in the industry, which may affect its business operations.
Recent product launches by the company will help in driving top line performance by serving a huge customer base. In June 2014, the company unveiled a new version of its Android software for smartphones and other devices. The new software enables developers for easy implementation of features such as animations. It will also include more privacy tools. In addition, the company presented new Android television service, new wearable devices and software that will work in cars. Launch of these innovative products helps the company cater to the changing consumer demands toward mobile computing and serve diverse markets more efficiently.
The company has taken several strategic initiatives to strengthen its home automation offerings. In this direction, in January 2014, the company acquired Nest Labs, Inc. (Nest), one of the leading developers of thermostats and smoke alarms. The acquisition is expected to enhance Google's suite of products and services in the home automation. Also, in June 2014, the company, through Nest, acquired Dropcam, Inc., surveillance camera maker in the US. The acquisition further broadens Google’s home automation portfolio. These strategic initiatives may provide the company growth opportunities to expand its presence in home automation market.
Strong market acceptance of Android based smartphones may provide ample growth opportunities for the company. Google’s Android operating system has emerged as the leading mobile operating system worldwide. It is expected that Android will garner more market share in the global smartphone market in the future. According to Google, the daily activation of Android devices reached over one million worldwide. Also, Android users download over 1.5 billion apps and games from Google Play per month. Although Android operating system is primarily benefitted with manufacturers support, the emergence of Android as a major platform may see more applications being built around Android operating system, and may eventually become a single dominant platform for mobile phones. Such scenario may further improve the company’s business operations.
Invalid clicks pose a major threat to companies such as Google. Since the company derives a majority of its revenue from advertising, fraudulent clicks could expose it to related lawsuits. Click fraud artificially inflates the number of clicks, and increases pay per click advertising fee charged to advertisers. Increasing number of click frauds may also result in the company being compelled to refund the fee to its advertisers. The victimized advertisers may also file lawsuits against Google. Thus, avoiding invalid clicks should remain the company’s highest priority as they could have an adverse effect on the company’s brand image and profitability.
Google operates in a highly competitive market which could affect its business and operating results. Competition could intensify with the entry of new competitors, development of new technologies, products and services and convergence. The company witnesses competition from general purpose search engines including Yahoo and Microsoft’s Bing; and social networks such as Facebook and Twitter. It major competitor in mobile application market is Apple Inc. The increase in competition also forced the company to exit from some of its businesses. For instance, Google announced to close its social networking business, Orkut from September 30, 2014. This is primarily due to non performance of business other part of the world, except in India and Brazil, as a result of intense competition from its rivals such as Facebook.
The company’s products and services involve in the storage and transmission of users’ and customers’ proprietary information. Google’s security measures might be breached due to the actions of outside parties, employee error, malfeasance, and as a result, an unauthorized
Weaknesses
Legal Proceedings
Opportunities
Product Launch
Strengthening Home Automation Portfolio
Penetration of Android Operating System
Threats
Invalid Clicks
Intense Competition
Security Breaches
Avention One-Stop Reports for Google Inc
Page 15
party may obtain access to the company’s data or users’ data or customers’ data. Also, its clients are subject to laws and regulations in the US and other jurisdictions designed to protect privacy of their personal information. In addition, experienced computer programmers and hackers may be able to pierce its network security and misappropriate confidential information, create system disruptions and cause shutdowns. Such issues may enable the company to incur significant expenses in addressing problems created by network security breaches. In addition, such issues may enable the company to lose any of the key customers and incur significant expenses in association with customers’ system failures. Breaches of security solutions may hurt the business interest of the company.
© 2014 GlobalData. All Rights Reserved. Published by Avention, Inc., Sep. 2014
Avention One-Stop Reports for Google Inc
Page 16

Avention One-Stop Reports for Google Inc
Page 17
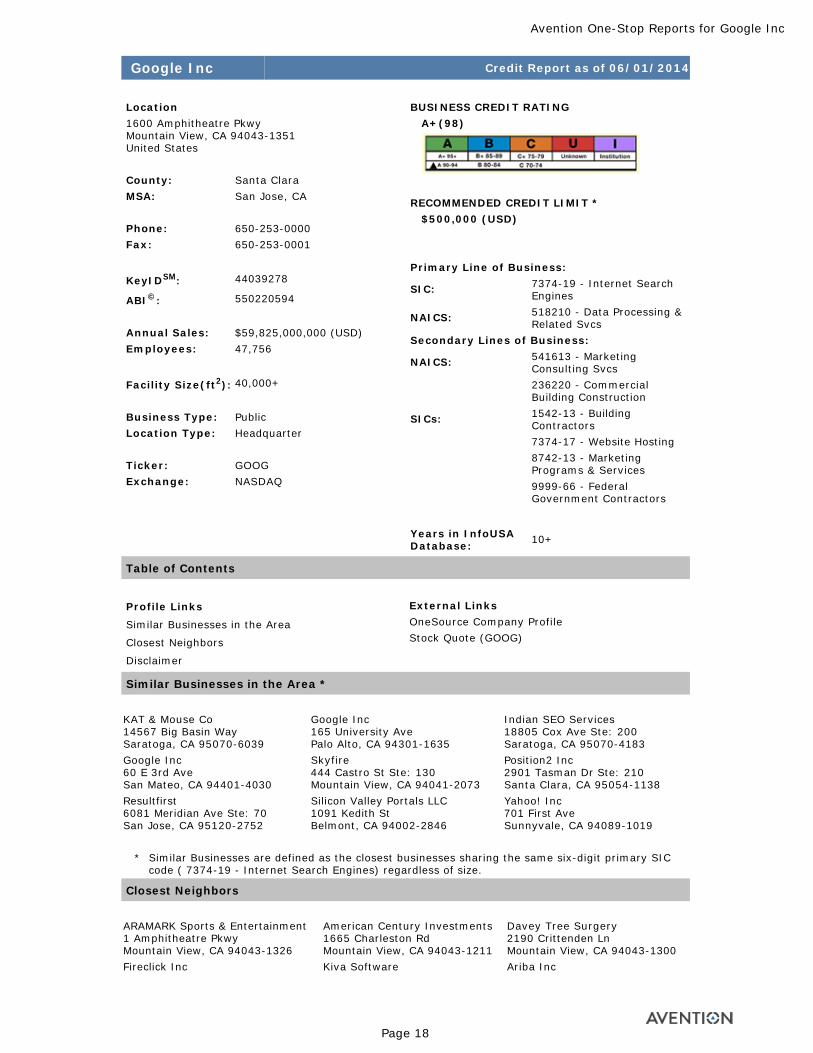
Google Inc Credit Report as of 06/01/2014
Location1600 Amphitheatre Pkwy Mountain View, CA 94043-1351 United States County: Santa ClaraMSA: San Jose, CA Phone: 650-253-0000Fax: 650-253-0001
KeyIDSM: 44039278
ABI©: 550220594
Annual Sales: $59,825,000,000 (USD)Employees: 47,756
Facility Size(ft2): 40,000+
Business Type: PublicLocation Type: Headquarter Ticker: GOOGExchange: NASDAQ
BUSINESS CREDIT RATING A+(98)
RECOMMENDED CREDIT LIMIT * $500,000 (USD) Primary Line of Business:
SIC: 7374-19 - Internet Search Engines
NAICS: 518210 - Data Processing & Related Svcs
Secondary Lines of Business:
NAICS: 541613 - Marketing Consulting Svcs236220 - Commercial Building Construction
SICs: 1542-13 - Building Contractors7374-17 - Website Hosting8742-13 - Marketing Programs & Services9999-66 - Federal Government Contractors
Years in InfoUSA Database: 10+
Table of Contents
Profile Links
Similar Businesses in the Area
Closest Neighbors
Disclaimer
External Links OneSource Company ProfileStock Quote (GOOG)
Similar Businesses in the Area *
KAT & Mouse Co 14567 Big Basin Way Saratoga, CA 95070-6039
Google Inc 165 University Ave Palo Alto, CA 94301-1635
Indian SEO Services 18805 Cox Ave Ste: 200 Saratoga, CA 95070-4183
Google Inc 60 E 3rd Ave San Mateo, CA 94401-4030
Skyfire 444 Castro St Ste: 130 Mountain View, CA 94041-2073
Position2 Inc 2901 Tasman Dr Ste: 210 Santa Clara, CA 95054-1138
Resultfirst 6081 Meridian Ave Ste: 70 San Jose, CA 95120-2752
Silicon Valley Portals LLC 1091 Kedith St Belmont, CA 94002-2846
Yahoo! Inc 701 First Ave Sunnyvale, CA 94089-1019
* Similar Businesses are defined as the closest businesses sharing the same six-digit primary SIC
code ( 7374-19 - Internet Search Engines) regardless of size.
Closest Neighbors
ARAMARK Sports & Entertainment 1 Amphitheatre Pkwy Mountain View, CA 94043-1326
American Century Investments 1665 Charleston Rd Mountain View, CA 94043-1211
Davey Tree Surgery 2190 Crittenden Ln Mountain View, CA 94043-1300
Fireclick Inc Kiva Software Ariba Inc
Avention One-Stop Reports for Google Inc
Page 18
2355 Northside Dr Ste: B250 San Diego, CA 92108-2705
1585 Charleston Rd Mountain View, CA 94043-1225
1565 Charleston Rd Mountain View, CA 94043-1209
A To Z Tree Specimen Nursery 2190 Crittenden Ln Mountain View, CA 94043-1300
Disclaimer Credit.net, a division of infoUSA, has developed a sophisticated computer model to assign credit ratings to most of the 14 million businesses in infoUSA's database. infoUSA's proven model considers information such as the number of employees, years in business, industry stability, census data and other factors to arrive at credit ratings that are sound indicators of ability to pay. It does not factor payment histories as many big companies intentionally "slow pay". Credit.net’s Credit Rating Scores are indicators of the probable ability to pay. We recommend that these ratings be used primarily as a starting point and should not be the sole factor used in making a credit decision. By necessity, credit decisions must be based upon the credit provider’s policies as applied to each unique transaction. You should obtain additional information from bank and trade references, local credit bureaus, or other sources before extending credit. Credit.net is not a financial advisor and makes no representations or warranties as to the accuracy, timeliness or completeness of the rating codes, and as such will not be responsible for any losses resulting from the use of this information. The information presented in this report is a direct representation of information used in developing the credit scores and credit limits. Where information differs between Business Browser and Credit.net (e.g. executive names), the user should utilize Business Browser as their primary information source.
Published by Avention, Inc., September, 2014.
Avention One-Stop Reports for Google Inc
Page 19

Avention One-Stop Reports for Google Inc
Page 20
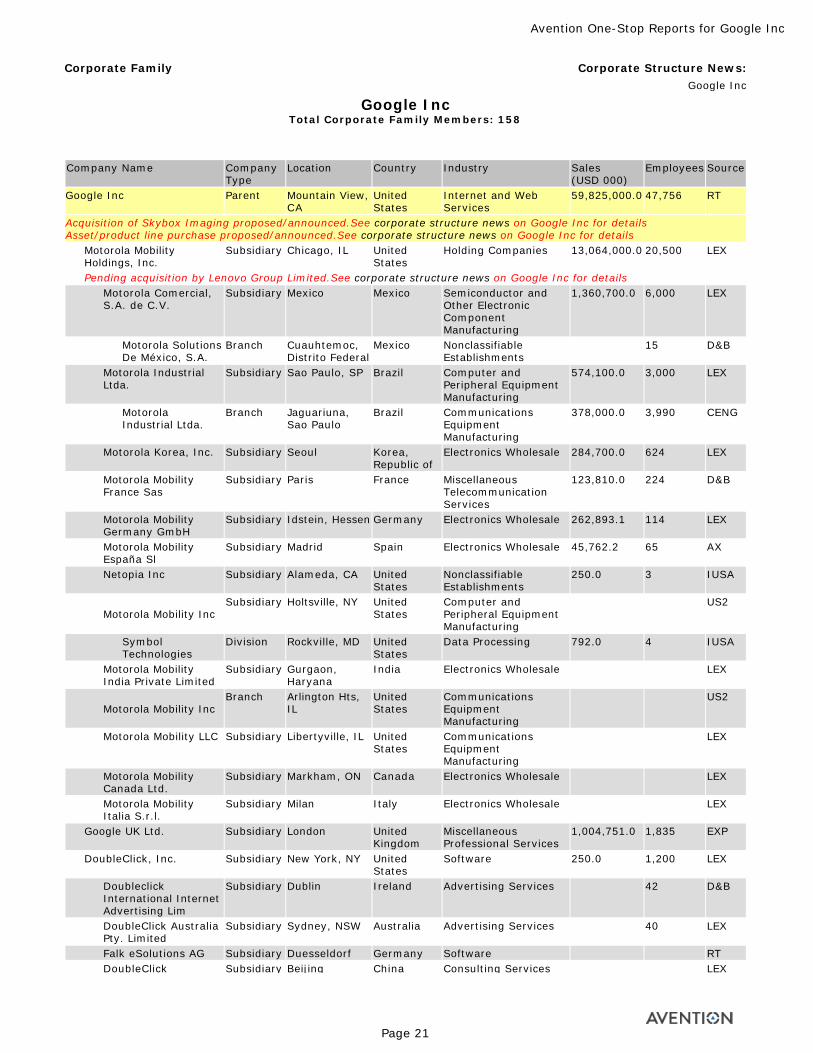
Corporate Family Corporate Structure News: Google Inc
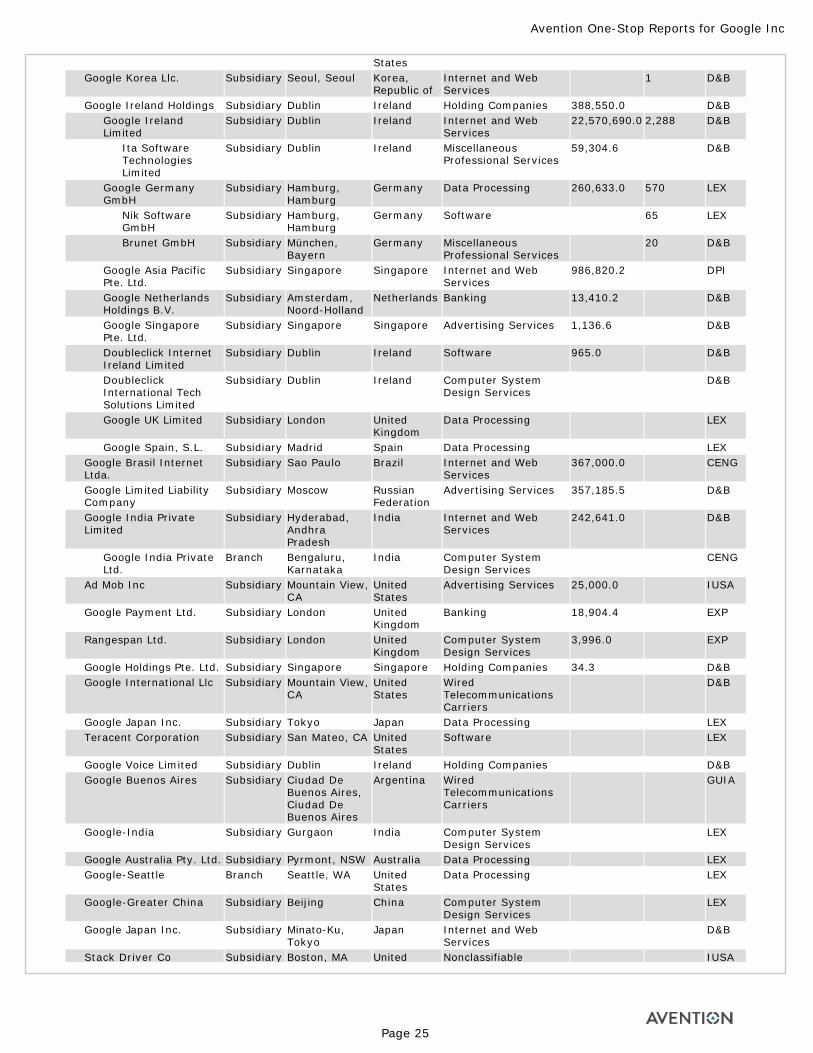
Google Inc Total Corporate Family Members: 158
Company Name Company Type
Location Country Industry Sales (USD 000)
Employees Source
Google Inc Parent Mountain View, CA
United States
Internet and Web Services
59,825,000.0 47,756 RT
Acquisition of Skybox Imaging proposed/announced.See corporate structure news on Google Inc for details Asset/product line purchase proposed/announced.See corporate structure news on Google Inc for details
Motorola Mobility Holdings, Inc.
Subsidiary Chicago, IL United States
Holding Companies 13,064,000.0 20,500 LEX
Pending acquisition by Lenovo Group Limited.See corporate structure news on Google Inc for detailsMotorola Comercial, S.A. de C.V.
Subsidiary Mexico Mexico Semiconductor and Other Electronic Component Manufacturing
1,360,700.0 6,000 LEX
Motorola Solutions De México, S.A.
Branch Cuauhtemoc, Distrito Federal
Mexico Nonclassifiable Establishments
15 D&B
Motorola Industrial Ltda.
Subsidiary Sao Paulo, SP Brazil Computer and Peripheral Equipment Manufacturing
574,100.0 3,000 LEX
Motorola Industrial Ltda.
Branch Jaguariuna, Sao Paulo
Brazil Communications Equipment Manufacturing
378,000.0 3,990 CENG
Motorola Korea, Inc. Subsidiary Seoul Korea, Republic of
Electronics Wholesale 284,700.0 624 LEX
Motorola Mobility France Sas
Subsidiary Paris France Miscellaneous Telecommunication Services
123,810.0 224 D&B
Motorola Mobility Germany GmbH
Subsidiary Idstein, Hessen Germany Electronics Wholesale 262,893.1 114 LEX
Motorola Mobility España Sl
Subsidiary Madrid Spain Electronics Wholesale 45,762.2 65 AX
Netopia Inc Subsidiary Alameda, CA United States
Nonclassifiable Establishments
250.0 3 IUSA
Motorola Mobility IncSubsidiary Holtsville, NY United
StatesComputer and Peripheral Equipment Manufacturing
US2
Symbol Technologies
Division Rockville, MD United States
Data Processing 792.0 4 IUSA
Motorola Mobility India Private Limited
Subsidiary Gurgaon, Haryana
India Electronics Wholesale LEX
Motorola Mobility IncBranch Arlington Hts,
ILUnited States
Communications Equipment Manufacturing
US2
Motorola Mobility LLC Subsidiary Libertyville, IL United States
Communications Equipment Manufacturing
LEX
Motorola Mobility Canada Ltd.
Subsidiary Markham, ON Canada Electronics Wholesale LEX
Motorola Mobility Italia S.r.l.
Subsidiary Milan Italy Electronics Wholesale LEX
Google UK Ltd. Subsidiary London United Kingdom
Miscellaneous Professional Services
1,004,751.0 1,835 EXP
DoubleClick, Inc. Subsidiary New York, NY United States
Software 250.0 1,200 LEX
Doubleclick International Internet Advertising Lim
Subsidiary Dublin Ireland Advertising Services 42 D&B
DoubleClick Australia Pty. Limited
Subsidiary Sydney, NSW Australia Advertising Services 40 LEX
Falk eSolutions AG Subsidiary Duesseldorf Germany Software RT DoubleClick Subsidiary Beijing China Consulting Services LEX
Avention One-Stop Reports for Google Inc
Page 21
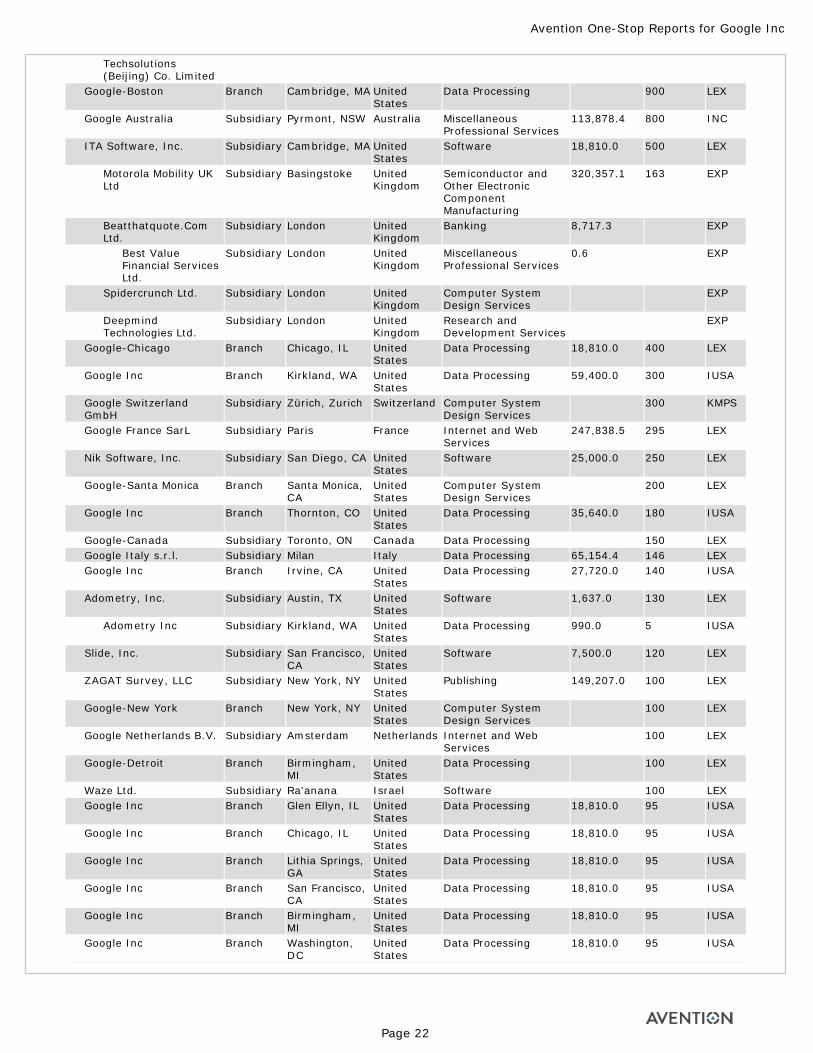
Techsolutions (Beijing) Co. Limited
Google-Boston Branch Cambridge, MA United States
Data Processing 900 LEX
Google Australia Subsidiary Pyrmont, NSW Australia Miscellaneous Professional Services
113,878.4 800 INC
ITA Software, Inc. Subsidiary Cambridge, MA United States
Software 18,810.0 500 LEX
Motorola Mobility UK Ltd
Subsidiary Basingstoke United Kingdom
Semiconductor and Other Electronic Component Manufacturing
320,357.1 163 EXP
Beatthatquote.Com Ltd.
Subsidiary London United Kingdom
Banking 8,717.3 EXP
Best Value Financial Services Ltd.
Subsidiary London United Kingdom
Miscellaneous Professional Services
0.6 EXP
Spidercrunch Ltd. Subsidiary London United Kingdom
Computer System Design Services
EXP
Deepmind Technologies Ltd.
Subsidiary London United Kingdom
Research and Development Services
EXP
Google-Chicago Branch Chicago, IL United States
Data Processing 18,810.0 400 LEX
Google Inc Branch Kirkland, WA United States
Data Processing 59,400.0 300 IUSA
Google Switzerland GmbH
Subsidiary Zürich, Zurich Switzerland Computer System Design Services
300 KMPS
Google France SarL Subsidiary Paris France Internet and Web Services
247,838.5 295 LEX
Nik Software, Inc. Subsidiary San Diego, CA United States
Software 25,000.0 250 LEX
Google-Santa Monica Branch Santa Monica, CA
United States
Computer System Design Services
200 LEX
Google Inc Branch Thornton, CO United States
Data Processing 35,640.0 180 IUSA
Google-Canada Subsidiary Toronto, ON Canada Data Processing 150 LEX Google Italy s.r.l. Subsidiary Milan Italy Data Processing 65,154.4 146 LEX Google Inc Branch Irvine, CA United
StatesData Processing 27,720.0 140 IUSA
Adometry, Inc. Subsidiary Austin, TX United States
Software 1,637.0 130 LEX
Adometry Inc Subsidiary Kirkland, WA United States
Data Processing 990.0 5 IUSA
Slide, Inc. Subsidiary San Francisco, CA
United States
Software 7,500.0 120 LEX
ZAGAT Survey, LLC Subsidiary New York, NY United States
Publishing 149,207.0 100 LEX
Google-New York Branch New York, NY United States
Computer System Design Services
100 LEX
Google Netherlands B.V. Subsidiary Amsterdam Netherlands Internet and Web Services
100 LEX
Google-Detroit Branch Birmingham, MI
United States
Data Processing 100 LEX
Waze Ltd. Subsidiary Ra'anana Israel Software 100 LEX Google Inc Branch Glen Ellyn, IL United
StatesData Processing 18,810.0 95 IUSA
Google Inc Branch Chicago, IL United States
Data Processing 18,810.0 95 IUSA
Google Inc Branch Lithia Springs, GA
United States
Data Processing 18,810.0 95 IUSA
Google Inc Branch San Francisco, CA
United States
Data Processing 18,810.0 95 IUSA
Google Inc Branch Birmingham, MI
United States
Data Processing 18,810.0 95 IUSA
Google Inc Branch Washington, DC
United States
Data Processing 18,810.0 95 IUSA
Avention One-Stop Reports for Google Inc
Page 22
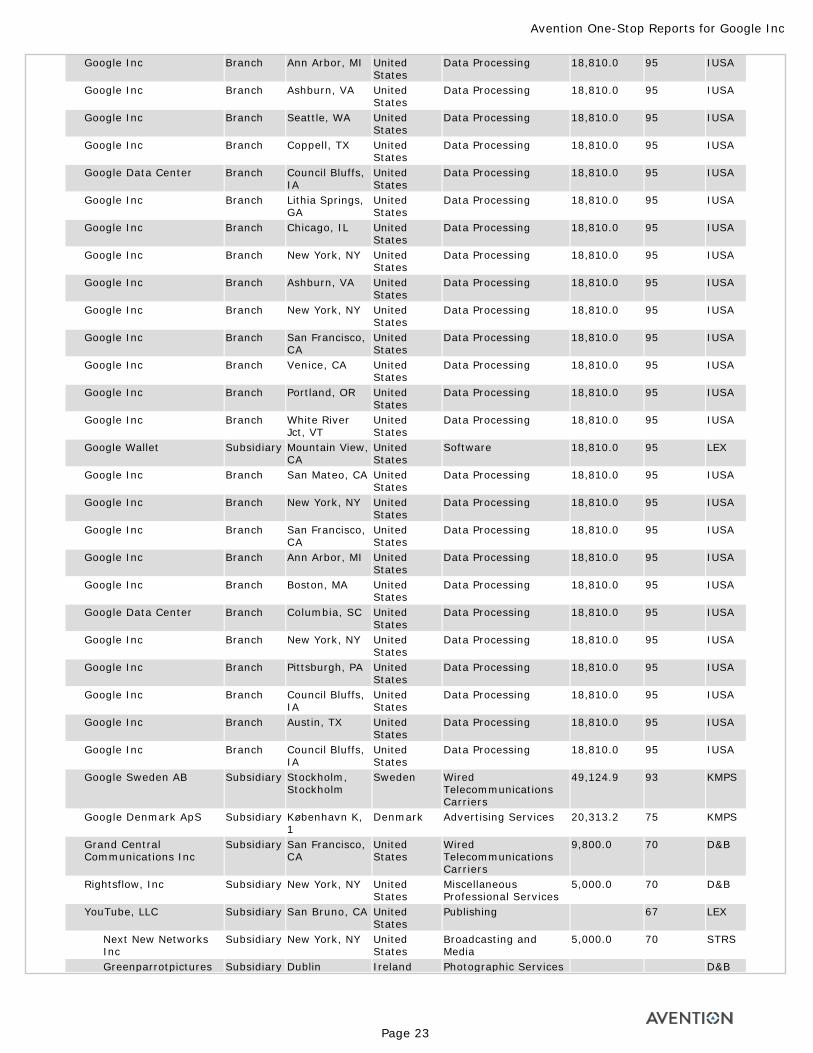
Google Inc Branch Ann Arbor, MI United States
Data Processing 18,810.0 95 IUSA
Google Inc Branch Ashburn, VA United States
Data Processing 18,810.0 95 IUSA
Google Inc Branch Seattle, WA United States
Data Processing 18,810.0 95 IUSA
Google Inc Branch Coppell, TX United States
Data Processing 18,810.0 95 IUSA
Google Data Center Branch Council Bluffs, IA
United States
Data Processing 18,810.0 95 IUSA
Google Inc Branch Lithia Springs, GA
United States
Data Processing 18,810.0 95 IUSA
Google Inc Branch Chicago, IL United States
Data Processing 18,810.0 95 IUSA
Google Inc Branch New York, NY United States
Data Processing 18,810.0 95 IUSA
Google Inc Branch Ashburn, VA United States
Data Processing 18,810.0 95 IUSA
Google Inc Branch New York, NY United States
Data Processing 18,810.0 95 IUSA
Google Inc Branch San Francisco, CA
United States
Data Processing 18,810.0 95 IUSA
Google Inc Branch Venice, CA United States
Data Processing 18,810.0 95 IUSA
Google Inc Branch Portland, OR United States
Data Processing 18,810.0 95 IUSA
Google Inc Branch White River Jct, VT
United States
Data Processing 18,810.0 95 IUSA
Google Wallet Subsidiary Mountain View, CA
United States
Software 18,810.0 95 LEX
Google Inc Branch San Mateo, CA United States
Data Processing 18,810.0 95 IUSA
Google Inc Branch New York, NY United States
Data Processing 18,810.0 95 IUSA
Google Inc Branch San Francisco, CA
United States
Data Processing 18,810.0 95 IUSA
Google Inc Branch Ann Arbor, MI United States
Data Processing 18,810.0 95 IUSA
Google Inc Branch Boston, MA United States
Data Processing 18,810.0 95 IUSA
Google Data Center Branch Columbia, SC United States
Data Processing 18,810.0 95 IUSA
Google Inc Branch New York, NY United States
Data Processing 18,810.0 95 IUSA
Google Inc Branch Pittsburgh, PA United States
Data Processing 18,810.0 95 IUSA
Google Inc Branch Council Bluffs, IA
United States
Data Processing 18,810.0 95 IUSA
Google Inc Branch Austin, TX United States
Data Processing 18,810.0 95 IUSA
Google Inc Branch Council Bluffs, IA
United States
Data Processing 18,810.0 95 IUSA
Google Sweden AB Subsidiary Stockholm, Stockholm
Sweden Wired Telecommunications Carriers
49,124.9 93 KMPS
Google Denmark ApS Subsidiary København K, 1
Denmark Advertising Services 20,313.2 75 KMPS
Grand Central Communications Inc
Subsidiary San Francisco, CA
United States
Wired Telecommunications Carriers
9,800.0 70 D&B
Rightsflow, Inc Subsidiary New York, NY United States
Miscellaneous Professional Services
5,000.0 70 D&B
YouTube, LLC Subsidiary San Bruno, CA United States
Publishing 67 LEX
Next New Networks Inc
Subsidiary New York, NY United States
Broadcasting and Media
5,000.0 70 STRS
Greenparrotpictures Subsidiary Dublin Ireland Photographic Services D&B
Avention One-Stop Reports for Google Inc
Page 23
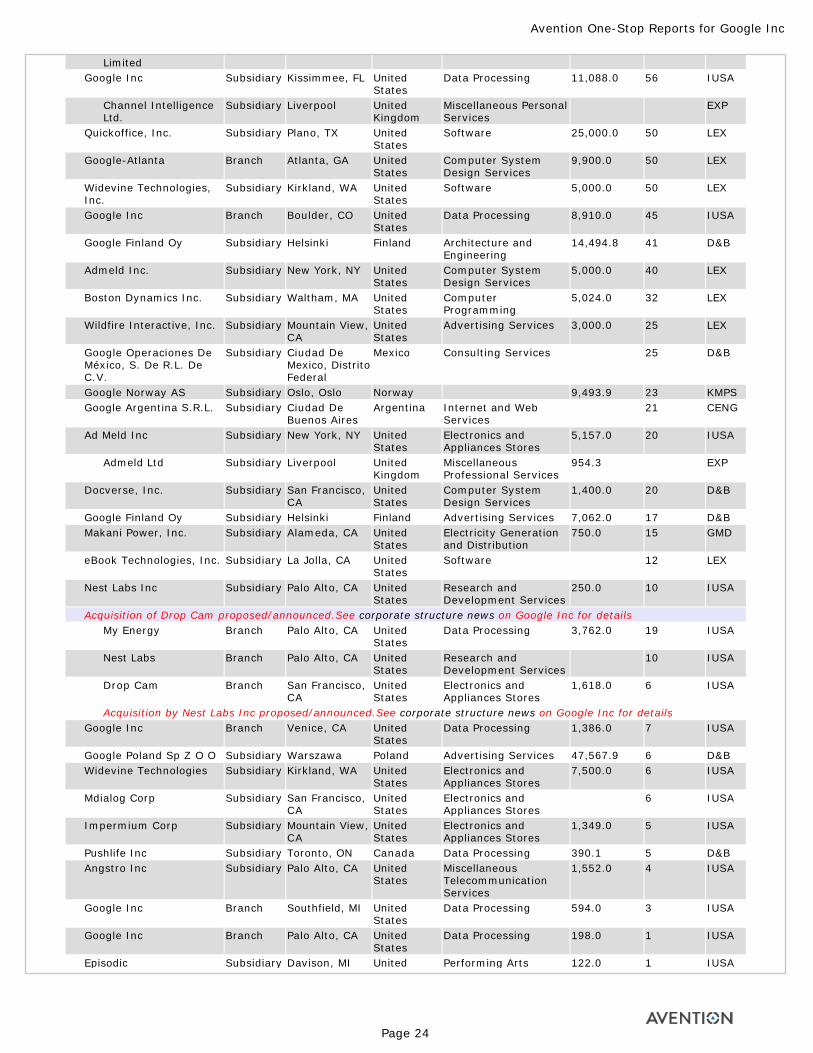
LimitedGoogle Inc Subsidiary Kissimmee, FL United
StatesData Processing 11,088.0 56 IUSA
Channel Intelligence Ltd.
Subsidiary Liverpool United Kingdom
Miscellaneous Personal Services
EXP
Quickoffice, Inc. Subsidiary Plano, TX United States
Software 25,000.0 50 LEX
Google-Atlanta Branch Atlanta, GA United States
Computer System Design Services
9,900.0 50 LEX
Widevine Technologies, Inc.
Subsidiary Kirkland, WA United States
Software 5,000.0 50 LEX
Google Inc Branch Boulder, CO United States
Data Processing 8,910.0 45 IUSA
Google Finland Oy Subsidiary Helsinki Finland Architecture and Engineering
14,494.8 41 D&B
Admeld Inc. Subsidiary New York, NY United States
Computer System Design Services
5,000.0 40 LEX
Boston Dynamics Inc. Subsidiary Waltham, MA United States
Computer Programming
5,024.0 32 LEX
Wildfire Interactive, Inc. Subsidiary Mountain View, CA
United States
Advertising Services 3,000.0 25 LEX
Google Operaciones De México, S. De R.L. De C.V.
Subsidiary Ciudad De Mexico, Distrito Federal
Mexico Consulting Services 25 D&B
Google Norway AS Subsidiary Oslo, Oslo Norway 9,493.9 23 KMPSGoogle Argentina S.R.L. Subsidiary Ciudad De
Buenos AiresArgentina Internet and Web
Services21 CENG
Ad Meld Inc Subsidiary New York, NY United States
Electronics and Appliances Stores
5,157.0 20 IUSA
Admeld Ltd Subsidiary Liverpool United Kingdom
Miscellaneous Professional Services
954.3 EXP
Docverse, Inc. Subsidiary San Francisco, CA
United States
Computer System Design Services
1,400.0 20 D&B
Google Finland Oy Subsidiary Helsinki Finland Advertising Services 7,062.0 17 D&B Makani Power, Inc. Subsidiary Alameda, CA United
StatesElectricity Generation and Distribution
750.0 15 GMD
eBook Technologies, Inc. Subsidiary La Jolla, CA United States
Software 12 LEX
Nest Labs Inc Subsidiary Palo Alto, CA United States
Research and Development Services
250.0 10 IUSA
Acquisition of Drop Cam proposed/announced.See corporate structure news on Google Inc for detailsMy Energy Branch Palo Alto, CA United
StatesData Processing 3,762.0 19 IUSA
Nest Labs Branch Palo Alto, CA United States
Research and Development Services
10 IUSA
Drop Cam Branch San Francisco, CA
United States
Electronics and Appliances Stores
1,618.0 6 IUSA
Acquisition by Nest Labs Inc proposed/announced.See corporate structure news on Google Inc for detailsGoogle Inc Branch Venice, CA United
StatesData Processing 1,386.0 7 IUSA
Google Poland Sp Z O O Subsidiary Warszawa Poland Advertising Services 47,567.9 6 D&B Widevine Technologies Subsidiary Kirkland, WA United
StatesElectronics and Appliances Stores
7,500.0 6 IUSA
Mdialog Corp Subsidiary San Francisco, CA
United States
Electronics and Appliances Stores
6 IUSA
Impermium Corp Subsidiary Mountain View, CA
United States
Electronics and Appliances Stores
1,349.0 5 IUSA
Pushlife Inc Subsidiary Toronto, ON Canada Data Processing 390.1 5 D&B Angstro Inc Subsidiary Palo Alto, CA United
StatesMiscellaneous Telecommunication Services
1,552.0 4 IUSA
Google Inc Branch Southfield, MI United States
Data Processing 594.0 3 IUSA
Google Inc Branch Palo Alto, CA United States
Data Processing 198.0 1 IUSA
Episodic Subsidiary Davison, MI United Performing Arts 122.0 1 IUSA
Avention One-Stop Reports for Google Inc
Page 24
StatesGoogle Korea Llc. Subsidiary Seoul, Seoul Korea,
Republic ofInternet and Web Services
1 D&B
Google Ireland Holdings Subsidiary Dublin Ireland Holding Companies 388,550.0 D&B Google Ireland Limited
Subsidiary Dublin Ireland Internet and Web Services
22,570,690.0 2,288 D&B
Ita Software Technologies Limited
Subsidiary Dublin Ireland Miscellaneous Professional Services
59,304.6 D&B
Google Germany GmbH
Subsidiary Hamburg, Hamburg
Germany Data Processing 260,633.0 570 LEX
Nik Software GmbH
Subsidiary Hamburg, Hamburg
Germany Software 65 LEX
Brunet GmbH Subsidiary München, Bayern
Germany Miscellaneous Professional Services
20 D&B
Google Asia Pacific Pte. Ltd.
Subsidiary Singapore Singapore Internet and Web Services
986,820.2 DPI
Google Netherlands Holdings B.V.
Subsidiary Amsterdam, Noord-Holland
Netherlands Banking 13,410.2 D&B
Google Singapore Pte. Ltd.
Subsidiary Singapore Singapore Advertising Services 1,136.6 D&B
Doubleclick Internet Ireland Limited
Subsidiary Dublin Ireland Software 965.0 D&B
Doubleclick International Tech Solutions Limited
Subsidiary Dublin Ireland Computer System Design Services
D&B
Google UK Limited Subsidiary London United Kingdom
Data Processing LEX
Google Spain, S.L. Subsidiary Madrid Spain Data Processing LEX Google Brasil Internet Ltda.
Subsidiary Sao Paulo Brazil Internet and Web Services
367,000.0 CENG
Google Limited Liability Company
Subsidiary Moscow Russian Federation
Advertising Services 357,185.5 D&B
Google India Private Limited
Subsidiary Hyderabad, Andhra Pradesh
India Internet and Web Services
242,641.0 D&B
Google India Private Ltd.
Branch Bengaluru, Karnataka
India Computer System Design Services
CENG
Ad Mob Inc Subsidiary Mountain View, CA
United States
Advertising Services 25,000.0 IUSA
Google Payment Ltd. Subsidiary London United Kingdom
Banking 18,904.4 EXP
Rangespan Ltd. Subsidiary London United Kingdom
Computer System Design Services
3,996.0 EXP
Google Holdings Pte. Ltd. Subsidiary Singapore Singapore Holding Companies 34.3 D&B Google International Llc Subsidiary Mountain View,
CAUnited States
Wired Telecommunications Carriers
D&B
Google Japan Inc. Subsidiary Tokyo Japan Data Processing LEX Teracent Corporation Subsidiary San Mateo, CA United
StatesSoftware LEX
Google Voice Limited Subsidiary Dublin Ireland Holding Companies D&B Google Buenos Aires Subsidiary Ciudad De
Buenos Aires, Ciudad De Buenos Aires
Argentina Wired Telecommunications Carriers
GUIA
Google-India Subsidiary Gurgaon India Computer System Design Services
LEX
Google Australia Pty. Ltd. Subsidiary Pyrmont, NSW Australia Data Processing LEX Google-Seattle Branch Seattle, WA United
StatesData Processing LEX
Google-Greater China Subsidiary Beijing China Computer System Design Services
LEX
Google Japan Inc. Subsidiary Minato-Ku, Tokyo
Japan Internet and Web Services
D&B
Stack Driver Co Subsidiary Boston, MA United Nonclassifiable IUSA
Avention One-Stop Reports for Google Inc
Page 25
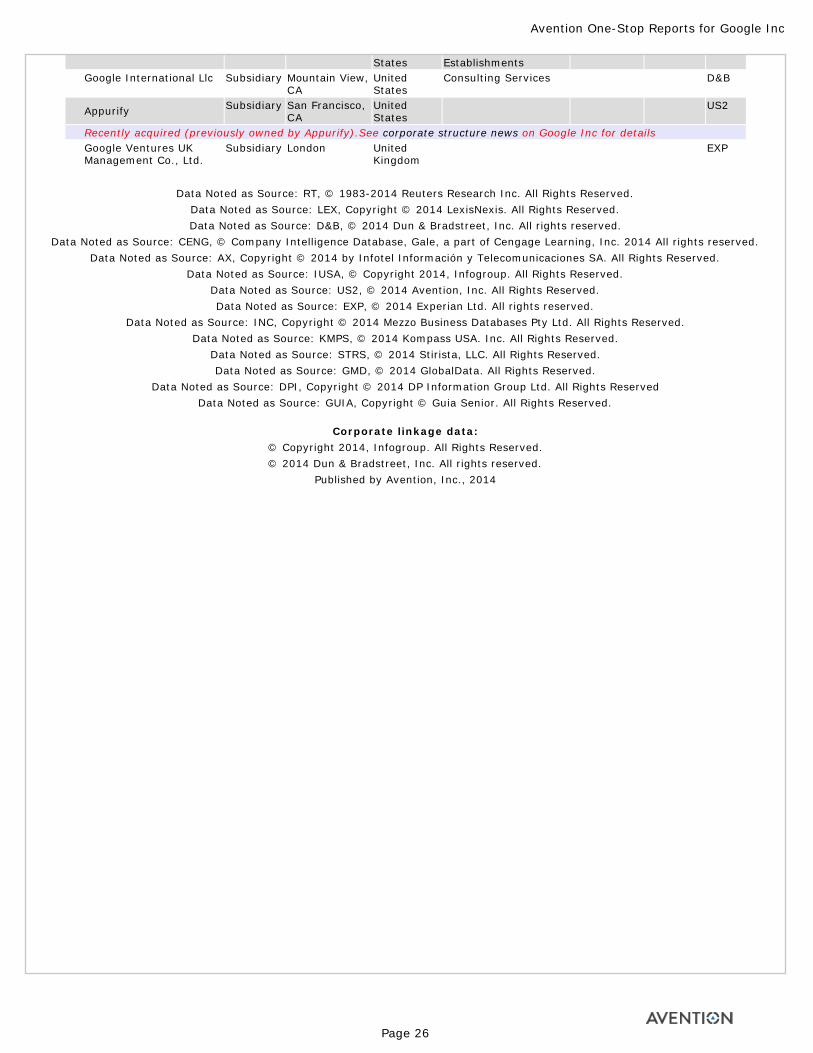
States EstablishmentsGoogle International Llc Subsidiary Mountain View,
CAUnited States
Consulting Services D&B
Appurify Subsidiary San Francisco, CA
United States
US2
Recently acquired (previously owned by Appurify).See corporate structure news on Google Inc for detailsGoogle Ventures UK Management Co., Ltd.
Subsidiary London United Kingdom
EXP
Data Noted as Source: RT, © 1983-2014 Reuters Research Inc. All Rights Reserved.
Data Noted as Source: LEX, Copyright © 2014 LexisNexis. All Rights Reserved.Data Noted as Source: D&B, © 2014 Dun & Bradstreet, Inc. All rights reserved.
Data Noted as Source: CENG, © Company Intelligence Database, Gale, a part of Cengage Learning, Inc. 2014 All rights reserved.Data Noted as Source: AX, Copyright © 2014 by Infotel Información y Telecomunicaciones SA. All Rights Reserved.
Data Noted as Source: IUSA, © Copyright 2014, Infogroup. All Rights Reserved.Data Noted as Source: US2, © 2014 Avention, Inc. All Rights Reserved.Data Noted as Source: EXP, © 2014 Experian Ltd. All rights reserved.
Data Noted as Source: INC, Copyright © 2014 Mezzo Business Databases Pty Ltd. All Rights Reserved.Data Noted as Source: KMPS, © 2014 Kompass USA. Inc. All Rights Reserved.
Data Noted as Source: STRS, © 2014 Stirista, LLC. All Rights Reserved.Data Noted as Source: GMD, © 2014 GlobalData. All Rights Reserved.
Data Noted as Source: DPI, Copyright © 2014 DP Information Group Ltd. All Rights ReservedData Noted as Source: GUIA, Copyright © Guia Senior. All Rights Reserved.
Corporate linkage data:
© Copyright 2014, Infogroup. All Rights Reserved.© 2014 Dun & Bradstreet, Inc. All rights reserved.
Published by Avention, Inc., 2014
Avention One-Stop Reports for Google Inc
Page 26
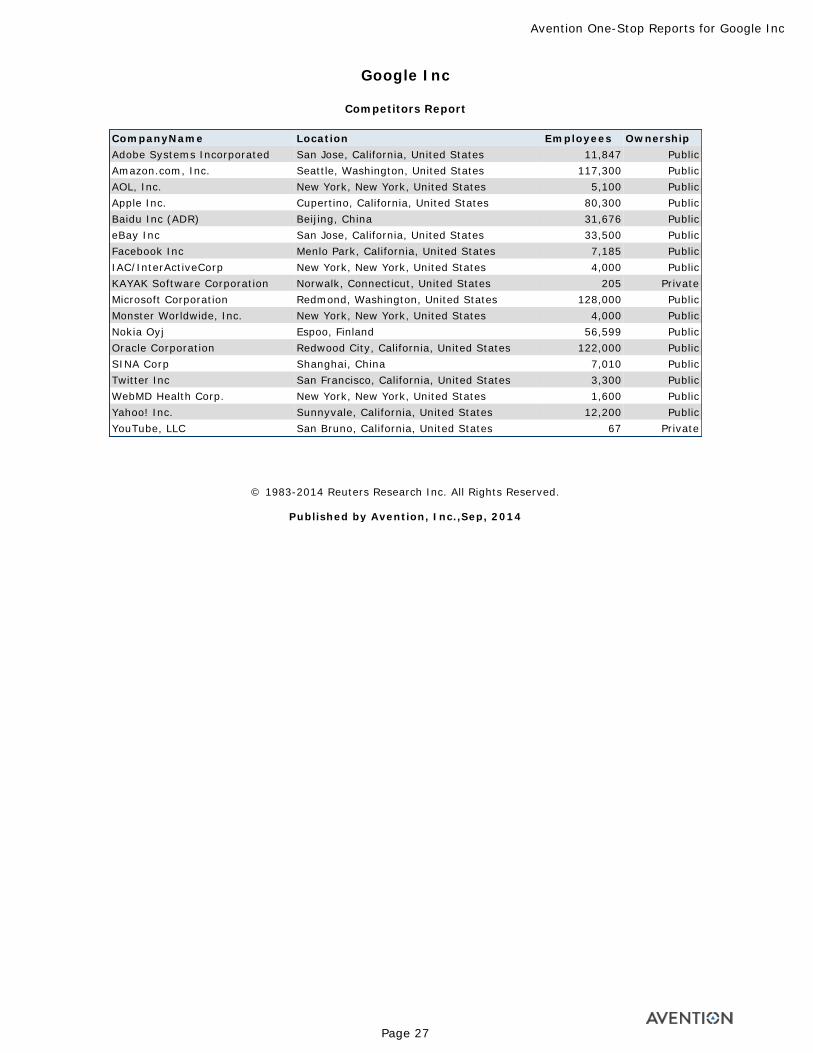
Google Inc
Competitors Report
CompanyName Location Employees Ownership Adobe Systems Incorporated San Jose, California, United States 11,847 Public Amazon.com, Inc. Seattle, Washington, United States 117,300 Public AOL, Inc. New York, New York, United States 5,100 Public Apple Inc. Cupertino, California, United States 80,300 Public Baidu Inc (ADR) Beijing, China 31,676 Public eBay Inc San Jose, California, United States 33,500 Public Facebook Inc Menlo Park, California, United States 7,185 Public IAC/InterActiveCorp New York, New York, United States 4,000 Public KAYAK Software Corporation Norwalk, Connecticut, United States 205 Private Microsoft Corporation Redmond, Washington, United States 128,000 Public Monster Worldwide, Inc. New York, New York, United States 4,000 Public Nokia Oyj Espoo, Finland 56,599 Public Oracle Corporation Redwood City, California, United States 122,000 Public SINA Corp Shanghai, China 7,010 Public Twitter Inc San Francisco, California, United States 3,300 Public WebMD Health Corp. New York, New York, United States 1,600 Public Yahoo! Inc. Sunnyvale, California, United States 12,200 Public YouTube, LLC San Bruno, California, United States 67 Private
© 1983-2014 Reuters Research Inc. All Rights Reserved.
Published by Avention, Inc.,Sep, 2014
Avention One-Stop Reports for Google Inc
Page 27
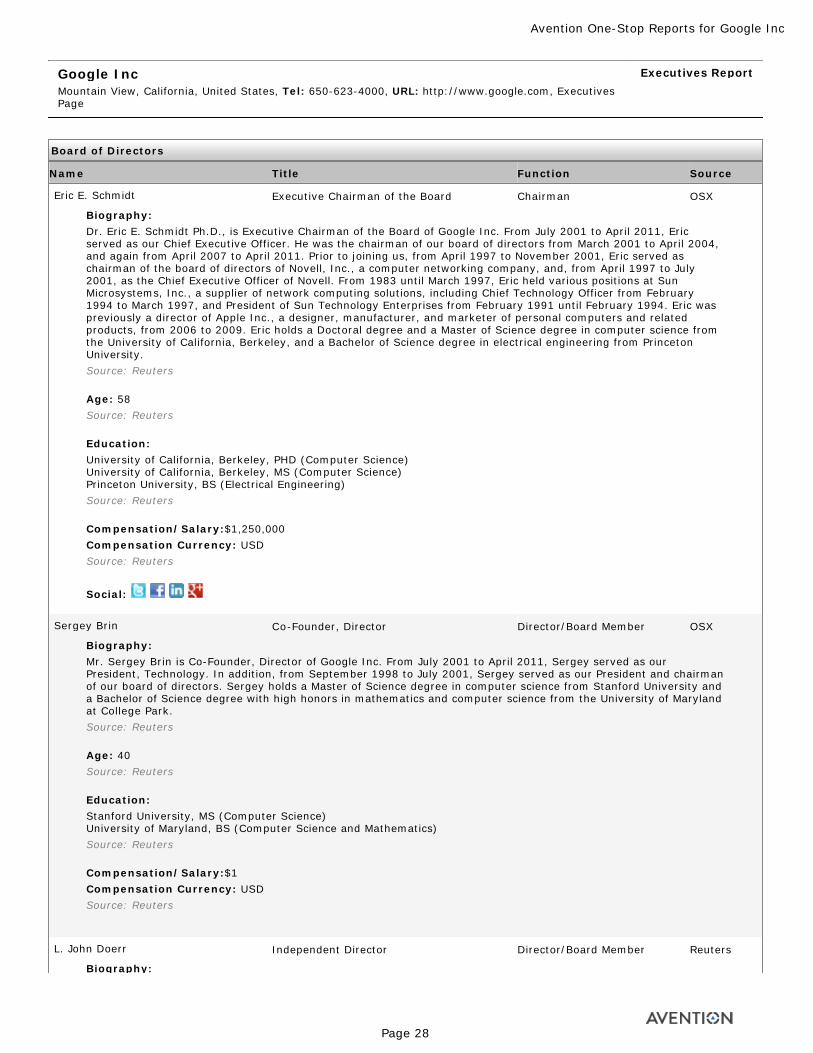
Google IncMountain View, California, United States, Tel: 650-623-4000, URL: http://www.google.com, Executives Page
Executives Report
Board of Directors
Name Title Function Source
Eric E. Schmidt Executive Chairman of the Board Chairman OSX
Biography: Dr. Eric E. Schmidt Ph.D., is Executive Chairman of the Board of Google Inc. From July 2001 to April 2011, Eric served as our Chief Executive Officer. He was the chairman of our board of directors from March 2001 to April 2004, and again from April 2007 to April 2011. Prior to joining us, from April 1997 to November 2001, Eric served as chairman of the board of directors of Novell, Inc., a computer networking company, and, from April 1997 to July 2001, as the Chief Executive Officer of Novell. From 1983 until March 1997, Eric held various positions at Sun Microsystems, Inc., a supplier of network computing solutions, including Chief Technology Officer from February 1994 to March 1997, and President of Sun Technology Enterprises from February 1991 until February 1994. Eric was previously a director of Apple Inc., a designer, manufacturer, and marketer of personal computers and related products, from 2006 to 2009. Eric holds a Doctoral degree and a Master of Science degree in computer science from the University of California, Berkeley, and a Bachelor of Science degree in electrical engineering from Princeton University.Source: Reuters Age: 58Source: Reuters Education:University of California, Berkeley, PHD (Computer Science) University of California, Berkeley, MS (Computer Science) Princeton University, BS (Electrical Engineering) Source: Reuters Compensation/Salary:$1,250,000Compensation Currency: USDSource: Reuters
Social:
Sergey Brin Co-Founder, Director Director/Board Member OSX
Biography: Mr. Sergey Brin is Co-Founder, Director of Google Inc. From July 2001 to April 2011, Sergey served as our President, Technology. In addition, from September 1998 to July 2001, Sergey served as our President and chairman of our board of directors. Sergey holds a Master of Science degree in computer science from Stanford University and a Bachelor of Science degree with high honors in mathematics and computer science from the University of Maryland at College Park.Source: Reuters Age: 40Source: Reuters Education:Stanford University, MS (Computer Science) University of Maryland, BS (Computer Science and Mathematics) Source: Reuters Compensation/Salary:$1Compensation Currency: USDSource: Reuters
L. John Doerr Independent Director Director/Board Member Reuters
Biography:
Avention One-Stop Reports for Google Inc
Page 28
Mr. L. John Doerr is Independent Director of Google Inc. John has been a General Partner of Kleiner Perkins Caufield & Byers, a venture capital firm, since August 1980. John has also been a member of the board of directors of Amyris, Inc., a synthetic biology company, since May 2006, and serves as chair of its nominating and governance committee and as a member of its leadership development and compensation committee; and Zynga Inc., a provider of social game services, since April 2013. John was previously a director of Amazon.com, Inc., an internet retail company, from 1996 to 2010. John holds a Master of Business Administration degree from Harvard Business School, and a Master of Science degree in electrical engineering and computer science, and a Bachelor of Science degree in electrical engineering from Rice University.Source: Reuters Age: 62Source: Reuters Education:Harvard Business School, MBA William Marsh Rice University, MS (Electrical Engineering and Computer Science) William Marsh Rice University, BS (Electrical Engineering) Source: Reuters
Daniel FrenchView Email Administrative Board Member Director/Board Member NetProspex*
Diane B. Greene Independent Director Director/Board Member Reuters
Biography: Ms. Diane B. Greene is Independent Director of Google Inc. Diane has also been a member of the board of directors of Intuit Inc., a provider of business and financial management solutions, since August 2006 and serves on its audit and risk committee and nominating and corporate governance committee. She is also a member of The MIT Corporation, the governing body of the Massachusetts Institute of Technology. Diane co-founded VMware, Inc., a provider of virtualization and virtualization-based cloud infrastructure solutions, in 1998 and took the company public in 2007. She served as Chief Executive Officer and President of VMware from 1998 to 2008, as a member of the board of directors of VMware from 2007 to 2008, and as an Executive Vice President of EMC Corporation, a provider of information infrastructure and virtual infrastructure technologies, solutions, and services, from 2005 to 2008. Prior to VMware, Diane held technical leadership positions at Silicon Graphics Inc., a provider of technical computing, storage, and data center solutions, Tandem Computers, Inc., a manufacturer of computer systems, and Sybase Inc., a global enterprise software and services company, and was Chief Executive Officer of VXtreme, Inc., a developer of streaming media solutions. Diane holds a Master of Science degree in computer science from the University of California, Berkeley, a Master of Science degree in naval architecture from the Massachusetts Institute of Technology, and a Bachelor of Arts degree in mechanical engineering from the University of Vermont.Source: Reuters Age: 58Source: Reuters Education:Massachusetts Institute of Technology, MS (Naval Architecture) University of California, Berkeley, MS (Computer Science) The University of Vermont, BA (Mechanical Engineering) Source: Reuters
Social:
John L. Hennessy Lead Independent Director Director/Board Member Reuters
Biography: Dr. John L. Hennessy, Ph.D., is Lead Independent Director of Google Inc. John has served as the President of Stanford University since September 2000. John has also been a member of the board of directors of Cisco Systems, Inc., a networking equipment company, since January 2002 and serves on its nominating and governance committee and acquisition committee. He also serves as a trustee of the Gordon and Betty Moore Foundation. From 1994 to August 2000, John held various positions at Stanford, including Dean of the Stanford University School of Engineering and Chair of the Stanford University Department of Computer Science. John co-founded and served as the chairman of the board of directors of Atheros Communications, Inc., a wireless semiconductor company, from 1998 to 2010. John holds a Doctoral degree and a Master of Science degree in computer science from the State University of New York, Stony Brook, and a Bachelor of Science degree in electrical engineering from Villanova University.Source: Reuters Age: 61
Avention One-Stop Reports for Google Inc
Page 29
Source: Reuters Education:State University of New York at Stony Brook, PHD (Computer Science) State University of New York at Stony Brook, MS (Computer Science) Villanova University, BS (Electrical Engineering) Source: Reuters
Social:
Ann Mather Independent Director Director/Board Member Reuters
Biography: Ms. Ann Mather is Independent Director of Google Inc. Ann has also been a member of the board of directors of: Glu Mobile Inc., a publisher of mobile games, since September 2005, and serves on its nominating and governance committee; Netflix, Inc., an internet subscription service for movies and television shows, since July 2010, and serves as chair of its audit committee; Shutterfly, Inc., a manufacturer and retailer of personalized products and services, since May 2013, and serves on its audit committee; and Solazyme, Inc., a renewable oil and bioproducts company, since April 2011, and serves as chair of its audit committee. Ann has also been an independent trustee to the Dodge & Cox Funds board of trustees since May 2011. Ann was previously a director of Central European Media Enterprises Group, a developer and operator of national commercial television channels and stations in Central and Eastern Europe, from 2004 to 2009, and MoneyGram International, Inc., a global payment services company, from May 2010 to May 2013. From 1999 to 2004, Ann was Executive Vice President and Chief Financial Officer of Pixar, a computer animation studio. Prior to her service at Pixar, Ann was Executive Vice President and Chief Financial Officer of Village Roadshow Pictures, the film production division of Village Roadshow Limited. Ann holds a Master of Arts degree from Cambridge University in England and is a chartered accountant.Source: Reuters Age: 55Source: Reuters Education:University of Cambridge, MA Source: Reuters
Social:
Alan R. Mulally Director Director/Board Member Reuters
Biography: Mr. Alan R. Mulally has been appointed as Director of Google Inc., with effect from 9 July 2014. Mr. Mulally served as President and Chief Executive Officer of Ford Motor Company, a global automotive company, from September 2006 through June 2014. Mr. Mulally was previously member of the board of directors of Ford and served on its finance committee from September 2006 through June 2014. From March 2001 to September 2006, Mr. Mulally served as Executive Vice President of the Boeing Company and President and Chief Executive Officer of Boeing Commercial Airplanes, Inc. He also was a member of the Boeing Executive Council. Prior to that time, he served as President of Boeing’s space and defense business. Mr. Mulally served as co-chair of the Washington Competitiveness Council and sat on the advisory boards of NASA, the University of Washington, the University of Kansas, the Massachusetts Institute Technology, and the U.S. Air Force Scientific Advisory Board. He is a member of the U.S. National Academy of Engineering and a fellow of England’s Royal Academy of Engineering. Mr. Mulally holds a Bachelor of Science and Master of Science degrees in aeronautical and astronautical engineering from the University of Kansas, and a Master’s degree in Management from the Massachusetts Institute of Technology as a 1982 Alfred P. Sloan fellow.Source: Reuters Age: 68Source: Reuters Education:Massachusetts Institute of Technology, M (Management) University of Kansas, MS (Aeronautical Engineering) University of Kansas, BS (Aeronautical Engineering) Source:
Paul S. Otellini Independent Director Director/Board Member Reuters
Biography:
Avention One-Stop Reports for Google Inc
Page 30
Mr. Paul S. Otellini is Independent Director of Google Inc. Paul served as the Chief Executive Officer and President of Intel Corporation, a semiconductor manufacturing company, from May 2005 to May 2013. Paul was previously member of the board of directors of Intel from 2002 to 2013. He also served as Intel’s Chief Operating Officer from 2002 to May 2005. From 1974 to 2002, Paul held various positions at Intel, including Executive Vice President and General Manager, Intel Architecture Group, and Executive Vice President and General Manager, Sales and Marketing Group. Paul holds a Master of Business Administration degree from the University of California, Berkeley, and a Bachelor of Arts degree in economics from the University of San Francisco.Source: Reuters Age: 63Source: Reuters Education:University of California, Berkeley, MBA University of San Francisco, BA (Economics) Source: Reuters
Social:
Lawrence Page Chief Executive Officer and Director Director/Board Member OSX
Biography: Mr. Lawrence E. Page is Chief Executive Officer, Co-Founder, Director of Google Inc. From July 2001 to April 2011, Larry served as our President, Products. In addition, from September 1998 to July 2001, Larry served as our Chief Executive Officer, and from September 1998 to July 2002, as our Chief Financial Officer. Larry holds a Master of Science degree in computer science from Stanford University and a Bachelor of Science degree in engineering, with a concentration in computer engineering, from the University of Michigan.Source: Reuters Age: 41Source: Reuters Education:Stanford University, MS (Computer Science) University of Michigan, BS (Engineering) Source: Reuters Compensation/Salary:$1Compensation Currency: USDSource: Reuters
Social:
Kavitark Ram Shriram Independent Director Director/Board Member Reuters
Biography: Mr. Kavitark Ram Shriram is Independent Director of Google Inc. Ram has been a managing partner of Sherpalo Ventures, LLC, an angel venture investment company, since January 2000. From August 1998 to September 1999, Ram served as Vice President of Business Development at Amazon.com, Inc., an internet retail company. Prior to that, Ram served as President at Junglee Corporation, a provider of database technology, which was acquired by Amazon.com in 1998. Ram was an early member of the executive team at Netscape Communications Corporation. Ram is also on the board of trustees of Stanford University. Ram holds a Bachelor of Science degree in mathematics from the University of Madras, India.Source: Reuters Age: 57Source: Reuters Education:University of Madras, BS (Mathematics) Source: Reuters
Shirley M. Tilghman Independent Director Director/Board Member Reuters
Avention One-Stop Reports for Google Inc
Page 31
Biography: Dr. Shirley M. Tilghman Ph.D., is Independent Director of Google Inc. Shirley served as the President of Princeton University from June 2001 to July 2013. Shirley also serves as a trustee of the Advantage Testing Foundation, Amherst College, the Carnegie Endowment for International Peace, the King Abdullah University of Science and Technology, and the Leadership for a Diverse America. From August 1986 to June 2001, she served as a Professor at Princeton University, and from August 1988 to June 2001, as an Investigator at Howard Hughes Medical Institute. In 1998, she took the role as founding director of Princeton’s multi-disciplinary Lewis-Sigler Institute for Integrative Genomics. Shirley holds a Doctoral degree in biochemistry from Temple University, and a Bachelor of Science degree with honors in chemistry from Queen’s University.Source: Reuters Age: 67Source: Reuters Education:Temple University, PHD (Biochemistry) Queens University, BS (Chemistry) Source: Reuters
Executives
Name Title Function Source
Lawrence Page Chief Executive Officer and Director Chief Executive Officer OSX
Biography: Mr. Lawrence E. Page is Chief Executive Officer, Co-Founder, Director of Google Inc. From July 2001 to April 2011, Larry served as our President, Products. In addition, from September 1998 to July 2001, Larry served as our Chief Executive Officer, and from September 1998 to July 2002, as our Chief Financial Officer. Larry holds a Master of Science degree in computer science from Stanford University and a Bachelor of Science degree in engineering, with a concentration in computer engineering, from the University of Michigan.Source: Reuters Age: 41Source: Reuters Education:Stanford University, MS (Computer Science) University of Michigan, BS (Engineering) Source: Reuters Compensation/Salary:$1Compensation Currency: USDSource: Reuters
Social:
Margo Georgiadis President, Americas Division Head Executive OSX
Salar Kamangar Senior Vice President, YouTube and Video Division Head Executive OSX
Biography: Salar Kamangar oversees Google's advertising and monetization products, including the AdWords program. He joined Google in 1999. During his first year, he created the company's first business plan and was responsible for its legal and finance functions. From there, Kamangar became a founding member of Google's product team, where he worked on consumer projects including the acquisition of DejaNews and the subsequent launch of Google Groups. In 2001, Kamangar led a small engineering team to define and launch the AdWords product in order to monetize the company's growing search traffic. Later, AdWords served as the foundation for Google's syndication on partner sites, including AOL, and today serves as the engine that drives Google's advertising revenue. Kamangar earned his B.S. in Biological Sciences with Honors from Stanford University.Source: infoUSA Education:Stanford University, bachelor's (Biological Sciences) Stanford University, bachelor's (Biological Sciences With Honors) Stanford University, BS (Biological Sciences)
Avention One-Stop Reports for Google Inc
Page 32
Source: Avention
Social:
Yuliya Solovyova Chief Executive Officer, Google Russia Division Head Executive OSX
Philipp Justus Managing Director Sales and Operations Managing Director OSX
Richard Cartwright Vice President Senior Management (General) NetProspex*
David C. Drummond Senior Vice President - Corporate Development, Chief Legal Officer, Secretary Senior Management (General) Reuters
Biography: Mr. David C. Drummond is Senior Vice President - Corporate Development, Chief Legal Officer, Secretary of Google Inc. Previously, he served as our Vice President, Corporate Development and General Counsel since February 2002. Prior to joining us, from July 1999 to February 2002, David served as Chief Financial Officer of SmartForce, an educational software applications company. Prior to that, David was a partner at the law firm of Wilson Sonsini Goodrich & Rosati. David has been a member of the board of directors of KKR Management LLC, the general partner of KKR & Co. L.P., a private equity firm, since March 2014, and serves on its conflicts committee. David holds a Juris Doctor degree from Stanford University and a Bachelor of Arts degree in history from Santa Clara University.Source: Reuters Age: 51Source: Reuters Education:Stanford University, JD Santa Clara University, BA (History) Source: Reuters Compensation/Salary:$650,000Compensation Currency: USDSource: Reuters
Claire Hughes Johnson Vice President Senior Management (General) IUSA
Dennis Kish Vice President, Fiber Senior Management (General) OSX
Patrick Pichette Chief Financial Officer, Senior Vice President Senior Management (General) Reuters
Biography: Mr. Patrick Pichette is Chief Financial Officer, Senior Vice President of Google Inc. Prior to joining us, from January 2001 until July 2008, Patrick served as an executive officer of Bell Canada Enterprises Inc., a telecommunications company, including, most recently, as President, Operations for Bell Canada, and previously as Executive Vice President, Chief Financial Officer, and Executive Vice President of Planning and Performance Management. Prior to joining Bell Canada Enterprises, from 1996 to 2000, Patrick was a principal at McKinsey & Company, a management consulting firm. Prior to that, from 1994 to 1996, he served as Vice President and Chief Financial Officer of Call-Net Enterprises Inc., a Canadian telecommunications company. Patrick has been a member of the board of directors of Bombardier Inc., a manufacturer of planes and trains, since October 2013, and serves on its audit committee and human resources and compensation committee. Patrick was previously a director of Amyris, Inc., a synthetic biology company, from March 2010 to May 2013. Patrick holds a Master of Arts degree in philosophy, politics, and economics from Oxford University, where he attended as a Rhodes Scholar, and a Bachelor of Arts degree in Business Administration from Université du Québec à Montréal.Source: Reuters Age: 51Source: Reuters Education:University of Oxford, MA (Philosophy) Universit du Qubec Montral, BA (Business Administration) Source: Reuters Compensation/Salary:$650,000Compensation Currency: USDSource: Reuters
Avention One-Stop Reports for Google Inc
Page 33
Maya Watts Broker and Owner Owner/Proprietor NetProspex*
Faris Abbas Senior Manager, Vendor Operations EMEA + APAC, Global Book Search Operations Executive OSX
Laszlo Bock Senior Vice President, People Operations Operations Executive OSX
Biography: Laszlo Bock leads Google's human resources function globally, which includes all areas related to the attraction, development and retention of "Googlers." Bock joined Google from the General Electric Company, where most recently he was a vice president of human resources within GE Capital Solutions. Before GE, Bock was a Management Consultant at McKinsey and Company, serving clients in the technology, private equity and media industries on issues of organizational design, talent acquisition and development, and cultural transformation. Bock earned a Masters in Business Administration from the Yale University School of Management, and a Bachelor of Arts in International Relations from Pomona College.Source: infoUSA
Francoise Brougher Vice President of Global SMB Sales and Operations Operations Executive OSX
Biography: Since March 2005, Francoise Brougher has led Google's business operations group, which helps the company to innovate at scale by designing business processes and solving strategic business problems. During her tenure the group has taken on projects such as partnering with the engineering leadership on the operating model for the global engineering organization, leading Google's market development efforts in Sub-Saharan Africa, and leading the company's "green" business operations efforts such as the solar panel installation on the Google campus. Prior to joining Google, Brougher was vice president of Business Strategy at Charles Schwab. Brougher earned a Masters in Business Administration from Harvard University, and a Masters in Engineering from Institut Catholique d'Arts et Metiers in France.Source: infoUSA Education:Harvard University, Masters (Business Administration) Institut Catholique d'Arts et Metiers, master (Engineering) Institut Catholique d'Arts et Metiers, Masters (Engineering) Source: Avention
Amy Chang Operations Operations Executive IUSA
Kathee Claudio Advertising Operations Manager Partners Operations Executive NetProspex*
Jennifer Dulski International, Operations Operations Executive IUSA
Lindsay Giorgi Operations Specialist Operations Executive NetProspex*
Judi Lamotte People Operations Manager Operations Executive NetProspex*
Social:
Stephan Meyer-Ewald Director Human Resources Technology and Operations Operations Executive NetProspex*
Social:
Hema PrashadView Email Global Revenue Operations Operations Executive NetProspex*
Anuj Sharma Information Technology Operations Manager Operations Executive NetProspex*
Thomas Siegel Director, Online Sales and Operations Operations Executive NetProspex*
Barbara Smith Sales and Operations Planning Manager Operations Executive NetProspex*
Matthew Stepka Vice President, Business Operations (Strategy) Operations Executive OSX
Ray Sweeney Logistics Project Manager Operations Operations Executive NetProspex*
Brice Wu Manager, Online Sales and Operations Operations Executive NetProspex*
Social:
Avention One-Stop Reports for Google Inc
Page 34
Ron Medford Director - Safety, Driverless Vehicles Environment/Safety Executive OSX
Daniel FrenchView Email Administrative Board Member Administration Executive NetProspex*
Divon LanView Email
Product Business Manager Sub Saharan Africa Administration Executive NetProspex*
Archana MishraView Email Office Manager Administration Executive NetProspex*
Connie Wilson Executive Assistant Administration Executive OSX
Justin SchuhView Email Chrome Security Engineer Security NetProspex*
John Cheng Area Information Technology Manager Finance Executive NetProspex*
Marc Philippe Director - Finance Finance Executive NetProspex*
Social:
Chi Achebe Account Strategist Accounting Executive NetProspex*
Dema Hadi Account Strategist Accounting Executive NetProspex*
Erik Jonte Information Technology Risk Manager Internal Audit Accounting Executive NetProspex*
Hitesh Raval Internal Audit Manager Accounting Executive NetProspex*
Kyle Zink Account Coordinator Accounting Executive NetProspex*
Cecilia Colombetti Senior Program Manager Payroll Benefits & Compensation Executive NetProspex*
Michael Axelrod Human Resources Manager Human Resources Executive NetProspex*
Alice Cheung Engineering Recruiter Human Resources Executive OSX
Social:
Anna Chung Recruiting Specialist Human Resources Executive NetProspex*
Eve Galazin Recruiting Staffing Human Resources Executive NetProspex*
Kristen Hofstetter Recruiter Human Resources Executive NetProspex*
Liane Hornsey Vice President, People Operations, Global Sales and Business Development Human Resources Executive OSX
Jun Inada Human Resources Business Partner and Recruiting Manager Human Resources Executive OSX
Randy KnaflicView Email
Staffing Manager Europe, Middle East and Africa Human Resources Executive NetProspex*
Katy Little Human Resources, Recruiter Human Resources Executive NetProspex*
Jessica Nonnemacher Sales Recruiter Human Resources Executive NetProspex*
Terry O'Connor Human Resources, Technical Recruiter Youtube Human Resources Executive NetProspex*
Chelsea Pollen Recruiting Specialist Human Resources Executive NetProspex*
Crystal PredeekView Email Recruiter Human Resources Executive NetProspex*
Laurel Walsh Leadership Staffing Programs Manager Human Resources Executive NetProspex*
Bjorn BehrendtView Email Certified Trainer Training Executive NetProspex*
Trudi Mccanna Training, Development Manager Training Executive NetProspex*
Geeta Singh Asia Pacific Head - People Development Training Executive OSX
Marl GatchalianView Email Relationship Manager Customer Service Executive NetProspex*
Cheryl Mooney Customer Service Representative Customer Service Executive NetProspex*
Avention One-Stop Reports for Google Inc
Page 35
Jessica Abate Territory Account Manager Sales Executive NetProspex*
Katherine AllanView Email Account Executive Sales Executive NetProspex*
Kate Burlingham Sales Coordinator Sales Executive NetProspex*
Ernesto Camacho Technical Account Manager Sales Executive NetProspex*
Maureen Carroll Account Manager Sales Executive NetProspex*
Kyle CopelandView Email
Account Manager For Mobile Display Advertising At Google Admob Sales Executive NetProspex*
Roy Daiany Account Manager Sales Executive NetProspex*
Manik Dhar Google Enterprise Sales Director-Mid Market Sales Executive NetProspex*
Cody Hale Enterprise Account Executive Sales Executive NetProspex*
Jonika Hoomes Head of Automotive and Emerging Business, Channel Sales Partnerships NA Sales Executive OSX
Social:
Bob JacobsonView Email Associate Insurance Account Executive Sales Executive NetProspex*
Adam Jones Google Enterprise Account Manager Sales Executive NetProspex*
Mary Jurkowski Account Manager Sales Executive NetProspex*
Social:
Kristin Kahlich Enterprise Sales Sales Executive NetProspex*
Brooke Lafazan Account Manager Sales Executive NetProspex*
Social:
Howard Lamb Account Manager Sales Executive NetProspex*
Aston Lau Technical Account Manager Sales Executive NetProspex*
Jim Lecinski Vice President, U.S. Sales and Service Sales Executive OSX
Social:
Shelley Murveit Adwords Account Manager Sales Executive NetProspex*
Scott Myles Senior Technical Account Manager Sales Executive NetProspex*
Laura Palmer Enterprise Account Manager Sales Executive NetProspex*
Sharon PinedoView Email Account Manager Enterprise Sales Sales Executive NetProspex*
Daniel Powers Director - Cloud Platform Sales Sales Executive OSX
Meghan Russell Associate Account Manager Sales Executive NetProspex*
Sarah Hoople Shere Senior Account Executive Sales Executive OSX
Social:
Bonita Stewart Vice President, Us Sales Sales Executive NetProspex*
Marc Walambe Account Development Manager Sales Executive NetProspex*
Alice Yu Technical Account Manager Sales Executive NetProspex*
Celen Zepeda Retail Account Manager Sales Executive OSX
Social:
Max Zhang Account Executive Sales Executive NetProspex*
Avention One-Stop Reports for Google Inc
Page 36
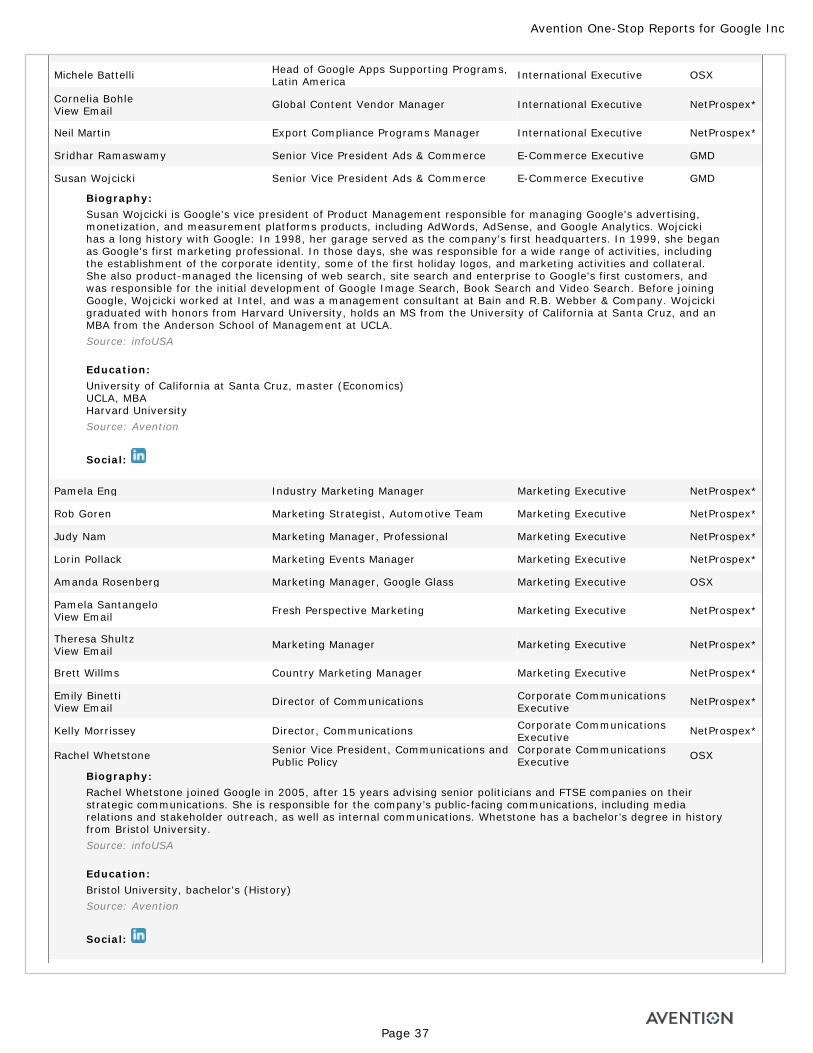
Michele Battelli Head of Google Apps Supporting Programs, Latin America International Executive OSX
Cornelia BohleView Email Global Content Vendor Manager International Executive NetProspex*
Neil Martin Export Compliance Programs Manager International Executive NetProspex*
Sridhar Ramaswamy Senior Vice President Ads & Commerce E-Commerce Executive GMD
Susan Wojcicki Senior Vice President Ads & Commerce E-Commerce Executive GMD
Biography: Susan Wojcicki is Google's vice president of Product Management responsible for managing Google's advertising, monetization, and measurement platforms products, including AdWords, AdSense, and Google Analytics. Wojcicki has a long history with Google: In 1998, her garage served as the company's first headquarters. In 1999, she began as Google's first marketing professional. In those days, she was responsible for a wide range of activities, including the establishment of the corporate identity, some of the first holiday logos, and marketing activities and collateral. She also product-managed the licensing of web search, site search and enterprise to Google's first customers, and was responsible for the initial development of Google Image Search, Book Search and Video Search. Before joining Google, Wojcicki worked at Intel, and was a management consultant at Bain and R.B. Webber & Company. Wojcicki graduated with honors from Harvard University, holds an MS from the University of California at Santa Cruz, and an MBA from the Anderson School of Management at UCLA.Source: infoUSA Education:University of California at Santa Cruz, master (Economics) UCLA, MBA Harvard University Source: Avention
Social:
Pamela Eng Industry Marketing Manager Marketing Executive NetProspex*
Rob Goren Marketing Strategist, Automotive Team Marketing Executive NetProspex*
Judy Nam Marketing Manager, Professional Marketing Executive NetProspex*
Lorin Pollack Marketing Events Manager Marketing Executive NetProspex*
Amanda Rosenberg Marketing Manager, Google Glass Marketing Executive OSX
Pamela SantangeloView Email Fresh Perspective Marketing Marketing Executive NetProspex*
Theresa ShultzView Email Marketing Manager Marketing Executive NetProspex*
Brett Willms Country Marketing Manager Marketing Executive NetProspex*
Emily BinettiView Email Director of Communications Corporate Communications
Executive NetProspex*
Kelly Morrissey Director, Communications Corporate Communications Executive NetProspex*
Rachel Whetstone Senior Vice President, Communications and Public Policy
Corporate Communications Executive OSX
Biography: Rachel Whetstone joined Google in 2005, after 15 years advising senior politicians and FTSE companies on their strategic communications. She is responsible for the company’s public-facing communications, including media relations and stakeholder outreach, as well as internal communications. Whetstone has a bachelor’s degree in history from Bristol University.Source: infoUSA Education:Bristol University, bachelor's (History) Source: Avention
Social:
Avention One-Stop Reports for Google Inc
Page 37
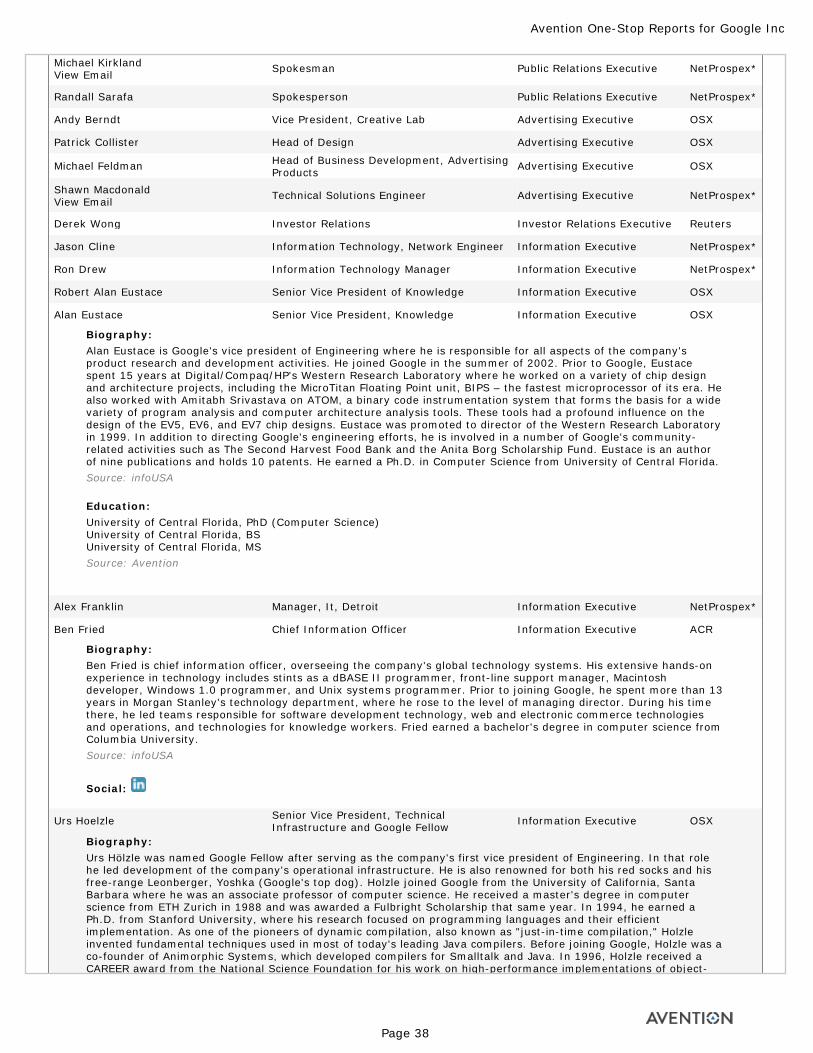
Michael KirklandView Email Spokesman Public Relations Executive NetProspex*
Randall Sarafa Spokesperson Public Relations Executive NetProspex*
Andy Berndt Vice President, Creative Lab Advertising Executive OSX
Patrick Collister Head of Design Advertising Executive OSX
Michael Feldman Head of Business Development, Advertising Products Advertising Executive OSX
Shawn MacdonaldView Email Technical Solutions Engineer Advertising Executive NetProspex*
Derek Wong Investor Relations Investor Relations Executive Reuters
Jason Cline Information Technology, Network Engineer Information Executive NetProspex*
Ron Drew Information Technology Manager Information Executive NetProspex*
Robert Alan Eustace Senior Vice President of Knowledge Information Executive OSX
Alan Eustace Senior Vice President, Knowledge Information Executive OSX
Biography: Alan Eustace is Google's vice president of Engineering where he is responsible for all aspects of the company's product research and development activities. He joined Google in the summer of 2002. Prior to Google, Eustace spent 15 years at Digital/Compaq/HP's Western Research Laboratory where he worked on a variety of chip design and architecture projects, including the MicroTitan Floating Point unit, BIPS – the fastest microprocessor of its era. He also worked with Amitabh Srivastava on ATOM, a binary code instrumentation system that forms the basis for a wide variety of program analysis and computer architecture analysis tools. These tools had a profound influence on the design of the EV5, EV6, and EV7 chip designs. Eustace was promoted to director of the Western Research Laboratory in 1999. In addition to directing Google's engineering efforts, he is involved in a number of Google's community-related activities such as The Second Harvest Food Bank and the Anita Borg Scholarship Fund. Eustace is an author of nine publications and holds 10 patents. He earned a Ph.D. in Computer Science from University of Central Florida.Source: infoUSA Education:University of Central Florida, PhD (Computer Science) University of Central Florida, BS University of Central Florida, MS Source: Avention
Alex Franklin Manager, It, Detroit Information Executive NetProspex*
Ben Fried Chief Information Officer Information Executive ACR
Biography: Ben Fried is chief information officer, overseeing the company's global technology systems. His extensive hands-on experience in technology includes stints as a dBASE II programmer, front-line support manager, Macintosh developer, Windows 1.0 programmer, and Unix systems programmer. Prior to joining Google, he spent more than 13 years in Morgan Stanley's technology department, where he rose to the level of managing director. During his time there, he led teams responsible for software development technology, web and electronic commerce technologies and operations, and technologies for knowledge workers. Fried earned a bachelor's degree in computer science from Columbia University.Source: infoUSA
Social:
Urs Hoelzle Senior Vice President, Technical Infrastructure and Google Fellow Information Executive OSX
Biography: Urs Hölzle was named Google Fellow after serving as the company's first vice president of Engineering. In that role he led development of the company's operational infrastructure. He is also renowned for both his red socks and his free-range Leonberger, Yoshka (Google's top dog). Holzle joined Google from the University of California, Santa Barbara where he was an associate professor of computer science. He received a master's degree in computer science from ETH Zurich in 1988 and was awarded a Fulbright Scholarship that same year. In 1994, he earned a Ph.D. from Stanford University, where his research focused on programming languages and their efficient implementation. As one of the pioneers of dynamic compilation, also known as "just-in-time compilation," Holzle invented fundamental techniques used in most of today's leading Java compilers. Before joining Google, Holzle was a co-founder of Animorphic Systems, which developed compilers for Smalltalk and Java. In 1996, Holzle received a CAREER award from the National Science Foundation for his work on high-performance implementations of object-
Avention One-Stop Reports for Google Inc
Page 38
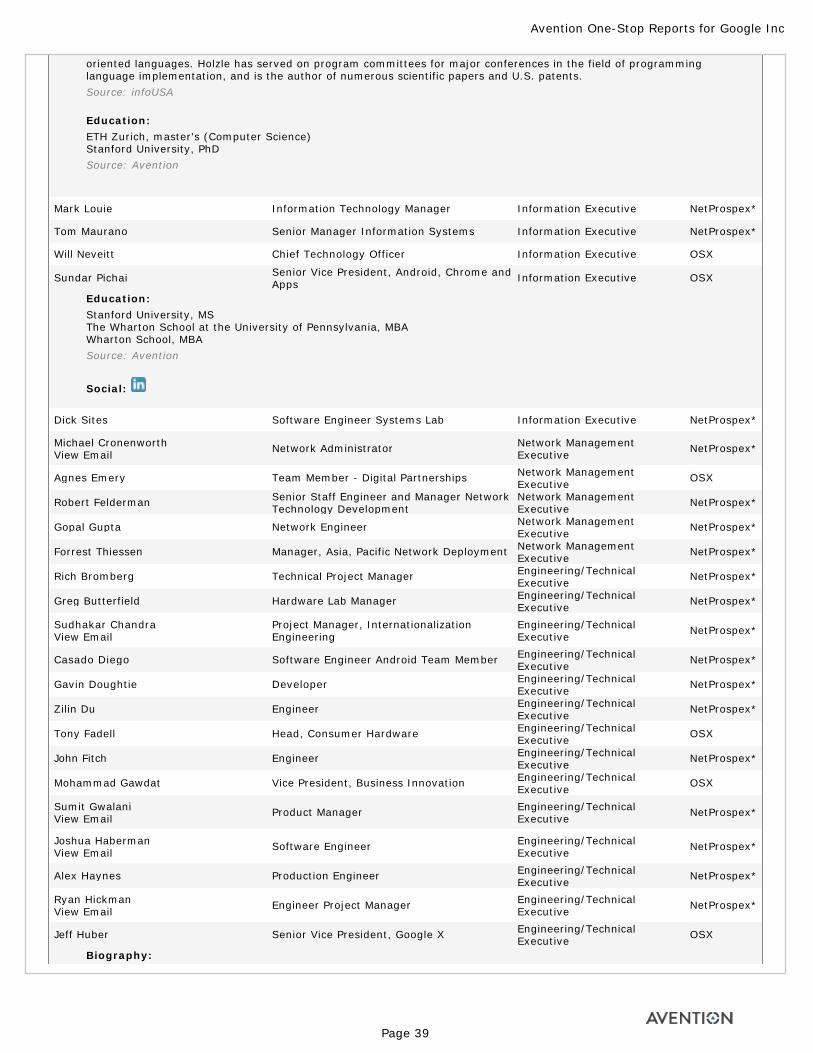
oriented languages. Holzle has served on program committees for major conferences in the field of programming language implementation, and is the author of numerous scientific papers and U.S. patents.Source: infoUSA Education:ETH Zurich, master's (Computer Science) Stanford University, PhD Source: Avention
Mark Louie Information Technology Manager Information Executive NetProspex*
Tom Maurano Senior Manager Information Systems Information Executive NetProspex*
Will Neveitt Chief Technology Officer Information Executive OSX
Sundar Pichai Senior Vice President, Android, Chrome and Apps Information Executive OSX
Education:Stanford University, MS The Wharton School at the University of Pennsylvania, MBA Wharton School, MBA Source: Avention
Social:
Dick Sites Software Engineer Systems Lab Information Executive NetProspex*
Michael CronenworthView Email Network Administrator Network Management
Executive NetProspex*
Agnes Emery Team Member - Digital Partnerships Network Management Executive OSX
Robert Felderman Senior Staff Engineer and Manager Network Technology Development
Network Management Executive NetProspex*
Gopal Gupta Network Engineer Network Management Executive NetProspex*
Forrest Thiessen Manager, Asia, Pacific Network Deployment Network Management Executive NetProspex*
Rich Bromberg Technical Project Manager Engineering/Technical Executive NetProspex*
Greg Butterfield Hardware Lab Manager Engineering/Technical Executive NetProspex*
Sudhakar ChandraView Email
Project Manager, Internationalization Engineering
Engineering/Technical Executive NetProspex*
Casado Diego Software Engineer Android Team Member Engineering/Technical Executive NetProspex*
Gavin Doughtie Developer Engineering/Technical Executive NetProspex*
Zilin Du Engineer Engineering/Technical Executive NetProspex*
Tony Fadell Head, Consumer Hardware Engineering/Technical Executive OSX
John Fitch Engineer Engineering/Technical Executive NetProspex*
Mohammad Gawdat Vice President, Business Innovation Engineering/Technical Executive OSX
Sumit GwalaniView Email Product Manager Engineering/Technical
Executive NetProspex*
Joshua HabermanView Email Software Engineer Engineering/Technical
Executive NetProspex*
Alex Haynes Production Engineer Engineering/Technical Executive NetProspex*
Ryan HickmanView Email Engineer Project Manager Engineering/Technical
Executive NetProspex*
Jeff Huber Senior Vice President, Google X Engineering/Technical Executive OSX
Biography:
Avention One-Stop Reports for Google Inc
Page 39
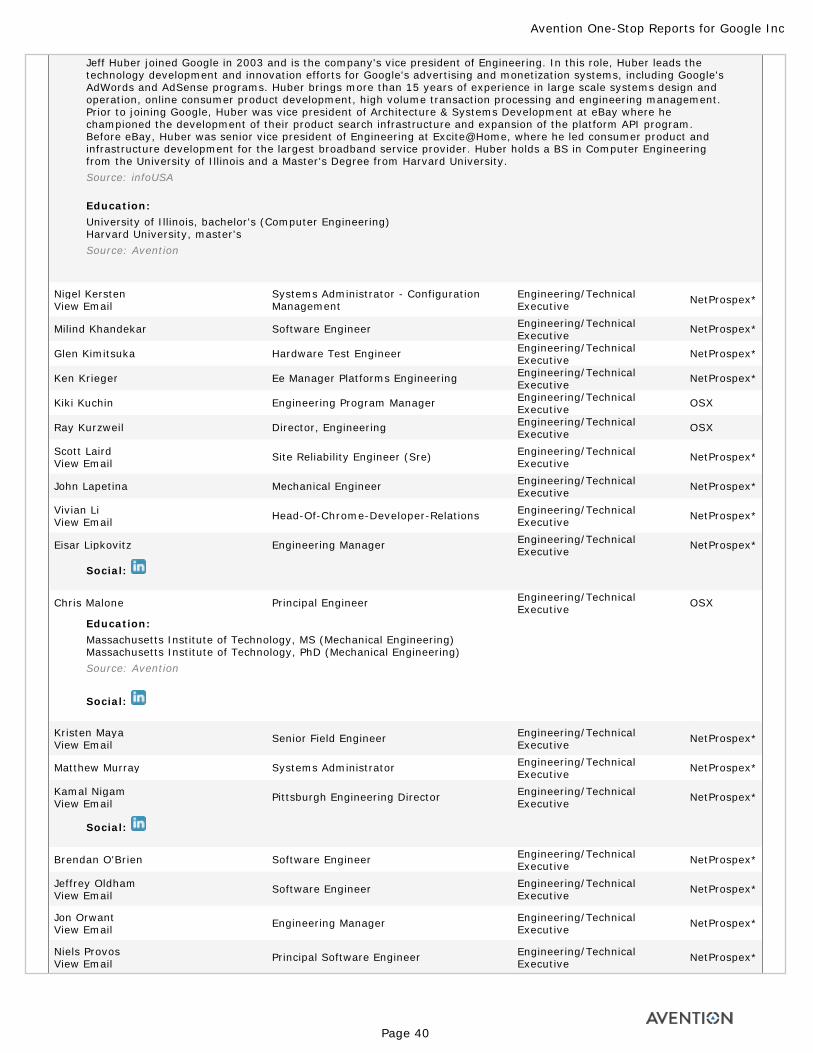
Jeff Huber joined Google in 2003 and is the company's vice president of Engineering. In this role, Huber leads the technology development and innovation efforts for Google's advertising and monetization systems, including Google's AdWords and AdSense programs. Huber brings more than 15 years of experience in large scale systems design and operation, online consumer product development, high volume transaction processing and engineering management. Prior to joining Google, Huber was vice president of Architecture & Systems Development at eBay where he championed the development of their product search infrastructure and expansion of the platform API program. Before eBay, Huber was senior vice president of Engineering at Excite@Home, where he led consumer product and infrastructure development for the largest broadband service provider. Huber holds a BS in Computer Engineering from the University of Illinois and a Master's Degree from Harvard University.Source: infoUSA Education:University of Illinois, bachelor's (Computer Engineering) Harvard University, master's Source: Avention
Nigel KerstenView Email
Systems Administrator - Configuration Management
Engineering/Technical Executive NetProspex*
Milind Khandekar Software Engineer Engineering/Technical Executive NetProspex*
Glen Kimitsuka Hardware Test Engineer Engineering/Technical Executive NetProspex*
Ken Krieger Ee Manager Platforms Engineering Engineering/Technical Executive NetProspex*
Kiki Kuchin Engineering Program Manager Engineering/Technical Executive OSX
Ray Kurzweil Director, Engineering Engineering/Technical Executive OSX
Scott LairdView Email Site Reliability Engineer (Sre) Engineering/Technical
Executive NetProspex*
John Lapetina Mechanical Engineer Engineering/Technical Executive NetProspex*
Vivian LiView Email Head-Of-Chrome-Developer-Relations Engineering/Technical
Executive NetProspex*
Eisar Lipkovitz Engineering Manager Engineering/Technical Executive NetProspex*
Social:
Chris Malone Principal Engineer Engineering/Technical Executive OSX
Education:Massachusetts Institute of Technology, MS (Mechanical Engineering) Massachusetts Institute of Technology, PhD (Mechanical Engineering) Source: Avention
Social:
Kristen MayaView Email Senior Field Engineer Engineering/Technical
Executive NetProspex*
Matthew Murray Systems Administrator Engineering/Technical Executive NetProspex*
Kamal NigamView Email Pittsburgh Engineering Director Engineering/Technical
Executive NetProspex*
Social:
Brendan O'Brien Software Engineer Engineering/Technical Executive NetProspex*
Jeffrey OldhamView Email Software Engineer Engineering/Technical
Executive NetProspex*
Jon OrwantView Email Engineering Manager Engineering/Technical
Executive NetProspex*
Niels ProvosView Email Principal Software Engineer Engineering/Technical
Executive NetProspex*
Avention One-Stop Reports for Google Inc
Page 40
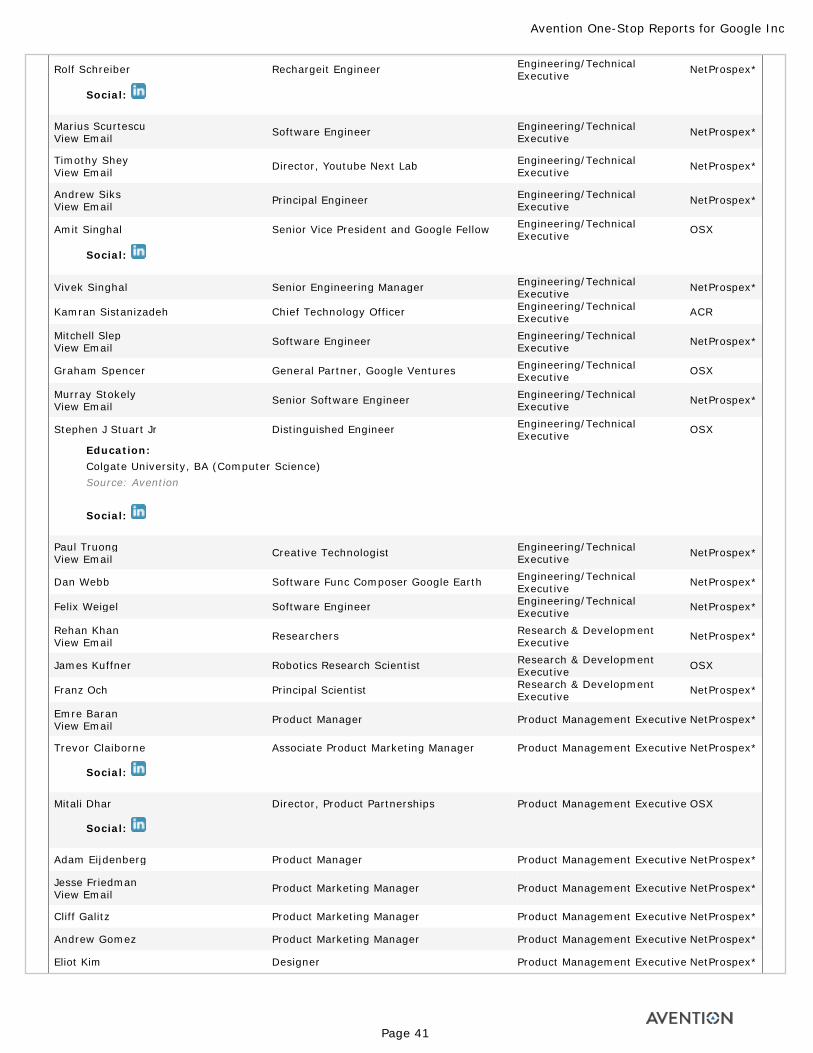
Rolf Schreiber Rechargeit Engineer Engineering/Technical Executive NetProspex*
Social:
Marius ScurtescuView Email Software Engineer Engineering/Technical
Executive NetProspex*
Timothy SheyView Email Director, Youtube Next Lab Engineering/Technical
Executive NetProspex*
Andrew SiksView Email Principal Engineer Engineering/Technical
Executive NetProspex*
Amit Singhal Senior Vice President and Google Fellow Engineering/Technical Executive OSX
Social:
Vivek Singhal Senior Engineering Manager Engineering/Technical Executive NetProspex*
Kamran Sistanizadeh Chief Technology Officer Engineering/Technical Executive ACR
Mitchell SlepView Email Software Engineer Engineering/Technical
Executive NetProspex*
Graham Spencer General Partner, Google Ventures Engineering/Technical Executive OSX
Murray StokelyView Email Senior Software Engineer Engineering/Technical
Executive NetProspex*
Stephen J Stuart Jr Distinguished Engineer Engineering/Technical Executive OSX
Education:Colgate University, BA (Computer Science) Source: Avention
Social:
Paul TruongView Email Creative Technologist Engineering/Technical
Executive NetProspex*
Dan Webb Software Func Composer Google Earth Engineering/Technical Executive NetProspex*
Felix Weigel Software Engineer Engineering/Technical Executive NetProspex*
Rehan KhanView Email Researchers Research & Development
Executive NetProspex*
James Kuffner Robotics Research Scientist Research & Development Executive OSX
Franz Och Principal Scientist Research & Development Executive NetProspex*
Emre BaranView Email Product Manager Product Management Executive NetProspex*
Trevor Claiborne Associate Product Marketing Manager Product Management Executive NetProspex*
Social:
Mitali Dhar Director, Product Partnerships Product Management Executive OSX
Social:
Adam Eijdenberg Product Manager Product Management Executive NetProspex*
Jesse FriedmanView Email Product Marketing Manager Product Management Executive NetProspex*
Cliff Galitz Product Marketing Manager Product Management Executive NetProspex*
Andrew Gomez Product Marketing Manager Product Management Executive NetProspex*
Eliot Kim Designer Product Management Executive NetProspex*
Avention One-Stop Reports for Google Inc
Page 41
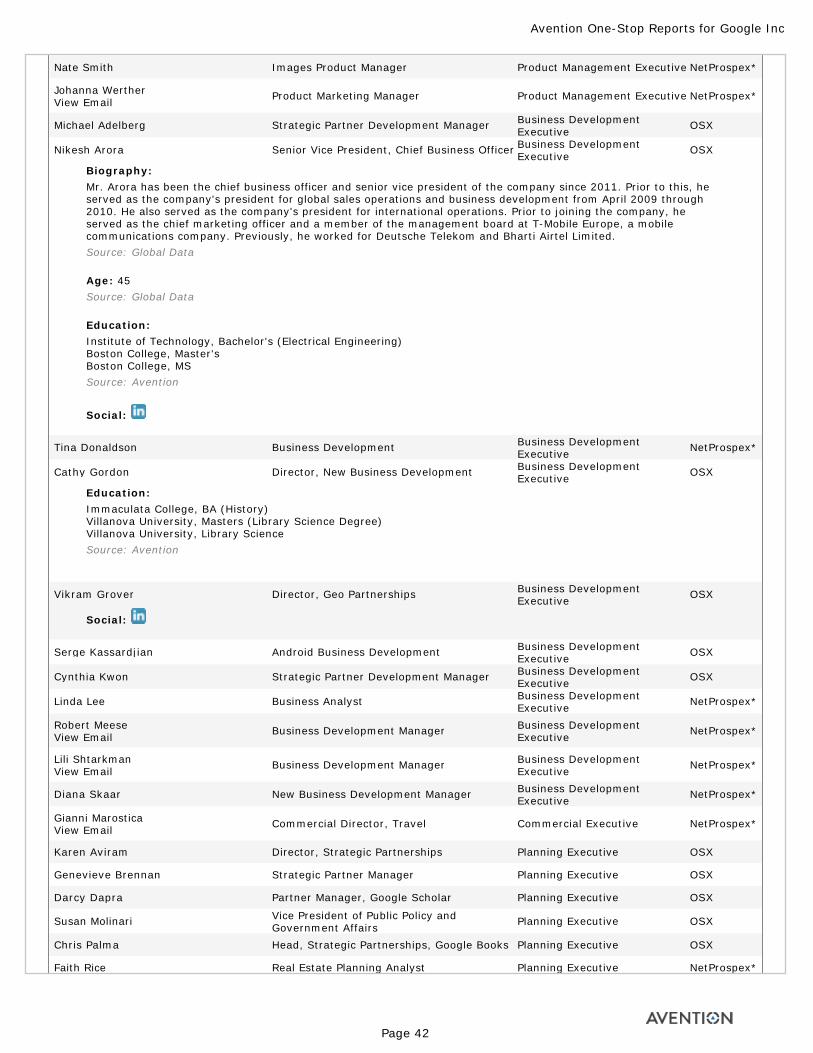
Nate Smith Images Product Manager Product Management Executive NetProspex*
Johanna WertherView Email Product Marketing Manager Product Management Executive NetProspex*
Michael Adelberg Strategic Partner Development Manager Business Development Executive OSX
Nikesh Arora Senior Vice President, Chief Business Officer Business Development Executive OSX
Biography: Mr. Arora has been the chief business officer and senior vice president of the company since 2011. Prior to this, he served as the company's president for global sales operations and business development from April 2009 through 2010. He also served as the company's president for international operations. Prior to joining the company, he served as the chief marketing officer and a member of the management board at T-Mobile Europe, a mobile communications company. Previously, he worked for Deutsche Telekom and Bharti Airtel Limited.Source: Global Data Age: 45Source: Global Data Education:Institute of Technology, Bachelor's (Electrical Engineering) Boston College, Master's Boston College, MS Source: Avention
Social:
Tina Donaldson Business Development Business Development Executive NetProspex*
Cathy Gordon Director, New Business Development Business Development Executive OSX
Education:Immaculata College, BA (History) Villanova University, Masters (Library Science Degree) Villanova University, Library Science Source: Avention
Vikram Grover Director, Geo Partnerships Business Development Executive OSX
Social:
Serge Kassardjian Android Business Development Business Development Executive OSX
Cynthia Kwon Strategic Partner Development Manager Business Development Executive OSX
Linda Lee Business Analyst Business Development Executive NetProspex*
Robert MeeseView Email Business Development Manager Business Development
Executive NetProspex*
Lili ShtarkmanView Email Business Development Manager Business Development
Executive NetProspex*
Diana Skaar New Business Development Manager Business Development Executive NetProspex*
Gianni MarosticaView Email Commercial Director, Travel Commercial Executive NetProspex*
Karen Aviram Director, Strategic Partnerships Planning Executive OSX
Genevieve Brennan Strategic Partner Manager Planning Executive OSX
Darcy Dapra Partner Manager, Google Scholar Planning Executive OSX
Susan Molinari Vice President of Public Policy and Government Affairs Planning Executive OSX
Chris Palma Head, Strategic Partnerships, Google Books Planning Executive OSX
Faith Rice Real Estate Planning Analyst Planning Executive NetProspex*
Avention One-Stop Reports for Google Inc
Page 42
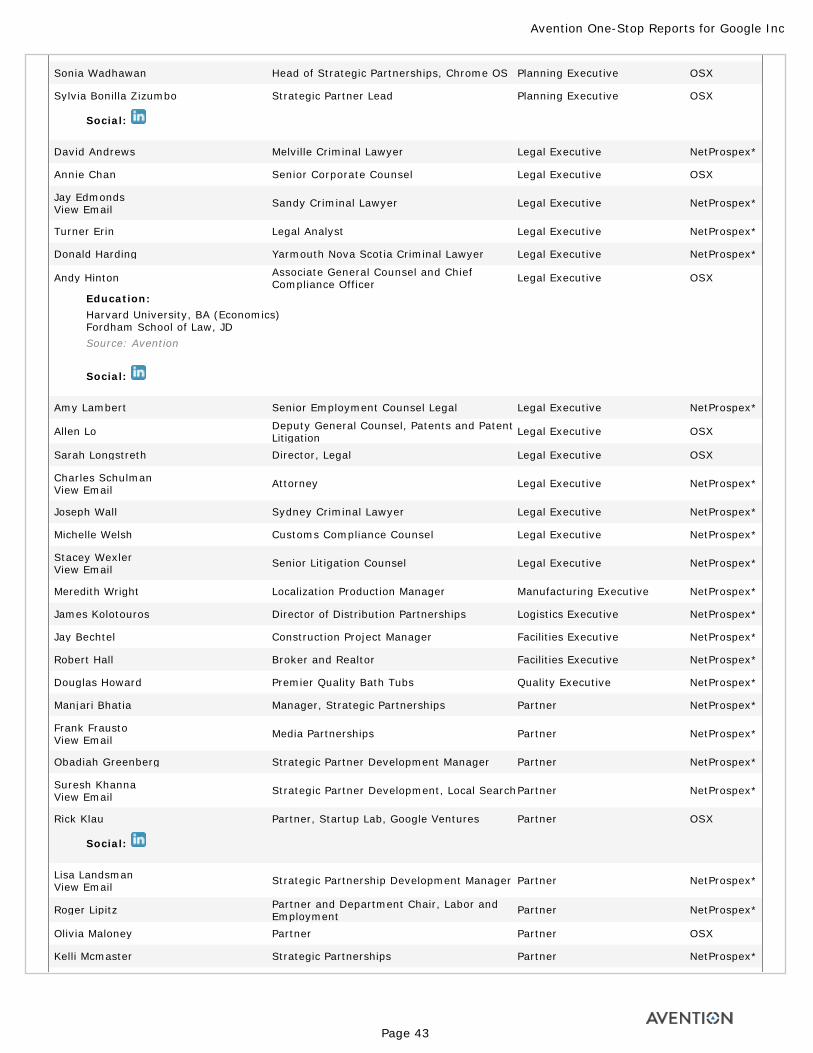
Sonia Wadhawan Head of Strategic Partnerships, Chrome OS Planning Executive OSX
Sylvia Bonilla Zizumbo Strategic Partner Lead Planning Executive OSX
Social:
David Andrews Melville Criminal Lawyer Legal Executive NetProspex*
Annie Chan Senior Corporate Counsel Legal Executive OSX
Jay EdmondsView Email Sandy Criminal Lawyer Legal Executive NetProspex*
Turner Erin Legal Analyst Legal Executive NetProspex*
Donald Harding Yarmouth Nova Scotia Criminal Lawyer Legal Executive NetProspex*
Andy Hinton Associate General Counsel and Chief Compliance Officer Legal Executive OSX
Education:Harvard University, BA (Economics) Fordham School of Law, JD Source: Avention
Social:
Amy Lambert Senior Employment Counsel Legal Legal Executive NetProspex*
Allen Lo Deputy General Counsel, Patents and Patent Litigation Legal Executive OSX
Sarah Longstreth Director, Legal Legal Executive OSX
Charles SchulmanView Email Attorney Legal Executive NetProspex*
Joseph Wall Sydney Criminal Lawyer Legal Executive NetProspex*
Michelle Welsh Customs Compliance Counsel Legal Executive NetProspex*
Stacey WexlerView Email Senior Litigation Counsel Legal Executive NetProspex*
Meredith Wright Localization Production Manager Manufacturing Executive NetProspex*
James Kolotouros Director of Distribution Partnerships Logistics Executive NetProspex*
Jay Bechtel Construction Project Manager Facilities Executive NetProspex*
Robert Hall Broker and Realtor Facilities Executive NetProspex*
Douglas Howard Premier Quality Bath Tubs Quality Executive NetProspex*
Manjari Bhatia Manager, Strategic Partnerships Partner NetProspex*
Frank FraustoView Email Media Partnerships Partner NetProspex*
Obadiah Greenberg Strategic Partner Development Manager Partner NetProspex*
Suresh KhannaView Email Strategic Partner Development, Local SearchPartner NetProspex*
Rick Klau Partner, Startup Lab, Google Ventures Partner OSX
Social:
Lisa LandsmanView Email Strategic Partnership Development Manager Partner NetProspex*
Roger Lipitz Partner and Department Chair, Labor and Employment Partner NetProspex*
Olivia Maloney Partner Partner OSX
Kelli Mcmaster Strategic Partnerships Partner NetProspex*
Avention One-Stop Reports for Google Inc
Page 43
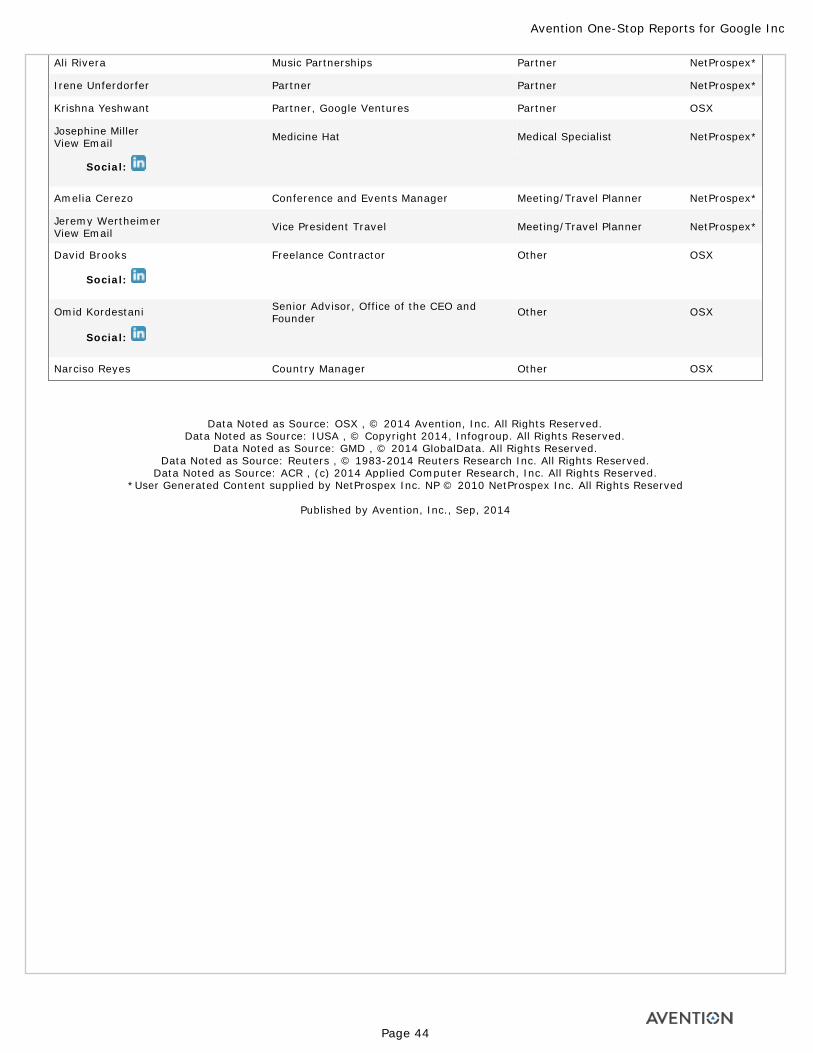
Ali Rivera Music Partnerships Partner NetProspex*
Irene Unferdorfer Partner Partner NetProspex*
Krishna Yeshwant Partner, Google Ventures Partner OSX
Josephine MillerView Email Medicine Hat Medical Specialist NetProspex*
Social:
Amelia Cerezo Conference and Events Manager Meeting/Travel Planner NetProspex*
Jeremy WertheimerView Email Vice President Travel Meeting/Travel Planner NetProspex*
David Brooks Freelance Contractor Other OSX
Social:
Omid Kordestani Senior Advisor, Office of the CEO and Founder Other OSX
Social:
Narciso Reyes Country Manager Other OSX
Data Noted as Source: OSX , © 2014 Avention, Inc. All Rights Reserved. Data Noted as Source: IUSA , © Copyright 2014, Infogroup. All Rights Reserved.
Data Noted as Source: GMD , © 2014 GlobalData. All Rights Reserved. Data Noted as Source: Reuters , © 1983-2014 Reuters Research Inc. All Rights Reserved.
Data Noted as Source: ACR , (c) 2014 Applied Computer Research, Inc. All Rights Reserved. *User Generated Content supplied by NetProspex Inc. NP © 2010 NetProspex Inc. All Rights Reserved
Published by Avention, Inc., Sep, 2014
Avention One-Stop Reports for Google Inc
Page 44

Avention One-Stop Reports for Google Inc
Page 45
Google Inc
Significant Developments
Google Inc executes investment in SunEdison Inc's solar plant Sep 10, 2014 SunEdison Inc:Says Google Inc has agreed to provide $145 million in equity financing for the Regulus solar plant.Located in Kern County, Calif., the Regulus plant will begin operation later this year, and will supply power to Southern California Edison through a 20-year power purchase agreement.
Google Inc's Nest Labs to buy Dropcam for $555 mln-Business Standard Jun 21, 2014 Google Inc:Google's Nest Labs has said it was buying video monitoring startup Dropcam for a reported $555 mln in cash-Business Standard.
Tela Resolves patent dispute with Google Inc Jun 12, 2014 Google Inc:Says Tela Innovations, Inc. has resolved its pending patent infringement litigation with Google by a mutual license agreement between the two companies.Tela also reached a separate agreement to settle its pending litigation with Pantech of Korea.Terms of the agreements will remain confidential.
Google and Skybox Imaging sign acquisition agreement Jun 10, 2014 Google Inc:Enters into an agreement to buy Skybox Imaging for $500 mln in cash, subject to adjustments.
Hagens Berman announces class action lawsuit against Google Inc May 20, 2014 Google Inc:Hagens Berman, a consumer rights law firm, filed a national class-action lawsuit against Google Inc.Claiming the company unlawfully denies payments to thousands of website owners and operators who place ads on their sites sold through Google AdWords.The lawsuit, filed in the U.S. District Court for the Northern District of California, alleges that Google abruptly cancels website owners' AdSense accounts often without explanation shortly before payments are due, and refuses to pay for the ads that ran prior to the cancelation.
Hagens Berman announces antitrust class action lawsuit against Google Inc May 01, 2014 Hagens Berman:Announces filing of a nationwide antitrust class-action lawsuit against Google Inc claiming the search engine giant illegally monopolized, and financially and creatively stagnated the American market of internet and mobile search.The lawsuit, filed in the U.S. District Court for the Northern District of California.Alleges that Google's monopoly of these markets stems from the company's purchasing of Android mobile operating system (Android OS) to maintain and expand its monopoly by pre-loading its own suite of applications onto the devices by way of secret Mobile Application Distribution Agreements (MADA).According to the suit, these agreements were hidden and marked to be viewed only by attorneys.
Hon Hai Precision Ind. Co Ltd sells patent to Google Inc. Apr 28, 2014 Hon Hai Precision Ind. Co Ltd:Sold patent to Google Inc. through MiiCs & Partners.The patent is about communications technology, including design, manufacture and test of communication system.
Apple, Google , Intel, and Adobe To Settle Anti-Poaching Suit
Avention One-Stop Reports for Google Inc
Page 46
Apr 24, 2014 Kelly M. Dermody:Says that a settlement has been reached with Apple Inc., Google Inc., Intel Corporation, and Adobe Systems Inc.In the class action lawsuit charging that these companies violated federal antitrust laws by conspiring for years to suppress the pay of technical, creative, and research and development employees, including by agreeing not to actively recruit each other's employees.Terms of the settlement are confidential until Plaintiffs file their settlement papers with the Court next month.
Google Inc and SunPower team up to finance $250 mln in residential solar lease projects Apr 23, 2014 Google Inc:New program that will provide financing to support about $250 mln of residential solar lease projects.Google committing up to $100 mln and SunPower committing about $150 mln investment.
Luxottica Group SpA enters strategic partnership with Google Inc to design, develop and distribute a new breed of eyewear for Glass Mar 24, 2014 Luxottica Group SpA:Announces strategic partnership with Google Inc to design, develop and distribute a new breed of eyewear for Glass.Says, through this relationship, Luxottica and Google, will establish a team of experts devoted to working on the design, development, tooling and engineering of Glass products.Luxottica also added that two brands of the Group, Ray-Ban and Oakley, will be a part of the collaboration with Glass, but details about these new products will be disclosed at a later stage.
Google Inc and Viacom Inc resolve copyright lawsuit Mar 18, 2014 Google Inc:Says the resolution of the Viacom vs YouTube copyright litigation.The terms of the settlement were not disclosed.
Yandex NV and Google announce advertising partnership for real-time bidding Feb 26, 2014 Yandex NV:Says that Yandex and Google have entered into a mutually beneficial strategic partnership agreement in respect of online display advertising sales.Says through this partnership, DoubleClick Bid Manager, Google's Demand-Side Platform will be connected to Yandex's Real Time Bidding system, while Yandex's Demand-Side Platform, AWAPS will join Google's RTB marketplace, DoubleClick AdExchange.Says the agreement only relates to display advertising, and does not cover text-based contextual advertising.Says technical integration is expected to take several months.
Google Inc approves distribution of shares Feb 10, 2014 Google Inc:Says its board has approved a distribution of shares of the Class C capital stock as a dividend to stockholders with a dividend record date of Mar. 27and a dividend payment date of Apr. 2.
Google Inc to own $750 mln Lenovo Group Ltd stake after Motorola deal closes-Reuters Feb 07, 2014 Google Inc:Will own a 5.94 percent stake in Lenovo Group Ltd worth $750 million once Lenovo's deal to buy Google's Motorola handset division closes, according to a disclosure on the Hong Kong stock exchange-Reuters.Google would take 618.3 million Lenovo shares at $1.213 per share.
Google Inc avoids fine with EU antitrust deal - Reuters Feb 05, 2014 Google Inc:Google Inc agreed to make concessions on how it displays competitors' links on its website on Wednesday, in a deal with the European Union regulator that ended a three-year antitrust probe and avoided a fine - Reuters.The agreement means the dominant search engine has avoided a process that could have lead to a fine of up to $5 bln, or 10 pct of its 2012 revenue.It must stick to the deal for the next five years.However, Google may still face a second EU investigation, this time into its Android operating system for smartphones, with potentially bigger risks for the company.Google has been the subject of a European Commission investigation into its internet search practices since Nov. 2010.
Avention One-Stop Reports for Google Inc
Page 47
Google Inc and Cisco Systems Inc enter into patent cross-licensing agreement Feb 04, 2014 Google Inc and Cisco Systems Inc:Says they have entered into a long-term patent cross-licensing agreement covering a broad range of products and technologies.Says the agreement allows each company to extract value from its patent portfolio through a license to the other's portfolio and by helping to reduce the risk of future litigation.
Vringo Inc announces U.S. district court order of post-judgment royalty rate of 6.5% against Google Inc and AOL Inc Jan 29, 2014 Vringo Inc:Says the U.S. District Court issued a Memorandum Opinion and Order related to its wholly-owned subsidiary I/P Engine, Inc.'s litigation against AOL, Google et al. for infringement of patents through their AdWords system.Says the Court held that the appropriate ongoing royalty rate is 6.5% of the 20.9% royalty base previously set by the District Court.On Nov. 6, 2012, the District Court in Norfolk, ruled in favor of I/P Engine and against the defendants AOL Inc., Google, Inc., IAC Search & Media, Inc., Target Corp., and Gannett Co., Inc. with respect to defendants' infringement of the asserted claims of U.S. Patent Nos. 6,314,420 and 6,775,664.
Lenovo Group Ltd to acquire Motorola Mobility from Google Inc Jan 29, 2014 Lenovo Group Ltd and Google Inc:Enters into a definitive agreement under which Lenovo plans to acquire the Motorola Mobility smartphone business.Says the purchase price is about $2.91 billion (subject to certain adjustments), including $1.41 billion paid at close, comprised of $660 million in cash and $750 million in Lenovo ordinary shares (subject to a share cap/floor).Says the remaining $1.5 billion will be paid in the form of a three-year promissory note.Says Google will maintain ownership of the vast majority of the Motorola Mobility patent portfolio, including current patent applications and invention disclosures.Says as part of its ongoing relationship with Google, Lenovo will receive a license to this rich portfolio of patents and other intellectual property.Says additionally Lenovo will receive over 2,000 patent assets, as well as the Motorola Mobility brand and trademark portfolio.
Google Inc to buy artificial intelligence company DeepMind - Reuters Jan 27, 2014 Google Inc:Agreed to acquire privately held artificial intelligence company, DeepMind Technologies Ltd - Reuters.Technology news website Re/code, which reported news of the deal earlier, said the price was $400 million, without disclosing where it got the information.
Google Inc and and Samsung Electronics Co Ltd announces global patent agreement - Reuters Jan 26, 2014 Google Inc:Google Inc and Samsung Electronics Co Ltd announced on Jan. 26, that they have reached a global patent cross-licensing agreement - Reuters.Says the deal covers patents currently owned by the companies, as well as any filed in the next 10 years, the companies said in a release.Says the financial terms were not disclosed.
Google Inc to acquire Nest Labs Inc Jan 13, 2014 Google Inc:Enters into an agreement to buy Nest Labs Inc.Says for transaction value of $3.2 bln in cash.Says transaction is subject to customary closing conditions, including the receipt of regulatory approvals in the US.Says it is expected to close in the next few months.
Honda Motor Co Ltd to cooperate with Google Inc-The Shikoku Shimbun Jan 08, 2014 Honda Motor Co Ltd and Google Inc:Honda Motor Co to cooperate with Google Inc through joining open automotive alliance of Google-The Shikoku Shimbun.Open automotive alliance aims at the progress of automatic driving technology through the telecommunications with communication infrastructure such as traffic lights.
Google Inc acquires developer of military robots-Reuters Dec 16, 2013 Google Inc:Big Dog, a four-legged robot that can climb muddy hills, and Cheetah, a robot which can outrun the fastest human, are among the robots that now belong to Google Inc.The company acquired Boston Dynamics, a privately held company known for building robots that look as if they belong in a science-fiction movie and which are often co-developed or funded by the U.S. military.The financial terms of the deal could not be learned.
Avention One-Stop Reports for Google Inc
Page 48
Google Inc To Pay $17 Million To Settle States' Safari Probe - Reuters Nov 18, 2013 Reuters reported that Google Inc will pay $17 million to settle allegations by 37 states and the District of Colombia that it secretly tracked Web users by placing special digital files on the Web browsers of their smartphones. The deal, announced November 18, 2013, ends a nearly two-year probe by the states into allegations that Google bypassed the privacy settings of customers using Apple Inc's Safari Web browser by placing cookies into the browser. Cookies are special files that allow websites and advertisers to identify individual Web surfers and track their browsing habits. The Safari Web browser used on iPhones and iPads automatically blocks third-party cookies, but Google altered the computer code of its cookies and was able to circumvent the blocks between June 2011 and February 2012, according to the states' allegations. Under the terms of deal, Google agreed not to use the type of code capable of overriding browser settings without user consent, unless for security, fraud or technical issues. It also agreed to provide consumers with more information about cookies for the next five years.
Google Inc Faces Anti Trust Probes In India And Four Other Jurisdictions - Business Standard Oct 30, 2013 Business Standard reported that Google Inc is facing probes by fair trade regulators in India, Europe and three other jurisdictions for alleged anti-competitive practices. Competition authorities in Argentina, Brazil and Taiwan have also opened investigations into certain aspects of Google's business, according to the Company. The Company said in a recent regulatory filing that the Comision Nacional de Defensa de la Competencia in Argentina, the Competition Commission of India, the Taiwan Fair Trade Commission and Brazil's Council for Economic Defense have also opened investigations into certain of the Company business practices.
EU Seeks Feedback On Google Inc Revised Antitrust Offer-Reuters Oct 28, 2013 Reuters reported that EU regulators have asked 125 Google Inc rivals and third parties to provide feedback on the company's second attempt to settle a three-year-long antitrust investigation and avert a possible $5 billion fine. The European Commission's hopes of closing the case next spring, however, suffered a setback after several rivals criticised Google's latest offer for not being materially different from a proposal made in April. Google's original proposal in April was rejected by its competitors, who said that the changes would only reinforce the company's dominance. That prompted the EU antitrust authority to demand fresh concessions from the U.S. company.
Google Inc Beats Q3 As Ad Volume Grows - Reuters Oct 17, 2013 Reuters reported that Google Inc's quarterly results beat Wall Street's expectations as the Company expanded its mobile and overseas businesses while keeping ad-rate declines in check, sending its shares to a record high. The average cost-per-click - the price that marketers pay Google when consumers click on their ads - decreased 8% during the third quarter, deepening the 6% price erosion that Google experienced in the second quarter. The Company also pointed to Google's 28% revenue growth outside of the U.S. and Britain as further signs of Google's strength.
Seat Pagine Gialle SpA's Seat PG Italia Renews Partnership with Google Inc Oct 14, 2013 Seat Pagine Gialle SpA announced that Seat PG Italia has renewed its partnership with Google Inc and will remain a Premium Partner of AdWords, the advertising programme that allows companies to promote themselves on the Google search engine and the Google Display network. A Premium Partner since 2009, Seat PG Italia has integrated Google AdWords into its PGclick portfolio of tools and offers personalized advertising solutions created specifically for each SME, identifying the right combination of parameters for each company. PGclick is a solution created by Seat PG Italia.
Brazil Investigates Google Inc Over Antitrust Charges-Reuters Oct 11, 2013 Reuters reported that Brazil is investigating Google Inc for anticompetitive practices alleged by Microsoft Corp and Brazilian rivals. Brazilian antitrust watchdog Cade said on October 11, 2013 it is looking into accusations that Google has unfairly used rivals' content, discouraged their advertisers and favored its own product listings in search results. Microsoft filed a complaint charging Google with obstructing advertising campaigns across multiple search engines, giving an unfair advantage to Google's profitable AdWords service, according to a Cade statement. Brazilian comparison shopping sites BuscapT and Bondfardo accused Google of reproducing product reviews from their users - a practice known as scraping - without allowing the competitors to do the same with its website Google Shopping. Cade is also looking into complaints from BuscapT and Bondfardo that Google gives unfair prominence to Google Shopping on its general Web search, making it the only price-comparison tool that appears with photos, prices and evaluations.
Avention One-Stop Reports for Google Inc
Page 49
Google Inc, Other Companies Discuss BlackBerry Ltd Bids-Reuters Oct 05, 2013 Reuters reported that BlackBerry Ltd on the block as its smartphone business struggles, is in talks with Cisco Systems Inc, Google Inc and SAP AG about selling them all or parts of itself. The Company, based in Waterloo, Ontario, has asked for preliminary expressions of interest from potential strategic buyers, which also include Intel Corp, LG Electronics Inc and Samsung Electronics Co Ltd, by early next week. It is unclear which parties will bid, if any. But the potential technology buyers have been especially interested in BlackBerry's secure server network and patent portfolio, although doubts about the assets' value remain an issue. Google, Intel, Cisco, LG and SAP declined to comment. Samsung was not immediately available for comment.
USITC Told To Review Ruling That Google Inc's Motorola Mobility Did Not Violate Microsoft Corp Patent - Reuters Oct 03, 2013 Reuters reported that an appeals court on October 03, 2013 partially reversed a ruling by the U.S. International Trade Commission, asking it to reconsider a decision that Google Inc subsidiary Motorola Mobility did not infringe on a Microsoft Corp MSFT.O patent. Acting on an appeal by Microsoft, the U.S. Court of Appeals for the Federal Circuit found that the ITC was correct in finding that Motorola Mobility, which has since been bought by Google, did not infringe three patents. But it found that the ITC erred in its reasoning in finding that a fourth patent was not infringed upon, and asked the ITC to reconsider that patent, which describes a graphical computer interface. In the original case, the ITC had found that Motorola Mobility did infringe one patent for meeting-scheduling technology.
Google Inc Offer May End Search Engine Case - Reuters Oct 01, 2013 Reuters reported that Google Inc to modify how it displays Internet search results could settle a long-running antitrust dispute with the European Union. The Company's search engine has been under investigation for three years by the European Commission, which acts as the bloc's antitrust regulator, over complaints it was blocking competitors in search results. Google proposed concessions in September, hoping to end a case which could otherwise lead to a fine of up to 10% of its global revenue, or $5 billion.
©1983-2014 Reuters Research Inc. All Rights Reserved. Published by Avention, Inc.,Sep, 2014
Avention One-Stop Reports for Google Inc
Page 50
Avention One-Stop Reports for Google Inc
Page 51
Table of Contents New Search Print Ready
Google EU Ruling Response Vetted as Complaints Pile Up
Bayou Buzz 18 September, 2014
Google Inc. (GOOG) faces continuedscrutiny over its response to a court ruling on the right to beforgotten after regulators from across the European Union saidthey’d received complaints from the public. The EU’s 28 privacy regulators continue “to analyze ... http://www.bayoubuzz.com
Related Topics:
Regulatory ActivityLegal
Provided by Moreover Technologies. Published by Avention, Inc., September 2014
The Wall Street Journal: News Corp says Google is a 'platform for piracy'
Atlanta Journal And Constitution 18 September, 2014
BRUSSELS-- Rupert Murdoch’s News Corp weighed into the debate over a proposed European Union settlement with Google Inc.--urging Brussels to throw out the settlement and calling Google a “platform for piracy.” In a letter to EU antitrust chief Joaquín Almunia ... http://www.ajc.com
Provided by Moreover Technologies. Published by Avention, Inc., September 2014
Pre-orders Start Tomorrow for Samsung Galaxy Note 4; Available October 17
Business Wire 18 September, 2014 Samsung delivers 4th generation Note series and continues to define the large screen smartphone category
DALLAS--(BUSINESS WIRE)-- Samsung Telecommunications America, LLC (Samsung) today announced that the Galaxy Note® 4 will be available in the U.S. beginning October 17, with pre-orders beginning tomorrow. Bringing new experiences and focusing on what matters to consumers and business users, the next-generation device is the most advanced large-screen smartphone yet.
Pre-orders Start Tomorrow for Samsung Galaxy Note 4; Available October 17 (Photo: Business Wire)
“Samsung created the large screen smartphone category with the Galaxy Note and are on our fourth generation, a category others are just entering,” said Gregory Lee, president and CEO of Samsung Telecommunications Americaand Samsung Electronics North America Headquarters. “The Galaxy Note 4 delivers a refined Note experience, and the latest technology that consumers want in their smartphone.”
The Galaxy Note 4 delivers unrivaled smartphone experiences including a brilliant display, advanced photo technology for front and rear camera, battery improvements, and S Pen™ enhancements. The Galaxy Note 4 enables users to get even more from their mobile device every day. The extraordinary 5.7-inch Quad HD (2560 x 1440) Super AMOLED® display creates stunning viewing experiences designed to enhance what users see.
The Galaxy Note 4 features advanced front and rear cameras for brighter, clearer images. The 16 megapixel rear-facing camera features an Optical Image Stabilizer, crisper images and advanced zoom technology. In addition, the device includes a 3.7 megapixel front-facing camera that captures shots easier than ever before and, with a wider angle, more people can be included in the picture. Both the front and rear-facing cameras have improved sensors for better, brighter photos in low light.
Related Companies:
MWW Group LLC [profile]Samsung Telecommunications America, LLC
[profile]
Samsung Electronics Co Ltd
[profile]
Related Topics:
Company LeadershipMarketingConferences, Seminars & ConventionsITNew TechnologyManagement Team
Avention One-Stop Reports for Google Inc
Page 52
With Adaptive Fast Charging1, the Galaxy Note 4 can go from no battery to 50 percent in about 30 minutes. The device is also equipped with Ultra Power Saving Mode, which offers standby time up to 24 hours on only 10 percent of battery life, allowing access to select applications, so that users have power when they need it most.
Samsung continues to refine the S Pen experience with easier interactions through shortcuts to make everyday tasks faster and easier. With the evolved S Pen, writing is more natural, allowing users to easily handwrite e-mails and texts, capture and edit meeting notes and post handwritten notes to their homescreen. The S Pen also offers the ease and precision of a computer mouse, making it simpler to select and move content, resize windows, and drag and drop between apps.
With the Galaxy Note 4’s 5.7-inch screen, the Multi Window feature has evolved for easier multi-tasking. Users can choose how to access applications with full, split or pop-up screens, and can easily change the size and positioning of apps on the screen with an intuitive swipe.
The Galaxy Note 4 features a new sleek design with a premium metal frame and Samsung’s signature removable back cover for easy access to the removable battery and microSD card slot. The Galaxy Note 4 will be available in Charcoal Black and Frost White. AT&T, Sprint, T-Mobile, Verizon and U.S. Cellular will carry the Galaxy Note 4. Samsung Experience Shops in Best Buy, as well as Amazon, Costco, RadioShack, Sam’s Club, Target, Walmart will also carry the Galaxy Note 4. Carriers and retailers will confirm specific pricing, availability, pre-orders and specs.
Pre-order the Samsung Galaxy Note 4 between September 19th and October 16th and get a guaranteed total trade-in of $2002 on any working smartphone. For more information, visit www.SamsungGalaxyPromotions.com/Note4.
The Galaxy Note 4 is the newest addition to the Samsung For Enterprise (SAFE™) portfolio, a growing family of highly desirable Samsung enterprise products and solutions equipped with productivity and feature enhancements that make them suitable for business use.
Business users can work on the go with confidence with Samsung Knox™3, the world-class government-grade security platform that provides protection from the hardware layer all the way to the application layer, securely separating enterprise and personal data on a single device.
Galaxy Note 4 accessories will include S-View® Flip Covers in a variety of colors, Wallet Flip Cover, Protective Cover, Replacement S Pen and multiple power solution options including Wireless Charging S-View Cover, Spare Battery Charging System, 9500mAh Battery Pack and Wireless Charging Vehicle Dock. The Gear VR, available this Fall, will also be compatible with the Galaxy Note 4.
Samsung Galaxy Note 4 Product Specifications:
Processor 2.7 GHz Quad-Core Processor
Display 5.7 inch (143.9mm) Quad HD Super AMOLED (2560 x 1440)
OS Android 4.4.4 (KitKat)
Camera
Rear Facing: 16 Mega pixel Auto Focus camera with Smart OIS
Front Facing: 3.7 Mega pixel camera with f1.9 Rear Facing Camera: HDR (Rich tone), Selective Focus, Rear-cam Selfie, Beauty face, Virtual Tour Shot, Shot & More, Dual Camera
Front Facing Camera: Selfie, Wide Selfie
Video
Codec: H.264, MPEG-4, H.263, VC-1, WMV7, WMV8, Sorenson Spark, MP43, VP8
Recording & Playback: up to UHD Codec: MP3, AAC/AAC+/eAAC+, WMA, AMR-NB/WB, Vorbis, FLAC(*)
Avention One-Stop Reports for Google Inc
Page 53
For more information, please visit www.samsungmobileuspress.com.
About Samsung SAFE™
SAFE™: "SAFE™” (Samsung for Enterprise) is a mark for a Samsung device which has been tested against Samsung’s own internal criteria for interoperability with certain third party security-related solutions for MDM and VPN. The testing includes field testing with local network connection and menu tree testing which tests functionality of the solutions in conjunction with the Samsung device. During the testing, the device is tested with the security solutions to see if the solutions work with the device as described by the third party security solution providers. The testing, for example, includes field testing with local network connection and menu tree testing which tests functionality of the solutions in conjunction with the Samsung device For more information about Samsung’s SAFE™ program, please refer to www.samsung.com/us/safe.
About Samsung Telecommunications America
Samsung Telecommunications America, LLC, (Samsung Mobile) a Dallas-based subsidiary of Samsung Electronics Co., Ltd., researches, develops and markets wireless handsets, wireless infrastructure and other telecommunications products throughout North America. For more information, please visit www.samsung.com.
About Samsung Electronics Co., Ltd.
Audio(*) Ultra High Quality Audio (~192KHz, 24 bit) support
S Pen Optimized Features
Air Command (Action Memo, Smart Select, Image Clip, Screen Write)
S Note, Snap Note, Direct Pen Input Additional Features Multi Window™
Ultra Power Saving Mode Voice Recorder (Normal Mode, Interview Mode, Meeting Mode, Voice Memo) S Health™4* 3.5 Dynamic Lock Screen Built in Heart Rate Monitor*
Google Mobile Services
Chrome, Drive, Photos, Gmail, Google, Google+, Google Settings, Hangouts, Maps, Play Books, Play Games, Play Newsstand, Play Movie & TV, Play Music, Play Store, Voice Search, YouTube
Connectivity
WiFi 802.11 a/b/g/n/ac (HT80) MIMO PCIe
GPS / GLONASS / Baidu
NFC, Bluetooth® v 4.1 (BLE,ANT+)
IR LED (Remote Control), USB2.0, MHL 3.0
Sensor
Gesture, Accelerometer, Geo-magnetic, Gyroscope, RGB,IR-LED
Proximity, Barometer, Hall Sensor, Finger Scanner, UV, Heart Rate Monitoring, SpO2 (Dependent on market)
Memory
32 GB Internal5 memory + micro SD slot (up to 128GB)
3GB RAM Dimension 153.5 x 78.6 x 8.5mm, 176g
Battery Standard battery, Li-ion 3,220mAh, Adaptive Fast Charging
Avention One-Stop Reports for Google Inc
Page 54
Samsung Electronics Co., Ltd. is a global leader in technology, opening new possibilities for people everywhere. Through relentless innovation and discovery, we are transforming the worlds of TVs, smartphones, tablets, PCs, cameras, home appliances, printers, LTE systems, medical devices, semiconductors and LED solutions. We employ 286,000 people across 80 countries with annual sales of US$216.7 billion. To discover more, please visit www.samsung.com.
Disclaimer of Warranties:
EXCEPT AS OTHERWISE PROVIDED IN THEIR STANDARD END USER LICENSE AND WARRANTY, TO THE FULL EXTENT PERMITTED BY LAW SAMSUNG ELECTRONICS CO., LTD., SAMSUNG TELECOMMUNICATIONS AMERICA, LLC, AND THEIR AFFILIATES (COLLECTIVELY REFERRED TO HEREIN AS THE “SAMSUNG ENTITIES”) EXPRESSLY DISCLAIM ANY AND ALL WARRANTIES, EXPRESS OR IMPLIED, INCLUDING ANY WARRANTY OF MERCHANTABILITY, FITNESS FOR A PARTICULAR PURPOSE, INTEROPERABILITY OR NON-INFRINGEMENT, WITH RESPECT TO INFORMATION TECHNOLOGY SECURITY PROTECTION, SAFE™ DEVICES AND APPLICATIONS TESTED WITH SAFE™ DEVICES. IN NO EVENT SHALL THE SAMSUNG ENTITIES BE LIABLE FOR ANY DIRECT, INDIRECT, INCIDENTAL, PUNITIVE, OR CONSEQUENTIAL DAMAGES OF ANY KIND WHATSOEVER WITH RESPECT TO INFORMATION TECHNOLOGY SECURITY PROTECTION, SAFE™ DEVICES OR APPLICATIONS TESTED WITH SAFE™ DEVICES.
In addition, information technology security protection will be affected by features or functionality associated with, among other things the e-mail platform, master data management, and virtual private network solutions selected by the software provider, solution provider or user. Choice of an e-mail, master data management, and virtual private network solution is at the sole discretion of the software provider, solution provider or user and any associated effect on information technology security protection is solely the responsibility of the software provider, solution provider or user. For complete statement of limited warranty, please refer to www.samsung.com/us/safe, available on the web and where Samsung smartphone devices are sold.
1 Fast Charging requires Adaptive Fast Charging or Quick Charge 2.0 compatible charger to work. Testing under laboratory conditions.Results may vary.Battery power consumption depends on factors such as network configuration, signal strength, operating temperature, features selected, vibrate mode, backlight settings, browser use, frequency of calls and voice, data and other applications usage patterns.
2 Eligible participants will receive a check equal to the difference between $200 and the trade-in amount (minimum $10) provided by a participating retailer.
3Knox is a mark for a Samsung device tested for security and is specifically configured with enterprise use in mind.For information about Samsung’s Knox device, please refer to www.samsung.com/us/knox.
4 *This device, S Health, and related software is not intended for use in the diagnosis of disease or other conditions, or in the cure, mitigation, treatment or prevention of disease.
5 Portion of memory occupied by existing content.
Samsung, Galaxy Note, S Pen, Super AMOLED, SAFE, Knox, S-View, and S Health are all trademarks of Samsung Electronics Co., Ltd.Google, Google Drive, Gmail, Google+, Hangouts, Google Maps, and other marks are trademarks of Google Inc.Other company names, product names and marks mentioned herein are the property of their respective owners and may be trademarks or registered trademarks.
Photos/Multimedia Gallery Available: http://www.businesswire.com/multimedia/home/20140918005585/en/
MWW for Samsung Marisa Conway, 212-704-9727 [email protected]
Source: Samsung Telecommunications America, LLC
© 2014 Acquire Media Corporation. Published by Avention, Inc., September 2014
Avention One-Stop Reports for Google Inc
Page 55
Google ruling response vetted by watchdogs as complaints pile up
Livemint.com 18 September, 2014
Google was ordered by an EU court in May to pull links in search results on a person’s name on request if the information was outdated or irrelevant. Photo: Bloomberg Brussels: Google Inc. faces continued scrutiny over its response to a court ruling on the ... http://www.livemint.com
Related Companies:
Google Inc [profile]
Related Topics:
Data SecurityRegulatory ActivityITLegal
Provided by Moreover Technologies. Published by Avention, Inc., September 2014
Xiaomi Redmi 1S vs. Motorola Moto E vs. Android One Smartphones: Specifications Comparison
International Business Times India 18 September, 2014
Visitors look at Android One Based mobiles after its launch in New Delhi September 15, 2014. Google Inc launched in India on Monday a $105 smartphone, the first device from its "Android One" initiative which is aimed at boosting sales in key emerging markets ... http://www.ibtimes.co.in
Related Companies:
Snapdeal [profile]
Related Geographies:
AfricaAsiaIndiaMali
Related Topics:
PricingEmerging MarketsProduct ManagementBusiness Development
Provided by Moreover Technologies. Published by Avention, Inc., September 2014
Xiaomi Redmi 1S vs. Motorola Moto E vs. Android One Smartphones: Specifications
International Business Times India 18 September, 2014
Visitors look at Android One Based mobiles after its launch in New Delhi September 15, 2014. Google Inc launched in India on Monday a $105 smartphone, the first device from its "Android One" initiative which is aimed at boosting sales in key emerging markets ... http://www.ibtimes.co.in
Related Companies:
Snapdeal [profile]
Related Geographies:
AfricaAsiaIndiaMali
Related Topics:
PricingEmerging MarketsProduct ManagementBusiness Development
Provided by Moreover Technologies. Published by Avention, Inc., September 2014
Avention One-Stop Reports for Google Inc
Page 56
NFC Forum Adds Analog Testing to Certification Program
Business Wire 18 September, 2014 Expanded Testing Will Help Drive Consistent RF Performance and Ensure a Consistent User Experience
WAKEFIELD, Mass.--(BUSINESS WIRE)-- The NFC Forum, a non-profit industry association that advances the use of Near Field Communication (NFC) technology, today announced the launch of Analog testing as part of its Certification Program. The NFC Forum analog certification will be the world’s first detailed evaluation of the Radio Frequency (RF) performance of an NFC device, assuring that the certified device fulfills the RF requirements and is compliant with the NFC Analog Technical Specification.
Consistent RF performance is essential to smooth and swift NFC interactions, fulfilling NFC’s promise of a seamless experience for the consumer. The testing milestone comes at an opportune time: according to IHS Technology, global shipments of NFC-enabled mobile phones will surge four-fold from 2013 to 2018, reaching 1.2 billion units and penetrating 63% of the global mobile phone market. Transparency Market Research reports that the NFC market is expected to reach 20 billion USD by 2019.
The NFC Forum also announced the availability of Logical Link Control Protocol (LLCP) and Simple NDEF Exchange Protocol (SNEP) certification testing, increasing testing coverage for the communications protocol layers. LLCP is the communication protocol used in NFC's peer-to-peer mode, and SNEP is a protocol for exchanging NFC Forum defined record structures on top of LLCP.
With the additions announced today, the Certification Program offers comprehensive testing for all of the communication layers that are needed to support NFC use cases. This means that application developers can have full confidence in the underlying layers in a certified device and focus on their parts of the NFC ecosystem.
Open to all Forum members, the NFC ForumCertification Program gives manufacturers a means of establishing that their products conform to the NFC Forum Technical Specifications, ensuring consistency in the behavior of compliant devices, and thereby setting the foundation for interoperability. The Certification Program also affords differentiation for NFC Forum members by shortening the product adoption process, lowering adoption costs, and making product implementations easier for partners to integrate.
"The availability of analog testing is a milestone in our Certification Program," said Koichi Tagawa, NFC Forum Chairman. "When a device is certified as compliant with NFC Forum specifications — and the analog specification in particular — it provides consumers with a better assurance that NFC’s easy touch interface will deliver the comfortable and consistent experience they expect. We are grateful for the coordinated efforts of the NFC Forum members, test labs, and tool vendors that have made analog testing possible."
The Certification Program ensures compliance with NFC Forumspecifications for the lower communication layers of an NFC-enabled device, including digital protocol, tag operations, activity, and now analog, LLCP, and SNEP. In order for a device to provide a consistent user experience, all these layers must be properly implemented.
The NFC Forum has established a comprehensive program to deliver the highest levels of quality and consistency during certification testing. The multi-layered approach requires certification testing to be conducted only at authorized test labs, operating only approved test tools, and using only the latest version of the Test Case Category List (TCCL).
Certification is one part of the NFC ForumCompliance Program, which was established to encourage and facilitate development and increase market availability of products that exemplify compliance with NFC Forum specifications, thereby assuring interoperability between devices produced by different manufacturers. By participating in the Certification Program, NFC Forum members and others establish confidence and credibility in the technology for everyone in the value chain, enabling a flourishing NFC ecosystem.
The Certification Program is open to NFC Forum members only. The NFC Forum has an entry-level Implementer membership targeted to companies that plan to implement the standards and certify products. The Forum also holds Plugfest test events three times a year to advance NFC interoperability across platforms, devices, and tags. The next Plugfest event will take place in Tokyo, September 29–October 3, 2014. Plugfest events are open to non-Forum members.
Related Companies:
Sony Corp [profile]
Related Geographies:
United StatesMassachusetts
Related Topics:
Company LeadershipMarketingPublic RelationsConferences, Seminars & ConventionsManagement Team
Related Industries:
Advertising Services [profile]
Avention One-Stop Reports for Google Inc
Page 57
About Near Field Communication Technology NFC technology makes life easier and more convenient for consumers around the world by making it simpler to make transactions, exchange digital content, and connect electronic devices with a touch. A standards-based connectivity technology, NFC harmonizes today's diverse contactless technologies, enabling current and future solutions in areas such as access control, consumer electronics, health care, information collection and exchange, loyalty and coupons, payments, and transport. NFC technology is supported by the world's leading communication device manufacturers, semiconductor producers, network operators, IT and services companies, and financial services organizations. NFC is compatible with hundreds of millions of contactless cards and readers already deployed worldwide.
About the NFC Forum The NFC Forum (www.nfc-forum.org) was launched as a non-profit industry association in 2004 by leading mobile communications, semiconductor, and consumer electronics companies. The Forum's mission is to advance the use of Near Field Communication technology by developing specifications, ensuring interoperability among devices and services, and educating the market about NFC technology. The Forum's global member companies are currently developing specifications for a modular NFC device architecture, and protocols for interoperable data exchange and device-independent service delivery, device discovery, and device capability. The NFC Forum's Sponsor members, which hold seats on the Board of Directors, include leading players in key industries around the world. The Sponsor members are: Broadcom Corporation, Google, Inc., Intel, MasterCard Worldwide, NEC, Nokia, NXP Semiconductors, Qualcomm, Samsung, Sony Corporation, STMicroelectronics, and Visa Inc.
NFC Forum Public Relations Ruth Cassidy, 617-957-8494 [email protected]
Source: The NFC Forum
© 2014 Acquire Media Corporation. Published by Avention, Inc., September 2014
Xiaomi Redmi 1S vs. Motorola Moto E vs. Android One Smartphones: Specification Comparison
International Business Times India 18 September, 2014
Visitors look at Android One Based mobiles after its launch in New Delhi September 15, 2014. Google Inc launched in India on Monday a $105 smartphone, the first device from its "Android One" initiative which is aimed at boosting sales in key emerging markets ... http://www.ibtimes.co.in
Related Companies:
Snapdeal [profile]
Related Geographies:
AfricaAsiaIndiaMali
Related Topics:
PricingEmerging MarketsProduct ManagementBusiness Development
Provided by Moreover Technologies. Published by Avention, Inc., September 2014
Nestle says allies to create jobs for Europe youth
KiniBiz 18 September, 2014
Nestle SA, the world’s biggest food company, said 100,000 job opportunities will be created for young people within four years as it expands an alliance with about 200 companies including Google Inc. to cut youth joblessness. Nestle plans to provide …
Related Companies:
Nestle SA [profile]
Avention One-Stop Reports for Google Inc
Page 58
http://m.kinibiz.com
Provided by Moreover Technologies. Published by Avention, Inc., September 2014
Nestle says allies to create 100,000 positions for Europe youth
KiniBiz 18 September, 2014
Nestle SA, the world’s biggest food company, said 100,000 job opportunities will be created for young people within four years as it expands an alliance with about 200 companies including Google Inc. to cut youth joblessness. Nestle plans to provide … http://m.kinibiz.com
Related Companies:
Nestle SA [profile]
Provided by Moreover Technologies. Published by Avention, Inc., September 2014
Xiaomi Redmi 1S vs. Motorola Moto E vs. Android One Smartphones: Specification C
International Business Times India 18 September, 2014
Visitors look at Android One Based mobiles after its launch in New Delhi September 15, 2014. Google Inc launched in India on Monday a $105 smartphone, the first device from its "Android One" initiative which is aimed at boosting sales in key emerging markets ... http://www.ibtimes.co.in
Related Companies:
Snapdeal [profile]
Related Geographies:
AfricaAsiaIndiaMali
Related Topics:
PricingEmerging MarketsProduct ManagementBusiness Development
Provided by Moreover Technologies. Published by Avention, Inc., September 2014
Avention One-Stop Reports for Google Inc
Page 59

Avention One-Stop Reports for Google Inc
Page 60
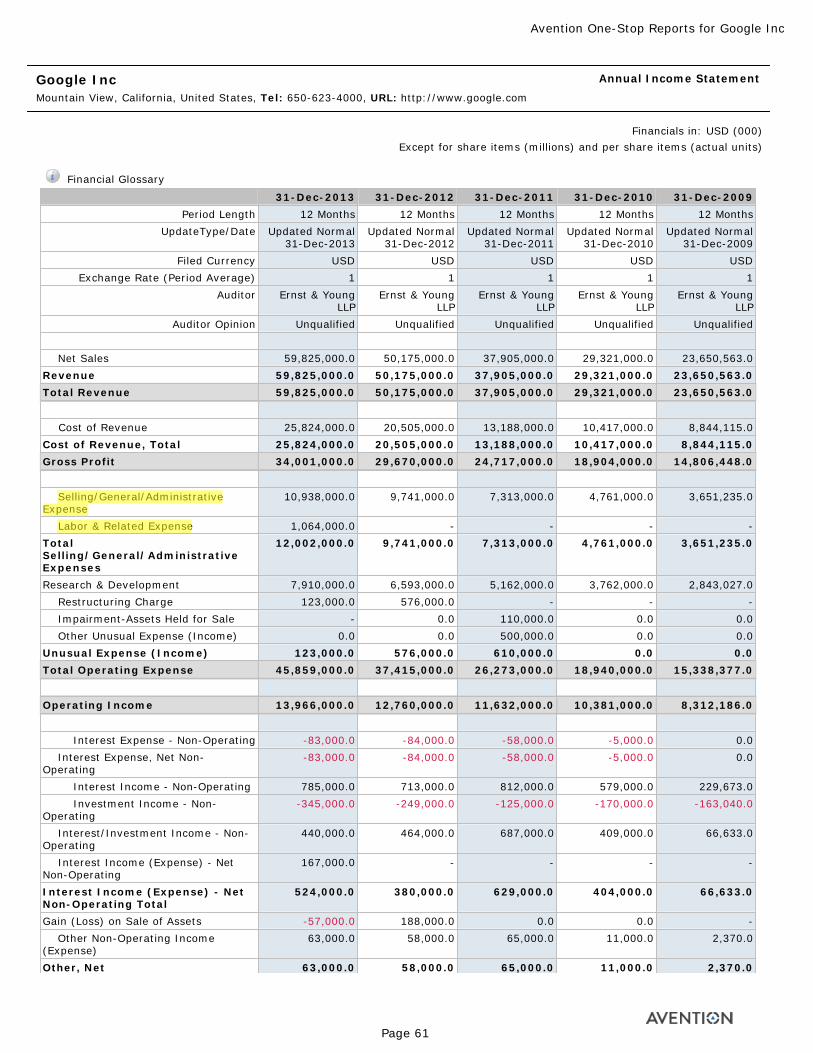
Google Inc Mountain View, California, United States, Tel: 650-623-4000, URL: http://www.google.com
Annual Income Statement
Financials in: USD (000)Except for share items (millions) and per share items (actual units)
Financial Glossary
31-Dec-2013 31-Dec-2012 31-Dec-2011 31-Dec-2010 31-Dec-2009Period Length 12 Months 12 Months 12 Months 12 Months 12 Months
UpdateType/Date Updated Normal 31-Dec-2013
Updated Normal 31-Dec-2012
Updated Normal 31-Dec-2011
Updated Normal 31-Dec-2010
Updated Normal 31-Dec-2009
Filed Currency USD USD USD USD USDExchange Rate (Period Average) 1 1 1 1 1
Auditor Ernst & Young LLP
Ernst & Young LLP
Ernst & Young LLP
Ernst & Young LLP
Ernst & Young LLP
Auditor Opinion Unqualified Unqualified Unqualified Unqualified Unqualified Net Sales 59,825,000.0 50,175,000.0 37,905,000.0 29,321,000.0 23,650,563.0Revenue 59,825,000.0 50,175,000.0 37,905,000.0 29,321,000.0 23,650,563.0Total Revenue 59,825,000.0 50,175,000.0 37,905,000.0 29,321,000.0 23,650,563.0
Cost of Revenue 25,824,000.0 20,505,000.0 13,188,000.0 10,417,000.0 8,844,115.0Cost of Revenue, Total 25,824,000.0 20,505,000.0 13,188,000.0 10,417,000.0 8,844,115.0Gross Profit 34,001,000.0 29,670,000.0 24,717,000.0 18,904,000.0 14,806,448.0
Selling/General/Administrative Expense
10,938,000.0 9,741,000.0 7,313,000.0 4,761,000.0 3,651,235.0
Labor & Related Expense 1,064,000.0 - - - -Total Selling/General/Administrative Expenses
12,002,000.0 9,741,000.0 7,313,000.0 4,761,000.0 3,651,235.0
Research & Development 7,910,000.0 6,593,000.0 5,162,000.0 3,762,000.0 2,843,027.0 Restructuring Charge 123,000.0 576,000.0 - - - Impairment-Assets Held for Sale - 0.0 110,000.0 0.0 0.0 Other Unusual Expense (Income) 0.0 0.0 500,000.0 0.0 0.0Unusual Expense (Income) 123,000.0 576,000.0 610,000.0 0.0 0.0Total Operating Expense 45,859,000.0 37,415,000.0 26,273,000.0 18,940,000.0 15,338,377.0
Operating Income 13,966,000.0 12,760,000.0 11,632,000.0 10,381,000.0 8,312,186.0
Interest Expense - Non-Operating -83,000.0 -84,000.0 -58,000.0 -5,000.0 0.0 Interest Expense, Net Non-Operating
-83,000.0 -84,000.0 -58,000.0 -5,000.0 0.0
Interest Income - Non-Operating 785,000.0 713,000.0 812,000.0 579,000.0 229,673.0 Investment Income - Non-Operating
-345,000.0 -249,000.0 -125,000.0 -170,000.0 -163,040.0
Interest/Investment Income - Non-Operating
440,000.0 464,000.0 687,000.0 409,000.0 66,633.0
Interest Income (Expense) - Net Non-Operating
167,000.0 - - - -
Interest Income (Expense) - Net Non-Operating Total
524,000.0 380,000.0 629,000.0 404,000.0 66,633.0
Gain (Loss) on Sale of Assets -57,000.0 188,000.0 0.0 0.0 - Other Non-Operating Income (Expense)
63,000.0 58,000.0 65,000.0 11,000.0 2,370.0
Other, Net 63,000.0 58,000.0 65,000.0 11,000.0 2,370.0
Avention One-Stop Reports for Google Inc
Page 61
Tahir
Highlight
Tahir
Highlight
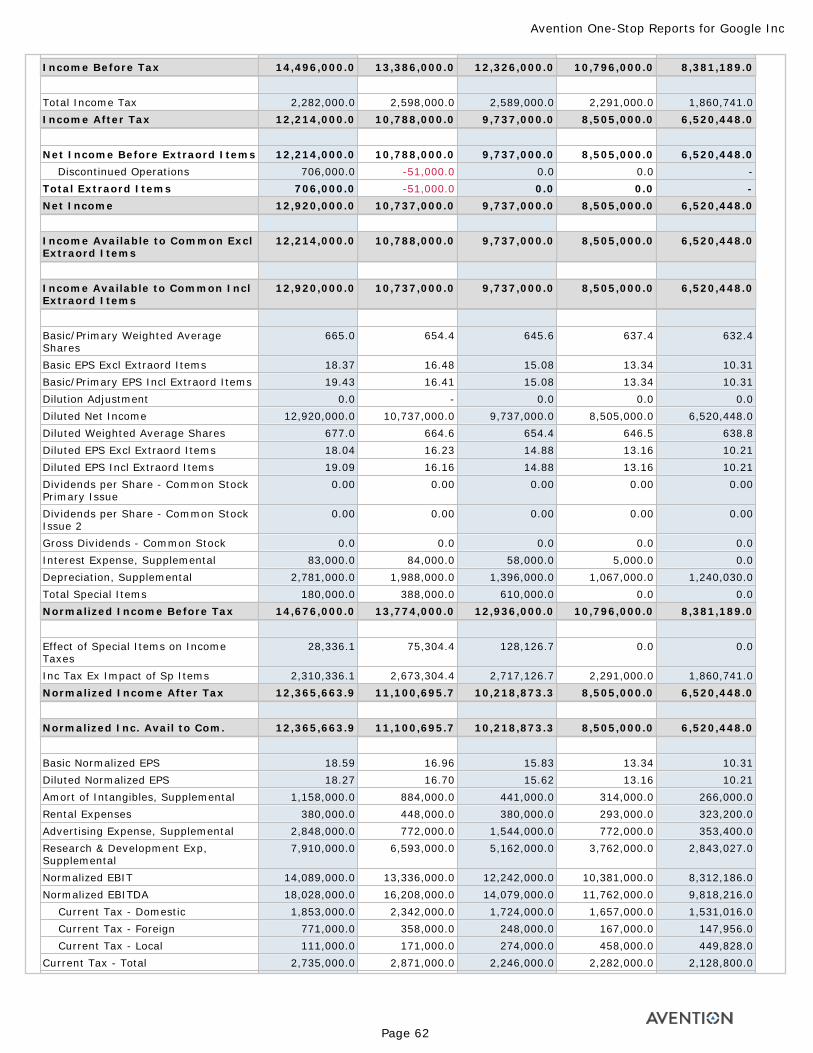
Income Before Tax 14,496,000.0 13,386,000.0 12,326,000.0 10,796,000.0 8,381,189.0
Total Income Tax 2,282,000.0 2,598,000.0 2,589,000.0 2,291,000.0 1,860,741.0Income After Tax 12,214,000.0 10,788,000.0 9,737,000.0 8,505,000.0 6,520,448.0
Net Income Before Extraord Items 12,214,000.0 10,788,000.0 9,737,000.0 8,505,000.0 6,520,448.0 Discontinued Operations 706,000.0 -51,000.0 0.0 0.0 -Total Extraord Items 706,000.0 -51,000.0 0.0 0.0 -Net Income 12,920,000.0 10,737,000.0 9,737,000.0 8,505,000.0 6,520,448.0
Income Available to Common Excl Extraord Items
12,214,000.0 10,788,000.0 9,737,000.0 8,505,000.0 6,520,448.0
Income Available to Common Incl Extraord Items
12,920,000.0 10,737,000.0 9,737,000.0 8,505,000.0 6,520,448.0
Basic/Primary Weighted Average Shares
665.0 654.4 645.6 637.4 632.4
Basic EPS Excl Extraord Items 18.37 16.48 15.08 13.34 10.31Basic/Primary EPS Incl Extraord Items 19.43 16.41 15.08 13.34 10.31Dilution Adjustment 0.0 - 0.0 0.0 0.0Diluted Net Income 12,920,000.0 10,737,000.0 9,737,000.0 8,505,000.0 6,520,448.0Diluted Weighted Average Shares 677.0 664.6 654.4 646.5 638.8Diluted EPS Excl Extraord Items 18.04 16.23 14.88 13.16 10.21Diluted EPS Incl Extraord Items 19.09 16.16 14.88 13.16 10.21Dividends per Share - Common Stock Primary Issue
0.00 0.00 0.00 0.00 0.00
Dividends per Share - Common Stock Issue 2
0.00 0.00 0.00 0.00 0.00
Gross Dividends - Common Stock 0.0 0.0 0.0 0.0 0.0Interest Expense, Supplemental 83,000.0 84,000.0 58,000.0 5,000.0 0.0Depreciation, Supplemental 2,781,000.0 1,988,000.0 1,396,000.0 1,067,000.0 1,240,030.0Total Special Items 180,000.0 388,000.0 610,000.0 0.0 0.0Normalized Income Before Tax 14,676,000.0 13,774,000.0 12,936,000.0 10,796,000.0 8,381,189.0
Effect of Special Items on Income Taxes
28,336.1 75,304.4 128,126.7 0.0 0.0
Inc Tax Ex Impact of Sp Items 2,310,336.1 2,673,304.4 2,717,126.7 2,291,000.0 1,860,741.0Normalized Income After Tax 12,365,663.9 11,100,695.7 10,218,873.3 8,505,000.0 6,520,448.0
Normalized Inc. Avail to Com. 12,365,663.9 11,100,695.7 10,218,873.3 8,505,000.0 6,520,448.0
Basic Normalized EPS 18.59 16.96 15.83 13.34 10.31Diluted Normalized EPS 18.27 16.70 15.62 13.16 10.21Amort of Intangibles, Supplemental 1,158,000.0 884,000.0 441,000.0 314,000.0 266,000.0Rental Expenses 380,000.0 448,000.0 380,000.0 293,000.0 323,200.0Advertising Expense, Supplemental 2,848,000.0 772,000.0 1,544,000.0 772,000.0 353,400.0Research & Development Exp, Supplemental
7,910,000.0 6,593,000.0 5,162,000.0 3,762,000.0 2,843,027.0
Normalized EBIT 14,089,000.0 13,336,000.0 12,242,000.0 10,381,000.0 8,312,186.0Normalized EBITDA 18,028,000.0 16,208,000.0 14,079,000.0 11,762,000.0 9,818,216.0 Current Tax - Domestic 1,853,000.0 2,342,000.0 1,724,000.0 1,657,000.0 1,531,016.0 Current Tax - Foreign 771,000.0 358,000.0 248,000.0 167,000.0 147,956.0 Current Tax - Local 111,000.0 171,000.0 274,000.0 458,000.0 449,828.0Current Tax - Total 2,735,000.0 2,871,000.0 2,246,000.0 2,282,000.0 2,128,800.0
Avention One-Stop Reports for Google Inc
Page 62
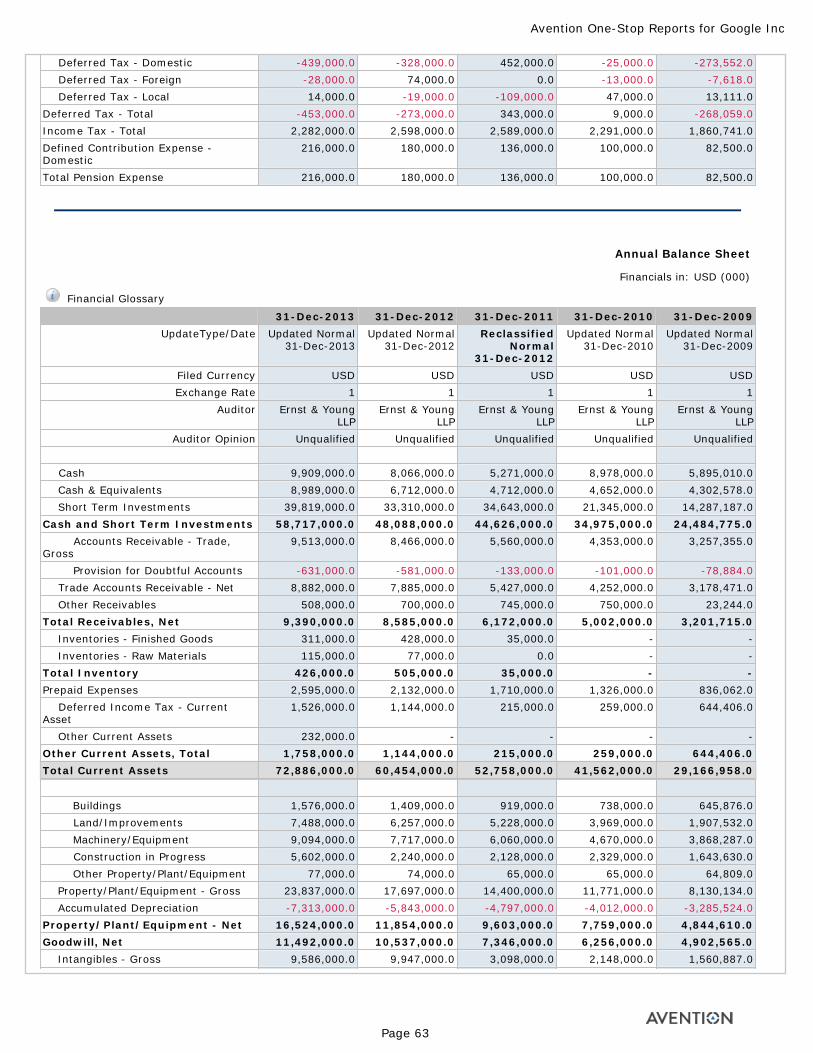
Deferred Tax - Domestic -439,000.0 -328,000.0 452,000.0 -25,000.0 -273,552.0 Deferred Tax - Foreign -28,000.0 74,000.0 0.0 -13,000.0 -7,618.0 Deferred Tax - Local 14,000.0 -19,000.0 -109,000.0 47,000.0 13,111.0Deferred Tax - Total -453,000.0 -273,000.0 343,000.0 9,000.0 -268,059.0Income Tax - Total 2,282,000.0 2,598,000.0 2,589,000.0 2,291,000.0 1,860,741.0Defined Contribution Expense - Domestic
216,000.0 180,000.0 136,000.0 100,000.0 82,500.0
Total Pension Expense 216,000.0 180,000.0 136,000.0 100,000.0 82,500.0
Annual Balance Sheet
Financials in: USD (000)
Financial Glossary
31-Dec-2013 31-Dec-2012 31-Dec-2011 31-Dec-2010 31-Dec-2009UpdateType/Date Updated Normal
31-Dec-2013Updated Normal
31-Dec-2012Reclassified
Normal 31-Dec-2012
Updated Normal 31-Dec-2010
Updated Normal 31-Dec-2009
Filed Currency USD USD USD USD USDExchange Rate 1 1 1 1 1
Auditor Ernst & Young LLP
Ernst & Young LLP
Ernst & Young LLP
Ernst & Young LLP
Ernst & Young LLP
Auditor Opinion Unqualified Unqualified Unqualified Unqualified Unqualified Cash 9,909,000.0 8,066,000.0 5,271,000.0 8,978,000.0 5,895,010.0 Cash & Equivalents 8,989,000.0 6,712,000.0 4,712,000.0 4,652,000.0 4,302,578.0 Short Term Investments 39,819,000.0 33,310,000.0 34,643,000.0 21,345,000.0 14,287,187.0Cash and Short Term Investments 58,717,000.0 48,088,000.0 44,626,000.0 34,975,000.0 24,484,775.0 Accounts Receivable - Trade, Gross
9,513,000.0 8,466,000.0 5,560,000.0 4,353,000.0 3,257,355.0
Provision for Doubtful Accounts -631,000.0 -581,000.0 -133,000.0 -101,000.0 -78,884.0 Trade Accounts Receivable - Net 8,882,000.0 7,885,000.0 5,427,000.0 4,252,000.0 3,178,471.0 Other Receivables 508,000.0 700,000.0 745,000.0 750,000.0 23,244.0Total Receivables, Net 9,390,000.0 8,585,000.0 6,172,000.0 5,002,000.0 3,201,715.0 Inventories - Finished Goods 311,000.0 428,000.0 35,000.0 - - Inventories - Raw Materials 115,000.0 77,000.0 0.0 - -Total Inventory 426,000.0 505,000.0 35,000.0 - -Prepaid Expenses 2,595,000.0 2,132,000.0 1,710,000.0 1,326,000.0 836,062.0 Deferred Income Tax - Current Asset
1,526,000.0 1,144,000.0 215,000.0 259,000.0 644,406.0
Other Current Assets 232,000.0 - - - -Other Current Assets, Total 1,758,000.0 1,144,000.0 215,000.0 259,000.0 644,406.0Total Current Assets 72,886,000.0 60,454,000.0 52,758,000.0 41,562,000.0 29,166,958.0
Buildings 1,576,000.0 1,409,000.0 919,000.0 738,000.0 645,876.0 Land/Improvements 7,488,000.0 6,257,000.0 5,228,000.0 3,969,000.0 1,907,532.0 Machinery/Equipment 9,094,000.0 7,717,000.0 6,060,000.0 4,670,000.0 3,868,287.0 Construction in Progress 5,602,000.0 2,240,000.0 2,128,000.0 2,329,000.0 1,643,630.0 Other Property/Plant/Equipment 77,000.0 74,000.0 65,000.0 65,000.0 64,809.0 Property/Plant/Equipment - Gross 23,837,000.0 17,697,000.0 14,400,000.0 11,771,000.0 8,130,134.0 Accumulated Depreciation -7,313,000.0 -5,843,000.0 -4,797,000.0 -4,012,000.0 -3,285,524.0Property/Plant/Equipment - Net 16,524,000.0 11,854,000.0 9,603,000.0 7,759,000.0 4,844,610.0Goodwill, Net 11,492,000.0 10,537,000.0 7,346,000.0 6,256,000.0 4,902,565.0 Intangibles - Gross 9,586,000.0 9,947,000.0 3,098,000.0 2,148,000.0 1,560,887.0
Avention One-Stop Reports for Google Inc
Page 63
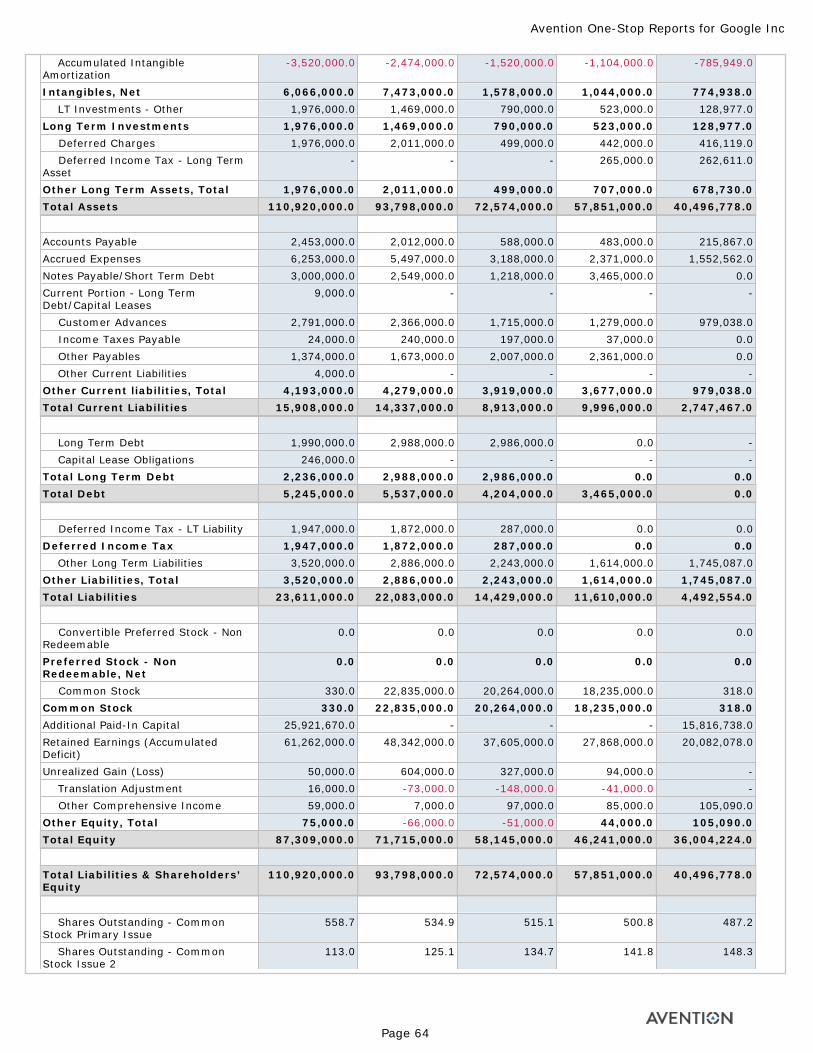
Accumulated Intangible Amortization
-3,520,000.0 -2,474,000.0 -1,520,000.0 -1,104,000.0 -785,949.0
Intangibles, Net 6,066,000.0 7,473,000.0 1,578,000.0 1,044,000.0 774,938.0 LT Investments - Other 1,976,000.0 1,469,000.0 790,000.0 523,000.0 128,977.0Long Term Investments 1,976,000.0 1,469,000.0 790,000.0 523,000.0 128,977.0 Deferred Charges 1,976,000.0 2,011,000.0 499,000.0 442,000.0 416,119.0 Deferred Income Tax - Long Term Asset
- - - 265,000.0 262,611.0
Other Long Term Assets, Total 1,976,000.0 2,011,000.0 499,000.0 707,000.0 678,730.0Total Assets 110,920,000.0 93,798,000.0 72,574,000.0 57,851,000.0 40,496,778.0
Accounts Payable 2,453,000.0 2,012,000.0 588,000.0 483,000.0 215,867.0Accrued Expenses 6,253,000.0 5,497,000.0 3,188,000.0 2,371,000.0 1,552,562.0Notes Payable/Short Term Debt 3,000,000.0 2,549,000.0 1,218,000.0 3,465,000.0 0.0Current Portion - Long Term Debt/Capital Leases
9,000.0 - - - -
Customer Advances 2,791,000.0 2,366,000.0 1,715,000.0 1,279,000.0 979,038.0 Income Taxes Payable 24,000.0 240,000.0 197,000.0 37,000.0 0.0 Other Payables 1,374,000.0 1,673,000.0 2,007,000.0 2,361,000.0 0.0 Other Current Liabilities 4,000.0 - - - -Other Current liabilities, Total 4,193,000.0 4,279,000.0 3,919,000.0 3,677,000.0 979,038.0Total Current Liabilities 15,908,000.0 14,337,000.0 8,913,000.0 9,996,000.0 2,747,467.0
Long Term Debt 1,990,000.0 2,988,000.0 2,986,000.0 0.0 - Capital Lease Obligations 246,000.0 - - - -Total Long Term Debt 2,236,000.0 2,988,000.0 2,986,000.0 0.0 0.0Total Debt 5,245,000.0 5,537,000.0 4,204,000.0 3,465,000.0 0.0
Deferred Income Tax - LT Liability 1,947,000.0 1,872,000.0 287,000.0 0.0 0.0Deferred Income Tax 1,947,000.0 1,872,000.0 287,000.0 0.0 0.0 Other Long Term Liabilities 3,520,000.0 2,886,000.0 2,243,000.0 1,614,000.0 1,745,087.0Other Liabilities, Total 3,520,000.0 2,886,000.0 2,243,000.0 1,614,000.0 1,745,087.0Total Liabilities 23,611,000.0 22,083,000.0 14,429,000.0 11,610,000.0 4,492,554.0
Convertible Preferred Stock - Non Redeemable
0.0 0.0 0.0 0.0 0.0
Preferred Stock - Non Redeemable, Net
0.0 0.0 0.0 0.0 0.0
Common Stock 330.0 22,835,000.0 20,264,000.0 18,235,000.0 318.0Common Stock 330.0 22,835,000.0 20,264,000.0 18,235,000.0 318.0Additional Paid-In Capital 25,921,670.0 - - - 15,816,738.0Retained Earnings (Accumulated Deficit)
61,262,000.0 48,342,000.0 37,605,000.0 27,868,000.0 20,082,078.0
Unrealized Gain (Loss) 50,000.0 604,000.0 327,000.0 94,000.0 - Translation Adjustment 16,000.0 -73,000.0 -148,000.0 -41,000.0 - Other Comprehensive Income 59,000.0 7,000.0 97,000.0 85,000.0 105,090.0Other Equity, Total 75,000.0 -66,000.0 -51,000.0 44,000.0 105,090.0Total Equity 87,309,000.0 71,715,000.0 58,145,000.0 46,241,000.0 36,004,224.0
Total Liabilities & Shareholders’ Equity
110,920,000.0 93,798,000.0 72,574,000.0 57,851,000.0 40,496,778.0
Shares Outstanding - Common Stock Primary Issue
558.7 534.9 515.1 500.8 487.2
Shares Outstanding - Common Stock Issue 2
113.0 125.1 134.7 141.8 148.3
Avention One-Stop Reports for Google Inc
Page 64
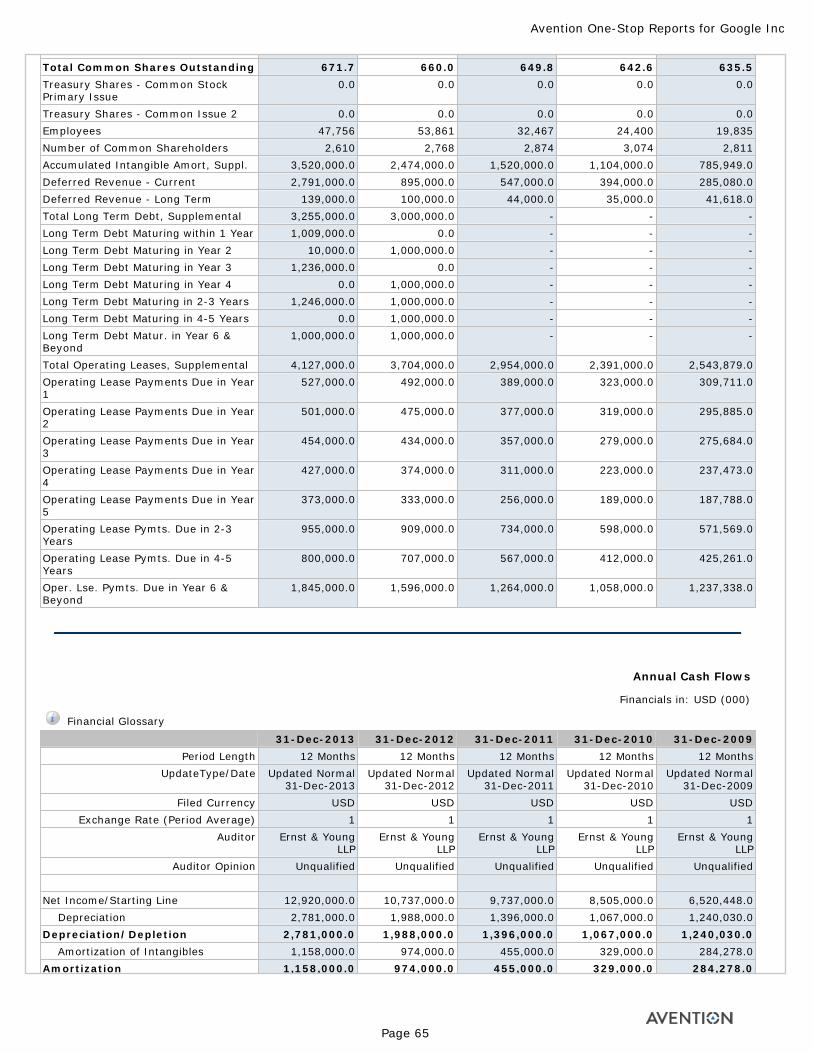
Total Common Shares Outstanding 671.7 660.0 649.8 642.6 635.5Treasury Shares - Common Stock Primary Issue
0.0 0.0 0.0 0.0 0.0
Treasury Shares - Common Issue 2 0.0 0.0 0.0 0.0 0.0Employees 47,756 53,861 32,467 24,400 19,835Number of Common Shareholders 2,610 2,768 2,874 3,074 2,811Accumulated Intangible Amort, Suppl. 3,520,000.0 2,474,000.0 1,520,000.0 1,104,000.0 785,949.0Deferred Revenue - Current 2,791,000.0 895,000.0 547,000.0 394,000.0 285,080.0Deferred Revenue - Long Term 139,000.0 100,000.0 44,000.0 35,000.0 41,618.0Total Long Term Debt, Supplemental 3,255,000.0 3,000,000.0 - - -Long Term Debt Maturing within 1 Year 1,009,000.0 0.0 - - -Long Term Debt Maturing in Year 2 10,000.0 1,000,000.0 - - -Long Term Debt Maturing in Year 3 1,236,000.0 0.0 - - -Long Term Debt Maturing in Year 4 0.0 1,000,000.0 - - -Long Term Debt Maturing in 2-3 Years 1,246,000.0 1,000,000.0 - - -Long Term Debt Maturing in 4-5 Years 0.0 1,000,000.0 - - -Long Term Debt Matur. in Year 6 & Beyond
1,000,000.0 1,000,000.0 - - -
Total Operating Leases, Supplemental 4,127,000.0 3,704,000.0 2,954,000.0 2,391,000.0 2,543,879.0Operating Lease Payments Due in Year 1
527,000.0 492,000.0 389,000.0 323,000.0 309,711.0
Operating Lease Payments Due in Year 2
501,000.0 475,000.0 377,000.0 319,000.0 295,885.0
Operating Lease Payments Due in Year 3
454,000.0 434,000.0 357,000.0 279,000.0 275,684.0
Operating Lease Payments Due in Year 4
427,000.0 374,000.0 311,000.0 223,000.0 237,473.0
Operating Lease Payments Due in Year 5
373,000.0 333,000.0 256,000.0 189,000.0 187,788.0
Operating Lease Pymts. Due in 2-3 Years
955,000.0 909,000.0 734,000.0 598,000.0 571,569.0
Operating Lease Pymts. Due in 4-5 Years
800,000.0 707,000.0 567,000.0 412,000.0 425,261.0
Oper. Lse. Pymts. Due in Year 6 & Beyond
1,845,000.0 1,596,000.0 1,264,000.0 1,058,000.0 1,237,338.0
Annual Cash Flows
Financials in: USD (000)
Financial Glossary
31-Dec-2013 31-Dec-2012 31-Dec-2011 31-Dec-2010 31-Dec-2009Period Length 12 Months 12 Months 12 Months 12 Months 12 Months
UpdateType/Date Updated Normal 31-Dec-2013
Updated Normal 31-Dec-2012
Updated Normal 31-Dec-2011
Updated Normal 31-Dec-2010
Updated Normal 31-Dec-2009
Filed Currency USD USD USD USD USDExchange Rate (Period Average) 1 1 1 1 1
Auditor Ernst & Young LLP
Ernst & Young LLP
Ernst & Young LLP
Ernst & Young LLP
Ernst & Young LLP
Auditor Opinion Unqualified Unqualified Unqualified Unqualified Unqualified Net Income/Starting Line 12,920,000.0 10,737,000.0 9,737,000.0 8,505,000.0 6,520,448.0 Depreciation 2,781,000.0 1,988,000.0 1,396,000.0 1,067,000.0 1,240,030.0Depreciation/Depletion 2,781,000.0 1,988,000.0 1,396,000.0 1,067,000.0 1,240,030.0 Amortization of Intangibles 1,158,000.0 974,000.0 455,000.0 329,000.0 284,278.0Amortization 1,158,000.0 974,000.0 455,000.0 329,000.0 284,278.0
Avention One-Stop Reports for Google Inc
Page 65
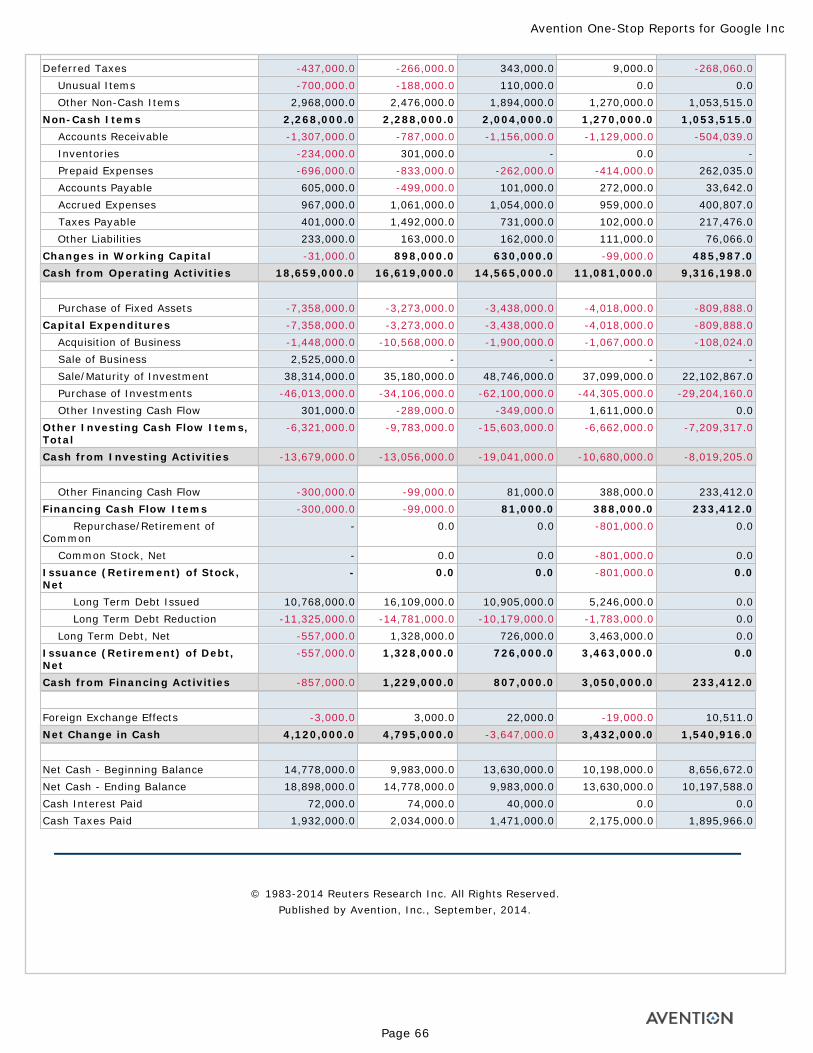
Deferred Taxes -437,000.0 -266,000.0 343,000.0 9,000.0 -268,060.0 Unusual Items -700,000.0 -188,000.0 110,000.0 0.0 0.0 Other Non-Cash Items 2,968,000.0 2,476,000.0 1,894,000.0 1,270,000.0 1,053,515.0Non-Cash Items 2,268,000.0 2,288,000.0 2,004,000.0 1,270,000.0 1,053,515.0 Accounts Receivable -1,307,000.0 -787,000.0 -1,156,000.0 -1,129,000.0 -504,039.0 Inventories -234,000.0 301,000.0 - 0.0 - Prepaid Expenses -696,000.0 -833,000.0 -262,000.0 -414,000.0 262,035.0 Accounts Payable 605,000.0 -499,000.0 101,000.0 272,000.0 33,642.0 Accrued Expenses 967,000.0 1,061,000.0 1,054,000.0 959,000.0 400,807.0 Taxes Payable 401,000.0 1,492,000.0 731,000.0 102,000.0 217,476.0 Other Liabilities 233,000.0 163,000.0 162,000.0 111,000.0 76,066.0Changes in Working Capital -31,000.0 898,000.0 630,000.0 -99,000.0 485,987.0Cash from Operating Activities 18,659,000.0 16,619,000.0 14,565,000.0 11,081,000.0 9,316,198.0
Purchase of Fixed Assets -7,358,000.0 -3,273,000.0 -3,438,000.0 -4,018,000.0 -809,888.0Capital Expenditures -7,358,000.0 -3,273,000.0 -3,438,000.0 -4,018,000.0 -809,888.0 Acquisition of Business -1,448,000.0 -10,568,000.0 -1,900,000.0 -1,067,000.0 -108,024.0 Sale of Business 2,525,000.0 - - - - Sale/Maturity of Investment 38,314,000.0 35,180,000.0 48,746,000.0 37,099,000.0 22,102,867.0 Purchase of Investments -46,013,000.0 -34,106,000.0 -62,100,000.0 -44,305,000.0 -29,204,160.0 Other Investing Cash Flow 301,000.0 -289,000.0 -349,000.0 1,611,000.0 0.0Other Investing Cash Flow Items, Total
-6,321,000.0 -9,783,000.0 -15,603,000.0 -6,662,000.0 -7,209,317.0
Cash from Investing Activities -13,679,000.0 -13,056,000.0 -19,041,000.0 -10,680,000.0 -8,019,205.0
Other Financing Cash Flow -300,000.0 -99,000.0 81,000.0 388,000.0 233,412.0Financing Cash Flow Items -300,000.0 -99,000.0 81,000.0 388,000.0 233,412.0 Repurchase/Retirement of Common
- 0.0 0.0 -801,000.0 0.0
Common Stock, Net - 0.0 0.0 -801,000.0 0.0Issuance (Retirement) of Stock, Net
- 0.0 0.0 -801,000.0 0.0
Long Term Debt Issued 10,768,000.0 16,109,000.0 10,905,000.0 5,246,000.0 0.0 Long Term Debt Reduction -11,325,000.0 -14,781,000.0 -10,179,000.0 -1,783,000.0 0.0 Long Term Debt, Net -557,000.0 1,328,000.0 726,000.0 3,463,000.0 0.0Issuance (Retirement) of Debt, Net
-557,000.0 1,328,000.0 726,000.0 3,463,000.0 0.0
Cash from Financing Activities -857,000.0 1,229,000.0 807,000.0 3,050,000.0 233,412.0
Foreign Exchange Effects -3,000.0 3,000.0 22,000.0 -19,000.0 10,511.0Net Change in Cash 4,120,000.0 4,795,000.0 -3,647,000.0 3,432,000.0 1,540,916.0
Net Cash - Beginning Balance 14,778,000.0 9,983,000.0 13,630,000.0 10,198,000.0 8,656,672.0Net Cash - Ending Balance 18,898,000.0 14,778,000.0 9,983,000.0 13,630,000.0 10,197,588.0Cash Interest Paid 72,000.0 74,000.0 40,000.0 0.0 0.0Cash Taxes Paid 1,932,000.0 2,034,000.0 1,471,000.0 2,175,000.0 1,895,966.0
© 1983-2014 Reuters Research Inc. All Rights Reserved. Published by Avention, Inc., September, 2014.
Avention One-Stop Reports for Google Inc
Page 66
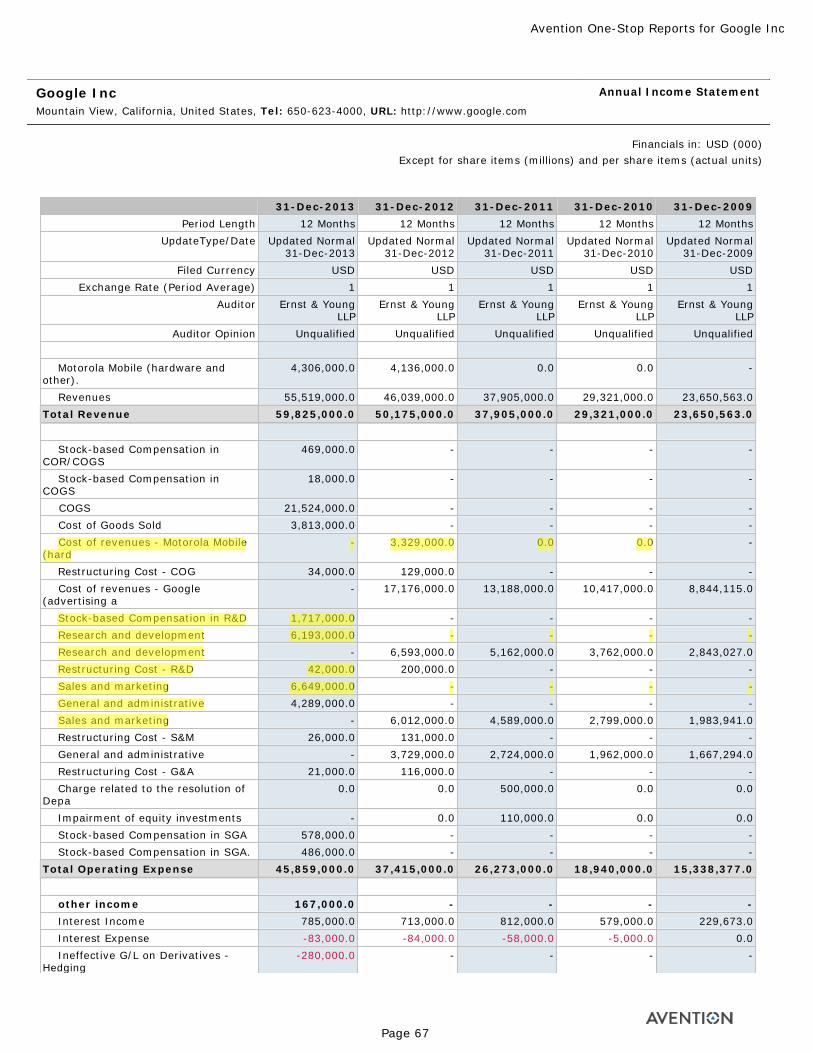
Google Inc Mountain View, California, United States, Tel: 650-623-4000, URL: http://www.google.com
Annual Income Statement
Financials in: USD (000)Except for share items (millions) and per share items (actual units)
31-Dec-2013 31-Dec-2012 31-Dec-2011 31-Dec-2010 31-Dec-2009Period Length 12 Months 12 Months 12 Months 12 Months 12 Months
UpdateType/Date Updated Normal 31-Dec-2013
Updated Normal 31-Dec-2012
Updated Normal 31-Dec-2011
Updated Normal 31-Dec-2010
Updated Normal 31-Dec-2009
Filed Currency USD USD USD USD USDExchange Rate (Period Average) 1 1 1 1 1
Auditor Ernst & Young LLP
Ernst & Young LLP
Ernst & Young LLP
Ernst & Young LLP
Ernst & Young LLP
Auditor Opinion Unqualified Unqualified Unqualified Unqualified Unqualified
Motorola Mobile (hardware and other).
4,306,000.0 4,136,000.0 0.0 0.0 -
Revenues 55,519,000.0 46,039,000.0 37,905,000.0 29,321,000.0 23,650,563.0Total Revenue 59,825,000.0 50,175,000.0 37,905,000.0 29,321,000.0 23,650,563.0
Stock-based Compensation in COR/COGS
469,000.0 - - - -
Stock-based Compensation in COGS
18,000.0 - - - -
COGS 21,524,000.0 - - - - Cost of Goods Sold 3,813,000.0 - - - - Cost of revenues - Motorola Mobile (hard
- 3,329,000.0 0.0 0.0 -
Restructuring Cost - COG 34,000.0 129,000.0 - - - Cost of revenues - Google (advertising a
- 17,176,000.0 13,188,000.0 10,417,000.0 8,844,115.0
Stock-based Compensation in R&D 1,717,000.0 - - - - Research and development 6,193,000.0 - - - - Research and development - 6,593,000.0 5,162,000.0 3,762,000.0 2,843,027.0 Restructuring Cost - R&D 42,000.0 200,000.0 - - - Sales and marketing 6,649,000.0 - - - - General and administrative 4,289,000.0 - - - - Sales and marketing - 6,012,000.0 4,589,000.0 2,799,000.0 1,983,941.0 Restructuring Cost - S&M 26,000.0 131,000.0 - - - General and administrative - 3,729,000.0 2,724,000.0 1,962,000.0 1,667,294.0 Restructuring Cost - G&A 21,000.0 116,000.0 - - - Charge related to the resolution of Depa
0.0 0.0 500,000.0 0.0 0.0
Impairment of equity investments - 0.0 110,000.0 0.0 0.0 Stock-based Compensation in SGA 578,000.0 - - - - Stock-based Compensation in SGA. 486,000.0 - - - -Total Operating Expense 45,859,000.0 37,415,000.0 26,273,000.0 18,940,000.0 15,338,377.0
other income 167,000.0 - - - - Interest Income 785,000.0 713,000.0 812,000.0 579,000.0 229,673.0 Interest Expense -83,000.0 -84,000.0 -58,000.0 -5,000.0 0.0 Ineffective G/L on Derivatives - Hedging
-280,000.0 - - - -
Avention One-Stop Reports for Google Inc
Page 67
Tahir
Highlight
Tahir
Highlight
Tahir
Highlight
Tahir
Highlight
Tahir
Highlight
Tahir
Highlight
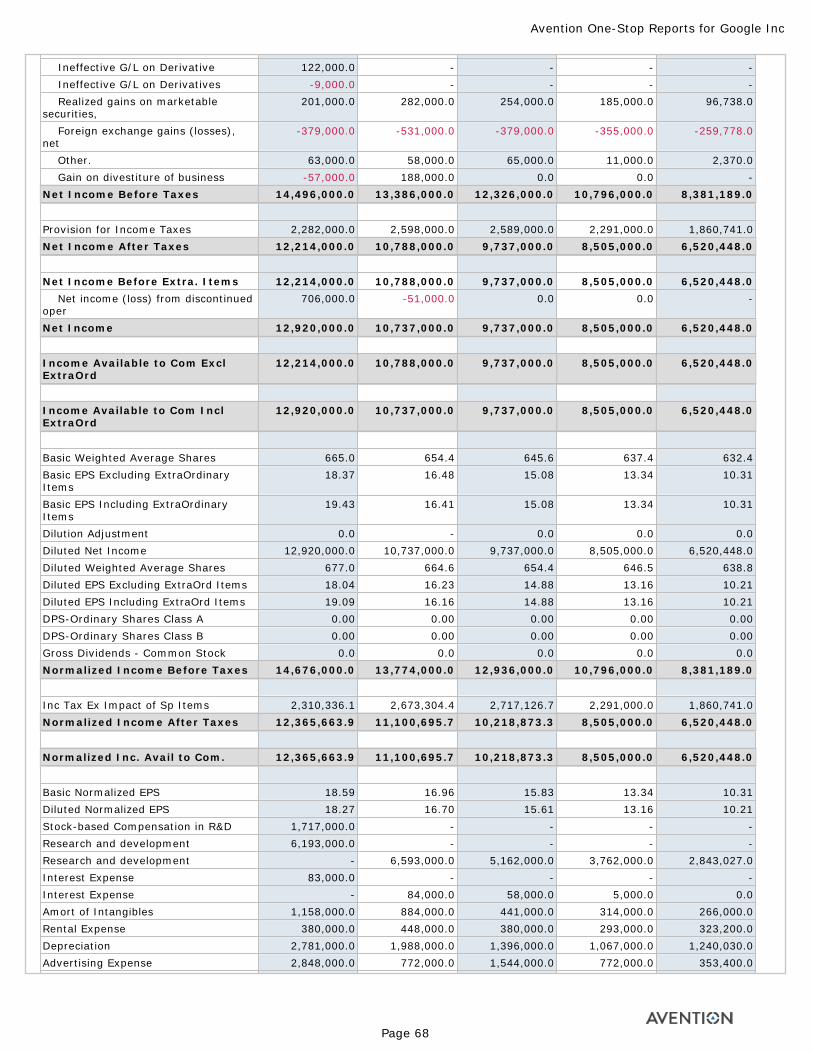
Ineffective G/L on Derivative 122,000.0 - - - - Ineffective G/L on Derivatives -9,000.0 - - - - Realized gains on marketable securities,
201,000.0 282,000.0 254,000.0 185,000.0 96,738.0
Foreign exchange gains (losses), net
-379,000.0 -531,000.0 -379,000.0 -355,000.0 -259,778.0
Other. 63,000.0 58,000.0 65,000.0 11,000.0 2,370.0 Gain on divestiture of business -57,000.0 188,000.0 0.0 0.0 -Net Income Before Taxes 14,496,000.0 13,386,000.0 12,326,000.0 10,796,000.0 8,381,189.0
Provision for Income Taxes 2,282,000.0 2,598,000.0 2,589,000.0 2,291,000.0 1,860,741.0Net Income After Taxes 12,214,000.0 10,788,000.0 9,737,000.0 8,505,000.0 6,520,448.0
Net Income Before Extra. Items 12,214,000.0 10,788,000.0 9,737,000.0 8,505,000.0 6,520,448.0 Net income (loss) from discontinued oper
706,000.0 -51,000.0 0.0 0.0 -
Net Income 12,920,000.0 10,737,000.0 9,737,000.0 8,505,000.0 6,520,448.0
Income Available to Com Excl ExtraOrd
12,214,000.0 10,788,000.0 9,737,000.0 8,505,000.0 6,520,448.0
Income Available to Com Incl ExtraOrd
12,920,000.0 10,737,000.0 9,737,000.0 8,505,000.0 6,520,448.0
Basic Weighted Average Shares 665.0 654.4 645.6 637.4 632.4Basic EPS Excluding ExtraOrdinary Items
18.37 16.48 15.08 13.34 10.31
Basic EPS Including ExtraOrdinary Items
19.43 16.41 15.08 13.34 10.31
Dilution Adjustment 0.0 - 0.0 0.0 0.0Diluted Net Income 12,920,000.0 10,737,000.0 9,737,000.0 8,505,000.0 6,520,448.0Diluted Weighted Average Shares 677.0 664.6 654.4 646.5 638.8Diluted EPS Excluding ExtraOrd Items 18.04 16.23 14.88 13.16 10.21Diluted EPS Including ExtraOrd Items 19.09 16.16 14.88 13.16 10.21DPS-Ordinary Shares Class A 0.00 0.00 0.00 0.00 0.00DPS-Ordinary Shares Class B 0.00 0.00 0.00 0.00 0.00Gross Dividends - Common Stock 0.0 0.0 0.0 0.0 0.0Normalized Income Before Taxes 14,676,000.0 13,774,000.0 12,936,000.0 10,796,000.0 8,381,189.0
Inc Tax Ex Impact of Sp Items 2,310,336.1 2,673,304.4 2,717,126.7 2,291,000.0 1,860,741.0Normalized Income After Taxes 12,365,663.9 11,100,695.7 10,218,873.3 8,505,000.0 6,520,448.0
Normalized Inc. Avail to Com. 12,365,663.9 11,100,695.7 10,218,873.3 8,505,000.0 6,520,448.0
Basic Normalized EPS 18.59 16.96 15.83 13.34 10.31Diluted Normalized EPS 18.27 16.70 15.61 13.16 10.21Stock-based Compensation in R&D 1,717,000.0 - - - -Research and development 6,193,000.0 - - - -Research and development - 6,593,000.0 5,162,000.0 3,762,000.0 2,843,027.0Interest Expense 83,000.0 - - - -Interest Expense - 84,000.0 58,000.0 5,000.0 0.0Amort of Intangibles 1,158,000.0 884,000.0 441,000.0 314,000.0 266,000.0Rental Expense 380,000.0 448,000.0 380,000.0 293,000.0 323,200.0Depreciation 2,781,000.0 1,988,000.0 1,396,000.0 1,067,000.0 1,240,030.0Advertising Expense 2,848,000.0 772,000.0 1,544,000.0 772,000.0 353,400.0
Avention One-Stop Reports for Google Inc
Page 68
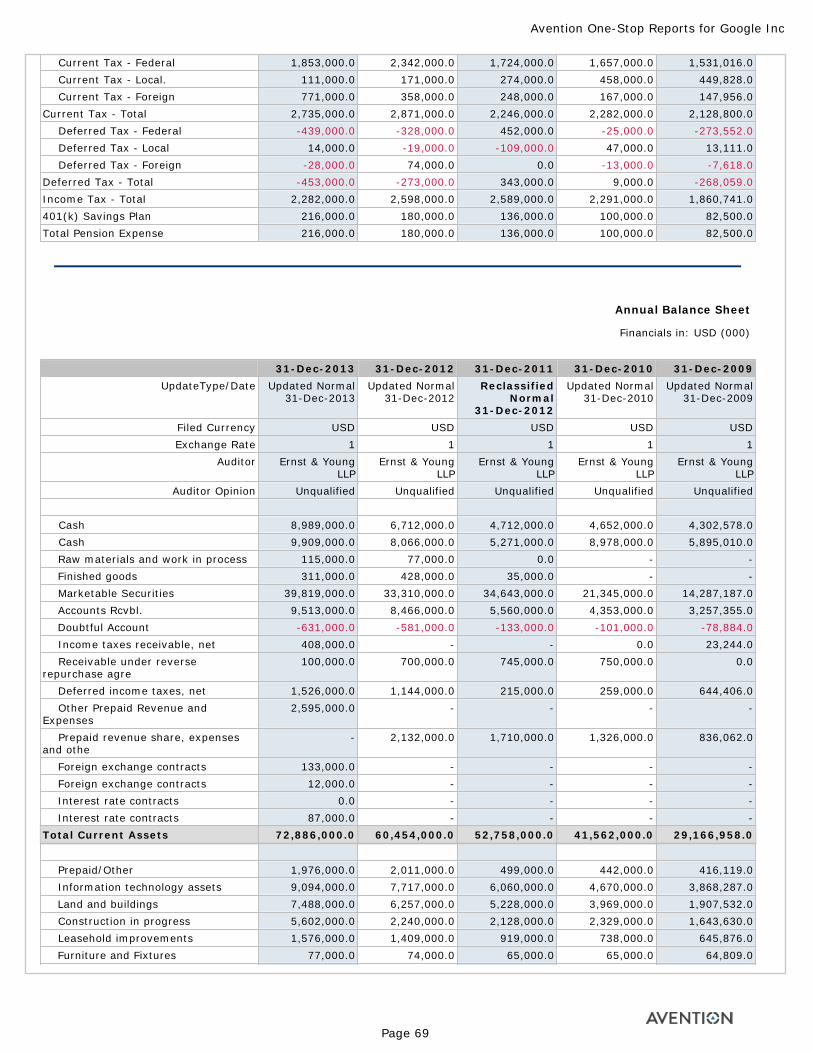
Current Tax - Federal 1,853,000.0 2,342,000.0 1,724,000.0 1,657,000.0 1,531,016.0 Current Tax - Local. 111,000.0 171,000.0 274,000.0 458,000.0 449,828.0 Current Tax - Foreign 771,000.0 358,000.0 248,000.0 167,000.0 147,956.0Current Tax - Total 2,735,000.0 2,871,000.0 2,246,000.0 2,282,000.0 2,128,800.0 Deferred Tax - Federal -439,000.0 -328,000.0 452,000.0 -25,000.0 -273,552.0 Deferred Tax - Local 14,000.0 -19,000.0 -109,000.0 47,000.0 13,111.0 Deferred Tax - Foreign -28,000.0 74,000.0 0.0 -13,000.0 -7,618.0Deferred Tax - Total -453,000.0 -273,000.0 343,000.0 9,000.0 -268,059.0Income Tax - Total 2,282,000.0 2,598,000.0 2,589,000.0 2,291,000.0 1,860,741.0401(k) Savings Plan 216,000.0 180,000.0 136,000.0 100,000.0 82,500.0Total Pension Expense 216,000.0 180,000.0 136,000.0 100,000.0 82,500.0
Annual Balance Sheet
Financials in: USD (000)
31-Dec-2013 31-Dec-2012 31-Dec-2011 31-Dec-2010 31-Dec-2009UpdateType/Date Updated Normal
31-Dec-2013Updated Normal
31-Dec-2012Reclassified
Normal 31-Dec-2012
Updated Normal 31-Dec-2010
Updated Normal 31-Dec-2009
Filed Currency USD USD USD USD USDExchange Rate 1 1 1 1 1
Auditor Ernst & Young LLP
Ernst & Young LLP
Ernst & Young LLP
Ernst & Young LLP
Ernst & Young LLP
Auditor Opinion Unqualified Unqualified Unqualified Unqualified Unqualified
Cash 8,989,000.0 6,712,000.0 4,712,000.0 4,652,000.0 4,302,578.0 Cash 9,909,000.0 8,066,000.0 5,271,000.0 8,978,000.0 5,895,010.0 Raw materials and work in process 115,000.0 77,000.0 0.0 - - Finished goods 311,000.0 428,000.0 35,000.0 - - Marketable Securities 39,819,000.0 33,310,000.0 34,643,000.0 21,345,000.0 14,287,187.0 Accounts Rcvbl. 9,513,000.0 8,466,000.0 5,560,000.0 4,353,000.0 3,257,355.0 Doubtful Account -631,000.0 -581,000.0 -133,000.0 -101,000.0 -78,884.0 Income taxes receivable, net 408,000.0 - - 0.0 23,244.0 Receivable under reverse repurchase agre
100,000.0 700,000.0 745,000.0 750,000.0 0.0
Deferred income taxes, net 1,526,000.0 1,144,000.0 215,000.0 259,000.0 644,406.0 Other Prepaid Revenue and Expenses
2,595,000.0 - - - -
Prepaid revenue share, expenses and othe
- 2,132,000.0 1,710,000.0 1,326,000.0 836,062.0
Foreign exchange contracts 133,000.0 - - - - Foreign exchange contracts 12,000.0 - - - - Interest rate contracts 0.0 - - - - Interest rate contracts 87,000.0 - - - -Total Current Assets 72,886,000.0 60,454,000.0 52,758,000.0 41,562,000.0 29,166,958.0
Prepaid/Other 1,976,000.0 2,011,000.0 499,000.0 442,000.0 416,119.0 Information technology assets 9,094,000.0 7,717,000.0 6,060,000.0 4,670,000.0 3,868,287.0 Land and buildings 7,488,000.0 6,257,000.0 5,228,000.0 3,969,000.0 1,907,532.0 Construction in progress 5,602,000.0 2,240,000.0 2,128,000.0 2,329,000.0 1,643,630.0 Leasehold improvements 1,576,000.0 1,409,000.0 919,000.0 738,000.0 645,876.0 Furniture and Fixtures 77,000.0 74,000.0 65,000.0 65,000.0 64,809.0
Avention One-Stop Reports for Google Inc
Page 69
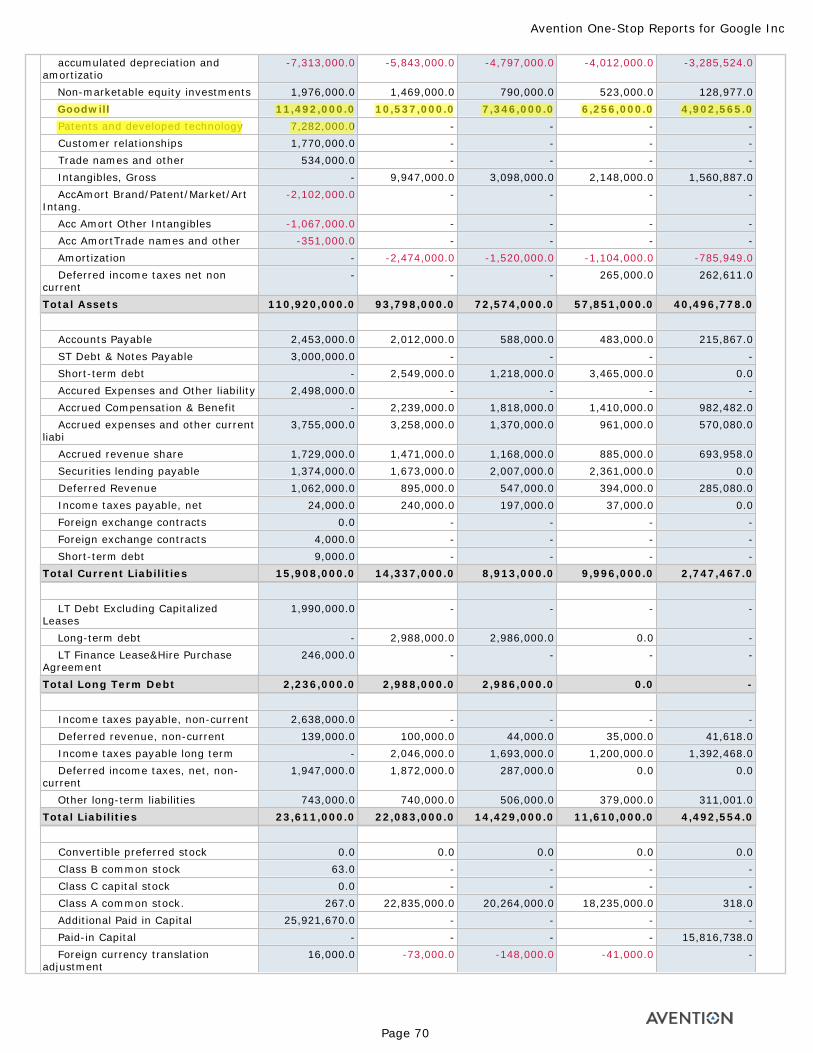
accumulated depreciation and amortizatio
-7,313,000.0 -5,843,000.0 -4,797,000.0 -4,012,000.0 -3,285,524.0
Non-marketable equity investments 1,976,000.0 1,469,000.0 790,000.0 523,000.0 128,977.0 Goodwill 11,492,000.0 10,537,000.0 7,346,000.0 6,256,000.0 4,902,565.0 Patents and developed technology 7,282,000.0 - - - - Customer relationships 1,770,000.0 - - - - Trade names and other 534,000.0 - - - - Intangibles, Gross - 9,947,000.0 3,098,000.0 2,148,000.0 1,560,887.0 AccAmort Brand/Patent/Market/Art Intang.
-2,102,000.0 - - - -
Acc Amort Other Intangibles -1,067,000.0 - - - - Acc AmortTrade names and other -351,000.0 - - - - Amortization - -2,474,000.0 -1,520,000.0 -1,104,000.0 -785,949.0 Deferred income taxes net non current
- - - 265,000.0 262,611.0
Total Assets 110,920,000.0 93,798,000.0 72,574,000.0 57,851,000.0 40,496,778.0
Accounts Payable 2,453,000.0 2,012,000.0 588,000.0 483,000.0 215,867.0 ST Debt & Notes Payable 3,000,000.0 - - - - Short-term debt - 2,549,000.0 1,218,000.0 3,465,000.0 0.0 Accured Expenses and Other liability 2,498,000.0 - - - - Accrued Compensation & Benefit - 2,239,000.0 1,818,000.0 1,410,000.0 982,482.0 Accrued expenses and other current liabi
3,755,000.0 3,258,000.0 1,370,000.0 961,000.0 570,080.0
Accrued revenue share 1,729,000.0 1,471,000.0 1,168,000.0 885,000.0 693,958.0 Securities lending payable 1,374,000.0 1,673,000.0 2,007,000.0 2,361,000.0 0.0 Deferred Revenue 1,062,000.0 895,000.0 547,000.0 394,000.0 285,080.0 Income taxes payable, net 24,000.0 240,000.0 197,000.0 37,000.0 0.0 Foreign exchange contracts 0.0 - - - - Foreign exchange contracts 4,000.0 - - - - Short-term debt 9,000.0 - - - -Total Current Liabilities 15,908,000.0 14,337,000.0 8,913,000.0 9,996,000.0 2,747,467.0
LT Debt Excluding Capitalized Leases
1,990,000.0 - - - -
Long-term debt - 2,988,000.0 2,986,000.0 0.0 - LT Finance Lease&Hire Purchase Agreement
246,000.0 - - - -
Total Long Term Debt 2,236,000.0 2,988,000.0 2,986,000.0 0.0 -
Income taxes payable, non-current 2,638,000.0 - - - - Deferred revenue, non-current 139,000.0 100,000.0 44,000.0 35,000.0 41,618.0 Income taxes payable long term - 2,046,000.0 1,693,000.0 1,200,000.0 1,392,468.0 Deferred income taxes, net, non-current
1,947,000.0 1,872,000.0 287,000.0 0.0 0.0
Other long-term liabilities 743,000.0 740,000.0 506,000.0 379,000.0 311,001.0Total Liabilities 23,611,000.0 22,083,000.0 14,429,000.0 11,610,000.0 4,492,554.0
Convertible preferred stock 0.0 0.0 0.0 0.0 0.0 Class B common stock 63.0 - - - - Class C capital stock 0.0 - - - - Class A common stock. 267.0 22,835,000.0 20,264,000.0 18,235,000.0 318.0 Additional Paid in Capital 25,921,670.0 - - - - Paid-in Capital - - - - 15,816,738.0 Foreign currency translation adjustment
16,000.0 -73,000.0 -148,000.0 -41,000.0 -
Avention One-Stop Reports for Google Inc
Page 70
Tahir
Highlight
Tahir
Highlight
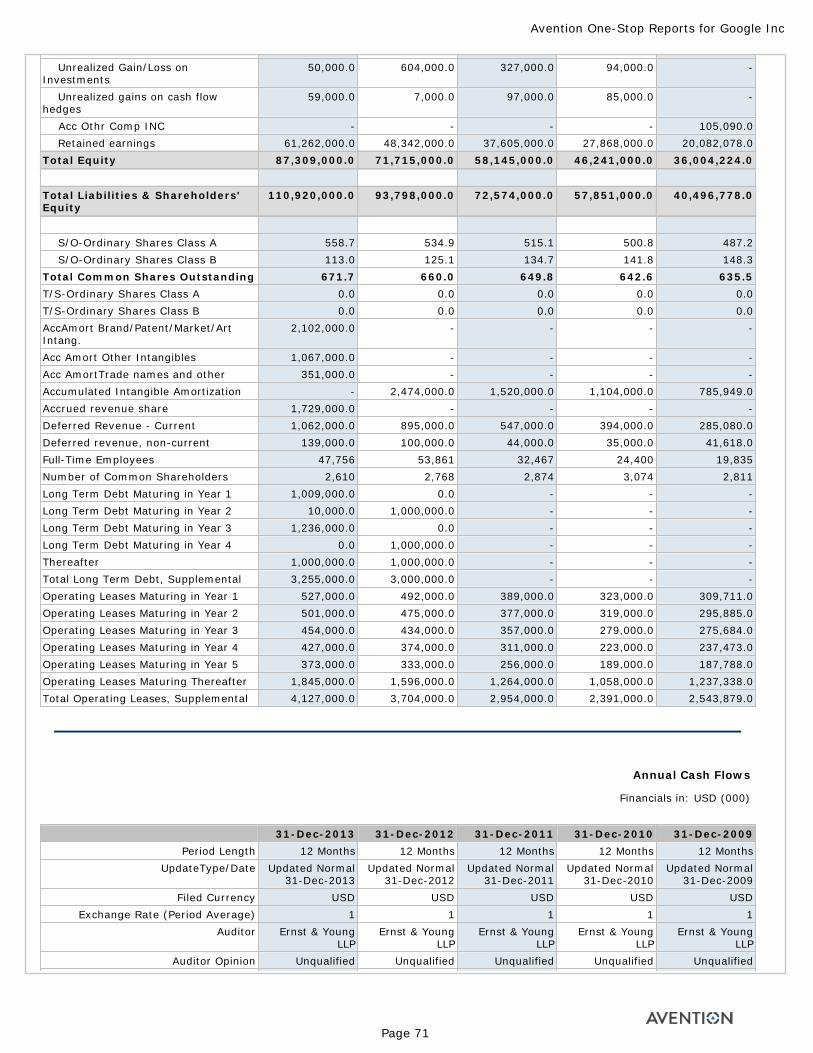
Unrealized Gain/Loss on Investments
50,000.0 604,000.0 327,000.0 94,000.0 -
Unrealized gains on cash flow hedges
59,000.0 7,000.0 97,000.0 85,000.0 -
Acc Othr Comp INC - - - - 105,090.0 Retained earnings 61,262,000.0 48,342,000.0 37,605,000.0 27,868,000.0 20,082,078.0Total Equity 87,309,000.0 71,715,000.0 58,145,000.0 46,241,000.0 36,004,224.0
Total Liabilities & Shareholders' Equity
110,920,000.0 93,798,000.0 72,574,000.0 57,851,000.0 40,496,778.0
S/O-Ordinary Shares Class A 558.7 534.9 515.1 500.8 487.2 S/O-Ordinary Shares Class B 113.0 125.1 134.7 141.8 148.3Total Common Shares Outstanding 671.7 660.0 649.8 642.6 635.5T/S-Ordinary Shares Class A 0.0 0.0 0.0 0.0 0.0T/S-Ordinary Shares Class B 0.0 0.0 0.0 0.0 0.0AccAmort Brand/Patent/Market/Art Intang.
2,102,000.0 - - - -
Acc Amort Other Intangibles 1,067,000.0 - - - -Acc AmortTrade names and other 351,000.0 - - - -Accumulated Intangible Amortization - 2,474,000.0 1,520,000.0 1,104,000.0 785,949.0Accrued revenue share 1,729,000.0 - - - -Deferred Revenue - Current 1,062,000.0 895,000.0 547,000.0 394,000.0 285,080.0Deferred revenue, non-current 139,000.0 100,000.0 44,000.0 35,000.0 41,618.0Full-Time Employees 47,756 53,861 32,467 24,400 19,835Number of Common Shareholders 2,610 2,768 2,874 3,074 2,811Long Term Debt Maturing in Year 1 1,009,000.0 0.0 - - -Long Term Debt Maturing in Year 2 10,000.0 1,000,000.0 - - -Long Term Debt Maturing in Year 3 1,236,000.0 0.0 - - -Long Term Debt Maturing in Year 4 0.0 1,000,000.0 - - -Thereafter 1,000,000.0 1,000,000.0 - - -Total Long Term Debt, Supplemental 3,255,000.0 3,000,000.0 - - -Operating Leases Maturing in Year 1 527,000.0 492,000.0 389,000.0 323,000.0 309,711.0Operating Leases Maturing in Year 2 501,000.0 475,000.0 377,000.0 319,000.0 295,885.0Operating Leases Maturing in Year 3 454,000.0 434,000.0 357,000.0 279,000.0 275,684.0Operating Leases Maturing in Year 4 427,000.0 374,000.0 311,000.0 223,000.0 237,473.0Operating Leases Maturing in Year 5 373,000.0 333,000.0 256,000.0 189,000.0 187,788.0Operating Leases Maturing Thereafter 1,845,000.0 1,596,000.0 1,264,000.0 1,058,000.0 1,237,338.0Total Operating Leases, Supplemental 4,127,000.0 3,704,000.0 2,954,000.0 2,391,000.0 2,543,879.0
Annual Cash Flows
Financials in: USD (000)
31-Dec-2013 31-Dec-2012 31-Dec-2011 31-Dec-2010 31-Dec-2009Period Length 12 Months 12 Months 12 Months 12 Months 12 Months
UpdateType/Date Updated Normal 31-Dec-2013
Updated Normal 31-Dec-2012
Updated Normal 31-Dec-2011
Updated Normal 31-Dec-2010
Updated Normal 31-Dec-2009
Filed Currency USD USD USD USD USDExchange Rate (Period Average) 1 1 1 1 1
Auditor Ernst & Young LLP
Ernst & Young LLP
Ernst & Young LLP
Ernst & Young LLP
Ernst & Young LLP
Auditor Opinion Unqualified Unqualified Unqualified Unqualified Unqualified
Avention One-Stop Reports for Google Inc
Page 71
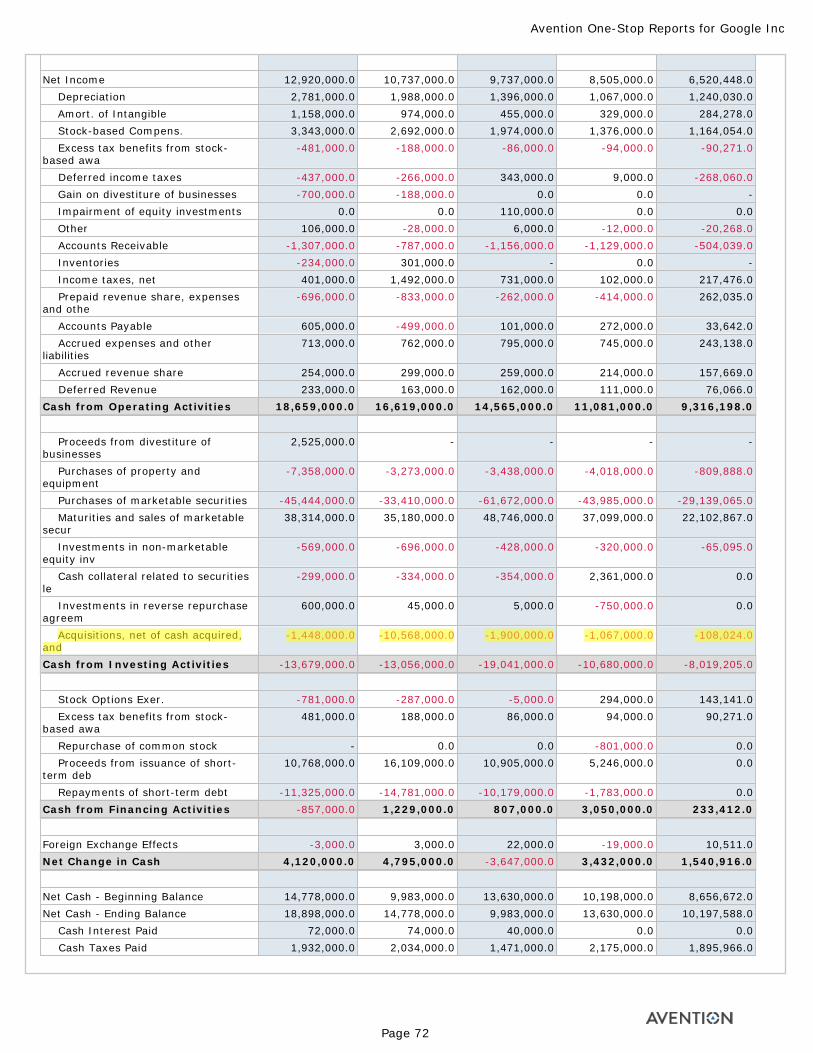
Net Income 12,920,000.0 10,737,000.0 9,737,000.0 8,505,000.0 6,520,448.0 Depreciation 2,781,000.0 1,988,000.0 1,396,000.0 1,067,000.0 1,240,030.0 Amort. of Intangible 1,158,000.0 974,000.0 455,000.0 329,000.0 284,278.0 Stock-based Compens. 3,343,000.0 2,692,000.0 1,974,000.0 1,376,000.0 1,164,054.0 Excess tax benefits from stock-based awa
-481,000.0 -188,000.0 -86,000.0 -94,000.0 -90,271.0
Deferred income taxes -437,000.0 -266,000.0 343,000.0 9,000.0 -268,060.0 Gain on divestiture of businesses -700,000.0 -188,000.0 0.0 0.0 - Impairment of equity investments 0.0 0.0 110,000.0 0.0 0.0 Other 106,000.0 -28,000.0 6,000.0 -12,000.0 -20,268.0 Accounts Receivable -1,307,000.0 -787,000.0 -1,156,000.0 -1,129,000.0 -504,039.0 Inventories -234,000.0 301,000.0 - 0.0 - Income taxes, net 401,000.0 1,492,000.0 731,000.0 102,000.0 217,476.0 Prepaid revenue share, expenses and othe
-696,000.0 -833,000.0 -262,000.0 -414,000.0 262,035.0
Accounts Payable 605,000.0 -499,000.0 101,000.0 272,000.0 33,642.0 Accrued expenses and other liabilities
713,000.0 762,000.0 795,000.0 745,000.0 243,138.0
Accrued revenue share 254,000.0 299,000.0 259,000.0 214,000.0 157,669.0 Deferred Revenue 233,000.0 163,000.0 162,000.0 111,000.0 76,066.0Cash from Operating Activities 18,659,000.0 16,619,000.0 14,565,000.0 11,081,000.0 9,316,198.0
Proceeds from divestiture of businesses
2,525,000.0 - - - -
Purchases of property and equipment
-7,358,000.0 -3,273,000.0 -3,438,000.0 -4,018,000.0 -809,888.0
Purchases of marketable securities -45,444,000.0 -33,410,000.0 -61,672,000.0 -43,985,000.0 -29,139,065.0 Maturities and sales of marketable secur
38,314,000.0 35,180,000.0 48,746,000.0 37,099,000.0 22,102,867.0
Investments in non-marketable equity inv
-569,000.0 -696,000.0 -428,000.0 -320,000.0 -65,095.0
Cash collateral related to securities le
-299,000.0 -334,000.0 -354,000.0 2,361,000.0 0.0
Investments in reverse repurchase agreem
600,000.0 45,000.0 5,000.0 -750,000.0 0.0
Acquisitions, net of cash acquired, and
-1,448,000.0 -10,568,000.0 -1,900,000.0 -1,067,000.0 -108,024.0
Cash from Investing Activities -13,679,000.0 -13,056,000.0 -19,041,000.0 -10,680,000.0 -8,019,205.0
Stock Options Exer. -781,000.0 -287,000.0 -5,000.0 294,000.0 143,141.0 Excess tax benefits from stock-based awa
481,000.0 188,000.0 86,000.0 94,000.0 90,271.0
Repurchase of common stock - 0.0 0.0 -801,000.0 0.0 Proceeds from issuance of short-term deb
10,768,000.0 16,109,000.0 10,905,000.0 5,246,000.0 0.0
Repayments of short-term debt -11,325,000.0 -14,781,000.0 -10,179,000.0 -1,783,000.0 0.0Cash from Financing Activities -857,000.0 1,229,000.0 807,000.0 3,050,000.0 233,412.0
Foreign Exchange Effects -3,000.0 3,000.0 22,000.0 -19,000.0 10,511.0Net Change in Cash 4,120,000.0 4,795,000.0 -3,647,000.0 3,432,000.0 1,540,916.0
Net Cash - Beginning Balance 14,778,000.0 9,983,000.0 13,630,000.0 10,198,000.0 8,656,672.0Net Cash - Ending Balance 18,898,000.0 14,778,000.0 9,983,000.0 13,630,000.0 10,197,588.0 Cash Interest Paid 72,000.0 74,000.0 40,000.0 0.0 0.0 Cash Taxes Paid 1,932,000.0 2,034,000.0 1,471,000.0 2,175,000.0 1,895,966.0
Avention One-Stop Reports for Google Inc
Page 72
Tahir
Highlight
© 1983-2014 Reuters Research Inc. All Rights Reserved. Published by Avention, Inc., September, 2014.
Avention One-Stop Reports for Google Inc
Page 73
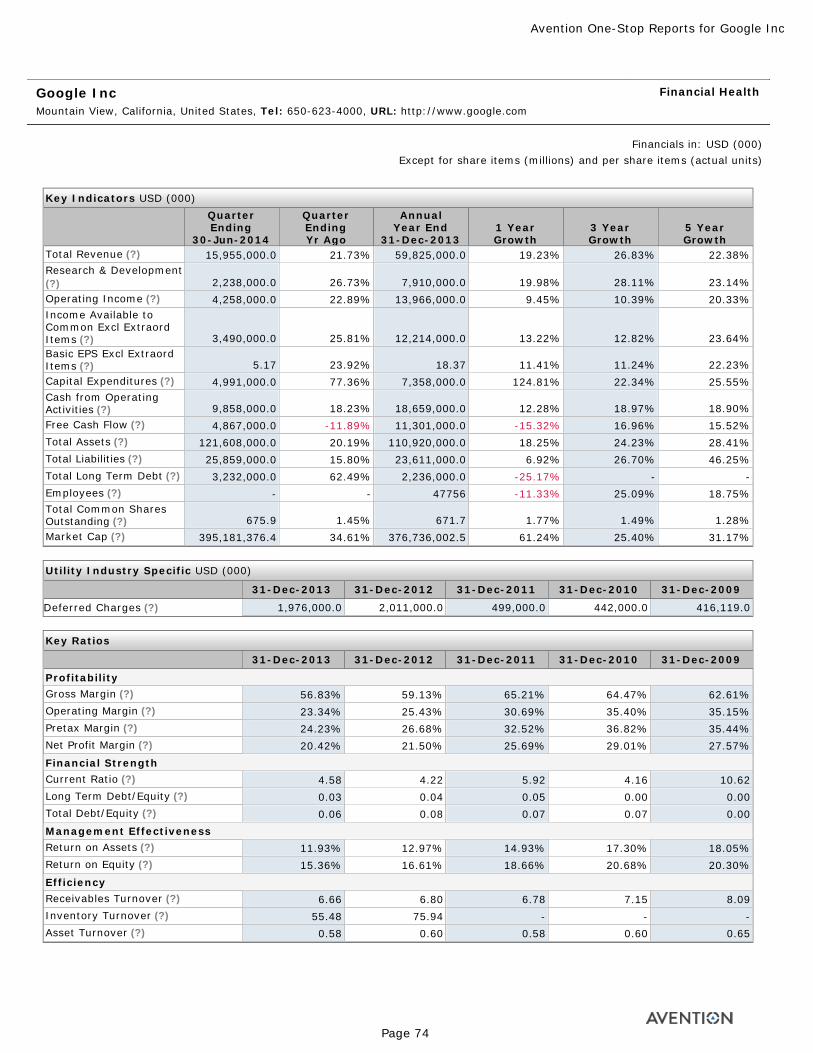
Google Inc Mountain View, California, United States, Tel: 650-623-4000, URL: http://www.google.com
Financial Health
Financials in: USD (000)Except for share items (millions) and per share items (actual units)
Key Indicators USD (000)
Total Revenue (?) 15,955,000.0 21.73% 59,825,000.0 19.23% 26.83% 22.38%Research & Development (?) 2,238,000.0 26.73% 7,910,000.0 19.98% 28.11% 23.14%Operating Income (?) 4,258,000.0 22.89% 13,966,000.0 9.45% 10.39% 20.33%Income Available to Common Excl Extraord Items (?) 3,490,000.0 25.81% 12,214,000.0 13.22% 12.82% 23.64%Basic EPS Excl Extraord Items (?) 5.17 23.92% 18.37 11.41% 11.24% 22.23%Capital Expenditures (?) 4,991,000.0 77.36% 7,358,000.0 124.81% 22.34% 25.55%Cash from Operating Activities (?) 9,858,000.0 18.23% 18,659,000.0 12.28% 18.97% 18.90%Free Cash Flow (?) 4,867,000.0 -11.89% 11,301,000.0 -15.32% 16.96% 15.52%Total Assets (?) 121,608,000.0 20.19% 110,920,000.0 18.25% 24.23% 28.41%Total Liabilities (?) 25,859,000.0 15.80% 23,611,000.0 6.92% 26.70% 46.25%Total Long Term Debt (?) 3,232,000.0 62.49% 2,236,000.0 -25.17% - -Employees (?) - - 47756 -11.33% 25.09% 18.75%Total Common Shares Outstanding (?) 675.9 1.45% 671.7 1.77% 1.49% 1.28%Market Cap (?) 395,181,376.4 34.61% 376,736,002.5 61.24% 25.40% 31.17%
Utility Industry Specific USD (000)
Deferred Charges (?) 1,976,000.0 2,011,000.0 499,000.0 442,000.0 416,119.0
Key Ratios
Profitability Gross Margin (?) 56.83% 59.13% 65.21% 64.47% 62.61%Operating Margin (?) 23.34% 25.43% 30.69% 35.40% 35.15%Pretax Margin (?) 24.23% 26.68% 32.52% 36.82% 35.44%Net Profit Margin (?) 20.42% 21.50% 25.69% 29.01% 27.57%Financial Strength Current Ratio (?) 4.58 4.22 5.92 4.16 10.62Long Term Debt/Equity (?) 0.03 0.04 0.05 0.00 0.00Total Debt/Equity (?) 0.06 0.08 0.07 0.07 0.00Management Effectiveness Return on Assets (?) 11.93% 12.97% 14.93% 17.30% 18.05%Return on Equity (?) 15.36% 16.61% 18.66% 20.68% 20.30%Efficiency Receivables Turnover (?) 6.66 6.80 6.78 7.15 8.09Inventory Turnover (?) 55.48 75.94 - - -Asset Turnover (?) 0.58 0.60 0.58 0.60 0.65
Quarter Ending
30-Jun-2014
Quarter Ending Yr Ago
Annual Year End
31-Dec-2013 1 Year Growth
3 Year Growth
5 Year Growth
31-Dec-2013 31-Dec-2012 31-Dec-2011 31-Dec-2010 31-Dec-2009
31-Dec-2013 31-Dec-2012 31-Dec-2011 31-Dec-2010 31-Dec-2009
Avention One-Stop Reports for Google Inc
Page 74
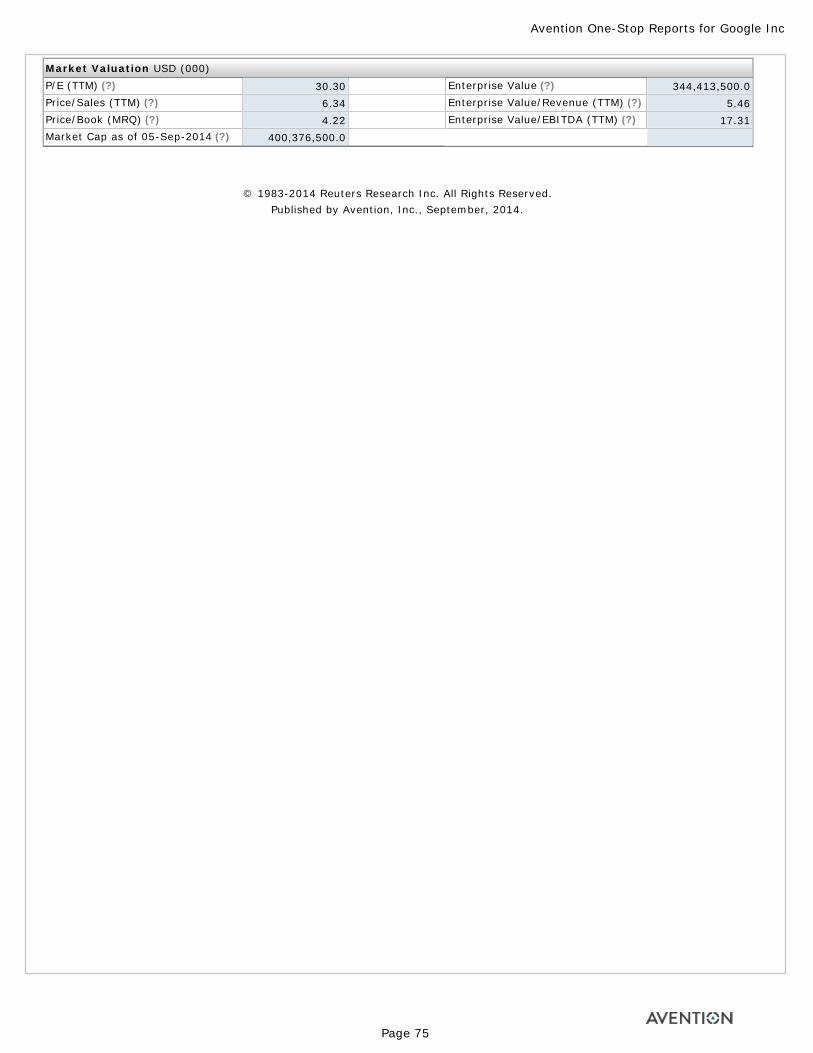
Market Valuation USD (000)P/E (TTM) (?) 30.30 . Enterprise Value (?) 344,413,500.0Price/Sales (TTM) (?) 6.34 . Enterprise Value/Revenue (TTM) (?) 5.46Price/Book (MRQ) (?) 4.22 . Enterprise Value/EBITDA (TTM) (?) 17.31Market Cap as of 05-Sep-2014 (?) 400,376,500.0 .
© 1983-2014 Reuters Research Inc. All Rights Reserved. Published by Avention, Inc., September, 2014.
Avention One-Stop Reports for Google Inc
Page 75
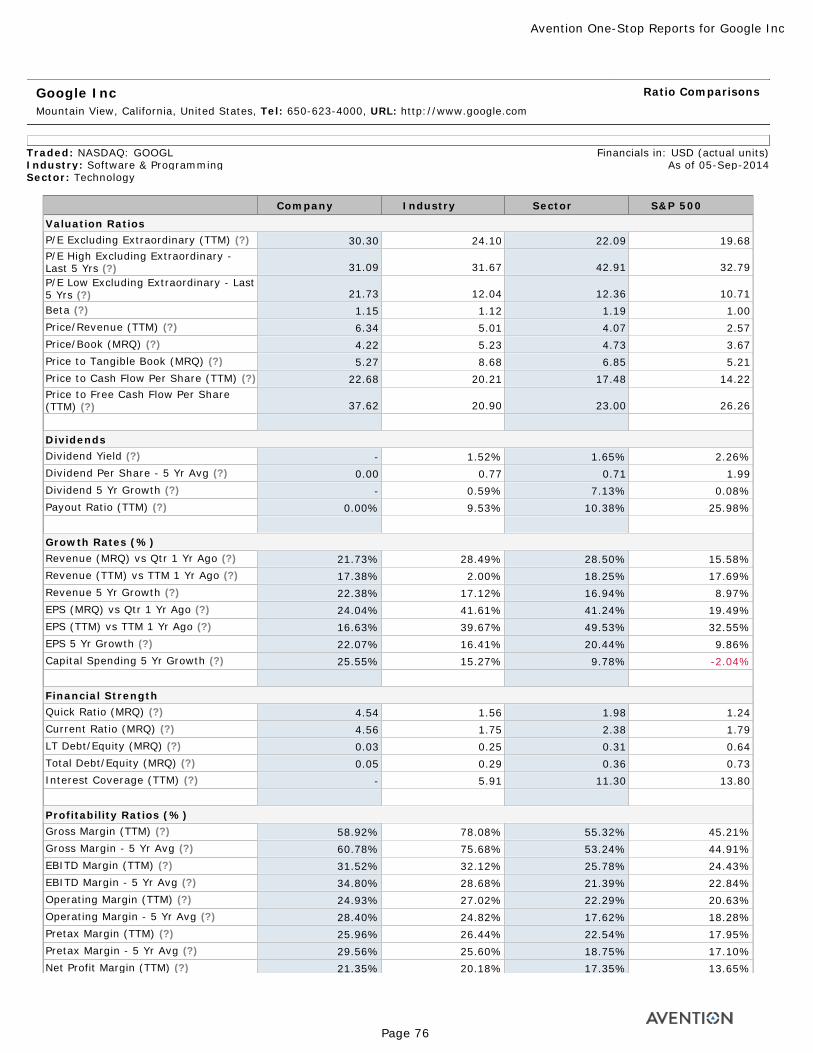
Google Inc Mountain View, California, United States, Tel: 650-623-4000, URL: http://www.google.com
Ratio Comparisons
Traded: NASDAQ: GOOGL Financials in: USD (actual units)Industry: Software & Programming As of 05-Sep-2014Sector: Technology
Valuation RatiosP/E Excluding Extraordinary (TTM) (?) 30.30 24.10 22.09 19.68P/E High Excluding Extraordinary - Last 5 Yrs (?) 31.09 31.67 42.91 32.79P/E Low Excluding Extraordinary - Last 5 Yrs (?) 21.73 12.04 12.36 10.71Beta (?) 1.15 1.12 1.19 1.00Price/Revenue (TTM) (?) 6.34 5.01 4.07 2.57Price/Book (MRQ) (?) 4.22 5.23 4.73 3.67Price to Tangible Book (MRQ) (?) 5.27 8.68 6.85 5.21Price to Cash Flow Per Share (TTM) (?) 22.68 20.21 17.48 14.22Price to Free Cash Flow Per Share (TTM) (?) 37.62 20.90 23.00 26.26 DividendsDividend Yield (?) - 1.52% 1.65% 2.26%Dividend Per Share - 5 Yr Avg (?) 0.00 0.77 0.71 1.99Dividend 5 Yr Growth (?) - 0.59% 7.13% 0.08%Payout Ratio (TTM) (?) 0.00% 9.53% 10.38% 25.98% Growth Rates (%)Revenue (MRQ) vs Qtr 1 Yr Ago (?) 21.73% 28.49% 28.50% 15.58%Revenue (TTM) vs TTM 1 Yr Ago (?) 17.38% 2.00% 18.25% 17.69%Revenue 5 Yr Growth (?) 22.38% 17.12% 16.94% 8.97%EPS (MRQ) vs Qtr 1 Yr Ago (?) 24.04% 41.61% 41.24% 19.49%EPS (TTM) vs TTM 1 Yr Ago (?) 16.63% 39.67% 49.53% 32.55%EPS 5 Yr Growth (?) 22.07% 16.41% 20.44% 9.86%Capital Spending 5 Yr Growth (?) 25.55% 15.27% 9.78% -2.04% Financial StrengthQuick Ratio (MRQ) (?) 4.54 1.56 1.98 1.24Current Ratio (MRQ) (?) 4.56 1.75 2.38 1.79LT Debt/Equity (MRQ) (?) 0.03 0.25 0.31 0.64Total Debt/Equity (MRQ) (?) 0.05 0.29 0.36 0.73Interest Coverage (TTM) (?) - 5.91 11.30 13.80 Profitability Ratios (%)Gross Margin (TTM) (?) 58.92% 78.08% 55.32% 45.21%Gross Margin - 5 Yr Avg (?) 60.78% 75.68% 53.24% 44.91%EBITD Margin (TTM) (?) 31.52% 32.12% 25.78% 24.43%EBITD Margin - 5 Yr Avg (?) 34.80% 28.68% 21.39% 22.84%Operating Margin (TTM) (?) 24.93% 27.02% 22.29% 20.63%Operating Margin - 5 Yr Avg (?) 28.40% 24.82% 17.62% 18.28%Pretax Margin (TTM) (?) 25.96% 26.44% 22.54% 17.95%Pretax Margin - 5 Yr Avg (?) 29.56% 25.60% 18.75% 17.10%Net Profit Margin (TTM) (?) 21.35% 20.18% 17.35% 13.65%
Company Industry Sector S&P 500
Avention One-Stop Reports for Google Inc
Page 76
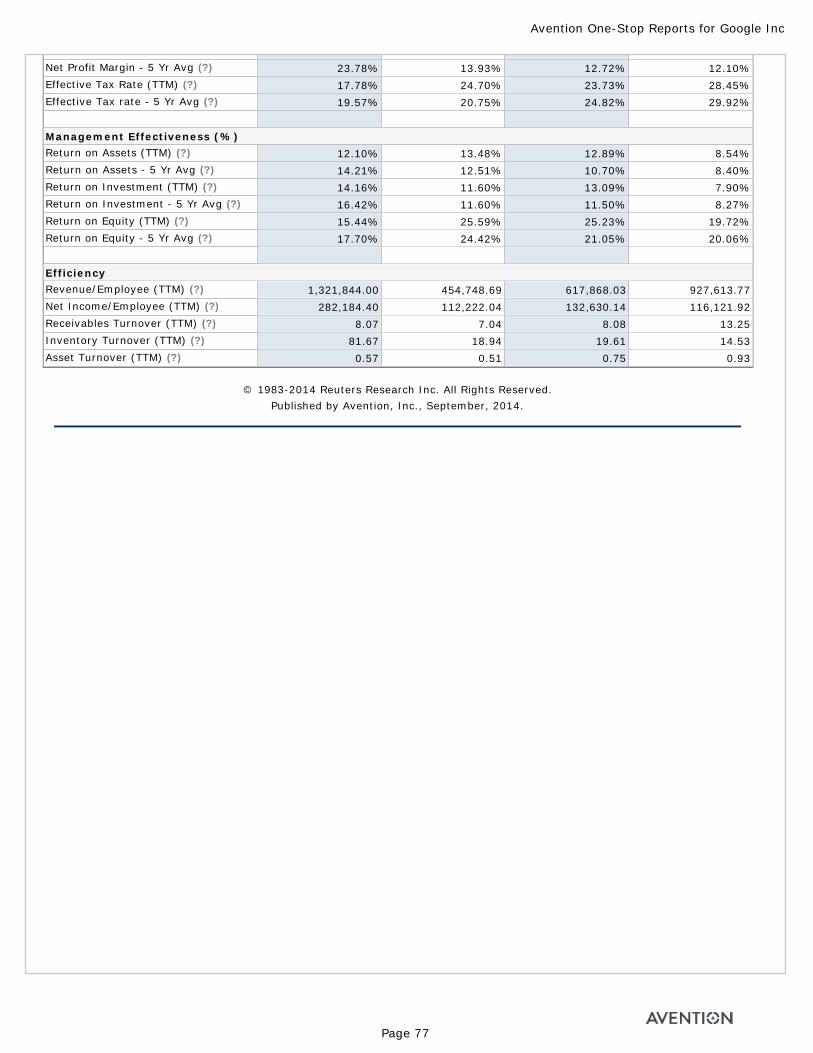
Net Profit Margin - 5 Yr Avg (?) 23.78% 13.93% 12.72% 12.10%Effective Tax Rate (TTM) (?) 17.78% 24.70% 23.73% 28.45%Effective Tax rate - 5 Yr Avg (?) 19.57% 20.75% 24.82% 29.92% Management Effectiveness (%)Return on Assets (TTM) (?) 12.10% 13.48% 12.89% 8.54%Return on Assets - 5 Yr Avg (?) 14.21% 12.51% 10.70% 8.40%Return on Investment (TTM) (?) 14.16% 11.60% 13.09% 7.90%Return on Investment - 5 Yr Avg (?) 16.42% 11.60% 11.50% 8.27%Return on Equity (TTM) (?) 15.44% 25.59% 25.23% 19.72%Return on Equity - 5 Yr Avg (?) 17.70% 24.42% 21.05% 20.06% EfficiencyRevenue/Employee (TTM) (?) 1,321,844.00 454,748.69 617,868.03 927,613.77Net Income/Employee (TTM) (?) 282,184.40 112,222.04 132,630.14 116,121.92Receivables Turnover (TTM) (?) 8.07 7.04 8.08 13.25Inventory Turnover (TTM) (?) 81.67 18.94 19.61 14.53Asset Turnover (TTM) (?) 0.57 0.51 0.75 0.93
© 1983-2014 Reuters Research Inc. All Rights Reserved. Published by Avention, Inc., September, 2014.
Avention One-Stop Reports for Google Inc
Page 77
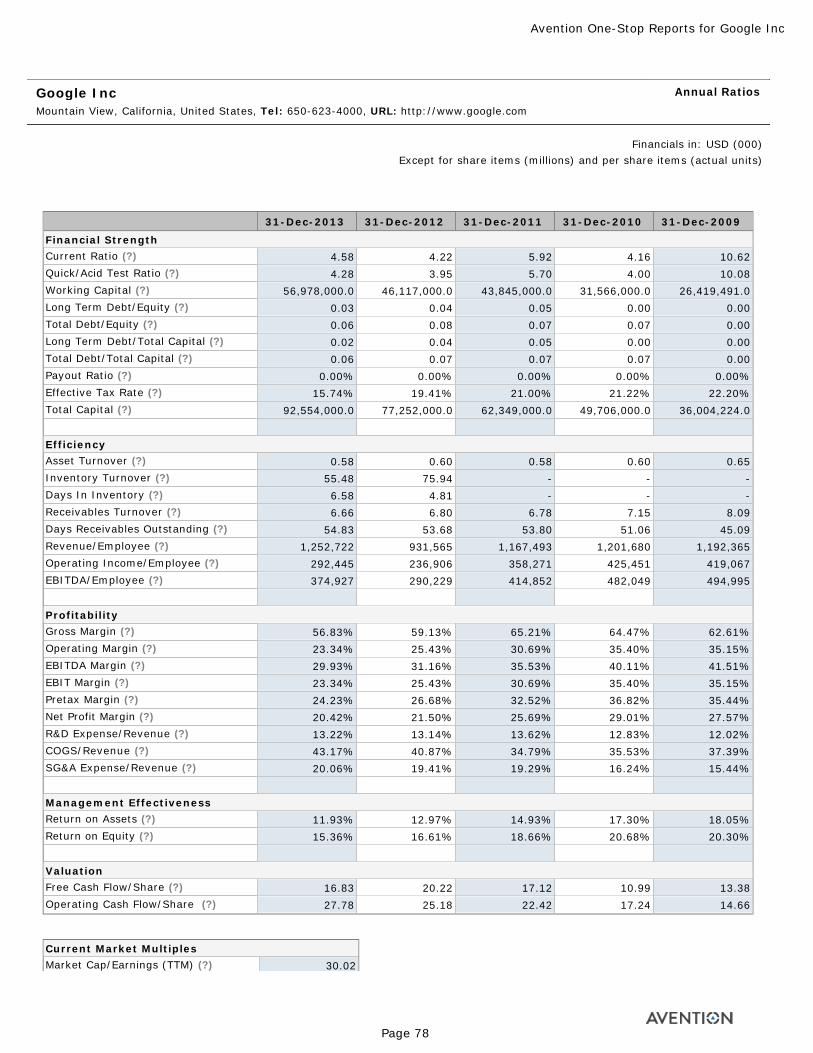
Google Inc Mountain View, California, United States, Tel: 650-623-4000, URL: http://www.google.com
Annual Ratios
Financials in: USD (000)Except for share items (millions) and per share items (actual units)
Financial StrengthCurrent Ratio (?) 4.58 4.22 5.92 4.16 10.62Quick/Acid Test Ratio (?) 4.28 3.95 5.70 4.00 10.08Working Capital (?) 56,978,000.0 46,117,000.0 43,845,000.0 31,566,000.0 26,419,491.0Long Term Debt/Equity (?) 0.03 0.04 0.05 0.00 0.00Total Debt/Equity (?) 0.06 0.08 0.07 0.07 0.00Long Term Debt/Total Capital (?) 0.02 0.04 0.05 0.00 0.00Total Debt/Total Capital (?) 0.06 0.07 0.07 0.07 0.00Payout Ratio (?) 0.00% 0.00% 0.00% 0.00% 0.00%Effective Tax Rate (?) 15.74% 19.41% 21.00% 21.22% 22.20%Total Capital (?) 92,554,000.0 77,252,000.0 62,349,000.0 49,706,000.0 36,004,224.0 EfficiencyAsset Turnover (?) 0.58 0.60 0.58 0.60 0.65Inventory Turnover (?) 55.48 75.94 - - -Days In Inventory (?) 6.58 4.81 - - -Receivables Turnover (?) 6.66 6.80 6.78 7.15 8.09Days Receivables Outstanding (?) 54.83 53.68 53.80 51.06 45.09Revenue/Employee (?) 1,252,722 931,565 1,167,493 1,201,680 1,192,365Operating Income/Employee (?) 292,445 236,906 358,271 425,451 419,067EBITDA/Employee (?) 374,927 290,229 414,852 482,049 494,995 ProfitabilityGross Margin (?) 56.83% 59.13% 65.21% 64.47% 62.61%Operating Margin (?) 23.34% 25.43% 30.69% 35.40% 35.15%EBITDA Margin (?) 29.93% 31.16% 35.53% 40.11% 41.51%EBIT Margin (?) 23.34% 25.43% 30.69% 35.40% 35.15%Pretax Margin (?) 24.23% 26.68% 32.52% 36.82% 35.44%Net Profit Margin (?) 20.42% 21.50% 25.69% 29.01% 27.57%R&D Expense/Revenue (?) 13.22% 13.14% 13.62% 12.83% 12.02%COGS/Revenue (?) 43.17% 40.87% 34.79% 35.53% 37.39%SG&A Expense/Revenue (?) 20.06% 19.41% 19.29% 16.24% 15.44% Management EffectivenessReturn on Assets (?) 11.93% 12.97% 14.93% 17.30% 18.05%Return on Equity (?) 15.36% 16.61% 18.66% 20.68% 20.30% ValuationFree Cash Flow/Share (?) 16.83 20.22 17.12 10.99 13.38Operating Cash Flow/Share (?) 27.78 25.18 22.42 17.24 14.66 Current Market MultiplesMarket Cap/Earnings (TTM) (?) 30.02
31-Dec-2013 31-Dec-2012 31-Dec-2011 31-Dec-2010 31-Dec-2009
Avention One-Stop Reports for Google Inc
Page 78
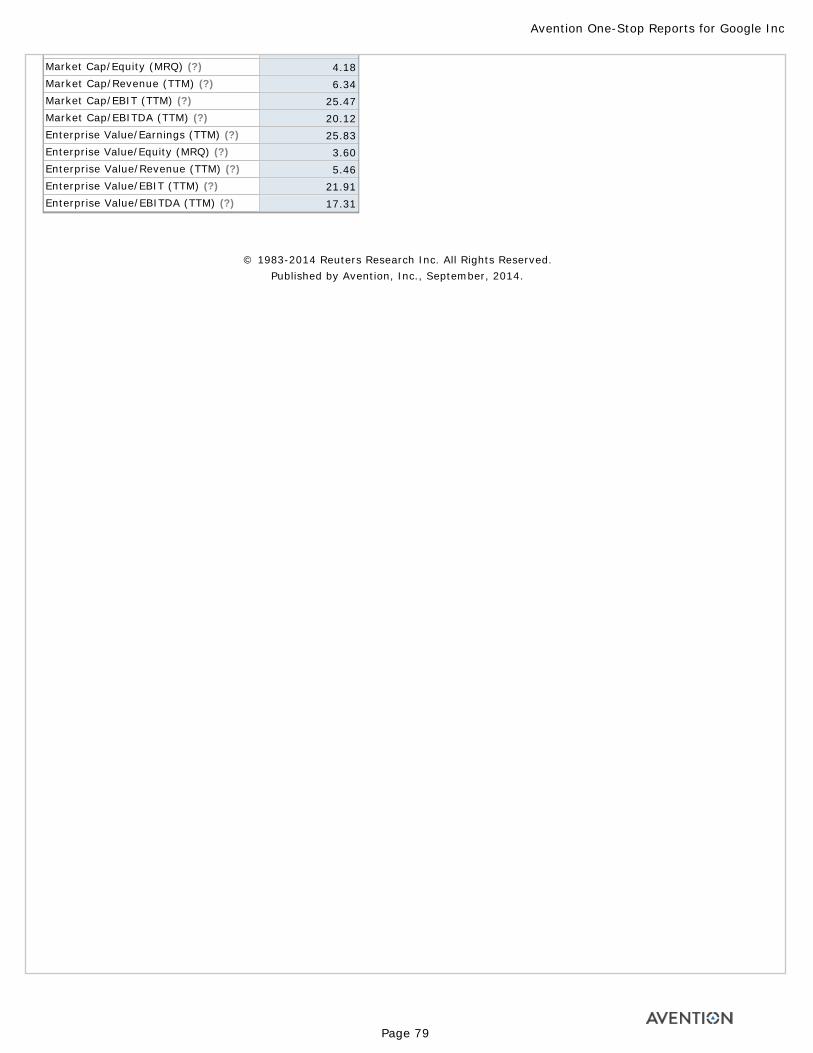
Market Cap/Equity (MRQ) (?) 4.18Market Cap/Revenue (TTM) (?) 6.34Market Cap/EBIT (TTM) (?) 25.47Market Cap/EBITDA (TTM) (?) 20.12Enterprise Value/Earnings (TTM) (?) 25.83Enterprise Value/Equity (MRQ) (?) 3.60Enterprise Value/Revenue (TTM) (?) 5.46Enterprise Value/EBIT (TTM) (?) 21.91Enterprise Value/EBITDA (TTM) (?) 17.31
© 1983-2014 Reuters Research Inc. All Rights Reserved. Published by Avention, Inc., September, 2014.
Avention One-Stop Reports for Google Inc
Page 79
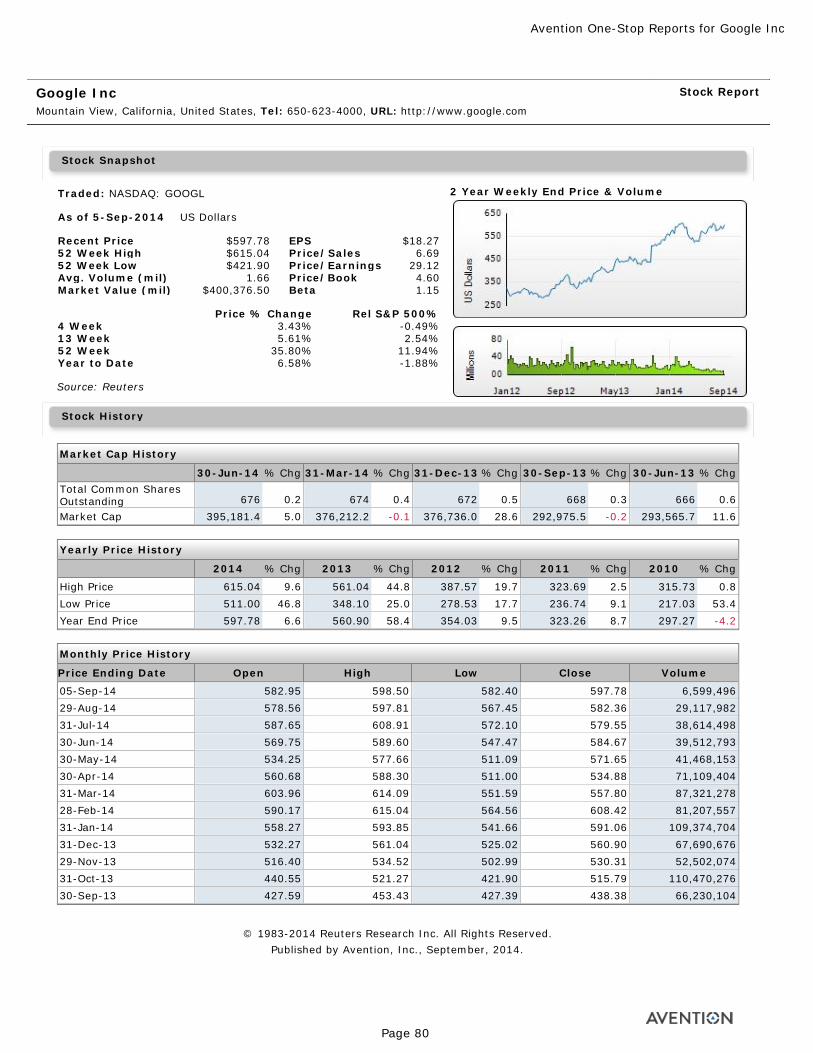
Google Inc Mountain View, California, United States, Tel: 650-623-4000, URL: http://www.google.com
Stock Report
Traded: NASDAQ: GOOGL
As of 5-Sep-2014 US Dollars
Recent Price $597.78 EPS $18.2752 Week High $615.04 Price/Sales 6.6952 Week Low $421.90 Price/Earnings 29.12Avg. Volume (mil) 1.66 Price/Book 4.60Market Value (mil) $400,376.50 Beta 1.15
Price % Change Rel S&P 500%4 Week 3.43% -0.49%13 Week 5.61% 2.54%52 Week 35.80% 11.94%Year to Date 6.58% -1.88%
Source: Reuters
2 Year Weekly End Price & Volume
Market Cap History
Total Common Shares Outstanding 676 0.2 674 0.4 672 0.5 668 0.3 666 0.6Market Cap 395,181.4 5.0 376,212.2 -0.1 376,736.0 28.6 292,975.5 -0.2 293,565.7 11.6
Yearly Price History
High Price 615.04 9.6 561.04 44.8 387.57 19.7 323.69 2.5 315.73 0.8Low Price 511.00 46.8 348.10 25.0 278.53 17.7 236.74 9.1 217.03 53.4Year End Price 597.78 6.6 560.90 58.4 354.03 9.5 323.26 8.7 297.27 -4.2
Monthly Price History
05-Sep-14 582.95 598.50 582.40 597.78 6,599,49629-Aug-14 578.56 597.81 567.45 582.36 29,117,98231-Jul-14 587.65 608.91 572.10 579.55 38,614,49830-Jun-14 569.75 589.60 547.47 584.67 39,512,79330-May-14 534.25 577.66 511.09 571.65 41,468,15330-Apr-14 560.68 588.30 511.00 534.88 71,109,40431-Mar-14 603.96 614.09 551.59 557.80 87,321,27828-Feb-14 590.17 615.04 564.56 608.42 81,207,55731-Jan-14 558.27 593.85 541.66 591.06 109,374,70431-Dec-13 532.27 561.04 525.02 560.90 67,690,67629-Nov-13 516.40 534.52 502.99 530.31 52,502,07431-Oct-13 440.55 521.27 421.90 515.79 110,470,27630-Sep-13 427.59 453.43 427.39 438.38 66,230,104
© 1983-2014 Reuters Research Inc. All Rights Reserved. Published by Avention, Inc., September, 2014.
Stock Snapshot
Stock History
30-Jun-14 % Chg 31-Mar-14 % Chg 31-Dec-13 % Chg 30-Sep-13 % Chg 30-Jun-13 % Chg
2014 % Chg 2013 % Chg 2012 % Chg 2011 % Chg 2010 % Chg
Price Ending Date Open High Low Close Volume
Avention One-Stop Reports for Google Inc
Page 80

Avention One-Stop Reports for Google Inc
Page 81
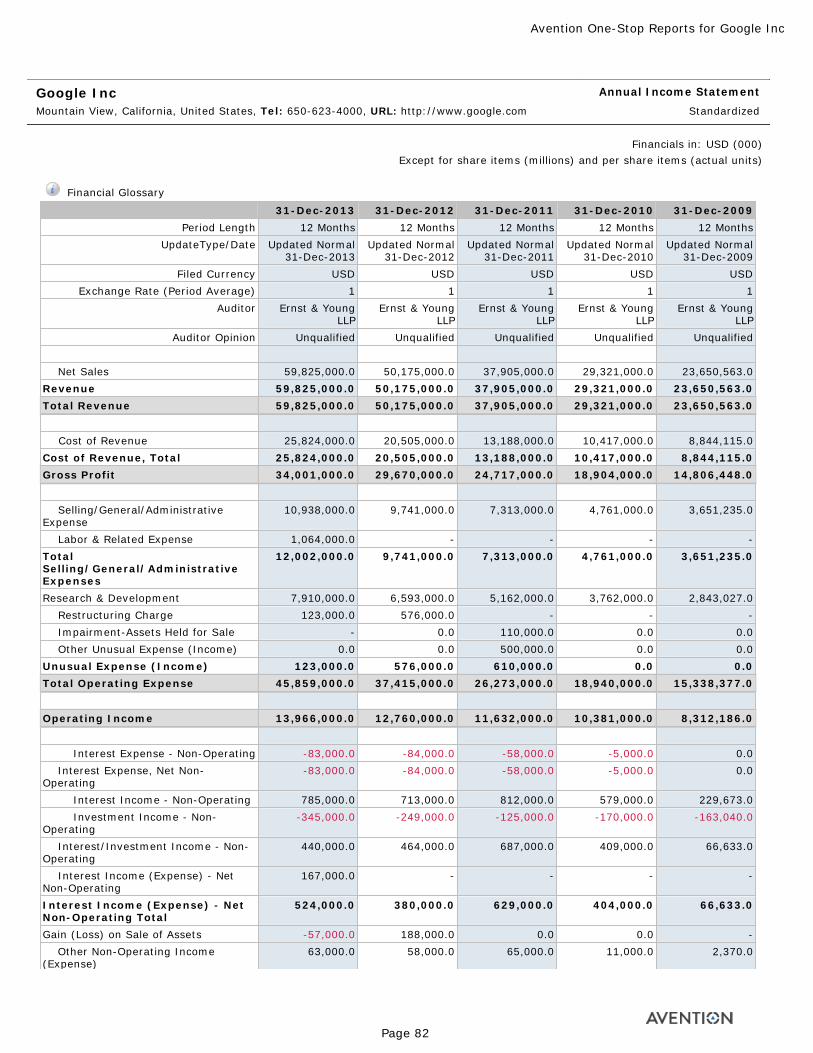
Google Inc Mountain View, California, United States, Tel: 650-623-4000, URL: http://www.google.com
Annual Income Statement
Standardized
Financials in: USD (000)Except for share items (millions) and per share items (actual units)
Financial Glossary
31-Dec-2013 31-Dec-2012 31-Dec-2011 31-Dec-2010 31-Dec-2009Period Length 12 Months 12 Months 12 Months 12 Months 12 Months
UpdateType/Date Updated Normal 31-Dec-2013
Updated Normal 31-Dec-2012
Updated Normal 31-Dec-2011
Updated Normal 31-Dec-2010
Updated Normal 31-Dec-2009
Filed Currency USD USD USD USD USDExchange Rate (Period Average) 1 1 1 1 1
Auditor Ernst & Young LLP
Ernst & Young LLP
Ernst & Young LLP
Ernst & Young LLP
Ernst & Young LLP
Auditor Opinion Unqualified Unqualified Unqualified Unqualified Unqualified Net Sales 59,825,000.0 50,175,000.0 37,905,000.0 29,321,000.0 23,650,563.0Revenue 59,825,000.0 50,175,000.0 37,905,000.0 29,321,000.0 23,650,563.0Total Revenue 59,825,000.0 50,175,000.0 37,905,000.0 29,321,000.0 23,650,563.0
Cost of Revenue 25,824,000.0 20,505,000.0 13,188,000.0 10,417,000.0 8,844,115.0Cost of Revenue, Total 25,824,000.0 20,505,000.0 13,188,000.0 10,417,000.0 8,844,115.0Gross Profit 34,001,000.0 29,670,000.0 24,717,000.0 18,904,000.0 14,806,448.0
Selling/General/Administrative Expense
10,938,000.0 9,741,000.0 7,313,000.0 4,761,000.0 3,651,235.0
Labor & Related Expense 1,064,000.0 - - - -Total Selling/General/Administrative Expenses
12,002,000.0 9,741,000.0 7,313,000.0 4,761,000.0 3,651,235.0
Research & Development 7,910,000.0 6,593,000.0 5,162,000.0 3,762,000.0 2,843,027.0 Restructuring Charge 123,000.0 576,000.0 - - - Impairment-Assets Held for Sale - 0.0 110,000.0 0.0 0.0 Other Unusual Expense (Income) 0.0 0.0 500,000.0 0.0 0.0Unusual Expense (Income) 123,000.0 576,000.0 610,000.0 0.0 0.0Total Operating Expense 45,859,000.0 37,415,000.0 26,273,000.0 18,940,000.0 15,338,377.0
Operating Income 13,966,000.0 12,760,000.0 11,632,000.0 10,381,000.0 8,312,186.0
Interest Expense - Non-Operating -83,000.0 -84,000.0 -58,000.0 -5,000.0 0.0 Interest Expense, Net Non-Operating
-83,000.0 -84,000.0 -58,000.0 -5,000.0 0.0
Interest Income - Non-Operating 785,000.0 713,000.0 812,000.0 579,000.0 229,673.0 Investment Income - Non-Operating
-345,000.0 -249,000.0 -125,000.0 -170,000.0 -163,040.0
Interest/Investment Income - Non-Operating
440,000.0 464,000.0 687,000.0 409,000.0 66,633.0
Interest Income (Expense) - Net Non-Operating
167,000.0 - - - -
Interest Income (Expense) - Net Non-Operating Total
524,000.0 380,000.0 629,000.0 404,000.0 66,633.0
Gain (Loss) on Sale of Assets -57,000.0 188,000.0 0.0 0.0 - Other Non-Operating Income (Expense)
63,000.0 58,000.0 65,000.0 11,000.0 2,370.0
Avention One-Stop Reports for Google Inc
Page 82
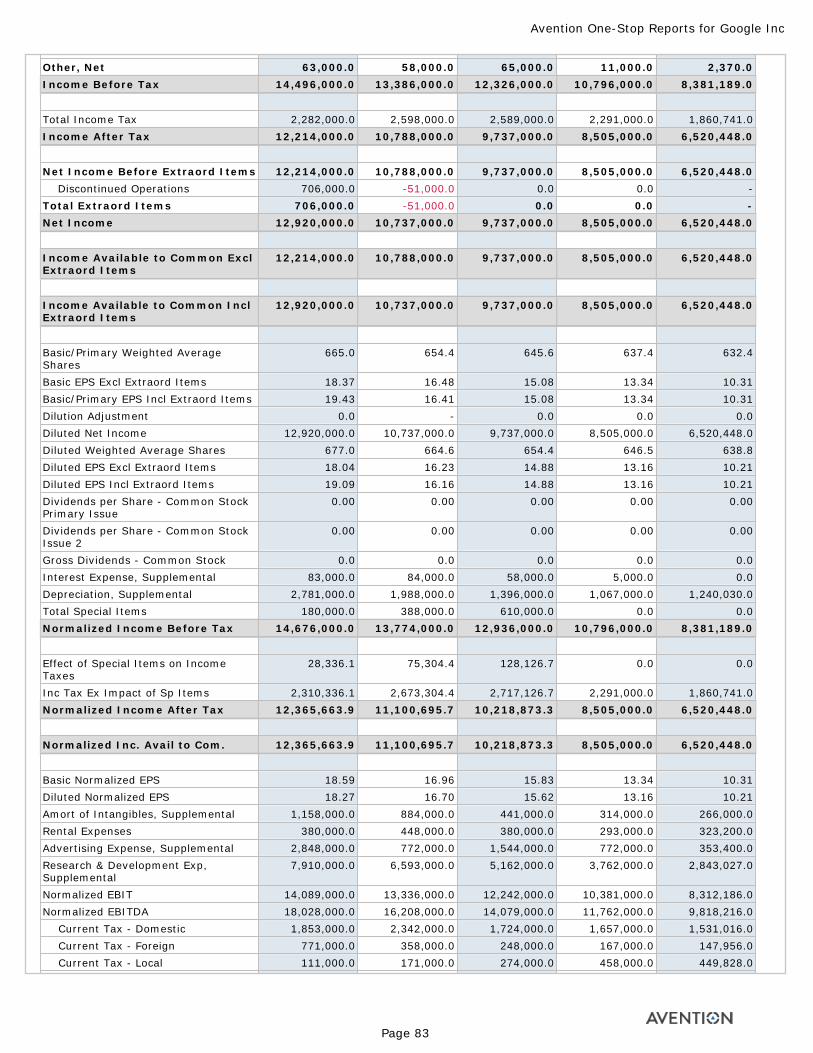
Other, Net 63,000.0 58,000.0 65,000.0 11,000.0 2,370.0Income Before Tax 14,496,000.0 13,386,000.0 12,326,000.0 10,796,000.0 8,381,189.0
Total Income Tax 2,282,000.0 2,598,000.0 2,589,000.0 2,291,000.0 1,860,741.0Income After Tax 12,214,000.0 10,788,000.0 9,737,000.0 8,505,000.0 6,520,448.0
Net Income Before Extraord Items 12,214,000.0 10,788,000.0 9,737,000.0 8,505,000.0 6,520,448.0 Discontinued Operations 706,000.0 -51,000.0 0.0 0.0 -Total Extraord Items 706,000.0 -51,000.0 0.0 0.0 -Net Income 12,920,000.0 10,737,000.0 9,737,000.0 8,505,000.0 6,520,448.0
Income Available to Common Excl Extraord Items
12,214,000.0 10,788,000.0 9,737,000.0 8,505,000.0 6,520,448.0
Income Available to Common Incl Extraord Items
12,920,000.0 10,737,000.0 9,737,000.0 8,505,000.0 6,520,448.0
Basic/Primary Weighted Average Shares
665.0 654.4 645.6 637.4 632.4
Basic EPS Excl Extraord Items 18.37 16.48 15.08 13.34 10.31Basic/Primary EPS Incl Extraord Items 19.43 16.41 15.08 13.34 10.31Dilution Adjustment 0.0 - 0.0 0.0 0.0Diluted Net Income 12,920,000.0 10,737,000.0 9,737,000.0 8,505,000.0 6,520,448.0Diluted Weighted Average Shares 677.0 664.6 654.4 646.5 638.8Diluted EPS Excl Extraord Items 18.04 16.23 14.88 13.16 10.21Diluted EPS Incl Extraord Items 19.09 16.16 14.88 13.16 10.21Dividends per Share - Common Stock Primary Issue
0.00 0.00 0.00 0.00 0.00
Dividends per Share - Common Stock Issue 2
0.00 0.00 0.00 0.00 0.00
Gross Dividends - Common Stock 0.0 0.0 0.0 0.0 0.0Interest Expense, Supplemental 83,000.0 84,000.0 58,000.0 5,000.0 0.0Depreciation, Supplemental 2,781,000.0 1,988,000.0 1,396,000.0 1,067,000.0 1,240,030.0Total Special Items 180,000.0 388,000.0 610,000.0 0.0 0.0Normalized Income Before Tax 14,676,000.0 13,774,000.0 12,936,000.0 10,796,000.0 8,381,189.0
Effect of Special Items on Income Taxes
28,336.1 75,304.4 128,126.7 0.0 0.0
Inc Tax Ex Impact of Sp Items 2,310,336.1 2,673,304.4 2,717,126.7 2,291,000.0 1,860,741.0Normalized Income After Tax 12,365,663.9 11,100,695.7 10,218,873.3 8,505,000.0 6,520,448.0
Normalized Inc. Avail to Com. 12,365,663.9 11,100,695.7 10,218,873.3 8,505,000.0 6,520,448.0
Basic Normalized EPS 18.59 16.96 15.83 13.34 10.31Diluted Normalized EPS 18.27 16.70 15.62 13.16 10.21Amort of Intangibles, Supplemental 1,158,000.0 884,000.0 441,000.0 314,000.0 266,000.0Rental Expenses 380,000.0 448,000.0 380,000.0 293,000.0 323,200.0Advertising Expense, Supplemental 2,848,000.0 772,000.0 1,544,000.0 772,000.0 353,400.0Research & Development Exp, Supplemental
7,910,000.0 6,593,000.0 5,162,000.0 3,762,000.0 2,843,027.0
Normalized EBIT 14,089,000.0 13,336,000.0 12,242,000.0 10,381,000.0 8,312,186.0Normalized EBITDA 18,028,000.0 16,208,000.0 14,079,000.0 11,762,000.0 9,818,216.0 Current Tax - Domestic 1,853,000.0 2,342,000.0 1,724,000.0 1,657,000.0 1,531,016.0 Current Tax - Foreign 771,000.0 358,000.0 248,000.0 167,000.0 147,956.0 Current Tax - Local 111,000.0 171,000.0 274,000.0 458,000.0 449,828.0
Avention One-Stop Reports for Google Inc
Page 83
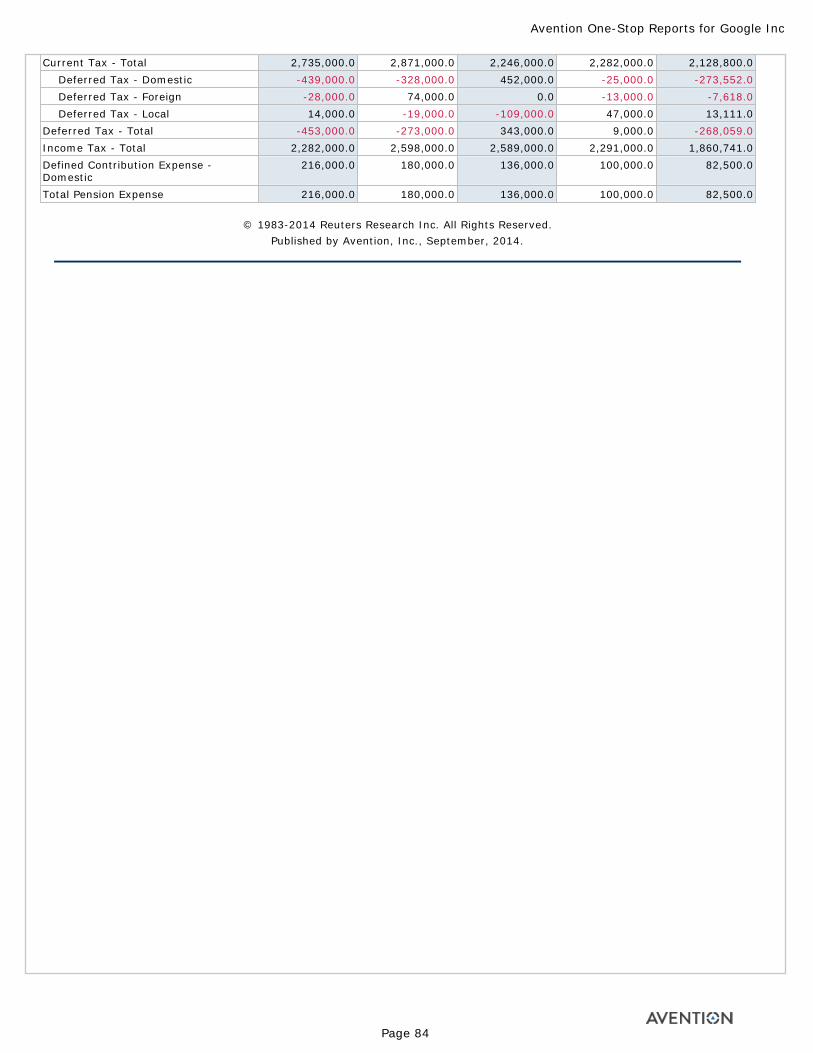
Current Tax - Total 2,735,000.0 2,871,000.0 2,246,000.0 2,282,000.0 2,128,800.0 Deferred Tax - Domestic -439,000.0 -328,000.0 452,000.0 -25,000.0 -273,552.0 Deferred Tax - Foreign -28,000.0 74,000.0 0.0 -13,000.0 -7,618.0 Deferred Tax - Local 14,000.0 -19,000.0 -109,000.0 47,000.0 13,111.0Deferred Tax - Total -453,000.0 -273,000.0 343,000.0 9,000.0 -268,059.0Income Tax - Total 2,282,000.0 2,598,000.0 2,589,000.0 2,291,000.0 1,860,741.0Defined Contribution Expense - Domestic
216,000.0 180,000.0 136,000.0 100,000.0 82,500.0
Total Pension Expense 216,000.0 180,000.0 136,000.0 100,000.0 82,500.0
© 1983-2014 Reuters Research Inc. All Rights Reserved. Published by Avention, Inc., September, 2014.
Avention One-Stop Reports for Google Inc
Page 84
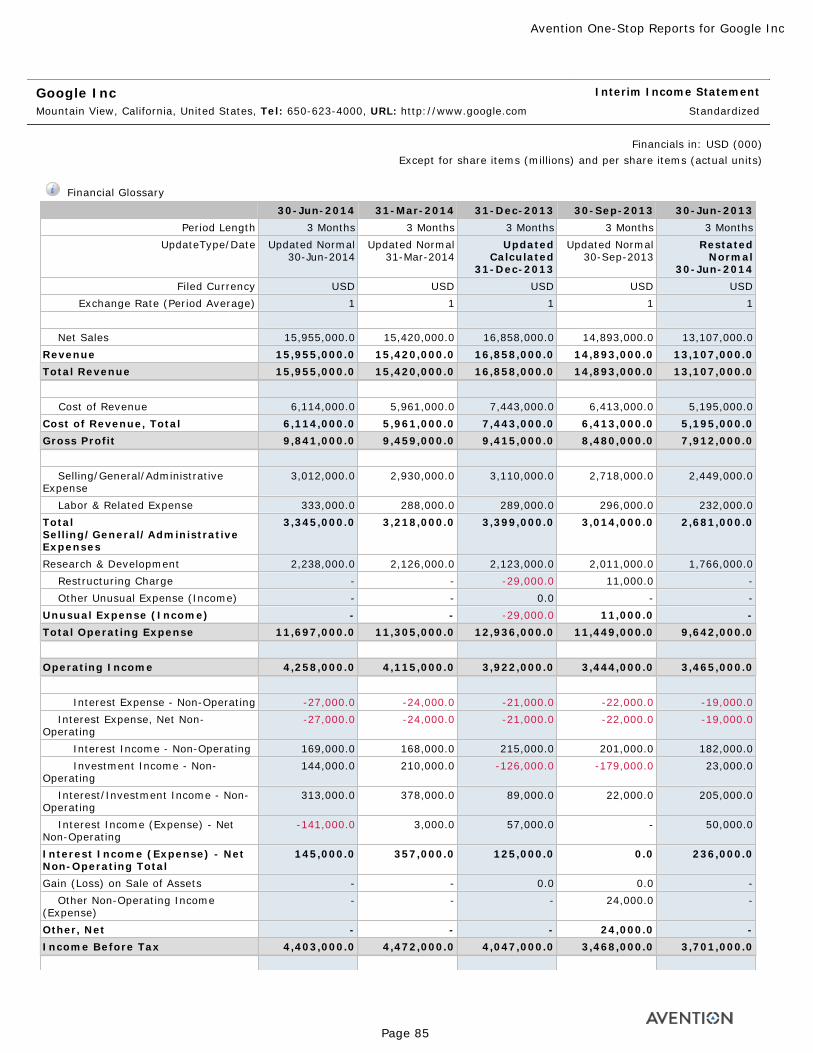
Google Inc Mountain View, California, United States, Tel: 650-623-4000, URL: http://www.google.com
Interim Income Statement
Standardized
Financials in: USD (000)Except for share items (millions) and per share items (actual units)
Financial Glossary
30-Jun-2014 31-Mar-2014 31-Dec-2013 30-Sep-2013 30-Jun-2013Period Length 3 Months 3 Months 3 Months 3 Months 3 Months
UpdateType/Date Updated Normal 30-Jun-2014
Updated Normal 31-Mar-2014
Updated Calculated
31-Dec-2013
Updated Normal 30-Sep-2013
Restated Normal
30-Jun-2014 Filed Currency USD USD USD USD USD
Exchange Rate (Period Average) 1 1 1 1 1 Net Sales 15,955,000.0 15,420,000.0 16,858,000.0 14,893,000.0 13,107,000.0Revenue 15,955,000.0 15,420,000.0 16,858,000.0 14,893,000.0 13,107,000.0Total Revenue 15,955,000.0 15,420,000.0 16,858,000.0 14,893,000.0 13,107,000.0
Cost of Revenue 6,114,000.0 5,961,000.0 7,443,000.0 6,413,000.0 5,195,000.0Cost of Revenue, Total 6,114,000.0 5,961,000.0 7,443,000.0 6,413,000.0 5,195,000.0Gross Profit 9,841,000.0 9,459,000.0 9,415,000.0 8,480,000.0 7,912,000.0
Selling/General/Administrative Expense
3,012,000.0 2,930,000.0 3,110,000.0 2,718,000.0 2,449,000.0
Labor & Related Expense 333,000.0 288,000.0 289,000.0 296,000.0 232,000.0Total Selling/General/Administrative Expenses
3,345,000.0 3,218,000.0 3,399,000.0 3,014,000.0 2,681,000.0
Research & Development 2,238,000.0 2,126,000.0 2,123,000.0 2,011,000.0 1,766,000.0 Restructuring Charge - - -29,000.0 11,000.0 - Other Unusual Expense (Income) - - 0.0 - -Unusual Expense (Income) - - -29,000.0 11,000.0 -Total Operating Expense 11,697,000.0 11,305,000.0 12,936,000.0 11,449,000.0 9,642,000.0
Operating Income 4,258,000.0 4,115,000.0 3,922,000.0 3,444,000.0 3,465,000.0
Interest Expense - Non-Operating -27,000.0 -24,000.0 -21,000.0 -22,000.0 -19,000.0 Interest Expense, Net Non-Operating
-27,000.0 -24,000.0 -21,000.0 -22,000.0 -19,000.0
Interest Income - Non-Operating 169,000.0 168,000.0 215,000.0 201,000.0 182,000.0 Investment Income - Non-Operating
144,000.0 210,000.0 -126,000.0 -179,000.0 23,000.0
Interest/Investment Income - Non-Operating
313,000.0 378,000.0 89,000.0 22,000.0 205,000.0
Interest Income (Expense) - Net Non-Operating
-141,000.0 3,000.0 57,000.0 - 50,000.0
Interest Income (Expense) - Net Non-Operating Total
145,000.0 357,000.0 125,000.0 0.0 236,000.0
Gain (Loss) on Sale of Assets - - 0.0 0.0 - Other Non-Operating Income (Expense)
- - - 24,000.0 -
Other, Net - - - 24,000.0 -Income Before Tax 4,403,000.0 4,472,000.0 4,047,000.0 3,468,000.0 3,701,000.0
Avention One-Stop Reports for Google Inc
Page 85
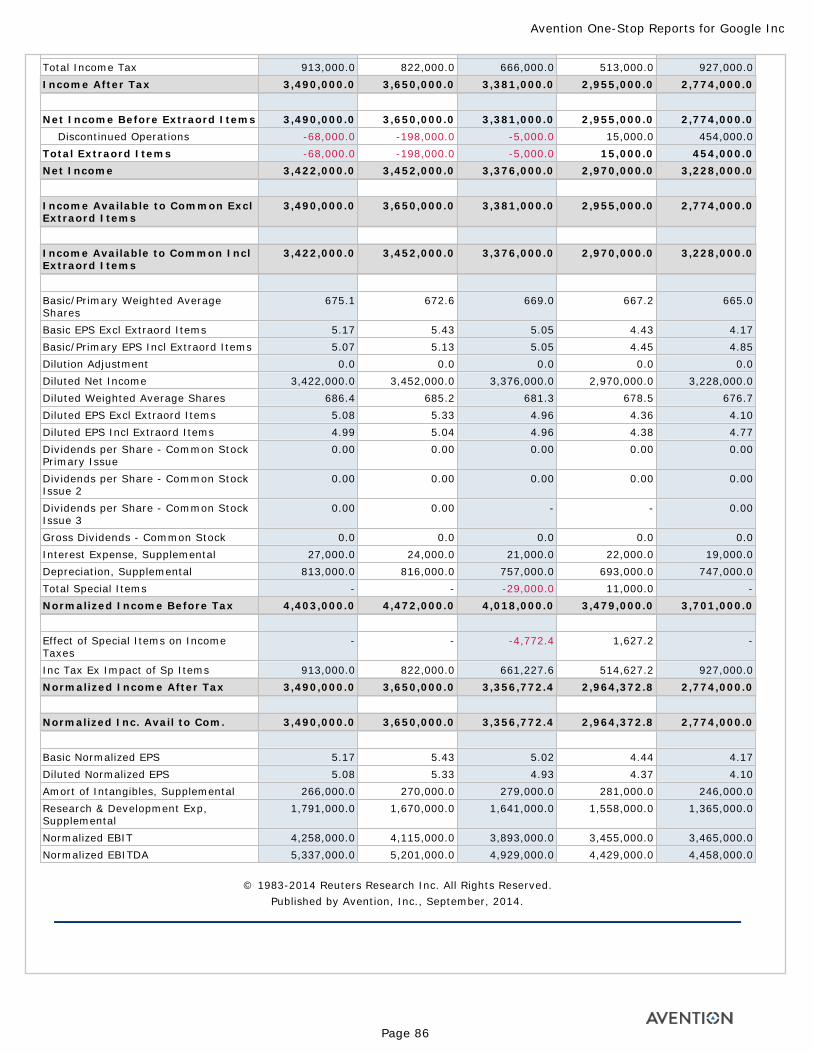
Total Income Tax 913,000.0 822,000.0 666,000.0 513,000.0 927,000.0Income After Tax 3,490,000.0 3,650,000.0 3,381,000.0 2,955,000.0 2,774,000.0
Net Income Before Extraord Items 3,490,000.0 3,650,000.0 3,381,000.0 2,955,000.0 2,774,000.0 Discontinued Operations -68,000.0 -198,000.0 -5,000.0 15,000.0 454,000.0Total Extraord Items -68,000.0 -198,000.0 -5,000.0 15,000.0 454,000.0Net Income 3,422,000.0 3,452,000.0 3,376,000.0 2,970,000.0 3,228,000.0
Income Available to Common Excl Extraord Items
3,490,000.0 3,650,000.0 3,381,000.0 2,955,000.0 2,774,000.0
Income Available to Common Incl Extraord Items
3,422,000.0 3,452,000.0 3,376,000.0 2,970,000.0 3,228,000.0
Basic/Primary Weighted Average Shares
675.1 672.6 669.0 667.2 665.0
Basic EPS Excl Extraord Items 5.17 5.43 5.05 4.43 4.17Basic/Primary EPS Incl Extraord Items 5.07 5.13 5.05 4.45 4.85Dilution Adjustment 0.0 0.0 0.0 0.0 0.0Diluted Net Income 3,422,000.0 3,452,000.0 3,376,000.0 2,970,000.0 3,228,000.0Diluted Weighted Average Shares 686.4 685.2 681.3 678.5 676.7Diluted EPS Excl Extraord Items 5.08 5.33 4.96 4.36 4.10Diluted EPS Incl Extraord Items 4.99 5.04 4.96 4.38 4.77Dividends per Share - Common Stock Primary Issue
0.00 0.00 0.00 0.00 0.00
Dividends per Share - Common Stock Issue 2
0.00 0.00 0.00 0.00 0.00
Dividends per Share - Common Stock Issue 3
0.00 0.00 - - 0.00
Gross Dividends - Common Stock 0.0 0.0 0.0 0.0 0.0Interest Expense, Supplemental 27,000.0 24,000.0 21,000.0 22,000.0 19,000.0Depreciation, Supplemental 813,000.0 816,000.0 757,000.0 693,000.0 747,000.0Total Special Items - - -29,000.0 11,000.0 -Normalized Income Before Tax 4,403,000.0 4,472,000.0 4,018,000.0 3,479,000.0 3,701,000.0
Effect of Special Items on Income Taxes
- - -4,772.4 1,627.2 -
Inc Tax Ex Impact of Sp Items 913,000.0 822,000.0 661,227.6 514,627.2 927,000.0Normalized Income After Tax 3,490,000.0 3,650,000.0 3,356,772.4 2,964,372.8 2,774,000.0
Normalized Inc. Avail to Com. 3,490,000.0 3,650,000.0 3,356,772.4 2,964,372.8 2,774,000.0
Basic Normalized EPS 5.17 5.43 5.02 4.44 4.17Diluted Normalized EPS 5.08 5.33 4.93 4.37 4.10Amort of Intangibles, Supplemental 266,000.0 270,000.0 279,000.0 281,000.0 246,000.0Research & Development Exp, Supplemental
1,791,000.0 1,670,000.0 1,641,000.0 1,558,000.0 1,365,000.0
Normalized EBIT 4,258,000.0 4,115,000.0 3,893,000.0 3,455,000.0 3,465,000.0Normalized EBITDA 5,337,000.0 5,201,000.0 4,929,000.0 4,429,000.0 4,458,000.0
© 1983-2014 Reuters Research Inc. All Rights Reserved. Published by Avention, Inc., September, 2014.
Avention One-Stop Reports for Google Inc
Page 86
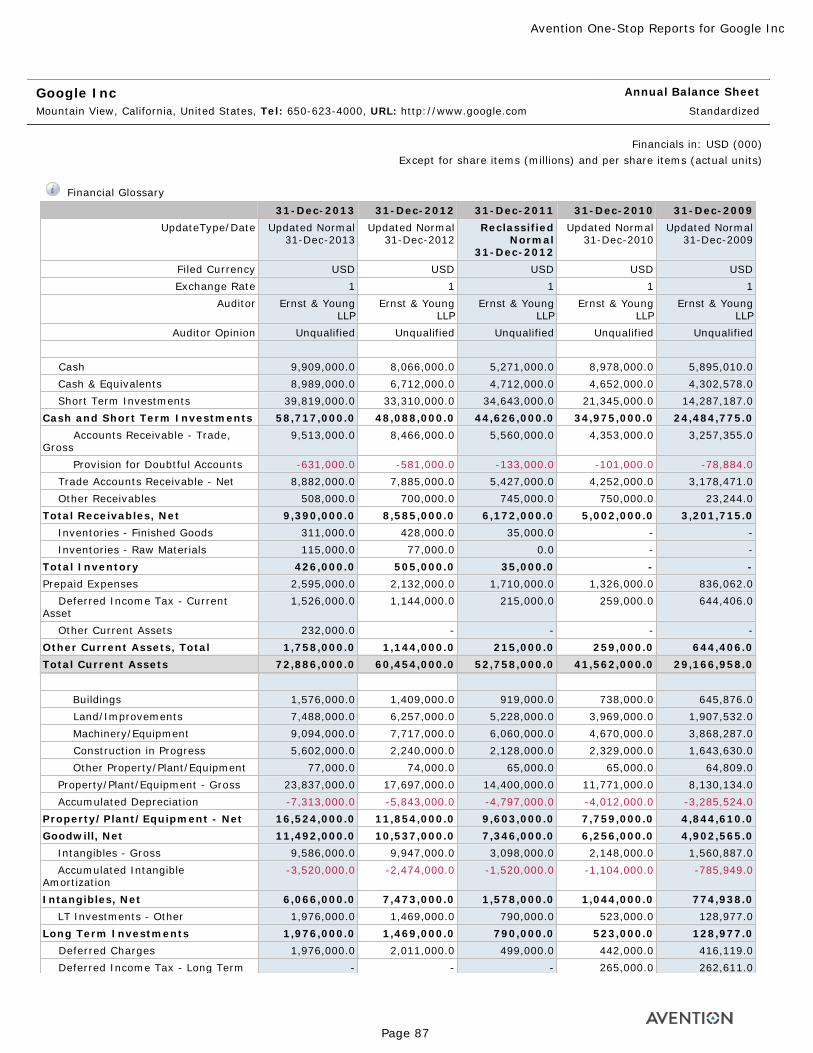
Google Inc Mountain View, California, United States, Tel: 650-623-4000, URL: http://www.google.com
Annual Balance Sheet
Standardized
Financials in: USD (000)Except for share items (millions) and per share items (actual units)
Financial Glossary
31-Dec-2013 31-Dec-2012 31-Dec-2011 31-Dec-2010 31-Dec-2009UpdateType/Date Updated Normal
31-Dec-2013Updated Normal
31-Dec-2012Reclassified
Normal 31-Dec-2012
Updated Normal 31-Dec-2010
Updated Normal 31-Dec-2009
Filed Currency USD USD USD USD USDExchange Rate 1 1 1 1 1
Auditor Ernst & Young LLP
Ernst & Young LLP
Ernst & Young LLP
Ernst & Young LLP
Ernst & Young LLP
Auditor Opinion Unqualified Unqualified Unqualified Unqualified Unqualified Cash 9,909,000.0 8,066,000.0 5,271,000.0 8,978,000.0 5,895,010.0 Cash & Equivalents 8,989,000.0 6,712,000.0 4,712,000.0 4,652,000.0 4,302,578.0 Short Term Investments 39,819,000.0 33,310,000.0 34,643,000.0 21,345,000.0 14,287,187.0Cash and Short Term Investments 58,717,000.0 48,088,000.0 44,626,000.0 34,975,000.0 24,484,775.0 Accounts Receivable - Trade, Gross
9,513,000.0 8,466,000.0 5,560,000.0 4,353,000.0 3,257,355.0
Provision for Doubtful Accounts -631,000.0 -581,000.0 -133,000.0 -101,000.0 -78,884.0 Trade Accounts Receivable - Net 8,882,000.0 7,885,000.0 5,427,000.0 4,252,000.0 3,178,471.0 Other Receivables 508,000.0 700,000.0 745,000.0 750,000.0 23,244.0Total Receivables, Net 9,390,000.0 8,585,000.0 6,172,000.0 5,002,000.0 3,201,715.0 Inventories - Finished Goods 311,000.0 428,000.0 35,000.0 - - Inventories - Raw Materials 115,000.0 77,000.0 0.0 - -Total Inventory 426,000.0 505,000.0 35,000.0 - -Prepaid Expenses 2,595,000.0 2,132,000.0 1,710,000.0 1,326,000.0 836,062.0 Deferred Income Tax - Current Asset
1,526,000.0 1,144,000.0 215,000.0 259,000.0 644,406.0
Other Current Assets 232,000.0 - - - -Other Current Assets, Total 1,758,000.0 1,144,000.0 215,000.0 259,000.0 644,406.0Total Current Assets 72,886,000.0 60,454,000.0 52,758,000.0 41,562,000.0 29,166,958.0
Buildings 1,576,000.0 1,409,000.0 919,000.0 738,000.0 645,876.0 Land/Improvements 7,488,000.0 6,257,000.0 5,228,000.0 3,969,000.0 1,907,532.0 Machinery/Equipment 9,094,000.0 7,717,000.0 6,060,000.0 4,670,000.0 3,868,287.0 Construction in Progress 5,602,000.0 2,240,000.0 2,128,000.0 2,329,000.0 1,643,630.0 Other Property/Plant/Equipment 77,000.0 74,000.0 65,000.0 65,000.0 64,809.0 Property/Plant/Equipment - Gross 23,837,000.0 17,697,000.0 14,400,000.0 11,771,000.0 8,130,134.0 Accumulated Depreciation -7,313,000.0 -5,843,000.0 -4,797,000.0 -4,012,000.0 -3,285,524.0Property/Plant/Equipment - Net 16,524,000.0 11,854,000.0 9,603,000.0 7,759,000.0 4,844,610.0Goodwill, Net 11,492,000.0 10,537,000.0 7,346,000.0 6,256,000.0 4,902,565.0 Intangibles - Gross 9,586,000.0 9,947,000.0 3,098,000.0 2,148,000.0 1,560,887.0 Accumulated Intangible Amortization
-3,520,000.0 -2,474,000.0 -1,520,000.0 -1,104,000.0 -785,949.0
Intangibles, Net 6,066,000.0 7,473,000.0 1,578,000.0 1,044,000.0 774,938.0 LT Investments - Other 1,976,000.0 1,469,000.0 790,000.0 523,000.0 128,977.0Long Term Investments 1,976,000.0 1,469,000.0 790,000.0 523,000.0 128,977.0 Deferred Charges 1,976,000.0 2,011,000.0 499,000.0 442,000.0 416,119.0 Deferred Income Tax - Long Term - - - 265,000.0 262,611.0
Avention One-Stop Reports for Google Inc
Page 87
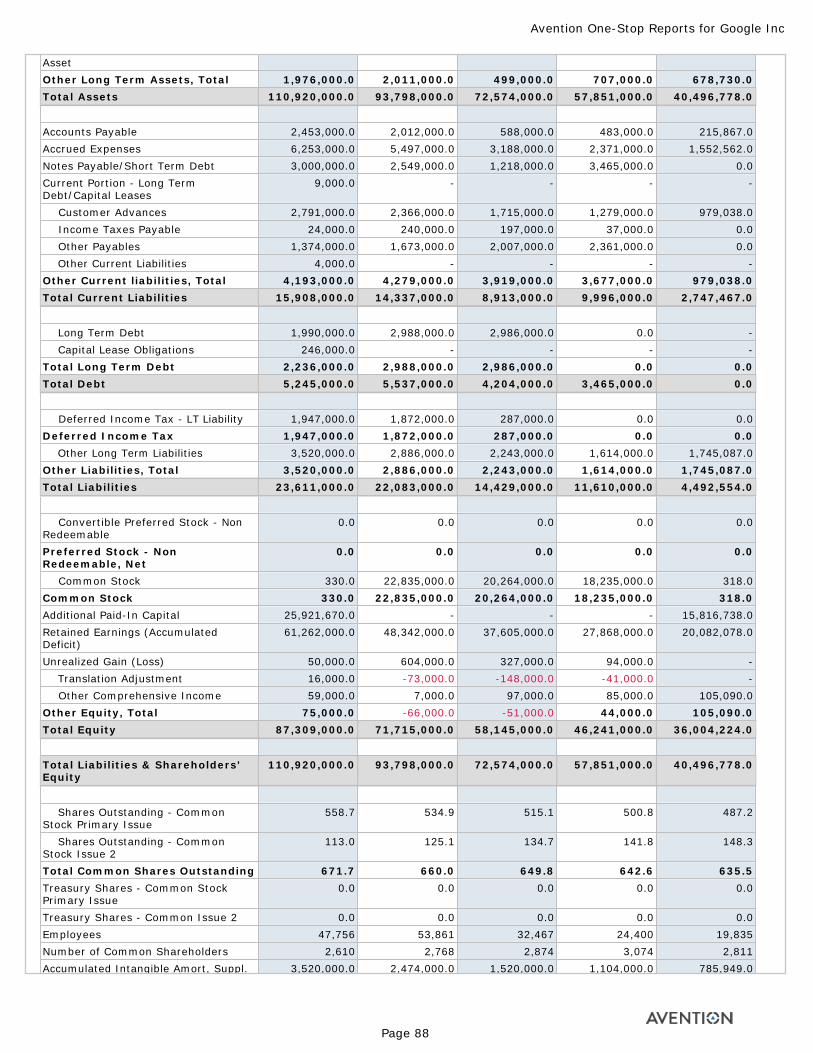
AssetOther Long Term Assets, Total 1,976,000.0 2,011,000.0 499,000.0 707,000.0 678,730.0Total Assets 110,920,000.0 93,798,000.0 72,574,000.0 57,851,000.0 40,496,778.0
Accounts Payable 2,453,000.0 2,012,000.0 588,000.0 483,000.0 215,867.0Accrued Expenses 6,253,000.0 5,497,000.0 3,188,000.0 2,371,000.0 1,552,562.0Notes Payable/Short Term Debt 3,000,000.0 2,549,000.0 1,218,000.0 3,465,000.0 0.0Current Portion - Long Term Debt/Capital Leases
9,000.0 - - - -
Customer Advances 2,791,000.0 2,366,000.0 1,715,000.0 1,279,000.0 979,038.0 Income Taxes Payable 24,000.0 240,000.0 197,000.0 37,000.0 0.0 Other Payables 1,374,000.0 1,673,000.0 2,007,000.0 2,361,000.0 0.0 Other Current Liabilities 4,000.0 - - - -Other Current liabilities, Total 4,193,000.0 4,279,000.0 3,919,000.0 3,677,000.0 979,038.0Total Current Liabilities 15,908,000.0 14,337,000.0 8,913,000.0 9,996,000.0 2,747,467.0
Long Term Debt 1,990,000.0 2,988,000.0 2,986,000.0 0.0 - Capital Lease Obligations 246,000.0 - - - -Total Long Term Debt 2,236,000.0 2,988,000.0 2,986,000.0 0.0 0.0Total Debt 5,245,000.0 5,537,000.0 4,204,000.0 3,465,000.0 0.0
Deferred Income Tax - LT Liability 1,947,000.0 1,872,000.0 287,000.0 0.0 0.0Deferred Income Tax 1,947,000.0 1,872,000.0 287,000.0 0.0 0.0 Other Long Term Liabilities 3,520,000.0 2,886,000.0 2,243,000.0 1,614,000.0 1,745,087.0Other Liabilities, Total 3,520,000.0 2,886,000.0 2,243,000.0 1,614,000.0 1,745,087.0Total Liabilities 23,611,000.0 22,083,000.0 14,429,000.0 11,610,000.0 4,492,554.0
Convertible Preferred Stock - Non Redeemable
0.0 0.0 0.0 0.0 0.0
Preferred Stock - Non Redeemable, Net
0.0 0.0 0.0 0.0 0.0
Common Stock 330.0 22,835,000.0 20,264,000.0 18,235,000.0 318.0Common Stock 330.0 22,835,000.0 20,264,000.0 18,235,000.0 318.0Additional Paid-In Capital 25,921,670.0 - - - 15,816,738.0Retained Earnings (Accumulated Deficit)
61,262,000.0 48,342,000.0 37,605,000.0 27,868,000.0 20,082,078.0
Unrealized Gain (Loss) 50,000.0 604,000.0 327,000.0 94,000.0 - Translation Adjustment 16,000.0 -73,000.0 -148,000.0 -41,000.0 - Other Comprehensive Income 59,000.0 7,000.0 97,000.0 85,000.0 105,090.0Other Equity, Total 75,000.0 -66,000.0 -51,000.0 44,000.0 105,090.0Total Equity 87,309,000.0 71,715,000.0 58,145,000.0 46,241,000.0 36,004,224.0
Total Liabilities & Shareholders’ Equity
110,920,000.0 93,798,000.0 72,574,000.0 57,851,000.0 40,496,778.0
Shares Outstanding - Common Stock Primary Issue
558.7 534.9 515.1 500.8 487.2
Shares Outstanding - Common Stock Issue 2
113.0 125.1 134.7 141.8 148.3
Total Common Shares Outstanding 671.7 660.0 649.8 642.6 635.5Treasury Shares - Common Stock Primary Issue
0.0 0.0 0.0 0.0 0.0
Treasury Shares - Common Issue 2 0.0 0.0 0.0 0.0 0.0Employees 47,756 53,861 32,467 24,400 19,835Number of Common Shareholders 2,610 2,768 2,874 3,074 2,811Accumulated Intangible Amort, Suppl. 3,520,000.0 2,474,000.0 1,520,000.0 1,104,000.0 785,949.0
Avention One-Stop Reports for Google Inc
Page 88
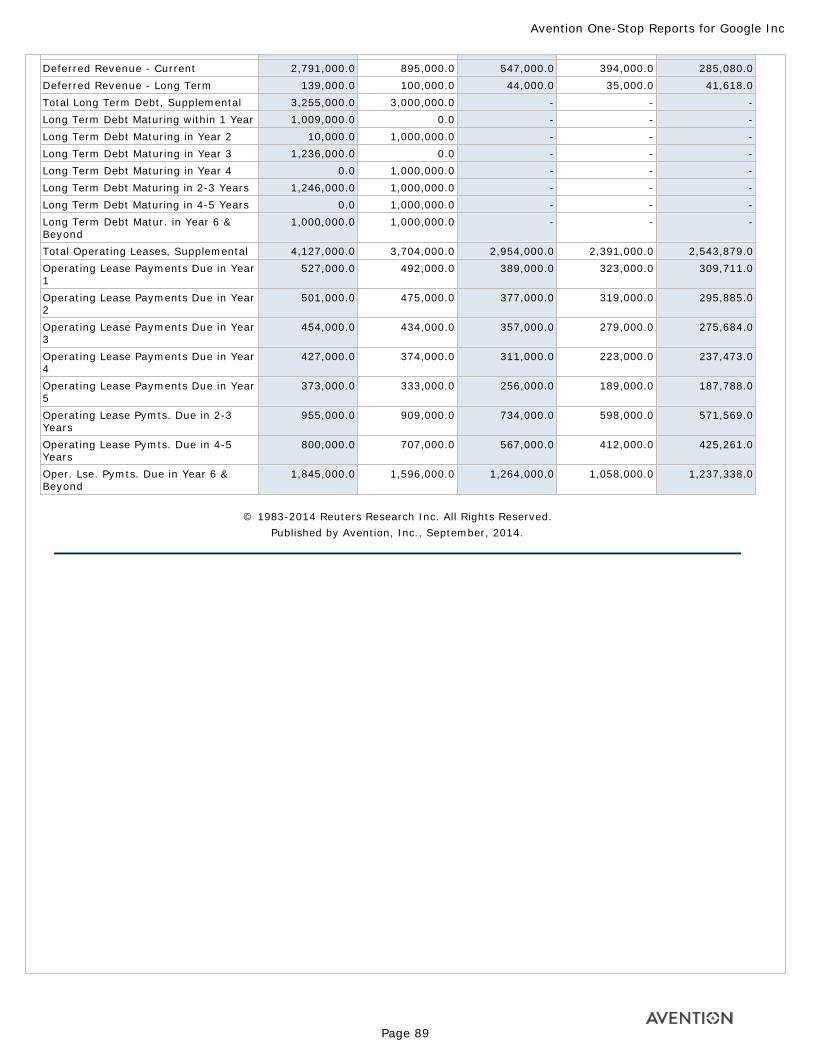
Deferred Revenue - Current 2,791,000.0 895,000.0 547,000.0 394,000.0 285,080.0Deferred Revenue - Long Term 139,000.0 100,000.0 44,000.0 35,000.0 41,618.0Total Long Term Debt, Supplemental 3,255,000.0 3,000,000.0 - - -Long Term Debt Maturing within 1 Year 1,009,000.0 0.0 - - -Long Term Debt Maturing in Year 2 10,000.0 1,000,000.0 - - -Long Term Debt Maturing in Year 3 1,236,000.0 0.0 - - -Long Term Debt Maturing in Year 4 0.0 1,000,000.0 - - -Long Term Debt Maturing in 2-3 Years 1,246,000.0 1,000,000.0 - - -Long Term Debt Maturing in 4-5 Years 0.0 1,000,000.0 - - -Long Term Debt Matur. in Year 6 & Beyond
1,000,000.0 1,000,000.0 - - -
Total Operating Leases, Supplemental 4,127,000.0 3,704,000.0 2,954,000.0 2,391,000.0 2,543,879.0Operating Lease Payments Due in Year 1
527,000.0 492,000.0 389,000.0 323,000.0 309,711.0
Operating Lease Payments Due in Year 2
501,000.0 475,000.0 377,000.0 319,000.0 295,885.0
Operating Lease Payments Due in Year 3
454,000.0 434,000.0 357,000.0 279,000.0 275,684.0
Operating Lease Payments Due in Year 4
427,000.0 374,000.0 311,000.0 223,000.0 237,473.0
Operating Lease Payments Due in Year 5
373,000.0 333,000.0 256,000.0 189,000.0 187,788.0
Operating Lease Pymts. Due in 2-3 Years
955,000.0 909,000.0 734,000.0 598,000.0 571,569.0
Operating Lease Pymts. Due in 4-5 Years
800,000.0 707,000.0 567,000.0 412,000.0 425,261.0
Oper. Lse. Pymts. Due in Year 6 & Beyond
1,845,000.0 1,596,000.0 1,264,000.0 1,058,000.0 1,237,338.0
© 1983-2014 Reuters Research Inc. All Rights Reserved. Published by Avention, Inc., September, 2014.
Avention One-Stop Reports for Google Inc
Page 89
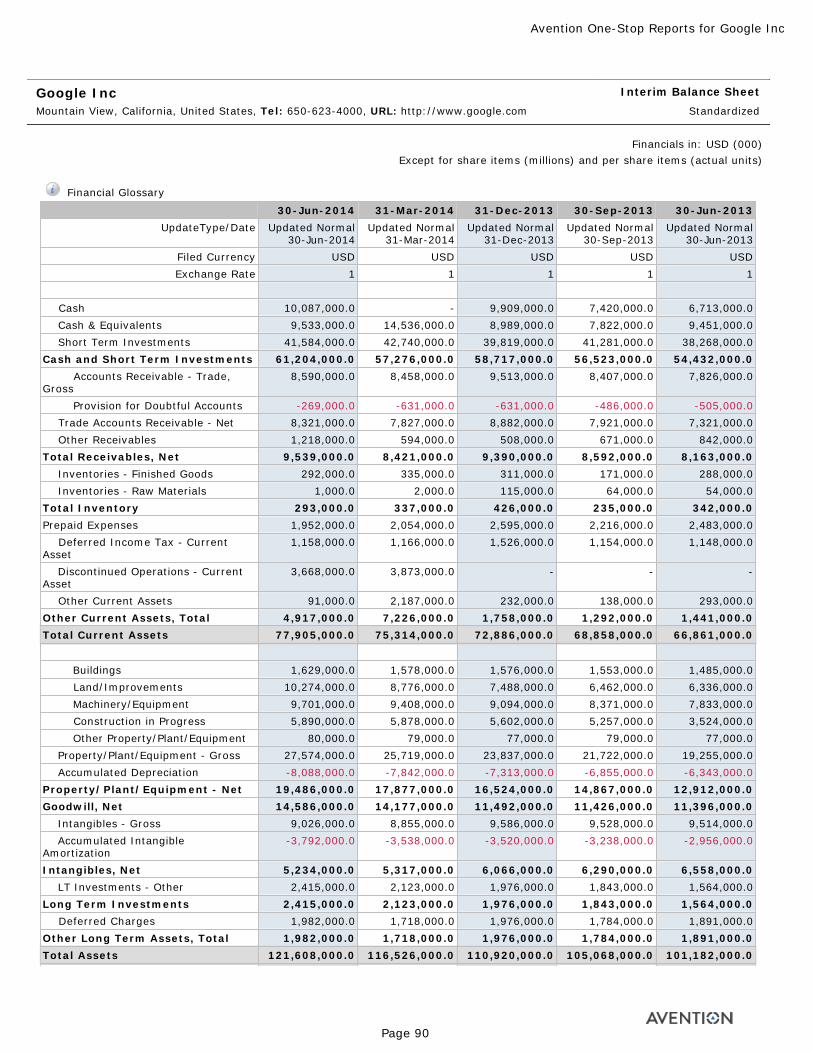
Google Inc Mountain View, California, United States, Tel: 650-623-4000, URL: http://www.google.com
Interim Balance Sheet
Standardized
Financials in: USD (000)Except for share items (millions) and per share items (actual units)
Financial Glossary
30-Jun-2014 31-Mar-2014 31-Dec-2013 30-Sep-2013 30-Jun-2013UpdateType/Date Updated Normal
30-Jun-2014Updated Normal
31-Mar-2014Updated Normal
31-Dec-2013Updated Normal
30-Sep-2013Updated Normal
30-Jun-2013Filed Currency USD USD USD USD USDExchange Rate 1 1 1 1 1
Cash 10,087,000.0 - 9,909,000.0 7,420,000.0 6,713,000.0 Cash & Equivalents 9,533,000.0 14,536,000.0 8,989,000.0 7,822,000.0 9,451,000.0 Short Term Investments 41,584,000.0 42,740,000.0 39,819,000.0 41,281,000.0 38,268,000.0Cash and Short Term Investments 61,204,000.0 57,276,000.0 58,717,000.0 56,523,000.0 54,432,000.0 Accounts Receivable - Trade, Gross
8,590,000.0 8,458,000.0 9,513,000.0 8,407,000.0 7,826,000.0
Provision for Doubtful Accounts -269,000.0 -631,000.0 -631,000.0 -486,000.0 -505,000.0 Trade Accounts Receivable - Net 8,321,000.0 7,827,000.0 8,882,000.0 7,921,000.0 7,321,000.0 Other Receivables 1,218,000.0 594,000.0 508,000.0 671,000.0 842,000.0Total Receivables, Net 9,539,000.0 8,421,000.0 9,390,000.0 8,592,000.0 8,163,000.0 Inventories - Finished Goods 292,000.0 335,000.0 311,000.0 171,000.0 288,000.0 Inventories - Raw Materials 1,000.0 2,000.0 115,000.0 64,000.0 54,000.0Total Inventory 293,000.0 337,000.0 426,000.0 235,000.0 342,000.0Prepaid Expenses 1,952,000.0 2,054,000.0 2,595,000.0 2,216,000.0 2,483,000.0 Deferred Income Tax - Current Asset
1,158,000.0 1,166,000.0 1,526,000.0 1,154,000.0 1,148,000.0
Discontinued Operations - Current Asset
3,668,000.0 3,873,000.0 - - -
Other Current Assets 91,000.0 2,187,000.0 232,000.0 138,000.0 293,000.0Other Current Assets, Total 4,917,000.0 7,226,000.0 1,758,000.0 1,292,000.0 1,441,000.0Total Current Assets 77,905,000.0 75,314,000.0 72,886,000.0 68,858,000.0 66,861,000.0
Buildings 1,629,000.0 1,578,000.0 1,576,000.0 1,553,000.0 1,485,000.0 Land/Improvements 10,274,000.0 8,776,000.0 7,488,000.0 6,462,000.0 6,336,000.0 Machinery/Equipment 9,701,000.0 9,408,000.0 9,094,000.0 8,371,000.0 7,833,000.0 Construction in Progress 5,890,000.0 5,878,000.0 5,602,000.0 5,257,000.0 3,524,000.0 Other Property/Plant/Equipment 80,000.0 79,000.0 77,000.0 79,000.0 77,000.0 Property/Plant/Equipment - Gross 27,574,000.0 25,719,000.0 23,837,000.0 21,722,000.0 19,255,000.0 Accumulated Depreciation -8,088,000.0 -7,842,000.0 -7,313,000.0 -6,855,000.0 -6,343,000.0Property/Plant/Equipment - Net 19,486,000.0 17,877,000.0 16,524,000.0 14,867,000.0 12,912,000.0Goodwill, Net 14,586,000.0 14,177,000.0 11,492,000.0 11,426,000.0 11,396,000.0 Intangibles - Gross 9,026,000.0 8,855,000.0 9,586,000.0 9,528,000.0 9,514,000.0 Accumulated Intangible Amortization
-3,792,000.0 -3,538,000.0 -3,520,000.0 -3,238,000.0 -2,956,000.0
Intangibles, Net 5,234,000.0 5,317,000.0 6,066,000.0 6,290,000.0 6,558,000.0 LT Investments - Other 2,415,000.0 2,123,000.0 1,976,000.0 1,843,000.0 1,564,000.0Long Term Investments 2,415,000.0 2,123,000.0 1,976,000.0 1,843,000.0 1,564,000.0 Deferred Charges 1,982,000.0 1,718,000.0 1,976,000.0 1,784,000.0 1,891,000.0Other Long Term Assets, Total 1,982,000.0 1,718,000.0 1,976,000.0 1,784,000.0 1,891,000.0Total Assets 121,608,000.0 116,526,000.0 110,920,000.0 105,068,000.0 101,182,000.0
Avention One-Stop Reports for Google Inc
Page 90
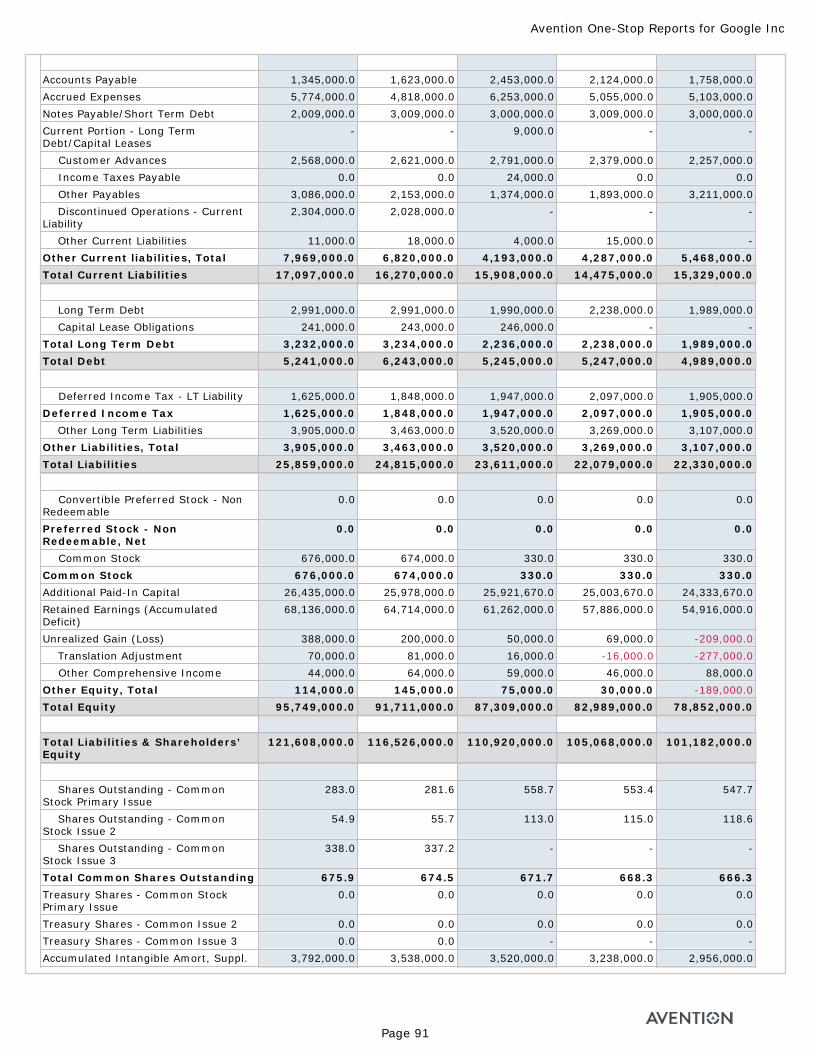
Accounts Payable 1,345,000.0 1,623,000.0 2,453,000.0 2,124,000.0 1,758,000.0Accrued Expenses 5,774,000.0 4,818,000.0 6,253,000.0 5,055,000.0 5,103,000.0Notes Payable/Short Term Debt 2,009,000.0 3,009,000.0 3,000,000.0 3,009,000.0 3,000,000.0Current Portion - Long Term Debt/Capital Leases
- - 9,000.0 - -
Customer Advances 2,568,000.0 2,621,000.0 2,791,000.0 2,379,000.0 2,257,000.0 Income Taxes Payable 0.0 0.0 24,000.0 0.0 0.0 Other Payables 3,086,000.0 2,153,000.0 1,374,000.0 1,893,000.0 3,211,000.0 Discontinued Operations - Current Liability
2,304,000.0 2,028,000.0 - - -
Other Current Liabilities 11,000.0 18,000.0 4,000.0 15,000.0 -Other Current liabilities, Total 7,969,000.0 6,820,000.0 4,193,000.0 4,287,000.0 5,468,000.0Total Current Liabilities 17,097,000.0 16,270,000.0 15,908,000.0 14,475,000.0 15,329,000.0
Long Term Debt 2,991,000.0 2,991,000.0 1,990,000.0 2,238,000.0 1,989,000.0 Capital Lease Obligations 241,000.0 243,000.0 246,000.0 - -Total Long Term Debt 3,232,000.0 3,234,000.0 2,236,000.0 2,238,000.0 1,989,000.0Total Debt 5,241,000.0 6,243,000.0 5,245,000.0 5,247,000.0 4,989,000.0
Deferred Income Tax - LT Liability 1,625,000.0 1,848,000.0 1,947,000.0 2,097,000.0 1,905,000.0Deferred Income Tax 1,625,000.0 1,848,000.0 1,947,000.0 2,097,000.0 1,905,000.0 Other Long Term Liabilities 3,905,000.0 3,463,000.0 3,520,000.0 3,269,000.0 3,107,000.0Other Liabilities, Total 3,905,000.0 3,463,000.0 3,520,000.0 3,269,000.0 3,107,000.0Total Liabilities 25,859,000.0 24,815,000.0 23,611,000.0 22,079,000.0 22,330,000.0
Convertible Preferred Stock - Non Redeemable
0.0 0.0 0.0 0.0 0.0
Preferred Stock - Non Redeemable, Net
0.0 0.0 0.0 0.0 0.0
Common Stock 676,000.0 674,000.0 330.0 330.0 330.0Common Stock 676,000.0 674,000.0 330.0 330.0 330.0Additional Paid-In Capital 26,435,000.0 25,978,000.0 25,921,670.0 25,003,670.0 24,333,670.0Retained Earnings (Accumulated Deficit)
68,136,000.0 64,714,000.0 61,262,000.0 57,886,000.0 54,916,000.0
Unrealized Gain (Loss) 388,000.0 200,000.0 50,000.0 69,000.0 -209,000.0 Translation Adjustment 70,000.0 81,000.0 16,000.0 -16,000.0 -277,000.0 Other Comprehensive Income 44,000.0 64,000.0 59,000.0 46,000.0 88,000.0Other Equity, Total 114,000.0 145,000.0 75,000.0 30,000.0 -189,000.0Total Equity 95,749,000.0 91,711,000.0 87,309,000.0 82,989,000.0 78,852,000.0
Total Liabilities & Shareholders’ Equity
121,608,000.0 116,526,000.0 110,920,000.0 105,068,000.0 101,182,000.0
Shares Outstanding - Common Stock Primary Issue
283.0 281.6 558.7 553.4 547.7
Shares Outstanding - Common Stock Issue 2
54.9 55.7 113.0 115.0 118.6
Shares Outstanding - Common Stock Issue 3
338.0 337.2 - - -
Total Common Shares Outstanding 675.9 674.5 671.7 668.3 666.3Treasury Shares - Common Stock Primary Issue
0.0 0.0 0.0 0.0 0.0
Treasury Shares - Common Issue 2 0.0 0.0 0.0 0.0 0.0Treasury Shares - Common Issue 3 0.0 0.0 - - -Accumulated Intangible Amort, Suppl. 3,792,000.0 3,538,000.0 3,520,000.0 3,238,000.0 2,956,000.0
Avention One-Stop Reports for Google Inc
Page 91
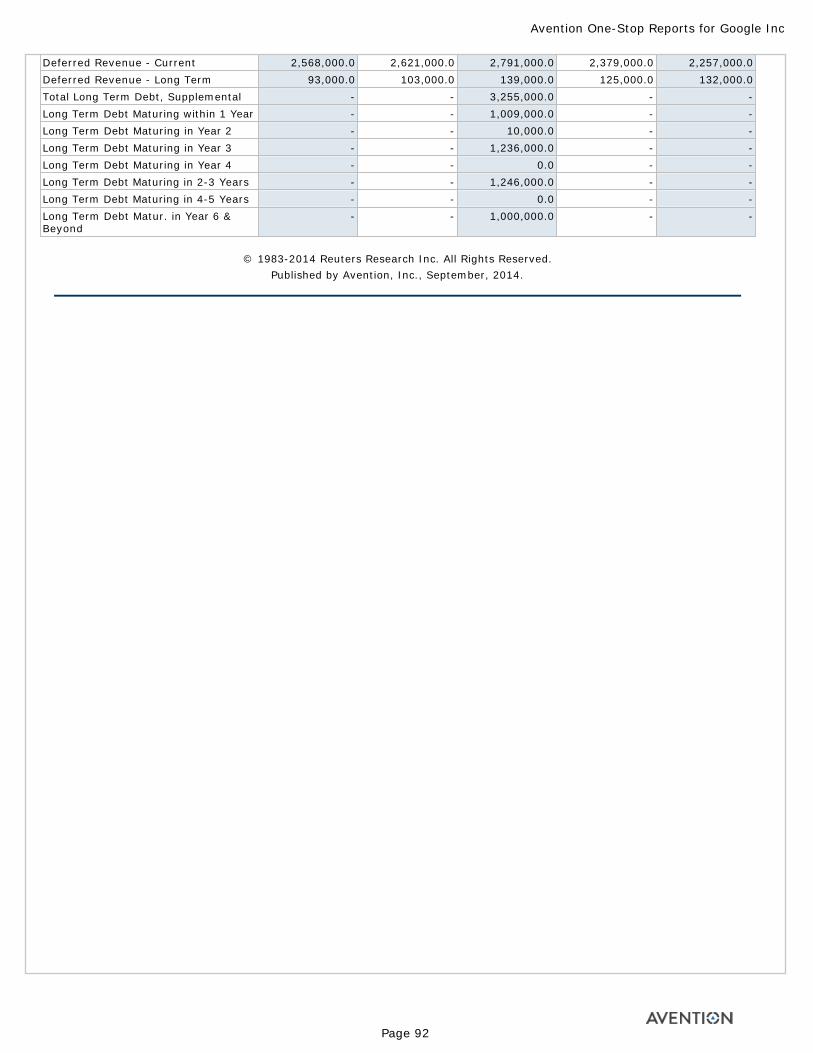
Deferred Revenue - Current 2,568,000.0 2,621,000.0 2,791,000.0 2,379,000.0 2,257,000.0Deferred Revenue - Long Term 93,000.0 103,000.0 139,000.0 125,000.0 132,000.0Total Long Term Debt, Supplemental - - 3,255,000.0 - -Long Term Debt Maturing within 1 Year - - 1,009,000.0 - -Long Term Debt Maturing in Year 2 - - 10,000.0 - -Long Term Debt Maturing in Year 3 - - 1,236,000.0 - -Long Term Debt Maturing in Year 4 - - 0.0 - -Long Term Debt Maturing in 2-3 Years - - 1,246,000.0 - -Long Term Debt Maturing in 4-5 Years - - 0.0 - -Long Term Debt Matur. in Year 6 & Beyond
- - 1,000,000.0 - -
© 1983-2014 Reuters Research Inc. All Rights Reserved. Published by Avention, Inc., September, 2014.
Avention One-Stop Reports for Google Inc
Page 92
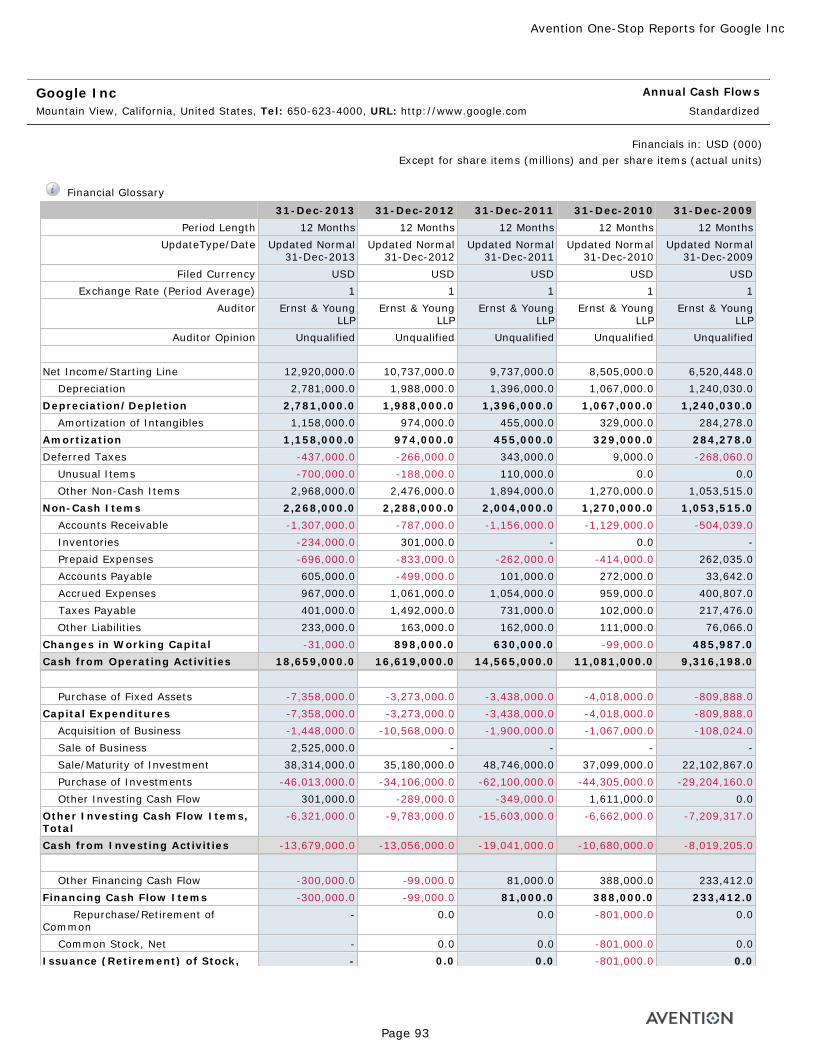
Google Inc Mountain View, California, United States, Tel: 650-623-4000, URL: http://www.google.com
Annual Cash Flows
Standardized
Financials in: USD (000)Except for share items (millions) and per share items (actual units)
Financial Glossary
31-Dec-2013 31-Dec-2012 31-Dec-2011 31-Dec-2010 31-Dec-2009Period Length 12 Months 12 Months 12 Months 12 Months 12 Months
UpdateType/Date Updated Normal 31-Dec-2013
Updated Normal 31-Dec-2012
Updated Normal 31-Dec-2011
Updated Normal 31-Dec-2010
Updated Normal 31-Dec-2009
Filed Currency USD USD USD USD USDExchange Rate (Period Average) 1 1 1 1 1
Auditor Ernst & Young LLP
Ernst & Young LLP
Ernst & Young LLP
Ernst & Young LLP
Ernst & Young LLP
Auditor Opinion Unqualified Unqualified Unqualified Unqualified Unqualified Net Income/Starting Line 12,920,000.0 10,737,000.0 9,737,000.0 8,505,000.0 6,520,448.0 Depreciation 2,781,000.0 1,988,000.0 1,396,000.0 1,067,000.0 1,240,030.0Depreciation/Depletion 2,781,000.0 1,988,000.0 1,396,000.0 1,067,000.0 1,240,030.0 Amortization of Intangibles 1,158,000.0 974,000.0 455,000.0 329,000.0 284,278.0Amortization 1,158,000.0 974,000.0 455,000.0 329,000.0 284,278.0Deferred Taxes -437,000.0 -266,000.0 343,000.0 9,000.0 -268,060.0 Unusual Items -700,000.0 -188,000.0 110,000.0 0.0 0.0 Other Non-Cash Items 2,968,000.0 2,476,000.0 1,894,000.0 1,270,000.0 1,053,515.0Non-Cash Items 2,268,000.0 2,288,000.0 2,004,000.0 1,270,000.0 1,053,515.0 Accounts Receivable -1,307,000.0 -787,000.0 -1,156,000.0 -1,129,000.0 -504,039.0 Inventories -234,000.0 301,000.0 - 0.0 - Prepaid Expenses -696,000.0 -833,000.0 -262,000.0 -414,000.0 262,035.0 Accounts Payable 605,000.0 -499,000.0 101,000.0 272,000.0 33,642.0 Accrued Expenses 967,000.0 1,061,000.0 1,054,000.0 959,000.0 400,807.0 Taxes Payable 401,000.0 1,492,000.0 731,000.0 102,000.0 217,476.0 Other Liabilities 233,000.0 163,000.0 162,000.0 111,000.0 76,066.0Changes in Working Capital -31,000.0 898,000.0 630,000.0 -99,000.0 485,987.0Cash from Operating Activities 18,659,000.0 16,619,000.0 14,565,000.0 11,081,000.0 9,316,198.0
Purchase of Fixed Assets -7,358,000.0 -3,273,000.0 -3,438,000.0 -4,018,000.0 -809,888.0Capital Expenditures -7,358,000.0 -3,273,000.0 -3,438,000.0 -4,018,000.0 -809,888.0 Acquisition of Business -1,448,000.0 -10,568,000.0 -1,900,000.0 -1,067,000.0 -108,024.0 Sale of Business 2,525,000.0 - - - - Sale/Maturity of Investment 38,314,000.0 35,180,000.0 48,746,000.0 37,099,000.0 22,102,867.0 Purchase of Investments -46,013,000.0 -34,106,000.0 -62,100,000.0 -44,305,000.0 -29,204,160.0 Other Investing Cash Flow 301,000.0 -289,000.0 -349,000.0 1,611,000.0 0.0Other Investing Cash Flow Items, Total
-6,321,000.0 -9,783,000.0 -15,603,000.0 -6,662,000.0 -7,209,317.0
Cash from Investing Activities -13,679,000.0 -13,056,000.0 -19,041,000.0 -10,680,000.0 -8,019,205.0
Other Financing Cash Flow -300,000.0 -99,000.0 81,000.0 388,000.0 233,412.0Financing Cash Flow Items -300,000.0 -99,000.0 81,000.0 388,000.0 233,412.0 Repurchase/Retirement of Common
- 0.0 0.0 -801,000.0 0.0
Common Stock, Net - 0.0 0.0 -801,000.0 0.0Issuance (Retirement) of Stock, - 0.0 0.0 -801,000.0 0.0
Avention One-Stop Reports for Google Inc
Page 93
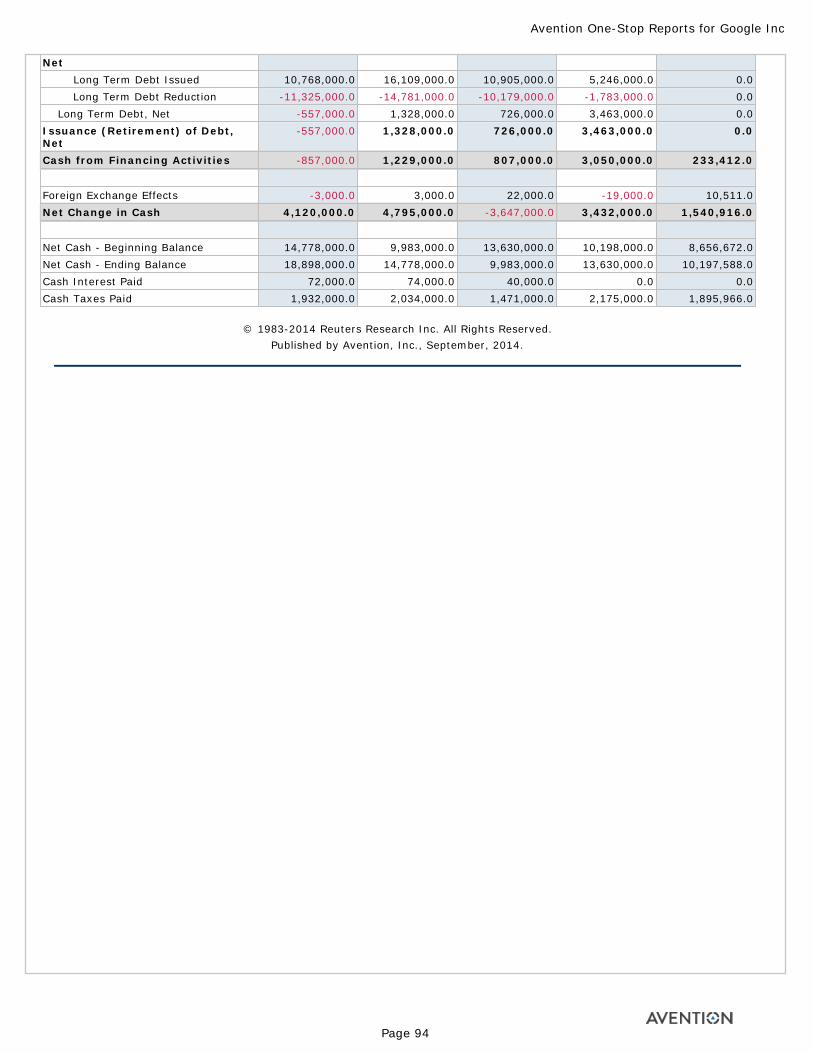
Net Long Term Debt Issued 10,768,000.0 16,109,000.0 10,905,000.0 5,246,000.0 0.0 Long Term Debt Reduction -11,325,000.0 -14,781,000.0 -10,179,000.0 -1,783,000.0 0.0 Long Term Debt, Net -557,000.0 1,328,000.0 726,000.0 3,463,000.0 0.0Issuance (Retirement) of Debt, Net
-557,000.0 1,328,000.0 726,000.0 3,463,000.0 0.0
Cash from Financing Activities -857,000.0 1,229,000.0 807,000.0 3,050,000.0 233,412.0
Foreign Exchange Effects -3,000.0 3,000.0 22,000.0 -19,000.0 10,511.0Net Change in Cash 4,120,000.0 4,795,000.0 -3,647,000.0 3,432,000.0 1,540,916.0
Net Cash - Beginning Balance 14,778,000.0 9,983,000.0 13,630,000.0 10,198,000.0 8,656,672.0Net Cash - Ending Balance 18,898,000.0 14,778,000.0 9,983,000.0 13,630,000.0 10,197,588.0Cash Interest Paid 72,000.0 74,000.0 40,000.0 0.0 0.0Cash Taxes Paid 1,932,000.0 2,034,000.0 1,471,000.0 2,175,000.0 1,895,966.0
© 1983-2014 Reuters Research Inc. All Rights Reserved. Published by Avention, Inc., September, 2014.
Avention One-Stop Reports for Google Inc
Page 94
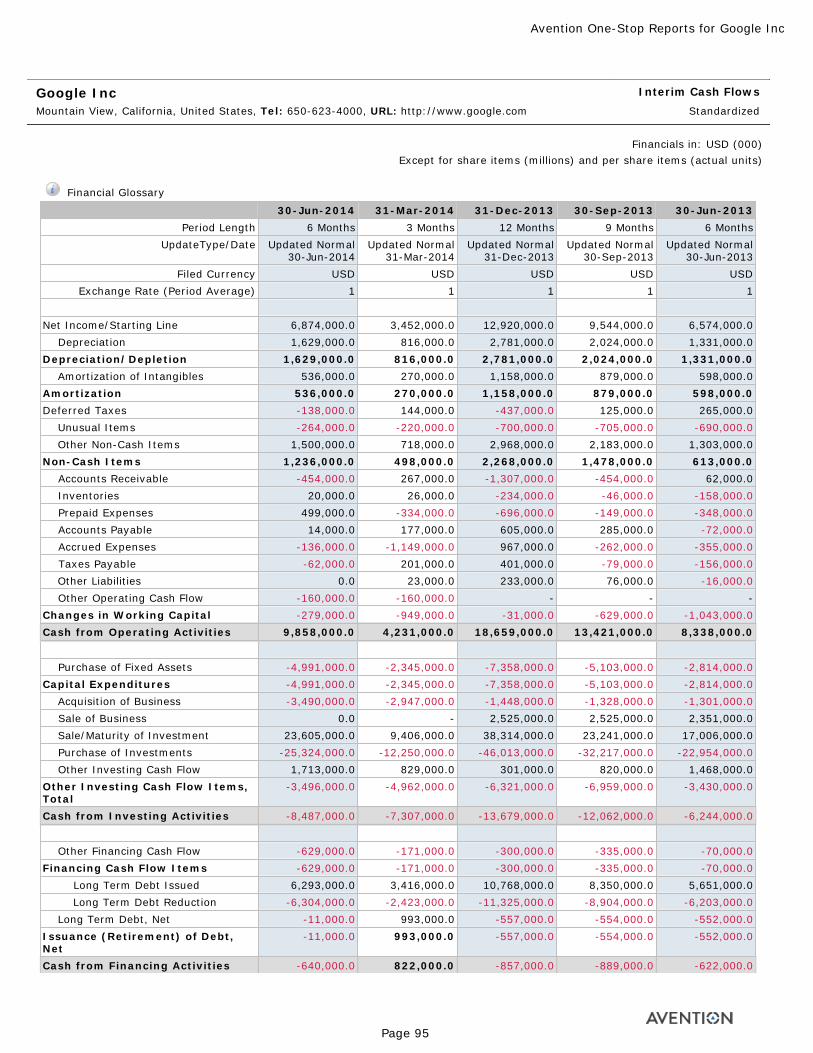
Google Inc Mountain View, California, United States, Tel: 650-623-4000, URL: http://www.google.com
Interim Cash Flows
Standardized
Financials in: USD (000)Except for share items (millions) and per share items (actual units)
Financial Glossary
30-Jun-2014 31-Mar-2014 31-Dec-2013 30-Sep-2013 30-Jun-2013Period Length 6 Months 3 Months 12 Months 9 Months 6 Months
UpdateType/Date Updated Normal 30-Jun-2014
Updated Normal 31-Mar-2014
Updated Normal 31-Dec-2013
Updated Normal 30-Sep-2013
Updated Normal 30-Jun-2013
Filed Currency USD USD USD USD USDExchange Rate (Period Average) 1 1 1 1 1
Net Income/Starting Line 6,874,000.0 3,452,000.0 12,920,000.0 9,544,000.0 6,574,000.0 Depreciation 1,629,000.0 816,000.0 2,781,000.0 2,024,000.0 1,331,000.0Depreciation/Depletion 1,629,000.0 816,000.0 2,781,000.0 2,024,000.0 1,331,000.0 Amortization of Intangibles 536,000.0 270,000.0 1,158,000.0 879,000.0 598,000.0Amortization 536,000.0 270,000.0 1,158,000.0 879,000.0 598,000.0Deferred Taxes -138,000.0 144,000.0 -437,000.0 125,000.0 265,000.0 Unusual Items -264,000.0 -220,000.0 -700,000.0 -705,000.0 -690,000.0 Other Non-Cash Items 1,500,000.0 718,000.0 2,968,000.0 2,183,000.0 1,303,000.0Non-Cash Items 1,236,000.0 498,000.0 2,268,000.0 1,478,000.0 613,000.0 Accounts Receivable -454,000.0 267,000.0 -1,307,000.0 -454,000.0 62,000.0 Inventories 20,000.0 26,000.0 -234,000.0 -46,000.0 -158,000.0 Prepaid Expenses 499,000.0 -334,000.0 -696,000.0 -149,000.0 -348,000.0 Accounts Payable 14,000.0 177,000.0 605,000.0 285,000.0 -72,000.0 Accrued Expenses -136,000.0 -1,149,000.0 967,000.0 -262,000.0 -355,000.0 Taxes Payable -62,000.0 201,000.0 401,000.0 -79,000.0 -156,000.0 Other Liabilities 0.0 23,000.0 233,000.0 76,000.0 -16,000.0 Other Operating Cash Flow -160,000.0 -160,000.0 - - -Changes in Working Capital -279,000.0 -949,000.0 -31,000.0 -629,000.0 -1,043,000.0Cash from Operating Activities 9,858,000.0 4,231,000.0 18,659,000.0 13,421,000.0 8,338,000.0
Purchase of Fixed Assets -4,991,000.0 -2,345,000.0 -7,358,000.0 -5,103,000.0 -2,814,000.0Capital Expenditures -4,991,000.0 -2,345,000.0 -7,358,000.0 -5,103,000.0 -2,814,000.0 Acquisition of Business -3,490,000.0 -2,947,000.0 -1,448,000.0 -1,328,000.0 -1,301,000.0 Sale of Business 0.0 - 2,525,000.0 2,525,000.0 2,351,000.0 Sale/Maturity of Investment 23,605,000.0 9,406,000.0 38,314,000.0 23,241,000.0 17,006,000.0 Purchase of Investments -25,324,000.0 -12,250,000.0 -46,013,000.0 -32,217,000.0 -22,954,000.0 Other Investing Cash Flow 1,713,000.0 829,000.0 301,000.0 820,000.0 1,468,000.0Other Investing Cash Flow Items, Total
-3,496,000.0 -4,962,000.0 -6,321,000.0 -6,959,000.0 -3,430,000.0
Cash from Investing Activities -8,487,000.0 -7,307,000.0 -13,679,000.0 -12,062,000.0 -6,244,000.0
Other Financing Cash Flow -629,000.0 -171,000.0 -300,000.0 -335,000.0 -70,000.0Financing Cash Flow Items -629,000.0 -171,000.0 -300,000.0 -335,000.0 -70,000.0 Long Term Debt Issued 6,293,000.0 3,416,000.0 10,768,000.0 8,350,000.0 5,651,000.0 Long Term Debt Reduction -6,304,000.0 -2,423,000.0 -11,325,000.0 -8,904,000.0 -6,203,000.0 Long Term Debt, Net -11,000.0 993,000.0 -557,000.0 -554,000.0 -552,000.0Issuance (Retirement) of Debt, Net
-11,000.0 993,000.0 -557,000.0 -554,000.0 -552,000.0
Cash from Financing Activities -640,000.0 822,000.0 -857,000.0 -889,000.0 -622,000.0
Avention One-Stop Reports for Google Inc
Page 95
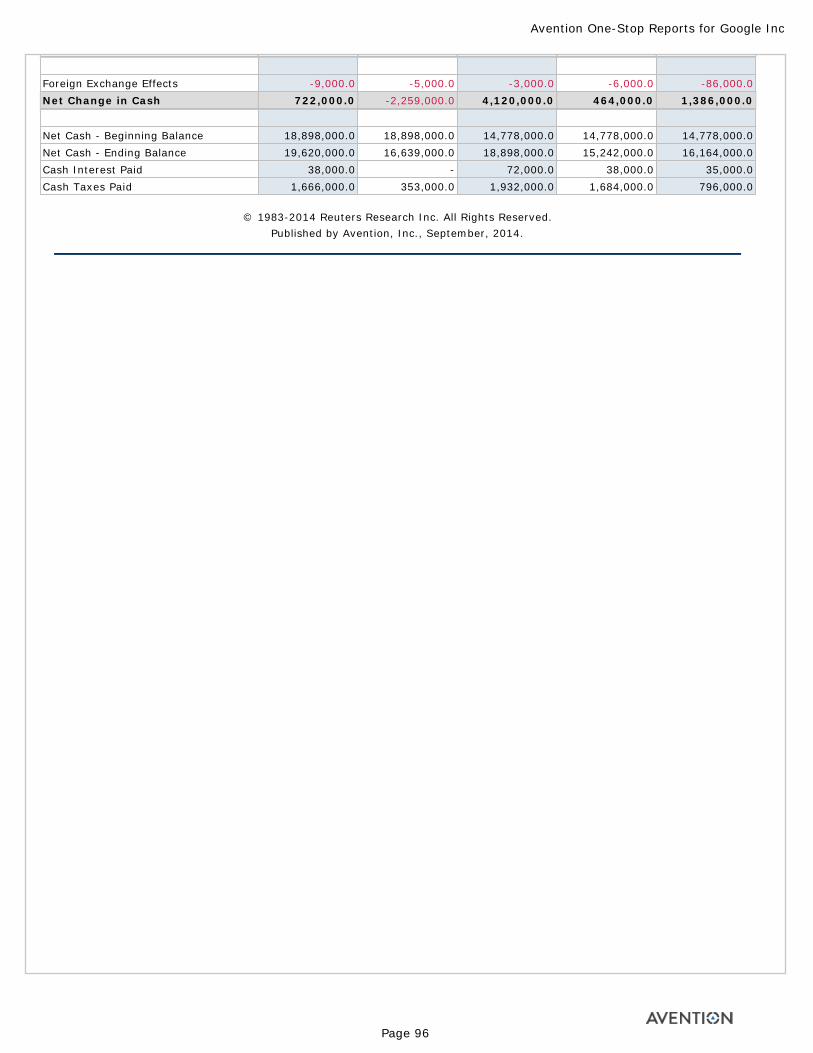
Foreign Exchange Effects -9,000.0 -5,000.0 -3,000.0 -6,000.0 -86,000.0Net Change in Cash 722,000.0 -2,259,000.0 4,120,000.0 464,000.0 1,386,000.0
Net Cash - Beginning Balance 18,898,000.0 18,898,000.0 14,778,000.0 14,778,000.0 14,778,000.0Net Cash - Ending Balance 19,620,000.0 16,639,000.0 18,898,000.0 15,242,000.0 16,164,000.0Cash Interest Paid 38,000.0 - 72,000.0 38,000.0 35,000.0Cash Taxes Paid 1,666,000.0 353,000.0 1,932,000.0 1,684,000.0 796,000.0
© 1983-2014 Reuters Research Inc. All Rights Reserved. Published by Avention, Inc., September, 2014.
Avention One-Stop Reports for Google Inc
Page 96
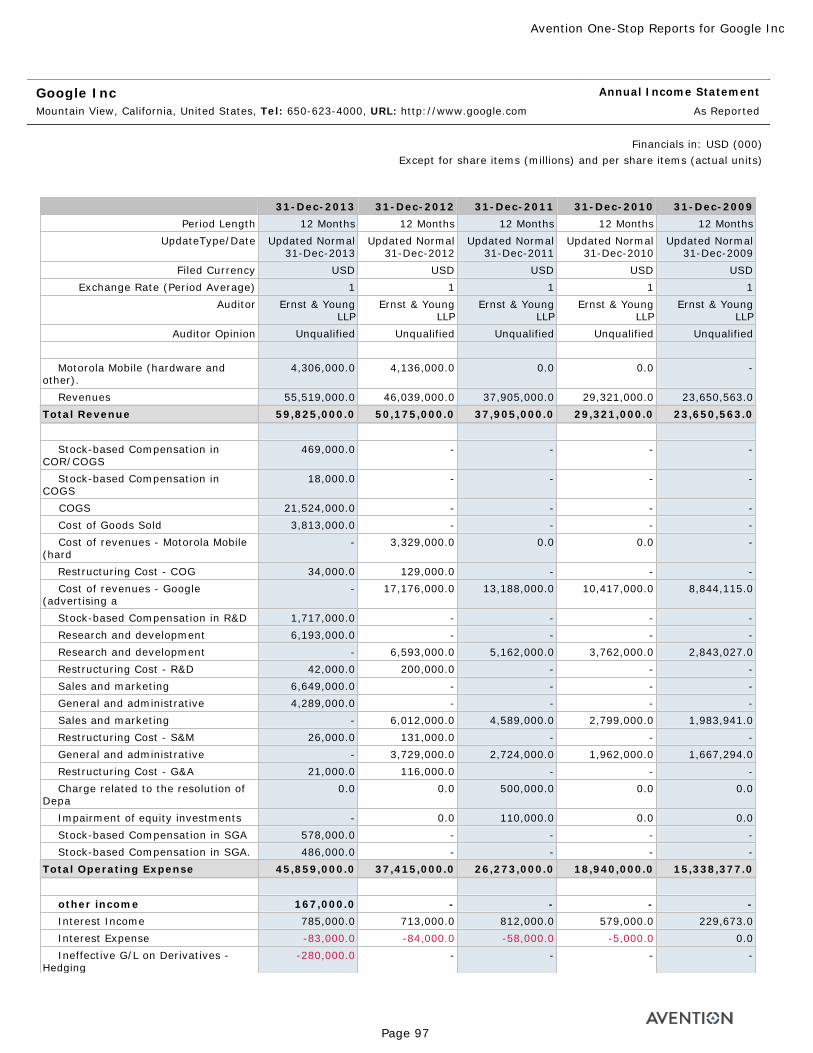
Google Inc Mountain View, California, United States, Tel: 650-623-4000, URL: http://www.google.com
Annual Income Statement
As Reported
Financials in: USD (000)Except for share items (millions) and per share items (actual units)
31-Dec-2013 31-Dec-2012 31-Dec-2011 31-Dec-2010 31-Dec-2009Period Length 12 Months 12 Months 12 Months 12 Months 12 Months
UpdateType/Date Updated Normal 31-Dec-2013
Updated Normal 31-Dec-2012
Updated Normal 31-Dec-2011
Updated Normal 31-Dec-2010
Updated Normal 31-Dec-2009
Filed Currency USD USD USD USD USDExchange Rate (Period Average) 1 1 1 1 1
Auditor Ernst & Young LLP
Ernst & Young LLP
Ernst & Young LLP
Ernst & Young LLP
Ernst & Young LLP
Auditor Opinion Unqualified Unqualified Unqualified Unqualified Unqualified
Motorola Mobile (hardware and other).
4,306,000.0 4,136,000.0 0.0 0.0 -
Revenues 55,519,000.0 46,039,000.0 37,905,000.0 29,321,000.0 23,650,563.0Total Revenue 59,825,000.0 50,175,000.0 37,905,000.0 29,321,000.0 23,650,563.0
Stock-based Compensation in COR/COGS
469,000.0 - - - -
Stock-based Compensation in COGS
18,000.0 - - - -
COGS 21,524,000.0 - - - - Cost of Goods Sold 3,813,000.0 - - - - Cost of revenues - Motorola Mobile (hard
- 3,329,000.0 0.0 0.0 -
Restructuring Cost - COG 34,000.0 129,000.0 - - - Cost of revenues - Google (advertising a
- 17,176,000.0 13,188,000.0 10,417,000.0 8,844,115.0
Stock-based Compensation in R&D 1,717,000.0 - - - - Research and development 6,193,000.0 - - - - Research and development - 6,593,000.0 5,162,000.0 3,762,000.0 2,843,027.0 Restructuring Cost - R&D 42,000.0 200,000.0 - - - Sales and marketing 6,649,000.0 - - - - General and administrative 4,289,000.0 - - - - Sales and marketing - 6,012,000.0 4,589,000.0 2,799,000.0 1,983,941.0 Restructuring Cost - S&M 26,000.0 131,000.0 - - - General and administrative - 3,729,000.0 2,724,000.0 1,962,000.0 1,667,294.0 Restructuring Cost - G&A 21,000.0 116,000.0 - - - Charge related to the resolution of Depa
0.0 0.0 500,000.0 0.0 0.0
Impairment of equity investments - 0.0 110,000.0 0.0 0.0 Stock-based Compensation in SGA 578,000.0 - - - - Stock-based Compensation in SGA. 486,000.0 - - - -Total Operating Expense 45,859,000.0 37,415,000.0 26,273,000.0 18,940,000.0 15,338,377.0
other income 167,000.0 - - - - Interest Income 785,000.0 713,000.0 812,000.0 579,000.0 229,673.0 Interest Expense -83,000.0 -84,000.0 -58,000.0 -5,000.0 0.0 Ineffective G/L on Derivatives - Hedging
-280,000.0 - - - -
Avention One-Stop Reports for Google Inc
Page 97

Ineffective G/L on Derivative 122,000.0 - - - - Ineffective G/L on Derivatives -9,000.0 - - - - Realized gains on marketable securities,
201,000.0 282,000.0 254,000.0 185,000.0 96,738.0
Foreign exchange gains (losses), net
-379,000.0 -531,000.0 -379,000.0 -355,000.0 -259,778.0
Other. 63,000.0 58,000.0 65,000.0 11,000.0 2,370.0 Gain on divestiture of business -57,000.0 188,000.0 0.0 0.0 -Net Income Before Taxes 14,496,000.0 13,386,000.0 12,326,000.0 10,796,000.0 8,381,189.0
Provision for Income Taxes 2,282,000.0 2,598,000.0 2,589,000.0 2,291,000.0 1,860,741.0Net Income After Taxes 12,214,000.0 10,788,000.0 9,737,000.0 8,505,000.0 6,520,448.0
Net Income Before Extra. Items 12,214,000.0 10,788,000.0 9,737,000.0 8,505,000.0 6,520,448.0 Net income (loss) from discontinued oper
706,000.0 -51,000.0 0.0 0.0 -
Net Income 12,920,000.0 10,737,000.0 9,737,000.0 8,505,000.0 6,520,448.0
Income Available to Com Excl ExtraOrd
12,214,000.0 10,788,000.0 9,737,000.0 8,505,000.0 6,520,448.0
Income Available to Com Incl ExtraOrd
12,920,000.0 10,737,000.0 9,737,000.0 8,505,000.0 6,520,448.0
Basic Weighted Average Shares 665.0 654.4 645.6 637.4 632.4Basic EPS Excluding ExtraOrdinary Items
18.37 16.48 15.08 13.34 10.31
Basic EPS Including ExtraOrdinary Items
19.43 16.41 15.08 13.34 10.31
Dilution Adjustment 0.0 - 0.0 0.0 0.0Diluted Net Income 12,920,000.0 10,737,000.0 9,737,000.0 8,505,000.0 6,520,448.0Diluted Weighted Average Shares 677.0 664.6 654.4 646.5 638.8Diluted EPS Excluding ExtraOrd Items 18.04 16.23 14.88 13.16 10.21Diluted EPS Including ExtraOrd Items 19.09 16.16 14.88 13.16 10.21DPS-Ordinary Shares Class A 0.00 0.00 0.00 0.00 0.00DPS-Ordinary Shares Class B 0.00 0.00 0.00 0.00 0.00Gross Dividends - Common Stock 0.0 0.0 0.0 0.0 0.0Normalized Income Before Taxes 14,676,000.0 13,774,000.0 12,936,000.0 10,796,000.0 8,381,189.0
Inc Tax Ex Impact of Sp Items 2,310,336.1 2,673,304.4 2,717,126.7 2,291,000.0 1,860,741.0Normalized Income After Taxes 12,365,663.9 11,100,695.7 10,218,873.3 8,505,000.0 6,520,448.0
Normalized Inc. Avail to Com. 12,365,663.9 11,100,695.7 10,218,873.3 8,505,000.0 6,520,448.0
Basic Normalized EPS 18.59 16.96 15.83 13.34 10.31Diluted Normalized EPS 18.27 16.70 15.61 13.16 10.21Stock-based Compensation in R&D 1,717,000.0 - - - -Research and development 6,193,000.0 - - - -Research and development - 6,593,000.0 5,162,000.0 3,762,000.0 2,843,027.0Interest Expense 83,000.0 - - - -Interest Expense - 84,000.0 58,000.0 5,000.0 0.0Amort of Intangibles 1,158,000.0 884,000.0 441,000.0 314,000.0 266,000.0Rental Expense 380,000.0 448,000.0 380,000.0 293,000.0 323,200.0Depreciation 2,781,000.0 1,988,000.0 1,396,000.0 1,067,000.0 1,240,030.0Advertising Expense 2,848,000.0 772,000.0 1,544,000.0 772,000.0 353,400.0
Avention One-Stop Reports for Google Inc
Page 98
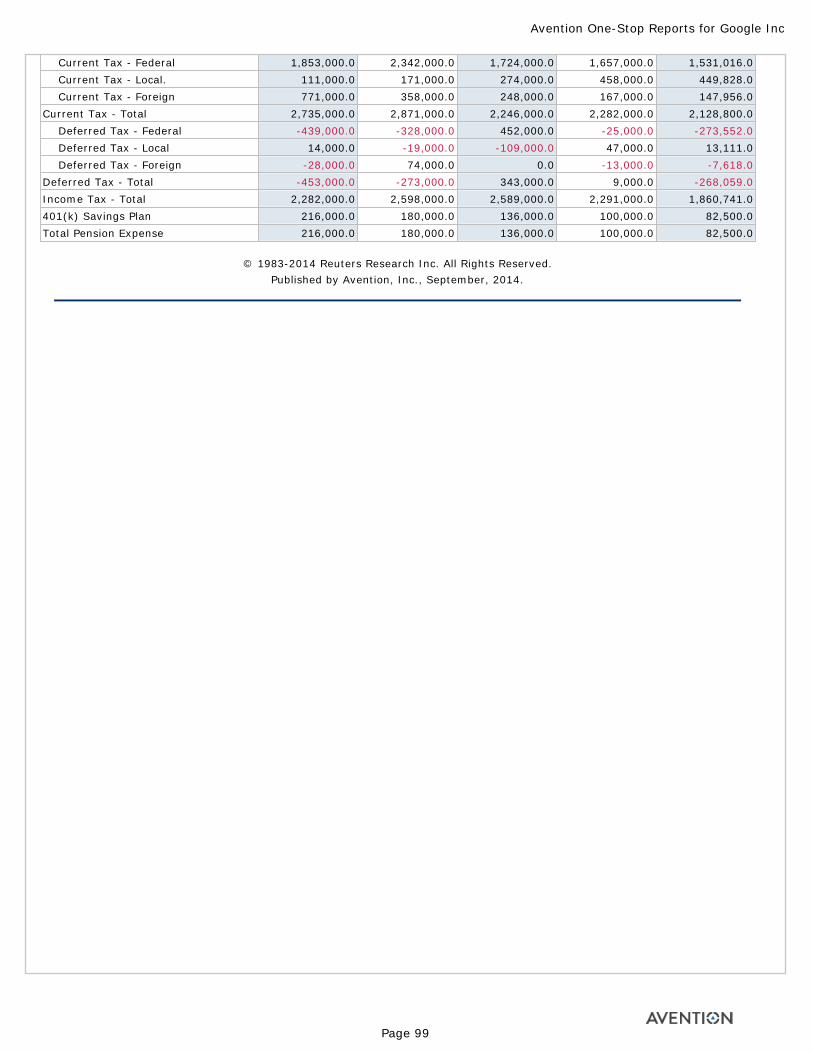
Current Tax - Federal 1,853,000.0 2,342,000.0 1,724,000.0 1,657,000.0 1,531,016.0 Current Tax - Local. 111,000.0 171,000.0 274,000.0 458,000.0 449,828.0 Current Tax - Foreign 771,000.0 358,000.0 248,000.0 167,000.0 147,956.0Current Tax - Total 2,735,000.0 2,871,000.0 2,246,000.0 2,282,000.0 2,128,800.0 Deferred Tax - Federal -439,000.0 -328,000.0 452,000.0 -25,000.0 -273,552.0 Deferred Tax - Local 14,000.0 -19,000.0 -109,000.0 47,000.0 13,111.0 Deferred Tax - Foreign -28,000.0 74,000.0 0.0 -13,000.0 -7,618.0Deferred Tax - Total -453,000.0 -273,000.0 343,000.0 9,000.0 -268,059.0Income Tax - Total 2,282,000.0 2,598,000.0 2,589,000.0 2,291,000.0 1,860,741.0401(k) Savings Plan 216,000.0 180,000.0 136,000.0 100,000.0 82,500.0Total Pension Expense 216,000.0 180,000.0 136,000.0 100,000.0 82,500.0
© 1983-2014 Reuters Research Inc. All Rights Reserved. Published by Avention, Inc., September, 2014.
Avention One-Stop Reports for Google Inc
Page 99
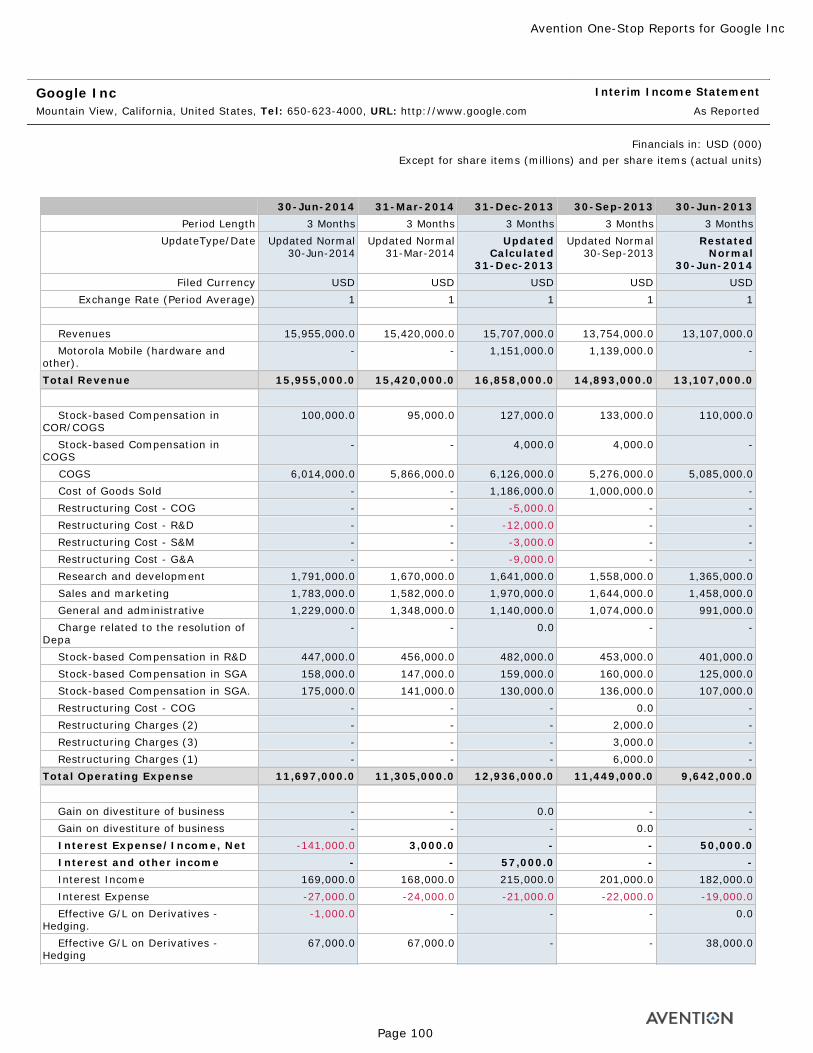
Google Inc Mountain View, California, United States, Tel: 650-623-4000, URL: http://www.google.com
Interim Income Statement
As Reported
Financials in: USD (000)Except for share items (millions) and per share items (actual units)
30-Jun-2014 31-Mar-2014 31-Dec-2013 30-Sep-2013 30-Jun-2013Period Length 3 Months 3 Months 3 Months 3 Months 3 Months
UpdateType/Date Updated Normal 30-Jun-2014
Updated Normal 31-Mar-2014
Updated Calculated
31-Dec-2013
Updated Normal 30-Sep-2013
Restated Normal
30-Jun-2014 Filed Currency USD USD USD USD USD
Exchange Rate (Period Average) 1 1 1 1 1
Revenues 15,955,000.0 15,420,000.0 15,707,000.0 13,754,000.0 13,107,000.0 Motorola Mobile (hardware and other).
- - 1,151,000.0 1,139,000.0 -
Total Revenue 15,955,000.0 15,420,000.0 16,858,000.0 14,893,000.0 13,107,000.0
Stock-based Compensation in COR/COGS
100,000.0 95,000.0 127,000.0 133,000.0 110,000.0
Stock-based Compensation in COGS
- - 4,000.0 4,000.0 -
COGS 6,014,000.0 5,866,000.0 6,126,000.0 5,276,000.0 5,085,000.0 Cost of Goods Sold - - 1,186,000.0 1,000,000.0 - Restructuring Cost - COG - - -5,000.0 - - Restructuring Cost - R&D - - -12,000.0 - - Restructuring Cost - S&M - - -3,000.0 - - Restructuring Cost - G&A - - -9,000.0 - - Research and development 1,791,000.0 1,670,000.0 1,641,000.0 1,558,000.0 1,365,000.0 Sales and marketing 1,783,000.0 1,582,000.0 1,970,000.0 1,644,000.0 1,458,000.0 General and administrative 1,229,000.0 1,348,000.0 1,140,000.0 1,074,000.0 991,000.0 Charge related to the resolution of Depa
- - 0.0 - -
Stock-based Compensation in R&D 447,000.0 456,000.0 482,000.0 453,000.0 401,000.0 Stock-based Compensation in SGA 158,000.0 147,000.0 159,000.0 160,000.0 125,000.0 Stock-based Compensation in SGA. 175,000.0 141,000.0 130,000.0 136,000.0 107,000.0 Restructuring Cost - COG - - - 0.0 - Restructuring Charges (2) - - - 2,000.0 - Restructuring Charges (3) - - - 3,000.0 - Restructuring Charges (1) - - - 6,000.0 -Total Operating Expense 11,697,000.0 11,305,000.0 12,936,000.0 11,449,000.0 9,642,000.0
Gain on divestiture of business - - 0.0 - - Gain on divestiture of business - - - 0.0 - Interest Expense/Income, Net -141,000.0 3,000.0 - - 50,000.0 Interest and other income - - 57,000.0 - - Interest Income 169,000.0 168,000.0 215,000.0 201,000.0 182,000.0 Interest Expense -27,000.0 -24,000.0 -21,000.0 -22,000.0 -19,000.0 Effective G/L on Derivatives - Hedging.
-1,000.0 - - - 0.0
Effective G/L on Derivatives - Hedging
67,000.0 67,000.0 - - 38,000.0
Avention One-Stop Reports for Google Inc
Page 100
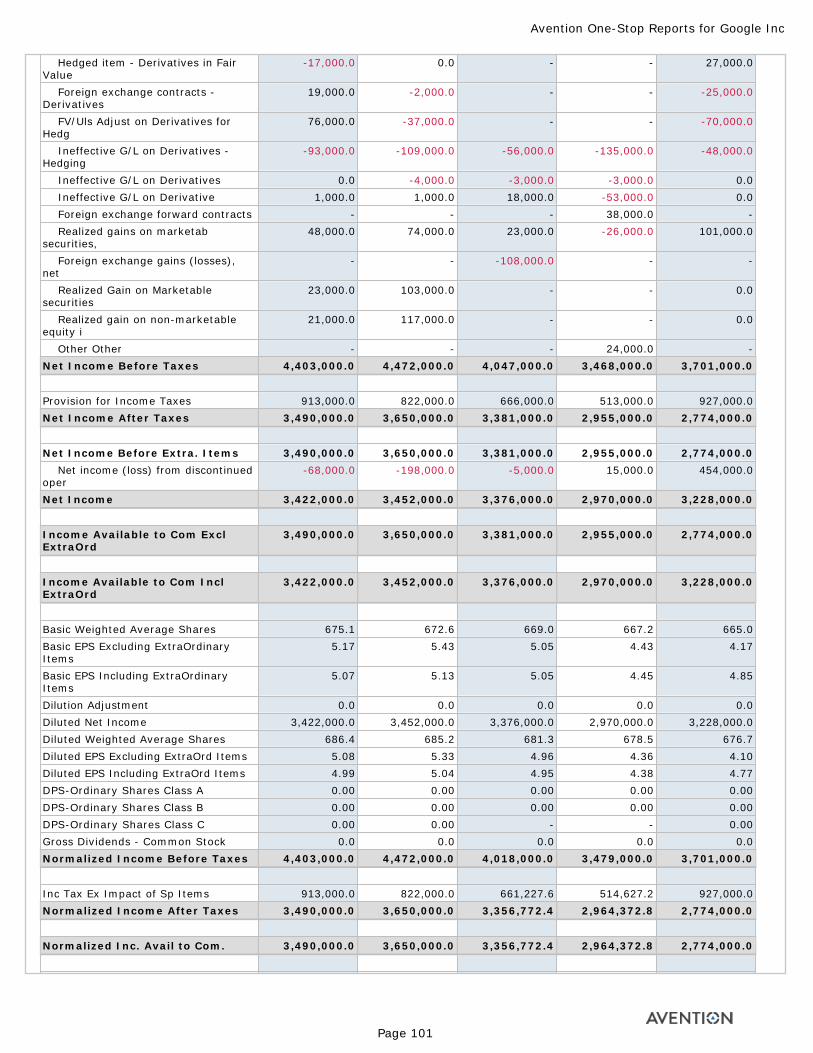
Hedged item - Derivatives in Fair Value
-17,000.0 0.0 - - 27,000.0
Foreign exchange contracts - Derivatives
19,000.0 -2,000.0 - - -25,000.0
FV/Uls Adjust on Derivatives for Hedg
76,000.0 -37,000.0 - - -70,000.0
Ineffective G/L on Derivatives - Hedging
-93,000.0 -109,000.0 -56,000.0 -135,000.0 -48,000.0
Ineffective G/L on Derivatives 0.0 -4,000.0 -3,000.0 -3,000.0 0.0 Ineffective G/L on Derivative 1,000.0 1,000.0 18,000.0 -53,000.0 0.0 Foreign exchange forward contracts - - - 38,000.0 - Realized gains on marketab securities,
48,000.0 74,000.0 23,000.0 -26,000.0 101,000.0
Foreign exchange gains (losses), net
- - -108,000.0 - -
Realized Gain on Marketable securities
23,000.0 103,000.0 - - 0.0
Realized gain on non-marketable equity i
21,000.0 117,000.0 - - 0.0
Other Other - - - 24,000.0 -Net Income Before Taxes 4,403,000.0 4,472,000.0 4,047,000.0 3,468,000.0 3,701,000.0
Provision for Income Taxes 913,000.0 822,000.0 666,000.0 513,000.0 927,000.0Net Income After Taxes 3,490,000.0 3,650,000.0 3,381,000.0 2,955,000.0 2,774,000.0
Net Income Before Extra. Items 3,490,000.0 3,650,000.0 3,381,000.0 2,955,000.0 2,774,000.0 Net income (loss) from discontinued oper
-68,000.0 -198,000.0 -5,000.0 15,000.0 454,000.0
Net Income 3,422,000.0 3,452,000.0 3,376,000.0 2,970,000.0 3,228,000.0
Income Available to Com Excl ExtraOrd
3,490,000.0 3,650,000.0 3,381,000.0 2,955,000.0 2,774,000.0
Income Available to Com Incl ExtraOrd
3,422,000.0 3,452,000.0 3,376,000.0 2,970,000.0 3,228,000.0
Basic Weighted Average Shares 675.1 672.6 669.0 667.2 665.0Basic EPS Excluding ExtraOrdinary Items
5.17 5.43 5.05 4.43 4.17
Basic EPS Including ExtraOrdinary Items
5.07 5.13 5.05 4.45 4.85
Dilution Adjustment 0.0 0.0 0.0 0.0 0.0Diluted Net Income 3,422,000.0 3,452,000.0 3,376,000.0 2,970,000.0 3,228,000.0Diluted Weighted Average Shares 686.4 685.2 681.3 678.5 676.7Diluted EPS Excluding ExtraOrd Items 5.08 5.33 4.96 4.36 4.10Diluted EPS Including ExtraOrd Items 4.99 5.04 4.95 4.38 4.77DPS-Ordinary Shares Class A 0.00 0.00 0.00 0.00 0.00DPS-Ordinary Shares Class B 0.00 0.00 0.00 0.00 0.00DPS-Ordinary Shares Class C 0.00 0.00 - - 0.00Gross Dividends - Common Stock 0.0 0.0 0.0 0.0 0.0Normalized Income Before Taxes 4,403,000.0 4,472,000.0 4,018,000.0 3,479,000.0 3,701,000.0
Inc Tax Ex Impact of Sp Items 913,000.0 822,000.0 661,227.6 514,627.2 927,000.0Normalized Income After Taxes 3,490,000.0 3,650,000.0 3,356,772.4 2,964,372.8 2,774,000.0
Normalized Inc. Avail to Com. 3,490,000.0 3,650,000.0 3,356,772.4 2,964,372.8 2,774,000.0
Avention One-Stop Reports for Google Inc
Page 101
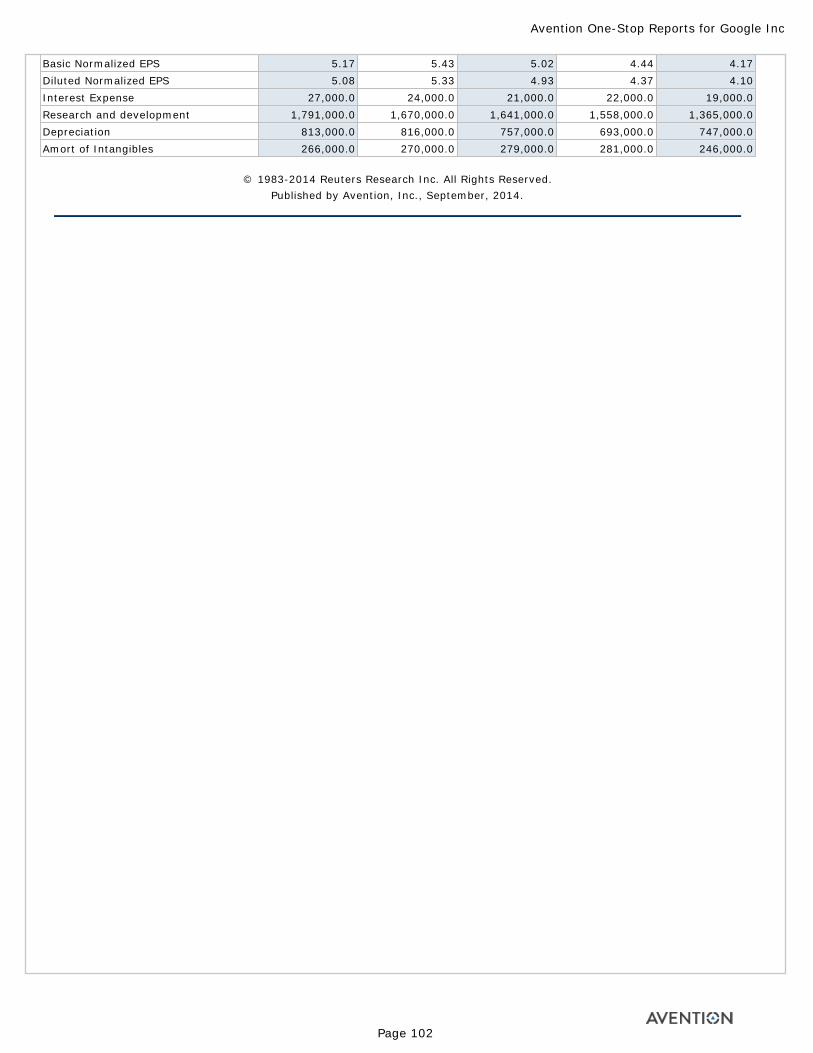
Basic Normalized EPS 5.17 5.43 5.02 4.44 4.17Diluted Normalized EPS 5.08 5.33 4.93 4.37 4.10Interest Expense 27,000.0 24,000.0 21,000.0 22,000.0 19,000.0Research and development 1,791,000.0 1,670,000.0 1,641,000.0 1,558,000.0 1,365,000.0Depreciation 813,000.0 816,000.0 757,000.0 693,000.0 747,000.0Amort of Intangibles 266,000.0 270,000.0 279,000.0 281,000.0 246,000.0
© 1983-2014 Reuters Research Inc. All Rights Reserved. Published by Avention, Inc., September, 2014.
Avention One-Stop Reports for Google Inc
Page 102
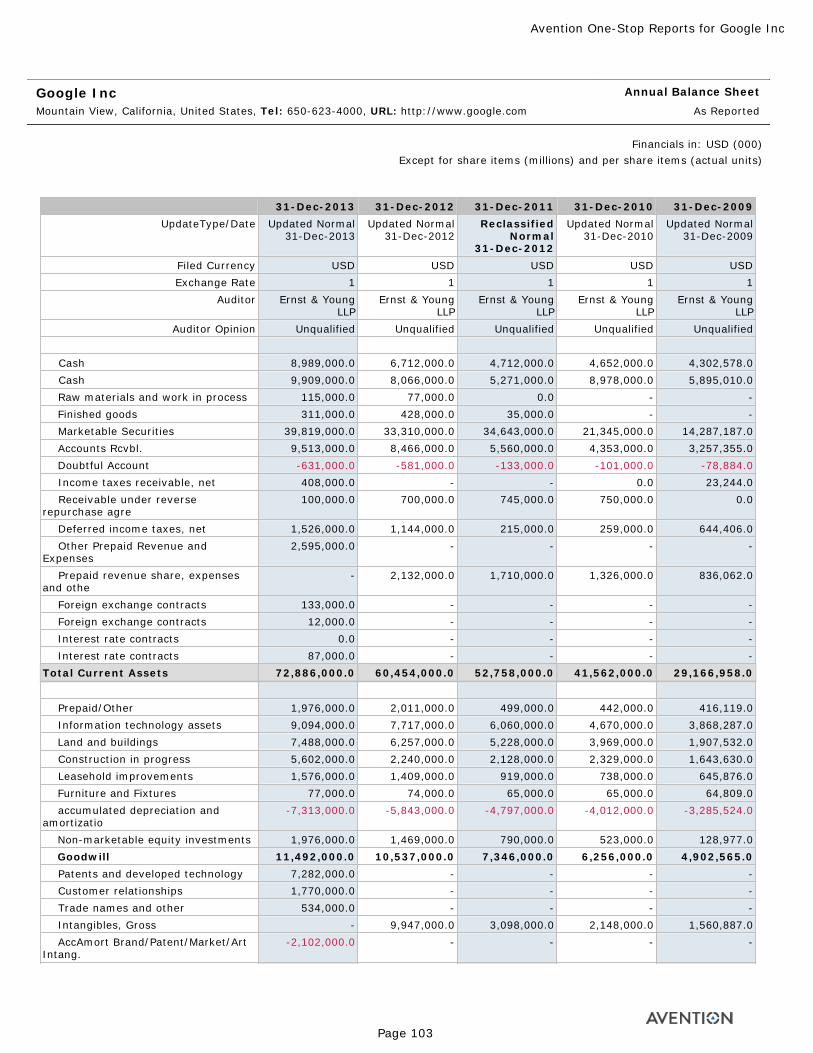
Google Inc Mountain View, California, United States, Tel: 650-623-4000, URL: http://www.google.com
Annual Balance Sheet
As Reported
Financials in: USD (000)Except for share items (millions) and per share items (actual units)
31-Dec-2013 31-Dec-2012 31-Dec-2011 31-Dec-2010 31-Dec-2009UpdateType/Date Updated Normal
31-Dec-2013Updated Normal
31-Dec-2012Reclassified
Normal 31-Dec-2012
Updated Normal 31-Dec-2010
Updated Normal 31-Dec-2009
Filed Currency USD USD USD USD USDExchange Rate 1 1 1 1 1
Auditor Ernst & Young LLP
Ernst & Young LLP
Ernst & Young LLP
Ernst & Young LLP
Ernst & Young LLP
Auditor Opinion Unqualified Unqualified Unqualified Unqualified Unqualified
Cash 8,989,000.0 6,712,000.0 4,712,000.0 4,652,000.0 4,302,578.0 Cash 9,909,000.0 8,066,000.0 5,271,000.0 8,978,000.0 5,895,010.0 Raw materials and work in process 115,000.0 77,000.0 0.0 - - Finished goods 311,000.0 428,000.0 35,000.0 - - Marketable Securities 39,819,000.0 33,310,000.0 34,643,000.0 21,345,000.0 14,287,187.0 Accounts Rcvbl. 9,513,000.0 8,466,000.0 5,560,000.0 4,353,000.0 3,257,355.0 Doubtful Account -631,000.0 -581,000.0 -133,000.0 -101,000.0 -78,884.0 Income taxes receivable, net 408,000.0 - - 0.0 23,244.0 Receivable under reverse repurchase agre
100,000.0 700,000.0 745,000.0 750,000.0 0.0
Deferred income taxes, net 1,526,000.0 1,144,000.0 215,000.0 259,000.0 644,406.0 Other Prepaid Revenue and Expenses
2,595,000.0 - - - -
Prepaid revenue share, expenses and othe
- 2,132,000.0 1,710,000.0 1,326,000.0 836,062.0
Foreign exchange contracts 133,000.0 - - - - Foreign exchange contracts 12,000.0 - - - - Interest rate contracts 0.0 - - - - Interest rate contracts 87,000.0 - - - -Total Current Assets 72,886,000.0 60,454,000.0 52,758,000.0 41,562,000.0 29,166,958.0
Prepaid/Other 1,976,000.0 2,011,000.0 499,000.0 442,000.0 416,119.0 Information technology assets 9,094,000.0 7,717,000.0 6,060,000.0 4,670,000.0 3,868,287.0 Land and buildings 7,488,000.0 6,257,000.0 5,228,000.0 3,969,000.0 1,907,532.0 Construction in progress 5,602,000.0 2,240,000.0 2,128,000.0 2,329,000.0 1,643,630.0 Leasehold improvements 1,576,000.0 1,409,000.0 919,000.0 738,000.0 645,876.0 Furniture and Fixtures 77,000.0 74,000.0 65,000.0 65,000.0 64,809.0 accumulated depreciation and amortizatio
-7,313,000.0 -5,843,000.0 -4,797,000.0 -4,012,000.0 -3,285,524.0
Non-marketable equity investments 1,976,000.0 1,469,000.0 790,000.0 523,000.0 128,977.0 Goodwill 11,492,000.0 10,537,000.0 7,346,000.0 6,256,000.0 4,902,565.0 Patents and developed technology 7,282,000.0 - - - - Customer relationships 1,770,000.0 - - - - Trade names and other 534,000.0 - - - - Intangibles, Gross - 9,947,000.0 3,098,000.0 2,148,000.0 1,560,887.0 AccAmort Brand/Patent/Market/Art Intang.
-2,102,000.0 - - - -
Avention One-Stop Reports for Google Inc
Page 103
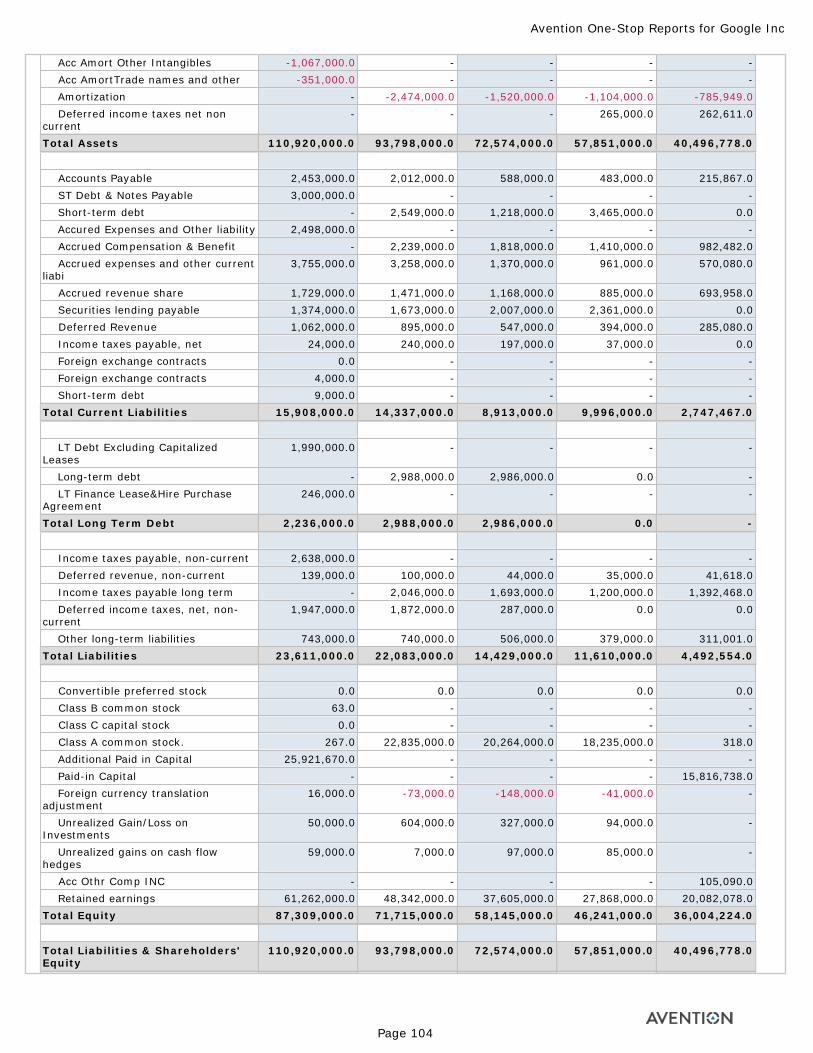
Acc Amort Other Intangibles -1,067,000.0 - - - - Acc AmortTrade names and other -351,000.0 - - - - Amortization - -2,474,000.0 -1,520,000.0 -1,104,000.0 -785,949.0 Deferred income taxes net non current
- - - 265,000.0 262,611.0
Total Assets 110,920,000.0 93,798,000.0 72,574,000.0 57,851,000.0 40,496,778.0
Accounts Payable 2,453,000.0 2,012,000.0 588,000.0 483,000.0 215,867.0 ST Debt & Notes Payable 3,000,000.0 - - - - Short-term debt - 2,549,000.0 1,218,000.0 3,465,000.0 0.0 Accured Expenses and Other liability 2,498,000.0 - - - - Accrued Compensation & Benefit - 2,239,000.0 1,818,000.0 1,410,000.0 982,482.0 Accrued expenses and other current liabi
3,755,000.0 3,258,000.0 1,370,000.0 961,000.0 570,080.0
Accrued revenue share 1,729,000.0 1,471,000.0 1,168,000.0 885,000.0 693,958.0 Securities lending payable 1,374,000.0 1,673,000.0 2,007,000.0 2,361,000.0 0.0 Deferred Revenue 1,062,000.0 895,000.0 547,000.0 394,000.0 285,080.0 Income taxes payable, net 24,000.0 240,000.0 197,000.0 37,000.0 0.0 Foreign exchange contracts 0.0 - - - - Foreign exchange contracts 4,000.0 - - - - Short-term debt 9,000.0 - - - -Total Current Liabilities 15,908,000.0 14,337,000.0 8,913,000.0 9,996,000.0 2,747,467.0
LT Debt Excluding Capitalized Leases
1,990,000.0 - - - -
Long-term debt - 2,988,000.0 2,986,000.0 0.0 - LT Finance Lease&Hire Purchase Agreement
246,000.0 - - - -
Total Long Term Debt 2,236,000.0 2,988,000.0 2,986,000.0 0.0 -
Income taxes payable, non-current 2,638,000.0 - - - - Deferred revenue, non-current 139,000.0 100,000.0 44,000.0 35,000.0 41,618.0 Income taxes payable long term - 2,046,000.0 1,693,000.0 1,200,000.0 1,392,468.0 Deferred income taxes, net, non-current
1,947,000.0 1,872,000.0 287,000.0 0.0 0.0
Other long-term liabilities 743,000.0 740,000.0 506,000.0 379,000.0 311,001.0Total Liabilities 23,611,000.0 22,083,000.0 14,429,000.0 11,610,000.0 4,492,554.0
Convertible preferred stock 0.0 0.0 0.0 0.0 0.0 Class B common stock 63.0 - - - - Class C capital stock 0.0 - - - - Class A common stock. 267.0 22,835,000.0 20,264,000.0 18,235,000.0 318.0 Additional Paid in Capital 25,921,670.0 - - - - Paid-in Capital - - - - 15,816,738.0 Foreign currency translation adjustment
16,000.0 -73,000.0 -148,000.0 -41,000.0 -
Unrealized Gain/Loss on Investments
50,000.0 604,000.0 327,000.0 94,000.0 -
Unrealized gains on cash flow hedges
59,000.0 7,000.0 97,000.0 85,000.0 -
Acc Othr Comp INC - - - - 105,090.0 Retained earnings 61,262,000.0 48,342,000.0 37,605,000.0 27,868,000.0 20,082,078.0Total Equity 87,309,000.0 71,715,000.0 58,145,000.0 46,241,000.0 36,004,224.0
Total Liabilities & Shareholders' Equity
110,920,000.0 93,798,000.0 72,574,000.0 57,851,000.0 40,496,778.0
Avention One-Stop Reports for Google Inc
Page 104
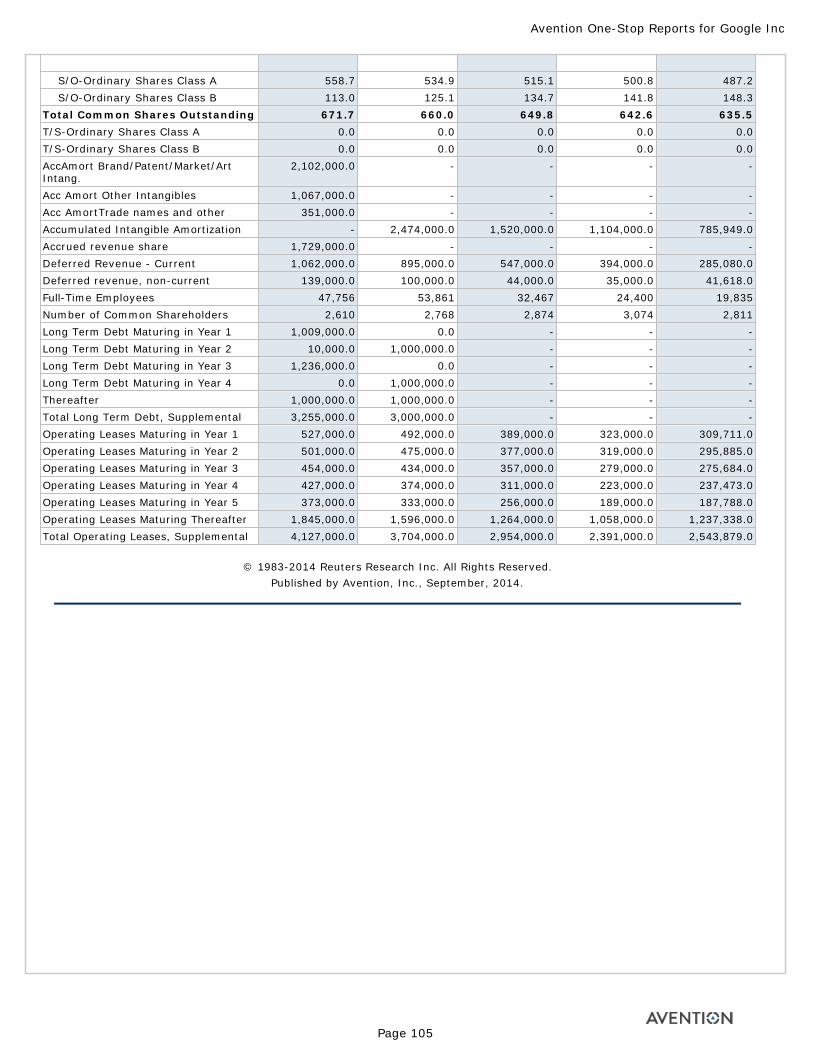
S/O-Ordinary Shares Class A 558.7 534.9 515.1 500.8 487.2 S/O-Ordinary Shares Class B 113.0 125.1 134.7 141.8 148.3Total Common Shares Outstanding 671.7 660.0 649.8 642.6 635.5T/S-Ordinary Shares Class A 0.0 0.0 0.0 0.0 0.0T/S-Ordinary Shares Class B 0.0 0.0 0.0 0.0 0.0AccAmort Brand/Patent/Market/Art Intang.
2,102,000.0 - - - -
Acc Amort Other Intangibles 1,067,000.0 - - - -Acc AmortTrade names and other 351,000.0 - - - -Accumulated Intangible Amortization - 2,474,000.0 1,520,000.0 1,104,000.0 785,949.0Accrued revenue share 1,729,000.0 - - - -Deferred Revenue - Current 1,062,000.0 895,000.0 547,000.0 394,000.0 285,080.0Deferred revenue, non-current 139,000.0 100,000.0 44,000.0 35,000.0 41,618.0Full-Time Employees 47,756 53,861 32,467 24,400 19,835Number of Common Shareholders 2,610 2,768 2,874 3,074 2,811Long Term Debt Maturing in Year 1 1,009,000.0 0.0 - - -Long Term Debt Maturing in Year 2 10,000.0 1,000,000.0 - - -Long Term Debt Maturing in Year 3 1,236,000.0 0.0 - - -Long Term Debt Maturing in Year 4 0.0 1,000,000.0 - - -Thereafter 1,000,000.0 1,000,000.0 - - -Total Long Term Debt, Supplemental 3,255,000.0 3,000,000.0 - - -Operating Leases Maturing in Year 1 527,000.0 492,000.0 389,000.0 323,000.0 309,711.0Operating Leases Maturing in Year 2 501,000.0 475,000.0 377,000.0 319,000.0 295,885.0Operating Leases Maturing in Year 3 454,000.0 434,000.0 357,000.0 279,000.0 275,684.0Operating Leases Maturing in Year 4 427,000.0 374,000.0 311,000.0 223,000.0 237,473.0Operating Leases Maturing in Year 5 373,000.0 333,000.0 256,000.0 189,000.0 187,788.0Operating Leases Maturing Thereafter 1,845,000.0 1,596,000.0 1,264,000.0 1,058,000.0 1,237,338.0Total Operating Leases, Supplemental 4,127,000.0 3,704,000.0 2,954,000.0 2,391,000.0 2,543,879.0
© 1983-2014 Reuters Research Inc. All Rights Reserved. Published by Avention, Inc., September, 2014.
Avention One-Stop Reports for Google Inc
Page 105
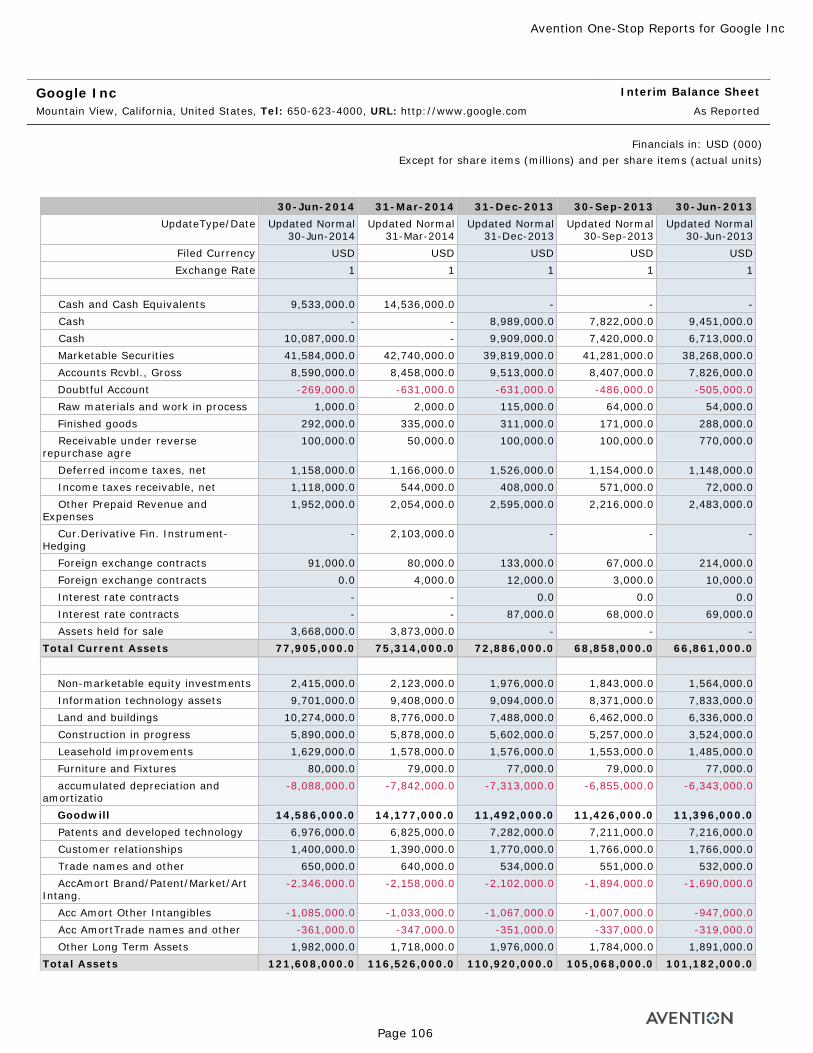
Google Inc Mountain View, California, United States, Tel: 650-623-4000, URL: http://www.google.com
Interim Balance Sheet
As Reported
Financials in: USD (000)Except for share items (millions) and per share items (actual units)
30-Jun-2014 31-Mar-2014 31-Dec-2013 30-Sep-2013 30-Jun-2013UpdateType/Date Updated Normal
30-Jun-2014Updated Normal
31-Mar-2014Updated Normal
31-Dec-2013Updated Normal
30-Sep-2013Updated Normal
30-Jun-2013Filed Currency USD USD USD USD USDExchange Rate 1 1 1 1 1
Cash and Cash Equivalents 9,533,000.0 14,536,000.0 - - - Cash - - 8,989,000.0 7,822,000.0 9,451,000.0 Cash 10,087,000.0 - 9,909,000.0 7,420,000.0 6,713,000.0 Marketable Securities 41,584,000.0 42,740,000.0 39,819,000.0 41,281,000.0 38,268,000.0 Accounts Rcvbl., Gross 8,590,000.0 8,458,000.0 9,513,000.0 8,407,000.0 7,826,000.0 Doubtful Account -269,000.0 -631,000.0 -631,000.0 -486,000.0 -505,000.0 Raw materials and work in process 1,000.0 2,000.0 115,000.0 64,000.0 54,000.0 Finished goods 292,000.0 335,000.0 311,000.0 171,000.0 288,000.0 Receivable under reverse repurchase agre
100,000.0 50,000.0 100,000.0 100,000.0 770,000.0
Deferred income taxes, net 1,158,000.0 1,166,000.0 1,526,000.0 1,154,000.0 1,148,000.0 Income taxes receivable, net 1,118,000.0 544,000.0 408,000.0 571,000.0 72,000.0 Other Prepaid Revenue and Expenses
1,952,000.0 2,054,000.0 2,595,000.0 2,216,000.0 2,483,000.0
Cur.Derivative Fin. Instrument-Hedging
- 2,103,000.0 - - -
Foreign exchange contracts 91,000.0 80,000.0 133,000.0 67,000.0 214,000.0 Foreign exchange contracts 0.0 4,000.0 12,000.0 3,000.0 10,000.0 Interest rate contracts - - 0.0 0.0 0.0 Interest rate contracts - - 87,000.0 68,000.0 69,000.0 Assets held for sale 3,668,000.0 3,873,000.0 - - -Total Current Assets 77,905,000.0 75,314,000.0 72,886,000.0 68,858,000.0 66,861,000.0
Non-marketable equity investments 2,415,000.0 2,123,000.0 1,976,000.0 1,843,000.0 1,564,000.0 Information technology assets 9,701,000.0 9,408,000.0 9,094,000.0 8,371,000.0 7,833,000.0 Land and buildings 10,274,000.0 8,776,000.0 7,488,000.0 6,462,000.0 6,336,000.0 Construction in progress 5,890,000.0 5,878,000.0 5,602,000.0 5,257,000.0 3,524,000.0 Leasehold improvements 1,629,000.0 1,578,000.0 1,576,000.0 1,553,000.0 1,485,000.0 Furniture and Fixtures 80,000.0 79,000.0 77,000.0 79,000.0 77,000.0 accumulated depreciation and amortizatio
-8,088,000.0 -7,842,000.0 -7,313,000.0 -6,855,000.0 -6,343,000.0
Goodwill 14,586,000.0 14,177,000.0 11,492,000.0 11,426,000.0 11,396,000.0 Patents and developed technology 6,976,000.0 6,825,000.0 7,282,000.0 7,211,000.0 7,216,000.0 Customer relationships 1,400,000.0 1,390,000.0 1,770,000.0 1,766,000.0 1,766,000.0 Trade names and other 650,000.0 640,000.0 534,000.0 551,000.0 532,000.0 AccAmort Brand/Patent/Market/Art Intang.
-2,346,000.0 -2,158,000.0 -2,102,000.0 -1,894,000.0 -1,690,000.0
Acc Amort Other Intangibles -1,085,000.0 -1,033,000.0 -1,067,000.0 -1,007,000.0 -947,000.0 Acc AmortTrade names and other -361,000.0 -347,000.0 -351,000.0 -337,000.0 -319,000.0 Other Long Term Assets 1,982,000.0 1,718,000.0 1,976,000.0 1,784,000.0 1,891,000.0Total Assets 121,608,000.0 116,526,000.0 110,920,000.0 105,068,000.0 101,182,000.0
Avention One-Stop Reports for Google Inc
Page 106
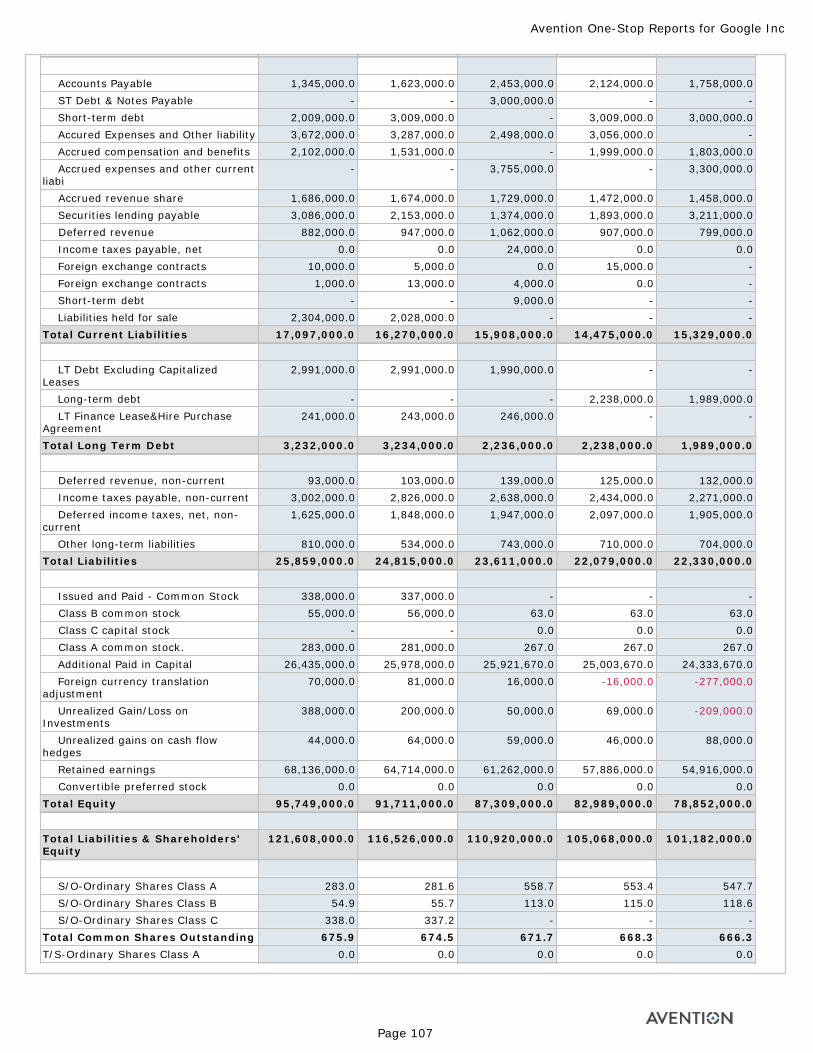
Accounts Payable 1,345,000.0 1,623,000.0 2,453,000.0 2,124,000.0 1,758,000.0 ST Debt & Notes Payable - - 3,000,000.0 - - Short-term debt 2,009,000.0 3,009,000.0 - 3,009,000.0 3,000,000.0 Accured Expenses and Other liability 3,672,000.0 3,287,000.0 2,498,000.0 3,056,000.0 - Accrued compensation and benefits 2,102,000.0 1,531,000.0 - 1,999,000.0 1,803,000.0 Accrued expenses and other current liabi
- - 3,755,000.0 - 3,300,000.0
Accrued revenue share 1,686,000.0 1,674,000.0 1,729,000.0 1,472,000.0 1,458,000.0 Securities lending payable 3,086,000.0 2,153,000.0 1,374,000.0 1,893,000.0 3,211,000.0 Deferred revenue 882,000.0 947,000.0 1,062,000.0 907,000.0 799,000.0 Income taxes payable, net 0.0 0.0 24,000.0 0.0 0.0 Foreign exchange contracts 10,000.0 5,000.0 0.0 15,000.0 - Foreign exchange contracts 1,000.0 13,000.0 4,000.0 0.0 - Short-term debt - - 9,000.0 - - Liabilities held for sale 2,304,000.0 2,028,000.0 - - -Total Current Liabilities 17,097,000.0 16,270,000.0 15,908,000.0 14,475,000.0 15,329,000.0
LT Debt Excluding Capitalized Leases
2,991,000.0 2,991,000.0 1,990,000.0 - -
Long-term debt - - - 2,238,000.0 1,989,000.0 LT Finance Lease&Hire Purchase Agreement
241,000.0 243,000.0 246,000.0 - -
Total Long Term Debt 3,232,000.0 3,234,000.0 2,236,000.0 2,238,000.0 1,989,000.0
Deferred revenue, non-current 93,000.0 103,000.0 139,000.0 125,000.0 132,000.0 Income taxes payable, non-current 3,002,000.0 2,826,000.0 2,638,000.0 2,434,000.0 2,271,000.0 Deferred income taxes, net, non-current
1,625,000.0 1,848,000.0 1,947,000.0 2,097,000.0 1,905,000.0
Other long-term liabilities 810,000.0 534,000.0 743,000.0 710,000.0 704,000.0Total Liabilities 25,859,000.0 24,815,000.0 23,611,000.0 22,079,000.0 22,330,000.0
Issued and Paid - Common Stock 338,000.0 337,000.0 - - - Class B common stock 55,000.0 56,000.0 63.0 63.0 63.0 Class C capital stock - - 0.0 0.0 0.0 Class A common stock. 283,000.0 281,000.0 267.0 267.0 267.0 Additional Paid in Capital 26,435,000.0 25,978,000.0 25,921,670.0 25,003,670.0 24,333,670.0 Foreign currency translation adjustment
70,000.0 81,000.0 16,000.0 -16,000.0 -277,000.0
Unrealized Gain/Loss on Investments
388,000.0 200,000.0 50,000.0 69,000.0 -209,000.0
Unrealized gains on cash flow hedges
44,000.0 64,000.0 59,000.0 46,000.0 88,000.0
Retained earnings 68,136,000.0 64,714,000.0 61,262,000.0 57,886,000.0 54,916,000.0 Convertible preferred stock 0.0 0.0 0.0 0.0 0.0Total Equity 95,749,000.0 91,711,000.0 87,309,000.0 82,989,000.0 78,852,000.0
Total Liabilities & Shareholders' Equity
121,608,000.0 116,526,000.0 110,920,000.0 105,068,000.0 101,182,000.0
S/O-Ordinary Shares Class A 283.0 281.6 558.7 553.4 547.7 S/O-Ordinary Shares Class B 54.9 55.7 113.0 115.0 118.6 S/O-Ordinary Shares Class C 338.0 337.2 - - -Total Common Shares Outstanding 675.9 674.5 671.7 668.3 666.3T/S-Ordinary Shares Class A 0.0 0.0 0.0 0.0 0.0
Avention One-Stop Reports for Google Inc
Page 107
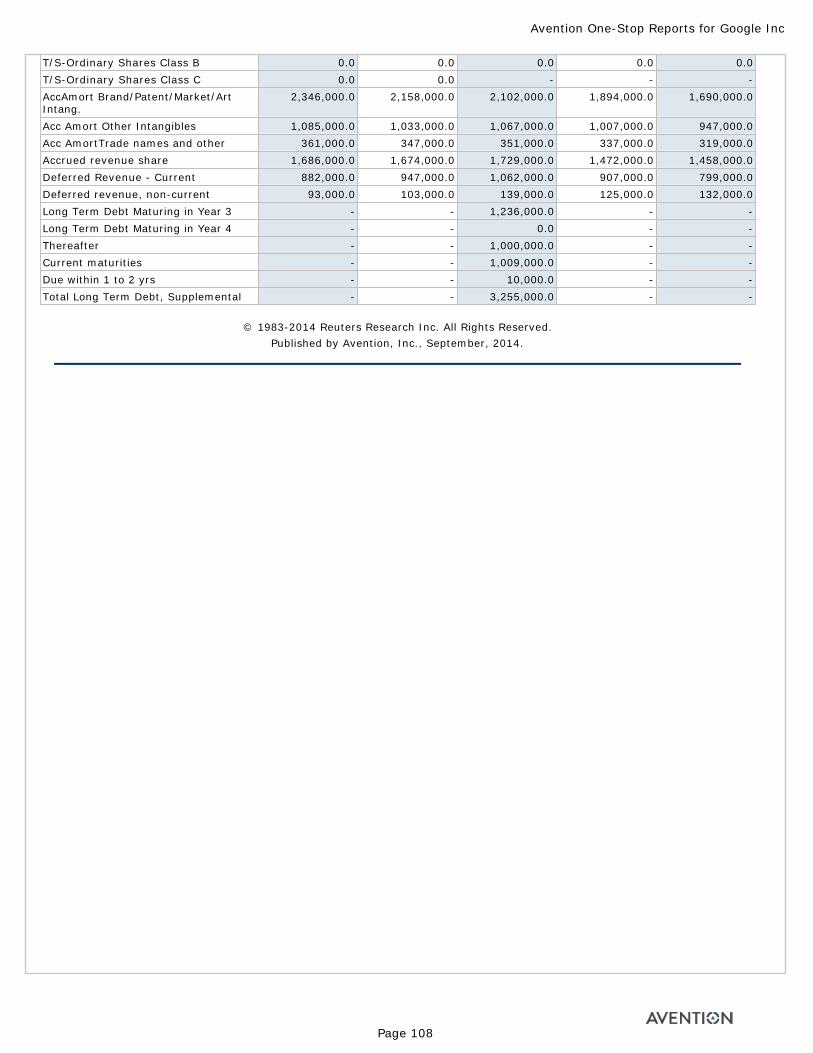
T/S-Ordinary Shares Class B 0.0 0.0 0.0 0.0 0.0T/S-Ordinary Shares Class C 0.0 0.0 - - -AccAmort Brand/Patent/Market/Art Intang.
2,346,000.0 2,158,000.0 2,102,000.0 1,894,000.0 1,690,000.0
Acc Amort Other Intangibles 1,085,000.0 1,033,000.0 1,067,000.0 1,007,000.0 947,000.0Acc AmortTrade names and other 361,000.0 347,000.0 351,000.0 337,000.0 319,000.0Accrued revenue share 1,686,000.0 1,674,000.0 1,729,000.0 1,472,000.0 1,458,000.0Deferred Revenue - Current 882,000.0 947,000.0 1,062,000.0 907,000.0 799,000.0Deferred revenue, non-current 93,000.0 103,000.0 139,000.0 125,000.0 132,000.0Long Term Debt Maturing in Year 3 - - 1,236,000.0 - -Long Term Debt Maturing in Year 4 - - 0.0 - -Thereafter - - 1,000,000.0 - -Current maturities - - 1,009,000.0 - -Due within 1 to 2 yrs - - 10,000.0 - -Total Long Term Debt, Supplemental - - 3,255,000.0 - -
© 1983-2014 Reuters Research Inc. All Rights Reserved. Published by Avention, Inc., September, 2014.
Avention One-Stop Reports for Google Inc
Page 108
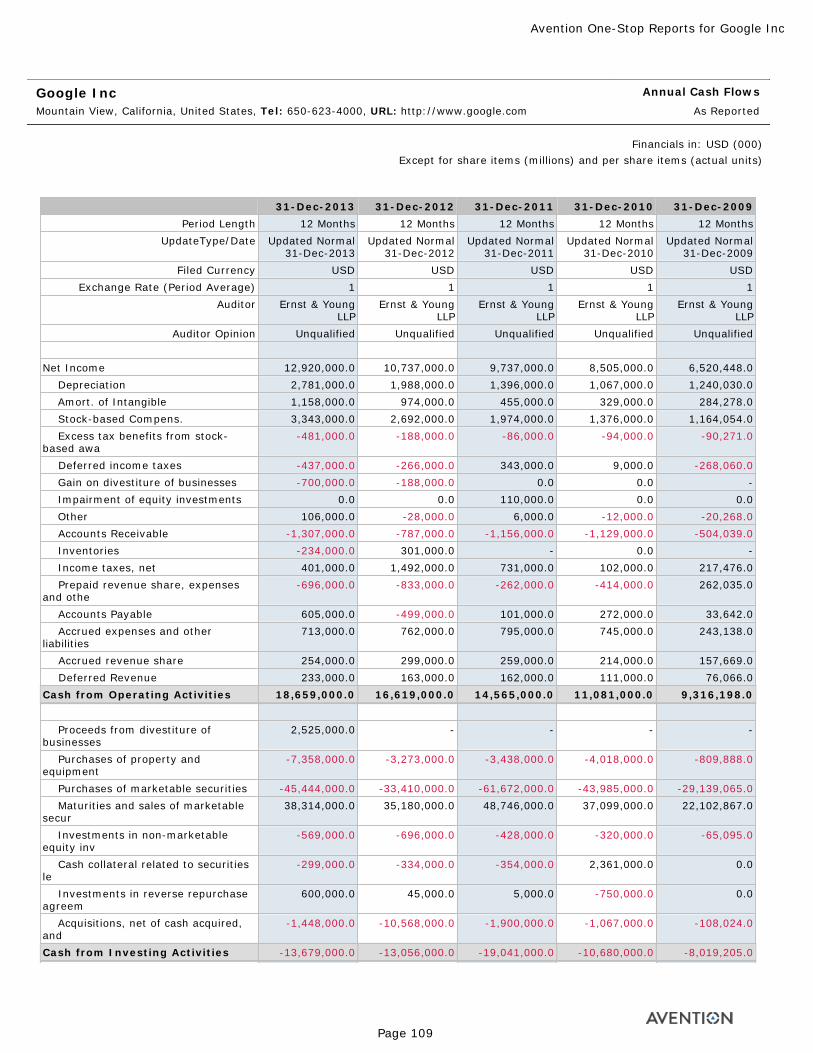
Google Inc Mountain View, California, United States, Tel: 650-623-4000, URL: http://www.google.com
Annual Cash Flows
As Reported
Financials in: USD (000)Except for share items (millions) and per share items (actual units)
31-Dec-2013 31-Dec-2012 31-Dec-2011 31-Dec-2010 31-Dec-2009Period Length 12 Months 12 Months 12 Months 12 Months 12 Months
UpdateType/Date Updated Normal 31-Dec-2013
Updated Normal 31-Dec-2012
Updated Normal 31-Dec-2011
Updated Normal 31-Dec-2010
Updated Normal 31-Dec-2009
Filed Currency USD USD USD USD USDExchange Rate (Period Average) 1 1 1 1 1
Auditor Ernst & Young LLP
Ernst & Young LLP
Ernst & Young LLP
Ernst & Young LLP
Ernst & Young LLP
Auditor Opinion Unqualified Unqualified Unqualified Unqualified Unqualified
Net Income 12,920,000.0 10,737,000.0 9,737,000.0 8,505,000.0 6,520,448.0 Depreciation 2,781,000.0 1,988,000.0 1,396,000.0 1,067,000.0 1,240,030.0 Amort. of Intangible 1,158,000.0 974,000.0 455,000.0 329,000.0 284,278.0 Stock-based Compens. 3,343,000.0 2,692,000.0 1,974,000.0 1,376,000.0 1,164,054.0 Excess tax benefits from stock-based awa
-481,000.0 -188,000.0 -86,000.0 -94,000.0 -90,271.0
Deferred income taxes -437,000.0 -266,000.0 343,000.0 9,000.0 -268,060.0 Gain on divestiture of businesses -700,000.0 -188,000.0 0.0 0.0 - Impairment of equity investments 0.0 0.0 110,000.0 0.0 0.0 Other 106,000.0 -28,000.0 6,000.0 -12,000.0 -20,268.0 Accounts Receivable -1,307,000.0 -787,000.0 -1,156,000.0 -1,129,000.0 -504,039.0 Inventories -234,000.0 301,000.0 - 0.0 - Income taxes, net 401,000.0 1,492,000.0 731,000.0 102,000.0 217,476.0 Prepaid revenue share, expenses and othe
-696,000.0 -833,000.0 -262,000.0 -414,000.0 262,035.0
Accounts Payable 605,000.0 -499,000.0 101,000.0 272,000.0 33,642.0 Accrued expenses and other liabilities
713,000.0 762,000.0 795,000.0 745,000.0 243,138.0
Accrued revenue share 254,000.0 299,000.0 259,000.0 214,000.0 157,669.0 Deferred Revenue 233,000.0 163,000.0 162,000.0 111,000.0 76,066.0Cash from Operating Activities 18,659,000.0 16,619,000.0 14,565,000.0 11,081,000.0 9,316,198.0
Proceeds from divestiture of businesses
2,525,000.0 - - - -
Purchases of property and equipment
-7,358,000.0 -3,273,000.0 -3,438,000.0 -4,018,000.0 -809,888.0
Purchases of marketable securities -45,444,000.0 -33,410,000.0 -61,672,000.0 -43,985,000.0 -29,139,065.0 Maturities and sales of marketable secur
38,314,000.0 35,180,000.0 48,746,000.0 37,099,000.0 22,102,867.0
Investments in non-marketable equity inv
-569,000.0 -696,000.0 -428,000.0 -320,000.0 -65,095.0
Cash collateral related to securities le
-299,000.0 -334,000.0 -354,000.0 2,361,000.0 0.0
Investments in reverse repurchase agreem
600,000.0 45,000.0 5,000.0 -750,000.0 0.0
Acquisitions, net of cash acquired, and
-1,448,000.0 -10,568,000.0 -1,900,000.0 -1,067,000.0 -108,024.0
Cash from Investing Activities -13,679,000.0 -13,056,000.0 -19,041,000.0 -10,680,000.0 -8,019,205.0
Avention One-Stop Reports for Google Inc
Page 109
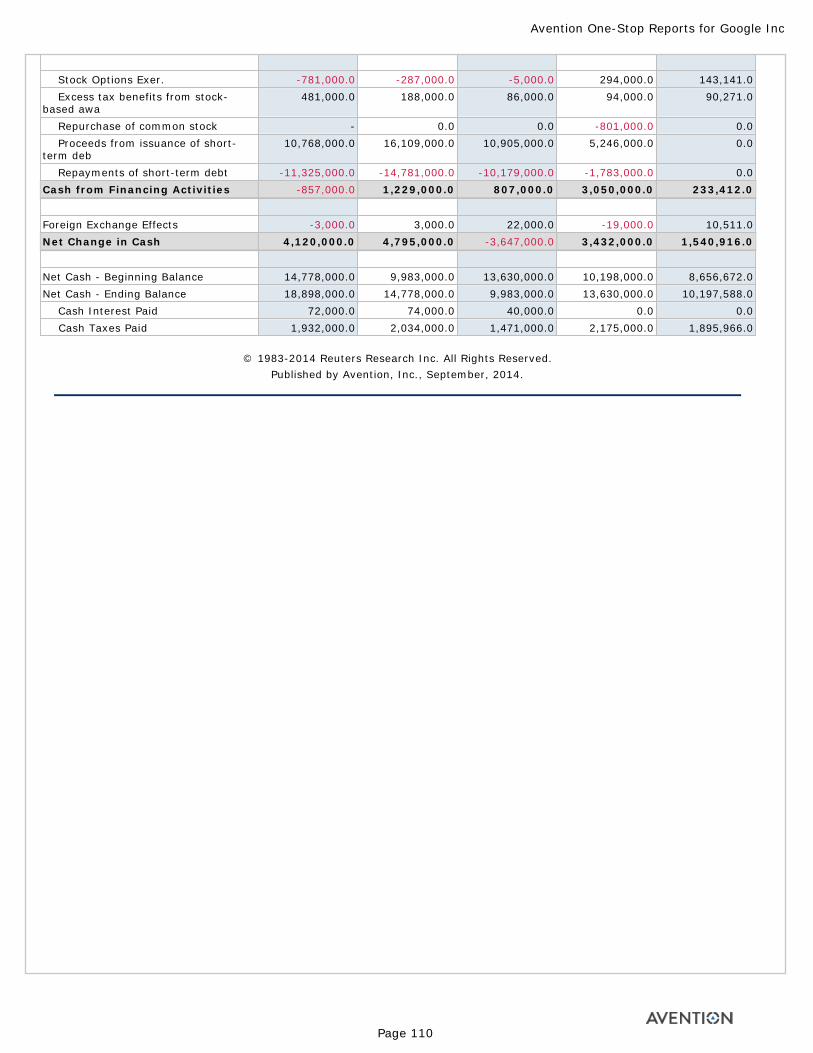
Stock Options Exer. -781,000.0 -287,000.0 -5,000.0 294,000.0 143,141.0 Excess tax benefits from stock-based awa
481,000.0 188,000.0 86,000.0 94,000.0 90,271.0
Repurchase of common stock - 0.0 0.0 -801,000.0 0.0 Proceeds from issuance of short-term deb
10,768,000.0 16,109,000.0 10,905,000.0 5,246,000.0 0.0
Repayments of short-term debt -11,325,000.0 -14,781,000.0 -10,179,000.0 -1,783,000.0 0.0Cash from Financing Activities -857,000.0 1,229,000.0 807,000.0 3,050,000.0 233,412.0
Foreign Exchange Effects -3,000.0 3,000.0 22,000.0 -19,000.0 10,511.0Net Change in Cash 4,120,000.0 4,795,000.0 -3,647,000.0 3,432,000.0 1,540,916.0
Net Cash - Beginning Balance 14,778,000.0 9,983,000.0 13,630,000.0 10,198,000.0 8,656,672.0Net Cash - Ending Balance 18,898,000.0 14,778,000.0 9,983,000.0 13,630,000.0 10,197,588.0 Cash Interest Paid 72,000.0 74,000.0 40,000.0 0.0 0.0 Cash Taxes Paid 1,932,000.0 2,034,000.0 1,471,000.0 2,175,000.0 1,895,966.0
© 1983-2014 Reuters Research Inc. All Rights Reserved. Published by Avention, Inc., September, 2014.
Avention One-Stop Reports for Google Inc
Page 110
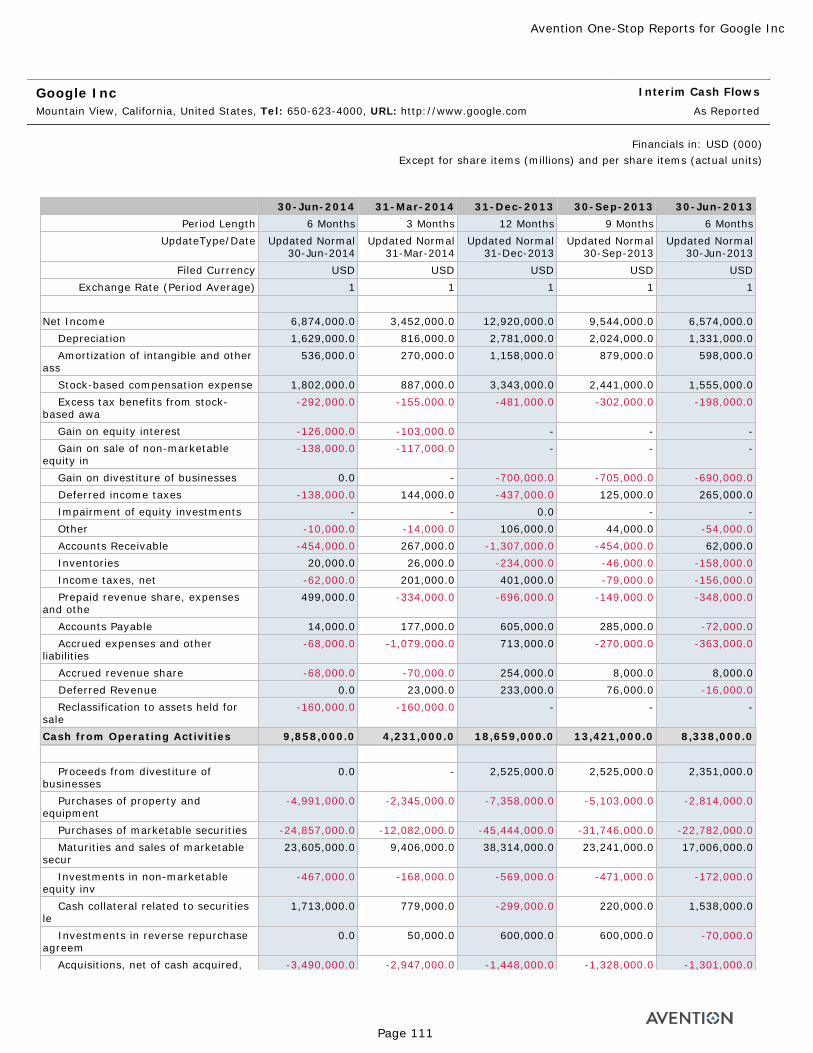
Google Inc Mountain View, California, United States, Tel: 650-623-4000, URL: http://www.google.com
Interim Cash Flows
As Reported
Financials in: USD (000)Except for share items (millions) and per share items (actual units)
30-Jun-2014 31-Mar-2014 31-Dec-2013 30-Sep-2013 30-Jun-2013Period Length 6 Months 3 Months 12 Months 9 Months 6 Months
UpdateType/Date Updated Normal 30-Jun-2014
Updated Normal 31-Mar-2014
Updated Normal 31-Dec-2013
Updated Normal 30-Sep-2013
Updated Normal 30-Jun-2013
Filed Currency USD USD USD USD USDExchange Rate (Period Average) 1 1 1 1 1
Net Income 6,874,000.0 3,452,000.0 12,920,000.0 9,544,000.0 6,574,000.0 Depreciation 1,629,000.0 816,000.0 2,781,000.0 2,024,000.0 1,331,000.0 Amortization of intangible and other ass
536,000.0 270,000.0 1,158,000.0 879,000.0 598,000.0
Stock-based compensation expense 1,802,000.0 887,000.0 3,343,000.0 2,441,000.0 1,555,000.0 Excess tax benefits from stock-based awa
-292,000.0 -155,000.0 -481,000.0 -302,000.0 -198,000.0
Gain on equity interest -126,000.0 -103,000.0 - - - Gain on sale of non-marketable equity in
-138,000.0 -117,000.0 - - -
Gain on divestiture of businesses 0.0 - -700,000.0 -705,000.0 -690,000.0 Deferred income taxes -138,000.0 144,000.0 -437,000.0 125,000.0 265,000.0 Impairment of equity investments - - 0.0 - - Other -10,000.0 -14,000.0 106,000.0 44,000.0 -54,000.0 Accounts Receivable -454,000.0 267,000.0 -1,307,000.0 -454,000.0 62,000.0 Inventories 20,000.0 26,000.0 -234,000.0 -46,000.0 -158,000.0 Income taxes, net -62,000.0 201,000.0 401,000.0 -79,000.0 -156,000.0 Prepaid revenue share, expenses and othe
499,000.0 -334,000.0 -696,000.0 -149,000.0 -348,000.0
Accounts Payable 14,000.0 177,000.0 605,000.0 285,000.0 -72,000.0 Accrued expenses and other liabilities
-68,000.0 -1,079,000.0 713,000.0 -270,000.0 -363,000.0
Accrued revenue share -68,000.0 -70,000.0 254,000.0 8,000.0 8,000.0 Deferred Revenue 0.0 23,000.0 233,000.0 76,000.0 -16,000.0 Reclassification to assets held for sale
-160,000.0 -160,000.0 - - -
Cash from Operating Activities 9,858,000.0 4,231,000.0 18,659,000.0 13,421,000.0 8,338,000.0
Proceeds from divestiture of businesses
0.0 - 2,525,000.0 2,525,000.0 2,351,000.0
Purchases of property and equipment
-4,991,000.0 -2,345,000.0 -7,358,000.0 -5,103,000.0 -2,814,000.0
Purchases of marketable securities -24,857,000.0 -12,082,000.0 -45,444,000.0 -31,746,000.0 -22,782,000.0 Maturities and sales of marketable secur
23,605,000.0 9,406,000.0 38,314,000.0 23,241,000.0 17,006,000.0
Investments in non-marketable equity inv
-467,000.0 -168,000.0 -569,000.0 -471,000.0 -172,000.0
Cash collateral related to securities le
1,713,000.0 779,000.0 -299,000.0 220,000.0 1,538,000.0
Investments in reverse repurchase agreem
0.0 50,000.0 600,000.0 600,000.0 -70,000.0
Acquisitions, net of cash acquired, -3,490,000.0 -2,947,000.0 -1,448,000.0 -1,328,000.0 -1,301,000.0
Avention One-Stop Reports for Google Inc
Page 111
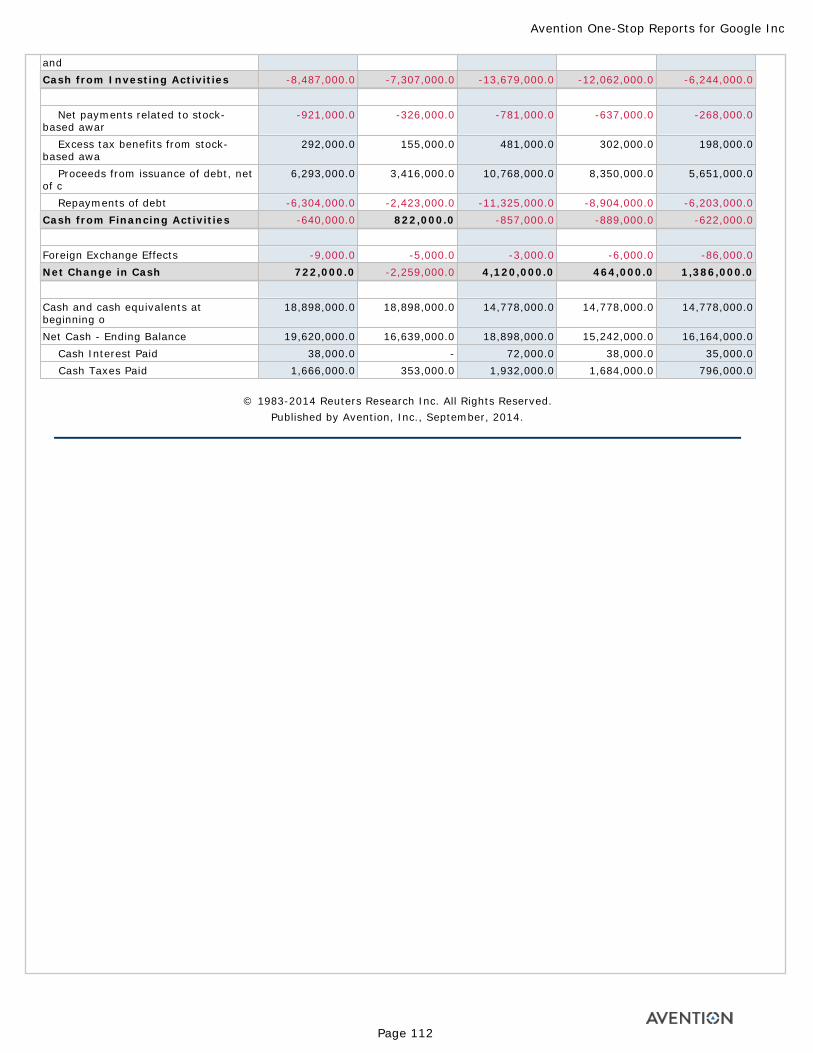
andCash from Investing Activities -8,487,000.0 -7,307,000.0 -13,679,000.0 -12,062,000.0 -6,244,000.0
Net payments related to stock-based awar
-921,000.0 -326,000.0 -781,000.0 -637,000.0 -268,000.0
Excess tax benefits from stock-based awa
292,000.0 155,000.0 481,000.0 302,000.0 198,000.0
Proceeds from issuance of debt, net of c
6,293,000.0 3,416,000.0 10,768,000.0 8,350,000.0 5,651,000.0
Repayments of debt -6,304,000.0 -2,423,000.0 -11,325,000.0 -8,904,000.0 -6,203,000.0Cash from Financing Activities -640,000.0 822,000.0 -857,000.0 -889,000.0 -622,000.0
Foreign Exchange Effects -9,000.0 -5,000.0 -3,000.0 -6,000.0 -86,000.0Net Change in Cash 722,000.0 -2,259,000.0 4,120,000.0 464,000.0 1,386,000.0
Cash and cash equivalents at beginning o
18,898,000.0 18,898,000.0 14,778,000.0 14,778,000.0 14,778,000.0
Net Cash - Ending Balance 19,620,000.0 16,639,000.0 18,898,000.0 15,242,000.0 16,164,000.0 Cash Interest Paid 38,000.0 - 72,000.0 38,000.0 35,000.0 Cash Taxes Paid 1,666,000.0 353,000.0 1,932,000.0 1,684,000.0 796,000.0
© 1983-2014 Reuters Research Inc. All Rights Reserved. Published by Avention, Inc., September, 2014.
Avention One-Stop Reports for Google Inc
Page 112
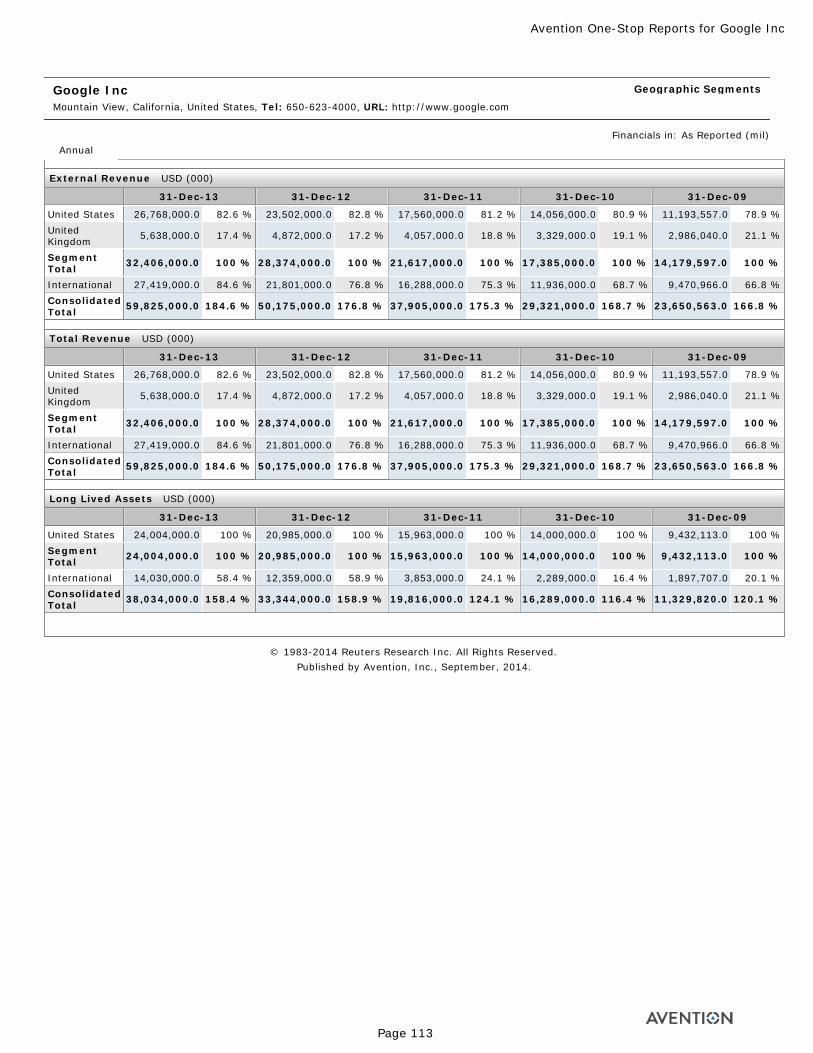
Google Inc Mountain View, California, United States, Tel: 650-623-4000, URL: http://www.google.com
Geographic Segments
Financials in: As Reported (mil)Annual
External Revenue USD (000)
31-Dec-13 31-Dec-12 31-Dec-11 31-Dec-10 31-Dec-09
United States 26,768,000.0 82.6 % 23,502,000.0 82.8 % 17,560,000.0 81.2 % 14,056,000.0 80.9 % 11,193,557.0 78.9 %United Kingdom 5,638,000.0 17.4 % 4,872,000.0 17.2 % 4,057,000.0 18.8 % 3,329,000.0 19.1 % 2,986,040.0 21.1 %
Segment Total 32,406,000.0 100 % 28,374,000.0 100 % 21,617,000.0 100 % 17,385,000.0 100 % 14,179,597.0 100 %
International 27,419,000.0 84.6 % 21,801,000.0 76.8 % 16,288,000.0 75.3 % 11,936,000.0 68.7 % 9,470,966.0 66.8 %Consolidated Total 59,825,000.0 184.6 % 50,175,000.0 176.8 % 37,905,000.0 175.3 % 29,321,000.0 168.7 % 23,650,563.0 166.8 %
Total Revenue USD (000)
31-Dec-13 31-Dec-12 31-Dec-11 31-Dec-10 31-Dec-09
United States 26,768,000.0 82.6 % 23,502,000.0 82.8 % 17,560,000.0 81.2 % 14,056,000.0 80.9 % 11,193,557.0 78.9 %United Kingdom 5,638,000.0 17.4 % 4,872,000.0 17.2 % 4,057,000.0 18.8 % 3,329,000.0 19.1 % 2,986,040.0 21.1 %
Segment Total 32,406,000.0 100 % 28,374,000.0 100 % 21,617,000.0 100 % 17,385,000.0 100 % 14,179,597.0 100 %
International 27,419,000.0 84.6 % 21,801,000.0 76.8 % 16,288,000.0 75.3 % 11,936,000.0 68.7 % 9,470,966.0 66.8 %Consolidated Total 59,825,000.0 184.6 % 50,175,000.0 176.8 % 37,905,000.0 175.3 % 29,321,000.0 168.7 % 23,650,563.0 166.8 %
Long Lived Assets USD (000)
31-Dec-13 31-Dec-12 31-Dec-11 31-Dec-10 31-Dec-09
United States 24,004,000.0 100 % 20,985,000.0 100 % 15,963,000.0 100 % 14,000,000.0 100 % 9,432,113.0 100 %Segment Total 24,004,000.0 100 % 20,985,000.0 100 % 15,963,000.0 100 % 14,000,000.0 100 % 9,432,113.0 100 %
International 14,030,000.0 58.4 % 12,359,000.0 58.9 % 3,853,000.0 24.1 % 2,289,000.0 16.4 % 1,897,707.0 20.1 %Consolidated Total 38,034,000.0 158.4 % 33,344,000.0 158.9 % 19,816,000.0 124.1 % 16,289,000.0 116.4 % 11,329,820.0 120.1 %
© 1983-2014 Reuters Research Inc. All Rights Reserved. Published by Avention, Inc., September, 2014.
Avention One-Stop Reports for Google Inc
Page 113
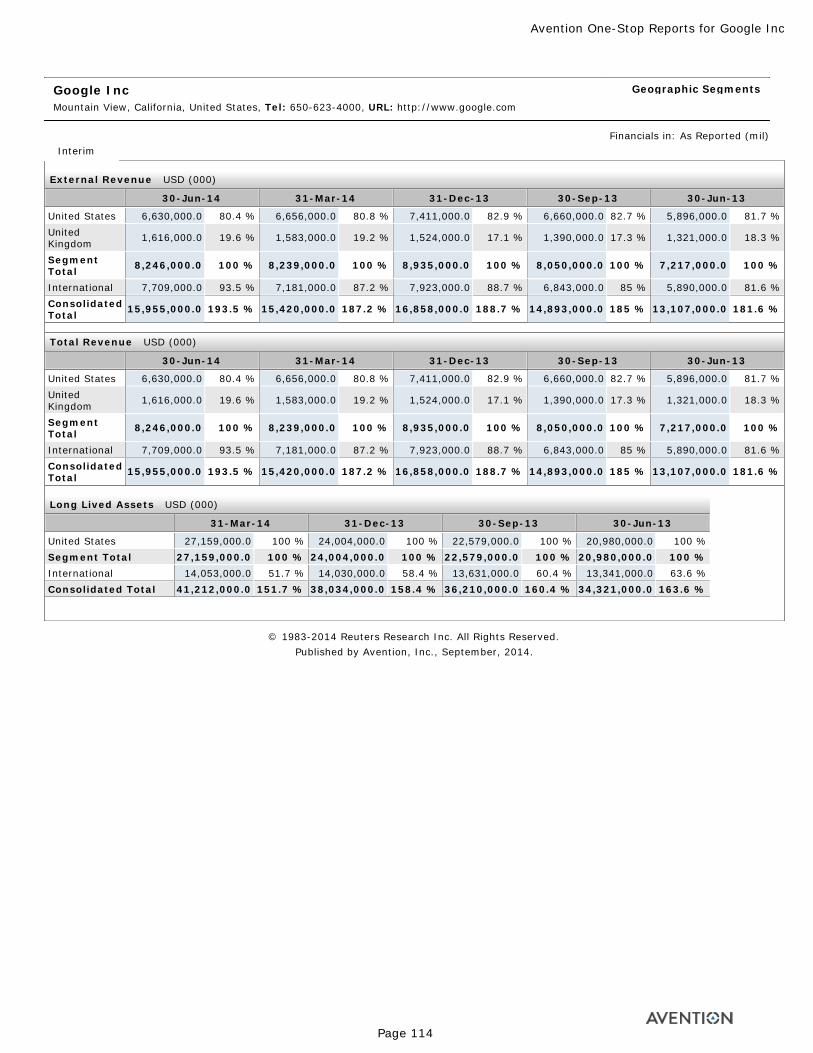
Google Inc Mountain View, California, United States, Tel: 650-623-4000, URL: http://www.google.com
Geographic Segments
Financials in: As Reported (mil)Interim
External Revenue USD (000)
30-Jun-14 31-Mar-14 31-Dec-13 30-Sep-13 30-Jun-13
United States 6,630,000.0 80.4 % 6,656,000.0 80.8 % 7,411,000.0 82.9 % 6,660,000.0 82.7 % 5,896,000.0 81.7 %United Kingdom 1,616,000.0 19.6 % 1,583,000.0 19.2 % 1,524,000.0 17.1 % 1,390,000.0 17.3 % 1,321,000.0 18.3 %
Segment Total 8,246,000.0 100 % 8,239,000.0 100 % 8,935,000.0 100 % 8,050,000.0 100 % 7,217,000.0 100 %
International 7,709,000.0 93.5 % 7,181,000.0 87.2 % 7,923,000.0 88.7 % 6,843,000.0 85 % 5,890,000.0 81.6 %Consolidated Total 15,955,000.0 193.5 % 15,420,000.0 187.2 % 16,858,000.0 188.7 % 14,893,000.0 185 % 13,107,000.0 181.6 %
Total Revenue USD (000)
30-Jun-14 31-Mar-14 31-Dec-13 30-Sep-13 30-Jun-13
United States 6,630,000.0 80.4 % 6,656,000.0 80.8 % 7,411,000.0 82.9 % 6,660,000.0 82.7 % 5,896,000.0 81.7 %United Kingdom 1,616,000.0 19.6 % 1,583,000.0 19.2 % 1,524,000.0 17.1 % 1,390,000.0 17.3 % 1,321,000.0 18.3 %
Segment Total 8,246,000.0 100 % 8,239,000.0 100 % 8,935,000.0 100 % 8,050,000.0 100 % 7,217,000.0 100 %
International 7,709,000.0 93.5 % 7,181,000.0 87.2 % 7,923,000.0 88.7 % 6,843,000.0 85 % 5,890,000.0 81.6 %Consolidated Total 15,955,000.0 193.5 % 15,420,000.0 187.2 % 16,858,000.0 188.7 % 14,893,000.0 185 % 13,107,000.0 181.6 %
Long Lived Assets USD (000)
31-Mar-14 31-Dec-13 30-Sep-13 30-Jun-13
United States 27,159,000.0 100 % 24,004,000.0 100 % 22,579,000.0 100 % 20,980,000.0 100 %Segment Total 27,159,000.0 100 % 24,004,000.0 100 % 22,579,000.0 100 % 20,980,000.0 100 %International 14,053,000.0 51.7 % 14,030,000.0 58.4 % 13,631,000.0 60.4 % 13,341,000.0 63.6 %Consolidated Total 41,212,000.0 151.7 % 38,034,000.0 158.4 % 36,210,000.0 160.4 % 34,321,000.0 163.6 %
© 1983-2014 Reuters Research Inc. All Rights Reserved. Published by Avention, Inc., September, 2014.
Avention One-Stop Reports for Google Inc
Page 114
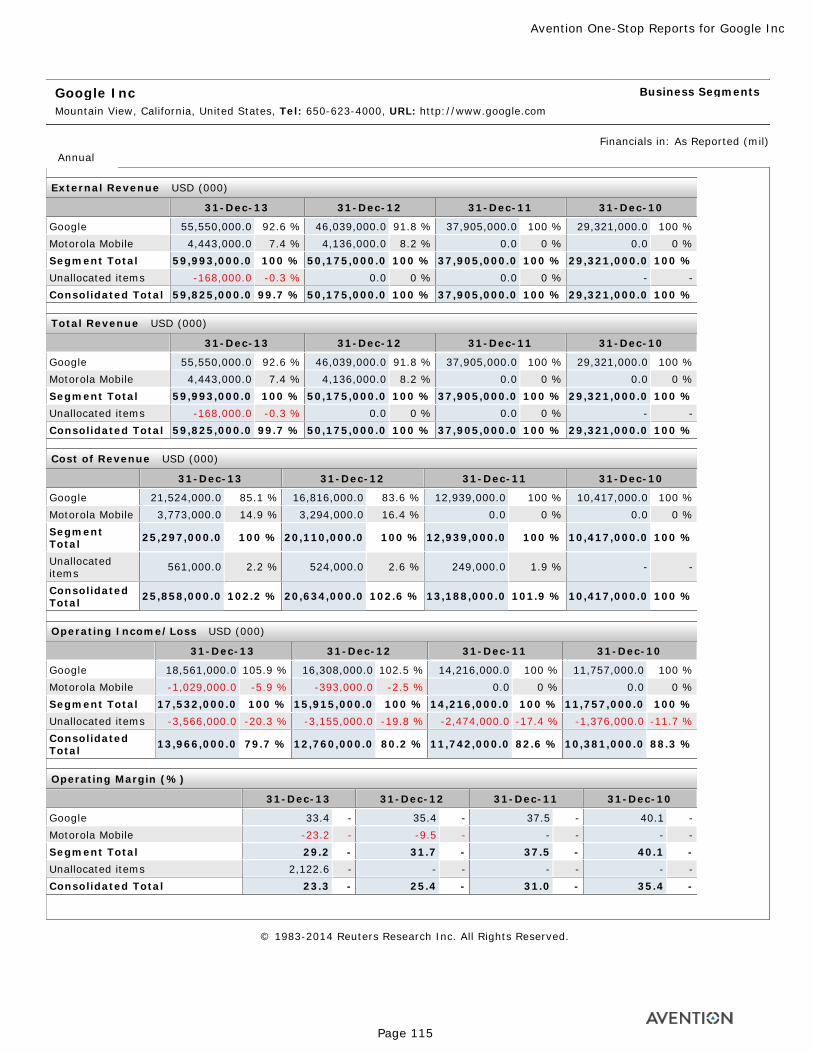
Google Inc Mountain View, California, United States, Tel: 650-623-4000, URL: http://www.google.com
Business Segments
Financials in: As Reported (mil)Annual
External Revenue USD (000)
31-Dec-13 31-Dec-12 31-Dec-11 31-Dec-10
Google 55,550,000.0 92.6 % 46,039,000.0 91.8 % 37,905,000.0 100 % 29,321,000.0 100 %Motorola Mobile 4,443,000.0 7.4 % 4,136,000.0 8.2 % 0.0 0 % 0.0 0 %Segment Total 59,993,000.0 100 % 50,175,000.0 100 % 37,905,000.0 100 % 29,321,000.0 100 %Unallocated items -168,000.0 -0.3 % 0.0 0 % 0.0 0 % - -Consolidated Total 59,825,000.0 99.7 % 50,175,000.0 100 % 37,905,000.0 100 % 29,321,000.0 100 %
Total Revenue USD (000)
31-Dec-13 31-Dec-12 31-Dec-11 31-Dec-10
Google 55,550,000.0 92.6 % 46,039,000.0 91.8 % 37,905,000.0 100 % 29,321,000.0 100 %Motorola Mobile 4,443,000.0 7.4 % 4,136,000.0 8.2 % 0.0 0 % 0.0 0 %Segment Total 59,993,000.0 100 % 50,175,000.0 100 % 37,905,000.0 100 % 29,321,000.0 100 %Unallocated items -168,000.0 -0.3 % 0.0 0 % 0.0 0 % - -Consolidated Total 59,825,000.0 99.7 % 50,175,000.0 100 % 37,905,000.0 100 % 29,321,000.0 100 %
Cost of Revenue USD (000)
31-Dec-13 31-Dec-12 31-Dec-11 31-Dec-10
Google 21,524,000.0 85.1 % 16,816,000.0 83.6 % 12,939,000.0 100 % 10,417,000.0 100 %Motorola Mobile 3,773,000.0 14.9 % 3,294,000.0 16.4 % 0.0 0 % 0.0 0 %Segment Total 25,297,000.0 100 % 20,110,000.0 100 % 12,939,000.0 100 % 10,417,000.0 100 %
Unallocated items 561,000.0 2.2 % 524,000.0 2.6 % 249,000.0 1.9 % - -
Consolidated Total 25,858,000.0 102.2 % 20,634,000.0 102.6 % 13,188,000.0 101.9 % 10,417,000.0 100 %
Operating Income/Loss USD (000)
31-Dec-13 31-Dec-12 31-Dec-11 31-Dec-10
Google 18,561,000.0 105.9 % 16,308,000.0 102.5 % 14,216,000.0 100 % 11,757,000.0 100 %Motorola Mobile -1,029,000.0 -5.9 % -393,000.0 -2.5 % 0.0 0 % 0.0 0 %Segment Total 17,532,000.0 100 % 15,915,000.0 100 % 14,216,000.0 100 % 11,757,000.0 100 %Unallocated items -3,566,000.0 -20.3 % -3,155,000.0 -19.8 % -2,474,000.0 -17.4 % -1,376,000.0 -11.7 %Consolidated Total 13,966,000.0 79.7 % 12,760,000.0 80.2 % 11,742,000.0 82.6 % 10,381,000.0 88.3 %
Operating Margin (%)
31-Dec-13 31-Dec-12 31-Dec-11 31-Dec-10
Google 33.4 - 35.4 - 37.5 - 40.1 -Motorola Mobile -23.2 - -9.5 - - - - -Segment Total 29.2 - 31.7 - 37.5 - 40.1 -Unallocated items 2,122.6 - - - - - - -Consolidated Total 23.3 - 25.4 - 31.0 - 35.4 -
© 1983-2014 Reuters Research Inc. All Rights Reserved.
Avention One-Stop Reports for Google Inc
Page 115
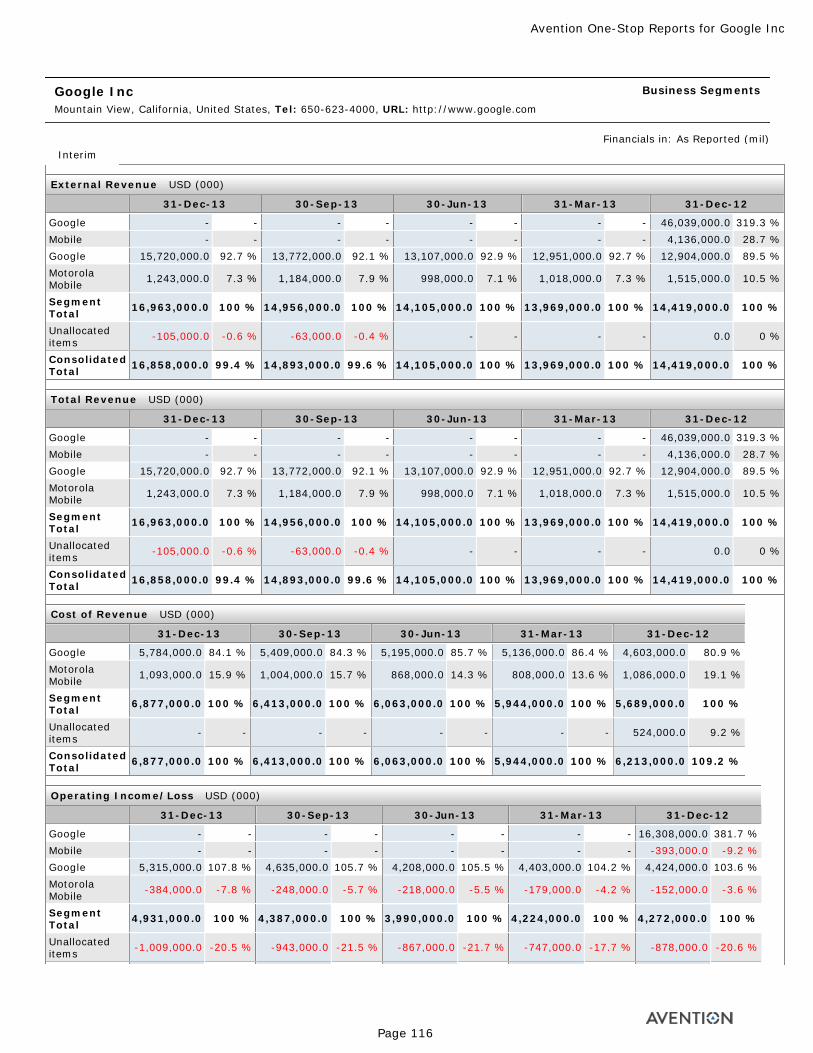
Google Inc Mountain View, California, United States, Tel: 650-623-4000, URL: http://www.google.com
Business Segments
Financials in: As Reported (mil)Interim
External Revenue USD (000)
31-Dec-13 30-Sep-13 30-Jun-13 31-Mar-13 31-Dec-12
Google - - - - - - - - 46,039,000.0 319.3 %Mobile - - - - - - - - 4,136,000.0 28.7 %Google 15,720,000.0 92.7 % 13,772,000.0 92.1 % 13,107,000.0 92.9 % 12,951,000.0 92.7 % 12,904,000.0 89.5 %Motorola Mobile 1,243,000.0 7.3 % 1,184,000.0 7.9 % 998,000.0 7.1 % 1,018,000.0 7.3 % 1,515,000.0 10.5 %
Segment Total 16,963,000.0 100 % 14,956,000.0 100 % 14,105,000.0 100 % 13,969,000.0 100 % 14,419,000.0 100 %
Unallocated items -105,000.0 -0.6 % -63,000.0 -0.4 % - - - - 0.0 0 %
Consolidated Total 16,858,000.0 99.4 % 14,893,000.0 99.6 % 14,105,000.0 100 % 13,969,000.0 100 % 14,419,000.0 100 %
Total Revenue USD (000)
31-Dec-13 30-Sep-13 30-Jun-13 31-Mar-13 31-Dec-12
Google - - - - - - - - 46,039,000.0 319.3 %Mobile - - - - - - - - 4,136,000.0 28.7 %Google 15,720,000.0 92.7 % 13,772,000.0 92.1 % 13,107,000.0 92.9 % 12,951,000.0 92.7 % 12,904,000.0 89.5 %Motorola Mobile 1,243,000.0 7.3 % 1,184,000.0 7.9 % 998,000.0 7.1 % 1,018,000.0 7.3 % 1,515,000.0 10.5 %
Segment Total 16,963,000.0 100 % 14,956,000.0 100 % 14,105,000.0 100 % 13,969,000.0 100 % 14,419,000.0 100 %
Unallocated items -105,000.0 -0.6 % -63,000.0 -0.4 % - - - - 0.0 0 %
Consolidated Total 16,858,000.0 99.4 % 14,893,000.0 99.6 % 14,105,000.0 100 % 13,969,000.0 100 % 14,419,000.0 100 %
Cost of Revenue USD (000)
31-Dec-13 30-Sep-13 30-Jun-13 31-Mar-13 31-Dec-12
Google 5,784,000.0 84.1 % 5,409,000.0 84.3 % 5,195,000.0 85.7 % 5,136,000.0 86.4 % 4,603,000.0 80.9 %Motorola Mobile 1,093,000.0 15.9 % 1,004,000.0 15.7 % 868,000.0 14.3 % 808,000.0 13.6 % 1,086,000.0 19.1 %
Segment Total 6,877,000.0 100 % 6,413,000.0 100 % 6,063,000.0 100 % 5,944,000.0 100 % 5,689,000.0 100 %
Unallocated items - - - - - - - - 524,000.0 9.2 %
Consolidated Total 6,877,000.0 100 % 6,413,000.0 100 % 6,063,000.0 100 % 5,944,000.0 100 % 6,213,000.0 109.2 %
Operating Income/Loss USD (000)
31-Dec-13 30-Sep-13 30-Jun-13 31-Mar-13 31-Dec-12
Google - - - - - - - - 16,308,000.0 381.7 %Mobile - - - - - - - - -393,000.0 -9.2 %Google 5,315,000.0 107.8 % 4,635,000.0 105.7 % 4,208,000.0 105.5 % 4,403,000.0 104.2 % 4,424,000.0 103.6 %Motorola Mobile -384,000.0 -7.8 % -248,000.0 -5.7 % -218,000.0 -5.5 % -179,000.0 -4.2 % -152,000.0 -3.6 %
Segment Total 4,931,000.0 100 % 4,387,000.0 100 % 3,990,000.0 100 % 4,224,000.0 100 % 4,272,000.0 100 %
Unallocated items -1,009,000.0 -20.5 % -943,000.0 -21.5 % -867,000.0 -21.7 % -747,000.0 -17.7 % -878,000.0 -20.6 %
Avention One-Stop Reports for Google Inc
Page 116
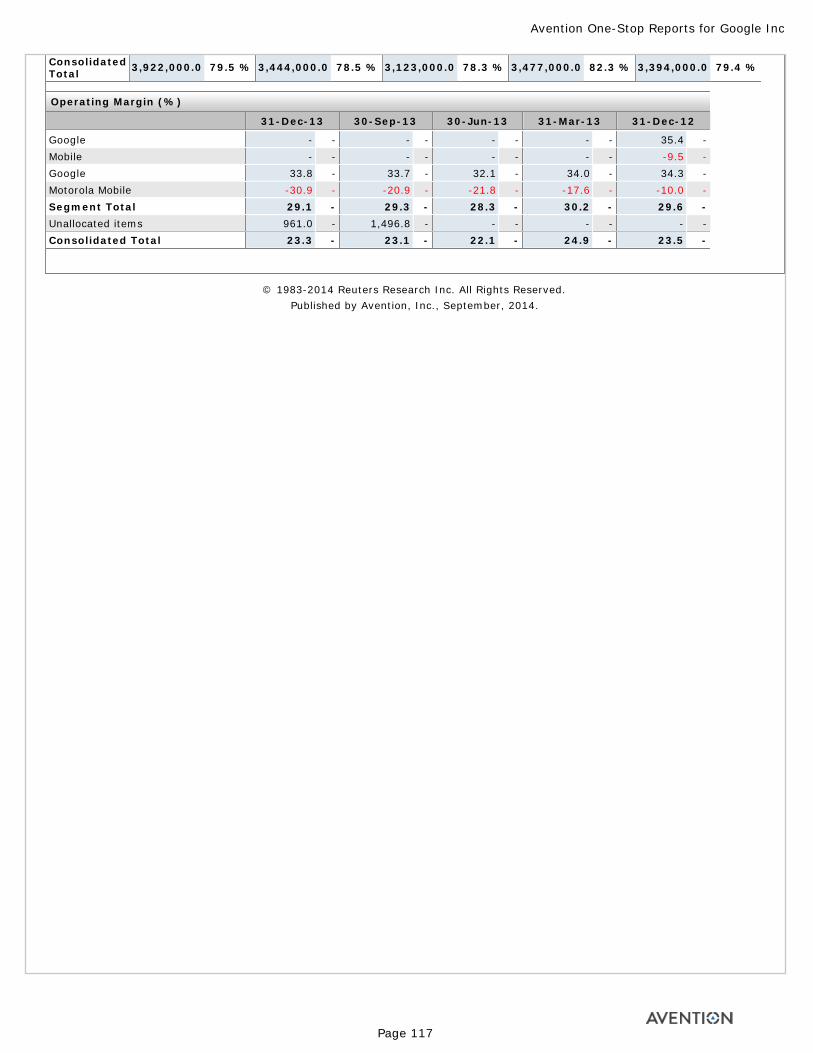
Consolidated Total 3,922,000.0 79.5 % 3,444,000.0 78.5 % 3,123,000.0 78.3 % 3,477,000.0 82.3 % 3,394,000.0 79.4 %
Operating Margin (%)
31-Dec-13 30-Sep-13 30-Jun-13 31-Mar-13 31-Dec-12
Google - - - - - - - - 35.4 -Mobile - - - - - - - - -9.5 -Google 33.8 - 33.7 - 32.1 - 34.0 - 34.3 -Motorola Mobile -30.9 - -20.9 - -21.8 - -17.6 - -10.0 -Segment Total 29.1 - 29.3 - 28.3 - 30.2 - 29.6 -Unallocated items 961.0 - 1,496.8 - - - - - - -Consolidated Total 23.3 - 23.1 - 22.1 - 24.9 - 23.5 -
© 1983-2014 Reuters Research Inc. All Rights Reserved. Published by Avention, Inc., September, 2014.
Avention One-Stop Reports for Google Inc
Page 117
Avention One-Stop Reports for Google Inc
Page 118
Related Documents