Good Housing Leads To Good Health A toolkit for environmental health practitioners September 2008

Welcome message from author
This document is posted to help you gain knowledge. Please leave a comment to let me know what you think about it! Share it to your friends and learn new things together.
Transcript

Good Housing Leads To Good HealthA toolkit for environmental health practitioners
September 2008

Good Housing Leads To Good Health: Atoolkit for environmental health practitionersis published by the Chartered Institute of
Environmental Health (CIEH), Chadwick
Court, 15 Hatfields, London SE1 8DJ, UK.
Tel: +44 (0)20 7928 6006.
Website: www.cieh.org
The toolkit provides the methodology and
case studies to help environmental health
practitioners indicate the links between
private sector housing and public health.
The CIEH would like to express its gratitude
to Viv Mason at the Building Research
Establishment, who was commissioned to
produce the report, and to all members of
the steering group.
Steering group members
Dr Stephen BattersbyConsultant, CIEH President
John BrysonConsultant, CIEH Trustee
Andrea BuseSouthampton City Council
Andrew GriffithsCIEH Acting Director of Policy
Robin KennedyDover District Council
Viv MasonBuilding Research Establishment
Paul MishkinLondon Borough of Islington
Acknowledgements
Contents
Introduction 04Why is a toolkit necessary? 04
Using this toolkit 05
Wider health determinants 07
The mechanisms 08Health Impact Assessment (HIA) 08
Local Area Agreements (LAAs) 09
Departmental Strategic Objectives (DSOs) 10
Home Improvement Agencies
and handyperson schemes 11
Quantitative methodology to show health impact 12
Using the Housing Health and Safety Rating System (HHSRS) 14
Cost comparison 17Other costs 17
Summarising hazards, health and cost 17
Health Impact Assessment – Questionnaires 18
Useful websites 19
Case studies – Measuring health impact to show qualitative effects of intervention 20
Health@Home: Warrington Borough
Council 20
Safe and Warm Housing Improvement
Project: Merseyside Health Action Zone 21
Health through Warmth: Walsall Council 23
The impact of housing on health:
Stockport Metropolitan Borough Council 26
Health Impact Assessment: North West
Leicestershire’s Private Sector Renewal
Strategy 27
Leeds Landlord Accreditation Scheme:
Leeds City Council 28
Pimhole Clearance Area: Bury
Metropolitan Borough Council 29
Health Housing Service: Nottingham
Energy Partnership 31
Broadening Choices for Older People
(BCOP): A handyperson service in
Birmingham 32
Entry by Intruders – Demonstrating the
true local picture: Bristol City Council 33
Overcrowding: Islington Borough Council 35
Appendices 38Appendix 1: Evidence linking housing
and health 38
Appendix 2: Showing links with costs 41
Appendix 3: The strategic context 42
9.0
9.1
9.2
9.3
9.4
9.5
9.6
9.7
9.8
9.9
9.10
9.11
10.010.1
10.2
10.3
1.01.1
1.2
2.0
3.03.1
3.2
3.3
3.4
4.0
5.0
6.06.1
6.2
7.0
8.0

1.0 Introduction
The Building Research Establishment (BRE)
Housing Centre was commissioned by the
Chartered Institute of Environmental Health
(CIEH) to produce a toolkit to help CIEH
members and housing managers to
promote the role of private sector housing
and its wider contribution to public health.
The toolkit provides methodology and case
studies to help indicate the links between
private sector housing and public health at
a local level.
Research has been carried out to establish
links between housing and public health at
a local level. This involved:
• Researching web-based information
• Using in-house data where available
• Contacting local authorities to find evidence
of best practice and examples of local
links between public health and housing
• Examining the use of local evidence
within the Housing Health and Safety
Rating System (HHSRS)
• Researching local health impact projects
based around housing
• Carrying out interviews with third parties
• Reproducing relevant case studies
• Producing a sample tool designed to
collect local data
The resulting package provides evidence of
current good practice and details of how to
gather information locally to influence
strategy and Local Area Agreements (LAAs).
The project has been undertaken with
guidance from a steering group.
Why is a toolkit necessary?The first few years of the 21st century has
seen a plethora of information, targets and
new legislation concerning private sector
housing. Much of it is aimed at encouraging
local authorities to meet the Government’s
targets and aspirations.
The number of people living in Decent
Homes has been recognised as being not
just of benefit to the occupiers but also to
the wider community and to society.
Homes play the most important role in
providing occupiers with opportunities and
contribute to the World Health
Organization’s (WHO) definition of health
as: “a complete state of physical, mental
and social well being”.
There have been a number of studies
specifically linking health and housing,
together with the costs generated by poor
housing. A summary of some of these is
included by way of background information
in Appendix 1.
The Government has allocated additional
funds to Primary Care Trusts (PCTs) to
promote public health, much of which has
recently been shown to have been used
within other health budgets1.
Cross discipline targets have been
introduced by the Government which
require partnership working, such as Local
Area Agreements (LAAs). These agreements
provide private sector housing sections a
unique chance to grasp the opportunity to
show elected councillors and partner
organisations how private sector housing
can make a real difference to public health.
The CIEH Commission on Housing Renewaland Public Health2 recommends that
government should consider housing renewal
as a public health intervention as a specific
theme for future Beacon Council awards.
The aim of this toolkit is to show how links
between homes and health can be made
and showing, where possible, the cost
benefit of some specifically linked housing
and health issues. Providing evidence of
cost benefit is important where resources
04 Good Housing Leads To Good Health: A toolkit for environmental health practitioners
1 Report of Association of
Directors of Public Health,
October 2007
2 Commission on HousingRenewal and Public Health:Final Report, CIEH 2007
The number of people living in Decent Homes has been recognised as being not just of benefit to the occupiers but also to the wider communityand to society
1.1

for improvement or enforcement action are
lacking. Cost benefit is a complex issue and
additional information discussing this is
provided in Appendix 2.
Local authorities are being charged with
drawing up LAAs. The information gained
by using this methodology can be linked
with wider local priorities, maximising the
impact of improved private sector housing.
Reducing health inequalities is a key target
for government and councils. The existing
links to Local Strategic Partnerships (LSPs),
Audit Commission Key Lines of Enquiry
(KLOE) and Best Value Indicators (BVIs) is
provided in Appendix 3.
Private sector housing is in danger of being
lost in the Government’s new agenda of
social housing and new build. 85 percent of
dwellings are in the private sector and there
is an important role of advocacy for this
sector within a local authorities’ strategy.
The Housing Regulatory Reform (Housing
Assistance England and Wales) Order 2002,
commonly called the RRO, introduced a
new concept in dealing with private sector
housing.
The legislation and associated guidance
(Housing Renewal Guidance 6/2002) gave
local authorities freedom to draw up their
own policies.
In many councils this has reduced the level
of action in the private sector. Officers need
to work harder to bring increased resources
into the sector to push private sector
housing back up the agenda and reduce
the widening gap between social and
private sector housing.
Using this toolkitThis evidence based toolkit utilises Health
Impact Assessments (HIAs) to show the
impact of housing intervention measures
on wider health benefits.
What is required is a method of measuring
and showing the value of private sector
housing intervention to health, society and
quality of life. This same method can also be
used to show the effect of not intervening
(for example the loss of independent living).
The evidence is there and this toolkit aims
to help you find it. Firstly find a baseline,
and work out the most effective and cost
efficient methods of improving homes to
sell the approach as Local Area Agreement
(LAA) targets. This kit is only a starting point.
Step 1: Use the Housing Health andSafety Rating System (HHSRS) CostsCalculator available to download fromthe CIEH website www.cieh.org/library/Knowledge/Housing/HHSRS_cost_calculator.xls
This will provide a baseline of likely numbers
of incidences within local authority areas,
together with the health costs and cost of
mitigating the hazard.
This figure can be used as evidence of the
cost and subsequently compared to the
cost of improvement works.
Local statistics from census data and web-
based statistics can be transposed to show
a cost benefit or to compare it with the
expected national average.
Step 2: Additional information
Use the web links on page 19 to provide
additional information at local authority or
regional level. In many cases information is
provided in graph or chart format and can
Good Housing Leads To Good Health: A toolkit for environmental health practitioners 05
1.2

be easily copied into reports. The health
profile is particularly useful.
Step 3: Carry out a Health ImpactAssessment (HIA)
HIAs are particularly valuable in bringing
together professionals from different
disciplines and will increasingly need to
include community safety officers or similar.
These can be used to measure the effect, or
likely effect, of enforcement action,
proactive policy or proposed policy changes.
Using questionnaires are a useful start in
health impact assessment. A list of possible
questions is included on page 18.
A number of examples of HIAs are included
as case studies, starting on page 20.
Working with a Primary Care Trust (PCT) is
preferable to ensure easy access to
vulnerable households.
Voluntary organisations, such as Age
Concern or home improvement agencies
can be enlisted to help. Data can also be
downloaded from Regional Health
Observatories.
Step 4: Involve elected members
Elected members will have excellent local
knowledge of their wards and may also sit
as board members on other organisations,
for example the PCT or Age Concern.
Step 5: Local priorities
Link the information and key issues to LAA
targets. Planned proactive work, such as
additional licensing planned to deal with
overcrowding, grants to target bed blocking
or working with other agencies on area
enforcement, should all link with other
agencies priorities.
Step 6: Documented evidence
Publicity, photographs and videos of
success help to show the importance of
improved homes. Projects to demonstrate
this can have an important impact,
especially on disassociated audiences3,
bringing the issue of health inequalities to
an audience who may not be listening.
Step 7: Keeping ahead
New targets and Departmental Strategic
Objectives (DSOs) have now been
announced by the Government. Further
guidance is expected when these objectives
have bedded in and good practice can be
copied. It will be necessary to think
holistically to show other partners the true
impact of housing interventions. Good
practice is often publicised. Review annually.
Once the initial picture and figures have
been built up the process will become easier.
06 Good Housing Leads To Good Health: A toolkit for environmental health practitioners
3 Measuring Impact:
Improving the health and
wellbeing of people in
mid-life and beyond,
National Institute Health
and Clinical Excellence 2005
2.0 Wider health determinants
Table 1
Good Housing Leads To Good Health: A toolkit for environmental health practitioners 07
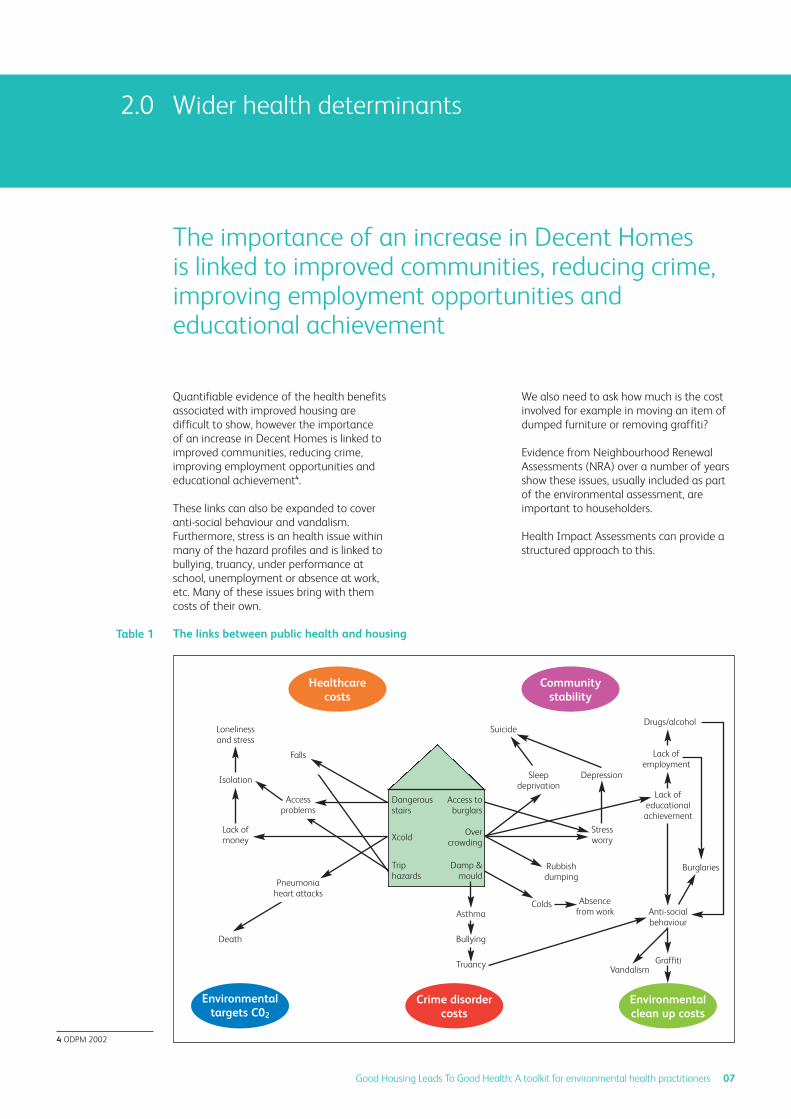
Quantifiable evidence of the health benefits
associated with improved housing are
difficult to show, however the importance
of an increase in Decent Homes is linked to
improved communities, reducing crime,
improving employment opportunities and
educational achievement4.
These links can also be expanded to cover
anti-social behaviour and vandalism.
Furthermore, stress is an health issue within
many of the hazard profiles and is linked to
bullying, truancy, under performance at
school, unemployment or absence at work,
etc. Many of these issues bring with them
costs of their own.
We also need to ask how much is the cost
involved for example in moving an item of
dumped furniture or removing graffiti?
Evidence from Neighbourhood Renewal
Assessments (NRA) over a number of years
show these issues, usually included as part
of the environmental assessment, are
important to householders.
Health Impact Assessments can provide a
structured approach to this.
4 ODPM 2002
The importance of an increase in Decent Homes is linked to improved communities, reducing crime,improving employment opportunities andeducational achievement
The links between public health and housing
Healthcarecosts
Environmentaltargets C02
Crime disordercosts
Environmentalclean up costs
Communitystability
Dangerousstairs
Xcold
Triphazards
Access toburglars
Overcrowding
Damp &mould
Asthma
Bullying
Truancy
Death
Lack ofmoney
Stressworry
Lack ofeducational
achievement
Lack ofemployment
Drugs/alcohol
Burglaries
Anti-socialbehaviour
Rubbishdumping
Sleepdeprivation
Colds
GraffitiVandalism
Absencefrom work
Isolation
Lonelinessand stress
Suicide
Depression
Pneumoniaheart attacks
Accessproblems
Falls

3.0 The mechanisms
Health impact can be used to help assess the effectsof improving homes (or not improving them) and tomeasure in a definable way the health determinants
3.1
Table 2
3.2
08 Good Housing Leads To Good Health: A toolkit for environmental health practitioners
Health Impact Assessment (HIA)Health impact can be used to help assess
the effects of improving homes (or not
improving them) and to measure in a
definable way the health determinants.
The assessment looks at health determinants
as a wider contribution to quality of life and
society rather than just health costs. A Health
Impact Assessment [HIA] is “a combination
of procedures, methods and tools by which
a policy, program or project may be judged
as to its potential effects on the health of a
population and the distribution of those
effects within the population”5.
At the local level an HIA has a potential
contribution to make to many areas of
activity and can provide a valuable tool to
support the work of Local Strategic
Partnerships (LSP) to demonstrate and6 to
support evidence based decision-making;
contributing to improvements and
reductions in health inequalities.
HIAs contribute to ensuring ownership of a
policy, cross-departmental working and
partnership development by involving the
community and professionals.
Within local authorities HIAs can be used to
determine the health impact of private
sector housing policy, bringing it into the
main stream or what could be part of a
Local Area Agreement (LAAs). They can be
particularly effective in linking enforcement
activity with health. The diagram below7
depicts the WHO definition of health and is
included as it is used as the basis for HIAs.
Local Area Agreements (LAAs)Local Area Agreements (LAAs) took the
place of Best Value Indicators (BVIs) from
April 2008.
Health determinants: Key areas influencing health
Dahlgren and Whitehead, 1991
5 WHO European Centre for
Health Policy, Gothenburg
Consensus 1999
6 Mason V, A Holistic
Approach to Housing,
Environmental HealthJournal, November 2003
7 Scott-Samuel A, Birley M
and Arden K, The Mersyside
Guidelines for Health
Impact Assessment,
Liverpool: Merseyside
Health Impact Assessment
Steering Group 1998

Local authorities as the lead partner have
been asked to draw up LAAs in consultation
with statutory and non-statutory
organisations operating within their area.
LAAs were introduced by the Department of
Communities and Local Government (DCLG)
in the Strong and prosperous communitiesWhite Paper. The Government has developed
a set of 198 national indicators from which
the authority will be able to select up to
35 negotiated targets, reflecting the most
important needs of the local community.
The priorities have to be negotiated with
the government office for the region and
targets set. There is an additional set of
18 statutory targets. The aims of the
agreements are divided into four parts:
• Children and young people
• Safer and stronger communities
• Healthier communities and older people
• Economic development and enterprise
Many councils are already involved in
preparing LAAs8. All councils were required
to have these in place by March 2008 to
start work on 1 June 2008.
The aim of the agreements is to link key
targets. Private sector housing generally has
links to many areas through the known
wider influence of Decent Homes. The
problem within private sector housing is to
accurately show this link.
Community and Environmental Health
Manager at Daventry District Council Mike
Arnold said:
“If services are not recognised as contributing
to LAA targets then they will have a lower
priority and this may affect funding”9.
During future comprehensive area
assessments (replacing comprehensive
performance assessments) judgements will
be made on outcomes and funds will follow.
Evidence will be required to show the
importance of housing as opposed to other
services competing for funds.
As a comparison the table below provides
evidence of the numbers of home accidents
against those caused at work or on the
roads10. The importance of housing
message needs to be brought to the
attention of those allocating resources.
Table 3
Good Housing Leads To Good Health: A toolkit for environmental health practitioners 09
8 Office of the Deputy
Prime Minister, The Reward
Element of Local Area
Agreements: Negotiation
of Stretched Targets,
November 2005
9 Mike Arnold, Community
and Environmental Health
Manager at Daventry DC, A
Voice for Local People Public
Health LAAs, EnvironmentalHealth Practitioner,September 2007, vol. 115/09
10 WHO Europe 2005
Comparison between causes of deaths and injuries in United Kingdom and France
Per year
At work
Killed persons
United Kingdom France
Injured persons Killed persons Injured persons
380 1,500,000 700 1,150,000
3600 317,000 7600 170,000
4100 2,700,000 9000 3,000,000
On the road
In the home

10 Good Housing Leads To Good Health: A toolkit for environmental health practitioners
Recent guidance for DCLG has indicated
that resources available to make more
homes decent will be favoured in local
partnerships.11 12
New Local Area Agreements (LAAs) will
help to embed housing at the heart of the
area’s priorities. They will also provide
further leverage over local authorities’
housing delivery and renewed focus on
areas of particular importance.
Appendix 3 gives details of where and how
private sector homes fit into the Audit
Commission Key lines of Enquiry (KLOE).
The Audit Commission have been charged
with introducing the Comprehensive Area
Assessment (CAA)13, to take the place of the
Comprehensive Performance Assessment
(CPA). This is intended to be risk based and
will focus on the LAA targets.
The CAA framework is still emerging but the
risk based approach will concentrate on
how policy and practice affects the
neighbourhood and community. CAA risk
assessments will focus on outputs.
An example where private sector housing
may be unexpectedly involved would be the
arrival of a food production factory and its
links with an increased migrant population
requiring housing in the area. ‘Sector self-
support’ (or anticipating and finding
resources to deal with new community
issues) is expected to be a continuing
theme, emphasised with the enactment of
the Housing Act 2004. The enforcement
procedures are encouraged to be self-
supporting, by charging owners/landlords
for notices and HMO licenses.
Departmental Strategic Objectives (DSOs)New National Indicators (NI) and
Departmental Strategic Objectives (DSOs)
have been announced. LAAs will have to
select the most appropriate NIs for their
area.
Future targets are likely to require some
form of measurement set by the LAA from
a baseline14. The Audit Commission has said
that they intend to concentrate on
measuring outcome as opposed to local
authority delivery. Their intention is not to
be bound by the targets set by the LAA.
But with the move to outcome based DSOs
and NIs, within homes there will be a
greater place for data based on specific
HHSRS hazards. Below are a few examples
relating hazards with national indicators
(NI) and outcome based Departmental
Strategic objectives (DSO) or Public Service
Agreements (PSA), which are not directly
related to measuring conditions in a home.
3.3
11 www.dh.gov.uk/
PublicationsAndStatistics/
FreedomOfInformation/
ClassesOfInformation/
WhitePaperHealthCare
Community/fs/en
Available here:
www.socialexclusionunit.
gov.uk/downloaddoc.asp?
id=797
12 PSA Delivery Agreement
20: Increase long term
housing supply and
affordability, HM
Government, October 2007
13 Strong and Prosperous
Communities – the Local
Government White Paper,
Cm 6939-I, Department of
Communities and Local
Government, October 2006
PSA 12: Improve the health and wellbeing of children
and young people
NI 50: Emotional health of children
Cause: Crowding and space hazard
PSA 17: Tackle poverty and promote greater independence and
wellbeing in later life
NI 138: Satisfaction of people over
65 with both home and neighbour
Cause: Entry by intruders
14 Negotiating New Local
Area Agreement,
Department for Communities
and Local Government,
September 2007

Good Housing Leads To Good Health: A toolkit for environmental health practitioners 11
The Government is committed to introducing
a ‘place survey’15 which will measure
satisfaction with accommodation and
neighbourhood. A self perception health
and wellbeing questionnaire will be included
as part of this. Health prevention has visibly
been moved up the agenda.
Home Improvement Agencies andhandyperson schemesReducing delays in discharge from hospital
is a key health sector priority16.
A fee system was introduced whereby
hospitals can charge social services
departments for failing to make
arrangements for the care of older people
who no longer have a medical need to
remain in hospital.
This change was also accompanied by short
term grant aid to support initiatives which
facilitate hospital discharge. These are
usually carried out by handyperson services
facilitated by a Home Improvement Agency
(HIA).
These agencies often receive additional
funding from local authority strategic
housing budgets and in some cases are run
in-house by the private sector housing team.
The links to Department of Health (DH)
objectives should be considered within LAAs.
The report On the Mend: The Role of HomeImprovement Agencies in HospitalDischarge (Adams, 2001) demonstrated
how undertaking small repairs and minor
adaptations to the home of people waiting
to leave hospital can be critical to their
discharge.
The provision of a small amount of funding
can support the services of a handyperson
scheme based within a Home Improvement
Agency17. Client confidence in these services
is evident and in many cases these services
are over subscribed.
The work carried out by handyperson
schemes can help local authorities to reach
vulnerable clients much faster. These
schemes can also assist health service
providers to reduce hospital admissions of
older people having accidents. Carrying out
minor repairs prevents hospital admission
from falls and accidents in the home.
The cost of delayed discharge from hospital
can be estimated at approximately £160m
per annum across England, according to the
DH in (2005).
3.4
The work carried out by handyperson schemes canhelp local authorities to reach vulnerable clientsmuch faster
Defra DSO: climate change tackledinternationally and throughdomestic action to reducegreenhouse gas emissions
NI 187: Tackling fuel poverty.
People receiving income based
benefits living in homes with a
low energy efficiency rating
Cause: Extreme cold hazard
15 The New Place Survey
Consultation, Department
for Communities and Local
Government, December
2007
16 Care & Repair England,
The Renewal Trust Business
Centre, 3 Hawksworth Street,
Nottingham NG3 2EG
Email: info@careandrepair-
england.org.uk
Web: www.careandrepair-
england.org.uk
17 DCLG, Supporting People
Foundations, Bleaklow
House, Howard Town Mill,
Glossop SK13 8HT
4.0 Quantitative methodology to show health impact
The Health and Safety Executive has
developed a method for businesses to
calculate the cost of accidents in their work
place18. This calculator has been redeveloped
and based on the HHSRS to measure the
effect of the home on health and produces
a method of quantifying the expected
number of health hazards in dwellings. The
estimated figure can then be compared
with local data to show the quantitative
effects of appropriate intervention.
The key indicators of health are used and
choosing the key indicators to quantify the
impact of improving housing on health
depends on two factors:
• Which factors have the greatest impact
of health?
• What measurements are available and
their accuracy?
Deciding on the hazards affecting health is
comparatively easy with the introduction of
the HHSRS and the data now available. But
it is worth looking at wider evidence
available from the World Health
Organization. The following table is
produced from their literature (ref 28)19.
Hazards believed to have the most
significant adverse health effects are ranked
as below, for countries that enforce health
and safety or building regulations.
The benefits of removing these hazards are
directly linked with mental and physical health.
In most of England and Wales Radon is not
a significant issue and is therefore not
included as a key indicator.
Air quality in the United Kingdom is
controlled by legislation other than that
concerned with housing with the exception
of that associated with mould spores and
humidity, which is dealt with under damp
and is therefore disregarded.
Using the HHSRS an indication of the
frequency or likelihood can be calculated.
In this country the average likelihood of a
fire hazard for example occurring between
1997 and 1999 was one in 4,760.
The small incidence of a fire hazard makes
predictions more difficult. For this reason it is
suggested that fire is only included as a local
indicator where accurate figures are available.
Table 4
12 Good Housing Leads To Good Health: A toolkit for environmental health practitioners
In this country the average likelihood of a firehazard for example occurring between 1997 and1999 was one in 4,760
18 www.hse.gov.uk/costs/
accidentcost_calc/accident
_costs
19 www.euro.who.int/HEN/
syntheses/housinghealth/
20050215_3
The most significant housing hazards associated with health effects*
• Poor air quality (particles and fibres that can cause death among the very ill)
• Poor hygrothermal conditions (excess heat, cold or humidity)
• Radon
• Slips, trips and falls
• Noise
• House dust mites
• Ambient tobacco smoke
• Fires
*The seriousness of the hazards has been ranked according to the number of people affected, the seriousness of the
effects and the strength of evidence.
Good Housing Leads To Good Health: A toolkit for environmental health practitioners 13
One of the hazards that is frequently a
cause of concern in England and Wales is
entry by intruders, with an average
likelihood of one in 40.
The other hazard with far reaching
consequences is crowding and space.
Although the average likelihood of the
hazard occurring is only one in 8,000 there
are indications that it is increasingly
common, particularly in the south of the
country and within areas with a high
migrant workforce.
The key indicators are therefore:
• Damp
• Cold
• Falls
• Entry by intruders
• Crowding and space
Additional local indicators may include:
• Radon
• Fire
5.0 Using the Housing Health and Safety Rating System(HHSRS)
14 Good Housing Leads To Good Health: A toolkit for environmental health practitioners
The HHSRS has been developed to identify andevaluate the potential risks to health and safetyfrom deficiencies identified in dwellings
The HHSRS has been developed to identify
and evaluate the potential risks to health
and safety from deficiencies identified in
dwellings.
The system was developed by Warwick
University Law School20 using statistical
evidence21 to give an accurate basis for
calculating the likelihood of an hazard
causing harm and the range of harms that
maybe expected.
There are 29 hazards identified but many
of them are comparatively rare for example
explosion or lead poisoning. The more
common hazards are seen regularly by
environmental health practitioners working
in private sector housing. It is the more
common hazards used in association with
the key indicators that are used to develop
a quantification methodology.
These are:
• Damp and mould growth
• Excess cold
• Crowding and space
• Entry by intruders
• Falling on level surfaces etc
• Falling on stairs etc
• Fire
The method for surveying a dwelling and
accurately assessing a hazard is the same
whatever the hazard. This methodology is
given in the published guidance22 which
must be followed. A brief summary for
non-technical persons (using as an example
the hazard of damp and mould growth) is
given in Table 5.
Assessing a dwelling for a damp andmould hazardA full survey of the dwelling is carried out
taking note of the structure of the building
and its ability to prevent damp entering
through the roof, windows, walls and floor.
The waste services will be examined to ensure
nothing is likely to leak. The type of heating,
insulation and ventilation will be noted to see
whether condensation is likely to occur. The
assessment is then made as to whether any
damp and mould growth is likely to cause
an occupier or visitor to experience any
harm over a 12 month period.
The occupier assessed (as required by the
guidance) is the most vulnerable for that
particular hazard. In the case of damp and
mould the occupier assessed is an under 14
year-old as they are the group judged most
susceptible to asthma.
If the surveyor considers there is a significant
risk from the hazard then this will be assessed
taking into account the average likelihood
of a harm occurring. The average likelihood
is given in the HHSRS Operating Guidance23.
The average likelihood of an under 14 year-
old person suffering a health problem from
damp and mould in any type of dwelling is
given as one in 464. A health problem or
harm is defined as one which requires some
type of medical intervention. The type of
harm that could occur from damp may
range from a common cold, stress or asthma.
These health effects or harm outcomes are
presented by percentage as one of four
classes of seriousness. See Table 5. The
definitions of these are all given in the
guidance and produced from the statistical
evidence basis mentioned above.
Predicting the number of hazards withina local authorityThe figures in the following two tables can
be used to give the likely number and type
of cases within an authority area.
The calculation tool can be extrapolated to
include the costs associated with expected
harm outcomes. Costs are substituted for
the harm outcome weightings given in the
20 Housing Health and
Safety Rating System
Guidance (Version 2),
Safe and Healthy Housing
Research Unit, Warwick Law
School, Office of the
Deputy Prime Minister,
November 2004
21 Statistical Evidence to
Support the Housing Health
and Safety Rating System:
Volume II – Summary of
Results, Office of the
Deputy Prime Minister,
May 2003
22 Housing Health and
Safety Rating System:
Operating Guidance,
Office of the Deputy Prime
Minister, February 2006
23 Housing Health and
Safety Rating System:
Operating Guidance,
Office of the Deputy Prime
Minister, February 2006

Good Housing Leads To Good Health: A toolkit for environmental health practitioners 15
guidance. An example using damp and
mould growth is below:
Damp and mould, an example
This methodology makes a number of far
reaching assumptions and can only be used
as a guide, but the calculator is a useful
starting point to give the average expected
incidents and costs when available. Similar
calculations can be used for all hazards.
This expected number can, where the
information is available, be correlated with
the actual expected number of incidents
and harms. The figure can be adjusted for
household size and number of vulnerable
persons if this is significantly different from
the average. An estimated cost can be
given which can be compared to local
authority costs for preventative works.
Similarly, a comparison between the local
area and the national picture can be made.
Information from house condition surveys,
statistics from police, fire and accident sites,
health authorities and census data can be
substituted where available to show the
greatest hazards within a local authority or
ward area.
A list of useful websites is provided on page
19. The regional public health observatory
is particularly valuable. Councils are
required to have a community crime
prevention officer who will have local crime
data available. County Council websites give
statistics at ward level. This should provide
evidence of the areas of greatest concern
and a cost benefit.
The HHSRS guidance indicates where
statistics providing average likelihoods and
harm outcomes have been collected from.
Using this information allows similar local
statistics to be used to indicate likelihood.
The example on page 16 compares Suffolk
Coastal District Council, Ipswich Borough
Council and Nottingham City Council for
the hazard of entry by intruders. The basis
of estimates for entry by intruders is based
on all burglaries as there is an assumption
of some mental harm done.
Local statistics are available for fire and
numbers of bed spaces (crowding and
space). Health based statistics are also
available but the number of variables
currently makes their use more difficult.
Table 5
In a local authority area with 100,000 private sector dwellings.
The average likelihood of damp causing an harm is 1 in 464.
100,000 / 464 = 216 expected incidences
Harms expected following this incidence are separated into the
classes of harm given in the guidance, calculated into the
representative scale percentage points and costed.
This equals:
0% x 216 = 0 class 1 x £50,000
1% x 216 = 1.08 class 2 x £20,000
10% x 216 = 10.8 class 3 x £1,500
89% x 216 = 96 class 4 x £100
Total expected health costs due to damp and mould in private
sector housing in a local authority with 100,000 such dwellings
is £47,000.

Entry by intruders, an exampleTable 6
16 Good Housing Leads To Good Health: A toolkit for environmental health practitioners
Suffolk Police Authority is required to report statistics to the
county council. Looking at their website gives a break down of
burglaries for every ward in Suffolk. Similarly, the burglary
numbers and numbers of dwellings for Nottingham City
Council were obtained from their website.
Suffolk Coastal District Council has 49,200 private sector
dwellings. Number of burglaries in 2005 was 172.
Likelihood is 49,200/172 = 1 in 286
Ipswich Borough Council has 44,564 private sector dwellings.
Number of burglaries in 2005 was 433.
Likelihood is 44,564/433 = 1 in 102
Nottingham City Council has 83,600 private sector dwellings.
Number of burglaries in 2005 was 54.8 per 1000.
Likelihood is 83,600/4581 = 1 in 18
Notes:
National average Likelihood is 1 in 40
The burglaries measured include those in social housing.
Suffolk has one of the lowest rates of burglary in the country.

6.0 Cost comparison
Good Housing Leads To Good Health: A toolkit for environmental health practitioners 17
Comparisons between the local cost of
preventative works and those of ill health
will be one of the main uses of the HHSRS
Costs Calculator.
Cost assumptions included in the Costs
Calculator have been developed from
median estimated costs used by the English
Housing Condition Survey (EHCS) and are a
useful starting point. Actual works and their
costs can be developed locally where more
accurate information is available.
The table below shows these figures.
Other costsThis toolkit concentrates on the cost benefit
in health cost terms. The full costs are
complex and are discussed in more detail in
Appendix 2, however some use can be made
of other costs where available. A burglary
for example has been costed at £3,26824.
Summarising hazards, health and cost The cost of typical class 1, 2, 3 and 4 harm
outcomes has been calculated and this can
be compared with the costs of works. The
national average costs calculated can only
be a starting point. As more information
becomes available it will be possible to use
local statistics and local costs to more
accurately inform strategy.
6.1
6.2
Table 7
Comparisons between the local cost of preventativeworks and those of ill health will be one of the mainuses of the HHSRS Costs Calculator
Hazard
Crowding and space
Damp
Entry by intruders
Excess cold
Level falls
Stair falls
Costs to remedy
£16,523
£11,075
£1,046
£4,993
£385
£338
Notes
Cat 1 costs only
Estimated from working results
2006 data only
2006 data only
24 Dubourg R and Hamed J,
The Economic and Social
Costs of Crime Against
Individuals and Households
2003/04, Home Office
Online Report 30/05, Home
Office: London 2005
Demonstrating costs of mitigating hazards: Costs of remedial works
Please note: Costs have been calculated from medians using the 2005/06 EHCS data.

7.0 Health Impact Assessment – Questionnaires
To prevent ‘consultation fatigue’ a selection of questions successfully used before is suggested
below which can be added to existing questionnaires.
The questionnaire should not be too long, so the most appropriate questions should be selected:
How do you feel about the state of repair of the internal/external structure of your property?
(range replies from very good to very poor)
How much do you spend on heating your home?
Do you feel safe within your home? (range from very safe to dangerous)
Have you had any accidents within the home during the last 12 months?
If so did the accident require first aid/GP visit/hospital visit?
Approximately how many times has a member of your household visited their GP in the
last 12 months?
In your opinion what problems related to accommodation and neighbourhood do people face?
In your opinion what physical and mental health problems are people living with?
How have these problems arisen?
What difficulties do you or your neighbours encounter with their daily activities as a result
of their physical/mental health?
Do you have any problems accessing services i.e. bus/library/GP/shop?
What are the reasons for this?
To assess the impact of improvement work
Since the work was carried out do you feel? (range from happier to content to the same)
Since the work was carried out do you feel more able to ask friends to visit? (range from a
lot to no difference)
Since the work was carried out do you think your children’s health has improved?
(range from a lot to no difference)
Since the work was carried out has your health/the health of other occupants in the
property improved? (range from a lot to no difference)
18 Good Housing Leads To Good Health: A toolkit for environmental health practitioners
Different types of questionnaire are already sent outby most local authorities asking questions regardingcustomer service
1.
2.
3.
4.
5.
6.
7.
8.
9.
10.
11.
12.
13.
14.
15.

8.0 Useful websites
Every local authority area has a health
profile. Google the council name and
“health profile”, for example: “Suffolk
Coastal health profile”.
Every region has a public health observatory
containing information on the number of
illness/accidents in that region, for example
the Eastern Region Public Health Observatory
ERPHO.
www.neighbourhoodstatistics.gov.ukThis site provides statistics on benefit
levels/crime, etc for each ward within each
local authority.
www.hpi.org.ukThe health poverty index is downloadable
in graph or spreadsheet format for every
local authority area.
www.Hi4em.org.ukHousing Intelligence is an East Midlands
orientated site, providing information on
dwelling statistics for local authorities in the
region.
www.integratedcarenetwork.gov.uk/housingIs an easy to find information site
connecting housing to the health and social
care agenda.
TIP: Mark useful websites and pages to help
find them again.
Good Housing Leads To Good Health: A toolkit for environmental health practitioners 19

9.0 Case studies – Measuring health impact to show the qualitative effects of interventionThere are eleven case studies précised and included here to show some best practice around the country.Health impact can be measured before, during or after an intervention or proposal.
Health@Home: Warrington Borough Council25
Key points:
• Partnership working
• Training of agencies in the work and tools of
partners working with similar client groups
• Health questionnaires following housing
intervention
The Health@Home Project (2004-2007) is a
partnership initiative focusing on the links
across sectors, with health and wellbeing as
their core concern.
The aim of the project was to focus on links
across boundaries of services, to assist
individuals, to assist staff to identify and
refer on ill and vulnerable people, provide
information and training to improve the
coordination of health and housing sectors
and aid the development of best practice.
Health@Home aims to cut across the
normal boundaries of service provision in a
practical way and to improve pathways
between services.
The cases referred to Health@Home had
the following health issues:
• Asthma/respiratory/Coronary Obstructive
Pulmonary Disorder (COPD): 25
• Heart condition: 1
• Several health conditions: 4
• Other (mental health, blind, arthritis): 12
Actions taken to improve health included
energy efficiency advice, grants, repairs and
adaptations.
Warrington also has high rates of
respiratory illness. A study26 has shown that
by funding central heating measures in
damp homes where there are asthmatic
children school days lost due to asthma
reduce from nine school days per 100 to
only two days per 100.
A Health Impact Assessment was conducted
after work had been carried out. Most people
asked said that they very much appreciated
the work that was done and felt that it had
greatly improved the quality of life for the
family or had improved their health.
However, the 19 percent of people who said
that the work had not improved their health
did so because they were healthy anyway
or their condition is chronic and could not
be improved by improvements to the
condition of the home alone.
When asked “has your health improved as a
result of the works to your home?” the
results were as follows:
• Yes: 38 or 67 percent
• No: 11 or 19 percent
• No answer: eight or 14 percent
The survey shows that work to improve the
quality of private sector housing plays an
important role in improving the health and
wellbeing of occupants.
This fits in very well with the aims of the
Social Inclusion Strategy, which seeks to
improve the living conditions, health and
wellbeing of disadvantaged groups.
When asked “how much has your health
improved, on a scale of zero to five, as a
result of the works to your home?” the
results were as follows:
5: (a lot) 20 or 45 percent
4: 14 or 32 percent
3: 4 or 9 percent
2: 2 or 4 percent
1: 3 or 7 percent
0: (not at all) 1 or 2 percent
Three quarters of respondents said that the
work has significantly improved their health
and wellbeing.
20 Good Housing Leads To Good Health: A toolkit for environmental health practitioners
25 Health@Home Project
Report October 2004 –
March 2007, Warrington
Borough Council, Warrington
Housing Association and
Warrington PCT
26 Housing and Health –
The Cornwall Intervention
Study (a report to the
Trustees of eaga Charitable
Trust), April 2004
9.1
For further
information
please contact
Gerry Kiddle
at Warrington
Borough Council on:
01925 246812

Key points:
• Reducing winter deaths and empowering
people to stay in their own homes
• Measurements of health attributes using
questionnaires
• Results showing a reduced number of visits
to GP and reduced length of hospital stays
The project was run using Health Action
Zone (HAZ) funding and involved the
former Liverpool Health Authority which
subsequently became the Primary Care
Trust. The evaluation is of particular interest
due to the use of standard health research
questionnaires reported in eight groupings.
The results are shown below.
The SF36a questionnaire (a standard
health questionnaire used across health
sectors) is structured to measure eight
health attributes using the Lickert method,
ranging from strongly agree to strongly
disagree, of summated ratings. The
attributes are:
• PF Physical functioning
• RP Role physical
• BP Bodily pain
• GH General health
• VT Vitality
• SF Social functioning
• RE Role emotional
• MH Mental health
A further attribute (HT or reported health
transaction) is contained within the general
health attribute. Each response in the
SF36a questionnaire is scored numerically.
In general a higher score indicates better
functioning or health, but this is not the
case with every attribute – some require
recoding in order to avoid bias.
The questionnaire is designed to be
completed by the respondent. However, in the
circumstances of the Safe and Warm project
it was decided that a surveyor should visit
respondents in their own homes. The Liverpool
HAZ results showed an improvement in
seven of the eight attributes as shown below:
Table 8
Good Housing Leads To Good Health: A toolkit for environmental health practitioners 21
27 Merseyside Health
Action Zone, Safe and Warm
Housing Improvement
Project, Final Monitoring
Report, Prof. Chris Couch
and Terry Fitzharris, Liverpool
Moores University 2003
Safe and Warm Housing Improvement Project27:Merseyside Health Action Zone (HAZ)
9.2
SF36a Survey results for Liverpool
■■ Before
■■ After
Health attributes
Sco
re
PF
80
70
60
50
40
30
20
10
0RP BP GH VT SF RE MH

22 Good Housing Leads To Good Health: A toolkit for environmental health practitioners
The project concluded that it was successful
in improving physical housing conditions,
particularly in relation to heating and
insulation systems, and security in the
home. This has led to occupiers feeling
warmer at home and experiencing reduced
heating costs.
Advice on welfare benefits resulted in
increased household incomes in many cases.
Collectively these physical and economic
improvements have in turn led to health
benefits. Particularly noticeable have been:
• Improvements in social functioning
• Reduced demands upon GP services
Not only does the project confirm the view
that investment in housing conditions can
improve the health and wellbeing of
householders, and therefore reduce the
burden both on primary health care, but there
will also be some reduced burden on hospitals.
An additional result of this project, because
of the partnership approach and sharing of
professional knowledge, was an increased
take up of the appropriate state benefits.
Good Housing Leads To Good Health: A toolkit for environmental health practitioners 23
Key points:
• Funding through an outside agency
• Trains key workers to recognise health
issues resulting from poor housing
• Links with LAAs
The Health through Warmth referral
scheme is in partnership with electricity
provider Npower. The scheme tackles fuel
poverty, cold related illness and excess
winter deaths. It also aims to improve the
health and living conditions of the most
vulnerable people in the most deprived
area’s of Walsall.
The scheme trains key workers to recognise
when the clients they are visiting are
suffering from ill health as a result of living
in a cold/damp home. The trained officer
can then refer them to a central point that
will identify and implement the appropriate
solution. This can include central heating,
insulation, energy advice and a benefits
health check.
To be assessed for the scheme the client
must suffer from a cold or damp related
illness. The project operates across the
whole of the borough for people of any age.
The scheme applies to all tenures, but it is
likely that the majority of the works
completed will be in the private sector.
The local Primary Care Trust has already
identified more than 100 staff to be trained
in completing referrals. The local branch of
Age Concern is also supporting the scheme
and their staff have received training. The
initial success of the project has led to the
employment of a Health through Warmth
officer.
Evaluation of the scheme has shown
Standard Assessment Procedure (SAP)
rating comparisons. The average Heath
through Warmth SAP has gone up from 48
to 73. The PCT have been asked to conduct
a cost comparison of savings to the PCT
services after an average case has had
energy efficiency measures.
Further evaluation shows a direct contribution
to nine of the targets identified in the main
LAA aims and also shows a contribution to
the other three aims, as below.
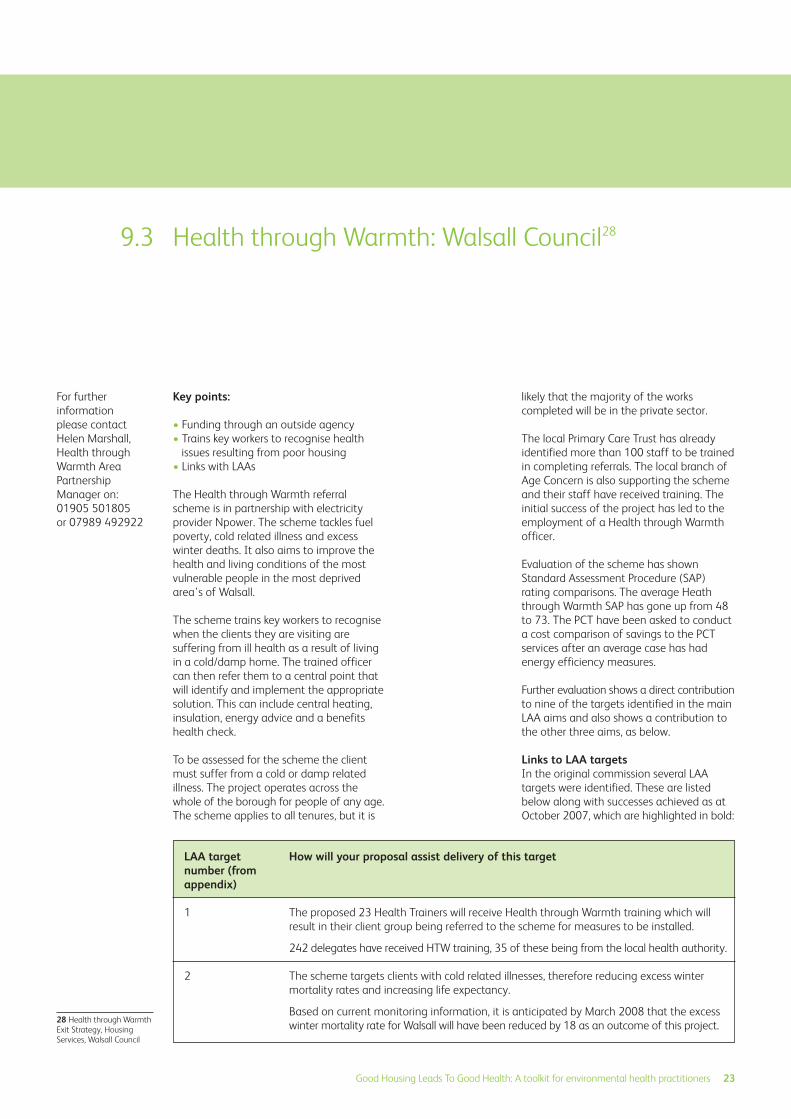
Links to LAA targetsIn the original commission several LAA
targets were identified. These are listed
below along with successes achieved as at
October 2007, which are highlighted in bold:
For further
information
please contact
Helen Marshall,
Health through
Warmth Area
Partnership
Manager on:
01905 501805
or 07989 492922
Health through Warmth: Walsall Council289.3
How will your proposal assist delivery of this target
The proposed 23 Health Trainers will receive Health through Warmth training which will
result in their client group being referred to the scheme for measures to be installed.
242 delegates have received HTW training, 35 of these being from the local health authority.
The scheme targets clients with cold related illnesses, therefore reducing excess winter
mortality rates and increasing life expectancy.
Based on current monitoring information, it is anticipated by March 2008 that the excess
winter mortality rate for Walsall will have been reduced by 18 as an outcome of this project.
LAA targetnumber (fromappendix)
1
2
28 Health through Warmth
Exit Strategy, Housing
Services, Walsall Council
24 Good Housing Leads To Good Health: A toolkit for environmental health practitioners
How will your proposal assist delivery of this target
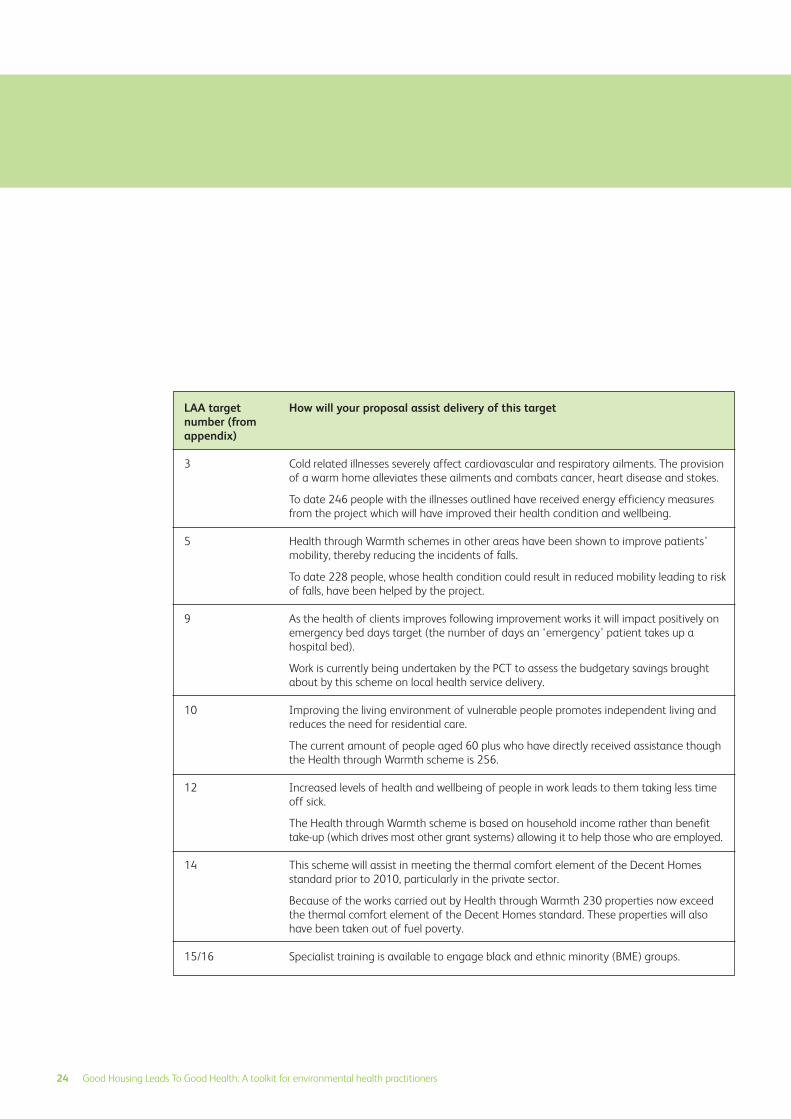
Cold related illnesses severely affect cardiovascular and respiratory ailments. The provision
of a warm home alleviates these ailments and combats cancer, heart disease and stokes.
To date 246 people with the illnesses outlined have received energy efficiency measures
from the project which will have improved their health condition and wellbeing.
Health through Warmth schemes in other areas have been shown to improve patients’
mobility, thereby reducing the incidents of falls.
To date 228 people, whose health condition could result in reduced mobility leading to risk
of falls, have been helped by the project.
As the health of clients improves following improvement works it will impact positively on
emergency bed days target (the number of days an ‘emergency’ patient takes up a
hospital bed).
Work is currently being undertaken by the PCT to assess the budgetary savings brought
about by this scheme on local health service delivery.
Improving the living environment of vulnerable people promotes independent living and
reduces the need for residential care.
The current amount of people aged 60 plus who have directly received assistance though
the Health through Warmth scheme is 256.
Increased levels of health and wellbeing of people in work leads to them taking less time
off sick.
The Health through Warmth scheme is based on household income rather than benefit
take-up (which drives most other grant systems) allowing it to help those who are employed.
This scheme will assist in meeting the thermal comfort element of the Decent Homes
standard prior to 2010, particularly in the private sector.
Because of the works carried out by Health through Warmth 230 properties now exceed
the thermal comfort element of the Decent Homes standard. These properties will also
have been taken out of fuel poverty.
Specialist training is available to engage black and ethnic minority (BME) groups.
LAA targetnumber (fromappendix)
3
5
9
10
12
14
15/16
Good Housing Leads To Good Health: A toolkit for environmental health practitioners 25
A study has been commissioned to
highlight the best methods of working with
BME groups. Community events have been
held with various faith organisations across
the borough.
The commission also recognised that
Health through Warmth had links into the
other three pillars. Examples of successes in
these pillars are:
a) Children and Young People – of the
314 referrals received into the scheme so
far, many will have young people living in
the household. 10 referrals, which
resulted in works being carried out, were
received where the client with the serious
illness was a young person
b) Safer and Stronger Communities –
Property values rose as a result of the
energy efficiency measures installed. The
average SAP rating (the method used to
measure the energy efficiency rating of a
property on the scale of 1 to 100) has
risen from 48 to 73, an improvement of
52 percent
c) Economic Development and Enterprise – The scheme primarily uses
the services of local contractors, who in
turn employ local people

26 Good Housing Leads To Good Health: A toolkit for environmental health practitioners
The impact of housing on health29: Stockport Metropolitan Borough Council
9.4
Key points:
• Health data collected
• Health visitor questionnaires
• Recommendations include further joint
working
Stockport Metropolitan Borough Council
carried out a Health Impact Assessment
before formulating their housing strategy:
“To inform the development of Stockport’s
2005/2008 Housing Strategy to ensure it is
geared to tackle public health issues in a
systematic way.”
Health data was collected on a ward by
ward basis on particular conditions which
may be influenced by housing. Respiratory
illnesses including excess cold deaths and
asthma; accident statistics involving
accidents in the home; homelessness and
mental illness data was collated. Data from
the House Condition Survey was used to
inform the process.
The HIA included asking health visitors
what housing issues affected on their
clients. This identified a wide set of factors
including affordable housing and
neighbourhood issues. The poor condition
of the private rented sector was also
identified as being a priority.
The recommendations were to prioritise
private rented stock, improve links with health
visitors for future referencing, incorporate links
(such as reducing crime) into the Housing
Strategy and to accelerate outcomes by
accessing joint funding. The last two points
are the basis of the new LAA targets.
29 The Impact of Housing
Conditions on Health,
Report to Social Care and
Health Scrutiny Committee,
Stockport Metropolitan
Borough Council 2005

Good Housing Leads To Good Health: A toolkit for environmental health practitioners 27
Health Impact Assessment: North WestLeicestershire’s Private Sector Renewal Strategy30
9.5
Key points:
• Identifying excluded groups
• Strengthening the enforcement strategy
• Using a common language across all
professional groups
Northwest Leicestershire commissioned a
rapid HIA of their draft Private Sector
Housing Renewal Policy.
The HIA was used as one of the main
methods of consultation. It allowed the
bringing together of health professionals
and council members as representatives of
clients and the wider community.
During the HIA a wide range of health
determinants were discussed against a
background of statistical information
regarding the tenure and property type.
Recommendations at the end of the report
assessed the policy as having a positive
effect on health, particularly towards the
target groups, but also highlighted some
areas for improvement – allowing the policy
to be tightened.
One of the unexpected issues raised during
the rapid Health Impact Assessment was
the exclusion of private tenants from the
policy. Recognition of this allowed the
enforcement strategy to be strengthened.
The names of assistance available and
language within the draft policy were found
to differ from related policies within the
public and health sectors. Altering these so
that everyone speaks the same language
should increase understanding and
communication between professionals.
30 Mason V, A Holistic
Approach to Housing,
Environmental HealthJournal, November 2003

28 Good Housing Leads To Good Health: A toolkit for environmental health practitioners
Leeds Landlord Accreditation Scheme31: Leeds City Council
9.6
Key point:
• Demonstration of the improved health of
private tenants following proactive
intervention
A Health Impact Assessment working group
was set up to include officers from Leeds
City Council and Leeds Primary Care Trust.
The assessment documented evidence
showing that housing conditions affect
health and wellbeing of occupants:
“An examination of the condition of
properties owned by Leeds Landlord
Accreditation Scheme (LLAS) members and
non-members shows that member
properties are of a higher standard and
their tenants are consequently experiencing
better health.
“Recommendations are made with respect
to enhancing and extending the scheme,
thereby enhancing the health of the
population of Leeds and tackling health
inequalities.”
The HIA was carried out using two main
tools:
1. Property Improvement Plans (PIP) drawn
up following HHSRS surveys
2. Questionnaires
Comparisons were made between the
condition of LLAS and non-LLAS properties
based on HHSRS surveys. A self perception
questionnaire was completed by the tenants.
For further
information
please contact
John D Swift, Health
Improvement
Specialist, Leeds
Primary Care Trust
on: 0113 3057551
or Mark Dolman,
Principal Health
Development Officer
on: 0113 2149216
31 Health Impact
Assessment of the Leeds
Landlord Accreditation
Scheme, JD Swift & M
Dolman, August 2007
Good Housing Leads To Good Health: A toolkit for environmental health practitioners 29
Pimhole Clearance Area32: Bury MetropolitanBorough Council
9.7
Key points:
• Crosscutting recommendations
• Demonstrated the possible negative
aspects of housing renewal, as well as the
positive, allowing preventive action to be
taken before the event
Bury Metropolitan Borough Council (MBC)
commissioned a rapid HIA on their
proposed clearance area in Pimhole. The
assessment day was attended by health
professionals, representatives from business
and residents. A major benefit was the
involvement of professionals from a number
of disciplines – leading to crosscutting
recommendations.
The predicted health results are listed below:
• An improvement in childhood health
through increased garden space leading to
increased physical activity. PCT mapping
shows 27.8 percent of residents in East
Bury take no physical activity in a week,
6.4 percent above the average for Bury
• A reduction in accidents both within the
home due to improved design and those
due to traffic. Speeding traffic is seen as a
serious problem by 26.1 to 29.4 percent
of East Bury residents. The average for the
number of Bury residents who see
speeding traffic as a problem is 22.2
percent
• A reduction in the incidence of asthma by
providing increased garden area for play
and dryer homes
• Improved self esteem and motivation
• Educational opportunities increased with
more room for studying. 2001 census
data indicates that 13 percent of families
are overcrowded compared with a five
percent average for Bury
• An increase in community ownership with
subsequent reduction in environmental
nuisance and investment in homes
• Improved employment and training
opportunities, particularly if a scheme
allowing self build homes can be achieved
and/or developers are encouraged to use
local labour and provide training.
Unemployment in the area is 4.2 percent
according to census data, the Bury
average is 2.7 percent
• Lower running costs of new homes with
improved energy efficiency will increase
comfort levels and give additional income
for leisure pursuits
• A perceived opportunity for some
residents to move to a more socially
inclusive area, a new start and access to
more facilities. 4.2 to 5 percent of East
Bury residents would not feel safe out in
the neighbourhood during the day. The
average for Bury is 2.4 percent
• Increased chances for private rented
sector tenants to gain better homes
The predicted negative health impacts:
• Psychological risks associated with a
change of community cohesion,
separation of extended families
• Less homes available, increasing the
length of the waiting list for social
housing
• More expensive homes will reduce
additional income for other pursuits
• Stress through fear of the unknown
• Potential poorer access to services and
employment opportunities for those
moving away from the area
32 Bury MBC Pimhole Rapid
HIA Report, Hollesley Health
& Housing Consultancy,
April 2004

30 Good Housing Leads To Good Health: A toolkit for environmental health practitioners
• Possible lack of access to appropriate
education, social services and medical
services
• Loss of employment and business for
commercial concerns within the area
• Stress to remaining community
• Reduced employment through potential
redundancies at the local school if the
numbers of pupils are reduced due to
moving out of the area
• Increased asthma and chest disorders
due to building and demolition
• Short term increase in vandalism, noise
levels and perceived increase in crime
levels
Predicting the negative impacts allowed
health professionals to work together to
reduce these before the event.

Key points:
• Use of case studies to advertise
achievements
• Links with social exclusion
The case study included below uses a real
case as an evaluation tool. The inclusion of
photographs can also be used to help
secure publicity.
Case Study – CatherineCatherine, a mother of two young children,
lives in Hyson Green in a three bedroom
terraced house rented from a private landlord
and was having problems keeping her home
warm – the fuel bills were very high.
It was at the Sure Start activities group at
the Vine Community Centre in Hyson Green
that Catherine met Debbie, Nottingham
District Council Healthy Housing Project
Coordinator and was referred to the Warm
Front Grant scheme.
Within a month a surveyor had assessed her
eligibility for the scheme and her property
to see what measures could be taken.
Catherine was pleased to find that she was
eligible to receive a central heating system;
this included a new gas combi boiler and
five radiators.
She said:
“The Warm Front grant has changed my
family’s life. I have lived in my home for six
years without any central heating, only a
gas fire in the living room. I had to use an
electric heater to warm the girls’ bedroom
before bedtime, which was very expensive.
The girls shared a room as I couldn’t afford
to heat a bedroom each for them.
“We have experienced quite a few really
bad winters and it has been really hard and
expensive for me to keep the house warm.
As a parent my main concern was keeping
the girls warm and happy.
“Now everything has changed for the
better, the house is warmer and the whole
atmosphere in the house has changed.
“We never used to use the dining room as it
was far to cold, but now we have central
heating in there it’s warm and we can sit
round the table to have meals together as a
family. The girls have now put up all their
paintings and pictures they have done from
nursery and home to make the dining room
look more homely. They are so much
happier; they can run around all the rooms
in the home and play in their bedrooms
and feel warm.
“I could tell our home is so much warmer
when a friend came to visit. This friend
never took her coat off in my house as it
was just too cold. The other day she came
in, took her coat off and told me my house
was warm, which made me so happy.
“We just want to say a big thank you to
Warm Front, they have changed our lives. I
would advise anyone eligible to take up the
opportunity and apply for a grant today; it’s
fantastic.”
June 2007
Nottingham Energy Partnership
For further
information
please email:
info@nottenergy.
com
Good Housing Leads To Good Health: A toolkit for environmental health practitioners 31
Health Housing Service: Nottingham EnergyPartnership
9.8

32 Good Housing Leads To Good Health: A toolkit for environmental health practitioners
Broadening Choices for Older People (BCOP): A handyperson service in Birmingham33
9.9
Mrs M is 75 years-old and cares for her
husband who, due to multiple strokes, now
has severe mobility limitations.
He is also diabetic and suffers with vascular
dementia. Mr M has refused all provision of
personal care, so Mrs M is left to deal with
most of his needs. She has a heart problem,
a spine condition and is waiting for hip
replacement surgery. Mr M has also had
many falls around the home. Home care
assistants come to help with tasks such as
making the beds and cleaning each day
and Mrs M receives three hours respite care
per week.
Mr M was a builder and ran his own
company for many years. His wife has a lot
of trouble getting him to accept people
coming into their home to undertake
repairs and BCOP (Broadening Choices for
Older People) is the first time he has
accepted. Commenting on the quality of
the BCOP handyperson scheme personnel
Mrs M said:
“They had such a friendly way with them
and came in not just as a sort of builder.
They came and spoke to [Mr M] and took
an interest in him and explained what they
were going to do and that is why [Mr M]
accepted people into the house.”
BCOP has completed many jobs for the
couple, from changing light bulbs to
installing a shower. Mrs M said that having
the service available: “had taken away a
great deal of worry”.
33 Copied from Small
Things Matter: The key role
of handyperson services,
Care & Repair England
2006

Good Housing Leads To Good Health: A toolkit for environmental health practitioners 33
Entry by Intruders – Demonstrating the true localpicture: Bristol City Council34
9.10
Key points:
• The use of local statistics
• Targeting available resources to need
Local costs and statistics can be transposed
to show real cost benefit. An example is
given below.
Bristol City Council use local crime statistics
to judge the likelihood of an ‘entry by
intruders’ hazard. The number of burglaries
per ward was collected from statistics
produced by Avon and Somerset police.
The number of properties per ward was
then divided by this figure to give the
likelihood of a dwelling being burgled or to
cause some type of harm outcome. In
accordance with the HHSRS guidance it is
assumed that all burglaries cause some
harm. The figures are being used to give
minor works assistance grants where
appropriate, in accordance with the
council’s policy.
Please see the Table below for further details.
Table 9
34 Housing Health and
Safety Rating System –
Hazard 12 – Entry by
Intruders: A local evaluation,
Bristol City Council
Marion Roderick 2007
Average likelihood of household burglary from 2002/3 to 2004/5*
Ward
Ashley
Cabot
Lawrence Hill
Filwood
Cotham
Easton
Bishopston
Knowle
Horfield
Southville
Windmill Hill
Hartcliffe
Whitchurch Park
Lockleaze
Southmead
Redland
Average annualhousehold burglaries
2002/3 to 2004/5
431.00
320.33
368.00
262.67
225.00
214.33
208.33
186.67
189.67
196.00
208.67
182.00
177.33
169.67
169.33
167.33
Number of dwellings(census data)
5127
4266
5637
4575
4978
4981
4854
4506
4730
4894
5330
4702
4597
4489
4513
4523
Likelihood ratio
12
13
15
17
22
23
23
24
25
25
26
26
26
26
27
27
*calculated using Avon and Somerset constabulary statistics Continued on next page

34 Good Housing Leads To Good Health: A toolkit for environmental health practitioners
Table 9 Average likelihood of household burglary from 2002/3 to 2004/5* continued
Ward
Eastville
Henbury
St George West
Clifton East
Stoke Bishop
Bishopsworth
Frome Vale
Westbury on Trym
Clifton
Hengrove
Kingsweston
Bedminster
Hillfields
Brislington East
Avonmouth
Henleaze
St George East
Brislington West
Stockwood
Bristol total
Average annualhousehold burglaries
2002/3 to 2004/5
175.33
150.00
165.33
153.33
109.00
143.33
138.67
125.33
135.33
131.00
120.33
125.67
124.67
119.67
122.67
98.00
101.67
87.67
84.67
6088.00
Number of dwellings(census data)
4895
4362
5006
4657
3370
4750
4688
4568
4951
4835
4580
4973
5210
5097
5254
4386
4970
4539
4491
166,374
Likelihood ratio
28
29
30
30
31
33
34
36
37
37
38
40
42
43
43
45
49
52
53
2795% confidenceinterval (24-31)
*calculated using Avon and Somerset constabulary statistics
Good Housing Leads To Good Health: A toolkit for environmental health practitioners 35
Overcrowding: Islington Borough Council9.11
Key points:
• Use of census data
• Linking health data and HHSRS
• Providing evidence for early intervention
This Health Impact Assessment project
looks at a range of local statistics and
compares them with the HHSRS to find the
priorities for action within Islington.
The project was carried out by an
environmental health practitioner who
works for both Islington Borough Council
and Islington Primary Care Trust (PCT). The
overcrowding topic is included below as an
example.
OvercrowdingThis hazard, known as ‘crowding and space’,
is of obvious significance in Islington due to
its high density, highly urban nature.
A detailed report, Space to wind down:Tackling the effects of overcrowding, by
Islington’s Housing, Performance and
Property Department35 highlighted a
worrying trend that showed overcrowding is
increasing in the borough.
A breakdown of these figures by tenure
revealed that overcrowding in the private
rented sector had decreased from 5.95
percent in 1991 to 4.75 percent in 2001,
whereas the levels of overcrowding in the
social sector increased in this time (from
5.74 percent to 8.05 percent in council
stock and from 4.17 percent to 6.30
percent for housing association stock). The
Residential Enforcement Housing (REH)
team do not have the power to effect
council stock but it does have power over
Residential Social Landlord (RSL) stock.
One of the key recommendations to come
out of the Space to wind down report is the
use of private sector stock to provide
accessible, affordable and quality
accommodation to take some of the
overspill from overcrowded social housing.
All of the other issues dealt within this
project, and indeed those other hazards
that make up the full complement of
HHSRS, will need to be taken into account
to ensure that people from overcrowded
households moved to the private sector are
not moved into a separate set of problems.
Another source of information specific to
Islington was produced as part of the
Neighbourhood Renewal Fund (NRF) project
in 2004. Various maps were produced which
add a further layer of detail in identifying
which parts of the borough suffer from
higher levels of overcrowding, deprivation,
etc. These can then be compared with
Census data to see if various wards should be
prioritised for action against overcrowding,
as well as comparing this data with maps
showing RSL accommodation to help
identify those areas in the private sector.
Table 10, using data from the 2001 census,
indicates levels of overcrowding by ward. An
occupancy rating of minus one means that
there is one room too few to accommodate
the occupants to the overcrowding
standard.
An occupancy rating of minus two means
that there are at least two rooms too few.
However, this data assumes that each single
household will require two common rooms
and one bedroom, and households of two or
more people will need two common rooms
plus one bedroom for each relevant unit i.e. a
couple, a person 16 years or older and up to
a pair of children up to the age of 15 (and of
the same sex when they are 10 and older).
This standard relating to how many people
can sleep in any suitable room is known as
the ‘bedroom standard’ and is a slightly
For further
information
please contact
Paul Mishkin at:
paul.mishkin@isling
ton.gov.uk
35 Health Impact
Assessment Project:
Residential Environment
Health Service and the use
of the Housing Health and
Safety Rating System, Paul
Mishkin, Residential
Environmental Health, Public
Protection, Islington Borough
Council, January 2008

36 Good Housing Leads To Good Health: A toolkit for environmental health practitioners
misleading definition because living rooms
and dining rooms can all be counted as
suitable ‘sleeping rooms’ under this standard.
The Census definition of overcrowding is not
coterminous with the bedroom standard as
it provides for two extra rooms plus sleeping
rooms; the bedroom standard would
consider these two extra rooms within the
standard itself as suitable for sleeping rooms.
Furthermore the other statutory standard
under Part X of the Housing Act 1985, a ‘fixed
space standard’ which details the minimum
room sizes for certain numbers of occupants,
is not directly comparable in any way to the
Census data. However, this standard, which
dates from 1935, and is by no means a
modern standard is due to be replaced in the
near future as set out under the Government’s
recent Tackling overcrowding in England: An action plan 2007 document.
Nevertheless the data is useful in providing an
estimation of overcrowding, albeit artificially
inflated from the actionable bedroom
standard, so there needs to be an extra
degree of caution in interpreting and applying
these statistics. For this reason the average
likelihoods have been calculated using the
minus two occupancy rating as being more
closely linked to the actual bedroom standard,
considering the two extra overcrowded
rooms taken into account by this method.
This data can be useful in identifying what
parts of the borough may need to be
prioritised to tackle overcrowding although,
as stated above, the problem is more acute
in council stock than the private rented and
housing association sectors. Nevertheless,
levels are still above national average and
justify intervention.
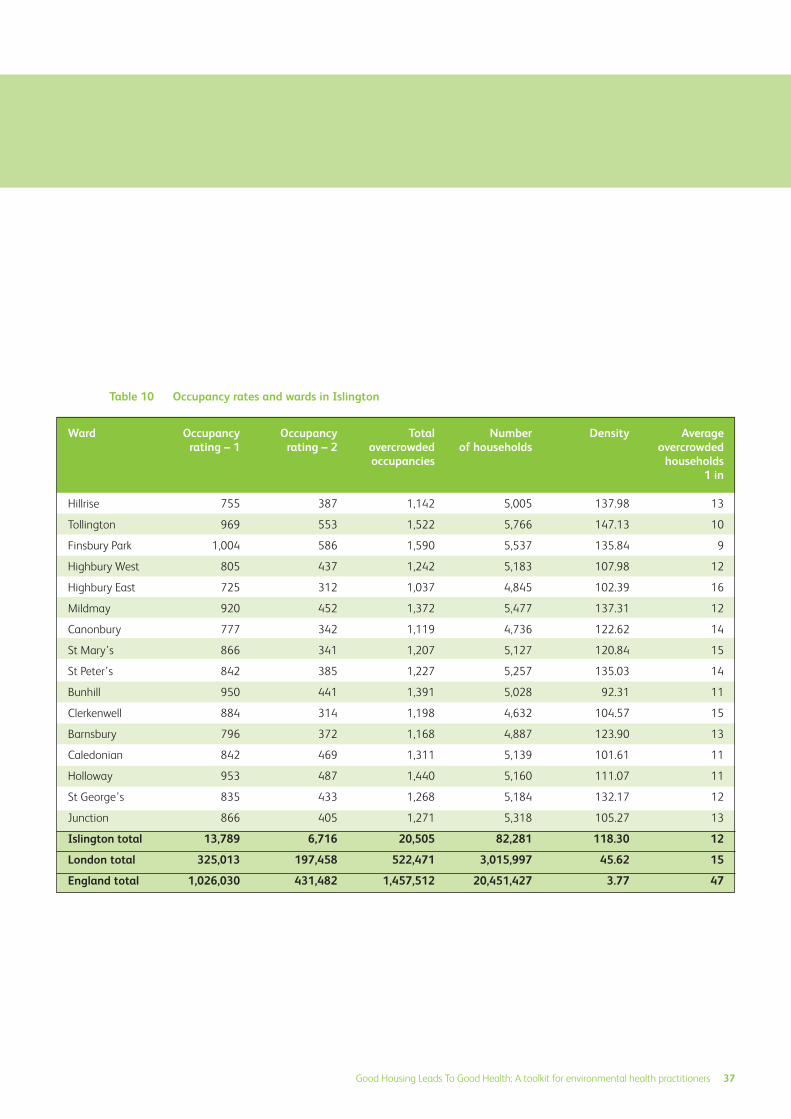
Table 10
Good Housing Leads To Good Health: A toolkit for environmental health practitioners 37
Occupancy rates and wards in Islington
Ward
Hillrise
Tollington
Finsbury Park
Highbury West
Highbury East
Mildmay
Canonbury
St Mary’s
St Peter’s
Bunhill
Clerkenwell
Barnsbury
Caledonian
Holloway
St George’s
Junction
Islington total
London total
England total
Occupancyrating – 1
755
969
1,004
805
725
920
777
866
842
950
884
796
842
953
835
866
13,789
325,013
1,026,030
Occupancyrating – 2
387
553
586
437
312
452
342
341
385
441
314
372
469
487
433
405
6,716
197,458
431,482
Number of households
5,005
5,766
5,537
5,183
4,845
5,477
4,736
5,127
5,257
5,028
4,632
4,887
5,139
5,160
5,184
5,318
82,281
3,015,997
20,451,427
Density
137.98
147.13
135.84
107.98
102.39
137.31
122.62
120.84
135.03
92.31
104.57
123.90
101.61
111.07
132.17
105.27
118.30
45.62
3.77
Averageovercrowded
households1 in
13
10
9
12
16
12
14
15
14
11
15
13
11
11
12
13
12
15
47
Totalovercrowdedoccupancies
1,142
1,522
1,590
1,242
1,037
1,372
1,119
1,207
1,227
1,391
1,198
1,168
1,311
1,440
1,268
1,271
20,505
522,471
1,457,512

38 Good Housing Leads To Good Health: A toolkit for environmental health practitioners
10.0 Appendices
Appendix 1: Evidence linking housing and health10.1
Although now dated one of the simplest
studies showing the cost of accidents in the
home was carried out in Northern Ireland
by the Royal Society for the Prevention of
Accidents (ROSPA) in 199436.
The table is reproduced below. More recent
studies aim to show the costs of illness and
the savings through home improvements.
Estimated cost per home accident
Improving security and reducingdepressionA direct cost benefit link between improving
security in a group of dwellings and cost
savings to the NHS in terms of reducing the
number of patients with clinical depression
is shown in a Health Impact Assessment
carried out in Sheffield37.
The paper uses figures from the Office of
National Statistics (ONS) to estimate the
number of likely cases of depression as an
emotional consequence of burglary. This is
compared with the NHS treatment costs for
depression in England. The estimate is that
the Decent Homes program in Sheffield will
save the NHS £300,000 annually by
providing enhanced security.
Reducing overcrowding and improvingconditionsThe qualitative benefits and the cost of
poor housing was demonstrated in a study
in East London where measurements were
taken before and after regeneration38.
Quoting from previously published work
Peter Ambrose gives the following figures
showing health gain in central Stepney
between 1996 and 2001 following a
renewal scheme:
Health gain in Stepney
As part of the Stepney study an attempt
was made to compare the costs of health
and policing. The study dates from 1996
but is still relevant.
Comparison of costs
Shelter has reported that 955,000 children
now live in overcrowded homes39. This is
50,000 more than three years ago. With an
increasing migrant population and rise in
house prices this increase is likely to
continue.
Conditions within overcrowded, temporary
accommodation can be more extreme than
those in social accommodation where there
is an expectation of some hope. Private
sector accommodation is increasingly used
to house families.
Table 12
Table 13
Table 11
Severity
Fatal
Serious
Slight (hospital treated)
Slight (GP treated)
Average (non fatal)
Average
Numbers of persons per habitable room
Progress as expected at school (%)
Everyone is warm enough (%)
Illness days per person/day (%)
Illness required visit to doctor (%)
Illness required visit to hospital (%)
Illness episode required a doctor (%)
Total (£)
784,090
23,830
3,920
120
8,300
9,460
1996 2000
1.43 1.13
39.3 54
30.8 68
0.37 0.05
74.6 59.4
20.4 5.2
74.6 9.4
Health costs (GP and
some hospital costs)
Some police costs
Poor housing in Stepney
£515
£380
Improved housingin Paddington
£72
£85
36 TRL Report 225,
Clackmannanshire Council
Project, June 1994
37 Decent Homes Better
Health, Sheffield Decent
Homes, Health Impact
Assessment, Jan Gilbertson,
Goeff Green and David
Ormandy, Sheffield Hallam
University 2006
38 The Health and Other
Costs Generated by Poor
Housing, Peter Ambrose
2005
39 Nowwhere to grow,
Anita Pati, Inside Housing,
September 2007

Good Housing Leads To Good Health: A toolkit for environmental health practitioners 39
Some of the problems associated with
overcrowding are social and according to
campaign group Shelter children living in
poor housing are nearly twice as likely as
other children to leave school without any
GCSEs. This is due in part to a lack of quiet
place for homework and parents may lack a
quiet space to communicate leading to
stress and depression. The physical illnesses
of asthma, bronchitis and other respiratory
problems are still present.
FallsFalls in the home are a major cause of
distress and can lead to long term disability.
Peter Ambrose’s East London study
estimates that hip fractures caused by falls
cost the NHS £726 million per year. The
likelihood of a fall within a dwelling can be
estimated and reduced by providing a safer
home environment.
A study in the Netherlands in 200640
estimates the cost of different forms of
injuries by counting all the likely inputs of an
injury i.e. hospital stay, ambulance journeys,
GP visits and physiotherapy sessions in units.
The total intervention costs can then be
estimated. Hip fractures were found to be
the highest costing injury and the 14th
most likely accident to happen.
Cold Treatment of cold-related illnesses and
conditions is a substantial financial drain on
the NHS approximately £1billion per year.
Cold conditions heavily impact on circulation
and around half of excess winter deaths are
circulatory in cause. The number of excess
winter deaths in England and Wales is
estimated as 25,000 to 45,000 per year41.
DampThe World Health Organization (WHO) has
been conducting a long term comparison
study of eight European cities, the LargeAnalysis and review of European Housingand Health Status (LARES) project.
The study uses assessments by
professionals and questionnaires to
occupants to show the links between
housing quality and perceived health.
Table 14 Relationship between housing quality and perceived health
40 Incidence and costs of
injuries in The Netherlands,
Willem Jan Meerding,
Saakje Mulder, Ed F. van
Beeck, European Journal ofPublic Health, Vol. 16, No. 3,
271–277 2006. Published
by Oxford University Press
on behalf of the European
Public Health Association
41 Available here:
www.socialexclusionunit.gov.
uk/downloaddoc.asp?id=797
Bad dwellingassessment
Average dwellingassessment
Good dwellingassessment
■■ Good or very
■■ good health
■■ Fair status
■■ health
■■ Bad or very
■■ bad health
20% 40% 60% 80% 100%0%
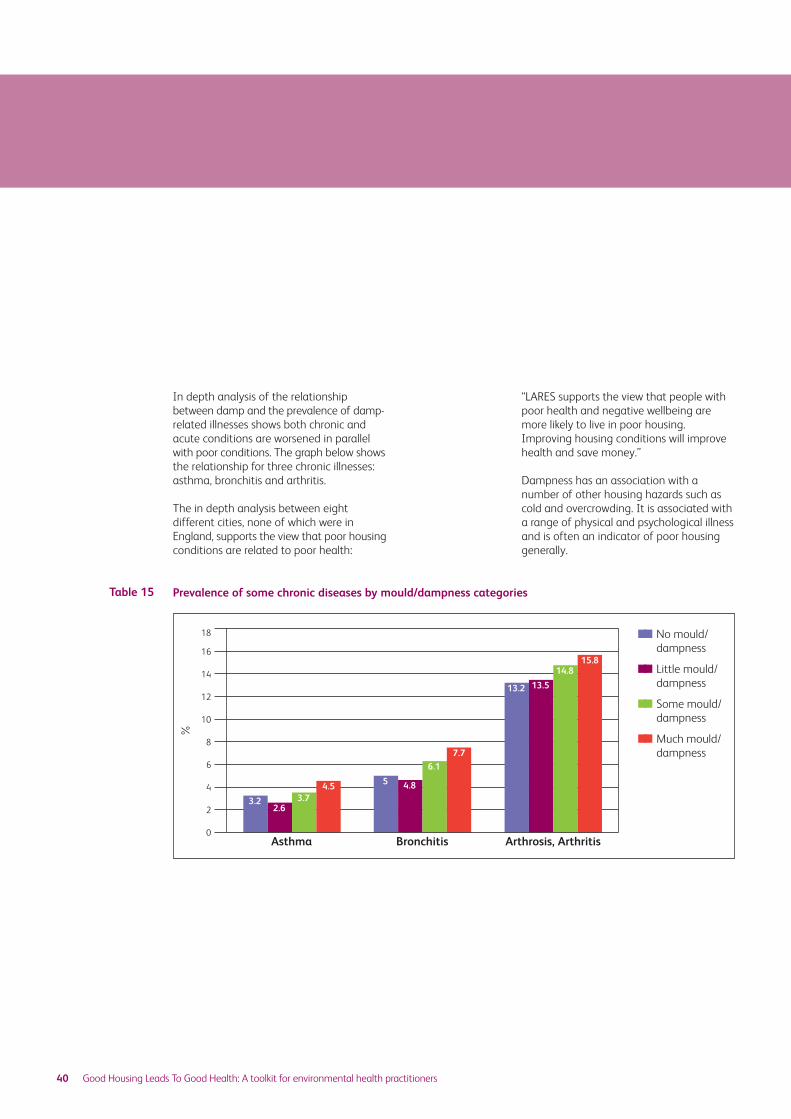
40 Good Housing Leads To Good Health: A toolkit for environmental health practitioners
In depth analysis of the relationship
between damp and the prevalence of damp-
related illnesses shows both chronic and
acute conditions are worsened in parallel
with poor conditions. The graph below shows
the relationship for three chronic illnesses:
asthma, bronchitis and arthritis.
The in depth analysis between eight
different cities, none of which were in
England, supports the view that poor housing
conditions are related to poor health:
“LARES supports the view that people with
poor health and negative wellbeing are
more likely to live in poor housing.
Improving housing conditions will improve
health and save money.”
Dampness has an association with a
number of other housing hazards such as
cold and overcrowding. It is associated with
a range of physical and psychological illness
and is often an indicator of poor housing
generally.
Table 15 Prevalence of some chronic diseases by mould/dampness categories
■■ No mould/
■■ dampness
■■ Little mould/
■■ dampness
■■ Some mould/
■■ dampness
■■ Much mould/
■■ dampness
Asthma Bronchitis Arthrosis, Arthritis
%
16
18
14
12
10
8
6
4
2
0
3.22.6
3.74.5 5 4.8
6.1
7.7
13.2 13.5
14.815.8

Good Housing Leads To Good Health: A toolkit for environmental health practitioners 41
Appendix 2: Showing links with costs10.2
Linking the benefits associated with
interventions to improve homes with cost
savings in the NHS is notoriously difficult.
But if the consequences of a fall down the
stairs could be costed and compared with
the cost of prevention this would provide
the basis for a simple quantitative
methodology of when intervention should
be available.
This is only one method of measuring costs
and the simplest to explain. It is known as
‘cost-offset’. The Cost-offset study by Kelly
et al 200542 also provides a number of
further methods of quantifying costs.
Simplified explanations of other methods
are provided below, from the National
Institute of Clinical Excellence (NICE)
publication: Measuring Impact 200543.
They include:
Cost-minimisation analysisThis method extends the economic analysis
further by considering an alternative use of
the resources.
Cost-effectiveness analysisThe most commonly used approach,
focusing on the single outcome or health
benefit of an intervention and the resulting
costs. But most interventions have multiple
outputs, making cost-effectiveness analysis
difficult to use. The solution to this is to
weight outcomes in terms of money (cost-
benefit) or in terms of utility or future use.
Cost-utility analysisMeasures and values the impact of an
intervention in terms of a health-related
improvement in a person’s quality of life.
This method allows for comparisons across
areas of an intervention, but does not
capture the broader, psychosocial, non-
health related impact of a public health
intervention.
Cost-benefit analysisThe method looks at costs and benefits in
monetary terms. If benefits exceed costs
the intervention is recommended. This
method has difficulties with regard to the
value in monetary terms of the benefits to
a person’s life. This value judgement has to
stand up to political and public scrutiny.
Cost-consequence analysisSimilar to cost-effectiveness analysis, but
can be used to measure interventions with
more than one outcome. For each
alternative outcome the evaluation
calculates all the costs and all the relevant
outcomes. The outcomes are weighed up
and compared with the costs. This has
advantages as it does not synthesise costs
and benefits into one outcome and can
look at multi-dimensional interventions.
However, the lack of a single outcome
measurement means it cannot be used to
rank interventions.
This calculator only aims to look at cost-
offset, the simple method or starting point
for cost information.
42 Economic Appraisal of
Public Health Interventions,
Kelly et al, Health
Development Agency 2005
43 Measuring Impact:
Improving the health and
wellbeing of people in
mid-life and beyond,
National Institute Health
and Clinical Excellence 2005
42 Good Housing Leads To Good Health: A toolkit for environmental health practitioners
Appendix 3: The strategic context10.3
The success of the private sector housing
function is judged by the Audit Commission
by reference to Key Lines of Enquiry (KLOE)44
These are organised into sections:
Of relevance to private sector housing are
the following:
Local Authority Strategic Housing Role
(including community wide housing
services) and (relevant to all local housing
authorities).
• Strategic Approach to Housing
• Homelessness and Housing Needs
• Private Sector Housing
• Allocations and Lettings (as appropriate)
• Supporting People (as overseen by
administering authorities)
• Housing Regeneration and
Neighbourhood Renewal (within the
specialist functions section
The KLOE 9 for private sector housing which
benefit from more accurate information
related to the wider definition of health are
reproduced below:
Private sector stock condition andhousing need data How good is the council’s understanding of
private sector stock condition and housing
needs and does it have an accurate baseline
of the critical information to the sector?
The strategic approach to private sectorhousing How clear and comprehensive is the
council’s approach to private sector
housing, either through a stand alone
Private Sector Housing Strategy or as a
distinct part of the wider housing strategy
and housing policies?
How well is the council’s approach to
private sector housing addressing the key
housing issues in the area?
Has the council utilised the full range of
powers available to it to tackle the issues
within its private sector?
How well has the council implemented and
delivered its objectives in meeting the
needs of private sector housing?
How well is the council working with
partners and other organisations to
increase capacity and reduce costs?
The impact of the strategic approach – how effectively is the council tacklingpoor housing conditions in the privatesector? Is the council being effective in addressing
poor conditions in the private sector
housing market?
Is the service effectively supporting disabled
people to live independently in their homes?
How effective is the monitoring of the
private sector housing strategy and does
performance inform future activity?
Value for money How well does the organisation maximise
the impact from its resources for private
sector housing?
How effectively has the organisation
established partnerships geared to achieve
value for money and improving its
performance to service users?
Has the organisation used procurement to
achieve value for money in delivering
services that benefits service users and
others?
A number of the KLOEs which emphasise
partnership working are highlighted. A
further list is produced for regeneration and
neighbourhood renewal, many of which are
relevant to private sector housing generally.
1.
2.
44 Housing Directorate –
Key Lines of Enquiry,
Audit Commission 2007
Using this toolkit it should be possible to
demonstrate the importance of
enforcement in private sector housing as a
role in health promotion.
The Audit Commission similarly sets KLOEs
for Primary Care Trusts (PCTs). When
drawing up their strategy they are required
to consider the objectives and priorities of
partner organisations. Relevant questions
which the Audit Commission require are
reproduced below45:
“The PCT has put in place arrangements for
setting, reviewing and implementing its
strategic and operational objectives.”
“5.1.2 Objectives give some attention to the
priorities of other partners and the wider
community. The PCT actively works with
local authority partners to reflect shared
priorities in its own objectives.” These arenow included in Local Area Agreement’sdiscussed in the main document.
There are also KLOEs developed under the
cross cutting agenda for community safety
which are of relevance to private sector
housing.
Best Value Indicators and public sectoragreements targetsLocal authorities are required to report to
the CLG annually on a number of statistics
designed to show they are active in tackling
the Government set priorities.
The number of empty homes that have
been filled or demolished through local
authority influence (BVI69) can be directly
related to private sector housing.
BVI26 relates to the fear of crime and
specifically to the number of domestic
burglaries. This indicator is reported on by
the police but relates directly to the dwelling
associated hazard of entry by intruders.
The Decent Homes agenda is linked to
promoting better communities, reducing
crime, improving employment and
educational achievement. When it was
introduced the ODPM stated:
“A Decent Home is a home that is warm,
weatherproof and has reasonably modern
facilities.
“Decent Homes are important for the
health and wellbeing of those living in
them. Poor housing helps an area to get a
bad reputation. That makes it an unpopular
place to live, which in turn may lead to the
breakdown of communities.
“A Decent Home is a key element of any
thriving, sustainable community.”
3.
45 NHS Audit 2006/07 –
Key Lines of Enquiry for
Auditors’ Local Evaluation
Assessments – Primary Care
Trusts, Audit Commission
Good Housing Leads To Good Health: A toolkit for environmental health practitioners 43

Chartered Institute of Environmental Health
Chadwick Court 15 Hatfields London SE1 8DJ
Telephone 020 7928 6006 Fax 020 7827 5831
Email [email protected] Web www.cieh.org
Registered Charity No. 290350
This report is printed on elemental chlorine-free
paper, produced from sustainable forests
Design: Sign Graphic Design
ISBN 10 1-904306-83-7ISBN 13 978-1-904306-83-2
Related Documents