NBER WORKING PAPER SERIES EUROPEAN PHARMACEUTICAL PRICE REGULATION, FIRM PROFITABILITY, AND R&D SPENDING Joseph H. Golec John A. Vernon Working Paper 12676 http://www.nber.org/papers/w12676 NATIONAL BUREAU OF ECONOMIC RESEARCH 1050 Massachusetts Avenue Cambridge, MA 02138 November 2006 The views expressed herein are those of the author(s) and do not necessarily reflect the views of the National Bureau of Economic Research. © 2006 by Joseph H. Golec and John A. Vernon. All rights reserved. Short sections of text, not to exceed two paragraphs, may be quoted without explicit permission provided that full credit, including © notice, is given to the source.

Golec_06_European Pharmaceutical Price Regulation.pdf
Nov 08, 2014
Welcome message from author
This document is posted to help you gain knowledge. Please leave a comment to let me know what you think about it! Share it to your friends and learn new things together.
Transcript
NBER WORKING PAPER SERIES
EUROPEAN PHARMACEUTICAL PRICE REGULATION, FIRM PROFITABILITY,AND R&D SPENDING
Joseph H. GolecJohn A. Vernon
Working Paper 12676http://www.nber.org/papers/w12676
NATIONAL BUREAU OF ECONOMIC RESEARCH1050 Massachusetts Avenue
Cambridge, MA 02138November 2006
The views expressed herein are those of the author(s) and do not necessarily reflect the views of theNational Bureau of Economic Research.
© 2006 by Joseph H. Golec and John A. Vernon. All rights reserved. Short sections of text, not toexceed two paragraphs, may be quoted without explicit permission provided that full credit, including© notice, is given to the source.
European Pharmaceutical Price Regulation, Firm Profitability, and R&D SpendingJoseph H. Golec and John A. VernonNBER Working Paper No. 12676November 2006JEL No. I11,I18,K2,O34
ABSTRACT
EU countries closely regulate pharmaceutical prices whereas the U.S. does not. This paper shows howprice constraints affect the profitability, stock returns, and R&D spending of EU and U.S. firms. Comparedto EU firms, U.S. firms are more profitable, earn higher stock returns, and spend more on researchand development (R&D). Some differences have increased over time. In 1986, EU pharmaceuticalR&D exceeded U.S. R&D by about 24 percent, but by 2004, EU R&D trailed U.S. R&D by about15 percent. During these 19 years, U.S. R&D spending grew at a real annual compound rate of 8.8percent, while EU R&D spending grew at a real 5.4 percent rate. Results show that EU consumersenjoyed much lower pharmaceutical price inflation, however, at a cost of 46 fewer new medicinesintroduced by EU firms and 1680 fewer EU research jobs.
Joseph H. GolecDepartment of Finance2100 Hillside RoadStorrs, CT [email protected]
John A. VernonUniversity of ConnecticutDepartment of Finance2100 Hillside RoadStorrs, CT 06269and [email protected]
3
1. Introduction
European Union (EU) countries closely regulate pharmaceutical prices in various
ways, while the United States (U.S.) does not. EU consumers clearly benefit because they
often pay lower prices than U.S. consumers for the same medicines. But few government
agencies or academic studies examine the less apparent costs of price regulation. One
exception is Campa and Hernando (2004), who show that EU mergers of regulated firms
produce significantly less value than mergers of unregulated firms. The EU also regulates
the conditions for acceptable mergers and acquisitions. Aktas, de Bondt, Levasseur, and
Schmitt (2001) and Aktas, de Bondt, and Roll (2004) show that these conditions
negatively affect the firms involved.
Our paper studies how EU pharmaceutical price regulation affects EU firms
compared to U.S. firms, and the indirect costs to the EU. Although many pharmaceuticals
are sold worldwide, EU (U.S.) firms typically sell proportionately more in the EU (U.S.)
(see Vernon, 2005). The direct consequence of EU price regulation is that firms selling
more in the EU could be less profitable. An indirect consequence could be reduced
research and development (R&D) spending, fewer research jobs, and fewer new
medicines introduced by EU firms.
The first part of this paper illustrates the average effects of EU price regulation on
EU firms compared to U.S. firms. We show that EU pharmaceutical firms are less
profitable, spend less on R&D, and earn smaller stock returns than U.S. firms. The EU
firms’ relatively poor profitability and stock returns are consistent with Doukas and
Switzer (1992), who show that profitability and stock prices are positively associated
with R&D spending. Reduced EU R&D spending and lower stock returns are costs borne
4
by EU citizens because they imply fewer well-paid research jobs and lower wealth for
EU stockholders.
The strength of this analysis is that it illustrates the costs and potential policy
implications of EU price regulation. Although policymakers may care little about
pharmaceutical stockholders’ low returns, they may be interested in the negative effects
that lower EU R&D spending has on high-tech employment and innovation. One
weakness of this analysis is that it compares average or aggregate figures for EU and U.S.
firms. This obscures some of the effects of EU price regulations. For example, some U.S.
(EU) firms could actually be more (less) affected by EU price regulations because they
happen to sell more (less) in the EU than in the U.S. Indeed, all firms selling
pharmaceuticals in the EU are somewhat affected by EU price regulation.
The second part of the paper examines the general effects that EU regulation has
on pharmaceutical R&D spending by U.S. or EU firms. This issue could be studied easily
if most firms reported sales and R&D spending by geographic area. Unfortunately,
relatively few firms publicly report sales by geographic area, and almost none report
R&D expenses by geographic area. Our alternative approach relates each firm’s
standardized sales to pharmaceutical price indexes. These indexes capture the level of
price regulation in each geographic area over time. The relations between a firm’s sales
and these indexes capture the relative sensitivity of its sales to changes in the indexes.
Firm sensitivities are then cross-sectionally related to their average R&D spending. Firms
with greater sales sensitivity to the EU (U.S.) price index are expected to spend less
(more) on R&D.
5
The notion that firms subject to greater price controls would spend less on R&D
seems straightforward; however, few have studied this relation. One recent study by
Giaccotto, Santere, and Vernon (2005) shows that real U.S. pharmaceutical prices and
industry-level U.S. pharmaceutical R&D growth are positively related. Our results
support theirs using firm-level data from both U.S. and EU firms.
The last part of the paper estimates the costs to the EU of price controls over the
last 19 years. We also project potential future costs for the EU, assuming that it retains its
current regulatory environment, and for the U.S., assuming that it adopts EU-type
regulation over time. Costs are estimated in terms of slower growth in R&D spending,
fewer research jobs, and fewer new medicines. We estimate these costs with a variety of
growth models. We acknowledge that price controls provide benefits to current
consumers, but focus on costs because they have received less attention from researchers
and policymakers.
We project costs for the U.S. because EU-type price regulations are gaining
popular support. For example, many in the U.S. have called for large-scale reimportation
of pharmaceuticals from price-regulated countries like Canada (e.g., Dorgan-Snow U.S.
Senate Bill, S.334). Reimportation is an indirect method of price control which is similar
to European parallel trade.1 Other more direct forms of EU-type price regulation have
been proposed in the U.S., including several provisions in President Clinton’s Health
Security Act. In August 2006, California legislators passed the Prescription Drug
1 Parallel trade is a more general term than reimportation because it refers to any product trade that occurs after the original manufacturer sells the product. For example, product manufactured in Germany, sold to an agent in Spain, and then resold by the agent in Spain to an agent in England is parallel trade. Reimportation fits the more common situation in the U.S. where a U.S. manufacturer sells to a Canadian agent, who then resells to another agent in the U.S.
6
Initiative, requiring manufacturers to discount pharmaceuticals by between 40 and 60
percent for low-income state residents.
Our results show that EU policy has kept pharmaceutical price inflation equal to
average consumer price inflation over the last 19 years, with real costs of about $5 billion
in foregone R&D spending, 1680 fewer research jobs and 46 foregone new medicines.
Prospective long-horizon costs for the EU are estimated at between ten and 20 times
these costs, with potential U.S. costs about twice the EU’s long-horizon costs.
This paper is organized as follows. Section 2 illustrates the difference between
U.S. and EU pharmaceutical price inflation. Section 3 compares U.S. and EU firms’
profitability, stock return performance, and R&D spending. Section 4 illustrates the
differences in U.S. and EU R&D spending growth over the 1986-2004 period using data
on U.S.-only and EU-only R&D spending. Section 5 tests the relation between
pharmaceutical pricing in the EU and U.S. and R&D spending. Section 6 translates the
observed slower growth of R&D spending into foregone R&D spending, fewer research
jobs, and fewer new medicines. Section 7 concludes the paper.
2.European and U.S. Pharmaceutical Prices
EU pharmaceutical price regulations take various forms, and many countries use
more than one. Vernon (2003) describes the different forms adopted by each EU-
member. Most European countries have stated that their pharmaceutical policy goal is to
keep pharmaceutical price increases at or below the general rate of consumer price
inflation. Although this goal is politically attractive, economic efficiency could easily
7
justify real pharmaceutical price increases because pharmaceutical demand rises more
than proportionately with income.
U.S. pharmaceutical prices are relatively unregulated, but have not been immune
to political pressures. In 1993, the Clinton Administration proposed a Health Security Act
that included regulations with the stated purpose of keeping pharmaceutical price
increases at or below average consumer price inflation. In response, 21 large
pharmaceutical firms pledged to keep price increases below average consumer price
inflation, perhaps as a way to preempt direct regulation.2
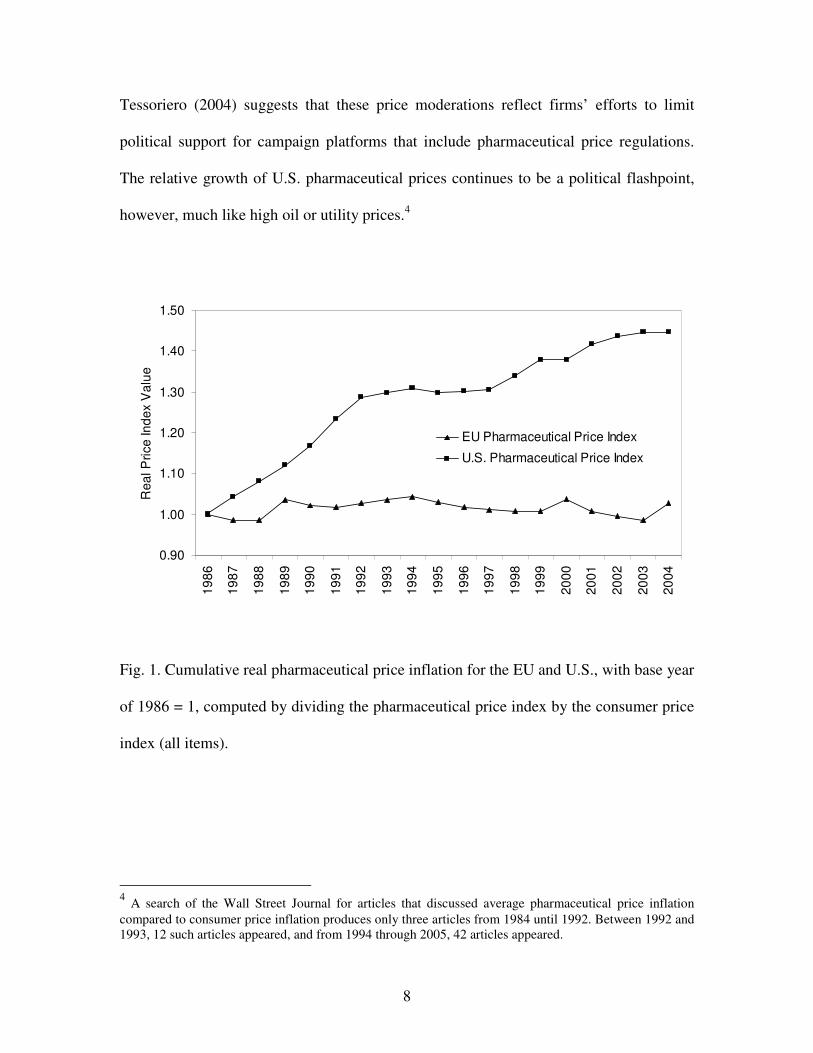
One way to assess the degree to which European regulation or U.S. political
pressure have affected pharmaceutical prices is to compare real pharmaceutical price
indexes for the EU and U.S. Figure 1 illustrates real growth of pharmaceutical prices for
the U.S. and Europe from 1986 to 2004. For each year, the pharmaceutical price index is
divided by the consumer price index for all items, and these real index numbers are
compounded year to year, with 1986 as the base year.3
Clearly, European regulations have effectively kept pharmaceutical prices from
rising faster than general consumer prices. Over the 19 year period, they never rose more
than a few percentage points faster than general consumer prices. In contrast, U.S. real
pharmaceutical prices increased in almost every year. Real price increases moderated
starting in 1993, around Clinton’s proposed price regulations (see Ellison and Mullin,
2001). Prices also moderated in 2000 and 2004, just before the presidential elections. 2 The firms are Abbott Labs, Bristol-Meyers Squibb, Eli Lilly, Glaxo, Johnson & Johnson, Merck, Pfizer, SmithKline Beecham, Warner-Lamber Wyeth-Ayerst (American Home Products) Ciba-Geigy, Dupont-Merck, G.D. Searle, Genentech, Hoechst-Roussel, Hoffmann-La Roche, Knoll, Marion Merrell Dow, Syntex, Upjon, and Zeneca. 3 U.S. pharmaceutical and CPI (all items price 1982-84 =100) indexes are from the Bureau of Labor Statistics. EU CPI is from Eurostat Harmonized Indeces of Consumer Prices (all items). The EU pharmaceutical price index is from Eurostat starting in 2001 and compiled from OECD Health Data 2003 for the years before 2001.
8
Tessoriero (2004) suggests that these price moderations reflect firms’ efforts to limit
political support for campaign platforms that include pharmaceutical price regulations.
The relative growth of U.S. pharmaceutical prices continues to be a political flashpoint,
however, much like high oil or utility prices.4
0.90
1.00
1.10
1.20
1.30
1.40
1.50
1986
1987
1988
1989
1990
1991
1992
1993
1994
1995
1996
1997
1998
1999
2000
2001
2002
2003
2004
Rea
l Pric
e In
dex
Val
ue .
EU Pharmaceutical Price Index
U.S. Pharmaceutical Price Index
Fig. 1. Cumulative real pharmaceutical price inflation for the EU and U.S., with base year
of 1986 = 1, computed by dividing the pharmaceutical price index by the consumer price
index (all items).
4 A search of the Wall Street Journal for articles that discussed average pharmaceutical price inflation compared to consumer price inflation produces only three articles from 1984 until 1992. Between 1992 and 1993, 12 such articles appeared, and from 1994 through 2005, 42 articles appeared.
9
3. EU versus U.S. Pharmaceutical Firms’ Profitability, Stock Returns, and R&D
Given the EU’s restrictive price regulations, one would expect EU firms to be
more negatively affected than U.S. firms because proportionately more of their revenue is
likely to come from the EU. Unfortunately, few firms report comprehensive data on the
geographic distribution of firm sales. Compustat Segments database includes sales by
geographic area for firms that report it in their financial statements after 1997. Between
1998 and 2004, 43 (13) U.S. (EU) firms report separate U.S. and EU sales. These data
cover only about 40 percent of the firms in our sample. Nevertheless, they show that on
average U.S. (EU) firms generated 76 (53) percent of combined U.S. plus EU sales from
the U.S. This proportion is stable across years for the U.S. firms, with 76 percent in both
1998 and 2004, and only slight variations in other years. But the proportion for EU firms
increases consistently from 43 percent in 1998, to 57 percent in 2004. This illustrates how
EU firms’ sales have recently shifted toward the U.S., perhaps because the U.S. offered
better pricing than the EU during the period.
Table 1 shows how EU firms’ profitability and R&D spending compares with that
of U.S. firms. To be included in this analysis, a firm had to have at least five years of data
in the Compustat Global Industrial/Commercial database between 1993 and 2004 (1993
is the first year available on the database). In addition, the firm must have sales equal to
at least ten percent of its assets. Because this study focuses on the effects of price
regulation on firm sales and R&D spending, we require that a firm has a minimal amount
of product sales.5 This condition is also important because each firm’s sales sensitivity to
5 These filters tend to eliminate small and young firms with few sales. Because the following results are size-weighted, including these firms has little effect on the results.

10
EU and U.S. price indexes must be estimated. All figures are translated into dollar
amounts using Compustat’s Currency database.
Profitability is measured by operating income standardized by total firm assets
and the intensity of firm R&D is measured by R&D spending divided by total firm
assets.6 For each year, each firm’s profitability and R&D intensity is computed, and a
weighted average is calculated for U.S. and EU firms, respectively. The weight placed on
each U.S. (EU) firm’s profitability or R&D intensity equals the ratio of its total assets to
the total assets of all U.S. (EU) firms with data in the particular year.
Table 1
Comparison of EU and U.S. Firms’ Profitability and R&D Spending from 1993 to 2004
Number of Firms Oper. Inc./ Total Assets R&D / Total Assets Year
U.S. EU U.S. EU U.S. EU
1993 77 15 0.193 0.113 0.100 0.084 1994 93 19 0.165 0.108 0.083 0.080 1995 110 20 0.167 0.122 0.090 0.090 1996 120 24 0.173 0.130 0.093 0.083 1997 133 28 0.179 0.120 0.100 0.076 1998 143 30 0.179 0.136 0.104 0.089 1999 132 35 0.190 0.100 0.099 0.079 2000 112 38 0.193 0.107 0.098 0.091 2001 113 38 0.175 0.112 0.107 0.086 2002 112 37 0.166 0.122 0.100 0.099 2003 104 32 0.134 0.148 0.095 0.103 2004 96 30 0.135 0.144 0.085 0.107
Table 1 shows that U.S. firms are more profitable than EU firms in each year
except 2003 and 2004. For the 1993-2004 period, U.S. firms averaged 17.1 percent
6 We follow Eberhart, Maxwell, and Siddique (2004) who use assets to standardize R&D. Using sales to standardize does not materially change the results.
11
profitability compared to 12.2 percent for EU firms. The 4.9 percentage point difference
is highly significant using a two-tailed t-test (t-stat = 6.85). U.S. firms have greater R&D
intensity in all years except 1995, 2003 and 2004. For the 1993-2004 period, U.S. firms
averaged 9.6 percent R&D intensity compared to 8.9 percent for EU firms. The 0.7
percent difference is significantly different from zero using a two-tailed t-test (t-stat =
2.07).
These results show that U.S. firms surpass EU firms in average profitability and
R&D intensity, although this changed in 2003-2004. U.S. firms’ profitability has dropped
while that of EU firms has increased, perhaps because U.S. firms suppressed price
increases leading up to the 2004 elections, or because they faced increasing price
pressures from generic medicines and increased reimportation. This is consistent with
Figure 1 that shows that real pharmaceutical prices were flat in the U.S. during 2003-
2004, but increased in the EU.
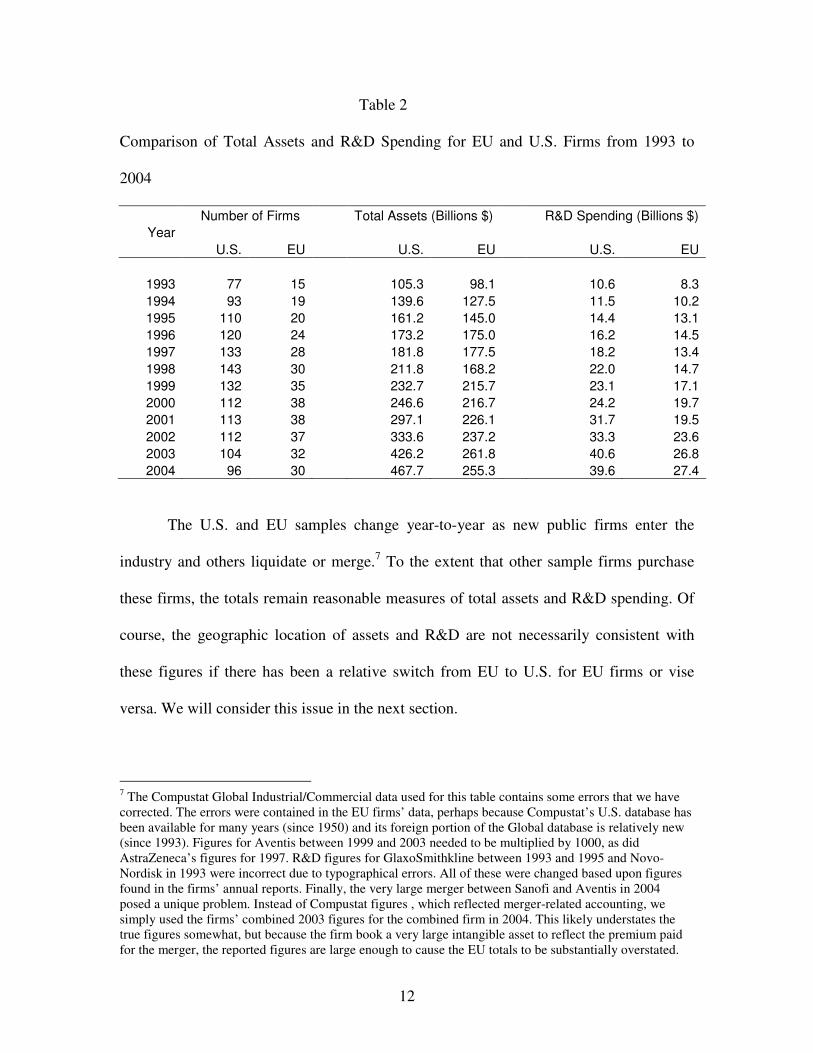
These measures are standardized by size (total assets). How do U.S. and EU firms
compare in terms of aggregate figures? Table 2 shows that U.S. firms have grown assets
and R&D spending faster than EU firms. Between 1993 and 2004, EU firms’ assets more
than doubled but U.S. firms’ more than quadrupled. U.S. R&D spending has grown 3.7
times over, while EU R&D has increased about 3.3 times.
12
Table 2
Comparison of Total Assets and R&D Spending for EU and U.S. Firms from 1993 to
2004
Number of Firms Total Assets (Billions $) R&D Spending (Billions $) Year
U.S. EU U.S. EU U.S. EU
1993 77 15 105.3 98.1 10.6 8.3 1994 93 19 139.6 127.5 11.5 10.2 1995 110 20 161.2 145.0 14.4 13.1 1996 120 24 173.2 175.0 16.2 14.5 1997 133 28 181.8 177.5 18.2 13.4 1998 143 30 211.8 168.2 22.0 14.7 1999 132 35 232.7 215.7 23.1 17.1 2000 112 38 246.6 216.7 24.2 19.7 2001 113 38 297.1 226.1 31.7 19.5 2002 112 37 333.6 237.2 33.3 23.6 2003 104 32 426.2 261.8 40.6 26.8 2004 96 30 467.7 255.3 39.6 27.4
The U.S. and EU samples change year-to-year as new public firms enter the
industry and others liquidate or merge.7 To the extent that other sample firms purchase
these firms, the totals remain reasonable measures of total assets and R&D spending. Of
course, the geographic location of assets and R&D are not necessarily consistent with
these figures if there has been a relative switch from EU to U.S. for EU firms or vise
versa. We will consider this issue in the next section.
7 The Compustat Global Industrial/Commercial data used for this table contains some errors that we have corrected. The errors were contained in the EU firms’ data, perhaps because Compustat’s U.S. database has been available for many years (since 1950) and its foreign portion of the Global database is relatively new (since 1993). Figures for Aventis between 1999 and 2003 needed to be multiplied by 1000, as did AstraZeneca’s figures for 1997. R&D figures for GlaxoSmithkline between 1993 and 1995 and Novo-Nordisk in 1993 were incorrect due to typographical errors. All of these were changed based upon figures found in the firms’ annual reports. Finally, the very large merger between Sanofi and Aventis in 2004 posed a unique problem. Instead of Compustat figures , which reflected merger-related accounting, we simply used the firms’ combined 2003 figures for the combined firm in 2004. This likely understates the true figures somewhat, but because the firm book a very large intangible asset to reflect the premium paid for the merger, the reported figures are large enough to cause the EU totals to be substantially overstated.
13
Another way to consider the effects of EU price regulation is to examine stock
return performance for EU firms compared to U.S. firms. Doukas and Switzer (1992)
show that stock prices respond favorably to R&D spending. If EU firms are not
comparatively disadvantaged by price regulation, then EU and U.S. pharmaceutical
stocks should perform comparably over time. Performance is measured by cumulative
total and risk-adjusted returns between 1993 and 2004 for market-value-weighed
portfolios of EU and U.S. stocks (for the same samples used in Tables 1 and 2). For each
full year of data available for a firm, its annual return is computed using prices and
dividends taken from Compustat’s Global Issues database. All prices and dividends are
translated into dollars using Compustat’s Global Currency database. Then for each year,
each EU firm’s return is weighted by its equity market value divided by the total equity
market value of all EU firms with returns in that year. These weighted returns are
summed for each year, and then the weighted-average returns are cumulated over the
1993 to 2004 period. Cumulative total returns for the portfolio of U.S. firms are
computed in the same way.
Because the risk of EU and U.S. pharmaceutical stocks could differ, differences in
total returns could be due to risk differences. Therefore, we consider risk-adjusted returns
as well. The following single factor market model is used to estimate the annual risk-
adjusted returns for each firm.
Rit = �i + �iRmt + �it , (1)
where Rit is firm i’s stock return in year t, Rmt is the market return in year t represented
by the value-weighted Morgan Stanley Capital International World Index (dollar return),
14
�i and �i are ordinary least squares coefficients for firm i, and �it is the error term for firm
i in year t.
Model 1 is estimated for each firm using its available annual returns. Then its
risk-adjusted return (RARi,t) in year t is computed using estimates of �i and �i,t from (1)
as;
tiitiRAR ,, ˆˆ εα += . (2)
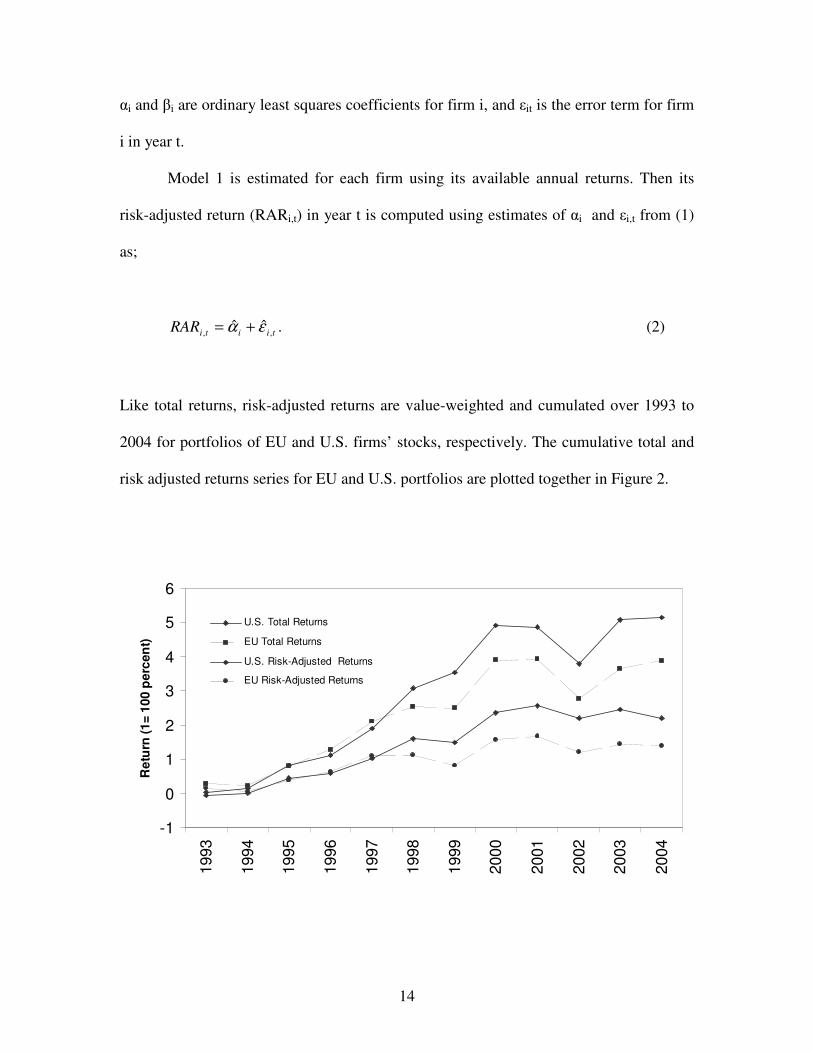
Like total returns, risk-adjusted returns are value-weighted and cumulated over 1993 to
2004 for portfolios of EU and U.S. firms’ stocks, respectively. The cumulative total and
risk adjusted returns series for EU and U.S. portfolios are plotted together in Figure 2.
-1
0
1
2
3
4
5
6
1993
1994
1995
1996
1997
1998
1999
2000
2001
2002
2003
2004
Ret
urn
(1=
100
per
cen
t)
U.S. Total Returns
EU Total Returns
U.S. Risk-Adjusted Returns
EU Risk-Adjusted Returns
15
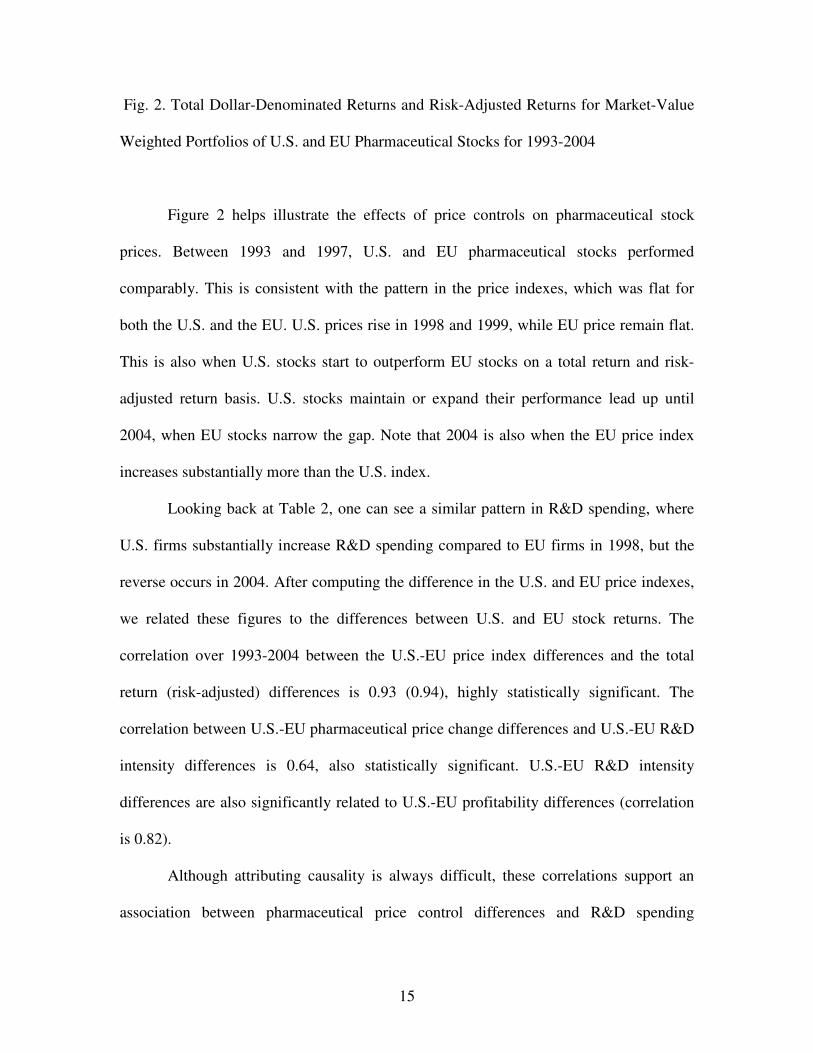
Fig. 2. Total Dollar-Denominated Returns and Risk-Adjusted Returns for Market-Value
Weighted Portfolios of U.S. and EU Pharmaceutical Stocks for 1993-2004
Figure 2 helps illustrate the effects of price controls on pharmaceutical stock
prices. Between 1993 and 1997, U.S. and EU pharmaceutical stocks performed
comparably. This is consistent with the pattern in the price indexes, which was flat for
both the U.S. and the EU. U.S. prices rise in 1998 and 1999, while EU price remain flat.
This is also when U.S. stocks start to outperform EU stocks on a total return and risk-
adjusted return basis. U.S. stocks maintain or expand their performance lead up until
2004, when EU stocks narrow the gap. Note that 2004 is also when the EU price index
increases substantially more than the U.S. index.
Looking back at Table 2, one can see a similar pattern in R&D spending, where
U.S. firms substantially increase R&D spending compared to EU firms in 1998, but the
reverse occurs in 2004. After computing the difference in the U.S. and EU price indexes,
we related these figures to the differences between U.S. and EU stock returns. The
correlation over 1993-2004 between the U.S.-EU price index differences and the total
return (risk-adjusted) differences is 0.93 (0.94), highly statistically significant. The
correlation between U.S.-EU pharmaceutical price change differences and U.S.-EU R&D
intensity differences is 0.64, also statistically significant. U.S.-EU R&D intensity
differences are also significantly related to U.S.-EU profitability differences (correlation
is 0.82).
Although attributing causality is always difficult, these correlations support an
association between pharmaceutical price control differences and R&D spending
16
differences. And these R&D spending differences appear to lead to stock return
differences, consistent with Doukas and Switzer (1992) findings. Indeed, the levels of
returns are high for both U.S. and EU pharmaceutical stock, perhaps because they both
spend heavily on R&D. But when pharmaceutical prices expand faster for one geographic
area, firms in that area tend to spend more on R&D, and their stocks benefit.
4. U.S.-EU R&D Growth Differences
A weakness of the Compustat Global data is that it includes only publicly
reported data. Another problem is that firms report total R&D spending, not spending by
geographic area. Finally, total R&D spending can include R&D spent by non-
pharmaceutical divisions of the firm (although most produce primarily pharmaceuticals).
Two other data sources avoid these potential problems. The European Federation
of Pharmaceutical Industries and Associations (EFPIA) has collected European R&D
spending data from its members since 1986.8 The Pharmaceutical Research and
Manufacturers of America (PhRMA) has collected U.S. R&D spending data from its
members since 1970.
These two associations include most major pharmaceutical firms (both U.S. and
EU firms), hence, their data provides a reasonable picture of pharmaceutical R&D
spending in the U.S. and EU. They provide aggregate data only. For privacy reasons, they
do not release firm-level data. The advantage of the data is that EFPIA’s (PhRMA’s)
members report not only their total R&D, but also their EU-specific (U.S.-specific) R&D.
8 EFPIA member association include those in Austria, Belgium, Denmark, Finland, France, Germany, Greece, Ireland, Italy, Netherlands, Norway, Portugal, Spain, Sweden, Switzerland, and U.K.
17
Furthermore, EFPIA translates R&D figures reported by its members from their domestic
currencies into Euros. We convert the Euro figures to dollars.
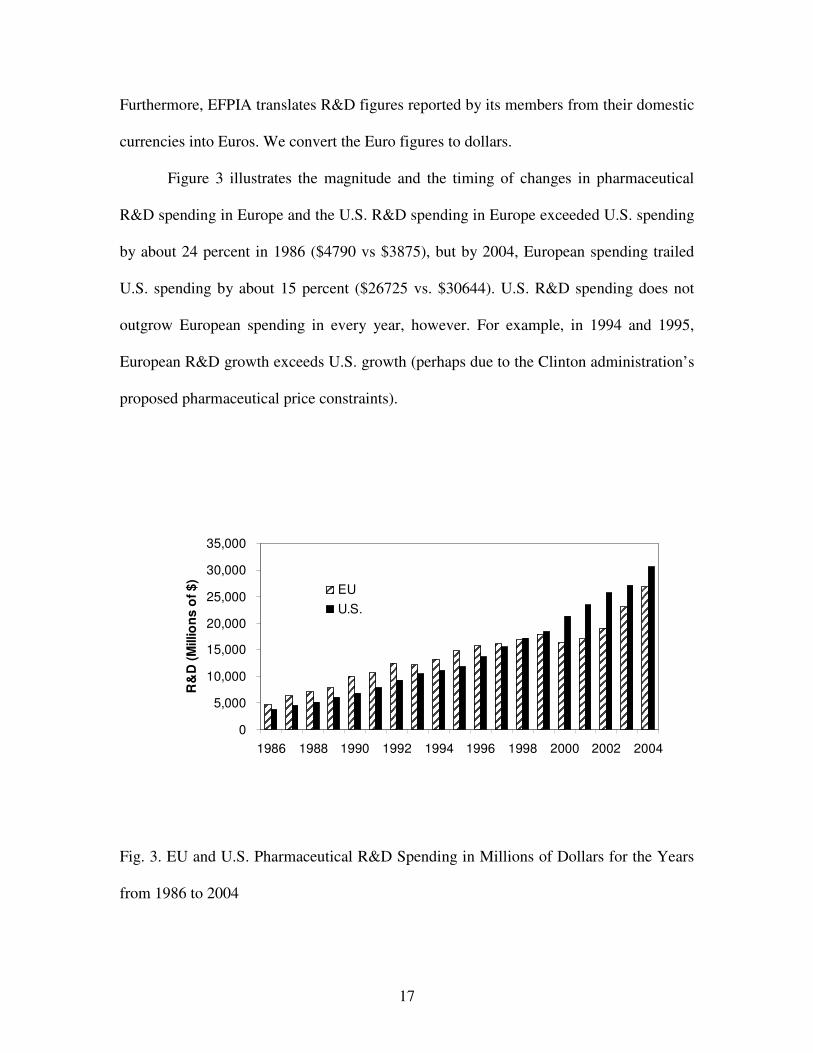
Figure 3 illustrates the magnitude and the timing of changes in pharmaceutical
R&D spending in Europe and the U.S. R&D spending in Europe exceeded U.S. spending
by about 24 percent in 1986 ($4790 vs $3875), but by 2004, European spending trailed
U.S. spending by about 15 percent ($26725 vs. $30644). U.S. R&D spending does not
outgrow European spending in every year, however. For example, in 1994 and 1995,
European R&D growth exceeds U.S. growth (perhaps due to the Clinton administration’s
proposed pharmaceutical price constraints).
0
5,000
10,000
15,000
20,000
25,000
30,000
35,000
1986 1988 1990 1992 1994 1996 1998 2000 2002 2004
R&
D (M
illio
ns o
f $)
EUU.S.
Fig. 3. EU and U.S. Pharmaceutical R&D Spending in Millions of Dollars for the Years
from 1986 to 2004
18
Like Table 2, Figure 3 shows that EU R&D spending stalls in 1997 and 2001.
U.S. R&D spending grows throughout the period including in 2004. Table 2 shows a
decline in 2004 U.S. R&D spending. At least part of the explanation for the differences
between figures in Table 2 and Figure 3 is that there are shifts in R&D spending from the
EU to the U.S., or vice versa.
There is anecdotal evidence that EU firms have recently shifted some R&D
spending from the EU to the U.S. Consider that in 1990, European firms spent 73 percent
of their R&D in Europe and 26 percent in the U.S. By 2002, they spent 58 percent in
Europe and 34 percent in the U.S.9 Major European firms have moved their research or
operational headquarters to the U.S., including Pharmacia in 1995, Aventis in 1999,
GlaxoSmithKline in 2000, and Novartis in 2002. Reasons given for these moves include
growing U.S. sales compared to EU sales, and requirements that they perform clinical
trials in the U.S., particularly FDA phase three trials. U.S.-based trials also establish
relationships with top U.S. physicians who set prescription guidelines for other
physicians.
Firms may be affected in different ways and at different times, but we argue that
EU price regulations have had substantial cumulative effects. One case where public data
is available illustrates the direct connection between regulation and EU R&D spending.
Spain and France set a price for Bayer’s second best-selling drug (Adalat) 40 percent
below its price in England. When Bayer restricted supply to French and Spanish
wholesalers who were reselling their supplies in England, the European Commission
fined Bayer 3 million Euros in 1996, and ordered them to stop restricting supply. World-
wide sales of Adalat, which had been growing strongly, subsequently fell by four (three) 9 EFPIA, “Year in Review 2001-2002.”
19
percent in 1998 (1999), mostly due to French and Spanish wholesalers reselling Adalat at
relatively low prices. As a consequence, Bayer cut its European R&D spending by one
percent in 1998 and by 14 percent in 1999. Conversely, Bayer increased its U.S. R&D
spending by eight percent in 1998 and by 31 percent in 1999.10 Bayer may have expected
the U.S. legal system to better protect their rights to control product distribution.
Some U.S. government data on foreign firms’ pharmaceutical R&D spending in
the U.S. shows that their spending grew from $6.2 billion in 1999 to $7.9 billion in 2003.
Conversely, U.S. firms foreign pharmaceutical R&D grew from only $2.8 billion in 1999
to $3.2 billion in 2002.11 The R&D data are not broken down by country but the Bureau
of Economic Analysis reports U.S. pharmaceutical assets held by foreign firms broken
down by country. European nations accounted for between 80 and 90 percent of these
assets during 1999-2003.
These data show that foreign firms do much more pharmaceutical R&D spending
in the U.S. than U.S. firms do abroad. Furthermore, foreign firms’ U.S. R&D is growing
faster. Therefore, Table 2 shows a smaller difference between U.S. and EU R&D than
Figure 3 because the table does not pick up the fact that EU firms spend a much larger
portion of their R&D in the U.S. than U.S. firms spend in the EU.
One problem with comparing figures adjusted for exchange rates is that exchange
rates can change significantly year-to-year, distorting the relative growth in R&D in
10 Figures taken from Bayer annual financial reports 1997-2001. 11 The data on foreign firms’ U.S. pharmaceutical R&D spending comes from the Bureau of Economic Analysis. See “Selected Data by Industry” under Foreign Direst Investment in the U.S.: Financial and Operating Data for U.S. Affiliates of Foreign Multinational Companies (www.bea.gov/bea/di/di1fdiop.htm). The data on assets can be found at the same place under “Assets by Industry and Country. These data are available starting in 1999. The data on U.S. firms’ foreign pharmaceutical R&D spending comes from tables titled “Company R&D Performed Outside the United States by Industry” at www.nsf.gov/statistics/iris. Data for 2002 is the latest available.
20
particular years. Perhaps a better way to compare the relative progress of U.S. and
European R&D spending is to construct real growth rates for each series in dollars and
Euros, respectively, and ignore exchange rates. Over a long period, relative changes in
exchange rates will appear in relative inflation rates so that adjusting nominal R&D
growth rates for domestic inflation provides smoother, more comparable series.
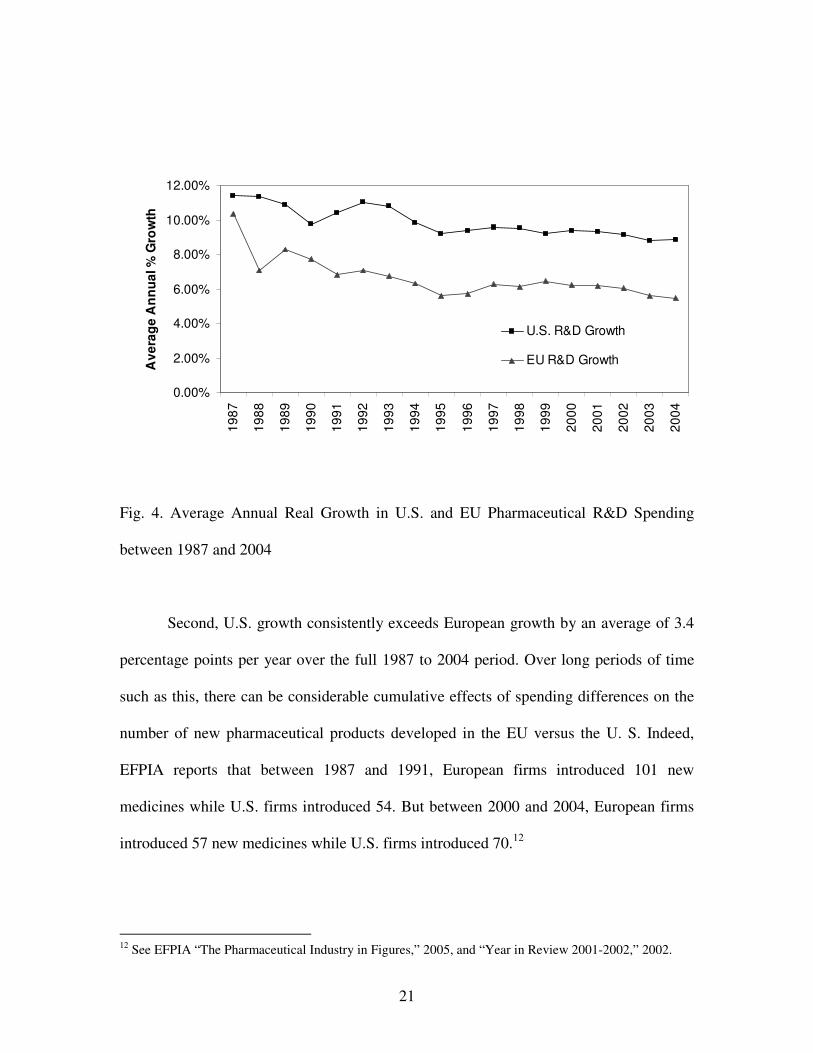
Figure 4 shows the smoothed time paths of R&D growth, making trends and
average differences clearer. It plots the average annual compound real R&D spending
growth rates for the U.S. and Europe. The growth rates are based on the same PhRMA
and EFPIA data, except that EU figures remain in Euros. Real growth is nominal growth
deflated by the CPI percent change for the same year. Each year’s observation is the
average annual real R&D growth for the years up to and including that year. The figure
highlights two significant features of the data. First, both U.S. and EU R&D spending
growth rates are trending down. The average real growth rates for the first five years of
the period compared to the last five years were 9.9% versus 7.6% for the U.S., and 6.6%
versus 2.8% for Europe. This could be due to the effects of increasing political pressures
in the U.S. and regulatory pressures in the EU.
21
0.00%
2.00%
4.00%
6.00%
8.00%
10.00%
12.00%
1987
1988
1989
1990
1991
1992
1993
1994
1995
1996
1997
1998
1999
2000
2001
2002
2003
2004
Ave
rage
Ann
ual %
Gro
wth
U.S. R&D Growth
EU R&D Growth
Fig. 4. Average Annual Real Growth in U.S. and EU Pharmaceutical R&D Spending
between 1987 and 2004
Second, U.S. growth consistently exceeds European growth by an average of 3.4
percentage points per year over the full 1987 to 2004 period. Over long periods of time
such as this, there can be considerable cumulative effects of spending differences on the
number of new pharmaceutical products developed in the EU versus the U. S. Indeed,
EFPIA reports that between 1987 and 1991, European firms introduced 101 new
medicines while U.S. firms introduced 54. But between 2000 and 2004, European firms
introduced 57 new medicines while U.S. firms introduced 70.12
12 See EFPIA “The Pharmaceutical Industry in Figures,” 2005, and “Year in Review 2001-2002,” 2002.
22
5. Linking Real Pharmaceutical Price Inflation to Firms’ R&D Spending
We wish to test the cross-sectional relation between EU price regulations and
R&D spending at the firm-level. Real pharmaceutical prices are used as a proxy for the
effects of price regulations and political pressure in the U.S. and EU over time. Giaccotto,
Santere, and Vernon (2005) find a statistically significant positive relation between U.S.
industry-level R&D spending and real U.S. pharmaceutical prices. We implement our test
using a two-stage process. In the first stage, we estimate the following regression for each
firm in our samples of U.S. and EU firms.
(Sales/Assets)i,t = b0 + bi,1(U.S. Price index)t + bi,2(EU Price Index)t + �i,t , (3)
where (Sales/Assets)i,t is the ratio of sales to total assets for firm i in year t, (U.S. Price
index)t and (EU Price Index)t are the U.S. and EU real pharmaceutical price indexes in
year t, respectively, �i,t is an error term for firm i in year t, and b0, b1, and b2 are ordinary
least squares regression coefficients.
The regression coefficients bi,1 and bi,2 are used to measure the sensitivity of a
firm’s sales to U.S. and EU price indexes, respectively. Firm sales are standardized by
assets to account for firm size and currency differences. All else equal, faster real prices
increases should increase sales faster than assets, assuming that real pharmaceutical price
changes do not affect the real cost of production facilities. We expect firms whose sales
are more sensitive to U.S. (EU) pharmaceutical prices to spend more (less) on R&D. To
test this hypothesis, we use the following regression.

23
(mean R&D/Assets)i = β0 + β1( 1,ib ) + β2( 2,ib ) + �i, (4)
where (mean R&D/Assets)i is the mean of firm i’s ratio of R&D spending to total assets
over the years for which it has Compustat data between 1993 to 2004, 1,ib and 2,ib are
coefficient estimates from (3) that measure firm i’s sales sensitivity to U.S. and EU price
indexes, respectively, β0, β1, and β2 are coefficients, and �i is an error term. The
hypothesis implies that β1> 0 and β2 < 0. That is, the more sensitive a firm’s sales are to
the U.S. (EU) price index, the greater its R&D spending.13
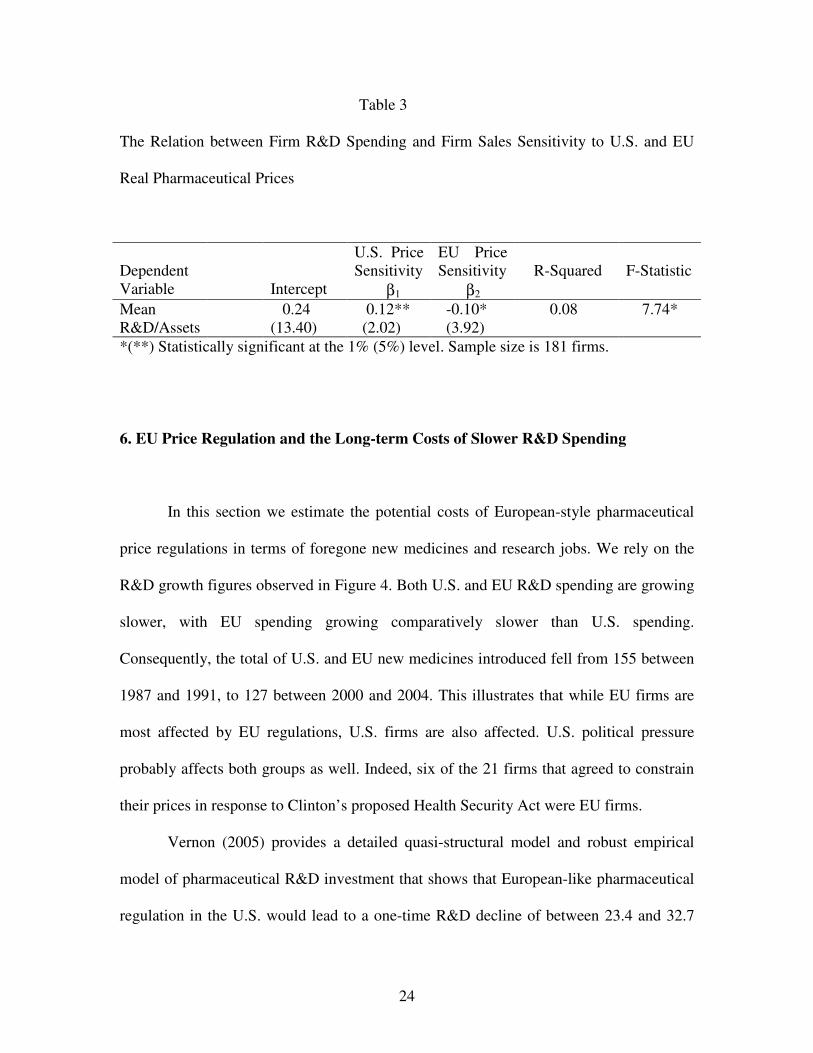
Table 3 reports the regression results. Note that both U.S. and EU firms are
pooled for this analysis. As predicted, 1β > 0 and 2β < 0. These estimates support a
significant positive (negative) relation between a firm’s sales sensitivity to U.S. (EU) real
prices and mean R&D spending intensity.
13 Because the independent variables ( 1,ib and 2,ib ) are measured with error, the estimates of �1 and �2
could be biased. Greene (1990) shows that when one independent variable is measured with error, its estimate is biased toward zero, but when more than one independent variable is measured with error, the bias depends on a number of parameters. To the extent that the estimates are biased toward zero, the tests for statistical significance are conservative.
24
Table 3
The Relation between Firm R&D Spending and Firm Sales Sensitivity to U.S. and EU
Real Pharmaceutical Prices
Dependent Variable
Intercept
U.S. Price Sensitivity β1
EU Price Sensitivity β2
R-Squared
F-Statistic
Mean R&D/Assets
0.24 (13.40)
0.12** (2.02)
-0.10* (3.92)
0.08 7.74*
*(**) Statistically significant at the 1% (5%) level. Sample size is 181 firms.
6. EU Price Regulation and the Long-term Costs of Slower R&D Spending
In this section we estimate the potential costs of European-style pharmaceutical
price regulations in terms of foregone new medicines and research jobs. We rely on the
R&D growth figures observed in Figure 4. Both U.S. and EU R&D spending are growing
slower, with EU spending growing comparatively slower than U.S. spending.
Consequently, the total of U.S. and EU new medicines introduced fell from 155 between
1987 and 1991, to 127 between 2000 and 2004. This illustrates that while EU firms are
most affected by EU regulations, U.S. firms are also affected. U.S. political pressure
probably affects both groups as well. Indeed, six of the 21 firms that agreed to constrain
their prices in response to Clinton’s proposed Health Security Act were EU firms.
Vernon (2005) provides a detailed quasi-structural model and robust empirical
model of pharmaceutical R&D investment that shows that European-like pharmaceutical
regulation in the U.S. would lead to a one-time R&D decline of between 23.4 and 32.7
25
percent. Giaccotto, Santerre, and Vernon (2005) found similar one-time effects using a
very different estimation method. But rather than a one-time decline, R&D spending
would likely grow slower as stricter regulations are adopted over time. Even at low
prices, some relatively-promising new R&D projects and late-stage projects would
continue to be funded.
We analyze the impact of R&D growth declines with three related models. The
models are used to compute the present value of R&D expenditures under different R&D
growth assumptions. They provide estimates of cumulative effects on R&D spending
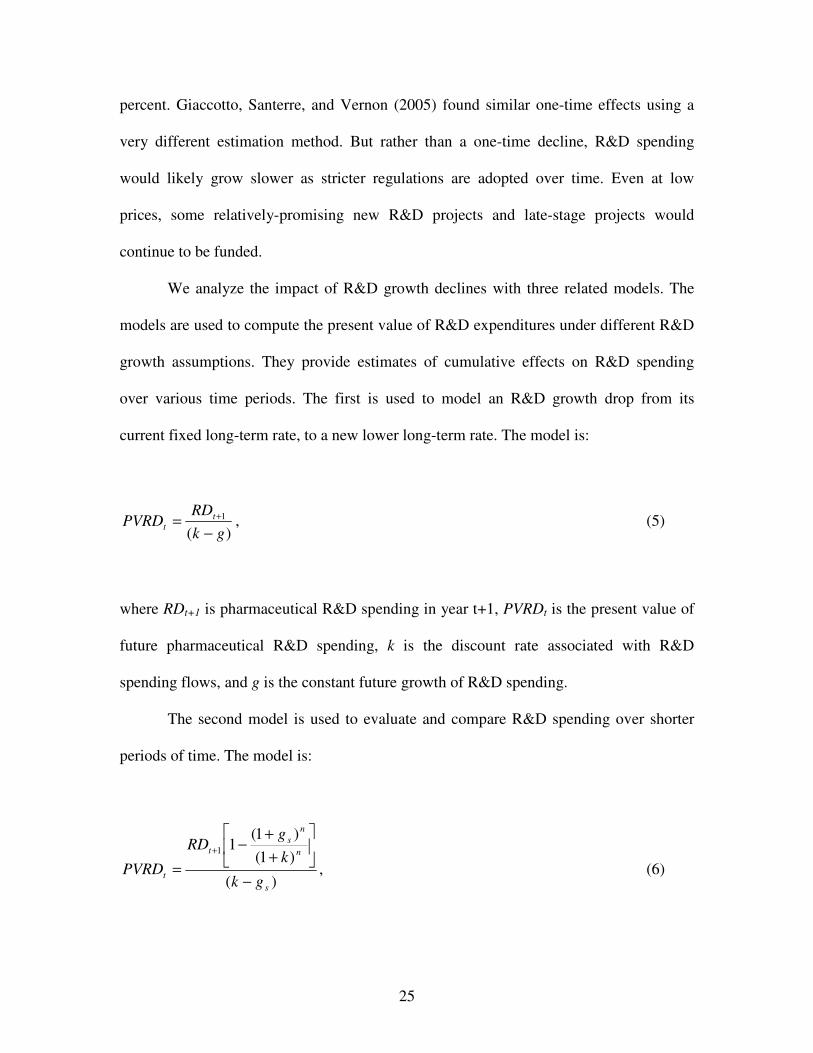
over various time periods. The first is used to model an R&D growth drop from its
current fixed long-term rate, to a new lower long-term rate. The model is:
)(1
gkRD
PVRD tt −
= + , (5)
where RDt+1 is pharmaceutical R&D spending in year t+1, PVRDt is the present value of
future pharmaceutical R&D spending, k is the discount rate associated with R&D
spending flows, and g is the constant future growth of R&D spending.
The second model is used to evaluate and compare R&D spending over shorter
periods of time. The model is:
)(
)1()1(
11
s
n
ns
t
t gk
kg
RD
PVRD−
��
���
�
++
−=
+
, (6)
26
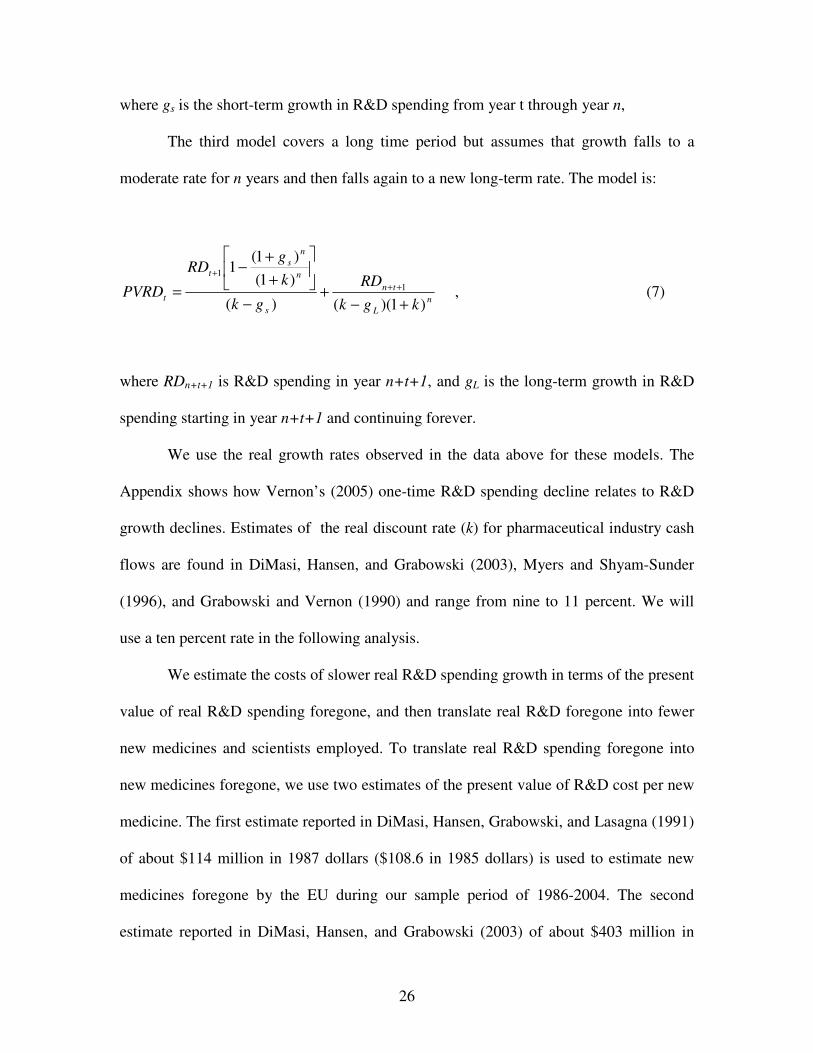
where gs is the short-term growth in R&D spending from year t through year n,
The third model covers a long time period but assumes that growth falls to a
moderate rate for n years and then falls again to a new long-term rate. The model is:
nL
tn
s
n
ns
t
t kgkRD
gk
kg
RD
PVRD)1)(()(
)1()1(
11
1
+−+
−
��
���
�
++
−= ++
+
, (7)
where RDn+t+1 is R&D spending in year n+t+1, and gL is the long-term growth in R&D
spending starting in year n+t+1 and continuing forever.
We use the real growth rates observed in the data above for these models. The
Appendix shows how Vernon’s (2005) one-time R&D spending decline relates to R&D
growth declines. Estimates of the real discount rate (k) for pharmaceutical industry cash
flows are found in DiMasi, Hansen, and Grabowski (2003), Myers and Shyam-Sunder
(1996), and Grabowski and Vernon (1990) and range from nine to 11 percent. We will
use a ten percent rate in the following analysis.
We estimate the costs of slower real R&D spending growth in terms of the present
value of real R&D spending foregone, and then translate real R&D foregone into fewer
new medicines and scientists employed. To translate real R&D spending foregone into
new medicines foregone, we use two estimates of the present value of R&D cost per new
medicine. The first estimate reported in DiMasi, Hansen, Grabowski, and Lasagna (1991)
of about $114 million in 1987 dollars ($108.6 in 1985 dollars) is used to estimate new
medicines foregone by the EU during our sample period of 1986-2004. The second
estimate reported in DiMasi, Hansen, and Grabowski (2003) of about $403 million in
27
2000 dollars ($439 million in 2004 dollars) is used to estimate new medicines foregone
by the EU and the U.S. for all future years.
To translate real R&D spending foregone into pharmaceutical scientist jobs
foregone, we use National Science Foundation figures that show R&D expenditures per
R&D employee in the Pharmaceuticals and Medicine Manufacturing industry (NAICS
3254) was $225,693 in 2001 (in constant 1996 dollars).14 The Bureau of Labor Statistics
reports that medical scientists in the industry earned about $77,000 in wages ($36.92 per
hour median wage).15 Given that other compensation is likely to be at least half the cost
of wages, then total employee compensation is about half of the $225,693 spent on R&D
per R&D employee. We use $112,846 (in 1996 dollars) in the computations below.16
Table 4 presents estimated costs of EU-type regulation under three different
scenarios. First are the costs to the EU of price regulation already incurred during the
1986-2004 period. Model (6) is used in this case. The second and third are the
prospective costs to the EU and the U.S. of price regulation in the future. Models (5) and
(7) are used to estimate prospective costs for the EU and the U.S., respectively
14 See Industrial R&D Employment in the United States and in U.S. Multinational Corporations, National Science Foundation, 2004. 15 See Bureau of Labor Statistics, Pharmaceutical and Medical Manufacturing (NAICS 3254), 2004, (www.bls.gov/oco/cg/pdf/cgs009.pdf). 16 Data on the distribution of R&D expenditures in the pharmaceutical and biotechnology industries across labor and non-labor inputs is not typically available in firms’ financial statements. We searched the financial statements filed on the SEC’s EDGAR database for those that discussed their labor inputs, and labor was mentioned as at least a majority of R&D expenses. We conducted a limited analysis of “pure play” biotechnology firms with R&D expenditure and labor expense data listed on Compustat. These firms had little or no revenue from marketed products so they were solely research firms. Under reasonable assumptions about the distribution of labor expense between R&D and non-R&D employees, labor represents close to 90 percent of their R&D expenses.

28
Table 4
Estimated Costs of EU-Type Pharmaceutical Price Regulation in Terms of Foregone
R&D Spending, Fewer New Medicines, and Fewer Scientists Employed
Scenario Foregone R&D Spending
Foregone New Medicines
Foregone R&D Job Years*
(1) Costs Incurred by the EU during 1986-2004 due to real R&D growth at 5.4% instead of 6.6%
$4.96 Billion (1985 dollars)
46
31,925
(2) Prospective Costs to EU from 2004 onward due to real R&D growth at 2.8% instead of 5.4%
$280.78 Billion (2004 dollars)
526
1,035,953
(3) Prospective Costs to U.S. from 2004 onward due to real R&D growth at 5.4% for 18 years followed by 2.8% thereafter instead of 6.6% throughout
$427.40 Billion (2004 dollars)
974
1,578,081
*Uses CPI annual inflation rates to adjust $112,846 (1996 dollars) compensation cost per research employee to the appropriate year.
For the first scenario, foregone European R&D spending is estimated by
comparing PVRD calculated using Europe’s actual 1987-2004 annual real R&D growth
(5.4%), to PVRD assuming that EU growth of 6.6% between 1987 and 1991 could have
been maintained if regulations were more comparable to the U.S. Note that U.S. annual
real R&D growth during the period averaged considerably more; about 8.8 percent. Some
of that growth probably reflects a shift of R&D spending by EU firms from the EU to the
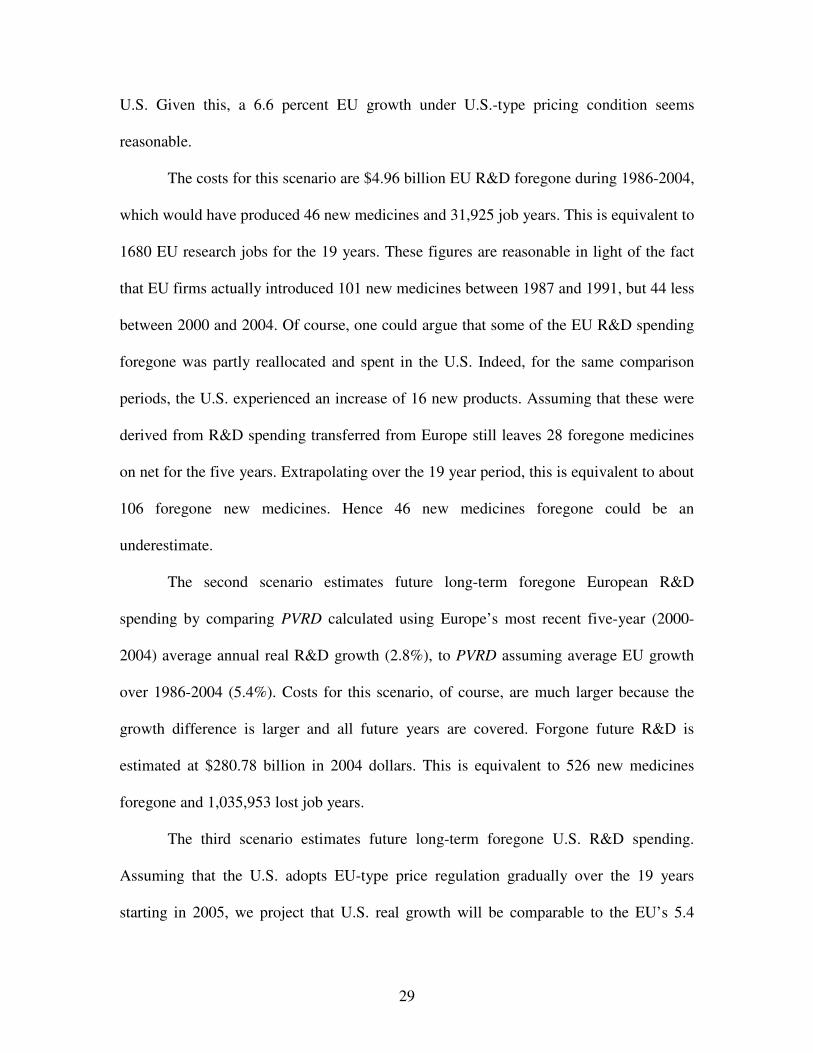
29
U.S. Given this, a 6.6 percent EU growth under U.S.-type pricing condition seems
reasonable.
The costs for this scenario are $4.96 billion EU R&D foregone during 1986-2004,
which would have produced 46 new medicines and 31,925 job years. This is equivalent to
1680 EU research jobs for the 19 years. These figures are reasonable in light of the fact
that EU firms actually introduced 101 new medicines between 1987 and 1991, but 44 less
between 2000 and 2004. Of course, one could argue that some of the EU R&D spending
foregone was partly reallocated and spent in the U.S. Indeed, for the same comparison
periods, the U.S. experienced an increase of 16 new products. Assuming that these were
derived from R&D spending transferred from Europe still leaves 28 foregone medicines
on net for the five years. Extrapolating over the 19 year period, this is equivalent to about
106 foregone new medicines. Hence 46 new medicines foregone could be an
underestimate.
The second scenario estimates future long-term foregone European R&D
spending by comparing PVRD calculated using Europe’s most recent five-year (2000-
2004) average annual real R&D growth (2.8%), to PVRD assuming average EU growth
over 1986-2004 (5.4%). Costs for this scenario, of course, are much larger because the
growth difference is larger and all future years are covered. Forgone future R&D is
estimated at $280.78 billion in 2004 dollars. This is equivalent to 526 new medicines
foregone and 1,035,953 lost job years.
The third scenario estimates future long-term foregone U.S. R&D spending.
Assuming that the U.S. adopts EU-type price regulation gradually over the 19 years
starting in 2005, we project that U.S. real growth will be comparable to the EU’s 5.4
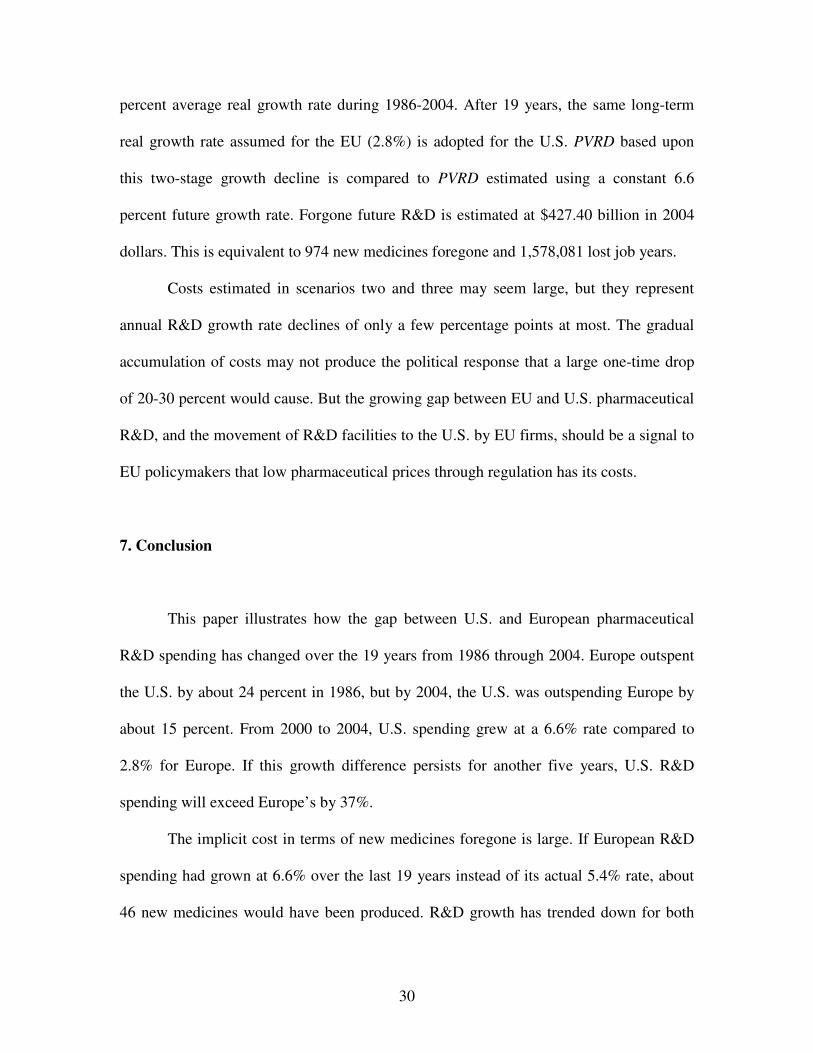
30
percent average real growth rate during 1986-2004. After 19 years, the same long-term
real growth rate assumed for the EU (2.8%) is adopted for the U.S. PVRD based upon
this two-stage growth decline is compared to PVRD estimated using a constant 6.6
percent future growth rate. Forgone future R&D is estimated at $427.40 billion in 2004
dollars. This is equivalent to 974 new medicines foregone and 1,578,081 lost job years.
Costs estimated in scenarios two and three may seem large, but they represent
annual R&D growth rate declines of only a few percentage points at most. The gradual
accumulation of costs may not produce the political response that a large one-time drop
of 20-30 percent would cause. But the growing gap between EU and U.S. pharmaceutical
R&D, and the movement of R&D facilities to the U.S. by EU firms, should be a signal to
EU policymakers that low pharmaceutical prices through regulation has its costs.
7. Conclusion
This paper illustrates how the gap between U.S. and European pharmaceutical
R&D spending has changed over the 19 years from 1986 through 2004. Europe outspent
the U.S. by about 24 percent in 1986, but by 2004, the U.S. was outspending Europe by
about 15 percent. From 2000 to 2004, U.S. spending grew at a 6.6% rate compared to
2.8% for Europe. If this growth difference persists for another five years, U.S. R&D
spending will exceed Europe’s by 37%.
The implicit cost in terms of new medicines foregone is large. If European R&D
spending had grown at 6.6% over the last 19 years instead of its actual 5.4% rate, about
46 new medicines would have been produced. R&D growth has trended down for both
31
the U.S. and Europe, but the gap in growth rates between the U.S. and Europe has
remained quite stable at about 3.4 percent. The general downward trend could reflect
weaker real price increases in the U.S. since 1992 and no real price increase in Europe
throughout. Threatened or actual pharmaceutical price regulation could account for this
weaker price growth and, consequently, weaker R&D growth.
Slower R&D growth as a consequence of price regulation and reimportation may
be politically acceptable because current consumer benefit, but we show that the cost to
future generations is substantial. European-type policies adopted in the U.S. could lead to
974 fewer new medicines and 1,578,081 lost job years in the future. Because new
medicines improve health and extend lives (see Lichtenberg 1996, 2003), these policies
essentially trade off the health and employment opportunities of future generations for
cost savings for current pharmaceutical consumers.
32
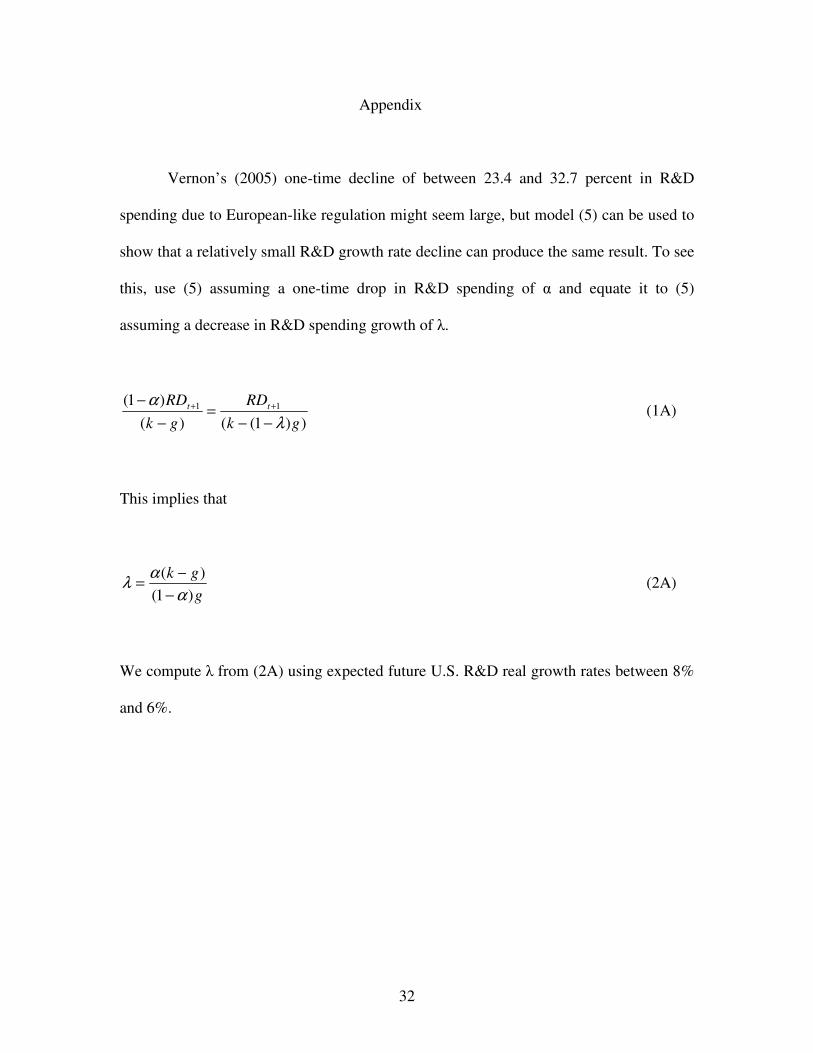
Appendix
Vernon’s (2005) one-time decline of between 23.4 and 32.7 percent in R&D
spending due to European-like regulation might seem large, but model (5) can be used to
show that a relatively small R&D growth rate decline can produce the same result. To see
this, use (5) assuming a one-time drop in R&D spending of � and equate it to (5)
assuming a decrease in R&D spending growth of �.
))1(()()1( 11
gkRD
gkRD tt
λα
−−=
−− ++ (1A)
This implies that
ggk)1(
)(α
αλ−
−= (2A)
We compute � from (2A) using expected future U.S. R&D real growth rates between 8%
and 6%.
33
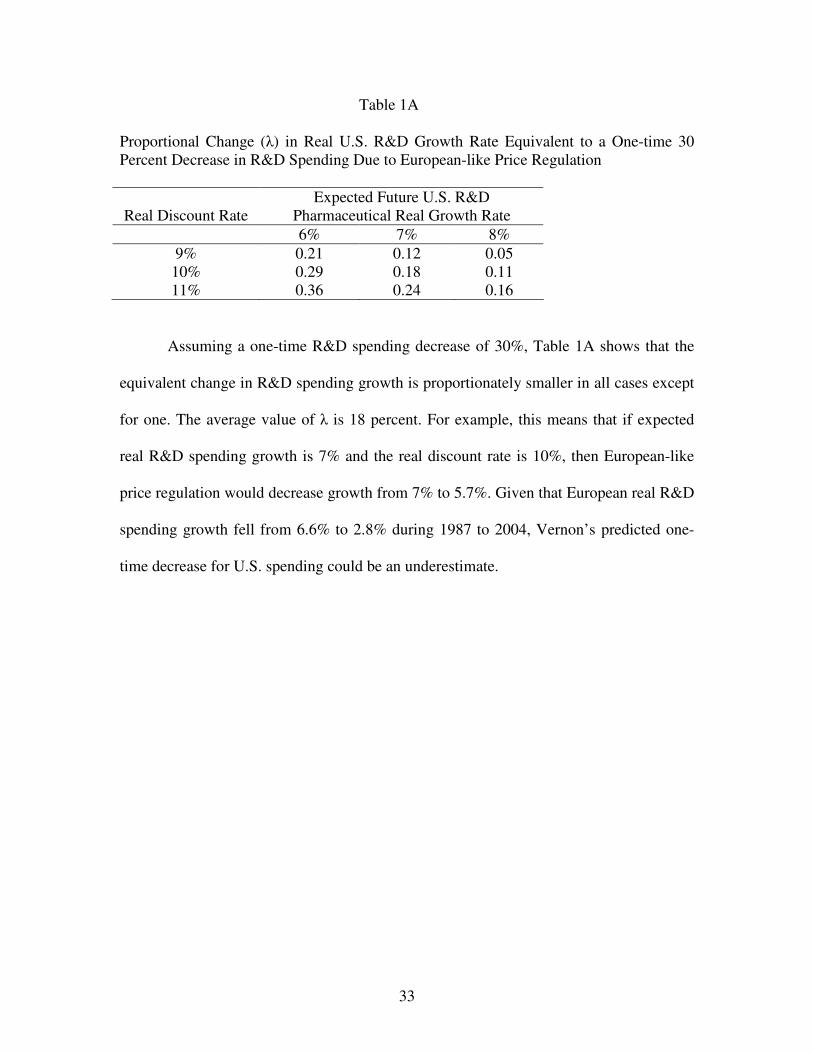
Table 1A
Proportional Change (�) in Real U.S. R&D Growth Rate Equivalent to a One-time 30 Percent Decrease in R&D Spending Due to European-like Price Regulation
Real Discount Rate
Expected Future U.S. R&D Pharmaceutical Real Growth Rate
6% 7% 8% 9% 0.21 0.12 0.05 10% 0.29 0.18 0.11 11% 0.36 0.24 0.16
Assuming a one-time R&D spending decrease of 30%, Table 1A shows that the
equivalent change in R&D spending growth is proportionately smaller in all cases except
for one. The average value of � is 18 percent. For example, this means that if expected
real R&D spending growth is 7% and the real discount rate is 10%, then European-like
price regulation would decrease growth from 7% to 5.7%. Given that European real R&D
spending growth fell from 6.6% to 2.8% during 1987 to 2004, Vernon’s predicted one-
time decrease for U.S. spending could be an underestimate.
34
References
Aktas, Nihat, Eric de Bondt, Michel Levasseur, and Andre Schmitt, 2001, “The Emerging
Role of the European Commission in Merger and Acquisition Monitoring: The Boeing–
McDonnell Douglas Case,” European Financial Management 7: 447- 480.
Aktas, Nihat, Eric de Bondt, and Richard Roll, 2004, “Market Response to European
Regulation of Business Combinations,” Journal of Financial and Quantitative Analysis
39: 731-758.
Bureau of Labor Statistics, 2004, Pharmaceutical and Medical Manufacturing (NAICS
3254), www.bls.gov/oco/cg/pdf/cgs009.pdf.
Campa, Jose Manuel and Ignacio Hernando, 2004, “Shareholder Value Creation in
European M&As,” European Financial Management 10: 47- 81.
DiMasi, Joseph A., Ronald W. Hansen, Henry G. Grabowski, and Louis Lasagna, 1991,
“Cost of Innovation in the Pharmaceutical Industry,” Journal of Health Economics 10:
107-142.
35
DiMasi, Joseph A., Ronald W. Hansen, and Henry G. Grabowski, 2003, “The Price of
Innovation: New Estimates of Drug Development Costs,” Journal of Health Economics
22: 151-185.
Eberhart, Allan C., William F. Maxwell, and Akhtar Siddique, 2004, An examination of long-
term stock returns and operating performance following R&D increases, Journal of Finance 59,
623-650.
European Federation of Pharmaceutical Industries and Associations (EFPIA), 2002,
“Year in Review 2001-2002”, Brussels, Belgium.
European Federation of Pharmaceutical Industries and Associations (EFPIA), 2005, “The
Pharmaceutical Industry in Figures”, Brussels, Belgium.
Ellison, Sara Fisher, and Wallace P. Mullin, 2001, “Gradual incorporation of information:
Pharmaceutical stocks and the evolution of President Clinton’s health care reform”,
Journal of Law and Economics 44, 89-130.
Ganslandt, Mattias and Keith E. Maskus, 2004, “Parallel Imports and the Pricing of
Pharmaceutical Products: Evidence from the European Union,” Journal of Health
Economics 23: 1035-1057.
36
Giaccotto, Carmelo, Rexford Santerre, and John Vernon, 2005, “Drug prices and research
and development investment behavior in the pharmaceutical industry”, Journal of Law
and Economics 48, 195-214.
Grabowski, Henry G., John M. Vernon, 1990, “A New Look at the Risks and Returns to
Pharmaceutical R&D,” Management Science 36(7):804-821.
Greene, William H., 1990, Econometric Analysis, McMillan Publishing Company: New York.
Lichtenberg, Frank, R., 1996, “Do (more and better) drugs keep people out of
hospitals?,” American Economic Review 86, 383-388.
Lichtenberg, Frank, R., 2003, “The Impact of New Drug Launches on Longevity:
Evidence from Longitudinal, Disease-Level Data from 52 Countries, 1982-2001,”
International Journal of Healthcare Finance and Economics 5, 47-73.
Myers, Stuart, C. and Lakshmi Shyam-Sunder, 1996, “Measuring Pharmaceutical
Industry Risk and the Cost of Capital,” in Robert M. Helms, ed., Competitive Strategies in
the Pharmaceutical Industry, American Enterprise Institute Press, Washington, DC., 208-
237.
National Science Foundation, 2004, Industrial R&D Employment in the United States
and in U.S. Multinational Corporations, NSF 05-302, by Francisco Moris.
37
Pharmaceutical Research and Manufacturers of America, 2005, “Pharmaceutical Industry
Profile:2005”. Washington D.C.
Tessoriero, Heather, 2004, “Torrid drug price increases pause”, Wall Street Journal,
December 6, A3.
Vernon, John, 2003, “Drug Research and Price Controls,” Regulation, 23 (4): 22-25.
Vernon, John, 2005, “Examining the Link between Price Regulation and Pharmaceutical
R&D Investment”, Health Economics 14, 1-16.
Related Documents