Goldman Sachs Global LNG Seminar

Welcome message from author
This document is posted to help you gain knowledge. Please leave a comment to let me know what you think about it! Share it to your friends and learn new things together.
Transcript

Goldman SachsGlobal LNG Seminar
BP’s Global Gas Position
Bolivia
Trinidad
Tangguh
BP Gas Resources BP Gas Sales
NorthwestShelf
Angola
Vico
Egypt

LNG Industry Dynamics Continue to Drive Growth
0
50
100
150
200
250
1964 1973 1980 1990 1996 2000 2010 2010 L 2010 Hi
7% CAGR
Early LNG growth Rise of Asian LNG Plentiful Gas Reserves
JapanKoreaTaiwanOther
EuropeU.S.
Lower growth
LNG gains greater market share of US supply gap
0
50
100
150
200
250
300
350
400
2020
Asia lacksProximal supply
Dri
vers
Dri
versNew M.E Low
Cost Supply
New Atlantic Low Cost Supply
US proximal supply declines
Higher demand growth driven by lower Asian prices
CCGT drives gas demand
New Asian customers
5% CAGR
10% CAGR
Major p/l competition
Gas demand growth continues
Costs allow new smaller markets to be reached
mtpa
mtpa
7% CAGR
US access constraints & low prices
Constrained US access
2002 Sales volume of 111 million tonnes LNG p.a.
•15 bcf/d or 6% of world gas demand of 230 bcf/d
•2.5 million boe/d or 3% of world oil demand
2002 $25b annual sales revenues; 130 LNG ships – cost of $4b per year

Key LNG Markets
Tangguh
Asia PacificTrinidad
USA
NWS
Europe to IndiaAtlanti
c
UK
India
China
Korea
Japan
SpainItaly
USA
Adgas
LNG remains a regional business
• US: deep and liquid market -- gaining access to regas capacity ensures access to market
• Europe: partial liberalisation -- regas capacity and customers generally difficult to secure
• Asia-Pacific: customers prefer long term contracts -- key is securing commitments
Linear business model
High Inertia environment
Gas monetisation priority
Merchant Trader
Early Market access
Portfolio opportunities
Vico

BP LNG Today and Future Developments
Spain, France
Italy, UK
Africa
India
USWC
Asia Pacific
Middle East
Atlantic
USA Japan, Korea, China
Trinidad Trains 2 & 3
Cove Point re-gas capacity
Trinidad Trains 4-6
Build New US East Coast re-gas
Adgas to Spain (3 Years)Qatargas to Spain (3Years)Iran LNG
Kakinanda re-gas & power project, IndiaDabhol, India
NWS supply into Japan/KoreaGuangdong re-gas terminal ownershipFuijan supply contractPhilippines supply (LOI)Vico
NWS Train 5 – Japan/Korea/ChinaTangguh – Japan/Korea/Taiwan/Java,
US West Coast
Nigeria to Spain spot cargoesEgypt Italy re-gas terminalLNG to UK
• Focus is on developing access to key premium markets development/capacity in re-gas.
• Market positions in advance of equity supply managed through short term supply deals & spot.
• Emerging supply network provides new opportunities for LNG trading
Long term economic supply
Short term opportunities
Potential new projects Current activites
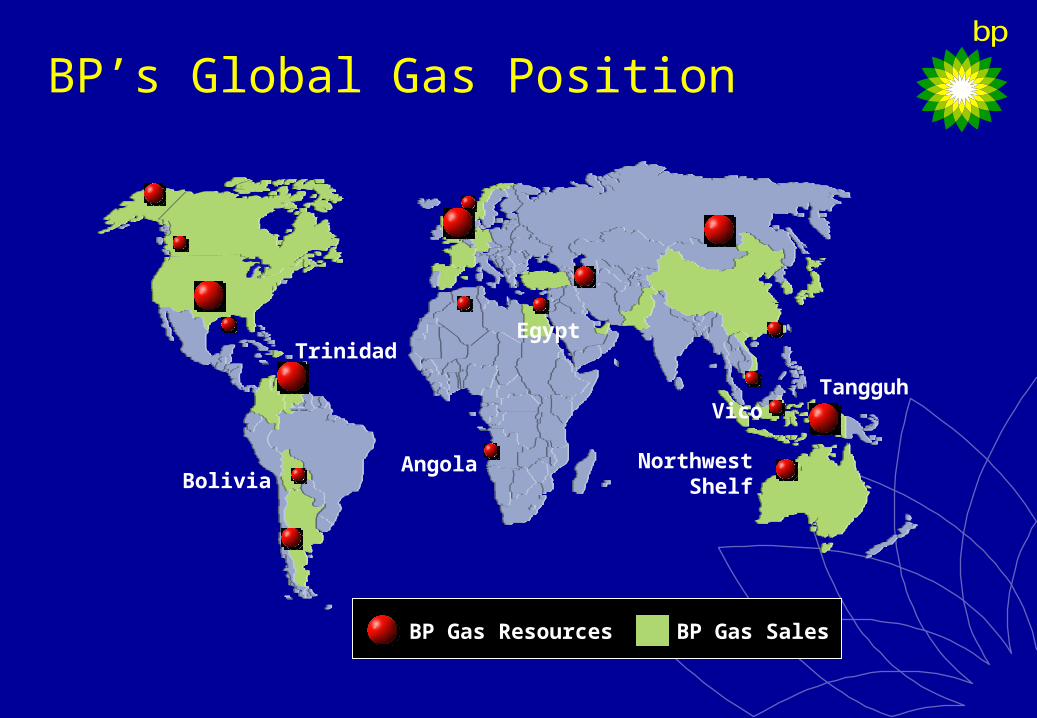
British Trader in Trinidad (10/05/03)

Trinidad
Spain
ElbaIsland
CovePoint
Boston
Trains 2 & 340% Spain60% US & Other
Train 140% Spain60% US & Other
Diversion &Back Fill Opportunity
LakeCharles
Trinidad - a New Complex Set of Deliveries to Capture US Market Opportunities
Trains 2 & 3Value Chain Alignment – Repsol acquire upstream interest in BP Trinidad & TobagoPotential Diversion – Trinidadian volumes destined for Spain to more attractive US marketsRisk Management – opportunity to balance supply / demandin Spain

Cove Point Terminal

Dominican Republic

Key LNG Markets
Tangguh
Asia PacificTrinidad
USA
NWS
Europe to IndiaAtlanti
c
UK
India
China
Korea
Japan
SpainItaly
USA
Adgas
LNG remains a regional business
• US: deep and liquid market -- gaining access to regas capacity ensures access to market
• Europe: partial liberalisation -- regas capacity and customers generally difficult to secure
• Asia-Pacific: customers prefer long term contracts -- key is securing commitments
Linear business model
High Inertia environment
Gas monetisation priority
Merchant Trader
Early Market access
Portfolio opportunities
Vico
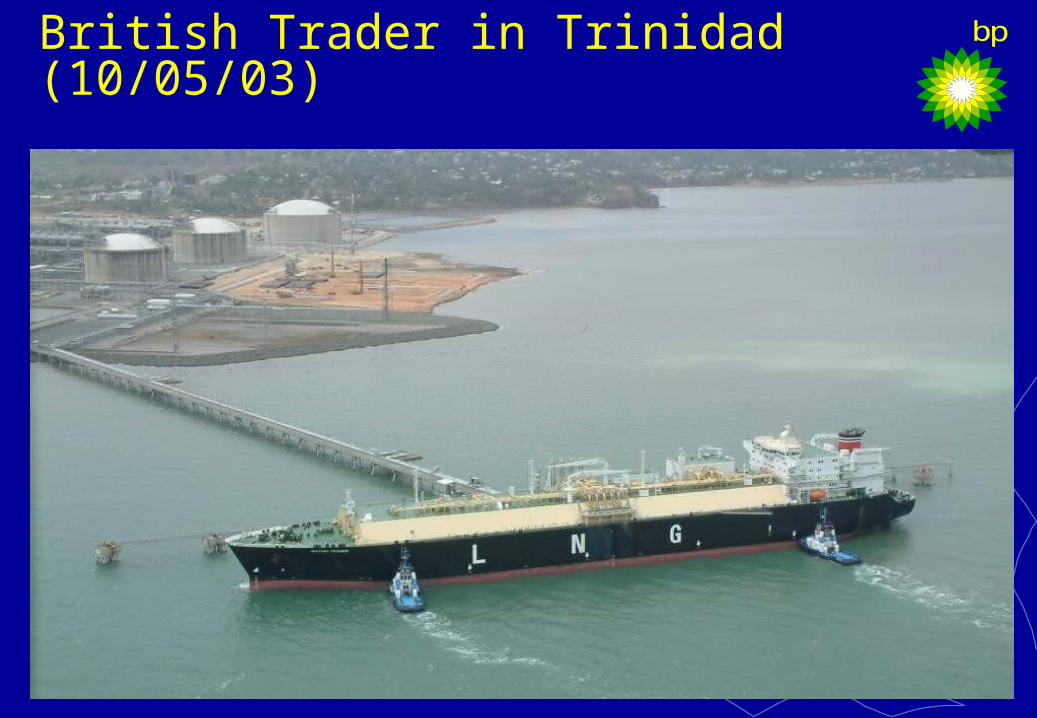
Yacheng
Kovykta
Beijing
Long-Distance Gas Pipeline
Fujian
Guangdong Regas Terminal
Building a Gas Business in South-China
NWS to Guangdong•BP 16.7% - net 50 mmscf/d
Yacheng Y13•BP 34% - net 100 mmscf/d (in
production)
Tangguh to Fujian•BP 37% - net 125 mmscf/d
Guangdong Terminal & Trunkline
•BP 30%•First LNG terminal in China
1996
2001
2002
2002
Northwest Shelf LNG
Tangguh LNG

Tangguh

BP Equity Gas into LNG Plant
0
1,000
2,000
3,000
Sontrach Shell Qatar BP XOM TFE
mmscf/d
2006E
2003
BP internal analysis based on publicly available data

gas supplied to plants
mmscfd
0
500
1000
1500
2000
00 01 02 03 04 05 08
New LNG
~
source: BP projections 03 - 05, 08
markets capturedas of Dec ‘02
0
500
1000
1500
2000
Japan
Americas
Spain
China
Other
mmscfdTrinidad 2&3Trinidad 1 IndonesiaAustralia
Building Markets Ahead of SupplyBP’s growth in equity gas is supported by building key LNG market positions in all three regions ahead of the supply
Related Documents


](https://static.cupdf.com/doc/110x72/577c7d741a28abe0549edc33/lee000966-depth-conversion-of-tangguh-gas-fieldsautosaved.jpg)