bcb.gov.br Brazil’s Economic Outlook and Agenda BC# Roberto Campos Neto Governor of Banco Central do Brasil October 15, 2021 Goldman Sachs

Welcome message from author
This document is posted to help you gain knowledge. Please leave a comment to let me know what you think about it! Share it to your friends and learn new things together.
Transcript
bcb.gov.br
Brazil’s Economic Outlook and Agenda BC#
Roberto Campos NetoGovernor of Banco Central do Brasil
October 15, 2021
Goldman Sachs

- 10 20 30 40 50 60 70 80 90
Chile
Canada
Japan
Brazil
United Kingdom
Israel
Australia
United States
Turkey
Europe ex UK
South America ex Brazil
Colombia
IndiaUK
Europe ex. UK
2
COVID-19
Covid-19: New deaths and vaccination
Sources: (1) Our World in Data. Last data: 13 Oct. 2021. (2) Localiza SUS for Brazilian booster doses.
South Am. ex BrazilBrazil
U.S.
New deaths/million(7-day rolling average)
New deaths fall as vaccination advances
At least one dose Fully vaccinated Booster dose
Share of population vaccinated (% of population)
Brazil
0
2
4
6
8
10
12
14
16
18
20
Mar-20 Sep-20 Mar-21 Sep-21
3
COVID-19
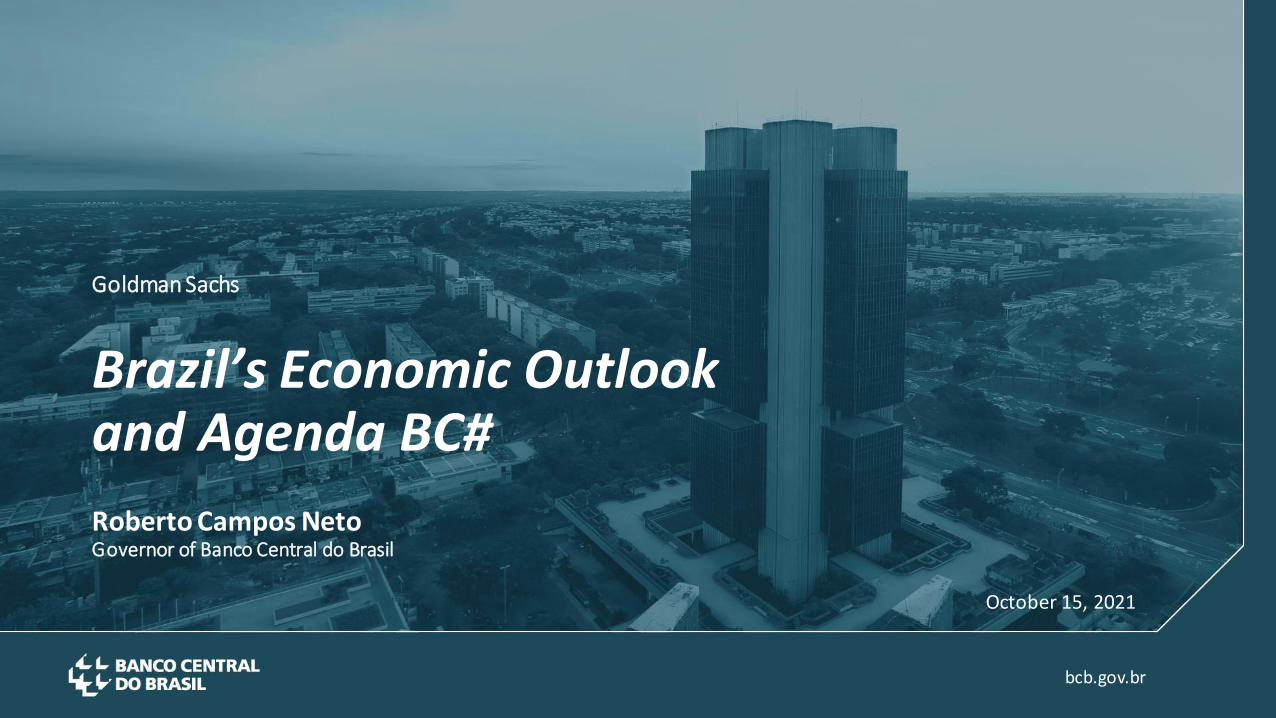
Brazil: Covid-19 vaccination
Sources: Registered vaccinationcollected at http://www.giscard.com.br/ andhttps://coronavirusbra1.github.io/. Localiza SUS.
Brazil
Brazilian vaccination campaign has advanced.
Brazil: daily dosesEstimated offer x registered (thousands/day)
Brazil: vaccination by age group (%)
Availability of doses based on a schedule published by the Ministry of Health on October 13th,with adjustments that reflect news published by the press. Scenario considers Astrazeneca-Oxford, Coronavac, Pfizer-BioNTech and Janssen vaccines. Dose delivery schedule subject tochanges.
At least one dose Fully vaccinated Booster dose
Updated to 10/10/2021
Updated to 10/13/2021
55%
80%86%
90%93%
97% 95% 95%
7%
33%
48%
65%
77%
92% 91% 89%
12%22%
12-19 20-29 30-39 40-49 50-59 60-69 70-79 80+
Coronavac
AZ-Oxford
Registered
Vaccination
0
500
1,000
1,500
2,000
2,500
Jan-21 Mar-21 May-21 Jul-21 Sep-21 Nov-21 Jan-22
Pfizer
Janssen
4
GLOBAL ECONOMY
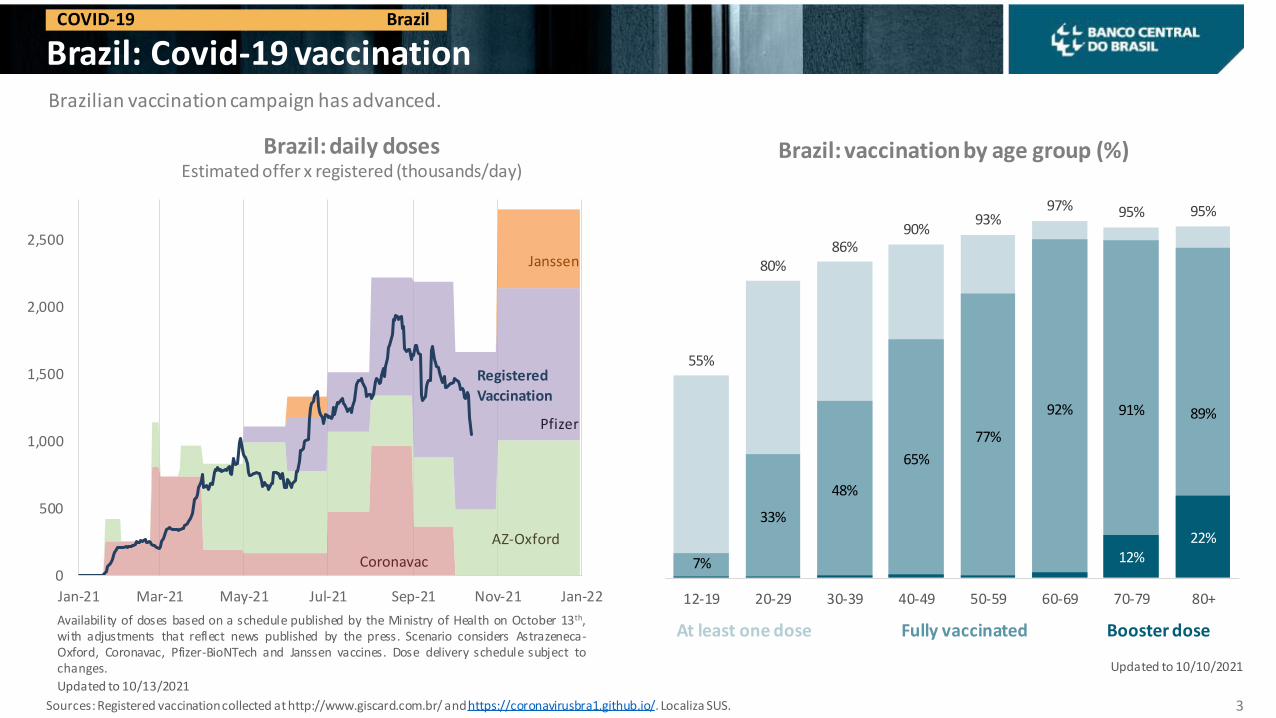
Advanced economies: economic activity Global economic recovery continues to be directly linked to the evolution of the pandemic and the pace of vaccination.
Sources: Bloomberg, Eurostat
Advanced Economies
. Euro
are
a G
DP
U.S
. G
DP
Fo
reca
st f
or
Q3
21
(Fe
d A
tlan
ta -
GD
PN
ow
) –
S.A
.A.R
. %
97.697.197.196.393.3
75
80
85
90
95
100
105
Q2 19 Q4 19 Q2 20 Q4 20 Q2 21
Q4
2019
= 1
00
Euro area= 2.2Germany= 1.6France= 1.1Italy= 2.7Spain= 2.8
Q2 21 Rate (qoq, %)
75
80
85
90
95
100
105
110
115
Q12019
Q2 Q3 Q4 Q12020
Q2 Q3 Q4 Q12021
Q2
Ave
rage
20
19
= 1
00
China Asia ex Japan and China USA Japan Euro area UK
GDP* (Average 2019 = 100)
* Series at constant prices, seasonally adjusted. The series 'Asia ex. Japan and China' was calculated as a weighted average ofSingapore, South Korea, Hong Kong, India, Indonesia, Philippines, Malaysia, Thailand,Taiwan and Turkey. The series of Singapore,
India and Indonesia are not seasonally adjusted.
1
2
3
4
5
6
7
8
9
Jul-21 Aug-21 Sep-21 Oct-21

82%
100%
69%
0%
10%
20%
30%
40%
50%
60%
70%
80%
90%
100%
Jan-20 May-20 Sep-20 Jan-21 May-21 Sep-21
Total Advanced Countries Emerging Countries
Brazil below
50
Total 28 countries, 12 advanced and 16 emerging
5
Economic activity
Sources: Refinitiv, Bloomberg.
Eco
no
mic
Su
rpri
ses
(Cit
i Eco
no
mic
Su
rpri
ses
Ind
ex
–C
ESI)
GLOBAL ECONOMY
PMI Manufacturing: % countries above 50 points
PM
I Se
rvic
es
(% o
f co
un
trie
s ab
ove
50
po
ints
)
-80
-40
0
40
80
120
Oct-16 Oct-17 Oct-18 Oct-19 Oct-20 Oct-21
Global EM
83%
0%
20%
40%
60%
80%
100%
Dec-19 Mar-20 Jun-20 Sep-20 Dec-20 Mar-21 Jun-21 Sep-21
Brazil above 50
Total 12 countries

6
GLOBAL ECONOMY
China: economic activity
Sources: Caixin-Markit, NBS, Deutsche Bank, Bloomberg
China
PMI Manufacturing - China
47
48
49
50
51
52
53
54
55
Sep-12 Sep-13 Sep-14 Sep-15 Sep-16 Sep-17 Sep-18 Sep-19 Sep-20 Sep-21
Caixin PMI (surveys mainly small, private business)
Official PMI (surveys mainly state-owned companies)
Hang Seng Properties Index
Real estate activity slowing down30%
25%
20%
15%
10%
5%
0%
-5%
-10%
30%
25%
20%
15%
10%
5%
0%
-5%
-10%
Jul-12 Jul-15 Jul-18 Jul-21
Property Investiment in Real Estate - Total Steel Production - rhs
000s
25
30
35
40
45
50
Oct-18 Apr-19 Oct-19 Apr-20 Oct-20 Apr-21 Oct-21

53
63
73
83
93
103
113
123
133
143
53
63
73
83
93
103
113
123
133
143
Jan-20 May-20 Sep-20 Jan-21 May-21 Sep-21
Chile Mexico South Africa Colombia Brazil
7
GLOBAL ECONOMY
Emerging economies: economic activity
Sources: Bloomberg, IBGE and BCB (Focus Report).
Emerging Economies
Re
tail
sale
s(j
an/2
02
0=1
00
)
Rus
sia
Mal
aysi
a
Sou
th A
fric
a Bra
zil
Me
xico
Arg
enti
na Colo
mbi
aCh
ina
Chile
-12
-10
-8
-6
-4
-2
0
2
42020 GDP (%)
55
60
65
70
75
80
85
90
95
100
105
Jan-20 Apr-20 Jul-20 Oct-20 Jan-21 Apr-21 Jul-21
SA, j
an/2
020
= 10
0
Economic Activity Index
Argentina Brazil Chile Colombia Mexico Peru
Ma
lays
ia
Mal
aysi
a
Ru
ssia
Rus
sia
Sou
th A
fric
a
Sou
th A
fric
a
Bra
zil
Bra
zil
Mex
ico
Me
xico
Arg
enti
na
Arg
enti
na
Colo
mb
ia
Co
lom
bia
Chin
a
Chin
a
Chile
Chile
0
2
4
6
8
10
12
2021 2022
GDP forecast (%)

0
10
20
30
40
50
60
70
80
90
100
110
120
130
140
201
1
201
2
201
3
201
4
201
5
201
6
201
7
201
8
201
9
202
0
202
1
Angola
Egypt
South Africa
Morocco
Algeria
Nigeria
India
Pakistan
China
Malaysia
Turkey
Kazakhstan
Azerbaijan
Russia
Thailand
Philippines
Croatia
Hungary
Ukraine
Romania
Belarus
Brazil
Uruguay
Bolivia
Colombia
Ecuador
Peru
Chile
Mexico
Dominican Rep.
Oman
Islamic Re. of Iran
Un. Arab Emirates
8
GLOBAL ECONOMY
Fiscal response
Sources: [1] IMF WEO Oct/21. For Brazil, the source is BCB. Brazil’s 2021 figure refers to Aug . [2] IMF Historical Public Debt Database.
Fiscal policy
Gross Debt – emerging markets(% of GDP)
Historical pattern of general government debt(1935-2020, % of GDP)
AFR
ICA
ASI
A E
X M
IDD
LE E
AST
EUR
OP
ELA
TIN
AM
ERIC
AM
IDD
LE E
AST
Brazil
Advanced Emerging Low Income
-10
5
20
35
50
65
80
95
110
125
193
5
194
0
194
5
195
0
195
5
196
0
196
5
197
0
197
5
198
0
198
5
199
0
199
5
200
0
200
5
201
0
201
5
202
0
WWIIGlobal financial
crisis
Covid-19
9
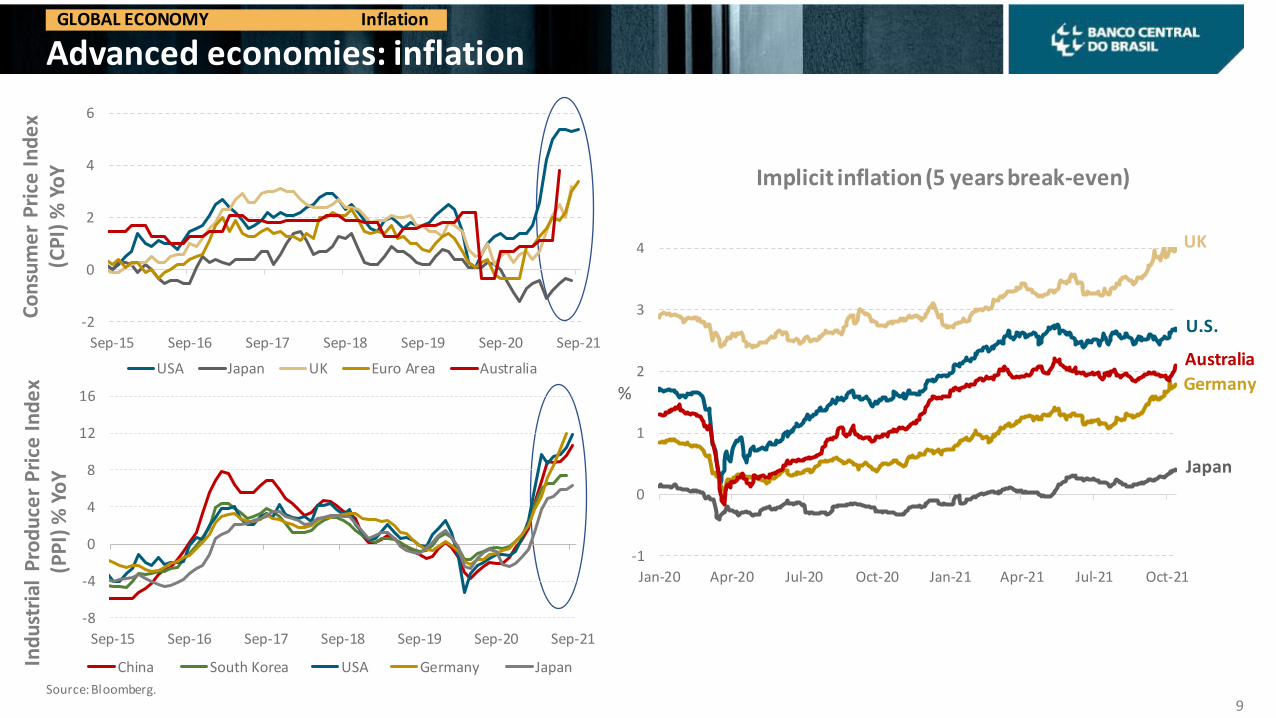
GLOBAL ECONOMY
Advanced economies: inflation
Source: Bloomberg.
Inflation
Implicit inflation (5 years break-even)
UK
U.S.
Australia
Germany
Japan
Co
nsu
me
r P
rice
In
de
x(C
PI)
% Y
oY
%
Ind
ust
rial
Pro
du
cer
Pri
ce I
nd
ex
(PP
I) %
Yo
Y
-2
0
2
4
6
Sep-15 Sep-16 Sep-17 Sep-18 Sep-19 Sep-20 Sep-21
USA Japan UK Euro Area Australia
-1
0
1
2
3
4
Jan-20 Apr-20 Jul-20 Oct-20 Jan-21 Apr-21 Jul-21 Oct-21
-8
-4
0
4
8
12
16
Sep-15 Sep-16 Sep-17 Sep-18 Sep-19 Sep-20 Sep-21
China South Korea USA Germany Japan
-25
-20
-15
-10
-5
0
5
10
15
20
25
-1
0
1
2
3
4
5
96 98 00 02 04 06 08 10 12 14 16 18 20 22
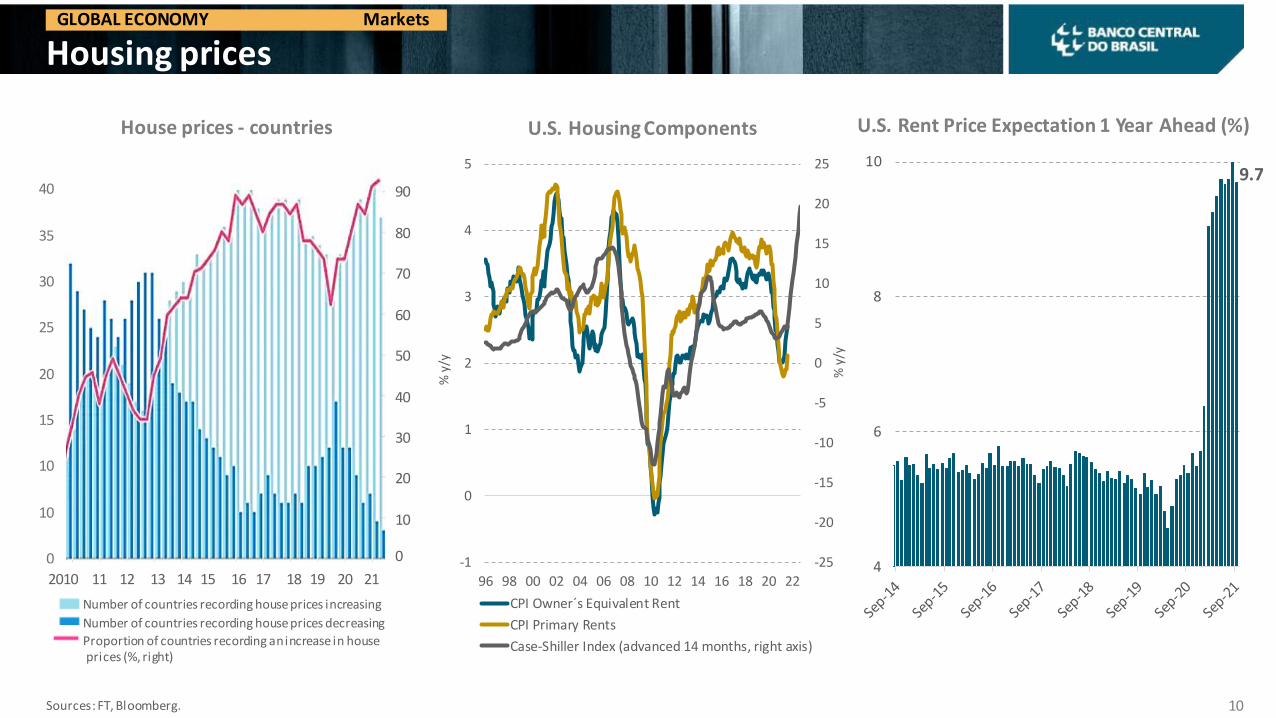
CPI Owner´s Equivalent Rent
CPI Primary Rents
Case-Shiller Index (advanced 14 months, right axis)
10
GLOBAL ECONOMY
Housing prices
Sources: FT, Bloomberg.
Markets
U.S. Housing Components U.S. Rent Price Expectation 1 Year Ahead (%)
Number of countries recording house prices increasing
Number of countries recording house prices decreasing
Proportion of countries recording an increase in houseprices (%, right)
40
35
30
25
20
15
10
10
0
90
80
70
60
50
40
30
20
10
0
House prices - countries
2010 11 12 13 14 15 16 17 18 19 20 21
% y
/y
% y
/y
9.7
4
6
8
10

11
GLOBAL ECONOMY
Sectoral bottlenecks
Sources: Bloomberg, Refinitiv.
Indicators suggest bottlenecks in the global economy.
Inte
rna
tio
na
l Fre
igh
t C
ost
s(J
an 2
018
= 10
0)
Sem
ico
nd
uct
ors
Ind
ex
(De
c 19
93 =
100
)
Semiconductors = Philadelphia Stock Exchange Semiconductor Index
0
5
10
15
20
25
30
35
40
45
50
US AT UK FR DE EA CZ AU IT CA IE ES GR TW PL JP MX KR BR TR ID RU CN IN
PMI Manufacturing Delivery Times (Smaller numbers represent longer time)
Sep/21 2020 Average0
700
1400
2100
2800
3500
Oct-96 Oct-01 Oct-06 Oct-11 Oct-16 Oct-21
826827
405
0
200
400
600
800
1000
Jan-18 Oct-18 Jul-19 Apr-20 Jan-21 Oct-21
Global Container Index
Harpex Global Charter Rate Index
Baltic Exchange Dry Global Index
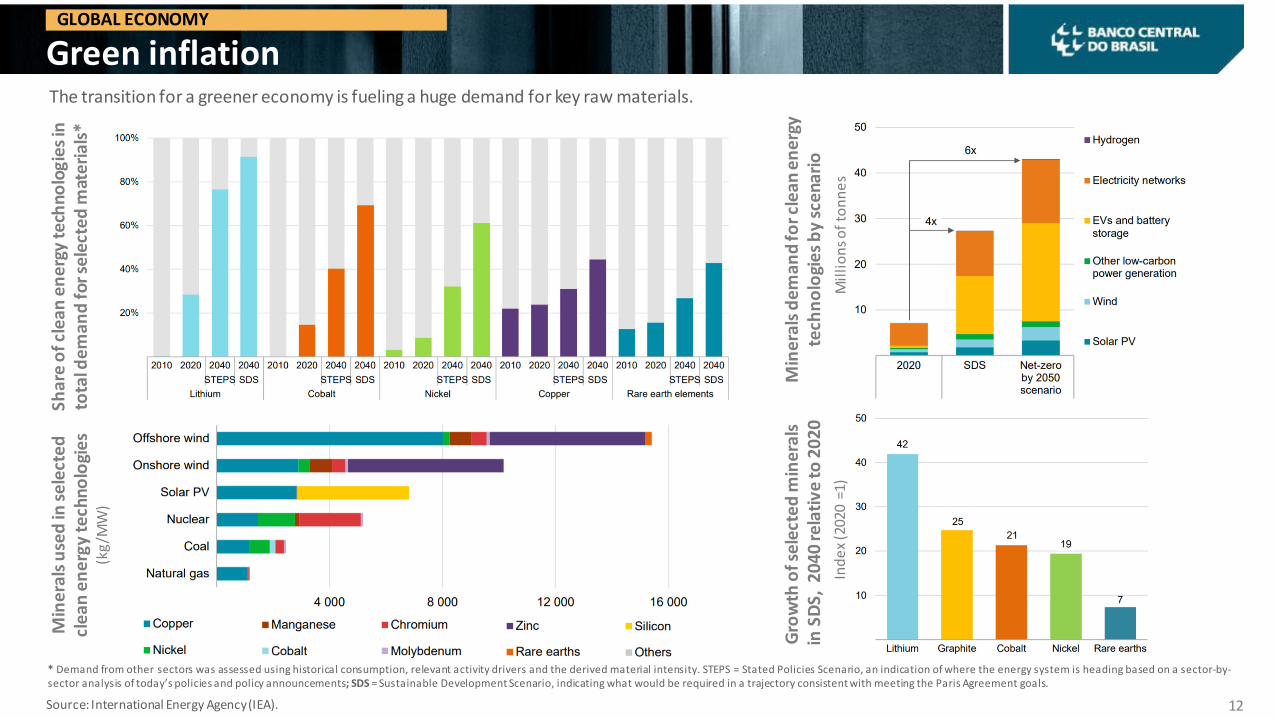
12
GLOBAL ECONOMY
Green inflation
Source: International Energy Agency (IEA).
The transition for a greener economy is fueling a huge demand for key raw materials.
Shar
e o
f cle
an e
ner
gy te
chno
logi
es in
to
tal d
eman
d fo
r sel
ecte
d m
ater
ials
*M
ine
rals
use
d in
se
lect
ed
cl
ean
en
erg
y t
ech
no
logi
es
(kg
/MW
)
Min
eral
s d
eman
d fo
r cle
an e
ner
gy
tech
no
logi
es
by
sce
nari
o
Mil
lio
ns
of
ton
ne
s
Gro
wth
of s
elec
ted
min
eral
sin
SD
S, 2
040
rela
tive
to 2
020
* Demand from other sectors was assessed using historical consumption, relevant activity drivers and the derived material intensity. STEPS = Stated Policies Scenario, an indication of where the energy system is heading based on a sector-by-sector analysis of today’s policies and policy announcements; SDS = Sustainable Development Scenario, indicating what would be required in a trajectory consistent with meeting the Paris Agreement goals.
Ind
ex
(202
0 =1
)
0
200
400
600
800
1000
1200
1400
Oct-14 Oct-15 Oct-16 Oct-17 Oct-18 Oct-19 Oct-20 Oct-21
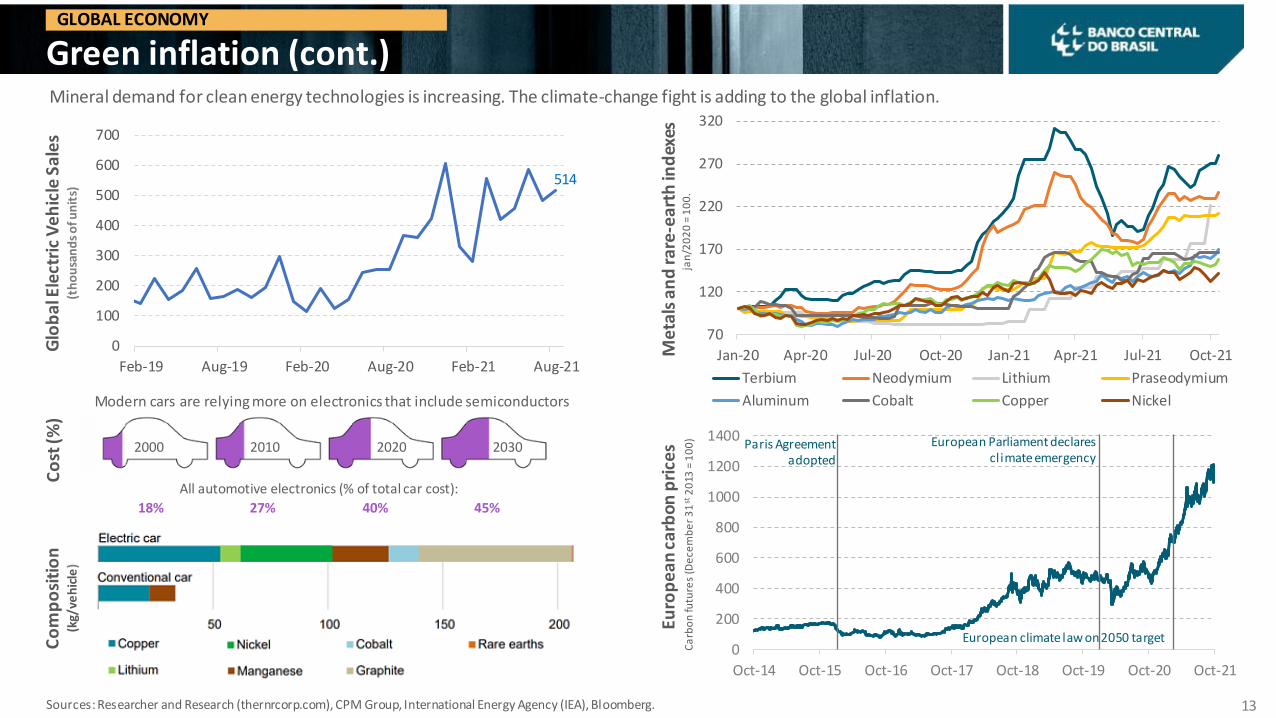
13
GLOBAL ECONOMY
Green inflation (cont.)Mineral demand for clean energy technologies is increasing. The climate-change fight is adding to the global inflation.
Co
st (%
)
Modern cars are relying more on electronics that include semiconductors
2000 2010 2020 2030
All automotive electronics (% of total car cost):
18% 27% 40% 45%
Sources: Researcher and Research (thernrcorp.com), CPM Group, International Energy Agency (IEA), Bloomberg.
Co
mp
osi
tio
n(k
g/ve
hic
le)
jan
/20
20
= 1
00
.
Euro
pea
n ca
rbon
pri
ces
Ca
rbo
n fu
ture
s (D
ece
mb
er
31
st2
013
= 1
00
)
Me
tals
an
d ra
re-e
arth
ind
exes
Cobre
Lítio
Níquel
Manganês
Cobalto
Grafite
50 100 150 200
Carro convencional
Paris Agreement adopted
European Parliament declares climate emergency
Terras-raras
Glo
ba
l Ele
ctri
c V
eh
icle
Sa
les
(th
ou
san
ds
of u
nit
s)
European climate law on 2050 target
514
0
100
200
300
400
500
600
700
Feb-19 Aug-19 Feb-20 Aug-20 Feb-21 Aug-21
70
120
170
220
270
320
Jan-20 Apr-20 Jul-20 Oct-20 Jan-21 Apr-21 Jul-21 Oct-21
Terbium Neodymium Lithium Praseodymium
Aluminum Cobalt Copper Nickel

14
GLOBAL ECONOMY
Energy pricesEnergy
Source: Bloomberg.
Energy Prices - Emerging countries (Dec/19=100)
Energy Prices - Advanced countries (Dec/19=100)
133
124
118118
116
109109
104103
80
90
100
110
120
130
140
Jan-20 May-20 Sep-20 Jan-21 May-21 Sep-21
Brazil Turkey India
Peru South Africa Chile
Russia Colombia Mexico
111110
107
104
101
75
80
85
90
95
100
105
110
115
Jan-20 May-20 Sep-20 Jan-21 May-21 Sep-21
USA United Kingdom Euro area Japan Canada
25
50
75
100
125
150
175
200
Jan-20 Apr-20 Jul-20 Oct-20 Jan-21 Apr-21 Jul-21 Oct-21
Jan
20
20
=10
0
15
GLOBAL ECONOMY
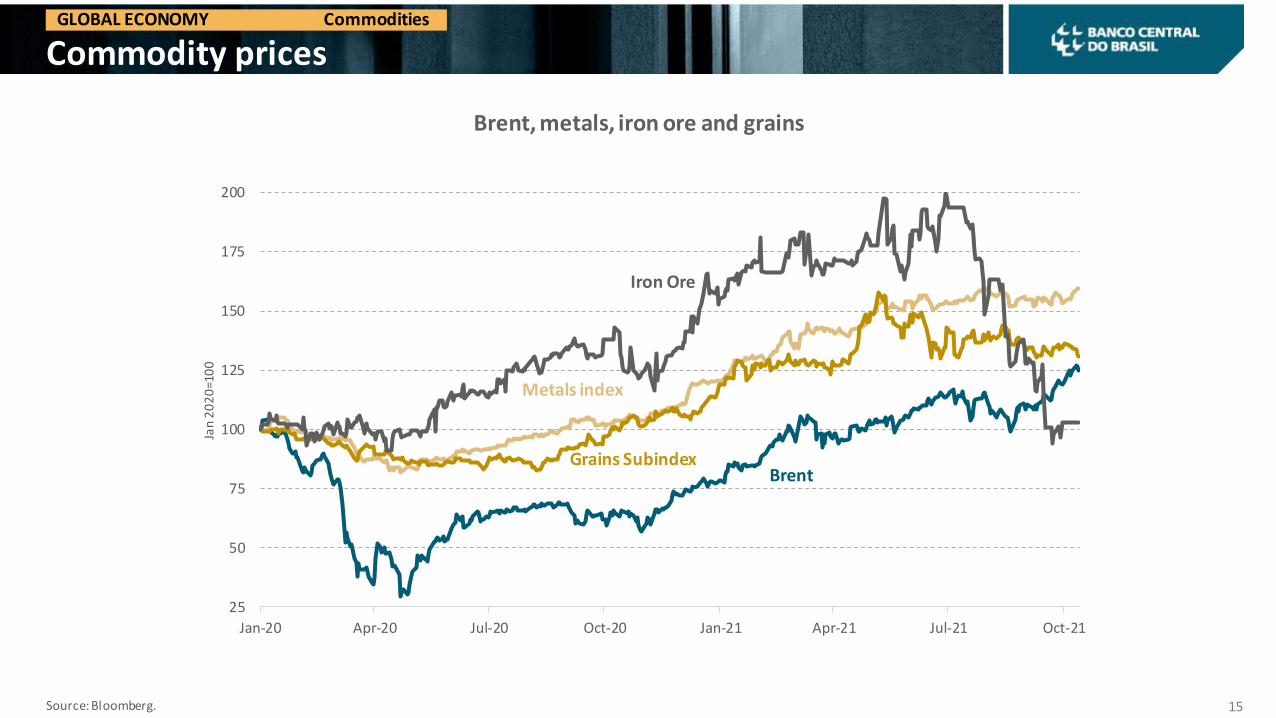
Commodity prices
Source: Bloomberg.
Commodities
Brent, metals, iron ore and grains
Iron Ore
Grains SubindexBrent
Metals index

16
GLOBAL ECONOMY
Emerging economies: inflation
Source: Bloomberg.
Inflation
CPI(jan 2020=100)
CPI Services(jan 2020=100)
130
127
124
121
118
115
112
109
106
103
100
97
126
122
118
114
110
106
102
98
107106
105104104
103
101
124
98
102
106
110
114
118
122
126
98
100
102
104
106
108
110
Jan-20 May-20 Sep-20 Jan-21 May-21 Sep-21
Russia
South Africa
Mexico
Chile
Brazil
Colombia
China
Turkey (right)
111
110
109
108107107
107
106
99
128
97
100
103
106
109
112
115
118
121
124
127
130
97
99
101
103
105
107
109
111
113
Jan-20 May-20 Sep-20 Jan-21 May-21 Sep-21
BrazilRussiaIndiaMexicoSouth AfricaChilePeruColombiaChinaTurkey (right)

18.00
4.75
6.75
3.50 4.00 3.502.00
4.35
6.25
2.00 1.75 1.650.50
2.751.50
0.50
8.50
0
5
10
15
20
TUR
MEX
RU
S
IDN
IND
ZAF
PH
L
CH
N
BR
A
CO
L
MYS
HU
N
THA
CH
L
PER
PO
L
UKR
Expected for 2021 CurrentP
oli
cy r
ate
s(%
)
17
GLOBAL ECONOMY
EMEs: inflation expectations and monetary policy Inflation expectations and monetary policy in EMEs
Sources: Bloomberg, BCB Focus Report.
Inflation
Several EMEs facing inflation pressures are raising interest rates. Most EMEs remain with inflation expectations anchored.
Inte
rest
rat
e c
han
ge s
ince
Feb
/21
(% Y
oY
)
0.00.51.01.52.02.53.03.54.04.5
Feb-21 Apr-21 Jun-21 Aug-21 Oct-21Brazil +4.25 Russia +2.5 Ukraine +2.5
Chile +2.25 Peru +1.25 Hungary +1.05
Turkey +1 Mexico +0.75 Poland +0.4
Colombia +0.25

18
GLOBAL ECONOMY
Monetary Policy
Sources: Bloomberg, Deutsche Bank.
Monetary Policy
Number of Global Central Bank Decisions - Hikes and Cuts* (rolling 12-month basis)
In terms of global central bank decisions of hikes exceeding cuts, we are now at the highest differential for a decade.
*Sample 21 countries from 1999, 50 from 2005, 60 from 2007, 70 from 2010, 79 from 2013, 80 from 2015.
400
350
300
250
200
150
100
50
0
1998 2000 2002 2004 2006 2008 2010 2012 2014 2016 2018 2020
Hikes Cuts

0
2
4
6
8
10
12
0 1Y 2Y 3Y 4Y 5Y 6Y 7Y 8Y 9Y 10Y
Rat
es
19
GLOBAL ECONOMY
EMEs: interest rates
Sources: Bloomberg.
Emerging Economies
Yield curves (Jan 20 (dashed lines) - Oct 13 (continuous line), 2021)
10y nominal interest rate (%)
BrazilSouth Africa
MexicoRussia
Colombia
2
4
6
8
10
12
14
Jan-
18
Apr
-18
Jul-
18
Oct
-18
Jan-
19
Apr
-19
Jul-
19
Oct
-19
Jan-
20
Apr
-20
Jul-
20
Oct
-20
Jan-
21
Apr
-21
Jul-
21
Oct
-21
%
Brazil South Africa Russia Mexico
Chile Indonesia Colombia
0
200
400
600
1Y 2Y 3Y 4Y 5Y 6Y 7Y 8Y 9Y 10Y
Cha
nge
sin
ce
Jan
21s
t(b
.p.)
Tenor

20
GLOBAL ECONOMY
Real FX rate and terms of trade
Source: Bloomberg
Indexes of effective foreign exchange rate and terms of trade detached
40
60
80
100
120
-20
-10
0
10
20
Brazil
60
80
100
120
-30
0
30
60
Australia
80
90
100
110
-40
-20
0
20
40
60
Chile
50
70
90
110
-5
10
25
40
South Africa
60
80
100
120
-10
0
10
20Canada
50
70
90
110
130
-10
20
50
80
Colombia
-1040
-840
-640
-440
-240
-40
160
360
Aug-18 Feb-19 Aug-19 Feb-20 Aug-20 Feb-21 Aug-21
88
90
92
94
96
98
100
102
104
I II III IV I II III IV I II III IV I II III IV I II III IV I II III IV I II III IV I II
2014 2015 2016 2017 2018 2019 2020 2021
21
DOMESTIC ECONOMY
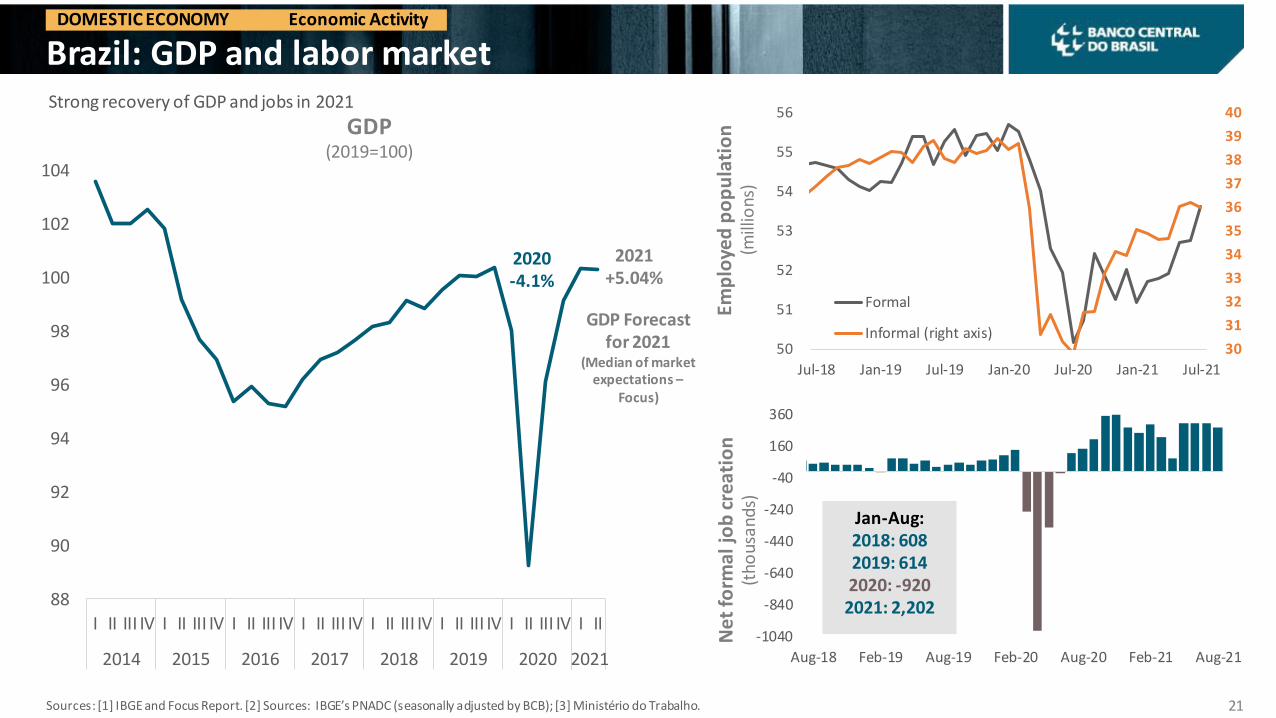
Brazil: GDP and labor market
Sources: [1] IBGE and Focus Report. [2] Sources: IBGE’s PNADC (seasonally adjusted by BCB); [3] Ministério do Trabalho.
Economic Activity
Strong recovery of GDP and jobs in 2021
GDP(2019=100)
2021+5.04%
GDP Forecast for 2021
(Median of market expectations –
Focus)
2020-4.1%
Ne
t fo
rmal
job
cre
atio
n(t
hous
ands
)Em
plo
yed
po
pu
lati
on
(m
illio
ns)
Jan-Aug:2018: 6082019: 6142020: -9202021: 2,202
30
31
32
33
34
35
36
37
38
39
40
50
51
52
53
54
55
56
Jul-18 Jan-19 Jul-19 Jan-20 Jul-20 Jan-21 Jul-21
Formal
Informal (right axis)
22
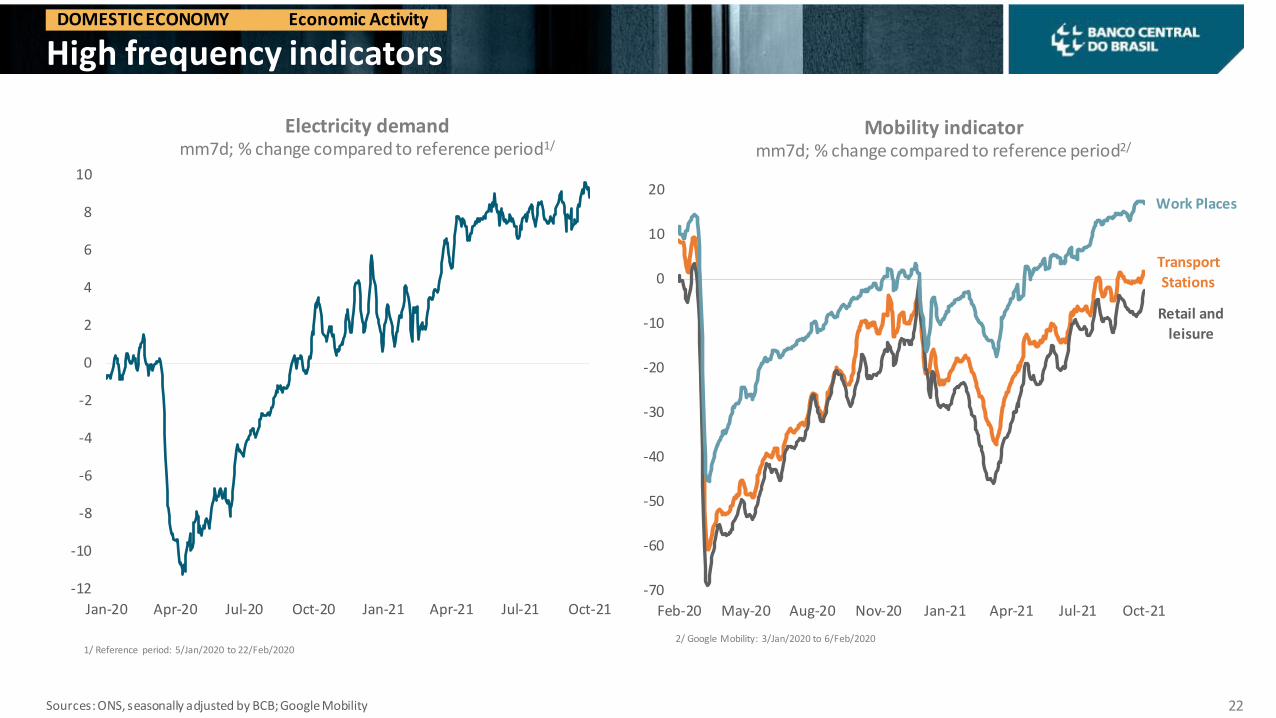
DOMESTIC ECONOMY
High frequency indicators
Sources: ONS, seasonally adjusted by BCB; Google Mobility
Economic Activity
Electricity demandmm7d; % change compared to reference period1/
Mobility indicatormm7d; % change compared to reference period2/
Trocar por indicador de mobilidade colado ao lado (Pedir para Depec)
2/ Google Mobility: 3/Jan/2020 to 6/Feb/20201/ Reference period: 5/Jan/2020 to 22/Feb/2020
-12
-10
-8
-6
-4
-2
0
2
4
6
8
10
Jan-20 Apr-20 Jul-20 Oct-20 Jan-21 Apr-21 Jul-21 Oct-21F
Transport
Stations
Retail and
leisure
Work Places
-70
-60
-50
-40
-30
-20
-10
0
10
20
Feb-20 May-20 Aug-20 Nov-20 Jan-21 Apr-21 Jul-21 Oct-21

55
60
65
70
75
80
85
90
95
100
105
110
115
120
Jan-20 May-20 Sep-20 Jan-21 May-21 Sep-21
Consumer
Manufacturing
Services
Construction
Retail
50
55
60
65
70
75
80
85
90
95
100
105
110
115
120
Jan-20 May-20 Sep-20 Jan-21 May-21 Sep-21
23
DOMESTIC ECONOMY
Confidence indicators
Source: FGV. Seasonally adjusted data.
Economic Activity
Business confidence X consumer confidence Consumer confidenceBy income range (in BRL thousand)
Average 2018-2019=
100
> R$ 9.6 thousand
R$ 4.8 to 9.6 thousand
R$ 2.1 to 4.8 thousand
< R$ 2.1 thousand
Average 2018-2019=
100

24
DOMESTIC ECONOMY
Consumer inflation
Sources: IBGE, BCB.
Inflation
10.25
6.4
0
1
2
3
4
5
6
7
8
9
10
11
Sep-14 Sep-15 Sep-16 Sep-17 Sep-18 Sep-19 Sep-20 Sep-21
IPCA Average of core inflation measures Target
IPCA and target (% YoY) Inflation segments (% YoY)
-6
-2
2
6
10
14
18
22
Sep-14 Sep-15 Sep-16 Sep-17 Sep-18 Sep-19 Sep-20 Sep-21
Administered prices Services
Industrial goods Food at home

Services, 2.73%
Underlying services, 3.77%
1%
2%
3%
4%
5%
6%
7%
8%
9%
10%
Sep-14 Sep-15 Sep-16 Sep-17 Sep-18 Sep-19 Sep-20 Sep-21
25
DOMESTIC ECONOMY
CPI: Services
Source: BCB, based on IBGE.
Inflation
CPI: Services (%) (24-month accumulated, annualized)

26
DOMESTIC ECONOMY
CPI: Surprises and decomposition
Sources: IBGE, BCB.
Inflation
-0.2
0.0
0.2
0.4
0.6
0.8
1.0
1.2
1.4
Sep-20 Nov-20 Jan-21 Mar-21 May-21 Jul-21 Sep-21
Administered
Services
IndustrialGoods
Food athome
CPI surprises (% MoM) Contribution to MoM change (in p.p.)
The date of the projections (in September, December, March and June) corresponds to the cutoff date of the Central Bank of Brazil Inflation Report.
0.0
0.2
0.4
0.6
0.8
1.0
1.2
1.4
Sep
-20
Oct
-20
No
v-20
Dec
-20
Jan
-21
Feb
-21
Mar
-21
Ap
r-21
May
-21
Jun-
21
Jul-2
1
Au
g-21
Sep
-21
Forecasts in Sep/20 Forecasts in Dec/20 Forecasts in Mar/21 Forecasts in Jun/21 For. InSep/21
IPCA BCB forecast Market expectations (Focus)

27
DOMESTIC ECONOMY
Inflation expectations for CPI
Source: BCB (Focus Report)
Inflation
Market expectations – Focus (% p.y.)
8.59%
4.17%
3.25%
2.5%
3.0%
3.5%
4.0%
4.5%
5.0%
5.5%
6.0%
6.5%
7.0%
7.5%
8.0%
8.5%
9.0%
Aug-19 Jan-20 Jun-20 Nov-20 Apr-21 Sep-21
2021
2022
2023

28
DOMESTIC ECONOMY
Monetary policy
• In its 241st meeting, the Copom unanimously decided to increase the Selic rate by 1.00 p.p. to 6.25%p.a.
• The Committee judges that this decision reflects its baseline scenario for prospective inflation, a higher-than-usual variance in the balance of risks, and is consistent with the convergence of inflation to its target over therelevant horizon for monetary policy, which includes 2022 and, to a lesser extent, 2023.
• The Committee considers that, at the present stage of the tightening cycle, this pace is the most appropriate toguarantee inflation convergence to the target at the relevant horizon and, simultaneously, allow the Committeeto obtain more information regarding the state of the economy and the persistence of shocks.
• At this moment, the Copom's baseline scenario and balance of risks indicate as appropriate to advance theprocess of monetary tightening further into the restrictive territory.
• For the next meeting, the Committee foresees another adjustment of the same magnitude. The Copomemphasizes that its future policy steps could be adjusted to ensure the achievement of the inflation target andwill depend on the evolution of economic activity, on the balance of risks, and on inflation expectations andprojections for the relevant horizon for monetary policy.
241st Copom Meeting – September 2021
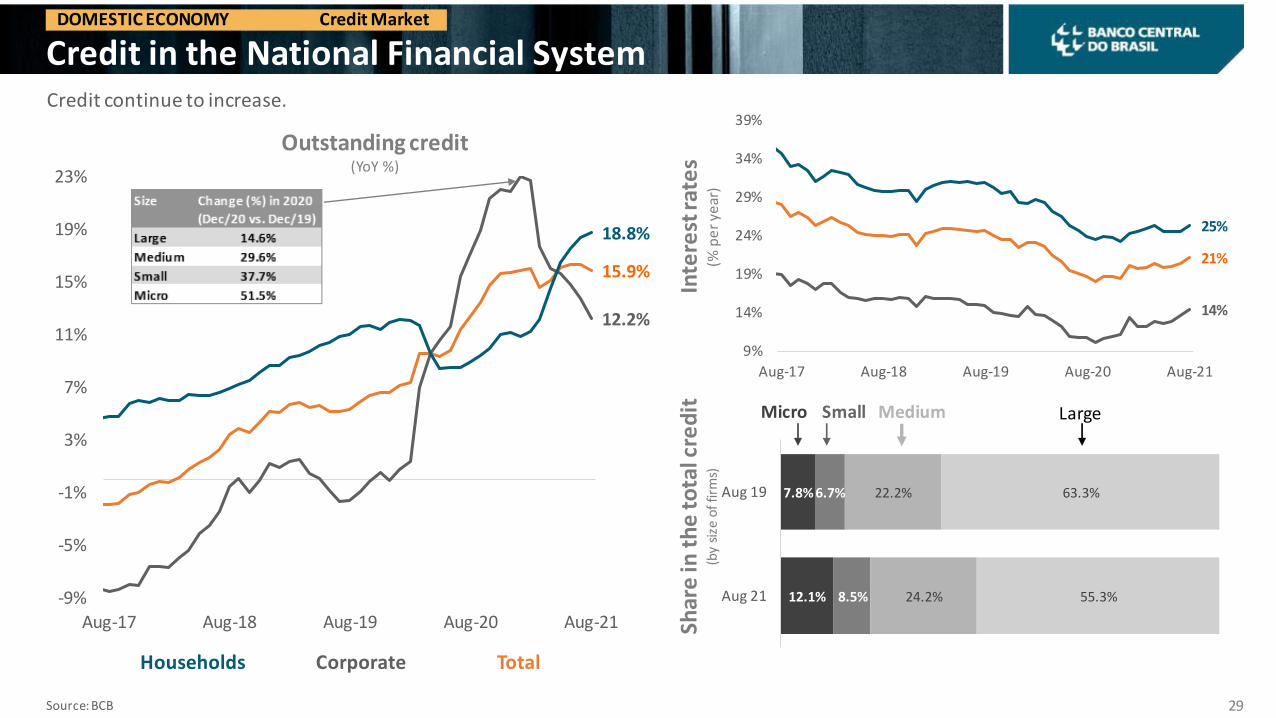
15.9%
12.2%
18.8%
-9%
-5%
-1%
3%
7%
11%
15%
19%
23%
Aug-17 Aug-18 Aug-19 Aug-20 Aug-21
29
DOMESTIC ECONOMY
Credit in the National Financial System
Source: BCB
Credit Market
Credit continue to increase.
Outstanding credit(YoY %)
Inte
rest
rate
s(%
pe
r ye
ar)
Households Corporate Total
Shar
e in
th
e t
ota
l cre
dit
(by
size
of f
irm
s)
21%
14%
25%
9%
14%
19%
24%
29%
34%
39%
Aug-17 Aug-18 Aug-19 Aug-20 Aug-21
Cen
ten
as
7.8%
12.1%
6.7%
8.5%
22.2%
24.2%
63.3%
55.3%
Aug 19
Aug 21
Micro Small Medium Large

2018
2019
2020
2021
0
40
80
120
160
200
Jan Feb Mar Apr May Jun Jul Aug Sep Oct Nov Dec
30
DOMESTIC ECONOMY
Corporate Credit
Source: B3. (*) until September 27th, 2021.
Spre
ads
Seco
nd
ary
Mar
ket
(%
)
Da
ily v
olu
me
Se
con
dar
y M
arke
t -
(BR
L B
illi
on
s)Accumulated Primary Emissions(BRL Billions)
Emissions Jan-Sep:2018: 119 bi2019: 137 bi2020: 74 bi
2021: 150.4 bi (*)
DOMESTIC ECONOMY Credit Market
0
1
1
2
2
3
3
4
4
5
5
Jan-18 Dec-18 Nov-19 Oct-20 Sep-21
Trading volume MM 60 (without CVRDA6) MM 60
1.51.6
0
1
2
3
4
jan-20 mai-20 set-20 jan-21 mai-21 set-21
AA-A
B-C-D

31
General Government Gross Debt (GGGD)
Source: STN, BCB
Economic ActivityDOMESTIC ECONOMY Fiscal
GGGD/GDP 2021 forecast(Focus median)
%
GGGD/GDP 2021 Focus forecast* (disaggregated)
%
Updated to 10/01/21
* Approximate decomposition of the Focus median forecast evolution for GGGD/GDP. Each variable median isconsidered separately. GDB deflator constructed from Focus CPI forecast. Interest expenditure implicitly calculated
from primary and nominal fiscal results forecast. “Others” are residuals (approximations, methodological compatibility,etc.).
Nov 3rd 2020 Forecast Real GDP
denominatorDenominator
deflator
Primary deficit
reduction forecast
Interests expenditure
increase forecast
OthersSep 19th 2021
Forecast
95.8
-2.3
-6.7
-4.0
1.3
-2.1
82.0
81
83
85
87
89
91
93
95
97
nov-20 jan-21 mar-21 mai-21 jul-21 set-21

9495
100
74
89
82
8382
70
75
80
85
90
95
100
2019 2020 2021 2022 2023 2024 2025 2026 2027 2028 2029 2030
20/11/20 1/10/21
32
General Government Gross Debt (GGGD)
Source: BCB (Focus report) – Updated to 10/01/21.
Economic ActivityDOMESTIC ECONOMY Fiscal
%
November 2020 Current
Evolution of GGGD/GDP forecast(median of market analysts forecast – Focus)

33

BCB’s S&E responsabilityRegulationSupervisionPartnerships
Financial education
Rural creditHousing creditRelationship with CongressTransparency of Monetary PolicyCommunication plan for BCB actionsRelationship with foreign investorsDigital Citizenship
InnovationMarket efficiencyInternational reserves
Cooperative creditMicrocreditCurrency convertibilityInitiatives for capital market
34

TechnologyAgenda
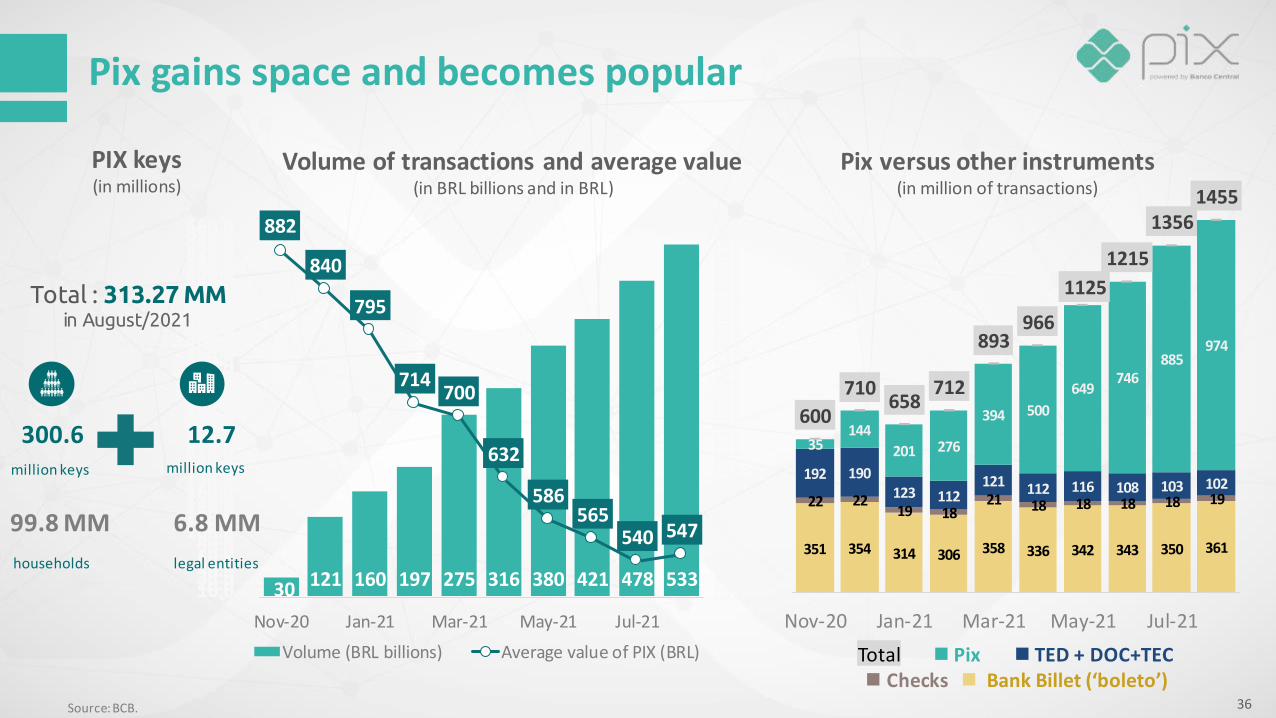
30 121 160 197 275 316 380 421 478 533
882
840
795
714700
632
586565
540 547
500.0510.0520.0530.0540.0550.0560.0570.0580.0590.0600.0610.0620.0630.0640.0650.0660.0670.0680.0690.0700.0710.0720.0730.0740.0750.0760.0770.0780.0790.0800.0810.0820.0830.0840.0850.0860.0870.0880.0890.0900.0910.0
- 10.0 20.0 30.0 40.0 50.0 60.0 70.0 80.0 90.0 100.0 110.0 120.0 130.0 140.0 150.0 160.0 170.0 180.0 190.0 200.0 210.0 220.0 230.0 240.0 250.0 260.0 270.0 280.0 290.0 300.0 310.0 320.0 330.0 340.0 350.0 360.0 370.0 380.0 390.0 400.0 410.0 420.0 430.0 440.0 450.0 460.0 470.0 480.0 490.0 500.0 510.0 520.0 530.0 540.0 550.0 560.0
Nov-20 Jan-21 Mar-21 May-21 Jul-21
Volume (BRL billions) Average value of PIX (BRL)
351 354 314 306 358 336 342 343 350 361
22 2219 18
21 18 18 18 18 19
192 190123 112
121 112 116 108 103 102
35144
201 276
394 500
649746
885974
600
710658
712
893966
1125
1215
13561455
Nov-20 Jan-21 Mar-21 May-21 Jul-21
Pix gains space and becomes popular
36Source: BCB.
households
million keys
Total : 313.27 MMin August/2021
PIX keys(in millions)
99.8 MM
300.6
6.8 MM
12.7
legal entities
Volume of transactions and average value(in BRL billions and in BRL)
Pix versus other instruments(in million of transactions)
Total ◼ Pix ◼ TED + DOC+TEC ◼ Checks ◼ Bank Billet (‘boleto’)
million keys

Pix: Evolution Agenda
3rd quarter 2022
4th quarter
Pix Saque (cash
withdrawal) and Pix Troco (cashback)
Payment Initiation Service Provider –PISP**
Special Return Mechanism(for fraud or operational error)
New ways to initiate• Payer QR Code Technology• Enable contactless transactions• Enable offline payments
Pix Cobrança• Additional Feature Set• Structural Improvements
Direct Debit***
Scheduled guaranteed transactions***
Pix for cross-border payments
[...]
*became mandatory **linked to Open Finance ***Publication of Operating Rules by BCB, Go Live to be defined
Future Agenda
Pix Cobrança
(invoice payments for payments with due date)
2nd quarter
Scheduled payments*
AGENDA BC#
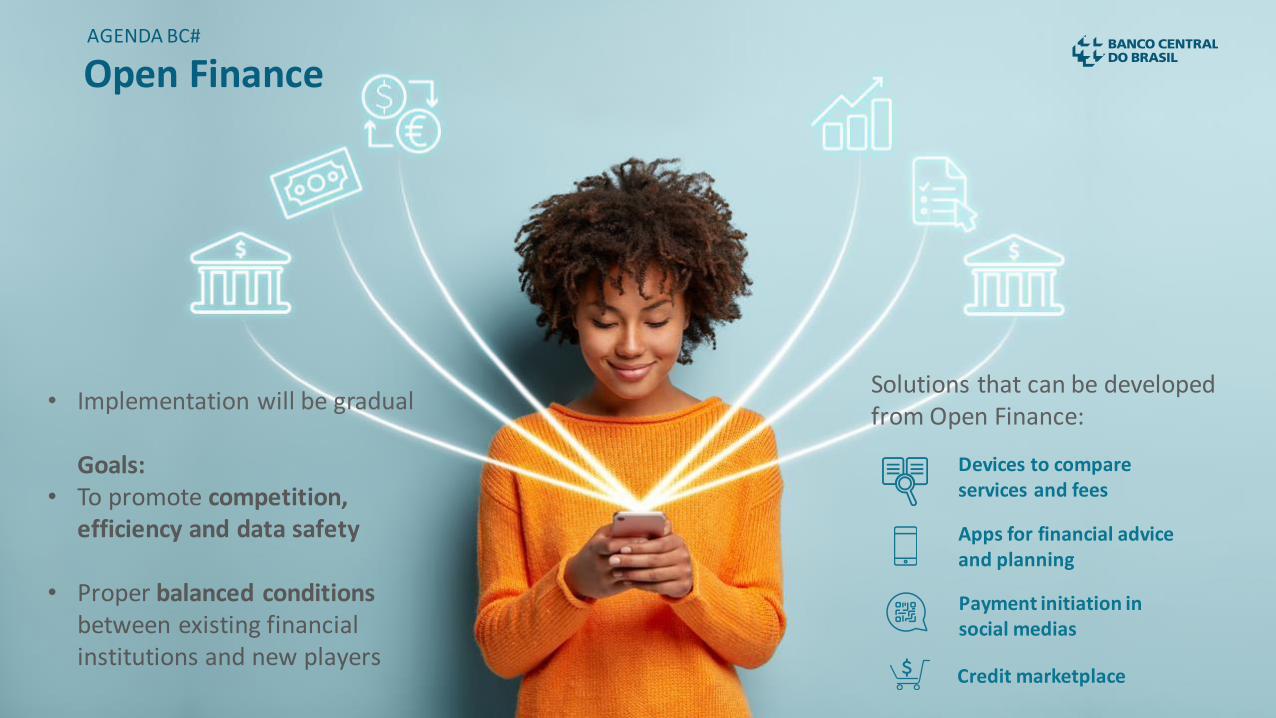
Open Finance
• Implementation will be gradual
Goals: • To promote competition,
efficiency and data safety
• Proper balanced conditions between existing financial institutions and new players
Solutions that can be developed from Open Finance:
Devices to compare services and fees
Apps for financial advice and planning
Payment initiation in social medias
Credit marketplace
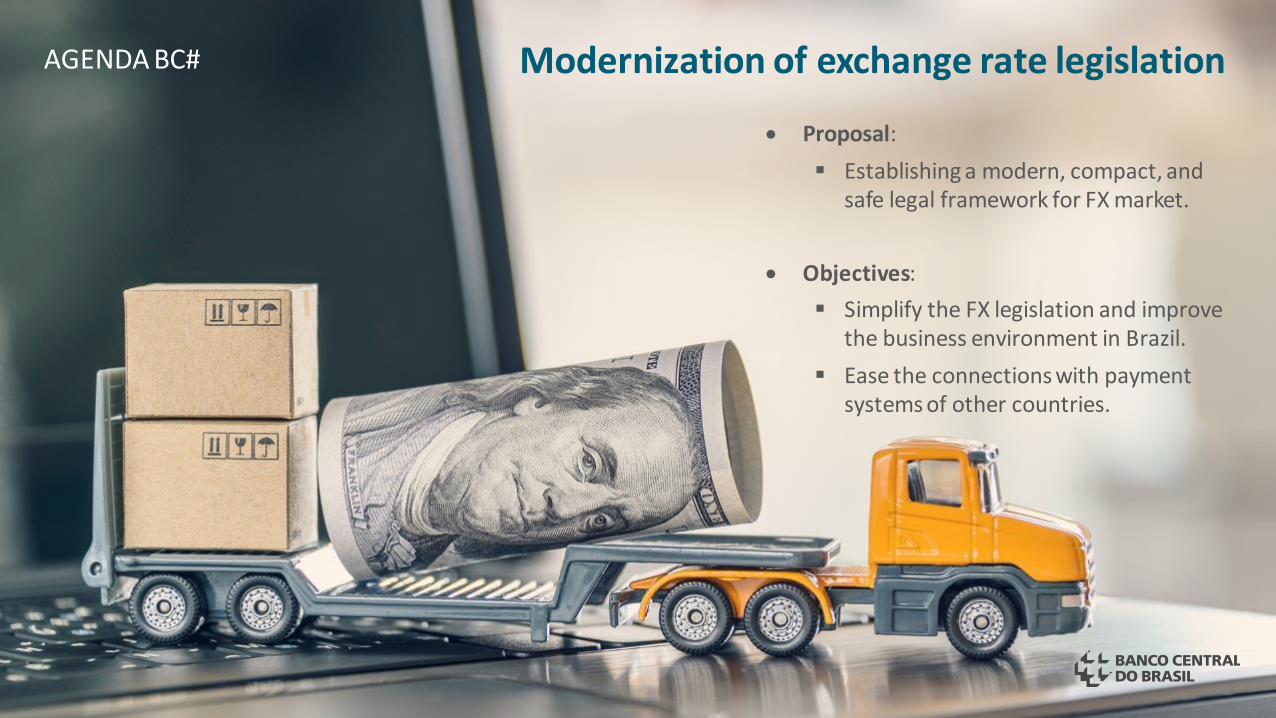
• Proposal:
▪ Establishing a modern, compact, and safe legal framework for FX market.
• Objectives:
▪ Simplify the FX legislation and improve the business environment in Brazil.
▪ Ease the connections with payment systems of other countries.
Modernization of exchange rate legislationAGENDA BC#

40
AGENDA BC#
Regulatory Sandbox
BCB’s Regulatory Sandbox starts in 2021 with the Cycle 1.
During the sandbox licensing process, BCB will assess whether the submitted projects comply with the definition of innovative project and whether their development is under the regulatory scope of BCB and CMN, among other criteria.
Legal persons, notary and registration service providers, public companies, and semi-public companies can participate, even when not yet fully licensed by BCB.
Simplified monitoring procedures will be adopted, considering the complexity and risks associated to each innovative project and, should BCB deems appropriate, additional limits and criteria may be applied.
By the end of cycle 1, participants may obtain a permanent license from BCB to operate. The projects may be a stepping stone for the improvement of the regulation issued by BCB and CMN.
TO UNDERSTAND THE REGULATORY SANDBOX
41
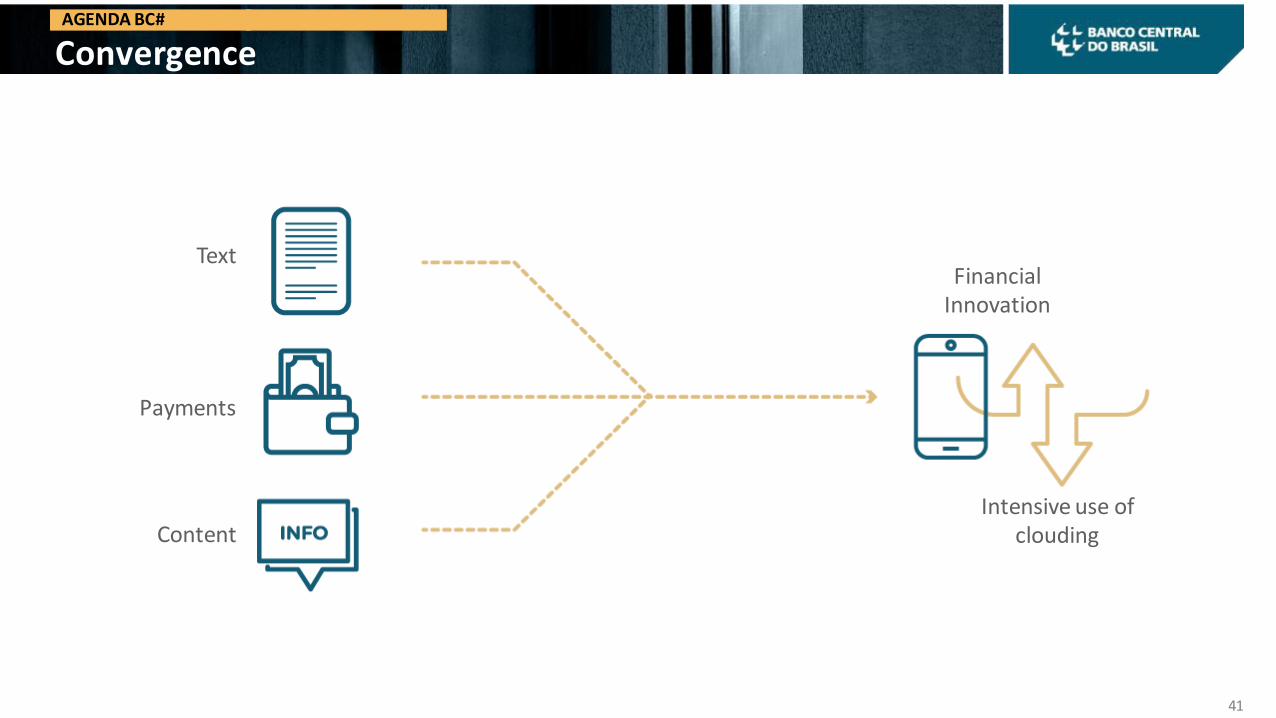
Convergence
Financial Innovation
Intensive use of clouding
Payments
Content
Text
AGENDA BC#

42
Innovation in the financial system
• Simplification• Internationalization• Convertibility
Digital currencyOpen Finance
Innovation in the currency
AGENDA BC#

A CBDC for Brazil:
The Digital Real
Guidelines:
• Extension of the Brazilian real
• Retail payments
• Innovative models development
• Not be interest-bearing
• Guarantee of legal certainty
• Data privacy and security
• Preventing and combating money laundering
• Interoperability and integration
• High cyber security
bcb.gov.br
SustainabilityMeasures:
• BCB’s S&E Responsibility
• Partnerships
• Policies
• Supervision
• Regulation
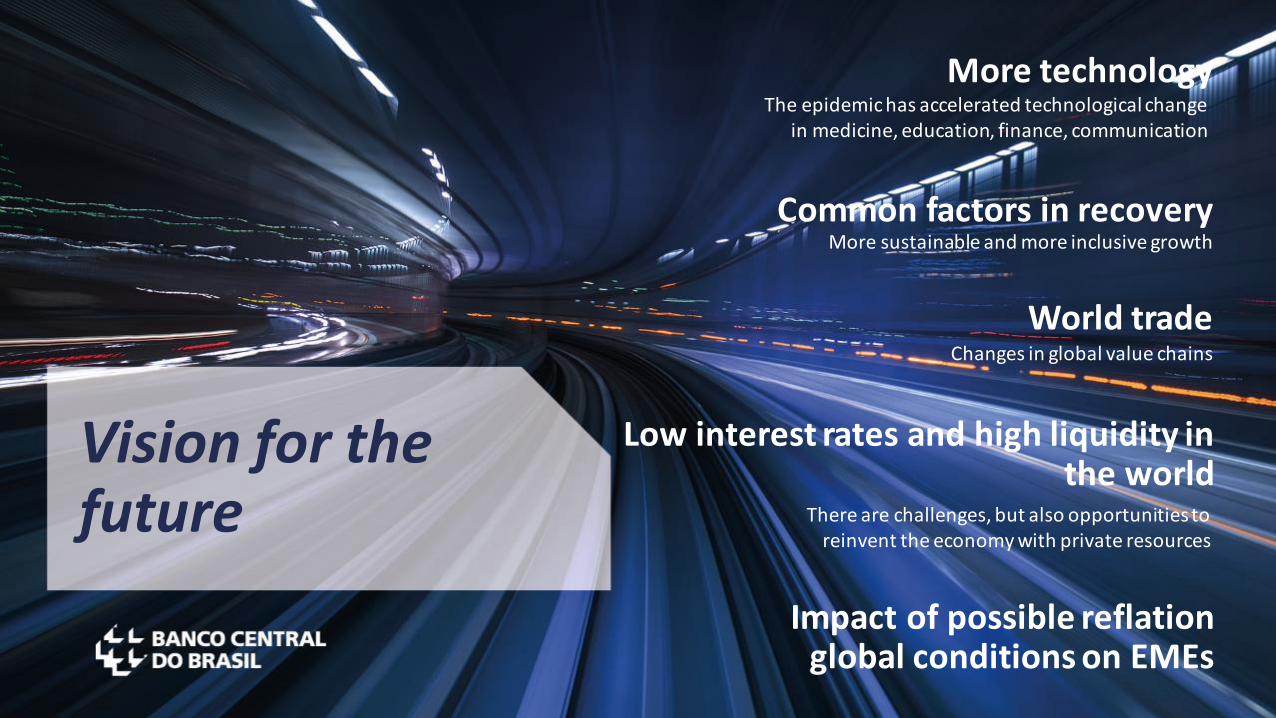
Common factors in recoveryMore sustainable and more inclusive growth
More technologyThe epidemic has accelerated technological change
in medicine, education, finance, communication
Low interest rates and high liquidity in the world
There are challenges, but also opportunities to reinvent the economy with private resources
Changes in global value chains
World trade
Vision for the future
Impact of possible reflation global conditions on EMEs

bcb.gov.br
Thank you!Roberto Campos Neto
Governor of Banco Central do BrasilOctober 15, 2021
Related Documents