FOR NORTH AMERICAN POWER CREDIT ORGANIZATION’S USE - NOT FOR FURTHER USE AND/OR DISTRIBUTION TO THE GENERAL PUBLIC. Goldman Sachs Asset Management Industry Study Utility Pension Plan Study Global Portfolio Solutions February 2020 THESE MATERIALS ARE PROVIDED SOLELY ON THE BASIS THAT THEY WILL NOT CONSTITUTE INVESTMENT ADVICE AND WILL NOT FORM A PRIMARY BASIS FOR ANY PERSON'S OR PLAN'S INVESTMENT DECISIONS, AND GOLDMAN SACHS IS NOT A FIDUCIARY WITH RESPECT TO ANY PERSON OR PLAN BY REASON OF PROVIDING THE MATERIAL OR CONTENT HEREIN. PLAN FIDUCIARIES SHOULD CONSIDER THEIR OWN CIRCUMSTANCES IN ASSESSING ANY POTENTIAL INVESTMENT COURSE OF ACTION. INFORMATION CONTAINED IN THESE MATERIALS IS PROVIDED TO PLAN FIDUCIARIES SOLEY FOR THEIR USE IN THEIR CAPACITY AS PLAN FIDUCIARIES. ANY INFORMATION ON MATTERS RELATING TO PLAN SPONSOR CONCERNS IS PROVIDED SOLELY FOR EDUCATIONAL PURPOSES.

Welcome message from author
This document is posted to help you gain knowledge. Please leave a comment to let me know what you think about it! Share it to your friends and learn new things together.
Transcript

FOR NORTH AMERICAN POWER CREDIT ORGANIZATION’S USE - NOT FOR FURTHER USE AND/OR DISTRIBUTION TO THE GENERAL PUBLIC.
Goldman Sachs Asset Management Industry Study Utility Pension Plan Study
Global Portfolio SolutionsFebruary 2020
THESE MATERIALS ARE PROVIDED SOLELY ON THE BASIS THAT THEY WILL NOT CONSTITUTE INVESTMENT ADVICE AND WILL NOT FORM A PRIMARY BASIS FOR ANY PERSON'SOR PLAN'S INVESTMENT DECISIONS, AND GOLDMAN SACHS IS NOT A FIDUCIARY WITH RESPECT TO ANY PERSON OR PLAN BY REASON OF PROVIDING THE MATERIAL ORCONTENT HEREIN. PLAN FIDUCIARIES SHOULD CONSIDER THEIR OWN CIRCUMSTANCES IN ASSESSING ANY POTENTIAL INVESTMENT COURSE OF ACTION. INFORMATIONCONTAINED IN THESE MATERIALS IS PROVIDED TO PLAN FIDUCIARIES SOLEY FOR THEIR USE IN THEIR CAPACITY AS PLAN FIDUCIARIES. ANY INFORMATION ON MATTERSRELATING TO PLAN SPONSOR CONCERNS IS PROVIDED SOLELY FOR EDUCATIONAL PURPOSES.

1FOR NORTH AMERICAN POWER CREDIT ORGANIZATION'S USE - NOT FOR FURTHER USE AND/OR DISTRIBUTION TO THE GENERAL PUBLIC.
Table of Contents
I. Executive Summary
II. GSAM Industry Study
III. Proposed Capital Efficiency Strategy
Appendix A: Assumptions and Methodology
Appendix B: US Shareholder-Owned Public Utilities Used in this Study
Appendix C: GSAM Contact List

FOR NORTH AMERICAN POWER CREDIT ORGANIZATION'S USE - NOT FOR FURTHER USE AND/OR DISTRIBUTION TO THE GENERAL PUBLIC.
I. Executive Summary

3FOR NORTH AMERICAN POWER CREDIT ORGANIZATION'S USE - NOT FOR FURTHER USE AND/OR DISTRIBUTION TO THE GENERAL PUBLIC.
Executive Summary
Source: GSAM as of 12/31/2018. 1Statistics from the DOL, per slide 9. Expected returns are estimates of hypothetical average returns of economic asset classes derived from statistical models. There can be no assurance that these returns can be achieved. Actual returns are likely to vary. The economic and market forecasts presented herein have been generated by GSAM for informational purposes as of the date of this presentation. They are based on proprietary models and there can be no assurance that the forecasts will be achieved. Please see additional disclosures at the end of this presentation. Please see additional disclosures. All illustrations of funded status, surplus and related funding information in this material are based on actuarial data provided by your actuary where appropriate. Illustrations reflect one possible outcome and reflect a number of assumptions which are disclosed therein. Goldman Sachs is not providing actuarial services in connection with providing the information contained therein.
Views and opinions expressed are for informational purposes only and do not constitute a recommendation by GSAM to buy, sell, or hold any security. Views and opinions are current as of the date of this presentation and may be subject to change, they should not be construed as investment advice.
GSAM analyzed the financial statements of 44 publicly traded utility companies for the year-end 2018. The key findings are:
Defined benefit (“DB”) plan funded status for the utility industry decreased from 87% to 86%, year-over-year, due to poor asset performance, despite an increase in discount rates
Unfortunately, the financial risks found in the DB plans for the industry remain material, due to the mismatch between plan assets and plan liabilities, representing a potential loss for the industry in excess of $71BN over the next seven years
Based on the analysis, the current weighted average strategic asset allocation across the industry is:
41% Equities, 43% Fixed Income, and 16% in Alternatives and Other; resulting in a weighted average expected return of 7.13%
Given that few plans within the industry have been frozen (approximately 13.5%1), liabilities are growing at roughly 6.7%, when adding the industry weighted average discount rate (4.4%) and service cost (2.3%), industry plan assets will likely struggle to keep up with growing liabilities, when incorporating the current deficit and PBGC Variable Rate Premiums
GSAM believes the industry plans may benefit by adopting a ‘capital efficient’ strategy that reduces interest rate risk via derivative overlays and re-deploys low yielding fixed income assets into higher yielding assets, all on a risk-neutral basis
FOR NORTH AMERICAN POWER CREDIT ORGANIZATION'S USE - NOT FOR FURTHER USE AND/OR DISTRIBUTION TO THE GENERAL PUBLIC.
II. GSAM Industry Study
5FOR NORTH AMERICAN POWER CREDIT ORGANIZATION'S USE - NOT FOR FURTHER USE AND/OR DISTRIBUTION TO THE GENERAL PUBLIC.
GSAM Industry Study
1 Source: Bloomberg and 10-K (2007-2018) as of 12/31/2018. For a complete list of utility peer group members used in this analysis, see Appendix. All illustrations of funded status, surplus and related funding information in this material are based on actuarial data provided by your actuary where appropriate. Illustrations reflect one possible outcome and reflect a number of assumptions which are disclosed therein. Goldman Sachs is not providing actuarial services in connection with providing the information contained therein.For Illustrative Purposes Only. Goldman Sachs does not provide accounting, tax or legal advice. Please see additional disclosures at the end of this presentation. The portfolio risk management process includes an effort to monitor and manage risk, but does not imply low risk. Past performance does not guarantee future results, which may vary.
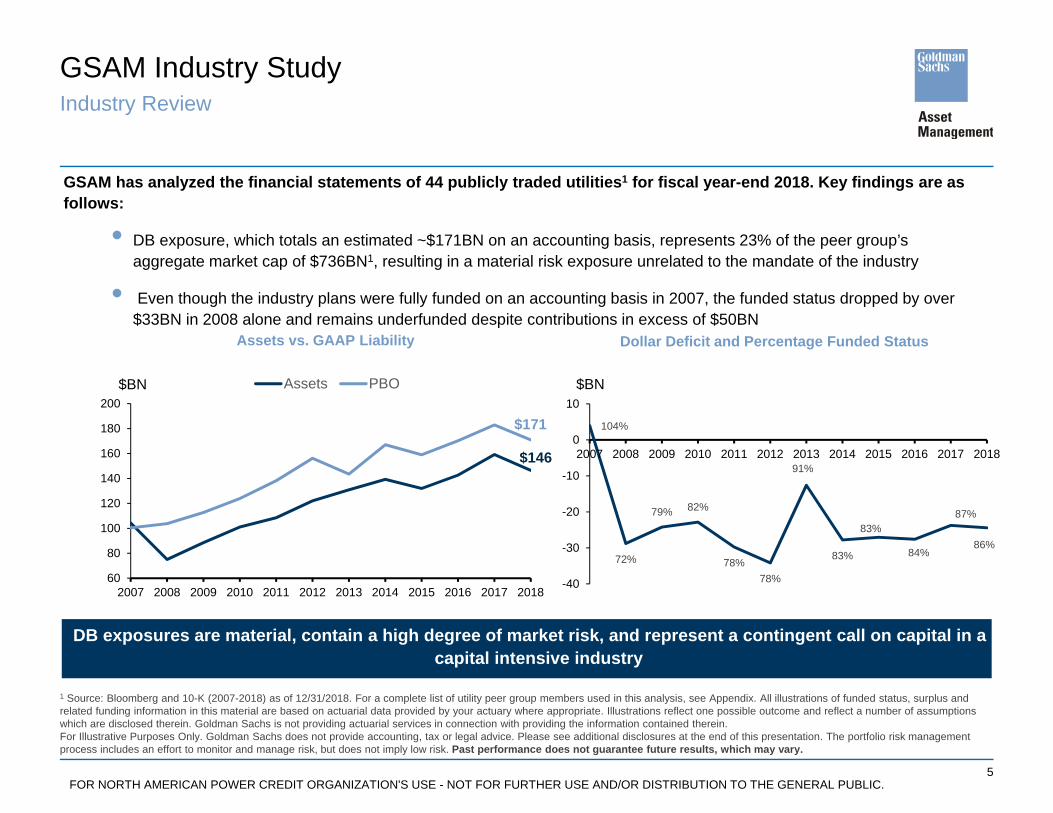
GSAM has analyzed the financial statements of 44 publicly traded utilities1 for fiscal year-end 2018. Key findings are as follows:
• DB exposure, which totals an estimated ~$171BN on an accounting basis, represents 23% of the peer group’s aggregate market cap of $736BN1, resulting in a material risk exposure unrelated to the mandate of the industry
• Even though the industry plans were fully funded on an accounting basis in 2007, the funded status dropped by over $33BN in 2008 alone and remains underfunded despite contributions in excess of $50BN
DB exposures are material, contain a high degree of market risk, and represent a contingent call on capital in a capital intensive industry
Assets vs. GAAP Liability Dollar Deficit and Percentage Funded Status
Industry Review
$171
60
80
100
120
140
160
180
200
2007 2008 2009 2010 2011 2012 2013 2014 2015 2016 2017 2018
Assets PBO$BN
$146
104%
72%
79% 82%
78%78%
91%
83%
83%
84%
-40
-30
-20
-10
0
10
2007 2008 2009 2010 2011 2012 2013 2014 2015 2016 2017 2018
$BN
87%
86%

6FOR NORTH AMERICAN POWER CREDIT ORGANIZATION'S USE - NOT FOR FURTHER USE AND/OR DISTRIBUTION TO THE GENERAL PUBLIC.
(80)
(60)
(40)
(20)
0
20
40
60
80
100
120
2007 2008 2009 2010 2011 2012 2013 2014 2015 2016 2017 2018Fund
ed s
tatu
s ($
BN
)
5th and 95th percentile Expected Actual
Expected funded status
Actual funded status
GSAM Industry Study
1 Source: 10-K filings as of 12/31/2018. Peer group includes the 44 companies outlined on slide 17. These examples are for illustrative purposes only and are not actual results. If any assumptions used do not prove to be true, results may vary substantially. Views and opinions expressed are for informational purposes only and do not constitute a recommendation by GSAM to buy, sell, or hold any security. Views and opinions are current as of the date of this presentation and may be subject to change, they should not be construed as investment advice. Past performance does not guarantee future results, which may vary. All illustrations of funded status, surplus and related funding information in this material are based on actuarial data provided by your actuary where appropriate. Illustrations reflect one possible outcome and reflect a number of assumptions which are disclosed therein. Goldman Sachs is not providing actuarial services in connection with providing the information contained therein. Goldman Sachs is not providing actuarial services in connection with providing the information contained therein. See appendix for assumptions
Since FYE 2007, the industry underperformed expectations primarily due to falling interest rates ($34BN) and lower than anticipated asset returns ($31BN) despite $21BN of contributions in excess of service cost 1
Since FYE 2007, the industry underperformed expectations primarily due to falling interest rates ($34BN) and lower than anticipated asset returns ($31BN) despite $21BN of contributions in excess of service cost 1
$56 BN
Industry Attribution Analysis of Underperformance
FYE 2018 Funded Status vs. Expectations1 Since FYE 2007
Beginning 12/31/2007 ($BN) Expected Actual DifferenceBeginning assets 100 100 Beginning liabilities 96 96 Beginning funded status 4 4
Changes in assets onlyBenefit payments (85) (85)Contributions 34 55 21 Asset returns 100 69 (31)Other 0 8 8 Total changes in assets 49 46 (2)
Changes in liabilities onlyBenefit payments (85) (85)Service cost 34 34 Interest cost 72 72 Liability change due to market factors 0 34 34 Liability change due to demographics 0 8 8 Other 0 12 12 Total changes in liabilities 21 74 53
Ending assets 149 146 (2)Ending liabilities 117 171 53 Ending funded status as of 12/31/2018 31 (24) (56)Total change in funded status 28 (28) (56)
7FOR NORTH AMERICAN POWER CREDIT ORGANIZATION'S USE - NOT FOR FURTHER USE AND/OR DISTRIBUTION TO THE GENERAL PUBLIC.
41%43%
16%
31%
48%
21%
0%
10%
20%
30%
40%
50%
60%
Equities Fixed Income Alts/Cash/Other
Utilities S&P 500
GSAM Industry Study
1Based on Company 10-K filings as of 12/31/2018. 2 Best and worst case scenarios based on a 1.645 standard deviation move (i.e., 95% confidence interval), funded status volatility of 11% and contributions equal to service cost. Based on Company 10-K filings. See Appendix for details. Peer group includes the 44 companies outlined on slide 17. Goldman Sachs does not provide accounting, tax or legal advice. Please see additional disclosures at the end of this presentation. Targets are subject to change and are current as of the date of this presentation. Targets are objectives and do not provide any assurance as to future results. These examples are for illustrative purposes only and are not actual results. If any assumptions used do not prove to be true, results may vary substantially. The economic and market forecasts presented herein have been generated by GSAM for informational purposes as of the date of this presentation. They are based on proprietary models and there can be no assurance that the forecasts will be achieved. Please see additional disclosures at the end of this presentation. All illustrations of funded status, surplus and related funding information in this material are based on actuarial data provided by your actuary where appropriate. Illustrations reflect one possible outcome and reflect a number of assumptions which are disclosed therein. Goldman Sachs is not providing actuarial services in connection with providing the information contained therein. Past performance does not guarantee future results, which may vary.
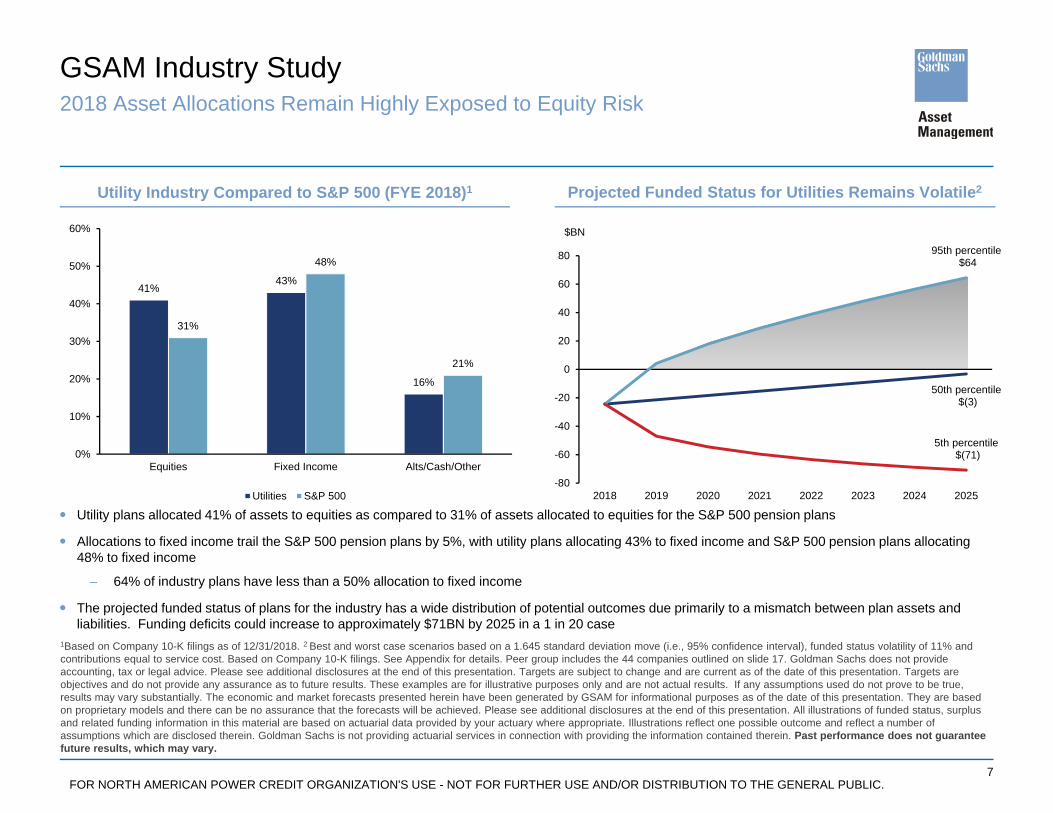
2018 Asset Allocations Remain Highly Exposed to Equity Risk
Projected Funded Status for Utilities Remains Volatile2Utility Industry Compared to S&P 500 (FYE 2018)1
Utility plans allocated 41% of assets to equities as compared to 31% of assets allocated to equities for the S&P 500 pension plans
Allocations to fixed income trail the S&P 500 pension plans by 5%, with utility plans allocating 43% to fixed income and S&P 500 pension plans allocating 48% to fixed income
– 64% of industry plans have less than a 50% allocation to fixed income
The projected funded status of plans for the industry has a wide distribution of potential outcomes due primarily to a mismatch between plan assets and liabilities. Funding deficits could increase to approximately $71BN by 2025 in a 1 in 20 case
50th percentile$(3)
95th percentile$64
5th percentile$(71)
-80
-60
-40
-20
0
20
40
60
80
2018 2019 2020 2021 2022 2023 2024 2025
$BN
8FOR NORTH AMERICAN POWER CREDIT ORGANIZATION'S USE - NOT FOR FURTHER USE AND/OR DISTRIBUTION TO THE GENERAL PUBLIC.
GSAM Industry Study
Source: Company 10-K filings as of 12/31/2018. Peer group includes the 44 companies outlined on slide 17. Past results are not necessarily indicative of future results. Views and opinions expressed are for informational purposes only and do not constitute a recommendation by GSAM to buy, sell, or hold any security. Views and opinions are current as of the date of this presentation and may be subject to change, they should not be construed as investment advice. These examples are for illustrative purposes only and are not actual results. If any assumptions used do not prove to be true, results may vary substantially. Please see additional disclosures.
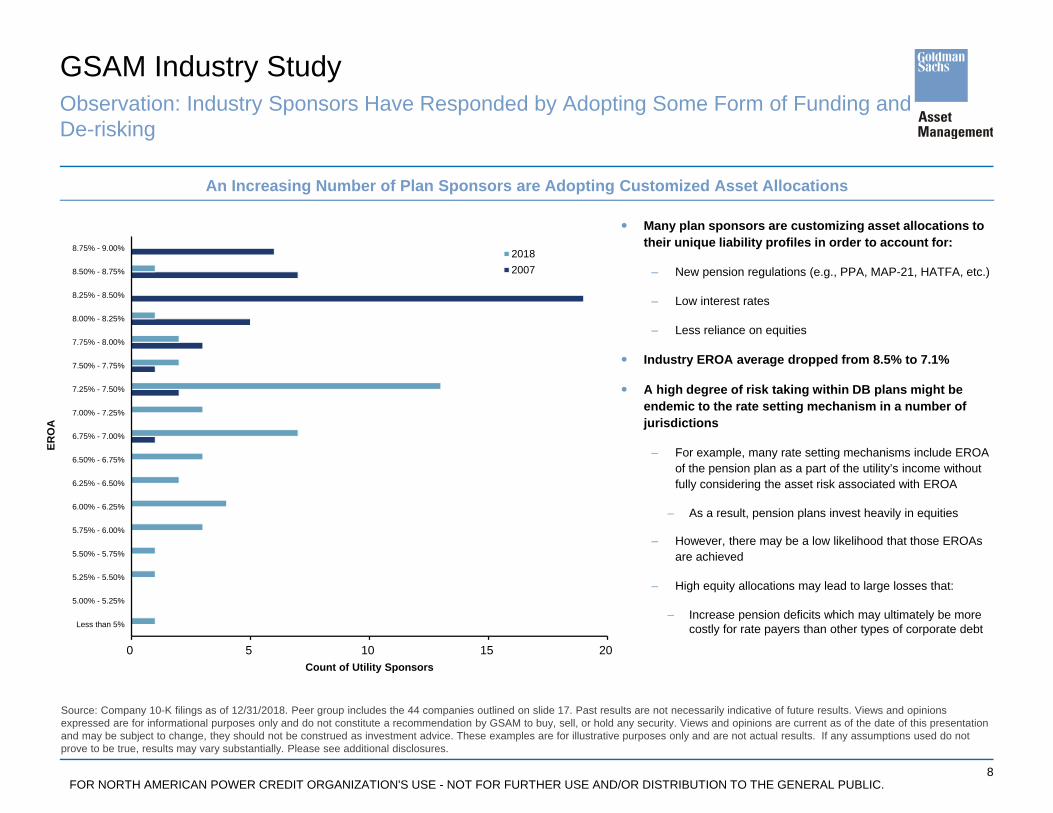
Many plan sponsors are customizing asset allocations to their unique liability profiles in order to account for:
– New pension regulations (e.g., PPA, MAP-21, HATFA, etc.)
– Low interest rates
– Less reliance on equities
Industry EROA average dropped from 8.5% to 7.1%
A high degree of risk taking within DB plans might be endemic to the rate setting mechanism in a number of jurisdictions
– For example, many rate setting mechanisms include EROA of the pension plan as a part of the utility’s income without fully considering the asset risk associated with EROA
– As a result, pension plans invest heavily in equities
– However, there may be a low likelihood that those EROAs are achieved
– High equity allocations may lead to large losses that:
– Increase pension deficits which may ultimately be more costly for rate payers than other types of corporate debt
Observation: Industry Sponsors Have Responded by Adopting Some Form of Funding and De-risking
An Increasing Number of Plan Sponsors are Adopting Customized Asset Allocations
0 5 10 15 20
Less than 5%
5.00% - 5.25%
5.25% - 5.50%
5.50% - 5.75%
5.75% - 6.00%
6.00% - 6.25%
6.25% - 6.50%
6.50% - 6.75%
6.75% - 7.00%
7.00% - 7.25%
7.25% - 7.50%
7.50% - 7.75%
7.75% - 8.00%
8.00% - 8.25%
8.25% - 8.50%
8.50% - 8.75%
8.75% - 9.00%
Count of Utility Sponsors
ERO
A
20182007
9FOR NORTH AMERICAN POWER CREDIT ORGANIZATION'S USE - NOT FOR FURTHER USE AND/OR DISTRIBUTION TO THE GENERAL PUBLIC.
GSAM Industry Study
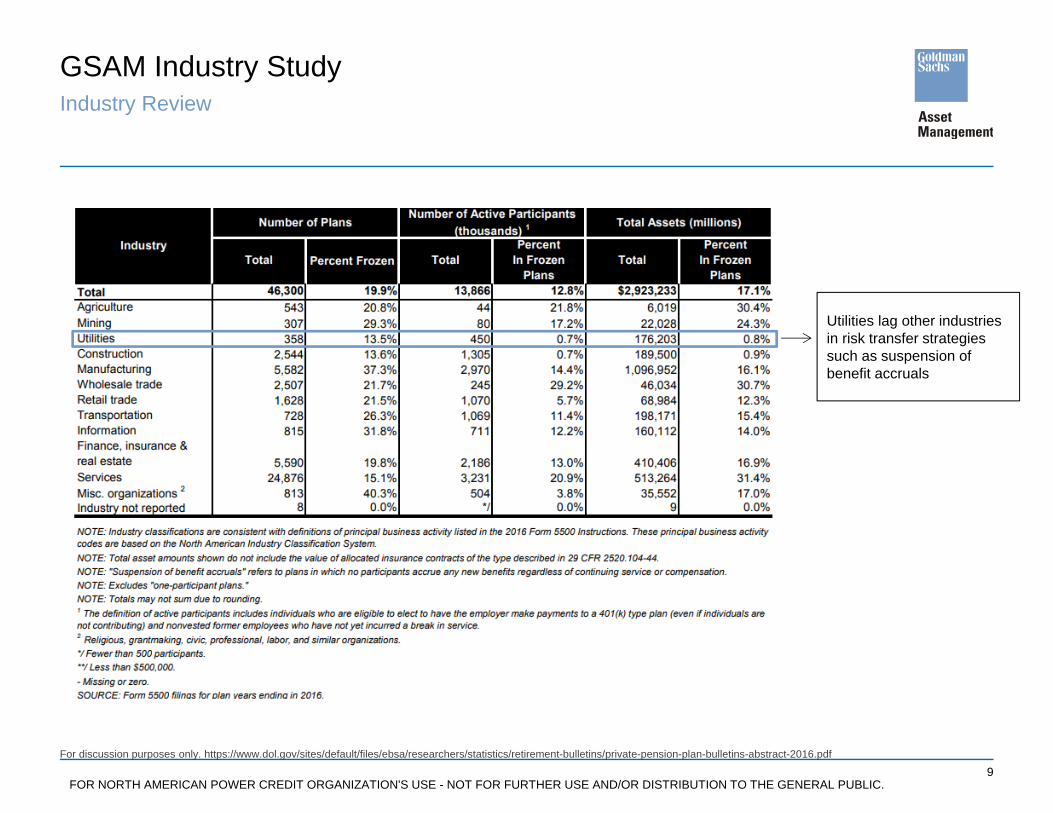
For discussion purposes only. https://www.dol.gov/sites/default/files/ebsa/researchers/statistics/retirement-bulletins/private-pension-plan-bulletins-abstract-2016.pdf
Utilities lag other industries in risk transfer strategies such as suspension of benefit accruals
Industry Review
FOR NORTH AMERICAN POWER CREDIT ORGANIZATION'S USE - NOT FOR FURTHER USE AND/OR DISTRIBUTION TO THE GENERAL PUBLIC.
III. Proposed Capital Efficiency Strategy
INFORMATION CONTAINED IN THESE MATERIALS IS PROVIDED TO PLAN FIDUCIARIES SOLEY FOR THEIR USE IN THEIR CAPACITY AS PLAN FIDUCIARIES. ANY INFORMATIONON MATTERS RELATING TO PLAN SPONSOR CONCERNS IS PROVIDED SOLELY FOR EDUCATIONAL PURPOSES.
11FOR NORTH AMERICAN POWER CREDIT ORGANIZATION'S USE - NOT FOR FURTHER USE AND/OR DISTRIBUTION TO THE GENERAL PUBLIC.
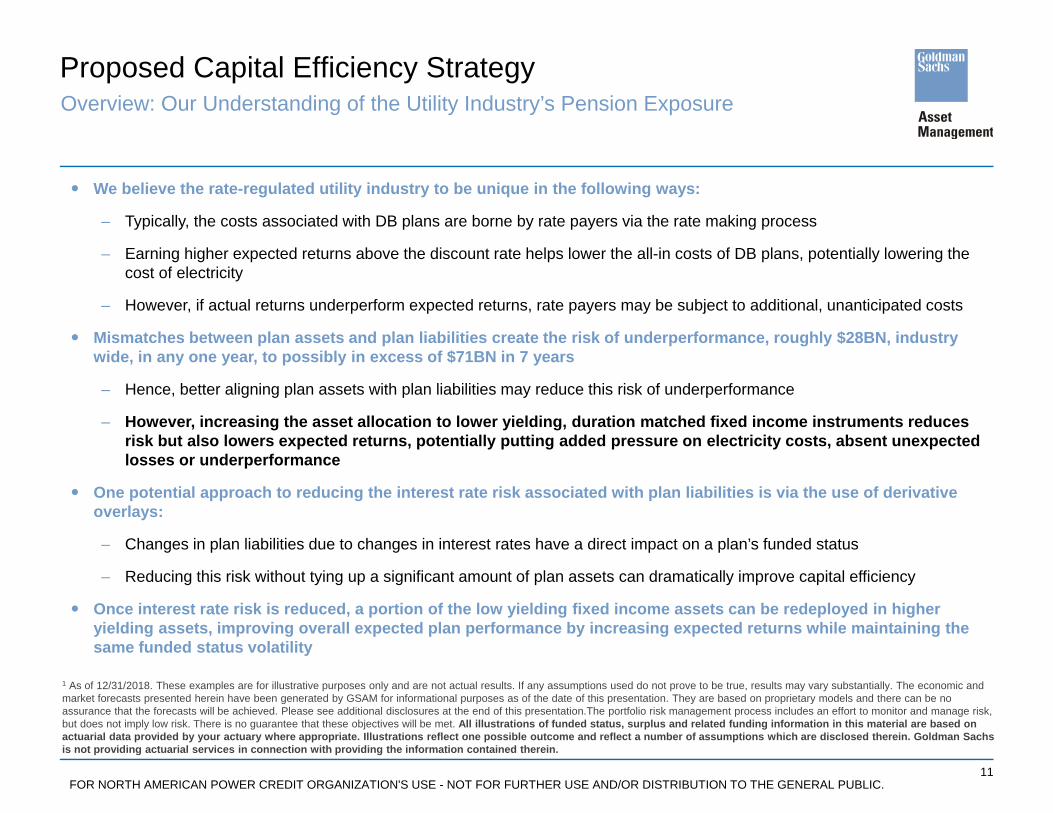
Proposed Capital Efficiency StrategyOverview: Our Understanding of the Utility Industry’s Pension Exposure
1 As of 12/31/2018. These examples are for illustrative purposes only and are not actual results. If any assumptions used do not prove to be true, results may vary substantially. The economic and market forecasts presented herein have been generated by GSAM for informational purposes as of the date of this presentation. They are based on proprietary models and there can be no assurance that the forecasts will be achieved. Please see additional disclosures at the end of this presentation.The portfolio risk management process includes an effort to monitor and manage risk, but does not imply low risk. There is no guarantee that these objectives will be met. All illustrations of funded status, surplus and related funding information in this material are based on actuarial data provided by your actuary where appropriate. Illustrations reflect one possible outcome and reflect a number of assumptions which are disclosed therein. Goldman Sachs is not providing actuarial services in connection with providing the information contained therein.
We believe the rate-regulated utility industry to be unique in the following ways:
– Typically, the costs associated with DB plans are borne by rate payers via the rate making process
– Earning higher expected returns above the discount rate helps lower the all-in costs of DB plans, potentially lowering the cost of electricity
– However, if actual returns underperform expected returns, rate payers may be subject to additional, unanticipated costs
Mismatches between plan assets and plan liabilities create the risk of underperformance, roughly $28BN, industry wide, in any one year, to possibly in excess of $71BN in 7 years
– Hence, better aligning plan assets with plan liabilities may reduce this risk of underperformance
– However, increasing the asset allocation to lower yielding, duration matched fixed income instruments reduces risk but also lowers expected returns, potentially putting added pressure on electricity costs, absent unexpected losses or underperformance
One potential approach to reducing the interest rate risk associated with plan liabilities is via the use of derivative overlays:
– Changes in plan liabilities due to changes in interest rates have a direct impact on a plan’s funded status
– Reducing this risk without tying up a significant amount of plan assets can dramatically improve capital efficiency
Once interest rate risk is reduced, a portion of the low yielding fixed income assets can be redeployed in higher yielding assets, improving overall expected plan performance by increasing expected returns while maintaining the same funded status volatility
12FOR NORTH AMERICAN POWER CREDIT ORGANIZATION'S USE - NOT FOR FURTHER USE AND/OR DISTRIBUTION TO THE GENERAL PUBLIC.
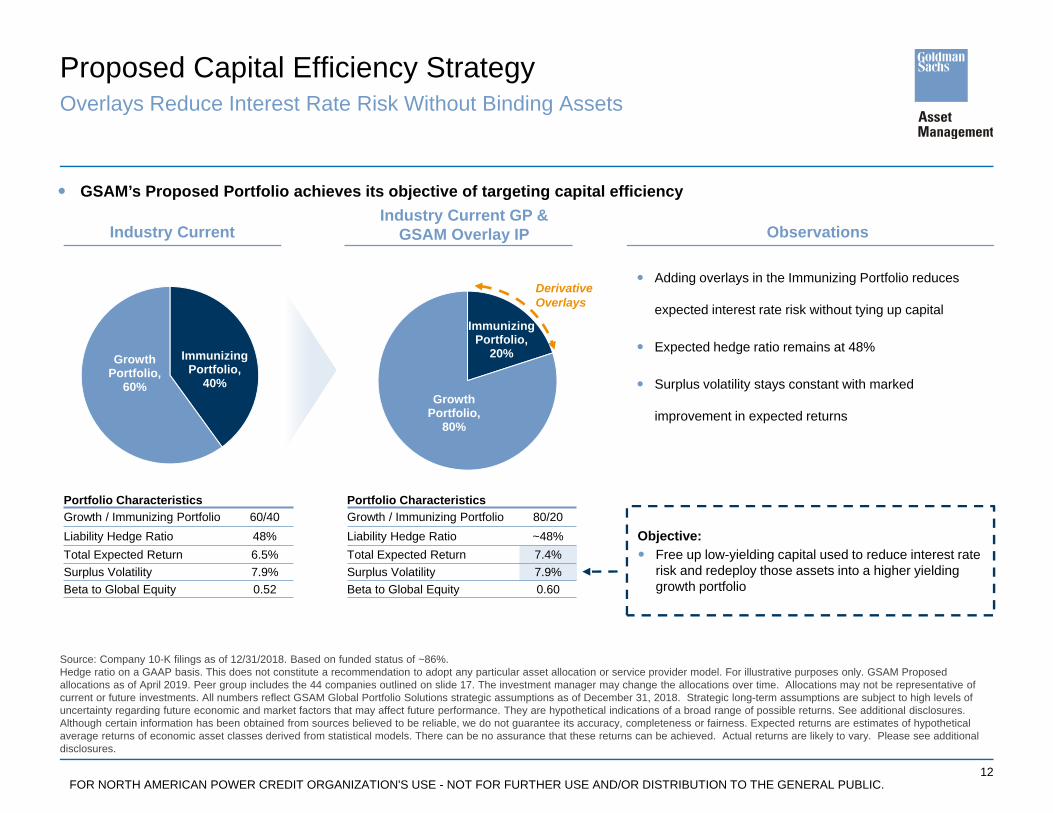
Industry Current GP & GSAM Overlay IP
Immunizing Portfolio,
20%
Growth Portfolio,
80%
Proposed Capital Efficiency StrategyOverlays Reduce Interest Rate Risk Without Binding Assets
Source: Company 10-K filings as of 12/31/2018. Based on funded status of ~86%. Hedge ratio on a GAAP basis. This does not constitute a recommendation to adopt any particular asset allocation or service provider model. For illustrative purposes only. GSAM Proposed allocations as of April 2019. Peer group includes the 44 companies outlined on slide 17. The investment manager may change the allocations over time. Allocations may not be representative of current or future investments. All numbers reflect GSAM Global Portfolio Solutions strategic assumptions as of December 31, 2018. Strategic long-term assumptions are subject to high levels of uncertainty regarding future economic and market factors that may affect future performance. They are hypothetical indications of a broad range of possible returns. See additional disclosures. Although certain information has been obtained from sources believed to be reliable, we do not guarantee its accuracy, completeness or fairness. Expected returns are estimates of hypothetical average returns of economic asset classes derived from statistical models. There can be no assurance that these returns can be achieved. Actual returns are likely to vary. Please see additional disclosures.
GSAM’s Proposed Portfolio achieves its objective of targeting capital efficiency
Industry Current
Portfolio CharacteristicsGrowth / Immunizing Portfolio 60/40Liability Hedge Ratio 48%Total Expected Return 6.5%Surplus Volatility 7.9%Beta to Global Equity 0.52
Portfolio CharacteristicsGrowth / Immunizing Portfolio 80/20Liability Hedge Ratio ~48%Total Expected Return 7.4%Surplus Volatility 7.9%Beta to Global Equity 0.60
Observations
Adding overlays in the Immunizing Portfolio reduces
expected interest rate risk without tying up capital
Expected hedge ratio remains at 48%
Surplus volatility stays constant with marked
improvement in expected returns
Objective: Free up low-yielding capital used to reduce interest rate
risk and redeploy those assets into a higher yielding growth portfolio
Derivative Overlays
Immunizing Portfolio,
40%
Growth Portfolio,
60%
FOR NORTH AMERICAN POWER CREDIT ORGANIZATION'S USE - NOT FOR FURTHER USE AND/OR DISTRIBUTION TO THE GENERAL PUBLIC.
Appendix A: Assumptions and Methodology

14FOR NORTH AMERICAN POWER CREDIT ORGANIZATION'S USE - NOT FOR FURTHER USE AND/OR DISTRIBUTION TO THE GENERAL PUBLIC.
Assumptions and Methodology
All data (PBO, Assets, Expected Benefit Pmts, etc.) based on company 10-K filings for 44 U.S. shareholder-owned public utilities
– Decomposition of annual liability (gains)/losses include assumed liability duration of 12 and actual reported change in discount rate
Projected expected funded status from 2007 FYE to 2018 FYE estimated based on information reported in company 10-K filings for 44
U.S. shareholder-owned public utilities and the following assumptions:
– Asset growth reflects contributions equal to service cost and actual return equal to expected returns
– Liability growth reflects no change in discount rate, pro-rata demographic (gains)/losses and service cost, and actual “other” liability
changes
Funded status volatility estimated based on GSAM capital market assumptions on plan assets and liabilities (data available to client)
– Benefit payments were assumed paid monthly, contributions made annually at the end of the seventh month of the year, and all
other asset and liability cash flows at end of year
– 1-in-20 best and worst case scenarios based on a 1.645 standard deviation move (i.e., 95% confidence interval) around the
expected path
• Growth assets based on allocation to equities and alternatives reported in 10-K asset allocation data
Company data as of 12/31/2018. These examples are for illustrative purposes only and are not actual results. If any assumptions used do not prove to be true, results may vary substantially.
15FOR NORTH AMERICAN POWER CREDIT ORGANIZATION'S USE - NOT FOR FURTHER USE AND/OR DISTRIBUTION TO THE GENERAL PUBLIC.
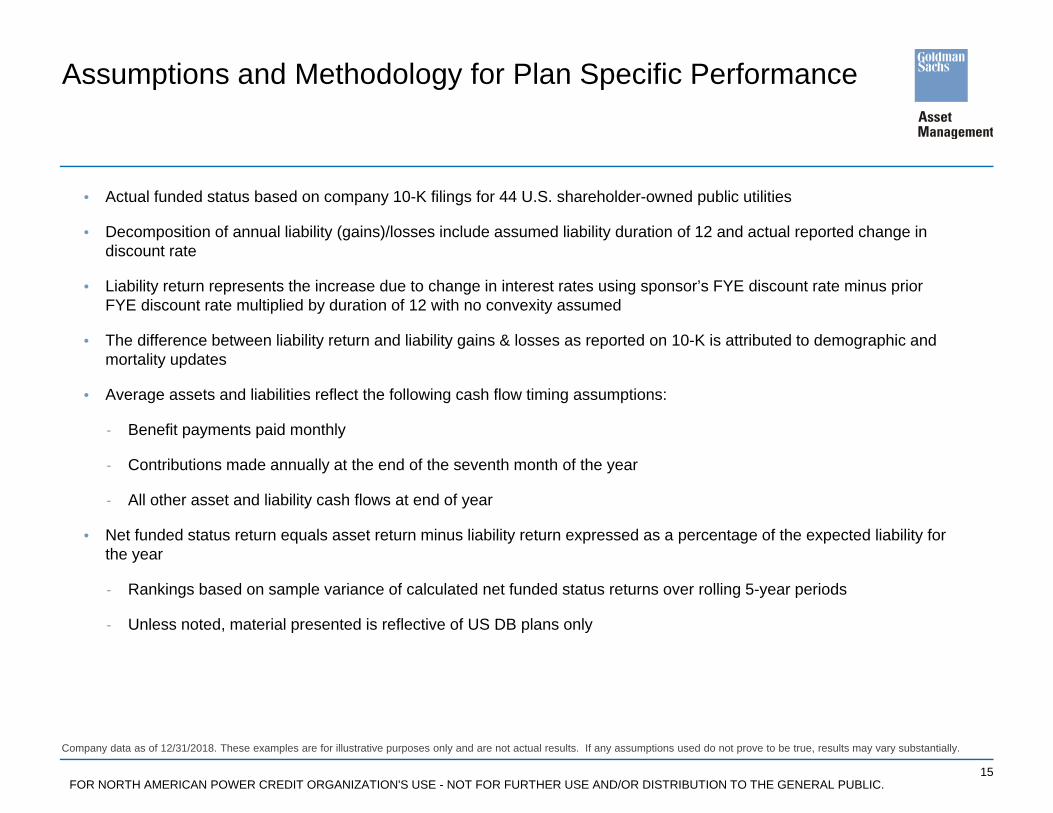
Assumptions and Methodology for Plan Specific Performance
• Actual funded status based on company 10-K filings for 44 U.S. shareholder-owned public utilities
• Decomposition of annual liability (gains)/losses include assumed liability duration of 12 and actual reported change in discount rate
• Liability return represents the increase due to change in interest rates using sponsor’s FYE discount rate minus prior FYE discount rate multiplied by duration of 12 with no convexity assumed
• The difference between liability return and liability gains & losses as reported on 10-K is attributed to demographic and mortality updates
• Average assets and liabilities reflect the following cash flow timing assumptions:
- Benefit payments paid monthly
- Contributions made annually at the end of the seventh month of the year
- All other asset and liability cash flows at end of year
• Net funded status return equals asset return minus liability return expressed as a percentage of the expected liability for the year
- Rankings based on sample variance of calculated net funded status returns over rolling 5-year periods
- Unless noted, material presented is reflective of US DB plans only
Company data as of 12/31/2018. These examples are for illustrative purposes only and are not actual results. If any assumptions used do not prove to be true, results may vary substantially.
FOR NORTH AMERICAN POWER CREDIT ORGANIZATION'S USE - NOT FOR FURTHER USE AND/OR DISTRIBUTION TO THE GENERAL PUBLIC.
Appendix B: US Shareholder-Owned Public Utilities Used in this Study

17FOR NORTH AMERICAN POWER CREDIT ORGANIZATION'S USE - NOT FOR FURTHER USE AND/OR DISTRIBUTION TO THE GENERAL PUBLIC.
US Shareholder-Owned Public Utilities Used in this Study
Any reference to a specific company or security does not constitute a recommendation to buy, sell, hold or directly invest in the company or its securities.
Company TickerMDU Resources Group, Inc. MDUMGE Energy, Inc. MGEENextEra Energy, Inc. NEENiSource Inc. NINorthWestern Energy NWENRG Energy, Inc. NRGNW Natural NWNOGE Energy Corp. OGEOtter Tail Corporation OTTRPG&E Corporation PCGPinnacle West Capital Corporation PNWPNM Resources, Inc. PNMPortland General Electric Company PORPPL Corporation PPLPublic Service Enterprise Group, Inc. PEGPuget Sound Energy PSDSempra Energy SRESouthern Company SOUnitil Corporation UTLWestar Energy, Inc. WRWisconsin Energy Corporation WECXcel Energy, Inc. XEL
Company TickerAES Corporation AESALLETE, Inc. ALEPEG Energy Corporation LNTAmeren Corporation AEEAmerican Electric Power Company, Inc. AEPAvista Corporation AVABlack Hills Corporation BKHCenterPoint Energy, Inc. CNPCleco Corporation CNLCMS Energy Corporation CMSConsolidated Edison, Inc. EDDominion Resources Inc. DDTE Energy Company DTEDuke Energy Corporation DUKEdison International EIXEl Paso Electric Company EEEntergy Corporation ETREversource Energy ESExelon Corporation EXCFirstEnergy Corp. FEHawaiian Electric Industries, Inc. HEIDACORP, Inc. IDA

FOR NORTH AMERICAN POWER CREDIT ORGANIZATION'S USE - NOT FOR FURTHER USE AND/OR DISTRIBUTION TO THE GENERAL PUBLIC.
Appendix C: GSAM Contact List
19FOR NORTH AMERICAN POWER CREDIT ORGANIZATION'S USE - NOT FOR FURTHER USE AND/OR DISTRIBUTION TO THE GENERAL PUBLIC.
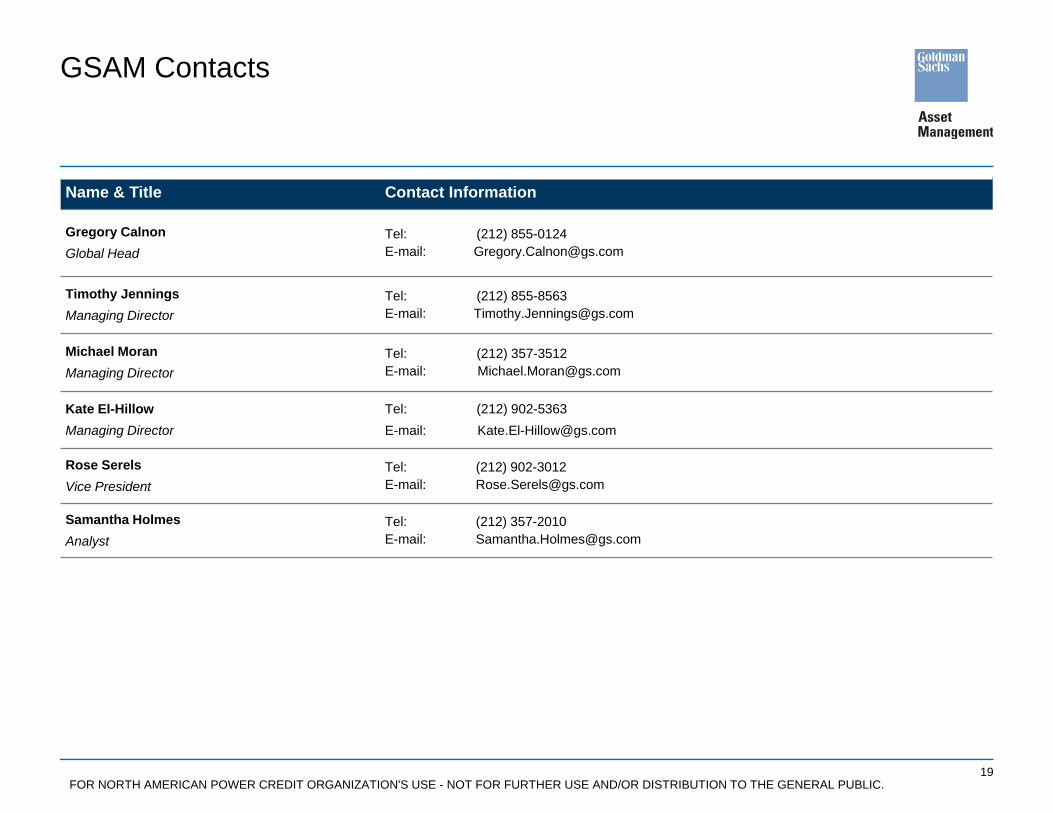
GSAM Contacts
Name & Title Contact Information
Gregory CalnonGlobal Head
Tel: (212) 855-0124E-mail: [email protected]
Timothy JenningsManaging Director
Tel: (212) 855-8563E-mail: [email protected]
Michael MoranManaging Director
Tel: (212) 357-3512E-mail: [email protected]
Kate El-HillowManaging Director
Tel: (212) 902-5363E-mail: [email protected]
Rose SerelsVice President
Tel: (212) 902-3012E-mail: [email protected]
Samantha HolmesAnalyst
Tel: (212) 357-2010E-mail: [email protected]

20FOR NORTH AMERICAN POWER CREDIT ORGANIZATION'S USE - NOT FOR FURTHER USE AND/OR DISTRIBUTION TO THE GENERAL PUBLIC.
Additional InformationStrategic Long-Term Assumptions: Expected Total Return and Volatility
All numbers reflect GSAM Global Portfolio Solutions strategic assumptions as of June 30, 2019. Strategic long-term assumptions are subject to high levels of uncertainty regarding future economic and market factors that may affect future performance. They are hypothetical indications of a broad range of possible returns. Expected returns are estimates of hypothetical average returns of economic asset classes derived from statistical models. There can be no assurance that these returns can be achieved. Actual returns are likely to vary. Please see additional disclosures. The returns are gross and do not reflect the deduction of investment advisory fees, which will reduce returns. Our investment advisory fees are described in Part 2 of our Form ADV. See additional disclosures.
Total Return Total Volatility Total Sharpe RatioCustom Benchmark 3.8% 10.7% 0.17
Private Equity 9.1% 22.5% 0.32
US Real Estate 6.9% 17.5% 0.28
Global Equity FX 2.6% 2.8% 0.20
Emerging Markets Equity 1 10.5% 20.3% 0.42
Global Small Cap Equity 8.5% 16.5% 0.39
LIBOR Floors 29.4% 135.9% 0.20
Global Equity 1 7.8% 14.8% 0.39
Emerging Markets Equity 2 10.5% 20.9% 0.41
Global Small Cap Equity 8.5% 17.7% 0.37
Global Real Estate (FTSE) 8.6% 18.1% 0.36
Global Infrastructure 7.8% 14.1% 0.41
Trend 7.6% 13.7% 0.41
Emerging Market Debt 5.3% 9.4% 0.35
Emerging Market Debt Local 6.1% 12.3% 0.33
Global Equity Volatility Strategy 5.4% 8.9% 0.38
Global High Yield 5.4% 9.1% 0.37
Hedge Funds 3.6% 5.4% 0.30
GPS Tilts Fund 3.4% 8.0% 0.17
Global Equity 1 7.2% 13.7% 0.38
Global Equity 2 7.8% 14.4% 0.40
GS Alternative Beta Trend 3.7% 12.4% 0.14
21FOR NORTH AMERICAN POWER CREDIT ORGANIZATION'S USE - NOT FOR FURTHER USE AND/OR DISTRIBUTION TO THE GENERAL PUBLIC.
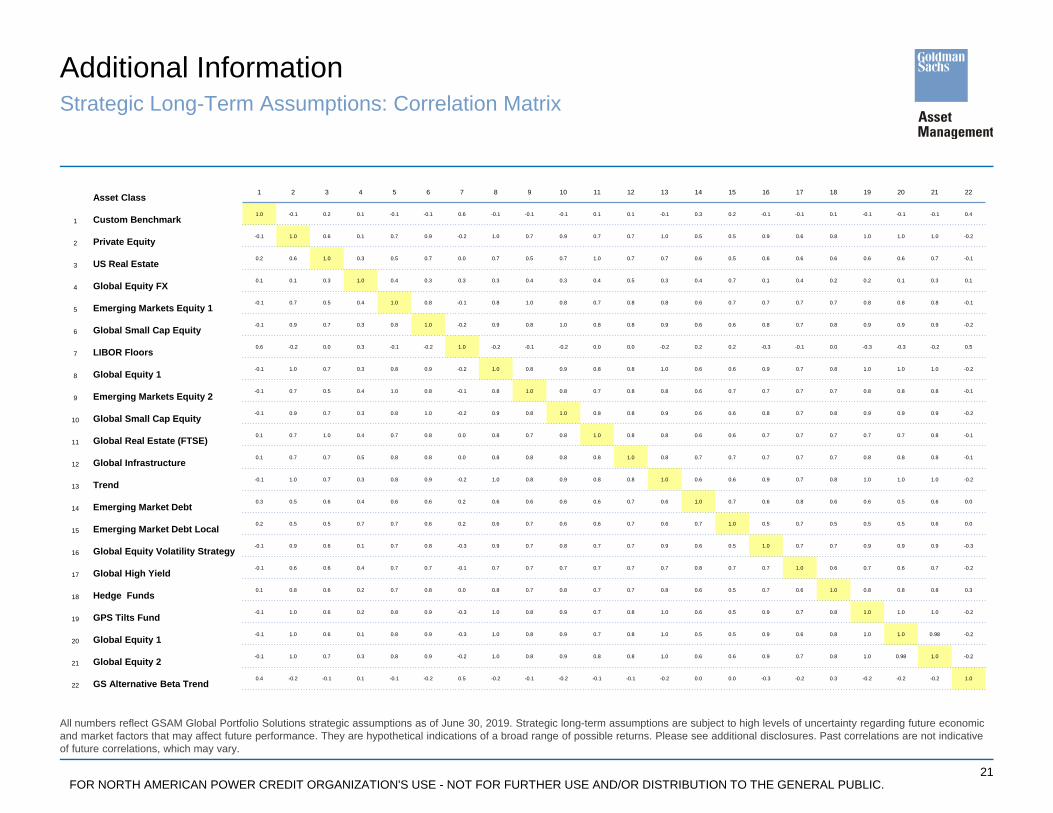
Additional InformationStrategic Long-Term Assumptions: Correlation Matrix
All numbers reflect GSAM Global Portfolio Solutions strategic assumptions as of June 30, 2019. Strategic long-term assumptions are subject to high levels of uncertainty regarding future economic and market factors that may affect future performance. They are hypothetical indications of a broad range of possible returns. Please see additional disclosures. Past correlations are not indicative of future correlations, which may vary.
Asset Class 1 2 3 4 5 6 7 8 9 10 11 12 13 14 15 16 17 18 19 20 21 22
1 Custom Benchmark1.0 -0.1 0.2 0.1 -0.1 -0.1 0.6 -0.1 -0.1 -0.1 0.1 0.1 -0.1 0.3 0.2 -0.1 -0.1 0.1 -0.1 -0.1 -0.1 0.4
2 Private Equity-0.1 1.0 0.6 0.1 0.7 0.9 -0.2 1.0 0.7 0.9 0.7 0.7 1.0 0.5 0.5 0.9 0.6 0.8 1.0 1.0 1.0 -0.2
3 US Real Estate0.2 0.6 1.0 0.3 0.5 0.7 0.0 0.7 0.5 0.7 1.0 0.7 0.7 0.6 0.5 0.6 0.6 0.6 0.6 0.6 0.7 -0.1
4 Global Equity FX0.1 0.1 0.3 1.0 0.4 0.3 0.3 0.3 0.4 0.3 0.4 0.5 0.3 0.4 0.7 0.1 0.4 0.2 0.2 0.1 0.3 0.1
5 Emerging Markets Equity 1-0.1 0.7 0.5 0.4 1.0 0.8 -0.1 0.8 1.0 0.8 0.7 0.8 0.8 0.6 0.7 0.7 0.7 0.7 0.8 0.8 0.8 -0.1
6 Global Small Cap Equity-0.1 0.9 0.7 0.3 0.8 1.0 -0.2 0.9 0.8 1.0 0.8 0.8 0.9 0.6 0.6 0.8 0.7 0.8 0.9 0.9 0.9 -0.2
7 LIBOR Floors0.6 -0.2 0.0 0.3 -0.1 -0.2 1.0 -0.2 -0.1 -0.2 0.0 0.0 -0.2 0.2 0.2 -0.3 -0.1 0.0 -0.3 -0.3 -0.2 0.5
8 Global Equity 1-0.1 1.0 0.7 0.3 0.8 0.9 -0.2 1.0 0.8 0.9 0.8 0.8 1.0 0.6 0.6 0.9 0.7 0.8 1.0 1.0 1.0 -0.2
9 Emerging Markets Equity 2-0.1 0.7 0.5 0.4 1.0 0.8 -0.1 0.8 1.0 0.8 0.7 0.8 0.8 0.6 0.7 0.7 0.7 0.7 0.8 0.8 0.8 -0.1
10 Global Small Cap Equity-0.1 0.9 0.7 0.3 0.8 1.0 -0.2 0.9 0.8 1.0 0.8 0.8 0.9 0.6 0.6 0.8 0.7 0.8 0.9 0.9 0.9 -0.2
11 Global Real Estate (FTSE)0.1 0.7 1.0 0.4 0.7 0.8 0.0 0.8 0.7 0.8 1.0 0.8 0.8 0.6 0.6 0.7 0.7 0.7 0.7 0.7 0.8 -0.1
12 Global Infrastructure0.1 0.7 0.7 0.5 0.8 0.8 0.0 0.8 0.8 0.8 0.8 1.0 0.8 0.7 0.7 0.7 0.7 0.7 0.8 0.8 0.8 -0.1
13 Trend-0.1 1.0 0.7 0.3 0.8 0.9 -0.2 1.0 0.8 0.9 0.8 0.8 1.0 0.6 0.6 0.9 0.7 0.8 1.0 1.0 1.0 -0.2
14 Emerging Market Debt0.3 0.5 0.6 0.4 0.6 0.6 0.2 0.6 0.6 0.6 0.6 0.7 0.6 1.0 0.7 0.6 0.8 0.6 0.6 0.5 0.6 0.0
15 Emerging Market Debt Local0.2 0.5 0.5 0.7 0.7 0.6 0.2 0.6 0.7 0.6 0.6 0.7 0.6 0.7 1.0 0.5 0.7 0.5 0.5 0.5 0.6 0.0
16 Global Equity Volatility Strategy-0.1 0.9 0.6 0.1 0.7 0.8 -0.3 0.9 0.7 0.8 0.7 0.7 0.9 0.6 0.5 1.0 0.7 0.7 0.9 0.9 0.9 -0.3
17 Global High Yield-0.1 0.6 0.6 0.4 0.7 0.7 -0.1 0.7 0.7 0.7 0.7 0.7 0.7 0.8 0.7 0.7 1.0 0.6 0.7 0.6 0.7 -0.2
18 Hedge Funds0.1 0.8 0.6 0.2 0.7 0.8 0.0 0.8 0.7 0.8 0.7 0.7 0.8 0.6 0.5 0.7 0.6 1.0 0.8 0.8 0.8 0.3
19 GPS Tilts Fund-0.1 1.0 0.6 0.2 0.8 0.9 -0.3 1.0 0.8 0.9 0.7 0.8 1.0 0.6 0.5 0.9 0.7 0.8 1.0 1.0 1.0 -0.2
20 Global Equity 1-0.1 1.0 0.6 0.1 0.8 0.9 -0.3 1.0 0.8 0.9 0.7 0.8 1.0 0.5 0.5 0.9 0.6 0.8 1.0 1.0 0.98 -0.2
21 Global Equity 2-0.1 1.0 0.7 0.3 0.8 0.9 -0.2 1.0 0.8 0.9 0.8 0.8 1.0 0.6 0.6 0.9 0.7 0.8 1.0 0.98 1.0 -0.2
22 GS Alternative Beta Trend0.4 -0.2 -0.1 0.1 -0.1 -0.2 0.5 -0.2 -0.1 -0.2 -0.1 -0.1 -0.2 0.0 0.0 -0.3 -0.2 0.3 -0.2 -0.2 -0.2 1.0
22FOR NORTH AMERICAN POWER CREDIT ORGANIZATION'S USE - NOT FOR FURTHER USE AND/OR DISTRIBUTION TO THE GENERAL PUBLIC.
Backup
THESE MATERIALS ARE PROVIDED SOLELY ON THE BASIS THAT THEY WILL NOT CONSTITUTE INVESTMENT ADVICE AND WILL NOT FORM A PRIMARY BASIS FOR ANY PERSON'S OR PLAN'S INVESTMENT DECISIONS, AND GOLDMAN SACHS IS NOT A FIDUCIARY WITH RESPECT TO ANY PERSON OR PLAN BY REASON OF PROVIDING THE MATERIAL OR CONTENT HEREIN. PLAN FIDUCIARIES SHOULD CONSIDER THEIR OWN CIRCUMSTANCES IN ASSESSING ANY POTENTIAL INVESTMENT COURSE OF ACTION.
This material is provided at your request for informational purposes only. It is not an offer or solicitation to buy or sell any securities.
High-yield, lower-rated securities involve greater price volatility and present greater credit risks than higher-rated fixed income securities.
This information discusses general market activity, industry or sector trends, or other broad-based economic, market or political conditions and should not be construed as research or investment advice. This material has been prepared by GSAM and is not financial research nor a product of Goldman Sachs Global Investment Research (GIR). It was not prepared in compliance with applicable provisions of law designed to promote the independence of financial analysis and is not subject to a prohibition on trading following the distribution of financial research. The views and opinions expressed may differ from those of Goldman Sachs Global Investment Research or other departments or divisions of Goldman Sachs and its affiliates. Investors are urged to consult with their financial advisors before buying or selling any securities. This information may not be current and GSAM has no obligation to provide any updates or changes.
Although certain information has been obtained from sources believed to be reliable, we do not guarantee its accuracy, completeness or fairness. We have relied upon and assumed without independent verification, the accuracy and completeness of all information available from public sources.
Past performance does not guarantee future results, which may vary. The value of investments and the income derived from investments will fluctuate and can go down as well as up. A loss of principal may occur.
References to indices, benchmarks or other measures of relative market performance over a specified period of time are provided for your information only and do not imply that the portfolio will achieve similar results. The index composition may not reflect the manner in which a portfolio is constructed. While an adviser seeks to design a portfolio which reflects appropriate risk and return features, portfolio characteristics may deviate from those of the benchmark.
Goldman Sachs does not provide accounting, tax, or legal advice. Notwithstanding anything in this document to the contrary, and except as required to enable compliance with applicable securities law, you may disclose to any person the US federal and state income tax treatment and tax structure of the transaction and all materials of any kind (including tax opinions and other tax analyses) that are provided to you relating to such tax treatment and tax structure, without Goldman Sachs imposing any limitation of any kind. Investors should be aware that a determination of the tax consequences to them should take into account their specific circumstances and that the tax law is subject to change in the future or retroactively and investors are strongly urged to consult with their own tax advisor regarding any potential strategy, investment or transaction.
Views and opinions expressed are for informational purposes only and do not constitute a recommendation by GSAM to buy, sell, or hold any security. Views and opinions are current as of the date of this presentation and may be subject to change, they should not be construed as investment advice.
THIS MATERIAL DOES NOT CONSTITUTE AN OFFER OR SOLICITATION IN ANY JURISDICTION WHERE OR TO ANY PERSON TO WHOM IT WOULD BE UNAUTHORIZED OR UNLAWFUL TO DO SO.
Prospective investors should inform themselves as to any applicable legal requirements and taxation and exchange control regulations in the countries of their citizenship, residence or domicile which might be relevant.
Expected return models apply statistical methods and a series of fixed assumptions to derive estimates of hypothetical average asset class performance. Reasonable people may disagree about the appropriate statistical model and assumptions. These models have limitations, as the assumptions may not be consensus views, or the model may not be updated to reflect current economic or market conditions. These models should not be relied upon to make predictions of actual future account performance. GSAM has no obligation to provide updates or changes to such data.
23FOR NORTH AMERICAN POWER CREDIT ORGANIZATION'S USE - NOT FOR FURTHER USE AND/OR DISTRIBUTION TO THE GENERAL PUBLIC.
Disclosures
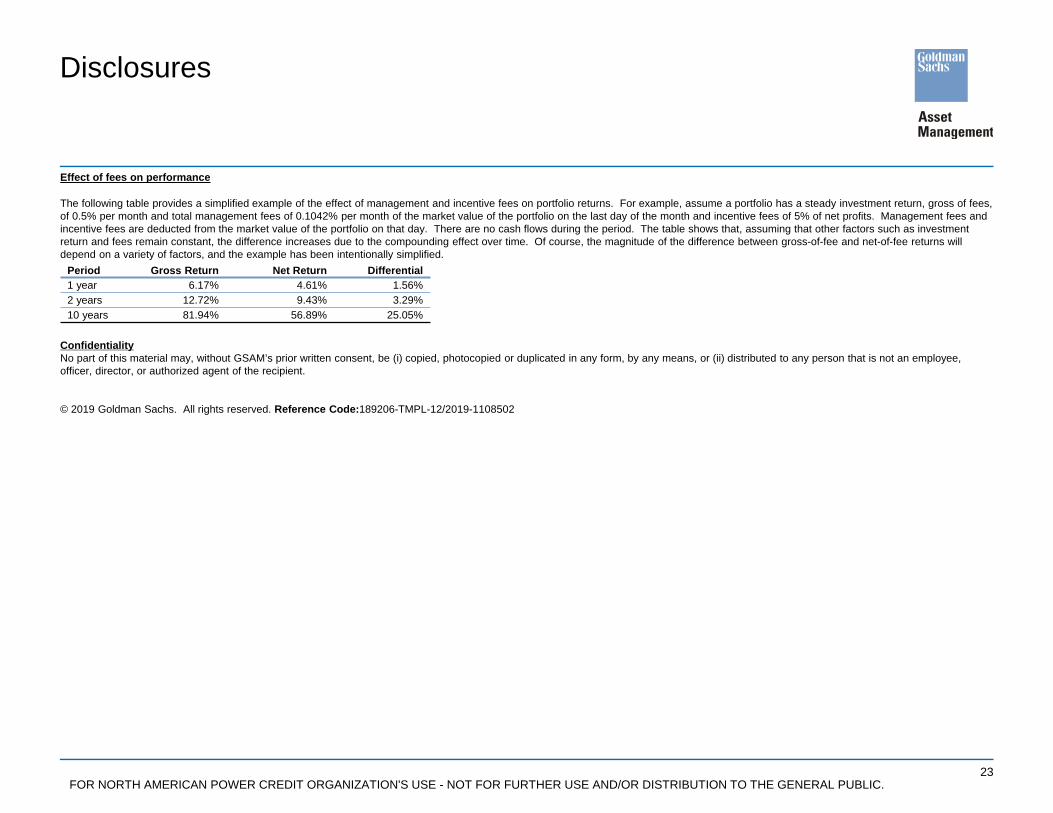
Effect of fees on performance
The following table provides a simplified example of the effect of management and incentive fees on portfolio returns. For example, assume a portfolio has a steady investment return, gross of fees, of 0.5% per month and total management fees of 0.1042% per month of the market value of the portfolio on the last day of the month and incentive fees of 5% of net profits. Management fees and incentive fees are deducted from the market value of the portfolio on that day. There are no cash flows during the period. The table shows that, assuming that other factors such as investment return and fees remain constant, the difference increases due to the compounding effect over time. Of course, the magnitude of the difference between gross-of-fee and net-of-fee returns will depend on a variety of factors, and the example has been intentionally simplified.
ConfidentialityNo part of this material may, without GSAM’s prior written consent, be (i) copied, photocopied or duplicated in any form, by any means, or (ii) distributed to any person that is not an employee, officer, director, or authorized agent of the recipient.
© 2019 Goldman Sachs. All rights reserved. Reference Code:189206-TMPL-12/2019-1108502
Period Gross Return Net Return Differential1 year 6.17% 4.61% 1.56%2 years 12.72% 9.43% 3.29%10 years 81.94% 56.89% 25.05%

24FOR NORTH AMERICAN POWER CREDIT ORGANIZATION'S USE - NOT FOR FURTHER USE AND/OR DISTRIBUTION TO THE GENERAL PUBLIC.
Disclosures
Any reference to a specific company or security does not constitute a recommendation to buy, sell, hold or directly invest in the company or its securities. It should not be assumed that investment decisions made in the future will be profitable or will equal the performance of the securities discussed in this document.
Economic and market forecasts presented herein reflect a series of assumptions and judgments as of the date of this presentation and are subject to change without notice. These forecasts do not take into account the specific investment objectives, restrictions, tax and financial situation or other needs of any specific client. Actual data will vary and may not be reflected here. These forecasts are subject to high levels of uncertainty that may affect actual performance. Accordingly, these forecasts should be viewed as merely representative of a broad range of possible outcomes. These forecasts are estimated, based on assumptions, and are subject to significant revision and may change materially as economic and market conditions change. Goldman Sachs has no obligation to provide updates or changes to these forecasts. Case studies and examples are for illustrative purposes only.
Strategic Long Term Assumptions:Alpha and tracking error assumptions reflect Global Portfolio Solutions’ estimates for above-average active managers and are based on a historical study of the results of active management. Expected returns are estimates of hypothetical average returns of economic asset classes derived from statistical models. There can be no assurance that these returns can be achieved. Actual returns are likely to vary. Please see additional disclosures.
The data regarding strategic assumptions has been generated by GPS for informational purposes. As such data is estimated and based on a number of assumptions; it is subject to significant revision and may change materially with changes in the underlying assumptions. GPS has no obligation to provide updates or changes. The strategic long-term assumptions shown are largely based on proprietary models and do not provide any assurance as to future returns. They are not representative of how we will manage any portfolios or allocate funds to the asset classes.Expected return models apply statistical methods and a series of fixed assumptions to derive estimates of hypothetical average asset class performance. Reasonable people may disagree about the appropriate statistical model and assumptions. These models have limitations, as the assumptions may not be consensus views, or the model may not be updated to reflect current economic or market conditions. These models should not be relied upon to make predictions of actual future account performance. GSAM has no obligation to provide updates or changes to such data.
The website links provided are for your convenience only and are not an endorsement or recommendation by GSAM of any of these websites or the products or services offered. GSAM is not responsible for the accuracy and validity of the content of these websites.
Index BenchmarksIndices are unmanaged. The figures for the index reflect the reinvestment of all income or dividends, as applicable, but do not reflect the deduction of any fees or expenses which would reduce returns. Investors cannot invest directly in indices.
The indices referenced herein have been selected because they are well known, easily recognized by investors, and reflect those indices that the Investment Manager believes, in part based on industry practice, provide a suitable benchmark against which to evaluate the investment or broader market described herein. The exclusion of “failed” or closed hedge funds may mean that each index overstates the performance of hedge funds generally.
Related Documents