Company FundamentalsCompany Fundamentals\Company Profile COMPANY PROFILE Figures in Singapore Dollars A Wright Investors' Service Research Report: Golden Agri-Resources Limited 440 Wheelers Farms Road Milford, CT 06461 U.S.A. Wright Quality Rating :BAC15 Golden Agri-Resources Ltd (GAR) is an investment holding company. The Company's primary activities include cultivating and harvesting oil palm trees, processing fresh fruit bunches (FFB) into crude palm oil (CPO) and palm kernel (PK), to refining CPO into industrial and consumer products such as cooking oil, margarine and shortening. GAR cultivates approximately 442,500 hectares of oil palm plantations in Indonesia, including plasma. GAR operates in two business segments: Indonesia Agri-business, which is engaged ownership and cultivation of oil palm plantation, ownership and operation of mills and refineries and producer of consumer cooking oil and margarine in Indonesia, and China Agri-business, which is engaged in ownership and operation of port, oilseed storage, crushing and refineries and producer of refined edible oil and food products in China. In January 2011, the Company acquired the remaining 50% shares in its associated company, PT Dami Mas Sejahtera. Stock Price (9/23/2011): 0.66 Stock Chart Recent stock performance 1 Week - 3.6% 4 Weeks 6.5% 13 Weeks - 2.9% 52 Weeks 13.8% Chairman & Chief Executive Franky Oesman Widjaja President Muktar Widjaja Chief Financial Officer Simon Lim Officers Earnings / Dividends (as of 6/30/2011) Earnings Dividends Most Recent Qtr 0.02 0.01 Last 12 Months 0.18 0.01 Ratio Analysis Price / Earnings Ratio 3.67 Dividend Yield 1.52% Key Data Ticker: E5H 2010 Sales: 4,757,819,919 Major Industry: Food & Beverages Sub Industry: Miscellaneous Food Country: Singapore Currency: Singapore Dollars Fiscal Year Ends: December Employees 31,448 Exchanges: SIN Share Type: Ordinary Market Capitalization: 8,011,526,782 Total Shares Outstanding: 12,138,676,942 Closely Held Shares: 5,071,129,976

Golden Agri
Mar 22, 2016
Analysis Report
Welcome message from author
This document is posted to help you gain knowledge. Please leave a comment to let me know what you think about it! Share it to your friends and learn new things together.
Transcript

Company FundamentalsCompany Fundamentals\Company Profile
COMPANY PROFILE Figures in Singapore Dollars
A Wright Investors' Service Research Report: Golden Agri-Resources Limited
440 Wheelers Farms Road Milford, CT 06461 U.S.A.
Wright Quality Rating:BAC15
Golden Agri-Resources Ltd (GAR) is an investment holding company. The Company's primary activities include cultivating and harvesting oil palm trees, processing fresh fruit bunches (FFB) into crude palm oil (CPO) and palm kernel (PK), to refining CPO into industrial and consumer products such as cooking oil, margarine and shortening. GAR cultivates approximately 442,500 hectares of oil palm plantations in Indonesia, including plasma. GAR operates in two business segments: Indonesia Agri-business, which is engaged ownership and cultivation of oil palm plantation, ownership and operation of mills and refineries and producer of consumer cooking oil and margarine in Indonesia, and China Agri-business, which is engaged in ownership and operation of port, oilseed storage, crushing and refineries and producer of refined edible oil and food products in China. In January 2011, the Company acquired the remaining 50% shares in its associated company, PT Dami Mas Sejahtera.
Stock Price (9/23/2011): 0.66
Stock Chart
Recent stock performance1 Week -3.6%4 Weeks 6.5%13 Weeks -2.9%52 Weeks 13.8%
Chairman & Chief Executive Franky Oesman Widjaja
President Muktar Widjaja
Chief Financial Officer Simon Lim
Officers
Earnings / Dividends (as of 6/30/2011) Earnings Dividends
Most Recent Qtr 0.02 0.01 Last 12 Months 0.18 0.01
Ratio AnalysisPrice / Earnings Ratio 3.67 Dividend Yield 1.52%
Key Data
Ticker: E5H
2010 Sales: 4,757,819,919
Major Industry: Food & Beverages
Sub Industry: Miscellaneous Food
Country: Singapore
Currency: Singapore Dollars
Fiscal Year Ends: December
Employees 31,448
Exchanges: SIN
Share Type: Ordinary
Market Capitalization: 8,011,526,782
Total Shares Outstanding: 12,138,676,942
Closely Held Shares: 5,071,129,976

Price / Sales Ratio 1.68 Payout Ratio 5.56% Price / Book Ratio 0.91 % Held by Insiders 41.78%
Address5 President John Kennedy Street Port Louis SINGAPORE
Phone +230 405 2000 Home Page http://www.goldenagri.com.sg
Copyright ©2000-2011 Distributed by Wright Investors' Service, Inc. All Rights Reserved. Except for quotations by established news media, no pages on this site may be reproduced, stored in a retrieval system, or transmitted for commercial purposes, in any form or by any means, electronic, mechanical, photocopying, recording, or otherwise without prior written permission. Information is believed reliable, but accuracy, completeness and opinions are not guaranteed.

Company Fundamentals\Comparative Business Analysis
A Wright Investors' Service Research Report: Golden Agri-Resources Limited Provided By CorporateInformation.com
440 Wheelers Farms Road Milford, CT 06461 U.S.A.
Wright Comparative Business Analysis Report
Report Date: 9/23/2011
Company Description Golden Agri-Resources Ltd (GAR) is an investment holding company. The Company's primary activities include cultivating and harvesting oil palm trees, processing fresh fruit bunches (FFB) into crude palm oil (CPO) and palm kernel (PK), to refining CPO into industrial and consumer products such as cooking oil, margarine and shortening. GAR cultivates approximately 442,500 hectares of oil palm plantations in Indonesia, including plasma. GAR operates in two business segments: Indonesia Agri-business, which is engaged ownership and cultivation of oil palm plantation, ownership and operation of mills and refineries and producer of consumer cooking oil and margarine in Indonesia, and China Agri-business, which is engaged in ownership and operation of port, oilseed storage, crushing and refineries and producer of refined edible oil and food products in China. In January 2011, the Company acquired the remaining 50% shares in its associated company, PT Dami Mas Sejahtera.
Competitor Analysis
Golden Agri-Resources Limited operates in the Edible fats and oils sector. This analysis compares Golden Agri-Resources Limited with three other companies: Nisshin Oillio Group Ltd of Japan (2011 sales of 305.30 billion Japanese Yen [US$3.99 billion] of which 92% was Cooking Oil-related), Ruchi Soya Industries Ltd of India (2011 sales: 180.16 billion Indian Rupees [US$3.73 billion] ), and J-Oil Mills Incorporated which is based in Japan (2011 sales of 172.04 billion Japanese Yen [US$2.25 billion] of which 92% was Oil Manufacturing-Related Business). Note: not all of these companies have the same fiscal year: the most recent data for each company are being used.
Sales Analysis
Golden Agri-Resources Limited reported sales of 4.76 billion Singapore Dollars (US$3.68 billion) for the year ending December of 2010. This represents an increase of 43.0% versus 2009, when the company's sales were 3.33 billion Singapore Dollars. Sales of Indonesia Agribusiness saw an increase of 84.2% in 2010, from 2.44 billion Singapore Dollars to 4.49 billion Singapore Dollars.
Recent Sales at Golden Agri-Resources Limited
(Figures in Billions of Singapore Dollars) In 2010, sales in India were up at a rate that was much higher than the company as a whole: in this region, sales increased 232.1% to 768.81 million Singapore Dollars. Although the company's overall sales increased, sales were not up in all regions of the world: sales in Indonesia were down 3.0% (to 720.25 million Singapore Dollars) and sales in Europe fell 25.8% (to 71.25 million Singapore Dollars) and sales in other countries fell 13.6% (to 23.78 million Singapore Dollars) . During 2010, the company's sales increased at a faster rate than all three comparable companies. While Golden Agri-Resources Limited enjoyed a sales increase of 43.0%, the other companies saw smaller increases: Nisshin Oillio Group Ltd sales were up 1.3%, Ruchi Soya Industries Ltd increased 26.2%, and J-Oil Mills Incorporated experienced a sales decline of 2.7%. Golden Agri-Resources Limited
1.36
1.79
2.81
4.21
3.33
4.76
2005 2006 2007 2008 2009 2010

currently has 31,448 employees. With sales of 4.76 billion Singapore Dollars (US$3.68 billion) , this equates to sales of US$116,918 per employee.
Sales Comparisons (Most Recent Fiscal Year)
Recent Stock Performance
In recent years, this stock has performed terribly. In 2008, the stock traded as high as 1.90 Singapore Dollars, versus 0.66 Singapore Dollars on 9/23/2011. (In 2008, the stock retreated significantly from its high, and by the end of the year was at 0.21 Singapore Dollars). For the 52 weeks ending 9/23/2011, the stock of this company was up 13.8% to 0.66 Singapore Dollars. During the past 13 weeks, the stock has fallen 2.9%. During the past 52 weeks, the stock of Golden Agri-Resources Limited has outperformed the three comparable companies, which saw changes between -15.3% and 0.4%. During the 12 months ending 6/30/2011, earnings per share totalled 0.18 Singapore Dollars per share. Thus, the Price / Earnings ratio is 3.67. These 12 month earnings are greater than the earnings per share achieved during the last fiscal year of the company, which ended in December of 2010, when the company reported earnings of 0.16 per share. Earnings per share rose 109.2% in 2010 from 2009. Note that the earnings number Includes Or Excludes Extraordinary Charge Or Credit. The P/E ratio of 3.7 is much lower than the P/E ratios of all three comparable companies, which are currently trading between 16.3 and 21.8 times earnings. This company is currently trading at 1.68 times sales. This is at a higher ratio than all three comparable companies, which are trading between 0.20 and 0.23 times sales. Golden Agri-Resources Limited is trading at 0.91 times book value. Since the price to book ratio is less than 1, this means that theoretically, the net value of the assets is greater than the value of a company as a going concern.
Summary of company valuations
The market capitalization of this company is 8.01 billion Singapore Dollars (US$6.19 billion) . The capitalization of the floating stock (i.e., that which is not closely held) is 4.66 billion Singapore Dollars (US$3.60 billion) .
Dividend Analysis
During the 12 months ending 6/30/2011, Golden Agri-Resources Limited paid dividends totalling 0.01 Singapore Dollars per share. Since the stock is currently trading at 0.66 Singapore Dollars, this implies a dividend yield of 1.5%. During the same 12 month period ended 6/30/2011, the Company reported earnings of 0.18 Singapore Dollars per share. Thus, the company paid 5.6% of its profits as dividends. Since the company is paying less than 10% of its earnings out in dividends, it is likely that this company believes that it has significant growth prospects, and has decided to pay only a modest dividend.
Profitability Analysis On the 4.76 billion Singapore Dollars in sales reported by the company in 2010, the cost of goods sold totalled 3.38 billion Singapore Dollars, or 71.0% of sales (i.e., the gross profit was 29.0% of sales). This gross profit margin is better than the company achieved in 2009, when cost of goods sold totalled 75.4% of sales. Golden Agri-Resources Limited's 2010 gross profit margin of 29.0% was better than all three comparable companies (which had gross profits in 2010 between 2.8% and 20.1% of sales). The company's earnings before interest, taxes, depreciation and amorization (EBITDA) were 847.57 million Singapore Dollars, or 17.8% of sales. This EBITDA to sales ratio is roughly on par with what the company achieved in 2009, when the EBITDA ratio was 16.7% of sales. The three comparable companies had EBITDA margins that were all less (between 2.8% and 6.3%) than that achieved by Golden Agri-Resources Limited. In 2010, earnings before extraordinary items at Golden Agri-Resources Limited were 1.93 billion Singapore Dollars, or 40.6% of sales. This profit margin is an improvement over the level the company achieved in 2009, when the profit margin was 26.5% of sales. The
CompanyYear Ended
Sales (US$blns)
Sales Growth
Sales/ Emp (US$) Largest Region
Golden Agri-Resources Limited Dec 2010 3.677 43.0% 116,918 Rest of Asia (41.3%)
Nisshin Oillio Group Ltd Mar 2011 3.993 1.3% 1,441,099 Japan (74.1%)
Ruchi Soya Industries Ltd Mar 2011 3.727 26.2% N/A N/A
J-Oil Mills Incorporated Mar 2011 2.250 -2.7% 2,108,994 Japan (100.0%)
Company Date P/EPrice/
BookPrice/ Sales
52 Wk Pr Chg
Golden Agri-Resources Limited 9/23/2011 3.7 0.91 1.68 13.80%
Nisshin Oillio Group Ltd 9/22/2011 21.8 0.57 0.20 -7.73%
Ruchi Soya Industries Ltd 9/23/2011 16.3 1.72 0.21 -15.31%
J-Oil Mills Incorporated 9/22/2011 16.9 0.61 0.23 0.42%

company's return on equity in 2010 was 25.3%. This was significantly better than the 13.2% return the company achieved in 2009. (Extraordinary items have been excluded).
Profitability Comparison
Inventory Analysis
As of December 2010, the value of the company's inventory totalled 1.10 billion Singapore Dollars. Since the cost of goods sold was 3.38 billion Singapore Dollars for the year, the company had 119 days of inventory on hand (another way to look at this is to say that the company turned over its inventory 3.1 times per year). This is an increase in days in inventory from December 2009, when the company had 694.17 million Singapore Dollars, which was only 101 days of sales in inventory. The 119 days in inventory is higher than the three comparable companies, which had inventories between 67 and 81 days sales at the end of 2010.
Financial Position
As of December 2010, the company's long term debt was 569.30 million Singapore Dollars and total liabilities (i.e., all monies owed) were 4.05 billion Singapore Dollars. The long term debt to equity ratio of the company is very low, at only 0.06. As of December 2010, the accounts receivable for the company were 301.24 million Singapore Dollars, which is equivalent to 23 days of sales. This is an improvement over the end of 2009, when Golden Agri-Resources Limited had 24 days of sales in accounts receivable. The 23 days of accounts receivable at Golden Agri-Resources Limited are lower than all three comparable companies: Nisshin Oillio Group Ltd had 68 days, Ruchi Soya Industries Ltd had 67 days, while J-Oil Mills Incorporated had 71 days outstanding at the end of the fiscal year 2010.
Financial Positions
Company Year
Gross Profit Margin
EBITDA Margin
Earns bef. extra
Golden Agri-Resources Limited 2010 29.0% 17.8% 40.6%
Golden Agri-Resources Limited 2009 24.6% 16.7% 26.5%
Nisshin Oillio Group Ltd 2011 18.0% 4.6% 0.7%
Ruchi Soya Industries Ltd 2011 N/A 2.8% 1.2%
J-Oil Mills Incorporated 2011 20.1% 6.3% 1.0%
Company YearLT Debt/ Equity
Days AR
Days Inv.
Golden Agri-Resources Limited 2010 0.06 23 119
Nisshin Oillio Group Ltd 2011 0.27 68 70
Ruchi Soya Industries Ltd 2011 0.37 67 67
J-Oil Mills Incorporated 2011 0.25 71 81
Copyright 2001-2011 The Winthrop Corporation Distributed by Wright Investors' Service, Inc.
All Rights Reserved
Important Legal Notice THIS REPORT IS PROVIDED FOR GENERAL INFORMATION ONLY, IS NOT TO BE CONSIDERED AS INVESTMENT ADVICE AND SHOULD NOT BE RELIED UPON FOR INVESTMENT DECISIONS. NO REPRESENTATION OR WARRANTY IS MADE REGARDING THE ACCURACY, RELIABILITY OR TIMELINESS OF THE CONTENT. THE REPORTS ARE COMPUTER GENERATED AND MAY BE SUBJECT TO PROGRAMMATIC AND/OR CONTENT ERRORS. VISITORS SHOULD VERIFY INFORMATION WITH OTHER RELIABLE SOURCES. THIS REPORT IS PROVIDED AS IS, WITHOUT WARRANTY OF ANY KIND, EXPRESS OR IMPLIED, INCLUDING BUT NOT LIMITED TO WARRANTIES OF MERCHANTABILITY, FITNESS FOR A PARTICULAR PURPOSE OR NON-INFRINGEMENT. IN NO EVENT WILL THE WINTHROP CORPORATION, WRIGHT INVESTORS' SERVICE, INC. OR ANY OF THEIR DATA PROVIDERS BE LIABLE FOR ANY DIRECT, INDIRECT, SPECIAL OR
CONSEQUENTIAL DAMAGES, NO MATTER WHAT THE CAUSE. THE CONTENT OF THIS REPORT IS PROTECTED BY APPLICABLE COPYRIGHT LAWS. CONTENT MAY NOT BE REPRODUCED, DISTRIBUTED, MODIFIED OR FRAMED WITHOUT PRIOR WRITTEN PERMISSION.

Company Fundamentals\Summary Analysis
SUMMARY ANALYSIS: Golden Agri-Resources Limited Per Share- Singapore Dollars
Year Price Value Ratios Equity Capital Earnings Dividends
Fiscal Yr Ends:
December
Market Price Last
Price/ Earnings
Ratio
Price/ Book Ratio
Dividend Yield
% Earned Growth
% Profit Rate (ROE)
Book Value
Begin Yr
12 Month Earnings
Per Share%
Change
% Payout Ratio
12 Month Dividends Per Share
2002 D 0.03 6.2 0.2 0.0% 3.3% 3.3% 0.13 BE 0.00 n/c 0.0% 0.000
2003 D 0.05 13.7 0.4 0.0% 3.1% 3.1% 0.13 BE 0.00 -7.5% 0.0% 0.000
2004 D 0.10 9.1 0.8 0.0% 8.8% 8.8% 0.13 BE 0.01 185.3% 0.0% 0.000
2005 D 0.08 6.5 0.6 2.7% 7.8% 9.4% 0.13 BCE 0.01 12.5% 17.5% 0.002
2006 0.27 3.5 1.6 1.8% 41.8% 44.6% 0.17 BE 0.08 498.5% 6.2% 0.005
2007 0.94 5.8 3.5 0.9% 58.9% 60.6% 0.27 BCE 0.16 113.1% 5.5% A 0.009
2008 0.21 1.3 0.5 0.0% 38.7% 38.7% 0.42 BCE 0.16 0.8% 0.0% A 0.000
2009 0.51 6.7 0.9 0.8% 12.2% 12.8% 0.59 BE 0.08 -53.5% 5.4% A 0.004
2010 0.80 5.1 1.3 1.0% 23.9% 25.1% 0.63 BCE 0.16 109.2% 4.9% 0.008
9/23/2011 0.66 3.6 0.9 1.5% n/a n/a 0.72 0.18 n/c 5.6% 0.010
(A): ALL ITEMS ADJUSTED FOR STOCK SPLITS OR DIVIDENDS - 4% DIV ON 03/26/2009 &11.7:10 RIGHT ISSUE (08.87 DIV) ON 06/25/2009, 2:1 ON 02/20/2008, 2:1 ON 09/11/2007
(B): INCLUDES OR EXCLUDES EXTRAORDINARY CHARGE OR CREDIT - INCLUDES OR EXCLUDES EXTRAORDINARY CHARGE OR CREDIT, INCLS 0.04 PRETAX CR AND NOM PRETAX CHG IN 2009, INCLS 0.21 PRETAX CR AND NOM PRETAX CHG IN 2008, INCLUDES .29 PRETAX CR IN 2007, INCLS 0.01 PRETAX CHG IN 2006, INCLS NOM PRETAX CR AND NOM PRETAX CHG IN 2005, INCLS NOM PRETAX CHG IN 2004, INCLS NOM PRETAX CHG IN 2002, INCLS 0.01 PRETAX CHG IN 2000
(C): INCLUDES THE EFFECTS OF A CHANGE IN ACCOUNTING POLICIES OR TAX LAWS - - ADOPTED IFRS 3 (REVISED) BUSINESS COMBINATIONS, IAS 27 (REVISED) CONSOLIDATED AND SEPARATED FINANCIAL STATEMENTS, IAS 39 (AMENDMENT) FINANCIAL INSTRUMENTS, IAS 1 (AMENDMENT), IAS 7 (AMENDMENT), IAS 17 (AMENDMENT), IAS 36 (AMENDMENT), IAS 38 (AMENDMENT), IFRS 2 (AMENDMENT), IFRS 8 (AMENDMENT), IFRIC 9 (AMENDMENT) IN 2010. NO SIGNIFICANT EARNINGS IMPACT, - ADOPTED ALL NEW REVISED IFRS AND NEW INTERPRETATIONS TO IFRS RELEVANT TO ITS OPERATIONS IN 2008, EARNINGS IMPACT IMMATERIAL, ADOPTED IAS 1 AMENDMENTS PRESENTATION OF FINANCIAL STATEMENTS - CAPITAL DISCLOSURES, IFRS 7 FINANCIAL INSTRUMENTS: DISCLOSURES, IFRIC 10 INTERIM FINANCIAL REPORTING AND IMPAIRMENT, EARNINGS IMPACT IMMATERIAL, ADOPTED IFRS 3, IFRS 5, IAS 1, IAS 2, IAS 8, IAS 10, IAS 16, IAS 17, IAS 21, IAS 24, IAS 27, IAS 28, IAS 32, IAS 33 FOR EARNINGS PER SHARE (REVISED 2003) AND IAS 39 FOR FINANCIAL INSTRUMENTS: RECOGNITION & MEASUREMENT (REVISED 2004), EARNINGS IMPACT IMMATERIAL
(D): ACCOUNTS CONVERTED USING YEAR-END EXCHANGE RATE OF 1.66301 FOR BALANCE SHEET & AVERAGE RATE OF 1.66542 FOR INCOME STATEMENT & CASH FLOW STATEMENT IN 2005, 1.63199 & 1.68554 IN 2004, 1.69799 & 1.74201 IN 2003, 1.73500 & 1.78667 IN 2002, 1.84699 & 1.79617 IN 2001, 1.73400 AND 1.72819 IN 2000
(E): BASED ON AVERAGE SHARES OUTSTANDING
Copyright ©2000-2011 Distributed by Wright Investors' Service, Inc. All Rights Reserved. Except for quotations by established news media, no pages on this site may be reproduced, stored in a retrieval system, or transmitted for commercial purposes, in any form or by any means, electronic, mechanical, photocopying, recording, or otherwise without prior written permission. Information is believed reliable, but accuracy, completeness and opinions are not guaranteed.


Company Fundamentals\Sales Analysis
SALES ANALYSIS: Golden Agri-Resources Limited Figures in thousands of Singapore Dollars
Year
SalesCost of
Goods Sold
Earnings before Interest, Taxes,
Depreciation, and Amortization
(EBITDA)
After Tax Income before
Extraordinary Charges and
Credits Employees
Amount in
thousands
Year-to-year Growth
Amount in
thousands% of Sales
Amount in
thousands% of
Sales
Amount in
thousands% of
Sales Number
Sales Per
Employee
After Tax Income
Per Employee
2001 557,483 -16.9% 368,159 66.0% 28,949 5.2% -89,961 -
16.1% 33,600 16,592 -2,677
2002 923,344 65.6% 582,667 63.1% 198,233 21.5% 41,331 4.5% 33,230 27,786 1,244
2003 1,079,492 16.9% 743,305 68.9% 167,587 15.5% 38,535 3.6% 31,720 34,032 1,215
2004 1,280,523 18.6% 852,437 66.6% 311,203 24.3% 110,335 8.6% 31,448 40,719 3,509
2005 1,364,455 6.6% 985,264 72.2% 271,990 19.9% 124,244 9.1% n/a n/a n/a
2006 1,785,233 30.8% 1,304,621 73.1% 1,292,648 72.4% 743,644 41.7% n/a n/a n/a
2007 2,811,246 57.5% 1,763,385 62.7% 2,830,187 100.7% 1,747,945 62.2% n/a n/a n/a
2008 4,207,858 49.7% 2,907,858 69.1% 2,874,555 68.3% 1,948,283 46.3% n/a n/a n/a
2009 3,327,423 -20.9% 2,509,350 75.4% 1,016,924 30.6% 880,508 26.5% n/a n/a n/a
2010 4,757,820 43.0% 3,380,165 71.0% 2,795,772 58.8% 1,931,883 40.6% n/a n/a n/a
Copyright ©2000-2011 Distributed by Wright Investors' Service, Inc. All Rights Reserved. Except for quotations by established news media, no pages on this site may be reproduced, stored in a retrieval system, or transmitted for commercial purposes, in any form or by any means, electronic, mechanical, photocopying, recording, or otherwise without prior written permission. Information is believed reliable, but accuracy, completeness and opinions are not guaranteed.

Company Fundamentals\Price Analysis
PRICE ANALYSIS: Golden Agri-Resources Limited Per Share- Singapore Dollars
QuarterHigh Price
Low Price
Closing Price
Quarterly %Change
12 months %Change
2002 Jan - Mar 0.032 0.022 0.028 n/a n/a
Apr - Jun 0.028 0.021 0.023 -16.0% n/a
Jul - Sep 0.025 0.020 0.022 -4.7% n/a
Oct - Dec 0.028 0.022 0.026 20.0% n/a
2003 Jan - Mar 0.033 0.026 0.032 20.8% 16.0%
Apr - Jun 0.051 0.031 0.043 34.5% 85.7%
Jul - Sep 0.066 0.042 0.063 46.2% 185.0%
Oct - Dec 0.068 0.049 0.054 -14.0% 104.2%
2004 Jan - Mar 0.081 0.054 0.079 46.9% 148.3%
Apr - Jun 0.083 0.077 0.082 2.8% 89.8%
Jul - Sep 0.095 0.082 0.092 12.2% 45.6%
Oct - Dec 0.104 0.091 0.103 12.0% 89.8%
2005 Jan - Mar 0.112 0.102 0.108 5.4% 36.1%
Apr - Jun 0.117 0.106 0.113 4.1% 37.8%
Jul - Sep 0.115 0.072 0.079 -29.4% -13.3%
Oct - Dec 0.093 0.070 0.082 2.8% -20.4%
2006 Jan - Mar 0.448 0.083 0.156 90.5% 43.9%
Apr - Jun 0.169 0.148 0.155 -0.7% 37.3%
Jul - Sep 0.208 0.150 0.195 26.4% 145.8%
Oct - Dec 0.287 0.193 0.267 36.7% 227.0%
2007 Jan - Mar 0.402 0.249 0.389 45.5% 149.6%
Apr - Jun 0.662 0.382 0.574 47.7% 271.4%
Jul - Sep 0.989 0.349 0.627 9.2% 220.9%
Oct - Dec 0.989 0.578 0.936 49.3% 250.4%
2008 Jan - Mar 1.899 0.623 0.879 -6.1% 126.1%
Apr - Jun 0.971 0.733 0.795 -9.5% 38.5%
Jul - Sep 0.808 0.252 0.278 -65.0% -55.6%
Oct - Dec 0.300 0.137 0.208 -25.4% -77.8%
2009 Jan - Mar 0.300 0.208 0.253 21.7% -71.3%
Apr - Jun 0.455 0.248 0.380 50.4% -52.2%
Jul - Sep 0.520 0.285 0.430 13.2% 54.6%

Oct - Dec 0.510 0.395 0.510 18.6% 145.7%
2010 Jan - Mar 0.655 0.490 0.580 13.7% 129.6%
Apr - Jun 0.625 0.480 0.530 -8.6% 39.5%
Jul - Sep 0.620 0.510 0.570 7.5% 32.6%
Oct - Dec 0.810 0.565 0.800 40.4% 56.9%
2011 Jan - Mar 0.830 0.610 0.690 -13.8% 19.0%
Apr - Jun 0.735 0.640 0.680 -1.4% 28.3%
9/23/2011 0.660 -2.9% 13.8%
Copyright ©2000-2011 Distributed by Wright Investors' Service, Inc. All Rights Reserved. Except for quotations by established news media, no pages on this site may be reproduced, stored in a retrieval system, or transmitted for commercial purposes, in any form or by any means, electronic, mechanical, photocopying, recording, or otherwise without prior written permission. Information is believed reliable, but accuracy, completeness and opinions are not guaranteed.

Company Fundamentals\Earnings & Dividends Analysis
EARNINGS AND DIVIDENDS ANALYSIS: Golden Agri-Resources Limited Per Share- Singapore Dollars Fiscal Year Ends in December
(A): ALL ITEMS ADJUSTED FOR STOCK SPLITS OR DIVIDENDS - 4% DIV ON 03/26/2009 &11.7:10 RIGHT ISSUE (08.87 DIV) ON 06/25/2009, 2:1 ON 02/20/2008, 2:1 ON 09/11/2007
(B): INCLUDES OR EXCLUDES EXTRAORDINARY CHARGE OR CREDIT - INCLUDES OR EXCLUDES EXTRAORDINARY CHARGE OR CREDIT, INCLS 0.04 PRETAX CR AND NOM PRETAX CHG IN 2009, INCLS 0.21 PRETAX CR AND NOM PRETAX CHG IN 2008, INCLUDES .29 PRETAX CR IN 2007, INCLS 0.01 PRETAX CHG IN 2006, INCLS NOM PRETAX CR AND NOM PRETAX CHG IN 2005, INCLS NOM PRETAX CHG IN 2004, INCLS NOM PRETAX CHG IN 2002
(C): INCLUDES THE EFFECTS OF A CHANGE IN ACCOUNTING POLICIES OR TAX LAWS - - ADOPTED IFRS 3 (REVISED) BUSINESS COMBINATIONS, IAS 27 (REVISED) CONSOLIDATED AND SEPARATED FINANCIAL STATEMENTS, IAS 39 (AMENDMENT) FINANCIAL INSTRUMENTS, IAS 1 (AMENDMENT), IAS 7 (AMENDMENT), IAS 17 (AMENDMENT), IAS 36 (AMENDMENT), IAS 38 (AMENDMENT), IFRS 2 (AMENDMENT), IFRS 8 (AMENDMENT), IFRIC 9 (AMENDMENT) IN 2010. NO SIGNIFICANT EARNINGS IMPACT, - ADOPTED ALL NEW REVISED IFRS AND NEW INTERPRETATIONS TO IFRS RELEVANT TO ITS OPERATIONS IN 2008, EARNINGS IMPACT IMMATERIAL, ADOPTED IAS 1 AMENDMENTS PRESENTATION OF FINANCIAL STATEMENTS - CAPITAL DISCLOSURES, IFRS 7 FINANCIAL INSTRUMENTS: DISCLOSURES, IFRIC 10 INTERIM FINANCIAL REPORTING AND IMPAIRMENT, EARNINGS IMPACT IMMATERIAL, ADOPTED IFRS 3, IFRS 5, IAS 1, IAS 2, IAS 8, IAS 10, IAS 16, IAS 17, IAS 21, IAS 24, IAS 27, IAS 28, IAS 32, IAS 33 FOR EARNINGS PER SHARE (REVISED 2003) AND IAS 39 FOR FINANCIAL INSTRUMENTS: RECOGNITION & MEASUREMENT (REVISED 2004), EARNINGS IMPACT IMMATERIAL
Fiscal Years
Earnings Per Share Dividends Per Share
12 Months Quarterly Reported Earnings 12 Months Quarterly Reported Dividends
Earnings%
ChangeQ1
Mar.Q2
Jun.Q3
Sep.Q4
Dec. Dividends%
ChangeQ1
Mar.Q2
Jun.Q3
Sep.Q4
Dec.%
Payout
2000 0.00 -85.4% n/a n/a n/a n/a 0.000 n/c n/a n/a n/a 0.000 27.4%
2001 D
E -0.01 n/c n/a 0.00 n/a -0.01 0.000 n/c n/a n/a n/a 0.000 0.0%
2002 D
BE 0.00 n/c n/a 0.00 n/a 0.00 0.000 n/c n/a n/a n/a 0.000 0.0%
2003 D
BE 0.00 -7.5% 0.00 0.00 -0.00 0.00 0.000 n/c n/a n/a n/a 0.000 0.0%
2004 D
BE 0.01 185.3% 0.01 0.01 0.00 -0.00 0.000 n/c n/a n/a n/a 0.000 0.0%
2005 D
BCE 0.01 12.5% 0.00 0.00 0.00 0.00 0.002 n/c n/a n/a n/a 0.002 0.0%
2006 BE 0.08 498.5% 0.03 0.02 0.02 0.01 0.005 114.5% n/a n/a n/a 0.005 2.9%
2007 BCE 0.16 113.1% 0.03 0.03 0.02 0.08 A 0.004 -6.4% 0.004 0.000 n/a 0.004 6.1%
2008 BCE 0.16 0.8% 0.05 0.08 0.02 0.01 n/a n/c n/a 0.007 n/a n/a 6.7%
2009 BE 0.08 -53.5% 0.00 0.01 0.01 0.06 A 0.004 n/c n/a 0.000 n/a 0.004 0.4%
2010 BCE 0.16 109.2% 0.00 0.01 0.01 0.14 0.008 89.7% n/a 0.000 n/a 0.008 3.1%
2011 n/a n/c 0.02 0.02 n/a n/a n/a n/c n/a n/a n/a n/a n/c

(D): ACCOUNTS CONVERTED USING YEAR-END EXCHANGE RATE OF 1.66301 FOR BALANCE SHEET & AVERAGE RATE OF 1.66542 FOR INCOME STATEMENT & CASH FLOW STATEMENT IN 2005, 1.63199 & 1.68554 IN 2004, 1.69799 & 1.74201 IN 2003, 1.73500 & 1.78667 IN 2002, 1.84699 & 1.79617 IN 2001
(E): BASED ON AVERAGE SHARES OUTSTANDING
Copyright ©2000-2011 Distributed by Wright Investors' Service, Inc. All Rights Reserved. Except for quotations by established news media, no pages on this site may be reproduced, stored in a retrieval system, or transmitted for commercial purposes, in any form or by any means, electronic, mechanical, photocopying, recording, or otherwise without prior written permission. Information is believed reliable, but accuracy, completeness and opinions are not guaranteed.

Financial Statement AnalysesFinancial Statement Analyses\Balance Sheet - Common Size
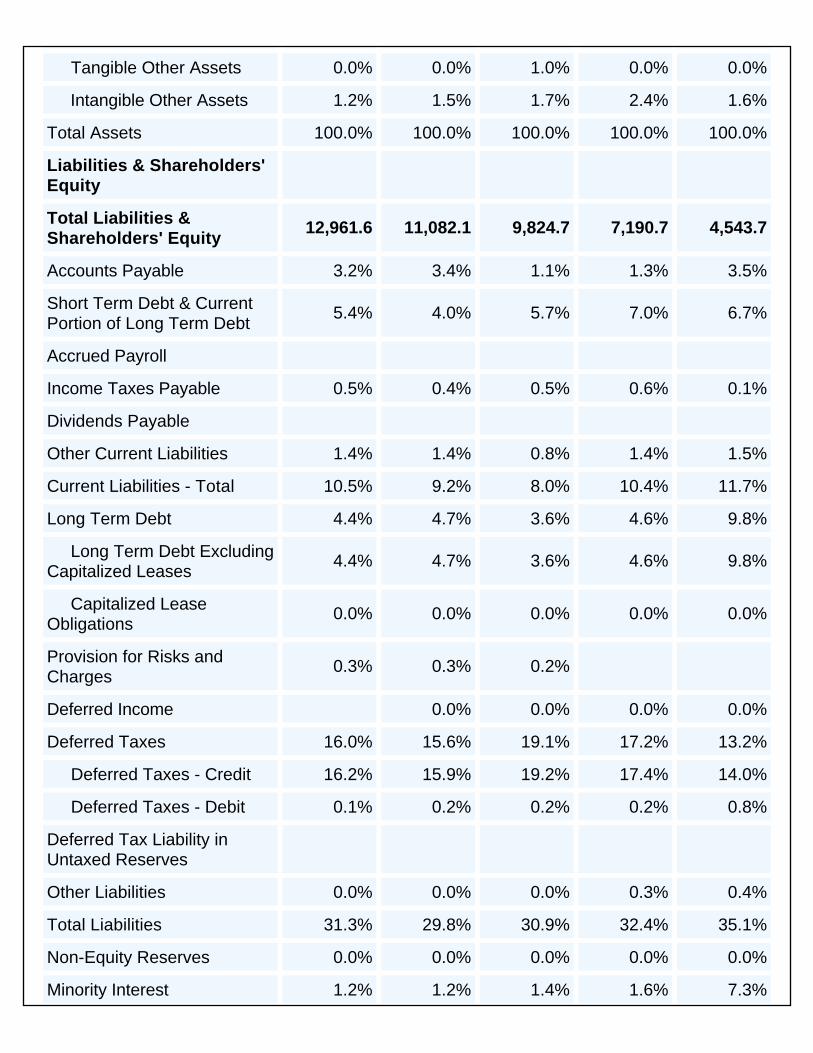
Balance Sheet - (Common Size): Golden Agri-Resources Limited Figures are expressed as Percent of Total Assets. Total Assets are in millions of Singapore Dollars.
Fiscal Year 2010 2009 2008 2007 2006
Fiscal Year End Date 12/31/2010 12/31/2009 12/31/2008 12/31/2007 12/31/2006
Assets
Total Assets 12,961.6 11,082.1 9,824.7 7,190.7 4,543.7
Cash & Short Term Investments
2.7% 4.5% 2.0% 2.9% 4.5%
Cash 2.2% 3.0% 1.6% 0.9% 1.9%
Short Term Investments 0.6% 1.5% 0.4% 2.0% 2.6%
Receivables (Net) 2.3% 1.9% 2.9% 3.3% 2.4%
Inventories -Total 8.5% 6.3% 4.7% 7.1% 6.0%
Raw Materials 3.3% 2.4% 1.0% 3.3% 2.6%
Work in Process
Finished Goods 1.2% 1.2% 0.9% 1.5% 1.2%
Progress Payments & Other
4.0% 2.7% 2.9% 2.3% 2.2%
Prepaid Expenses 1.1% 0.7% 0.6% 1.1% 0.9%
Other Current Assets 0.1% 0.7% 0.1% 0.9% 0.5%
Current Assets - Total 14.8% 14.0% 10.4% 15.3% 14.3%
Long Term Receivables 1.5% 2.0% 1.8% 2.4% 4.7%
Investment in Associated Companies
0.1% 0.1% 0.1% 0.4% 0.6%
Other Investments 0.5% 0.3% 0.4% 0.5% 0.0%
Property Plant and Equipment - Gross
87.5% 88.5% 91.3% 85.9% 88.7%
Accumulated Depreciation 5.7% 6.5% 6.6% 7.0% 10.1%
Property Plant and Equipment – Net
81.8% 82.0% 84.6% 79.0% 78.6%
Other Assets 1.3% 1.6% 2.8% 2.5% 1.8%
Deferred Charges 0.1% 0.1% 0.1% 0.1% 0.2%
Tangible Other Assets 0.0% 0.0% 1.0% 0.0% 0.0%
Intangible Other Assets 1.2% 1.5% 1.7% 2.4% 1.6%
Total Assets 100.0% 100.0% 100.0% 100.0% 100.0%
Liabilities & Shareholders' Equity
Total Liabilities & Shareholders' Equity
12,961.6 11,082.1 9,824.7 7,190.7 4,543.7
Accounts Payable 3.2% 3.4% 1.1% 1.3% 3.5%
Short Term Debt & Current Portion of Long Term Debt
5.4% 4.0% 5.7% 7.0% 6.7%
Accrued Payroll
Income Taxes Payable 0.5% 0.4% 0.5% 0.6% 0.1%
Dividends Payable
Other Current Liabilities 1.4% 1.4% 0.8% 1.4% 1.5%
Current Liabilities - Total 10.5% 9.2% 8.0% 10.4% 11.7%
Long Term Debt 4.4% 4.7% 3.6% 4.6% 9.8%
Long Term Debt Excluding Capitalized Leases
4.4% 4.7% 3.6% 4.6% 9.8%
Capitalized Lease Obligations
0.0% 0.0% 0.0% 0.0% 0.0%
Provision for Risks and Charges
0.3% 0.3% 0.2%
Deferred Income 0.0% 0.0% 0.0% 0.0%
Deferred Taxes 16.0% 15.6% 19.1% 17.2% 13.2%
Deferred Taxes - Credit 16.2% 15.9% 19.2% 17.4% 14.0%
Deferred Taxes - Debit 0.1% 0.2% 0.2% 0.2% 0.8%
Deferred Tax Liability in Untaxed Reserves
Other Liabilities 0.0% 0.0% 0.0% 0.3% 0.4%
Total Liabilities 31.3% 29.8% 30.9% 32.4% 35.1%
Non-Equity Reserves 0.0% 0.0% 0.0% 0.0% 0.0%
Minority Interest 1.2% 1.2% 1.4% 1.6% 7.3%

Preferred Stock 0.0% 0.0% 0.0% 0.0% 0.0%
Preferred Stock Issued for ESOP
ESOP Guarantees - Preferred Issued
Common Equity 67.6% 69.0% 67.7% 66.0% 57.6%
Total Liabilities & Shareholders' Equity
100.0% 100.0% 100.0% 100.0% 100.0%
Copyright ©2000-2011 Distributed by Wright Investors' Service, Inc. All Rights Reserved. Except for quotations by established news media, no pages on this site may be reproduced, stored in a retrieval system, or transmitted for commercial purposes, in any form or by any means, electronic, mechanical, photocopying, recording, or otherwise without prior written permission. Information is believed reliable, but accuracy, completeness and opinions are not guaranteed.
Financial Statement Analyses\Balance Sheet - Year-Year % Change
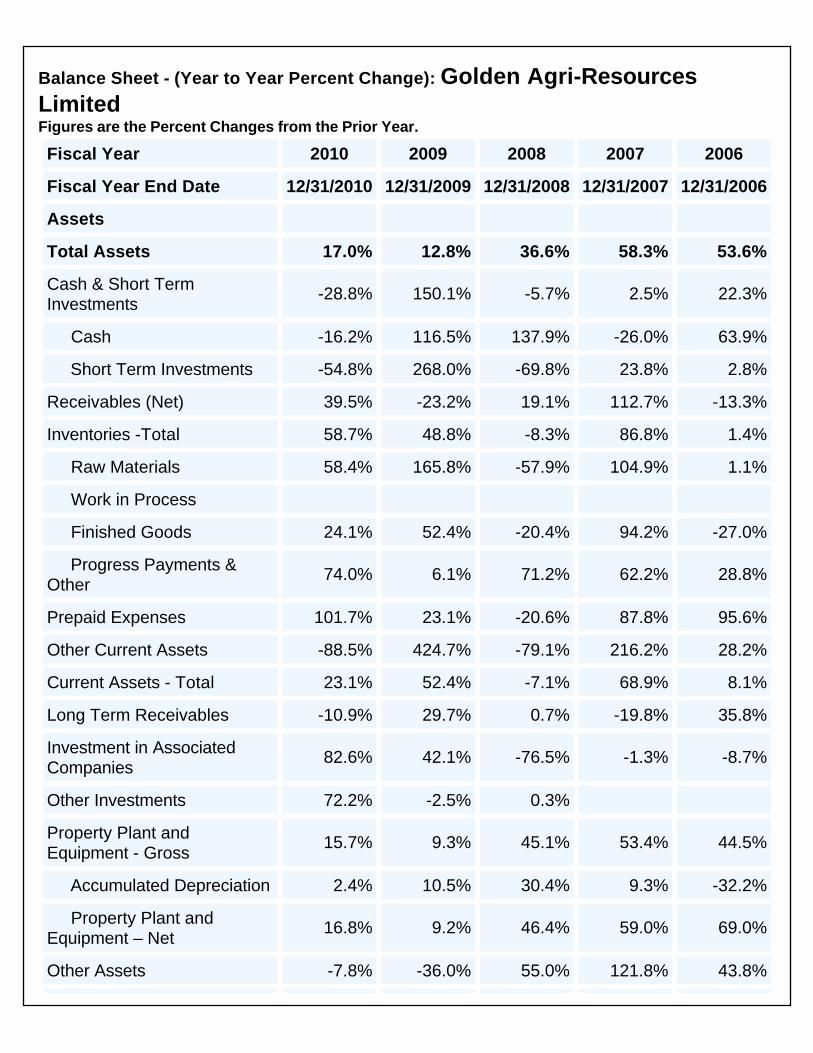
Balance Sheet - (Year to Year Percent Change): Golden Agri-Resources Limited Figures are the Percent Changes from the Prior Year.
Fiscal Year 2010 2009 2008 2007 2006
Fiscal Year End Date 12/31/2010 12/31/2009 12/31/2008 12/31/2007 12/31/2006
Assets
Total Assets 17.0% 12.8% 36.6% 58.3% 53.6%
Cash & Short Term Investments
-28.8% 150.1% -5.7% 2.5% 22.3%
Cash -16.2% 116.5% 137.9% -26.0% 63.9%
Short Term Investments -54.8% 268.0% -69.8% 23.8% 2.8%
Receivables (Net) 39.5% -23.2% 19.1% 112.7% -13.3%
Inventories -Total 58.7% 48.8% -8.3% 86.8% 1.4%
Raw Materials 58.4% 165.8% -57.9% 104.9% 1.1%
Work in Process
Finished Goods 24.1% 52.4% -20.4% 94.2% -27.0%
Progress Payments & Other
74.0% 6.1% 71.2% 62.2% 28.8%
Prepaid Expenses 101.7% 23.1% -20.6% 87.8% 95.6%
Other Current Assets -88.5% 424.7% -79.1% 216.2% 28.2%
Current Assets - Total 23.1% 52.4% -7.1% 68.9% 8.1%
Long Term Receivables -10.9% 29.7% 0.7% -19.8% 35.8%
Investment in Associated Companies
82.6% 42.1% -76.5% -1.3% -8.7%
Other Investments 72.2% -2.5% 0.3%
Property Plant and Equipment - Gross
15.7% 9.3% 45.1% 53.4% 44.5%
Accumulated Depreciation 2.4% 10.5% 30.4% 9.3% -32.2%
Property Plant and Equipment – Net
16.8% 9.2% 46.4% 59.0% 69.0%
Other Assets -7.8% -36.0% 55.0% 121.8% 43.8%

Deferred Charges 10.6% 26.0% 11.7% -7.8% 12.9%
Tangible Other Assets -100.0%
Intangible Other Assets -9.0% -2.8% 0.0% 137.3% 48.7%
Total Assets 17.0% 12.8% 36.6% 58.3% 53.6%
Liabilities & Shareholders' Equity
Total Liabilities & Shareholders' Equity
17.0% 12.8% 36.6% 58.3% 53.6%
Accounts Payable 11.6% 250.4% 15.4% -41.1% -22.6%
Short Term Debt & Current Portion of Long Term Debt
57.1% -20.6% 10.2% 66.0% 4.3%
Accrued Payroll
Income Taxes Payable 20.3% 6.2% 4.1% 878.7% 35.7%
Dividends Payable
Other Current Liabilities 24.6% 88.4% -21.7% 52.8% -19.0%
Current Liabilities - Total 33.7% 28.9% 6.1% 39.5% -8.3%
Long Term Debt 9.7% 47.3% 7.2% -26.1% 28.4%
Long Term Debt Excluding Capitalized Leases
9.7% 47.3% 7.2% -26.0% 28.9%
Capitalized Lease Obligations
-19.3% 286.0% -14.0% -95.9% -55.5%
Provision for Risks and Charges
26.0% 44.3%
Deferred Income
Deferred Taxes 20.0% -7.5% 51.7% 105.4% 324.2%
Deferred Taxes - Credit 19.1% -7.0% 51.0% 96.6% 270.5%
Deferred Taxes - Debit -40.9% 47.2% -0.5% -50.4% 18.5%
Deferred Tax Liability in Untaxed Reserves
Other Liabilities 428.6% -100.0% 24.3% 499.3%
Total Liabilities 22.7% 8.7% 30.4% 45.9% 48.8%
Non-Equity Reserves

Minority Interest 13.3% 0.6% 18.7% -65.9% 51.2%
Preferred Stock
Preferred Stock Issued for ESOP
ESOP Guarantees - Preferred Issued
Common Equity 14.5% 14.9% 40.1% 81.6% 57.0%
Total Liabilities & Shareholders' Equity
17.0% 12.8% 36.6% 58.3% 53.6%
Copyright ©2000-2011 Distributed by Wright Investors' Service, Inc. All Rights Reserved. Except for quotations by established news media, no pages on this site may be reproduced, stored in a retrieval system, or transmitted for commercial purposes, in any form or by any means, electronic, mechanical, photocopying, recording, or otherwise without prior written permission. Information is believed reliable, but accuracy, completeness and opinions are not guaranteed.

Financial Statement Analyses\Balance Sheet - Five-Year Averages
Balance Sheet - (5 Year Averages): Golden Agri-Resources Limited Figures in millions of Singapore Dollars.
Fiscal Year 2010 2009 2008 2007 2006
Fiscal Year End Date 12/31/2010 12/31/2009 12/31/2008 12/31/2007 12/31/2006
Assets
Total Assets 9,120.5 7,120.0 5,348.6 3,837.4 2,865.4
Cash & Short Term Investments
293.2 256.0 186.4 160.5 131.9
Cash 184.6 139.2 78.0 56.0 53.5
Short Term Investments 108.5 116.8 108.4 104.5 78.4
Receivables (Net) 229.0 194.3 163.9 124.0 109.1
Inventories -Total 608.7 442.1 335.4 272.5 190.3
Raw Materials 228.6 167.2 126.4 121.5 84.3
Work in Process
Finished Goods 107.0 90.0 81.0 71.8 54.9
Progress Payments & Other
273.1 185.0 128.0 79.2 51.1
Prepaid Expenses 79.6 54.0 43.5 38.6 26.9
Other Current Assets 37.0 38.6 23.9 21.1 7.6
Current Assets - Total 1,247.5 985.1 753.0 616.6 465.7
Long Term Receivables 196.2 187.8 230.0 291.1 356.4
Investment in Associated Companies
17.3 20.0 24.2 30.4 32.1
Other Investments 33.6 21.5 14.4 10.4 6.1
Property Plant and Equipment - Gross
8,065.0 6,353.4 4,769.5 3,352.5 2,489.2
Accumulated Depreciation 613.6 600.9 571.2 544.7 539.3
Property Plant and Equipment – Net
7,451.4 5,752.5 4,198.3 2,807.8 1,949.9
Other Assets 174.5 153.1 128.6 81.0 55.2
Deferred Charges 9.8 8.8 7.8 7.2 6.7

Tangible Other Assets 19.4 19.4 21.9 2.6 3.7
Intangible Other Assets 145.4 124.9 98.9 71.2 44.8
Total Assets 9,120.5 7,120.0 5,348.6 3,837.4 2,865.4
Liabilities & Shareholders' Equity
Total Liabilities & Shareholders' Equity
9,120.5 7,120.0 5,348.6 3,837.4 2,865.4
Accounts Payable 231.6 188.3 124.6 113.5 104.9
Short Term Debt & Current Portion of Long Term Debt
500.1 419.7 377.3 347.9 359.3
Accrued Payroll
Income Taxes Payable 40.9 29.7 20.7 12.1 6.0
Dividends Payable
Other Current Liabilities 117.0 96.0 82.7 91.4 100.1
Current Liabilities - Total 889.6 733.7 605.2 565.0 570.4
Long Term Debt 442.8 398.3 383.2 385.2 373.0
Long Term Debt Excluding Capitalized Leases
442.6 397.6 382.5 384.5 372.2
Capitalized Lease Obligations
0.3 0.7 0.7 0.7 0.7
Provision for Risks and Charges
Deferred Income 0.0
Deferred Taxes 1,503.4 1,116.1 776.8 404.0 154.0
Deferred Taxes - Credit 1,525.9 1,141.6
Deferred Taxes - Debit 22.5 25.5
Deferred Tax Liability in Untaxed Reserves
Other Liabilities 8.0 8.3 8.2 8.9 4.7
Total Liabilities 2,863.0 2,267.4 1,778.0 1,363.2 1,102.0
Non-Equity Reserves 0.0 0.0
Minority Interest 173.5 186.8 170.6 153.0 145.9
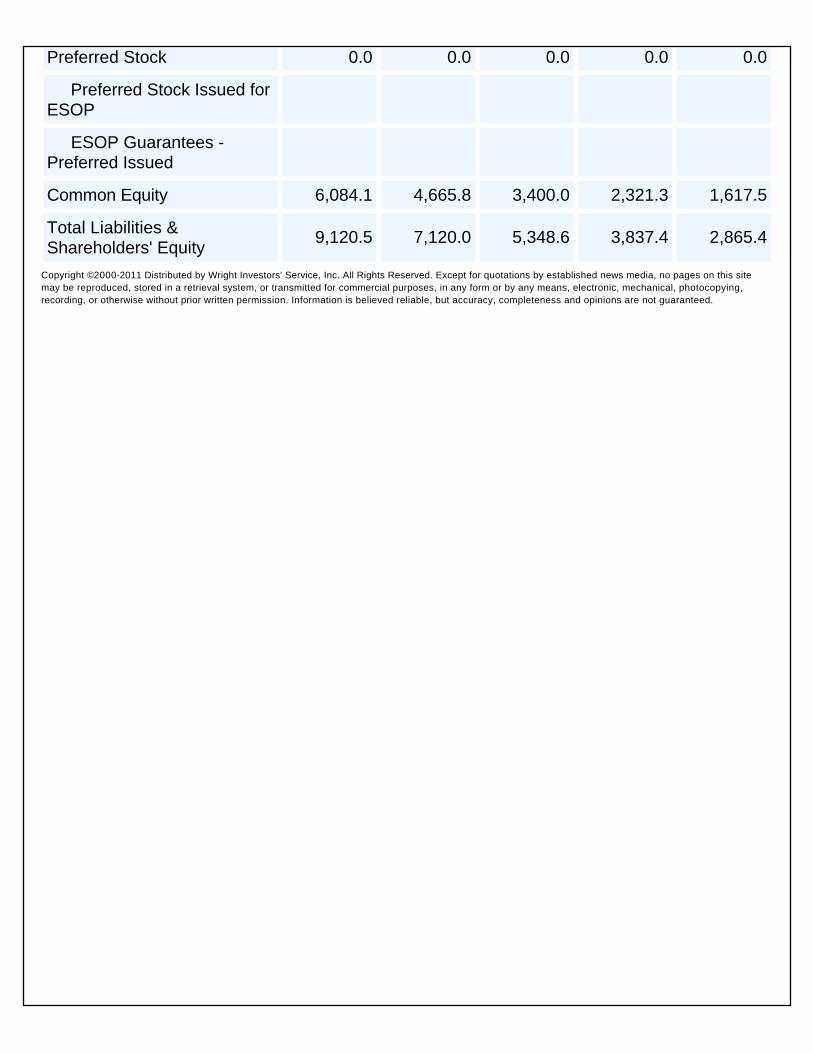
Preferred Stock 0.0 0.0 0.0 0.0 0.0
Preferred Stock Issued for ESOP
ESOP Guarantees - Preferred Issued
Common Equity 6,084.1 4,665.8 3,400.0 2,321.3 1,617.5
Total Liabilities & Shareholders' Equity
9,120.5 7,120.0 5,348.6 3,837.4 2,865.4
Copyright ©2000-2011 Distributed by Wright Investors' Service, Inc. All Rights Reserved. Except for quotations by established news media, no pages on this site may be reproduced, stored in a retrieval system, or transmitted for commercial purposes, in any form or by any means, electronic, mechanical, photocopying, recording, or otherwise without prior written permission. Information is believed reliable, but accuracy, completeness and opinions are not guaranteed.
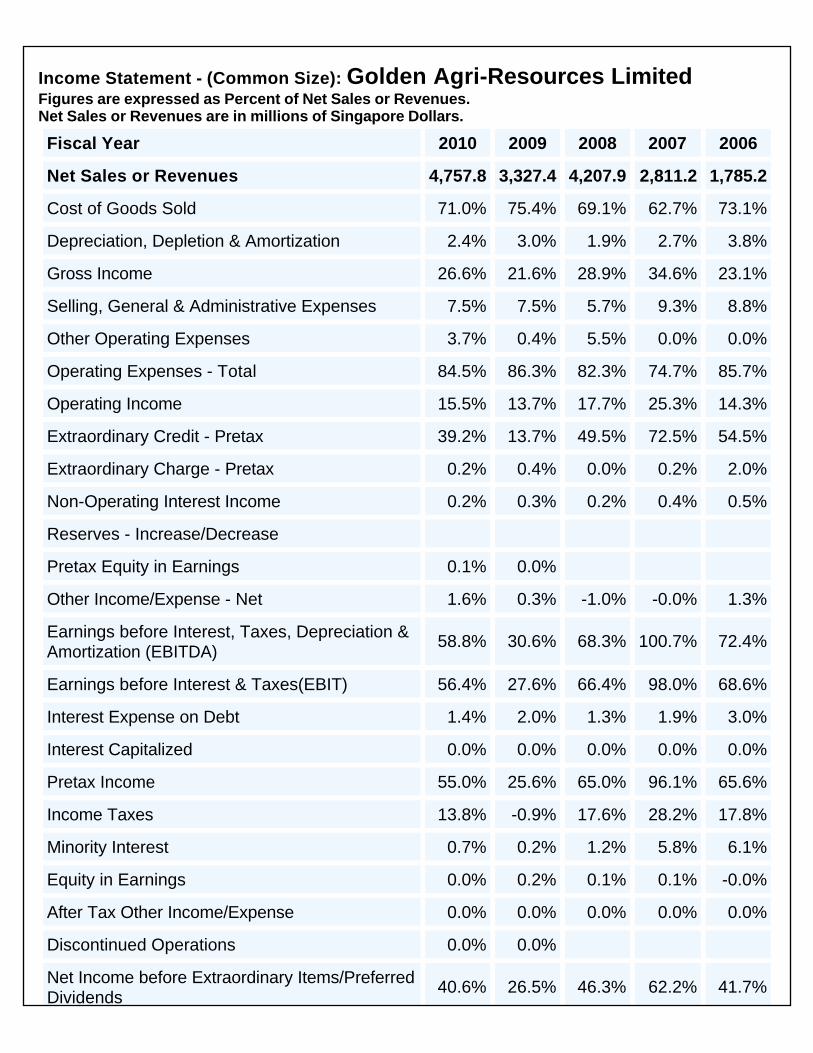
Financial Statement Analyses\Income Statement - Common Size
Income Statement - (Common Size): Golden Agri-Resources Limited Figures are expressed as Percent of Net Sales or Revenues. Net Sales or Revenues are in millions of Singapore Dollars.
Fiscal Year 2010 2009 2008 2007 2006
Net Sales or Revenues 4,757.8 3,327.4 4,207.9 2,811.2 1,785.2
Cost of Goods Sold 71.0% 75.4% 69.1% 62.7% 73.1%
Depreciation, Depletion & Amortization 2.4% 3.0% 1.9% 2.7% 3.8%
Gross Income 26.6% 21.6% 28.9% 34.6% 23.1%
Selling, General & Administrative Expenses 7.5% 7.5% 5.7% 9.3% 8.8%
Other Operating Expenses 3.7% 0.4% 5.5% 0.0% 0.0%
Operating Expenses - Total 84.5% 86.3% 82.3% 74.7% 85.7%
Operating Income 15.5% 13.7% 17.7% 25.3% 14.3%
Extraordinary Credit - Pretax 39.2% 13.7% 49.5% 72.5% 54.5%
Extraordinary Charge - Pretax 0.2% 0.4% 0.0% 0.2% 2.0%
Non-Operating Interest Income 0.2% 0.3% 0.2% 0.4% 0.5%
Reserves - Increase/Decrease
Pretax Equity in Earnings 0.1% 0.0%
Other Income/Expense - Net 1.6% 0.3% -1.0% -0.0% 1.3%
Earnings before Interest, Taxes, Depreciation & Amortization (EBITDA)
58.8% 30.6% 68.3% 100.7% 72.4%
Earnings before Interest & Taxes(EBIT) 56.4% 27.6% 66.4% 98.0% 68.6%
Interest Expense on Debt 1.4% 2.0% 1.3% 1.9% 3.0%
Interest Capitalized 0.0% 0.0% 0.0% 0.0% 0.0%
Pretax Income 55.0% 25.6% 65.0% 96.1% 65.6%
Income Taxes 13.8% -0.9% 17.6% 28.2% 17.8%
Minority Interest 0.7% 0.2% 1.2% 5.8% 6.1%
Equity in Earnings 0.0% 0.2% 0.1% 0.1% -0.0%
After Tax Other Income/Expense 0.0% 0.0% 0.0% 0.0% 0.0%
Discontinued Operations 0.0% 0.0%
Net Income before Extraordinary Items/Preferred Dividends
40.6% 26.5% 46.3% 62.2% 41.7%

Extraordinary Items & Gain/Loss Sale of Assets 0.0% 0.0% 0.0% 0.0% 0.0%
Preferred Dividend Requirements 0.0% 0.0% 0.0% 0.0% 0.0%
Net Income after Preferred Dividends - available to Common
40.6% 26.5% 46.3% 62.2% 41.7%
Copyright ©2000-2011 Distributed by Wright Investors' Service, Inc. All Rights Reserved. Except for quotations by established news media, no pages on this site may be reproduced, stored in a retrieval system, or transmitted for commercial purposes, in any form or by any means, electronic, mechanical, photocopying, recording, or otherwise without prior written permission. Information is believed reliable, but accuracy, completeness and opinions are not guaranteed.
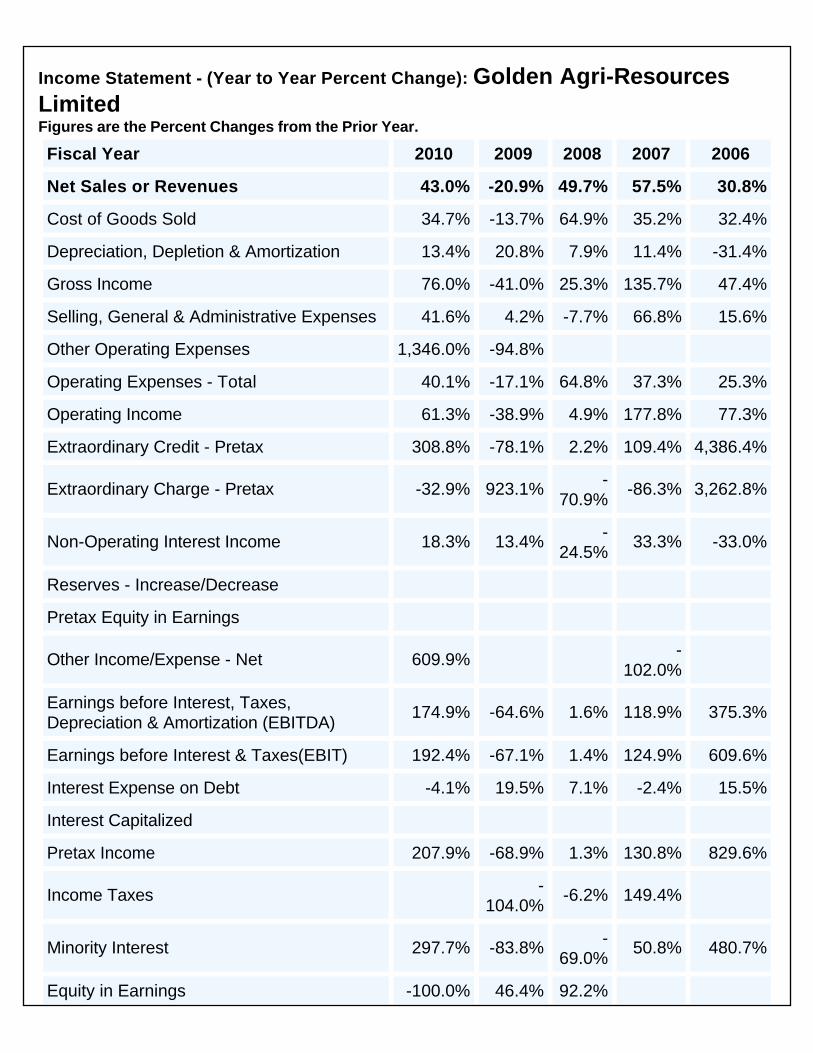
Financial Statement Analyses\Income Statement - Year-Year % Change
Income Statement - (Year to Year Percent Change): Golden Agri-Resources Limited Figures are the Percent Changes from the Prior Year.
Fiscal Year 2010 2009 2008 2007 2006
Net Sales or Revenues 43.0% -20.9% 49.7% 57.5% 30.8%
Cost of Goods Sold 34.7% -13.7% 64.9% 35.2% 32.4%
Depreciation, Depletion & Amortization 13.4% 20.8% 7.9% 11.4% -31.4%
Gross Income 76.0% -41.0% 25.3% 135.7% 47.4%
Selling, General & Administrative Expenses 41.6% 4.2% -7.7% 66.8% 15.6%
Other Operating Expenses 1,346.0% -94.8%
Operating Expenses - Total 40.1% -17.1% 64.8% 37.3% 25.3%
Operating Income 61.3% -38.9% 4.9% 177.8% 77.3%
Extraordinary Credit - Pretax 308.8% -78.1% 2.2% 109.4% 4,386.4%
Extraordinary Charge - Pretax -32.9% 923.1% -70.9%
-86.3% 3,262.8%
Non-Operating Interest Income 18.3% 13.4% -24.5%
33.3% -33.0%
Reserves - Increase/Decrease
Pretax Equity in Earnings
Other Income/Expense - Net 609.9% -102.0%
Earnings before Interest, Taxes, Depreciation & Amortization (EBITDA)
174.9% -64.6% 1.6% 118.9% 375.3%
Earnings before Interest & Taxes(EBIT) 192.4% -67.1% 1.4% 124.9% 609.6%
Interest Expense on Debt -4.1% 19.5% 7.1% -2.4% 15.5%
Interest Capitalized
Pretax Income 207.9% -68.9% 1.3% 130.8% 829.6%
Income Taxes -104.0%
-6.2% 149.4%
Minority Interest 297.7% -83.8% -69.0%
50.8% 480.7%
Equity in Earnings -100.0% 46.4% 92.2%

After Tax Other Income/Expense
Discontinued Operations
Net Income before Extraordinary Items/Preferred Dividends
119.4% -54.8% 11.5% 135.1% 498.5%
Extraordinary Items & Gain/Loss Sale of Assets
Preferred Dividend Requirements
Net Income after Preferred Dividends - available to Common
119.4% -54.8% 11.5% 135.1% 498.5%
Copyright ©2000-2011 Distributed by Wright Investors' Service, Inc. All Rights Reserved. Except for quotations by established news media, no pages on this site may be reproduced, stored in a retrieval system, or transmitted for commercial purposes, in any form or by any means, electronic, mechanical, photocopying, recording, or otherwise without prior written permission. Information is believed reliable, but accuracy, completeness and opinions are not guaranteed.

Financial Statement Analyses\Income Statement - Five-Year Averages
Income Statement - (5 Year Averages): Golden Agri-Resources Limited Figures in millions of Singapore Dollars.
Fiscal Year 2010 2009 2008 2007 2006
Net Sales or Revenues 3,377.9 2,699.2 2,289.9 1,664.2 1,286.6
Cost of Goods Sold 2,373.1 1,894.1 1,562.7 1,129.8 893.7
Depreciation, Depletion & Amortization 87.5 85.0 85.4 85.6 88.7
Gross Income 917.3 720.2 641.7 448.8 304.2
Selling, General & Administrative Expenses 253.2 209.1 182.8 157.1 127.1
Other Operating Expenses 83.5 48.7 46.3 0.0 0.0
Operating Expenses - Total 2,797.3 2,236.9 1,877.2 1,372.5 1,109.5
Operating Income 580.6 462.4 412.6 291.7 177.1
Extraordinary Credit - Pretax 1,483.0 1,114.2 1,022.9 606.6 199.0
Extraordinary Charge - Pretax 13.1 11.4 11.8 22.4 24.3
Non-Operating Interest Income 9.5 9.8 9.3 9.4 10.3
Reserves - Increase/Decrease
Pretax Equity in Earnings
Other Income/Expense - Net 13.6 -2.7 -2.4 3.9 -2.5
Earnings before Interest, Taxes, Depreciation & Amortization (EBITDA)
2,162.0 1,657.3 1,516.1 974.7 448.3
Earnings before Interest & Taxes(EBIT) 2,074.5 1,572.3 1,430.7 889.1 359.6
Interest Expense on Debt 58.9 55.3 52.0 51.0 54.0
Interest Capitalized 0.0 0.0 0.0 0.0 0.0
Pretax Income 2,015.6 1,517.0 1,378.7 838.1 305.6
Income Taxes 495.4 360.9 373.7 231.5 78.7
Minority Interest 73.1 70.3 70.5 53.6 14.6
Equity in Earnings 3.3 3.1 0.4 -0.1 -0.7
After Tax Other Income/Expense 0.0 0.0 0.0 0.0 0.0
Discontinued Operations
Net Income before Extraordinary Items/Preferred Dividends
1,450.5 1,088.9 934.9 552.9 211.6

Extraordinary Items & Gain/Loss Sale of Assets 0.0 0.0 0.0 0.0 0.0
Preferred Dividend Requirements 0.0 0.0 0.0 0.0 0.0
Net Income after Preferred Dividends - available to Common
1,450.5 1,088.9 934.9 552.9 211.6
Copyright ©2000-2011 Distributed by Wright Investors' Service, Inc. All Rights Reserved. Except for quotations by established news media, no pages on this site may be reproduced, stored in a retrieval system, or transmitted for commercial purposes, in any form or by any means, electronic, mechanical, photocopying, recording, or otherwise without prior written permission. Information is believed reliable, but accuracy, completeness and opinions are not guaranteed.

Financial Statement Analyses\Sources of Capital - Net Change
Sources of Capital: Golden Agri-Resources Limited Currency figures are in millions of Singapore Dollars. Year to year % changes pertain to reported Balance Sheet values.
Fiscal Year 2010 2009 2008 2007 2006
Fiscal Year End Date 12/31/2010 12/31/2009 12/31/2008 12/31/2007 12/31/2006
Total Capital 9,480.0 8,299.5 7,139.6 5,190.8 3,392.0
Percent of Total Capital
Short Term Debt 7.3% 5.3% 7.8% 9.7% 9.0%
Long Term Debt 6.0% 6.3% 4.9% 6.3% 13.1%
Other Liabilities 0.0% 0.0% 0.0% 0.4% 0.5%
Total Liabilities 42.7% 39.8% 42.5% 44.9% 47.1%
Minority Interest 1.6% 1.6% 1.9% 2.2% 9.8%
Preferred Stock 0.0% 0.0% 0.0% 0.0% 0.0%
Retained Earnings 73.0% 68.0% 68.9% 58.7% 46.2%
Common Equity 92.4% 92.1% 93.2% 91.5% 77.1%
Total Capital 100.0% 100.0% 100.0% 100.0% 100.0%
Year to Year Net Changes
Short Term Debt 25.2 -11.5 5.1 20.1 1.3
Long Term Debt 5.0 16.7 2.4 -11.6 9.8
Other Liabilities 0.1 0.0 -2.1 0.4 1.4
Total Liabilities 74.9 26.4 70.9 73.2 52.4
Minority Interest 1.8 0.1 2.1 -21.9 11.2
Preferred Stock 0.0 0.0 0.0 0.0 0.0
Retained Earnings 127.6 72.8 186.9 148.0 123.9
Common Equity 111.2 99.2 190.4 213.4 94.9
Total Capital 118.0 116.0 194.9 179.9 116.0
Year to Year Percent Changes
Short Term Debt 57.1% -20.6% 10.2% 66.0% 4.3%
Long Term Debt 9.7% 47.3% 7.2% -26.1% 28.4%

Other Liabilities 428.6% -100.0% 24.3% 499.3%
Total Liabilities 22.7% 8.7% 30.4% 45.9% 48.8%
Minority Interest 13.3% 0.6% 18.7% -65.9% 51.2%
Preferred Stock
Retained Earnings 22.6% 14.8% 61.3% 94.4% 378.2%
Common Equity 14.5% 14.9% 40.1% 81.6% 57.0%
Total Capital 14.2% 16.2% 37.5% 53.0% 52.0%
Total Liabilities & Common Equity
Total Liabilities 4,050.9 3,301.6 3,037.5 2,328.5 1,596.5
Net Change in Liabilities as % of Total Liabilities
18.5% 8.0% 23.3% 31.4% 32.8%
Common Equity 8,757.6 7,645.4 6,653.0 4,749.1 2,615.3
Net Change in Common Equity as % of Common Equity
12.7% 13.0% 28.6% 44.9% 36.3%
Cash Flow
Operating Activities 227.3 377.1 604.6 253.0 106.9
Financing Activities 250.3 410.5 -109.4 540.6 145.4
Investing Activities 637.8 568.2 483.8 807.0 167.4Copyright ©2000-2011 Distributed by Wright Investors' Service, Inc. All Rights Reserved. Except for quotations by established news media, no pages on this site may be reproduced, stored in a retrieval system, or transmitted for commercial purposes, in any form or by any means, electronic, mechanical, photocopying, recording, or otherwise without prior written permission. Information is believed reliable, but accuracy, completeness and opinions are not guaranteed.
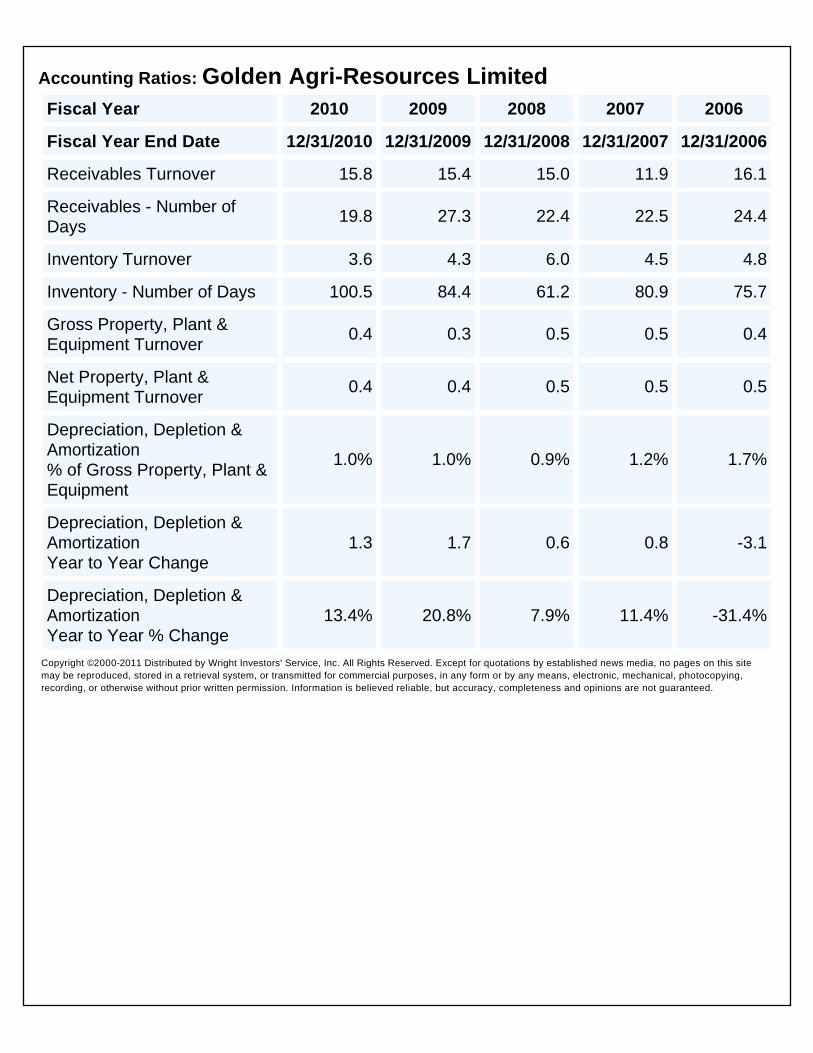
Financial Ratio AnalysesFinancial Ratio Analyses\Accounting Ratios
Accounting Ratios: Golden Agri-Resources Limited
Fiscal Year 2010 2009 2008 2007 2006
Fiscal Year End Date 12/31/2010 12/31/2009 12/31/2008 12/31/2007 12/31/2006
Receivables Turnover 15.8 15.4 15.0 11.9 16.1
Receivables - Number of Days
19.8 27.3 22.4 22.5 24.4
Inventory Turnover 3.6 4.3 6.0 4.5 4.8
Inventory - Number of Days 100.5 84.4 61.2 80.9 75.7
Gross Property, Plant & Equipment Turnover
0.4 0.3 0.5 0.5 0.4
Net Property, Plant & Equipment Turnover
0.4 0.4 0.5 0.5 0.5
Depreciation, Depletion & Amortization % of Gross Property, Plant & Equipment
1.0% 1.0% 0.9% 1.2% 1.7%
Depreciation, Depletion & Amortization Year to Year Change
1.3 1.7 0.6 0.8 -3.1
Depreciation, Depletion & Amortization Year to Year % Change
13.4% 20.8% 7.9% 11.4% -31.4%
Copyright ©2000-2011 Distributed by Wright Investors' Service, Inc. All Rights Reserved. Except for quotations by established news media, no pages on this site may be reproduced, stored in a retrieval system, or transmitted for commercial purposes, in any form or by any means, electronic, mechanical, photocopying, recording, or otherwise without prior written permission. Information is believed reliable, but accuracy, completeness and opinions are not guaranteed.
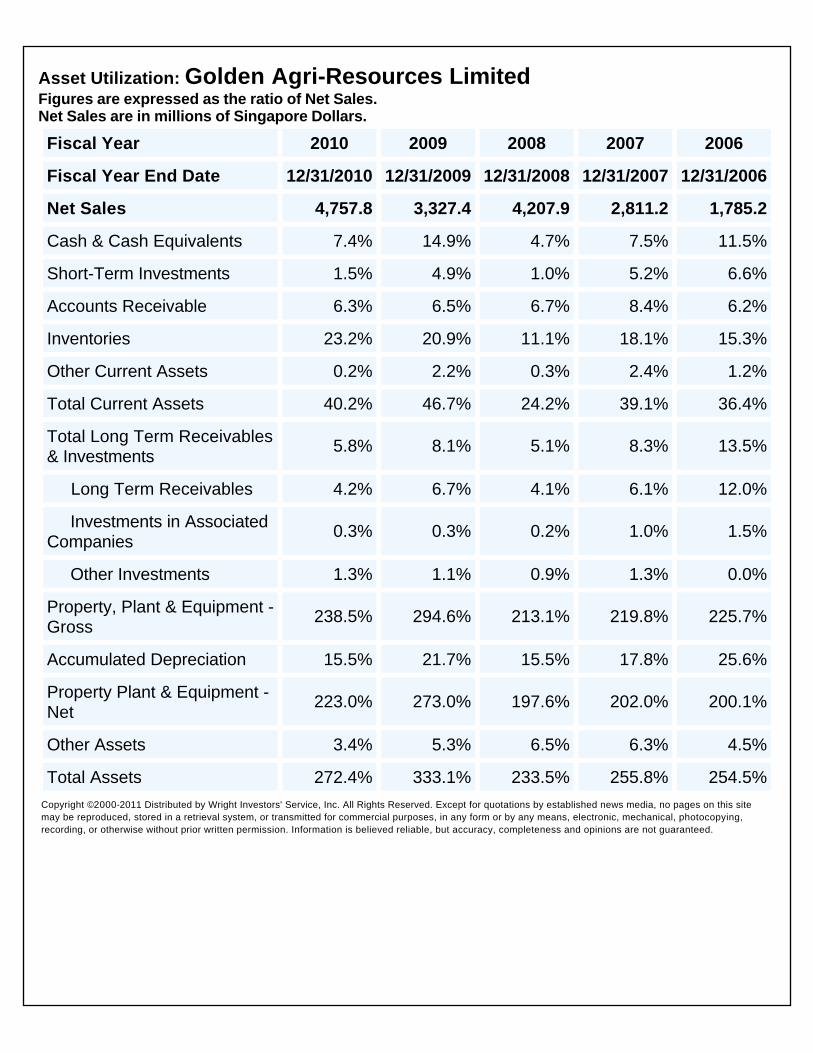
Financial Ratio Analyses\Asset Utilization
Asset Utilization: Golden Agri-Resources Limited Figures are expressed as the ratio of Net Sales. Net Sales are in millions of Singapore Dollars.
Fiscal Year 2010 2009 2008 2007 2006
Fiscal Year End Date 12/31/2010 12/31/2009 12/31/2008 12/31/2007 12/31/2006
Net Sales 4,757.8 3,327.4 4,207.9 2,811.2 1,785.2
Cash & Cash Equivalents 7.4% 14.9% 4.7% 7.5% 11.5%
Short-Term Investments 1.5% 4.9% 1.0% 5.2% 6.6%
Accounts Receivable 6.3% 6.5% 6.7% 8.4% 6.2%
Inventories 23.2% 20.9% 11.1% 18.1% 15.3%
Other Current Assets 0.2% 2.2% 0.3% 2.4% 1.2%
Total Current Assets 40.2% 46.7% 24.2% 39.1% 36.4%
Total Long Term Receivables & Investments
5.8% 8.1% 5.1% 8.3% 13.5%
Long Term Receivables 4.2% 6.7% 4.1% 6.1% 12.0%
Investments in Associated Companies
0.3% 0.3% 0.2% 1.0% 1.5%
Other Investments 1.3% 1.1% 0.9% 1.3% 0.0%
Property, Plant & Equipment - Gross
238.5% 294.6% 213.1% 219.8% 225.7%
Accumulated Depreciation 15.5% 21.7% 15.5% 17.8% 25.6%
Property Plant & Equipment - Net
223.0% 273.0% 197.6% 202.0% 200.1%
Other Assets 3.4% 5.3% 6.5% 6.3% 4.5%
Total Assets 272.4% 333.1% 233.5% 255.8% 254.5%Copyright ©2000-2011 Distributed by Wright Investors' Service, Inc. All Rights Reserved. Except for quotations by established news media, no pages on this site may be reproduced, stored in a retrieval system, or transmitted for commercial purposes, in any form or by any means, electronic, mechanical, photocopying, recording, or otherwise without prior written permission. Information is believed reliable, but accuracy, completeness and opinions are not guaranteed.
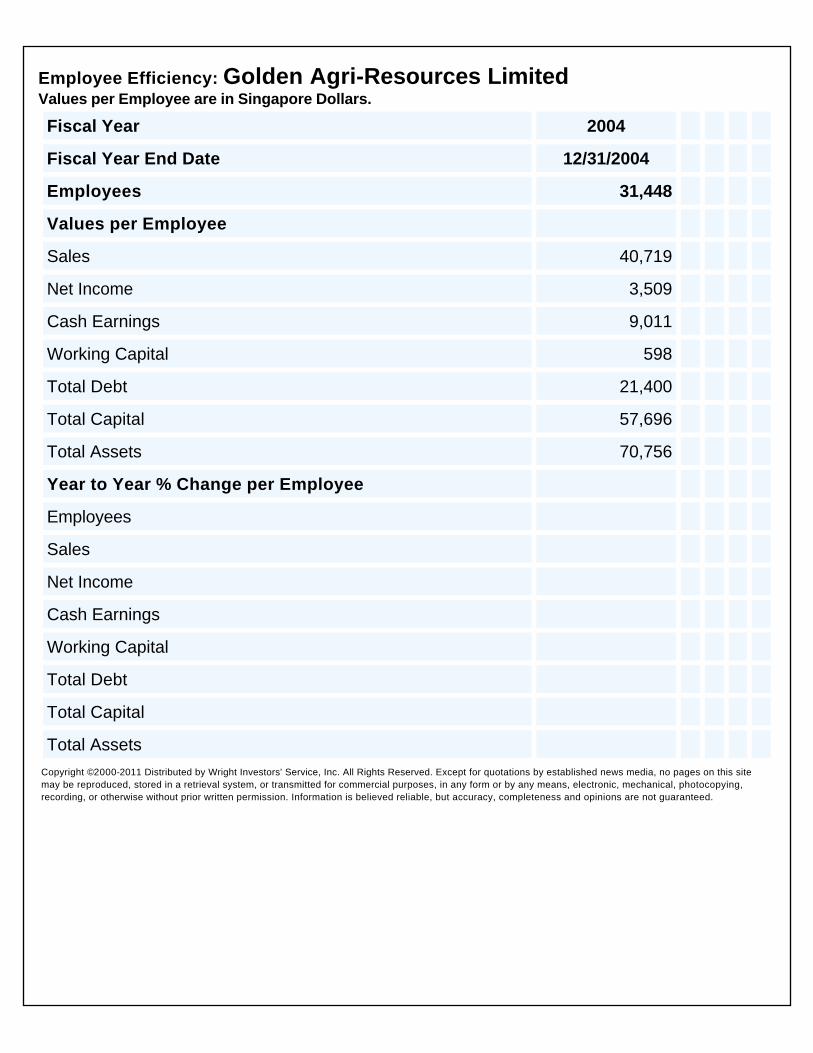
Financial Ratio Analyses\Employee Efficiency
Employee Efficiency: Golden Agri-Resources Limited Values per Employee are in Singapore Dollars.
Fiscal Year 2004
Fiscal Year End Date 12/31/2004
Employees 31,448
Values per Employee
Sales 40,719
Net Income 3,509
Cash Earnings 9,011
Working Capital 598
Total Debt 21,400
Total Capital 57,696
Total Assets 70,756
Year to Year % Change per Employee
Employees
Sales
Net Income
Cash Earnings
Working Capital
Total Debt
Total Capital
Total Assets Copyright ©2000-2011 Distributed by Wright Investors' Service, Inc. All Rights Reserved. Except for quotations by established news media, no pages on this site may be reproduced, stored in a retrieval system, or transmitted for commercial purposes, in any form or by any means, electronic, mechanical, photocopying, recording, or otherwise without prior written permission. Information is believed reliable, but accuracy, completeness and opinions are not guaranteed.

Financial Ratio Analyses\Fixed Charges Coverage
Fixed Charges Coverage: Golden Agri-Resources Limited
Fiscal Year 2010 2009 2008 2007 2006
Fiscal Year End Date 12/31/2010 12/31/2009 12/31/2008 12/31/2007 12/31/2006
EBIT/Total Interest Expense 41.6 13.7 49.6 52.4 22.7
EBIT/Net Interest 50.2 15.9 58.1 66.1 26.8
EBIT/(Total Interest Exp + Pfd Div)
41.6 13.7 49.6 52.4 22.7
EBIT/Dividends on Common Shares
44.2 233.8 21.4 25.9 57.2
EBIT/(Dividends on Common + Pfd)
44.2 233.8 21.4 25.9 57.2
EBITDA/Total Interest Expense
43.4 15.1 51.1 53.8 24.0
EBITDA/Net Interest 52.3 17.6 59.8 68.0 28.3
EBITDA/(Total Interest Exp + Pfd Div)
43.4 15.1 51.1 53.8 24.0
EBITDA/Dividends on Com Shares
46.1 259.1 22.1 26.6 60.3
EBITDA/(Dividends on Com + Pfd)
46.1 259.1 22.1 26.6 60.3
Copyright ©2000-2011 Distributed by Wright Investors' Service, Inc. All Rights Reserved. Except for quotations by established news media, no pages on this site may be reproduced, stored in a retrieval system, or transmitted for commercial purposes, in any form or by any means, electronic, mechanical, photocopying, recording, or otherwise without prior written permission. Information is believed reliable, but accuracy, completeness and opinions are not guaranteed.

Financial Ratio Analyses\Leverage Analysis
Leverage Analysis: Golden Agri-Resources Limited
Fiscal Year 2010 2009 2008 2007 2006
Fiscal Year End Date 12/31/2010 12/31/2009 12/31/2008 12/31/2007 12/31/2006
Long Term Debt % of EBIT 21.2% 56.5% 12.6% 11.9% 36.3%
Long Term Debt % of EBITDA
20.4% 51.0% 12.3% 11.6% 34.4%
Long Term Debt % of Total Assets
4.4% 4.7% 3.6% 4.6% 9.8%
Long Term Debt % of Total Capital
6.0% 6.3% 4.9% 6.3% 13.1%
Long Term Debt % of Com Equity
6.5% 6.8% 5.3% 6.9% 17.0%
Total Debt % of EBIT 47.1% 104.7% 32.5% 30.3% 61.2%
Total Debt % of EBITDA 45.2% 94.5% 31.6% 29.5% 57.9%
Total Debt % of Total Assets 9.7% 8.7% 9.2% 11.6% 16.5%
Total Debt % of Total Capital 13.3% 11.6% 12.7% 16.1% 22.1%
Total Debt % of Total Capital & Short Term Debt
12.4% 11.0% 11.8% 14.6% 20.3%
Total Debt % of Common Equity
14.4% 12.6% 13.7% 17.6% 28.6%
Minority Interest % of EBIT 5.7% 14.7% 4.8% 4.1% 27.1%
Minority Interest % of EBITDA 5.5% 13.3% 4.7% 4.0% 25.7%
Minority Interest % of Total Assets
1.2% 1.2% 1.4% 1.6% 7.3%
Minority Interest % of Total Capital
1.6% 1.6% 1.9% 2.2% 9.8%
Minority Interest % of Com Equity
1.7% 1.8% 2.0% 2.4% 12.7%
Preferred Stock % of EBIT 0.0% 0.0% 0.0% 0.0% 0.0%
Preferred Stock % of EDITDA 0.0% 0.0% 0.0% 0.0% 0.0%
Preferred Stock % of Total Assets
0.0% 0.0% 0.0% 0.0% 0.0%
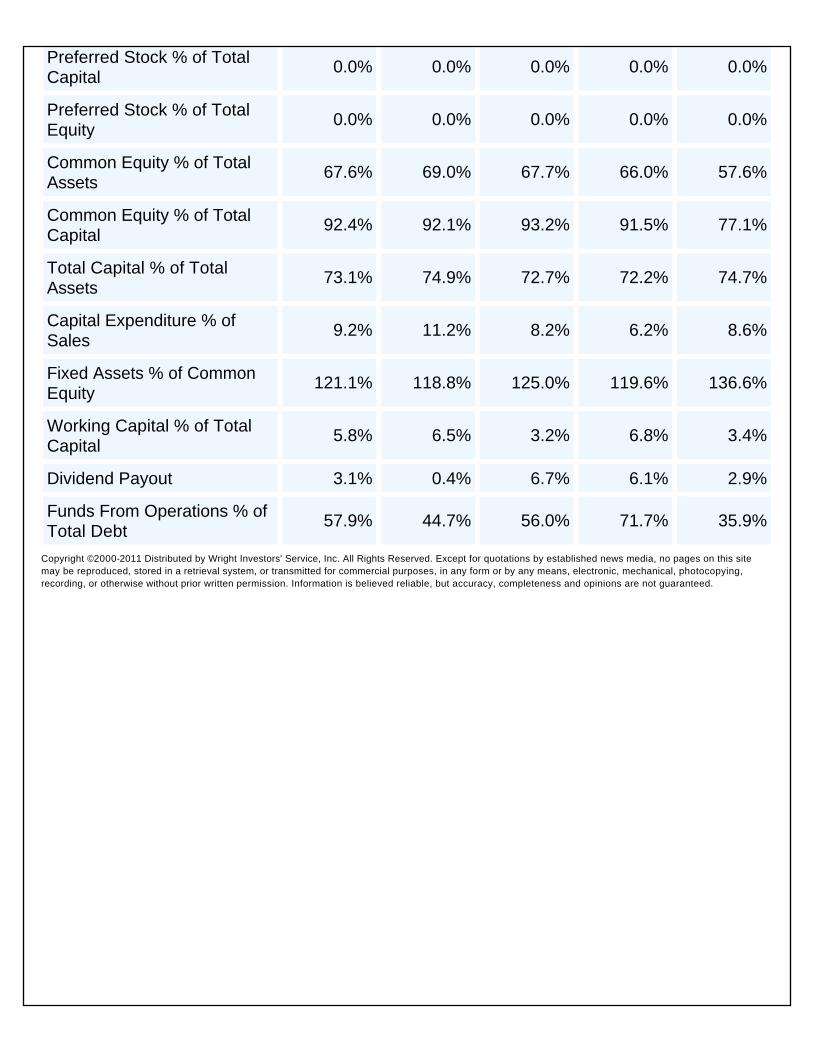
Preferred Stock % of Total Capital
0.0% 0.0% 0.0% 0.0% 0.0%
Preferred Stock % of Total Equity
0.0% 0.0% 0.0% 0.0% 0.0%
Common Equity % of Total Assets
67.6% 69.0% 67.7% 66.0% 57.6%
Common Equity % of Total Capital
92.4% 92.1% 93.2% 91.5% 77.1%
Total Capital % of Total Assets
73.1% 74.9% 72.7% 72.2% 74.7%
Capital Expenditure % of Sales
9.2% 11.2% 8.2% 6.2% 8.6%
Fixed Assets % of Common Equity
121.1% 118.8% 125.0% 119.6% 136.6%
Working Capital % of Total Capital
5.8% 6.5% 3.2% 6.8% 3.4%
Dividend Payout 3.1% 0.4% 6.7% 6.1% 2.9%
Funds From Operations % of Total Debt
57.9% 44.7% 56.0% 71.7% 35.9%
Copyright ©2000-2011 Distributed by Wright Investors' Service, Inc. All Rights Reserved. Except for quotations by established news media, no pages on this site may be reproduced, stored in a retrieval system, or transmitted for commercial purposes, in any form or by any means, electronic, mechanical, photocopying, recording, or otherwise without prior written permission. Information is believed reliable, but accuracy, completeness and opinions are not guaranteed.

Financial Ratio Analyses\Liquidity Analysis
Liquidity Analysis: Golden Agri-Resources Limited
Fiscal Year 2010 2009 2008 2007 2006
Fiscal Year End Date 12/31/2010 12/31/2009 12/31/2008 12/31/2007 12/31/2006
Total Current Assets % Net Sales
40.2% 46.7% 24.2% 39.1% 36.4%
Cash % of Current Assets 14.7% 21.5% 15.2% 5.9% 13.5%
Cash & Equivalents % of Current Assets
18.5% 32.0% 19.5% 19.2% 31.6%
Quick Ratio 0.5 0.7 0.6 0.6 0.6
Receivables % of Current Assets
15.7% 13.9% 27.6% 21.5% 17.0%
Receivable Turnover - number of days
19.8 27.3 22.4 22.5 24.4
Inventories % of Current Assets
57.6% 44.7% 45.7% 46.3% 41.9%
Inventory Turnover - number of days
100.5 84.4 61.2 80.9 75.7
Inventory to Cash & Equivalents - number of days
115.6 257.7 153.3 149.1 271.8
Receivables % of Total Assets
2.3% 1.9% 2.9% 3.3% 2.4%
Current Ratio 1.4 1.5 1.3 1.5 1.2
Total Debt % of Total Capital 12.4% 11.0% 11.8% 14.6% 20.3%
Funds from Operations % of Current Liabilities
53.7% 42.2% 64.4% 80.2% 50.3%
Funds from Operations % of Long Term Debt
128.3% 82.7% 144.4% 181.8% 60.4%
Funds from Operations % of Total Debt
57.9% 44.7% 56.0% 71.7% 35.9%
Funds from Operations % of Total Capital
7.7% 5.2% 7.1% 11.5% 7.9%
Cash Flow (in milllions of Singapore Dollars)
Operating Activities 227.3 377.1 604.6 253.0 106.9

Financing Activities 250.3 410.5 -109.4 540.6 145.4
Investing Activities 637.8 568.2 483.8 807.0 167.4Copyright ©2000-2011 Distributed by Wright Investors' Service, Inc. All Rights Reserved. Except for quotations by established news media, no pages on this site may be reproduced, stored in a retrieval system, or transmitted for commercial purposes, in any form or by any means, electronic, mechanical, photocopying, recording, or otherwise without prior written permission. Information is believed reliable, but accuracy, completeness and opinions are not guaranteed.

Financial Ratio Analyses\Per-Share Ratios
Per Share Data: Golden Agri-Resources Limited Figures are expressed as per unit of respective shares. Figures are in Singapore Dollars.
Fiscal Year 2010 2009 2008 2007 2006
Fiscal Year End Date 12/31/2010 12/31/2009 12/31/2008 12/31/2007 12/31/2006
Sales 0.39 0.27 0.37 0.25 0.18
Operating Income 0.06 0.04 0.07 0.06 0.03
Pre-tax Income 0.22 0.07 0.24 0.24 0.12
Net Income (Continuing Operations)
0.22 0.07 0.24 0.24 0.12
Net Income Before Extra Items
0.16 0.07 0.17 0.15 0.08
Extraordinary Items 0.00 0.00 0.00 0.00 0.00
Net Income After Extraordinary Items
0.16 0.07 0.17 0.15 0.08
Net Income Available to Common Shares
0.16 0.08 0.17 0.16 0.08
Fully Diluted Earnings 0.16 0.08 0.17 0.16 0.08
Common Dividends 0.01 0.00 0.01 0.00
Cash Earnings 0.06 0.04 0.05 0.06 0.03
Book Value 0.72 0.63 0.59 0.42 0.27
Retained Earnings 0.57 0.46 0.44 0.27 0.16
Assets 1.07 0.91 0.87 0.64 0.46Copyright ©2000-2011 Distributed by Wright Investors' Service, Inc. All Rights Reserved. Except for quotations by established news media, no pages on this site may be reproduced, stored in a retrieval system, or transmitted for commercial purposes, in any form or by any means, electronic, mechanical, photocopying, recording, or otherwise without prior written permission. Information is believed reliable, but accuracy, completeness and opinions are not guaranteed.

Financial Ratio Analyses\Profitability Growth
Profitability Analysis: Golden Agri-Resources Limited Currency figures are in Singapore Dollars.
Fiscal Year 2010 2009 2008 2007 2006
Fiscal Year End Date 12/31/2010 12/31/2009 12/31/2008 12/31/2007 12/31/2006
Gross Income Margin 26.6% 21.6% 28.9% 34.6% 23.1%
Operating Income Margin 15.5% 13.7% 17.7% 25.3% 14.3%
Pretax Income Margin 55.0% 25.6% 65.0% 96.1% 65.6%
EBIT Margin 56.4% 27.6% 66.4% 98.0% 68.6%
Net Income Margin 40.6% 26.5% 46.3% 62.2% 41.7%
Return on Equity - Total 23.6% 12.3% 34.2% 47.5% 34.7%
Return on Invested Capital 20.9% 11.5% 29.7% 38.0% 25.2%
Return on Assets 16.5% 9.1% 23.4% 30.4% 20.9%
Asset Turnover 0.4 0.3 0.4 0.4 0.4
Financial Leverage 14.4% 12.6% 13.7% 17.6% 28.6%
Interest Expense on Debt 64,480,502 67,239,018 56,287,065 52,558,766 53,826,285
Effective Tax Rate 25.0% 27.1% 29.3% 27.1%
Cash Flow % Sales 15.4% 12.9% 12.1% 21.3% 15.0%
Selling, General & Administrative Expenses % of Sales
7.5% 7.5% 5.7% 9.3% 8.8%
Research & Development Expense
Operating Income Return On Total Capital
14.2% 16.2% 37.5% 53.0% 52.0%
Copyright ©2000-2011 Distributed by Wright Investors' Service, Inc. All Rights Reserved. Except for quotations by established news media, no pages on this site may be reproduced, stored in a retrieval system, or transmitted for commercial purposes, in any form or by any means, electronic, mechanical, photocopying, recording, or otherwise without prior written permission. Information is believed reliable, but accuracy, completeness and opinions are not guaranteed.

Wright Quality Rating AnalysesWright Quality Rating Analyses\Investment Acceptance
Wright Quality Rating - Investment Acceptance: Golden Agri-Resources Limited Currency figures are in millions of U.S. Dollars.
Wright Quality Rating BAC15
Investment Acceptance Rating BAC15
Total Market Value of Shares Outstanding - Three Year Average 5,336
- Current Year 6,172
Public Market Value (Excludes Closely Held) - Three Year Average 3,107
- Current Year 3,594
Trading Volume - Three Year Average 0
- Current Year 0
Turnover Rate - Three Year Average 0.0%
- Current Year 0.0%
Stock Exchange Listings SIN
Number of Institutional Investors 0
Number of Shareholders 43,491
Closely Held Shares as % of Total Shares Outstanding 41.8%Copyright ©2000-2011 Distributed by Wright Investors' Service, Inc. All Rights Reserved. Except for quotations by established news media, no pages on this site may be reproduced, stored in a retrieval system, or transmitted for commercial purposes, in any form or by any means, electronic, mechanical, photocopying, recording, or otherwise without prior written permission. Information is believed reliable, but accuracy, completeness and opinions are not guaranteed.
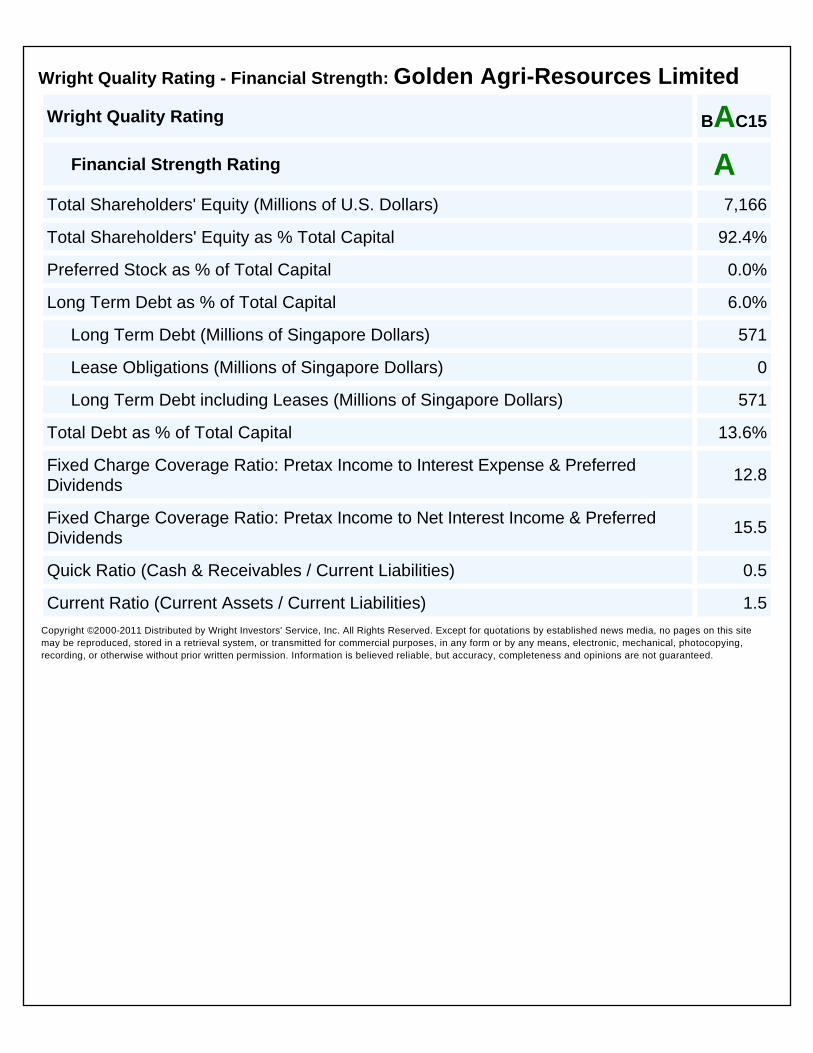
Wright Quality Rating Analyses\Financial Strength
Wright Quality Rating - Financial Strength: Golden Agri-Resources Limited
Wright Quality Rating BAC15
Financial Strength Rating BAC15
Total Shareholders' Equity (Millions of U.S. Dollars) 7,166
Total Shareholders' Equity as % Total Capital 92.4%
Preferred Stock as % of Total Capital 0.0%
Long Term Debt as % of Total Capital 6.0%
Long Term Debt (Millions of Singapore Dollars) 571
Lease Obligations (Millions of Singapore Dollars) 0
Long Term Debt including Leases (Millions of Singapore Dollars) 571
Total Debt as % of Total Capital 13.6%
Fixed Charge Coverage Ratio: Pretax Income to Interest Expense & Preferred Dividends
12.8
Fixed Charge Coverage Ratio: Pretax Income to Net Interest Income & Preferred Dividends
15.5
Quick Ratio (Cash & Receivables / Current Liabilities) 0.5
Current Ratio (Current Assets / Current Liabilities) 1.5Copyright ©2000-2011 Distributed by Wright Investors' Service, Inc. All Rights Reserved. Except for quotations by established news media, no pages on this site may be reproduced, stored in a retrieval system, or transmitted for commercial purposes, in any form or by any means, electronic, mechanical, photocopying, recording, or otherwise without prior written permission. Information is believed reliable, but accuracy, completeness and opinions are not guaranteed.

Wright Quality Rating Analyses\Profitability & Stability
Wright Quality Rating - Profitability & Stability: Golden Agri-Resources Limited
Wright Quality Rating BAC15
Profitability & Stability Rating BAC15
Profit Rate of Earnings on Equity Capital - Time-Weighted Normal 31.6%
- Basic Trend -4.0%
Cash Earnings Return on Equity - Time-Weighted Average 10.5%
- Basic Trend -1.5%
Cash Earnings Return on Equity - Stability Index 67.3%
Return On Assets (Time-Weighted Average) 0.4%
Pre-Tax Income as % of Total Assets (Time-Weighted Average) 5.7%
Operating Income as % of Total Assets (Time-Weighted Average) 6.2%
Operating Income as % of Total Capital (Adjusted Rate) 11.4%
Pre-Tax Income as % of Total Assets (Time-Weighted Average) 5.7%
Operating Income as % of Total Assets (Time-Weighted Average) 6.2%
Operating Income as % of Total Capital (Adjusted Rate) 11.4%Copyright ©2000-2011 Distributed by Wright Investors' Service, Inc. All Rights Reserved. Except for quotations by established news media, no pages on this site may be reproduced, stored in a retrieval system, or transmitted for commercial purposes, in any form or by any means, electronic, mechanical, photocopying, recording, or otherwise without prior written permission. Information is believed reliable, but accuracy, completeness and opinions are not guaranteed.

Wright Quality Rating Analyses\Corporate Growth
Wright Quality Rating - Corporate Growth: Golden Agri-Resources Limited Figures are expressed on a Per Share Basis.
Wright Quality Rating BAC15 Growth Rating BAC15Normal Earnings Growth 2.6%
Cash Earnings Growth 15.0%
Cash Earnings Stability Index 68.7%
Earned Equity Growth 25.0%
Dividend Growth 12.2%
Operating Income Growth 16.9%
Assets Growth 21.8%
Sales/Revenues Growth 17.7%Copyright ©2000-2011 Distributed by Wright Investors' Service, Inc. All Rights Reserved. Except for quotations by established news media, no pages on this site may be reproduced, stored in a retrieval system, or transmitted for commercial purposes, in any form or by any means, electronic, mechanical, photocopying, recording, or otherwise without prior written permission. Information is believed reliable, but accuracy, completeness and opinions are not guaranteed.
Related Documents