Please refer to important disclosures at the end of this report 1 Consolidated ( ` cr) 2QFY2012 2QFY2011 % chg (yoy) 1QFY2012 % chg (qoq) Net sales 429 148 190.0 494 (13.2) EBITDA 53 30 73.2 76 (30.7) % margin 12.3 20.6 (828)bp 15.4 (310)bp Net income 11 7 50.0 31 (64.7) Source: Company, Angel Research For 2QFY2012, Godavari Power & Ispat (GPIL) reported robust top-line growth; however, its profitability was hit on account of higher iron ore and coal costs. We maintain our Buy rating on the stock. Higher volumes and realization drive strong top-line growth: During the quarter, GPIL’s net sales grew by 190.0% yoy to ` 429cr on account of higher realization and increased sales volume. Pellet, sponge iron, billets and HB wire realizations increased by 51.7%, 30.7%, 23.2% and 25.8% yoy, respectively. Billets, HB wire, ferro alloys, and power sales volumes grew by 108.3%, 30.1%, 24.5% and 21.9% yoy, respectively, during the quarter. Higher input costs mute profit growth: Raw-material cost as a percentage of net sales stood at 65.8% in 2QFY2012 compared to 49.1% in 2QFY2011, as the rise in iron ore and coal prices more than offset the rise in product prices. Thus, EBITDA margin slipped by 828bp yoy to 12.3% in 2QFY2012 and EBITDA grew by 73.2% yoy to ` 53cr. Interest and depreciation expenses grew by 145.0% and 51.7% yoy to ` 25cr and ` 17cr, respectively. Consequently , net profit increased by only 50.0% yoy to ` 11cr during the quarter. Outlook and valuation: Although GPIL’s 2QFY2012 profitability was affected by higher iron ore and coal costs, going forward we expect the company to improve its profitability on the back of increased high-margin pellet sales. At the CMP, the stock is trading at 3.7x FY2012E and 3.0x FY2013E EV/EBITDA. On a P/BV basis, it is trading at 0.5x FY2012E and 0.4x FY2013E estimates. We maintain our Buy recommendation on GPIL with a revised target price of ` 154, valuing it at 3.3x FY2013E EV/EBITDA. Key financials (Consolidated) Y/E March ( ` cr) FY2010 FY2011 FY2012E FY2013E Net sales 822 1,116 1,992 2,064 % chg (24.7) 35.7 78.5 3.6 Net profit 57 86 80 112 % chg (8.1) 50.0 (7.4) 41.5 FDEPS ( ` ) 20.5 27.1 25.0 35.4 OPM (%) 15.9 20.8 14.9 16.3 P/E (x) 5.8 4.4 4.7 3.3 P/BV (x) 0.6 0.6 0.5 0.4 RoE (%) 11.9 14.4 11.0 13.7 RoCE (%) 10.5 13.6 13.8 15.2 EV/Sales (x) 1.0 1.0 0.5 0.5 EV/EBITDA (x) 6.2 4.7 3.7 3.0 Source: Company, Angel Research BUY CMP ` 119 Target Price ` 154 Investment Period 12 months Stock Info Sector Bloomberg Code GODPI@IN Shareholding Pattern (%) Promoters 63. 7 MF / Banks / Indian Fls 4.6 FII / NRIs / OCBs 3.7 Indi an Public / Others 28. 0 Abs. (%) 3m 1yr 3yr Sensex 0.8 (16.5) 74.7 GPIL (24.3) (44.1) 45.7 10 17,193 5,169 GDPI.BO 377 0.9 224/108 22028 Steel Avg. Daily Volume Market Cap ( ` cr) Beta 52 Week High / Low Face Value ( ` ) BSE Sensex Nifty Reuters Code Bhavesh Chauhan Tel: 022- 39357600 Ext: 6821 [email protected] Godawari Power & Ispat Performance Highlights 2QFY2012 Result Update | Steel November 11, 2011

Welcome message from author
This document is posted to help you gain knowledge. Please leave a comment to let me know what you think about it! Share it to your friends and learn new things together.
Transcript

8/3/2019 Godawari Power & Ispat Result Updated
http://slidepdf.com/reader/full/godawari-power-ispat-result-updated 1/10
Please refer to important disclosures at the end of this report 1
Consolidated (` cr) 2QFY2012 2QFY2011 % chg (yoy) 1QFY2012 % chg (qoq)
Net sales 429 148 190.0 494 (13.2)
EBITDA 53 30 73.2 76 (30.7)
% margin 12.3 20.6 (828)bp 15.4 (310)bp
Net income 11 7 50.0 31 (64.7)
Source: Company, Angel Research
For 2QFY2012, Godavari Power & Ispat (GPIL) reported robust top-line growth;
however, its profitability was hit on account of higher iron ore and coal costs.
We maintain our Buy rating on the stock.
Higher volumes and realization drive strong top-line growth: During the quarter,
GPIL’s net sales grew by 190.0% yoy to ` 429cr on account of higher realization
and increased sales volume. Pellet, sponge iron, billets and HB wire realizations
increased by 51.7%, 30.7%, 23.2% and 25.8% yoy, respectively. Billets, HB wire,
ferro alloys, and power sales volumes grew by 108.3%, 30.1%, 24.5% and 21.9%
yoy, respectively, during the quarter.
Higher input costs mute profit growth: Raw-material cost as a percentage of net
sales stood at 65.8% in 2QFY2012 compared to 49.1% in 2QFY2011, as the rise
in iron ore and coal prices more than offset the rise in product prices. Thus,
EBITDA margin slipped by 828bp yoy to 12.3% in 2QFY2012 and EBITDA grewby 73.2% yoy to ` 53cr. Interest and depreciation expenses grew by 145.0% and
51.7% yoy to ` 25cr and ` 17cr, respectively. Consequently, net profit increased by
only 50.0% yoy to ` 11cr during the quarter.
Outlook and valuation: Although GPIL’s 2QFY2012 profitability was affected by
higher iron ore and coal costs, going forward we expect the company to improve
its profitability on the back of increased high-margin pellet sales. At the CMP, the
stock is trading at 3.7x FY2012E and 3.0x FY2013E EV/EBITDA. On a P/BV basis,
it is trading at 0.5x FY2012E and 0.4x FY2013E estimates. We maintain our Buy
recommendation on GPIL with a revised target price of `154, valuing it at 3.3x
FY2013E EV/EBITDA.
Key financials (Consolidated)
Y/E March (` cr) FY2010 FY2011 FY2012E FY2013E
Net sales 822 1,116 1,992 2,064
% chg (24.7) 35.7 78.5 3.6
Net profit 57 86 80 112
% chg (8.1) 50.0 (7.4) 41.5
FDEPS (`) 20.5 27.1 25.0 35.4
OPM (%) 15.9 20.8 14.9 16.3
P/E (x) 5.8 4.4 4.7 3.3
P/BV (x) 0.6 0.6 0.5 0.4
RoE (%) 11.9 14.4 11.0 13.7RoCE (%) 10.5 13.6 13.8 15.2
EV/Sales (x) 1.0 1.0 0.5 0.5
EV/EBITDA (x) 6.2 4.7 3.7 3.0
Source: Company, Angel Research
BUYCMP ` 119
Target Price ` 154
Investment Period 12 months
Stock Info
Sector
Bloomberg Code GODPI@IN
Shareholding Pattern (%)
Promoters 63.7
MF / Banks / Indian Fls 4.6
FII / NRIs / OCBs 3.7
Indian Public / Others 28.0
Abs. (%) 3m 1yr 3yr
Sensex 0.8 (16.5) 74.7
GPIL (24.3) (44.1) 45.7
10
17,193
5,169
GDPI.BO
377
0.9
224/108
22028
Steel
Avg. Daily Volume
Market Cap ( ` cr)
Beta
52 Week High / Low
Face Value ( ` )
BSE Sensex
Nifty
Reuters Code
Bhavesh Chauhan
Tel: 022- 39357600 Ext: [email protected]
Godawari Power & Ispat
Performance Highlights
2QFY2012 Result Update | Steel
November 11, 2011

8/3/2019 Godawari Power & Ispat Result Updated
http://slidepdf.com/reader/full/godawari-power-ispat-result-updated 2/10
Godawari Power | 2QFY2012 Result Update
November 11, 2011 2
Exhibit 1: 2QFY2012 performance (Consolidated)
Y/E March (` cr) 2QFY2012 2QFY2011 yoy % 1QFY012 qoq %
Net sales 429 148 190.0 494 (13.2)
Raw material 282 73 288.8 330 (14.4)% of net sales 65.8 49.1 66.7
Staff cost 13 8 74.4 10 31.1
% of net sales 3.1 5.1 2.0
Other expenditure 81 37 116.6 78 3.1
% of net sales 18.8 25.2 15.9
Total expenditure 376 117 220.3 418 (10.0)
% of net sales 87.7 79.4 84.6
Operating profit 53 30 73.2 76 (30.7)
OPM (%) 12.3 20.6 15.4
Other operating income - - - - -
EBITDA 53 30 73.2 76 (30.7)
EBITDA margins (%) 12.3 20.6 15.4
Interest 25 10 145.0 27 (7.6)
Depreciation 17 11 51.7 16 4.2
Other income 3 - 2,766.7 4 (21.1)
Exceptional items - - - - -
Profit before tax 14 9 54.4 37 (62.0)
% of net sales 3.3 6.1 7.5
Tax 3 2 71.7 6 (48.2)
% of PBT 22.5 20.3 16.5
Profit after tax 11 7 50.0 31 (64.7)
% of net sales 2.5 4.9 6.2
Source: Company, Angel Research
Higher volumes and increased realization drive top-line growth
During the quarter, GPIL’s net sales grew by 190.0% yoy to ` 429cr on account of
higher realization, increased sales volumes and merger with Hira Industries and
R.R. Ispat. Pellet, sponge iron, billets and HB wire realizations increased by 51.7%,
30.7%, 23.2% and 25.8% yoy, respectively. Pellet sales volume stood at 52,937
tonnes (capacity utilization over 100%) in 2QFY2012 vs. 3,319 tonnes in
2QFY2011. Billets, HB wire, ferro alloys and power sales volumes grew by
108.3%, 30.1%, 24.5% and 21.9% yoy, respectively, during the quarter.
Higher coal and iron ore costs affect margins
Despite net sales growing by 190.0% yoy, EBITDA grew by only 73.2% yoy to
` 53cr on account of rising prices of key inputs. Raw-material cost as a percentage
of net sales stood at 65.8% in 2QFY2012 compared to 49.1% in 2QFY2011, as
the rise in iron ore and coal prices more than offset the rise in product prices.
Thus, EBITDA margin slipped by 828bp yoy to 12.3% in 2QFY2012. Interest and
depreciation expenses grew by 145.0% and 51.7% yoy to ` 25cr and ` 17cr,
respectively, during the quarter. Consequently, net profit increased by only 50.0%
yoy to ` 11cr during the quarter.

8/3/2019 Godawari Power & Ispat Result Updated
http://slidepdf.com/reader/full/godawari-power-ispat-result-updated 3/10
Godawari Power | 2QFY2012 Result Update
November 11, 2011 3
Exhibit 2: Quarterly production trend
(tonnes) 4QFY10 1QFY11 2QFY11 3QFY11 4QFY11 1QFY12 2QFY12 yoy % qoq %
Sponge iron 80,359 61,535 53,637 75,314 88,955 90,720 80,759 50.6 (11.0)
Billets 23,370 - 15,228 30,990 39,033 30,031 30,714 101.7 2.3HB wire 17,088 14,193 15,130 13,457 18,901 25,664 18,620 23.1 (27.4)
Ferro alloys 1,500 - 1,888 1,971 1,312 1,988 1,471 (22.1) (26.0)
Power (mn units) 88 76 62 80 92 101 87 40.0 (13.6)
Pellet 48,305 55,396 62,315 103,100 133,750 153,400 1,52,700 145.0 (0.5)
Source: Company, Angel Research
Exhibit 3: Quarterly sales volume trend
(tonnes) 4QFY10 1QFY11 2QFY11 3QFY11 4QFY11 1QFY12 2QFY12 yoy % qoq %
Sponge iron 59,768 61,144 38,460 41,194 44,001 58,974 42,501 10.5 (27.9)
Billets 23,221 533 14,478 31,168 39,097 30,476 30,160 108.3 (1.0)
HB wire 17,934 13,609 12,866 14,952 19,566 24,802 16,743 30.1 (32.5)
Ferro alloys 1,168 649 1,259 852 2,322 1,631 1,567 24.5 (3.9)
Power (mn units) 37 52 18 19 22 34 22 21.9 (34.7)
Pellet 8,473 8,591 3,319 18,265 49,561 43,625 52,937 1,495.1 21.3
Source: Company, Angel Research
Exhibit 4: Quarterly realization trend
(`/tonne) 4QFY10 1QFY11 2QFY11 3QFY11 4QFY11 1QFY12 2QFY12 yoy % qoq %
Sponge iron 15,384 15,365 14,438 16,988 19,445 19,404 18,873 30.7 (2.7)
Billets 24,151 28,143 24,669 25,331 28,741 30,002 30,389 23.2 1.3
HB wire 29,458 30,502 28,956 29,441 34,811 35,855 36,415 25.8 1.6
Ferro alloys 57,534 57,319 53,366 52,289 51,981 51,301 50,498 (5.4) (1.6)
Power ( ` /unit) 3.9 5.1 2.6 2.9 2.5 3.0 2.9 9.6 (0.7)
Pellet 5,571 7,252 5,371 7,292 7,924 8,291 8,146 51.7 (1.7)
Source: Company, Angel Research

8/3/2019 Godawari Power & Ispat Result Updated
http://slidepdf.com/reader/full/godawari-power-ispat-result-updated 4/10
Godawari Power | 2QFY2012 Result Update
November 11, 2011 4
Investment rationale
Mining capacity at Ari Dongri mine to increase
Currently, GPIL has an approval to mine 0.6mn tonnes of iron ore from the Ari Dongri mine. Management aims to increase the mining capacity to
0.9mn tonnes during FY2012. Increased production from captive iron ore mine
should further lower costs, given a steep rise in iron ore prices recently.
Increasing pellet sales to improve GPIL’s profits
GPIL’s 0.6mn tonne pellet plant in its 75% subsidiary Ardent Steel in Keonjhar,
Orissa, started commercial production during August 2010. This coupled with
GPIL’s 0.6mn tonne pellet plant should drive strong profitability growth in FY2012
and FY2013, as we expect pellet prices to remain firm.
Outlook and valuation
Although GPIL’s 2QFY2012 profitability was affected by higher iron ore and coal
costs, going forward we expect GPIL to improve its profitability on the back of
increased high-margin pellet sales. A key catalyst for the stock would be
commencement of iron ore mining from Boria Tibu. At the CMP, the stock is
trading at 3.7x FY2012E and 3.0x FY2013E EV/EBITDA. On a P/BV basis, it is
trading at 0.5x FY2012E and 0.4x FY2013E estimates. We maintain our Buy view
on GPIL with a revised target price of `154, valuing it at 3.3x FY2013E EV/EBITDA.
Exhibit 5: EPS – Angel forecast vs. consensus
Year (`) Angel forecast Bloomberg consensus Variation (%)
FY2012E 25.0 31.9 (21.5)
FY2013E 35.4 39.4 (10.1)
Source: Bloomberg, Angel Research
Exhibit 6: EV/EBITDA band
Source: Bloomberg, Angel Research
0
500
1,000
1,500
2,000
2,500
3,000
Apr-06Oct-06Apr-07Oct-07Apr-08Oct-08Apr-09Oct-09Apr-10Oct-10Apr-11Oct-11
( `
c r )
2x 4x 6x 8x

8/3/2019 Godawari Power & Ispat Result Updated
http://slidepdf.com/reader/full/godawari-power-ispat-result-updated 5/10
Godawari Power | 2QFY2012 Result Update
November 11, 2011 5
Exhibit 7: P/E band
Source: Bloomberg, Angel Research
Exhibit 8: P/BV band
Source: Bloomberg, Angel Research
Exhibit 9: Recommendation summary
Companies CMP Target Reco. Mcap Upside P/E (x) P/BV (x) EV/EBITDA (x) RoE (%) RoCE (%)
(`) Price (`) (` cr) (%) FY12E FY13E FY12E FY13E FY12E FY13E FY12E FY13E FY12E FY13E
Bhushan 323 - Neutral 6,859 - 4.1 4.1 0.5 0.5 8.5 7.5 13.8 12.2 7.9 7.4GPIL 119 154 Buy 377 30 4.7 3.3 0.5 0.4 3.7 3.0 11.0 13.7 13.8 15.2
Monnet Ispat 403 549 Buy 2,593 36 8.4 6.4 1.1 0.9 8.2 6.0 13.8 16.6 8.7 11.0
SEML 114 137 Buy 408 20 8.6 7.8 0.6 0.5 6.5 4.7 7.0 7.3 4.5 5.3
Source: Company, Angel Research
0
50
100
150
200
250
300
350
400
450
Apr-06Oct-06Apr-07Oct-07Apr-08Oct-08Apr-09Oct-09Apr-10Oct-10Apr-11Oct-11
( ` )
2x 4x 6x 8x 12x
0
100
200
300
400
500
600
Apr-06Oct-06Apr-07Oct-07Apr-08Oct-08Apr-09Oct-09Apr-10Oct-10Apr-11Oct-11
( ` )
0.5x 1.0x 1.5x 2.0x

8/3/2019 Godawari Power & Ispat Result Updated
http://slidepdf.com/reader/full/godawari-power-ispat-result-updated 6/10
Godawari Power | 2QFY2012 Result Update
November 11, 2011 6
Profit & Loss Statement (Consolidated)
Y/E March (` cr) FY2008 FY2009 FY2010 FY2011 FY2012E FY2013E
Gross sales 936 1,233 887 1,221 2,130 2,208
Less: Excise duty 126 141 64 105 138 143Net sales 810 1,092 822 1,116 1,992 2,064
Other operating income - - - - - -
Total operating income 810 1,092 822 1,116 1,992 2,064
% chg 69.6 34.8 (24.7) 35.7 78.5 3.6
Total expenditure 642 969 692 884 1,696 1,728
Net raw materials 553 876 580 638 1,169 1,181
Other mfg costs 78 79 92 210 478 495
Personnel 11 14 19 35 49 52
Other - - - - - -
EBITDA 168 123 131 232 296 336
% chg 98.0 (26.8) 6.2 78.0 27.4 13.6
(% of net sales) 20.7 11.3 15.9 20.8 14.9 16.3
Depreciation 26 28 34 55 76 78
EBIT 142 94 96 177 220 258
% chg 95.7 (33.6) 2.1 83.6 24.5 17.0
(% of net sales) 17.6 8.6 11.7 15.9 11.1 12.5
Interest charges 31 36 34 73 125 124
Other income 2 11 4 15 16 18
(% of PBT) 1.6 16.2 6.0 13.0 14.4 11.6
Share in profit of asso. - - - - - -
Recurring PBT 113 70 67 119 111 152
% chg 81.4 (37.6) (5.1) 79.0 (7.1) 36.7
Extra. Inc/(Expense) - - - - - -
PBT (reported) 113 70 67 119 111 152
Tax 14 8 11 20 19 26
(% of PBT) 12.3 11.9 15.8 16.6 17.0 17.0
PAT (reported) 99 61 56 99 92 126
Add: Earnings of asso. 1 1 1.2 0.4 - -
Less: Minority interest - - - (14) (12) (13)
Extra. Expense/(Inc.) 0.1 - - - - -
PAT after MI (reported) 100 62 57 86 80 112Adj. PAT 100 62 57 86 80 112
% chg 86.6 (37.4) (8.1) 50.0 (7.4) 41.5
(% of net sales) 12.3 5.7 7.0 7.7 4.0 5.4
Basic EPS (`) 40.8 23.1 21.2 27.1 25.0 35.4
Fully diluted EPS (̀ ) 35.6 22.3 20.5 27.1 25.0 35.4
% chg 58.4 (37.4) (8.1) 32.1 (7.4) 41.5

8/3/2019 Godawari Power & Ispat Result Updated
http://slidepdf.com/reader/full/godawari-power-ispat-result-updated 7/10
Godawari Power | 2QFY2012 Result Update
November 11, 2011 7
Balance Sheet (Consolidated)
Y/E March (` cr) FY2008 FY2009 FY2010 FY2011 FY2012E FY2013E
SOURCES OF FUNDS
Equity share capital 27 27 27 32 32 32
Reserves & surplus 364 419 471 573 642 743
Shareholders’ funds 391 446 498 605 673 775
Share warrants 3 3 - - - -
Minority interest - 7 10 76 89 102
Total loans 293 355 518 884 856 906
Deferred tax liability 2 2 1 - - -
Total liabilities 689 812 1,027 1,566 1,618 1,783
APPLICATION OF FUNDS
Gross block 464 495 752 1,172 1,292 1,392
Less: Acc. depreciation 60 89 122 202 277 356
Net Block 404 407 630 971 1,015 1,037
Capital work-in-progress 15 202 194 94 64 61
Goodwill 5 5 5 - - -
Investments 19 10 12 22 55 55
Current assets 323 267 288 601 686 833
Cash 64 44 20 136 90 229
Loans & advances 41 47 59 110 110 110
Other 219 176 210 355 486 494
Current liabilities 78 77 101 127 203 204
Net current assets 246 189 188 474 484 629
Deferred Tax Asset - - - 5 5 5Mis. exp. not written off - - - - - -
Total assets 689 812 1,027 1,566 1,618 1,783
8/3/2019 Godawari Power & Ispat Result Updated
http://slidepdf.com/reader/full/godawari-power-ispat-result-updated 8/10
Godawari Power | 2QFY2012 Result Update
November 11, 2011 8
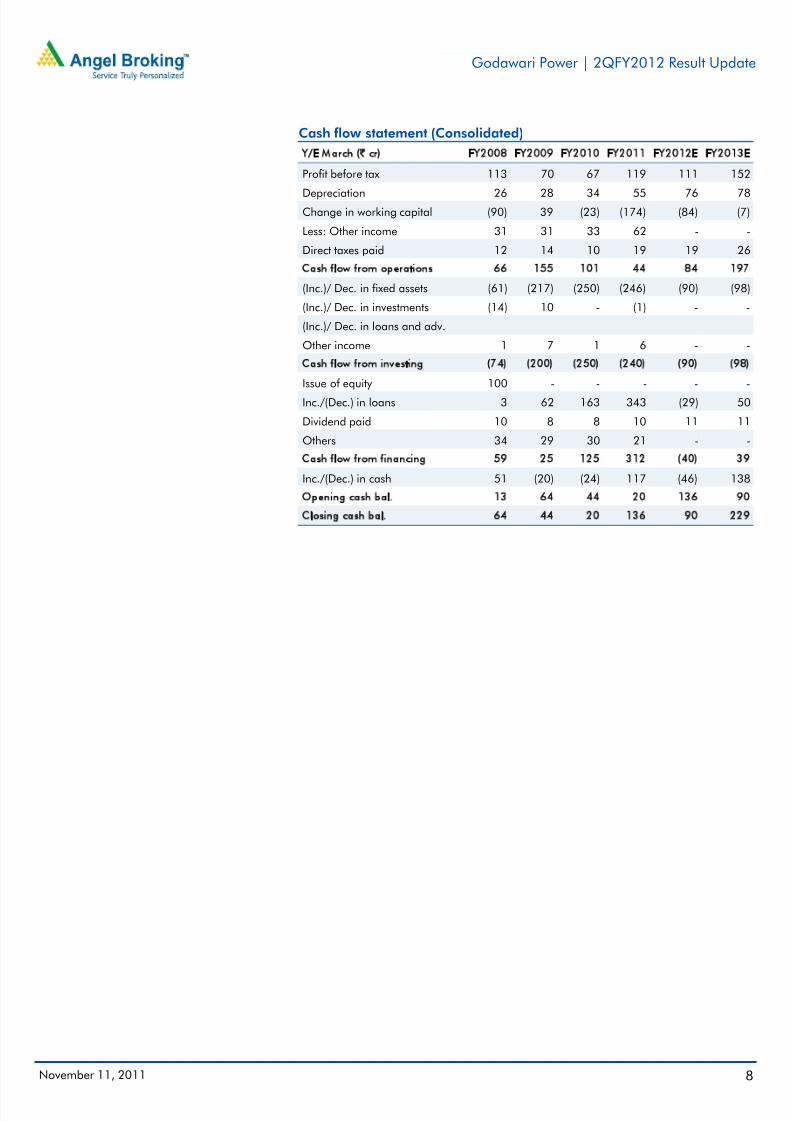
Cash flow statement (Consolidated)
Y/E March (` cr) FY2008 FY2009 FY2010 FY2011 FY2012E FY2013E
Profit before tax 113 70 67 119 111 152
Depreciation 26 28 34 55 76 78Change in working capital (90) 39 (23) (174) (84) (7)
Less: Other income 31 31 33 62 - -
Direct taxes paid 12 14 10 19 19 26
Cash flow from operations 66 155 101 44 84 197
(Inc.)/ Dec. in fixed assets (61) (217) (250) (246) (90) (98)
(Inc.)/ Dec. in investments (14) 10 - (1) - -
(Inc.)/ Dec. in loans and adv.
Other income 1 7 1 6 - -
Cash flow from investing (74) (200) (250) (240) (90) (98)
Issue of equity 100 - - - - -
Inc./(Dec.) in loans 3 62 163 343 (29) 50
Dividend paid 10 8 8 10 11 11
Others 34 29 30 21 - -
Cash flow from financing 59 25 125 312 (40) 39
Inc./(Dec.) in cash 51 (20) (24) 117 (46) 138
Opening cash bal. 13 64 44 20 136 90
Closing cash bal. 64 44 20 136 90 229
8/3/2019 Godawari Power & Ispat Result Updated
http://slidepdf.com/reader/full/godawari-power-ispat-result-updated 9/10
Godawari Power | 2QFY2012 Result Update
November 11, 2011 9
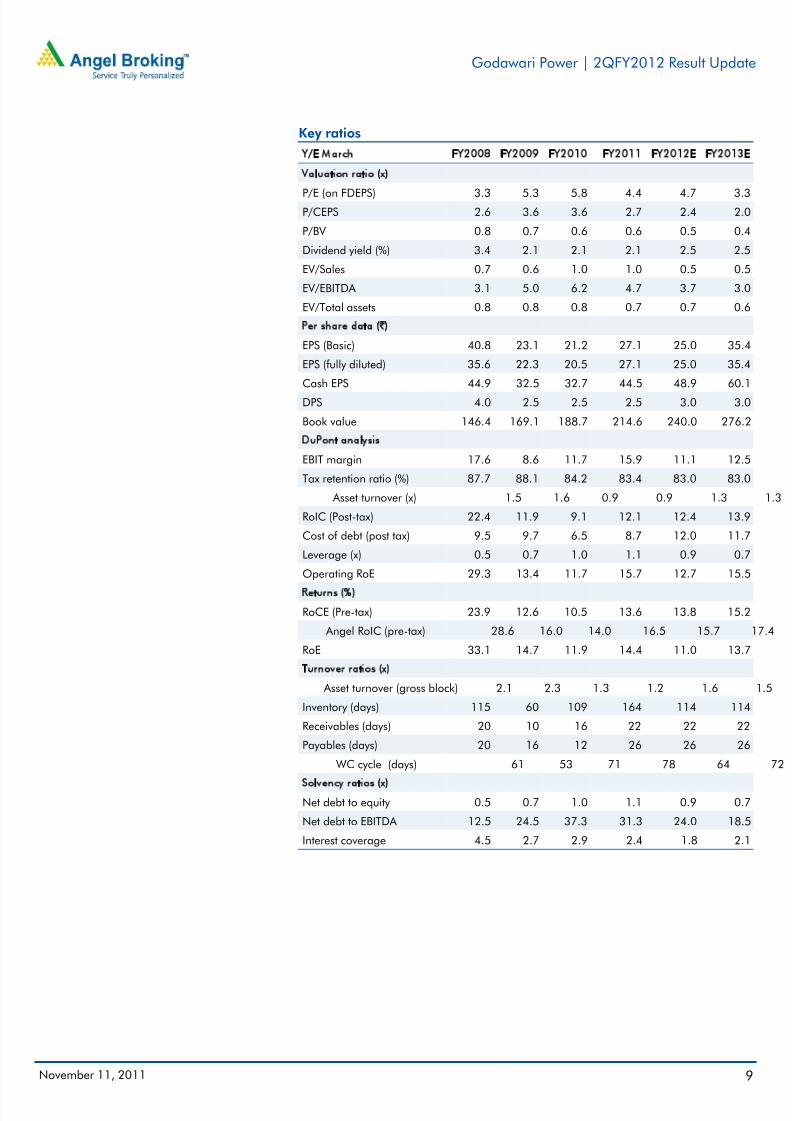
Key ratios
Y/E March FY2008 FY2009 FY2010 FY2011 FY2012E FY2013E
Valuation ratio (x)
P/E (on FDEPS) 3.3 5.3 5.8 4.4 4.7 3.3P/CEPS 2.6 3.6 3.6 2.7 2.4 2.0
P/BV 0.8 0.7 0.6 0.6 0.5 0.4
Dividend yield (%) 3.4 2.1 2.1 2.1 2.5 2.5
EV/Sales 0.7 0.6 1.0 1.0 0.5 0.5
EV/EBITDA 3.1 5.0 6.2 4.7 3.7 3.0
EV/Total assets 0.8 0.8 0.8 0.7 0.7 0.6
Per share data (`)EPS (Basic) 40.8 23.1 21.2 27.1 25.0 35.4
EPS (fully diluted) 35.6 22.3 20.5 27.1 25.0 35.4
Cash EPS 44.9 32.5 32.7 44.5 48.9 60.1
DPS 4.0 2.5 2.5 2.5 3.0 3.0
Book value 146.4 169.1 188.7 214.6 240.0 276.2
DuPont analysis
EBIT margin 17.6 8.6 11.7 15.9 11.1 12.5
Tax retention ratio (%) 87.7 88.1 84.2 83.4 83.0 83.0
Asset turnover (x) 1.5 1.6 0.9 0.9 1.3 1.3
RoIC (Post-tax) 22.4 11.9 9.1 12.1 12.4 13.9
Cost of debt (post tax) 9.5 9.7 6.5 8.7 12.0 11.7
Leverage (x) 0.5 0.7 1.0 1.1 0.9 0.7
Operating RoE 29.3 13.4 11.7 15.7 12.7 15.5
Returns (%)
RoCE (Pre-tax) 23.9 12.6 10.5 13.6 13.8 15.2
Angel RoIC (pre-tax) 28.6 16.0 14.0 16.5 15.7 17.4
RoE 33.1 14.7 11.9 14.4 11.0 13.7
Turnover ratios (x)
Asset turnover (gross block) 2.1 2.3 1.3 1.2 1.6 1.5
Inventory (days) 115 60 109 164 114 114
Receivables (days) 20 10 16 22 22 22
Payables (days) 20 16 12 26 26 26
WC cycle (days) 61 53 71 78 64 72
Solvency ratios (x)Net debt to equity 0.5 0.7 1.0 1.1 0.9 0.7
Net debt to EBITDA 12.5 24.5 37.3 31.3 24.0 18.5
Interest coverage 4.5 2.7 2.9 2.4 1.8 2.1

8/3/2019 Godawari Power & Ispat Result Updated
http://slidepdf.com/reader/full/godawari-power-ispat-result-updated 10/10
Godawari Power | 2QFY2012 Result Update
November 11, 2011 10
Research Team Tel: 022 - 3935 7800 E-mail: [email protected] Website: www.angelbroking.com
DISCLAIMER
This document is solely for the personal information of the recipient, and must not be singularly used as the basis of any investment
decision. Nothing in this document should be construed as investment or financial advice. Each recipient of this document should make
such investigations as they deem necessary to arrive at an independent evaluation of an investment in the securities of the companies
referred to in this document (including the merits and risks involved), and should consult their own advisors to determine the merits and
risks of such an investment.
Angel Broking Limited, its affiliates, directors, its proprietary trading and investment businesses may, from time to time, make
investment decisions that are inconsistent with or contradictory to the recommendations expressed herein. The views contained in this
document are those of the analyst, and the company may or may not subscribe to all the views expressed within.
Reports based on technical and derivative analysis center on studying charts of a stock's price movement, outstanding positions and
trading volume, as opposed to focusing on a company's fundamentals and, as such, may not match with a report on a company's
fundamentals.
The information in this document has been printed on the basis of publicly available information, internal data and other reliablesources believed to be true, but we do not represent that it is accurate or complete and it should not be relied on as such, as thisdocument is for general guidance only. Angel Broking Limited or any of its affiliates/ group companies shall not be in any way responsible for any loss or damage that may arise to any person from any inadvertent error in the information contained in this report .
Angel Broking Limited has not independently verified all the information contained within this document. Accordingly, we cannot testify,nor make any representation or warranty, express or implied, to the accuracy, contents or data contained within this document. While Angel Broking Limited endeavours to update on a reasonable basis the information discussed in this material, there may be regulatory,compliance, or other reasons that prevent us from doing so.
This document is being supplied to you solely for your information, and its contents, information or data may not be reproduced,
redistributed or passed on, directly or indirectly.
Angel Broking Limited and its affiliates may seek to provide or have engaged in providing corporate finance, investment banking orother advisory services in a merger or specific transaction to the companies referred to in this report, as on the date of this report or in
the past.
Neither Angel Broking Limited, nor its directors, employees or affiliates shall be liable for any loss or damage that may arise from or in
connection with the use of this information.
Note: Please refer to the important `Stock Holding Disclosure' report on the Angel website (Research Section). Also, pleaserefer to the latest update on respective stocks for the disclosure status in respect of those stocks. Angel Broking Limited andits affiliates may have investment positions in the stocks recommended in this report.
Disclosure of Interest Statement Godawari Power
1. Analyst ownership of the stock No
2. Angel and its Group companies ownership of the stock No
3. Angel and its Group companies' Directors ownership of the stock No
4. Broking relationship with company covered No
Note: We have not considered any Exposure below ` 1 lakh for Angel, its Group companies and Directors.
Ratings (Returns) : Buy (> 15%) Accumulate (5% to 15%) Neutral (-5 to 5%)Reduce (-5% to 15%) Sell (< -15%)
Related Documents
![Godawari Power and Ispat Limited - Motilal Oswal · Preliminary Placement Document Serial No: [ ] Not for circulation Date: [ ] Godawari Power and Ispat Limited (Incorporated in the](https://static.cupdf.com/doc/110x72/5b5c300a7f8b9a68368c3ccc/godawari-power-and-ispat-limited-motilal-preliminary-placement-document-serial.jpg)