GODAE systems in operation 1 E. Dombrowsky 1 , L. Bertino 2, G. Brassington 3, E.Chassignet 4 , F. Davidson 5 , H. Hurlburt 6 , M. Kamachi 7 , T. Lee 8 , M. Martin 9 , S. Mei 10 , M. Tonani 11 1 Mercator-Ocean, Toulouse, France 2 Nansen Environmental and Remote Sensing Center, Bergen, Norway 3 Centre for Australian Weather and Climate Research, BOM, Melbourne, Australia 4 Florida State University, COAPS, Tallahassee, USA 5 Fisheries and Oceans, St Johns, Canada 6 Naval Rerearch Laboratory, Stennis Space Center, Slidell, USA 7 Japan Meteorological Agency, Meteorological Research Institute, Tsukuba, Japan 8 Jet Propulsion Laboratory, Pasadena, USA 9 Met Office, Exeter, UK 10 National Marine Environment Forecast Center, Beijing, China 11 Istituto Nazionale di Geofisica e Vulcanologia, Bologna, Italy Abstract During the last 15 years, operational oceanography systems have emerged in several countries around the world. This emergence has been largely fostered by the GODAE experiment, during which each nation engaged in this activity have organised partnership and constructive competition. This trans-national coordination was very beneficial for the development of operational oceanography, leading to economies of scales and more targeted actions. Today, several systems provide routine real-time ocean analysis and forecast and/or reanalysis products. They are all based on (i) state-of-the-art primitive equation baroclinic Ocean General Circulation Model (OGCM) configurations, either global or regional (basin-scale), with resolutions that range from coarse to eddy resolving and (ii) data assimilation techniques whose complexity ranges from simple analysis correction to advanced 4D variational schemes. They assimilate altimeter sea level anomalies, remotely sensed SST such as GHRSST products and in situ profiles of T and S, including ARGO. Some systems have implemented downscaling capacities in specific regions of interest including shelf/coastal seas. Some also have implemented coupling with the atmosphere and/or the prognostic sea ice in polar regions. They are the GODAE system in operation. They are reviewed in this paper. The GODAE system discussed here include: (1) BLUElink OceanMAPS, (2) C-NOOFS, , (3) ECCO, (4) FOAM, (5) HYCOM/NCODA, (6) MERCATOR, (7) MFS, (8) MOVE/MRI.COM, (9) NLOM/NCOM, (10) NMEFC, (11) RTOFS and (12) TOPAZ. Key words: Operational Oceanography, Ocean Prediction, Ocean Data Assimilation Introduction The development of global and regional ocean data assimilation system started in the nineties. This development was made possible because several ingredients were in place: (i) advances in numerical ocean modelling, with some general ocean circulation model codes developed by the research community being available, they were ranging from simple quasi-geostrophic to more complex primitive equations, successfully implemented and scientifically validated in realistic configurations of the real ocean, numerically efficient and with relatively high coding and documentation standards, (ii) development of assimilation schemes for the ocean, from simple nudging to more elaborated kalman filters and 1 Co-authors and systems are listed in alphabetic order

Welcome message from author
This document is posted to help you gain knowledge. Please leave a comment to let me know what you think about it! Share it to your friends and learn new things together.
Transcript
GODAE systems in operation1
E. Dombrowsky1, L. Bertino2, G. Brassington3, E.Chassignet4, F. Davidson5, H. Hurlburt6, M. Kamachi7, T. Lee8, M. Martin9, S. Mei10, M. Tonani11
1Mercator-Ocean, Toulouse, France
2Nansen Environmental and Remote Sensing Center, Bergen, Norway 3Centre for Australian Weather and Climate Research, BOM, Melbourne, Australia
4Florida State University, COAPS, Tallahassee, USA 5Fisheries and Oceans, St Johns, Canada
6Naval Rerearch Laboratory, Stennis Space Center, Slidell, USA 7Japan Meteorological Agency, Meteorological Research Institute, Tsukuba, Japan
8Jet Propulsion Laboratory, Pasadena, USA 9Met Office, Exeter, UK
10National Marine Environment Forecast Center, Beijing, China 11Istituto Nazionale di Geofisica e Vulcanologia, Bologna, Italy
Abstract
During the last 15 years, operational oceanography systems have emerged in several countries around the world. This emergence has been largely fostered by the GODAE experiment, during which each nation engaged in this activity have organised partnership and constructive competition. This trans-national coordination was very beneficial for the development of operational oceanography, leading to economies of scales and more targeted actions. Today, several systems provide routine real-time ocean analysis and forecast and/or reanalysis products. They are all based on (i) state-of-the-art primitive equation baroclinic Ocean General Circulation Model (OGCM) configurations, either global or regional (basin-scale), with resolutions that range from coarse to eddy resolving and (ii) data assimilation techniques whose complexity ranges from simple analysis correction to advanced 4D variational schemes. They assimilate altimeter sea level anomalies, remotely sensed SST such as GHRSST products and in situ profiles of T and S, including ARGO. Some systems have implemented downscaling capacities in specific regions of interest including shelf/coastal seas. Some also have implemented coupling with the atmosphere and/or the prognostic sea ice in polar regions. They are the GODAE system in operation. They are reviewed in this paper. The GODAE system discussed here include: (1) BLUElink OceanMAPS, (2) C-NOOFS, , (3) ECCO, (4) FOAM, (5) HYCOM/NCODA, (6) MERCATOR, (7) MFS, (8) MOVE/MRI.COM, (9) NLOM/NCOM, (10) NMEFC, (11) RTOFS and (12) TOPAZ.
Key words: Operational Oceanography, Ocean Prediction, Ocean Data Assimilation
Introduction
The development of global and regional ocean data assimilation system started in the nineties. This development was made possible because several ingredients were in place: (i) advances in numerical ocean modelling, with some general ocean circulation model codes developed by the research community being available, they were ranging from simple quasi-geostrophic to more complex primitive equations, successfully implemented and scientifically validated in realistic configurations of the real ocean, numerically efficient and with relatively high coding and documentation standards, (ii) development of assimilation schemes for the ocean, from simple nudging to more elaborated kalman filters and
1 Co-authors and systems are listed in alphabetic order

variational schemes, successfully demonstrated in realistic applications, and with algorithmic simplifications allowing their implementation on the existing computers, (iii) the emergence of super computing facilities, enabling the implementation of realistic ocean data assimilation systems at basin scale at a resolution fine enough to represent the eddy field, (iv) the development of global observing systems, especially from space, with real-time data delivery mechanisms, more specifically the satellite altimeters that allowed for the first time ever the opportunity to have a all year long, quasi synoptic picture of the eddy field for global ocean, except at very high latitudes. Last but not least, this development has been pulled by some users, among others are the navies in some countries (US, UK, France, Australia, Canada), the meteorological agencies for applications ranging from object drift monitoring (France), or hurricane forecast (US) to seasonal and climate prediction (US, France, Japan, China), or the downstream commercial sector such as the oil industry (Norway).
This movement started approximately at the same time in Europe and USA in the early nineties. In the USA, the Naval Research Laboratory (NRL) implemented a 1/4 degree global NLOM system in 1997 (Metzger et al., 1998; Hurlburt et al., 2008). In Europe, The UK Met office implemented the FOAM system (Bell et al., 2000) started in 1997 (global, 1°), and the French Navy implemented the SOAP system (Lesquère and Dombrowsky 1994, Giraud et al, 1997) started first in 1993 in the Azores current region (12.5km horizontal resolution), and extended to the North-eastern Atlantic (at 1/10°) in 1998. They have been followed rapidly by an increasing number of other countries that have developed real-time ocean prediction capacities including Italy and Norway in Europe, Japan, Australia, China and Canada. Today, a dozen of systems are routinely operated in 9 countries participating to GODAE (Smith and Lefebvre, 1997), from regional high resolution including tides to global eddy resolving systems, providing estimates of the ocean state updated regularly (from daily to monthly), and providing forecast from a few days up to one month.
1. Systems overview
a) Global systems
Today, seven systems cover the whole world ocean (see Table 1). Two of these system operated in the US are eddy resolving: the operational NLOM/NCOM system (NLOM at 1/32° and NCOM at 1/8°), and a preoperational 1/12° system based on HYCOM and NCODA. In Europe, the UK FOAM system is currently transitioning from 1° to eddy permitting at 1/4° to be operational in 2008, using the same model configuration as Mercator Océan who has been running this 1/4° global system since 2005. The Australian BLUElink> OceanMAPS system covers the globe at 1° resolution, with enhanced resolution (up to 1/10°) in the Australian region, and has been operational since 2007. In the US, the ECCO group operates a global 0.3° resolution system in near real-time. The Japanese MOVE/MRI.COM has a 1° global implementation and is operational since march 2008.
b) Regional systems
Several systems have also been implemented in regions of the global ocean to serve regional needs or to simulate specific phenomenon such as the ENSO. In addition to these regional systems there are hundreds of local/coastal systems operated in the world for very local needs. We don’t address them in this paper (for a review of these system, see De Mey et al. 2008, this issue) The regional systems we address here are the GODAE systems that have been implemented in a whole ocean basin (see Table 1). They are the RTOFS system operated in the North Atlantic (4-18 km horizontal resolution) by NCEP (USA), the MOVE/MRI.COM regional systems in the North Pacific (1/2°) and the Northwester Pacific (1/10°) operated by JMA (Japan), the NMEFC (SOA) system in the Tropical Pacific (2°x1°) operated by NMEFC (China), the C-NOOFS system in the Northwestern Atlantic (1/4°) operated by DFO (Canada), the MFS system in the Mediterranean sea (1/16°) operated by INGV (Italy), the TOPAZ system in the North Atlantic and the Arctic ocean and ice (11-16 km horizontal resolution) operated by Met.no., the FOAM systems in the North Atlantic, Mediterranean and Indian Ocean (1/12°) operated by UKMO, and the MERCATOR North and Tropical Atlantic and Mediterranean (1/12°) operated by Mercator Océan.

c) Model systems
All the GODAE systems in operations use primitive equation OGCMs. They are differences in domain coverage, horizontal and vertical resolution, and different atmospheric forcing used. Most systems have z-level vertical coordinate systems, except the ones that are based on HYCOM (HYCOM/NCODA, RTOFS and TOPAZ) which have hybrid coordinate systems, isopycnal at depth, and also the layered model, NLOM. For a review of the model characteristics, see Chassignet et al. (2008, this issue).
The major characteristics of these modelling systems are summarized in the following table:
System OGCM Domain Horiz resol Vert sampling Atm forcing
BLUELINK MOM4 Global 1° global
1/10° around Austrlia
47 z-levels GASP
3-hourly
C-NOOFS NEMO Canadian Atlantic 1/4° 50 z-levels EC/GEM hourly
ECCO MIT Global 1° global
1°x0.3° tropics
46 z-levels NCEP
FOAM NEMO Global
North Atl. + Med + Indian
1/4° Global
1/12° Regional
50 z-levels UKMO
6-hourly
HYCOM/NCODA HYCOM Global 1/12° 32 hybrid layers
NOGAPS 3-hourly
MERCATOR NEMO Global
North Atl. + Med
1/4° Global
1/12° Regional
50 z-levels ECMWF
daily
MFS NEMO Mediterranean 1/16° 71 z-levels ECMWF
6-hourly
MOVE/MRI.COM MRI.COM Global 1° global
1/2° in Trop Pacific
1/10° in Western Trop
Pacific
50 z-levels JMA
6-hourly
NLOM/NCOM NLOM/NCOM
Global 1/32°; 1/8° 7 layers – 40 sigma or z
levels
NOGAPS
NMEFC IAP/CAS Tropical pacific (30°S-30°N)
2°x1° 14 z-levels NCEP+clim
RTOFS HYCOM North and Tropical Atlantic (>25°S)
4-18 km 26 hybrid layers
NCEP
3-hourly
TOPAZ HYCOM Atlantic and Arctic 11-16 km 22 hybrid layers
ECMWF
6-hourly
Table 1: GODAE system modelling component main characteristics
d) Assimilation systems
All the here above mentioned systems assimilate real-time or near real-time observations (except C-NOOFS). The assimilation schemes implemented are reviewed in Cummings et al (2008, this issue). Their main characteristics are summarized in the following table:
System Assimilation scheme
SST SSH Other
BLUELINK Ensemble OI
BODAS
AMSR-E Along track Jason+Envisat
T/S profiles
C-NOOFS None None None None
ECCO Kalman filter/smoother
None Along track Jason
T profiles
Climatology
FOAM Analysis Correction
scheme+IAU
OSTIA Along track Jason+Envisat+GFO
SSALTO/DUACS
T/S profiles
Ice concentration
HYCOM/NCODA Multivariate OI+IAU
NCODA
Satellite+in situ Along track Jason+Envisat+GFO
NAVO ADFC
T/S profiles
Ice concentration
MERCATOR SEEK filter
SAM2
RTG SST Along track Jason+Envisat+GFO
SSALTO/DUACS
T/S profiles
CORIOLIS
MFS 3D-VAR with vertical EOFs
Nudging (SST)
AVHRR maps from
CNR/ISAC
Along track Jason+Envisat+GFO
SSALTO/DUACS
T/S profiles
MOVE/MRI.COM 3D-VAR with vertical
EOFS+IAU
MGDSST Along track Jason+Envisat
T/S profiles
NLOM/NCOM OI, nudging,
MODAS, NCODA
MODAS SST NLOM: Along track Jason+Envisat+GFO
NAVO ADFC
MODAS synthetic 3D T/S,
NCODA T/S profiles (NCOM)
NMEFC 3D-VAR
OVALS
Reynolds Along track Jason
PODAAC SSHA
T/S profiles
CORIOLIS
CADC/NMDIS
RTOFS 3D-VAR with vertical 1D cov
GOES AVHRR + in situ
Along track Jason+Envisat
T/S profiles
TOPAZ Ensemble Kalman Filter 100 members
Reynolds SST SLA MAPS from Jason+Envisat+GFO
SSALTO/DUACS
T/S profiles Ice concentration
+ drift
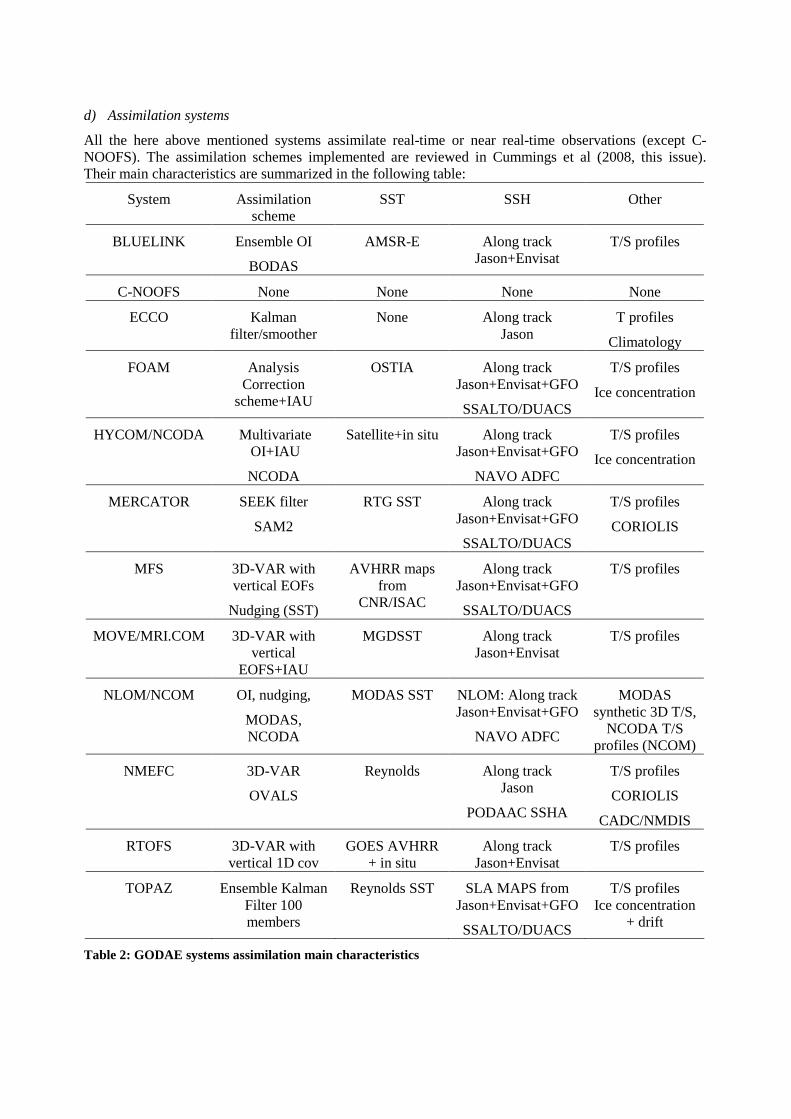
Table 2: GODAE systems assimilation main characteristics
e) Routine setup
The different systems have different routine setup. Some of them are designed for short-term prediction frequently updated, while some other are used to compute nowcast estimates.
The following table summarize the main routine setup characteristics.
System Forecast range Update Freq Hindcast length
BLUELINK 7 days Twice weekly 11 days
C-NOOFS 6 days Daily none
ECCO None Every 10 days
FOAM 5 days Daily 1 day
HYCOM/NCODA 7 days Daily 5 days
MERCATOR 14 days (weekly)
7-days (daily)
Weekly (global)
Daily (Natl+Med)
2 weeks (weekly)
MFS 10 days Daily 2 weeks
MOVE/MRI.COM 30 days Every 5 days 10 days
NLOM/NCOM 4 & 30 days/4 days Daily & weekly/daily 3 days
NMEFC None Monthly
RTOFS 5 days Daily
TOPAZ 10 days Weekly 1 week
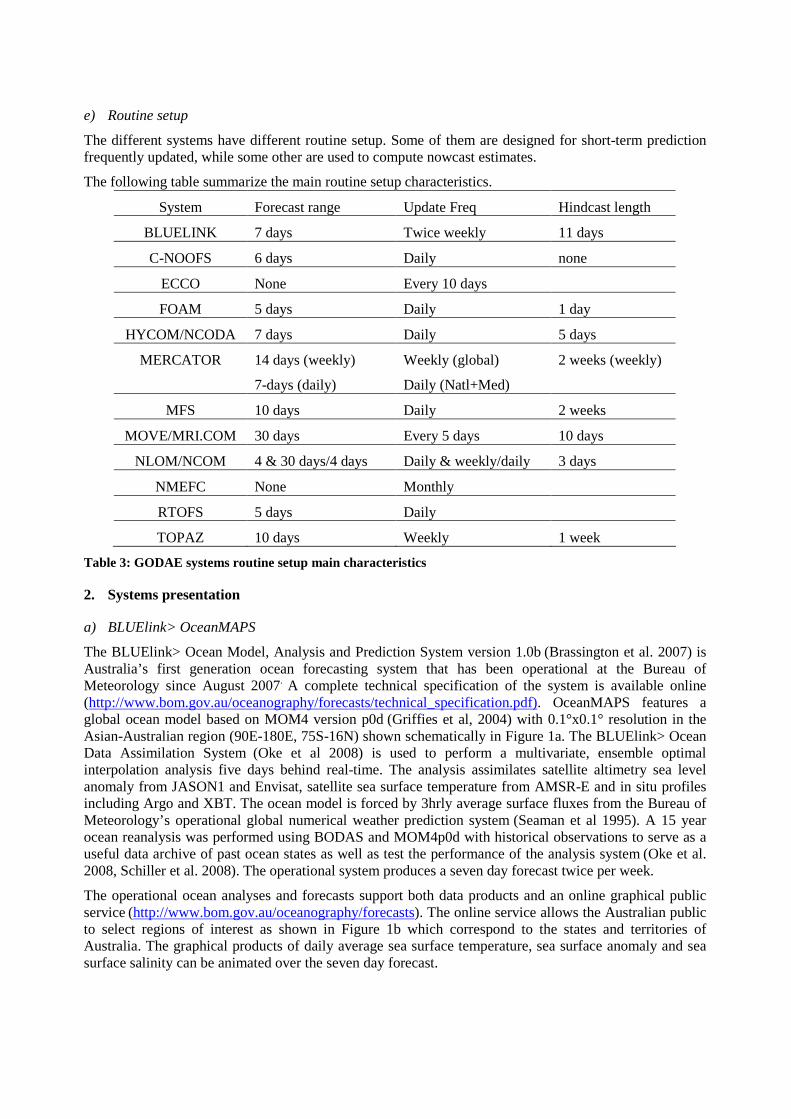
Table 3: GODAE systems routine setup main characteristics
2. Systems presentation
a) BLUElink> OceanMAPS
The BLUElink> Ocean Model, Analysis and Prediction System version 1.0b (Brassington et al. 2007) is Australia’s first generation ocean forecasting system that has been operational at the Bureau of Meteorology since August 2007. A complete technical specification of the system is available online
(http://www.bom.gov.au/oceanography/forecasts/technical_specification.pdf). OceanMAPS features a global ocean model based on MOM4 version p0d (Griffies et al, 2004) with 0.1°x0.1° resolution in the Asian-Australian region (90E-180E, 75S-16N) shown schematically in Figure 1a. The BLUElink> Ocean Data Assimilation System (Oke et al 2008) is used to perform a multivariate, ensemble optimal interpolation analysis five days behind real-time. The analysis assimilates satellite altimetry sea level anomaly from JASON1 and Envisat, satellite sea surface temperature from AMSR-E and in situ profiles including Argo and XBT. The ocean model is forced by 3hrly average surface fluxes from the Bureau of Meteorology’s operational global numerical weather prediction system (Seaman et al 1995). A 15 year ocean reanalysis was performed using BODAS and MOM4p0d with historical observations to serve as a useful data archive of past ocean states as well as test the performance of the analysis system (Oke et al. 2008, Schiller et al. 2008). The operational system produces a seven day forecast twice per week.
The operational ocean analyses and forecasts support both data products and an online graphical public service (http://www.bom.gov.au/oceanography/forecasts). The online service allows the Australian public to select regions of interest as shown in Figure 1b which correspond to the states and territories of Australia. The graphical products of daily average sea surface temperature, sea surface anomaly and sea surface salinity can be animated over the seven day forecast.

Utilisation and demonstration of impact is a critical activity for BLUElink> and other similar systems participating in the GODAE. Specific maritime applications include: defense, search and rescue, port management, offshore oil and gas operations, marine park management, fisheries management, eco-tourism as well as a number of recreational activities such as ocean going yacht racing and even beach swimming. In respect to the latter, BLUElink> OceanMAPS role is to forecast coastal upwelling events and cooler coastal water temperatures. A number of hypothermia victims were reported in the Austral summer of 2006/2007. Ocean forecast information will assist in education and awareness of the health risks. BLUElink> OceanMAPS will also support the prediction of weather phenomena including: tropical cyclones, east coast cyclones and coastal weather systems.
Australian territorial waters lie adjacent to the Indian, Pacific and Southern Oceans which spans the tropical through to the high latitudes supporting a wide range of physical processes. In 2007 the East Australian Current (EAC) and western Tasman Sea has seen a general increase in the quantity and magnitude of both cyclonic and anticyclonic eddies. A deep cyclonic eddy formed off the coast of Sydney in mid-February 2007 and persisted for several months. The eddy, dubbed a “monster” eddy in the popular media, was an extreme event that pushed the main branch of the EAC around the eddy influencing the local marine ecosystem. Anomalous heat content persisted into the Austral winter producing sharp sea surface temperature fronts as shown in Figure 1c, which were associated with an active season of East Coast Cyclones. The winter storm fronts in the Great Australian Bight frequently form a storm-surge along Australia’s southern coastline which subsequently propagates as coastally trapped waves. BLUElink> OceanMAPS provided accurate phase and amplitude forecasts of the event shown in Figure 1d. These are two examples of some of the mesoscale ocean events that occurred around Australia in 2007.
The BLUElink> OceanMAPS system has performed robustly as an operational system since August 2007 which was a key technical challenge for the first system. Reductions in performance of the system have occurred with two separate drop outs of parts of the observing system, such as Envisat and AMSR-E. A BLUElink> OceanMAPS version 1.1 is being prepared for June 2008 which will include a number of improvements such as the initialisation scheme. A project is underway to develop a new prediction system with a number of enhancements including greater horizontal and vertical resolution.

(a) (b)
(c) (d)
Figure 1: top left (a) Horizontal grid used in the BLUElink> OceanMAPS with every 30th grid point shown overlaying ocean bathymetry. Top right (b): Australian Bureau of Meteorology ocean forecast online region selection page . Bottom left (c) Sea surface temperature and surface currents for the west Tasman Sea from BLUElink> OceanMAPS for 9th July 2007. Bottom right (d): Sea level anomaly for the Great Australian Bight from BLUElink> OceanMAPS for 29th October 2007
b) C-NOOFS
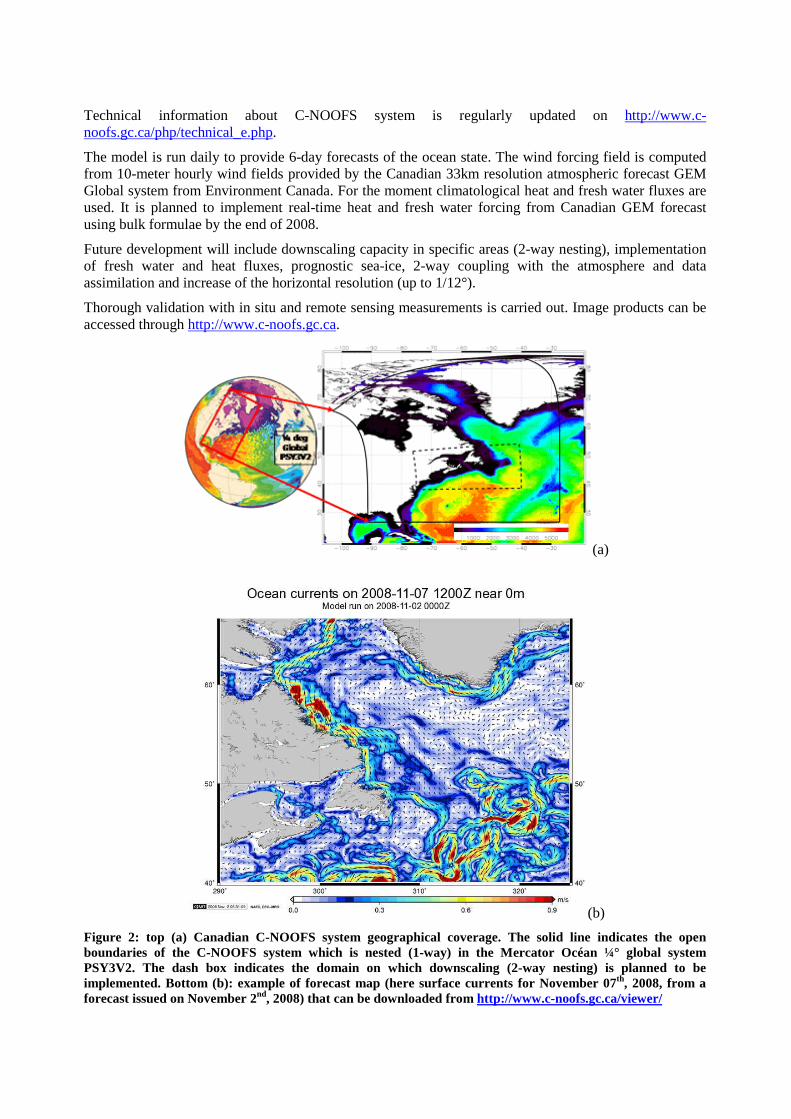
Fisheries and Oceans Canada (DFO) has developed the Canada-Newfoundland Operational Oceanography Forecast System (C-NOOFS, see http://www.c-noofs.gc.ca/). It covers the western part of the North Atlantic (Canadian Atlantic Waters) as shown in Figure 2, and provide daily forecast of the ocean state on a routine base. The C-NOOFS system is presently run in an unverified pre-operational mode. The CNOOFS system is routinely nested (1-way) in the Mercator Océan global system from which it gets initial and boundary data.
The system is implemented in the Canadian Atlantic waters (26.69°N-83-68°N, 103.12°W-27.23°W), currently on a 1/4° ORCA grid (Madec and Imbard, 1996) coinciding with the one used by Mercator Océan. Transition to 1/12° horizontal resolution is planned for the end of 2008. The OGCM used is NEMO (Madec et al. 1998, Madec, 2008) using a filtered free surface approximation. The vertical resolution is the same as the Mercator Ocean global system, i.e. 50 z-levels on the vertical. Tidal forcing is also implemented with one main component. Multiple tidal components implementation is planned for the end of 2008.
There is yet no data assimilation implemented in C-NOOFS. However, the benefits of ocean data assimilation are currently included by using open boundary and initial conditions that are generated by the Mercator system which assimilates the observation. The C-NOOFS system is reinitialized to Mercator Océan fields once a week.
Technical information about C-NOOFS system is regularly updated on http://www.c-noofs.gc.ca/php/technical_e.php.
The model is run daily to provide 6-day forecasts of the ocean state. The wind forcing field is computed from 10-meter hourly wind fields provided by the Canadian 33km resolution atmospheric forecast GEM Global system from Environment Canada. For the moment climatological heat and fresh water fluxes are used. It is planned to implement real-time heat and fresh water forcing from Canadian GEM forecast using bulk formulae by the end of 2008.
Future development will include downscaling capacity in specific areas (2-way nesting), implementation of fresh water and heat fluxes, prognostic sea-ice, 2-way coupling with the atmosphere and data assimilation and increase of the horizontal resolution (up to 1/12°).
Thorough validation with in situ and remote sensing measurements is carried out. Image products can be accessed through http://www.c-noofs.gc.ca.
(a)
(b)
Figure 2: top (a) Canadian C-NOOFS system geographical coverage. The solid line indicates the open boundaries of the C-NOOFS system which is nested (1-way) in the Mercator Océan ¼° global system PSY3V2. The dash box indicates the domain on which downscaling (2-way nesting) is planned to be implemented. Bottom (b): example of forecast map (here surface currents for November 07th, 2008, from a forecast issued on November 2nd, 2008) that can be downloaded from http://www.c-noofs.gc.ca/viewer/

c) ECCO
ECCO-GODAE systems that routinely produce global ocean data assimilation products include a near real-time system based on Kalman filter/smoother assimilation (e.g., Fukumori 2002) and a delay-mode estimation system based on the adjoint method (e.g., Wunsch and Heimbach 2007). Both systems use the MIT Ocean General Circulation Model. ECCO products are primarily geared towards the applications for physical oceanography and climate research (e.g., Lee and Fukumori 2003, Stammer et al. 2003). ECCO-GODAE products (along with those from other ECCO projects) are served by DODS and LAS servers (http://ecco-group.org). The products are characterized by their physical consistency (satisfying model equations exactly). This allows the closure of property budgets (e.g., heat conservation) and greatly facilitates in addition to oceanographic and climate research, interpretation of various processes controlling the evolution of the oceanic state. ECCO products and tools have also been widely used for research in other areas, such as initialization of seasonal-to-interannual prediction (e.g., Cazes-Boezio et al. 2008), constraining regional analysis systems (e.g., Gebbie et al. 2006), geodesy (e.g., Gross et al. 2005), and biogeochemistry (e.g., McKinley et al. 2004). Different aspects of ECCO products were validated in various studies according to the specific applications. For example, a study of the equatorial Indian Ocean by Halkides and Lee (2008) illustrated the good agreement between ECCO Kalman filter/smoother product with observations in terms of seasonal variations of zonal wind stress, sea level, and SST as shown in Figure 3.
Figure 3: Comparison of seasonal variations of zonal wind stress, sea level, and SST between estimates from ECCO Kalman filter/smoother assimilation product with satellite observations (from QuikSCAT, JASON-1, and AVHRR, respectively).
d) FOAM
The Forecasting Ocean Assimilation Model (FOAM) system run at the UK Met Office produces daily analyses and forecasts out to 5 days ahead of the ocean and sea-ice variables, and provides the main UK contribution to GODAE. Work is nearing completion to transition the FOAM system to use the Nucleus for European Modelling of the Oceans (NEMO) modelling framework. This system will be implemented
operationally in Autumn 2008. The ocean model within the NEMO framework is the OPA model which includes a free surface, partial steps bathymetry, and allows the use of a hybrid sigma-z vertical coordinate system and generalised orthogonal curvilinear horizontal coordinate systems. The initial implementation of FOAM-NEMO includes a global model at ¼˚ resolution, with regional models of the North Atlantic, Mediterranean Sea and Indian Ocean at 1/12˚ resolution. The global configuration has been developed in collaboration with Mercator. The sea-ice model currently being used in FOAM-NEMO is LIM2. The CICE sea-ice model is being tested for running with NEMO, and it is planned to use this in the operational system. FOAM uses 6-hourly surface fluxes from the Met Office operational NWP system to force the models. All FOAM configurations are operational with full operational support including 24/7 operator cover, on-call arrangements for response to problems by scientific staff, backup procedures, and use of resilient systems.
FOAM assimilates a range of real-time data. Both temperature and salinity in situ profile data delivered over the GTS are assimilated, including Argo, XBTs and TAO/Triton data. Extensive quality control checks are applied to the data including track, stability, background and buddy checks, using a quality control system developed for the ENACT and ENSEMBLES projects. Satellite altimeter sea level anomaly data from the Jason-1, GFO and Envisat satellites, currently retrieved from CLS on a daily basis, are assimilated into FOAM. Sea-ice concentration fields produced by the EUMETSAT Ocean & Sea Ice Satellite Application Facility (OSISAF) based on SSM/I data are also assimilated. FOAM assimilates sea surface temperature observations from ships and drifting and moored buoys, together with high resolution satellite data from GHRSST. These include data from the AATSR, AMSRE and AVHRR (from NOAA and MetOp satellites) instruments.
The FOAM data assimilation scheme has been developed from the Analysis Correction scheme which deals efficiently with multiple observation types and with large numbers of observations to calculate multivariate increments to the model fields. The FOAM implementation of the scheme includes numerous significant developments, most notably: a technique for timely assimilation of observations; a two-component background error covariance model; a bias correction scheme for controlling biases in the tropics; a scheme to correct for bias in satellite SST observations; and a scheme to correct biases in the mean dynamic topography. Sea surface height increments calculated from satellite altimeter data are projected in the vertical using the Cooper and Haines (1996) scheme. The FOAM assimilation scheme is described in detail in Martin et al. (2007).
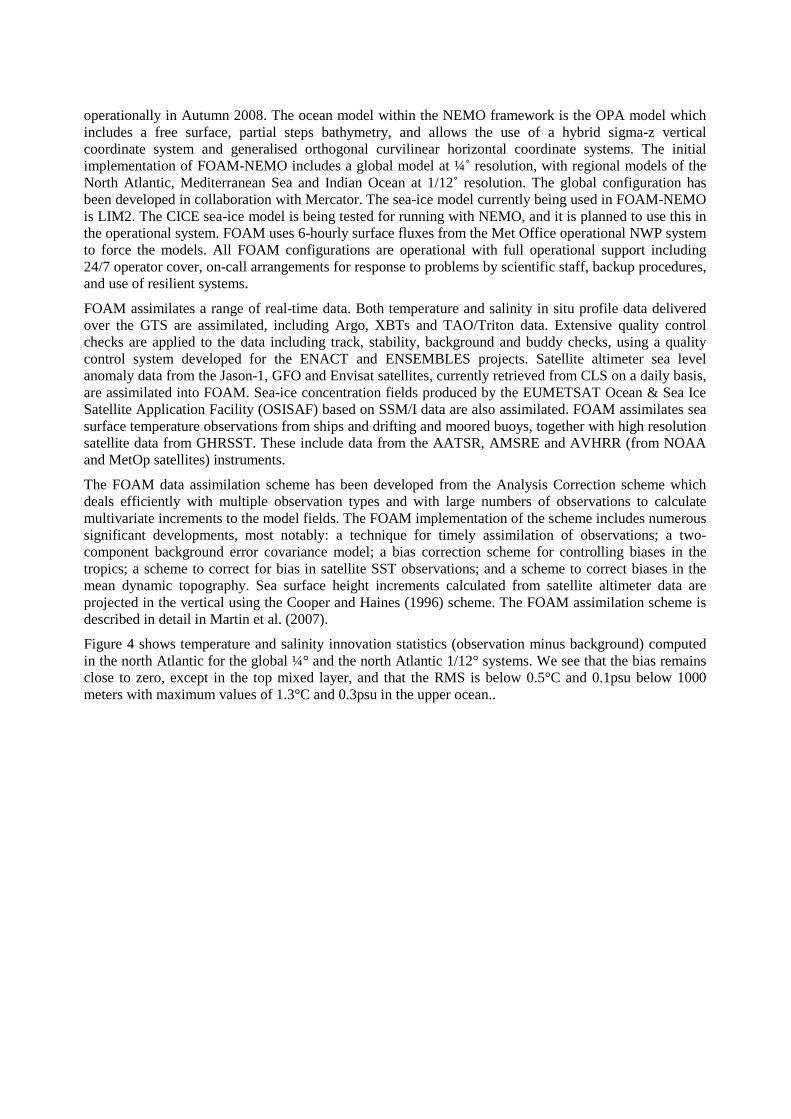
Figure 4 shows temperature and salinity innovation statistics (observation minus background) computed in the north Atlantic for the global ¼° and the north Atlantic 1/12° systems. We see that the bias remains close to zero, except in the top mixed layer, and that the RMS is below 0.5°C and 0.1psu below 1000 meters with maximum values of 1.3°C and 0.3psu in the upper ocean..
ORCA025
NATL12
ORCA025
NATL12
RMS Error
Mean Error
RMS Error
Mean Error
Figure 4: In situ profile (obs-background) statistics for global 1/4˚ and regional 1/12˚ model in the North Atlantic. Dark lines: RMS error, dotted line: bias.
Although the primary user of FOAM is the Royal Navy, the data are also used by a number of commercial operators for activities such as ship routing and cable repairs. The potential for use of FOAM data in the generation of synthetic climatologies is being explored with the UK Hydrographic Office. The high resolution North Atlantic FOAM configuration is used to drive the NW European shelf seas model developed by POL and operated by the Met Office. Boundary data are also generated from this model for a number of other coastal systems. FOAM data have been used extensively by the Seasonal Forecasting Group within the Met Office to monitor temperature anomaly patterns associated with cold winter conditions.
The method of serving FOAM data is dependent upon the customer requirement. Royal Navy data feeds use secure communications links to deliver data direct to their HORACE forecaster workbench system. For customers requiring an operational data supply, the Met Office Data and Products Distribution System (DPDS, see http://www.metoffice.gov.uk/wfc/index.html) supplies selected FOAM data by FTP in GRIB format. Direct FTP feeds are provided to other customers with specific operational requirements. Finally, FOAM data are made freely available for research use through ESSC web pages (http://lovejoy.nerc-essc.ac.uk:8080/Godiva2).
e) HYCOM/NCODA
NAVOCEANO operates a 1/12° global ocean prediction system using HYCOM (Bleck, 2002, Chassignet et al., 2003; Halliwell, 2004). This pre-operational system (not formally approved for operational use but integrated daily in operational queues at NAVOCEANO) has been running in near real-time since December 2006, and in real-time since February 2007 (Hurlburt et al., 2008). A 1-year assimilative hindcast spanning June 2007 - May 2008 was run to assess system performance and for comparison against the NCOM/NLOM system (Metzger et al., 2008). This hindcast was spun-up to real-time and is the basis for the system currently in use. It runs daily on 379 IBM Power 5+ processors using a part of the operational allocation on the machine. The daily run consists of a 5 day hindcast to take into account the

most recent observations in the assimilation system and then produces a 5 day forecast; this requires about ~15 wall clock hours.
The model configuration is a global implementation of HYCOM 2.2 on a 1/12° Mercator grid from 72°S matching a bipolar grid for the Arctic north of 47°N. The horizontal resolution is 6.5 km grid spacing on average, with 3.5 km grid spacing at North Pole. Bathymetry is derived from DBDB2 dataset. It has 32 hybrid layers in the vertical. It is coupled to a thermodynamic ice model that will be soon upgraded to Los Alamos CICE ice model.
It assimilates sea surface height (ENVISAT, GFO, and JASON), sea surface temperature (all available satellite and in-situ sources), all available in-situ temperature and salinity profiles (ARGO, CTD, moorings, etc.), and SSMI sea ice concentration. The three-dimensional multivariate optimum interpolation Navy Coupled Ocean Data Assimilation (NCODA) (Cummings, 2005) system is the assimilation technique. The NCODA horizontal correlations are multivariate in geopotential and velocity, thereby permitting adjustments (increments) to the mass field to be correlated with adjustments to the flow field. The velocity adjustments are in geostrophic balance with the geopotential increments, and the geopotential increments are in hydrostatic agreement with the temperature and salinity increments. The correction is computed from the innovations every day, and inserted in the model system using incremental analysis updates (IAU) on a 6-hour time window.
The model is forced during integration using the Navy Operational Global Atmospheric Prediction System (NOGAPS) outputs including wind stress, wind speed, heat flux (using bulk formula) and precipitation.
Products can be accessed as daily fields through http://www.hycom.org/dataserver. Image products can also be accessed through http://www7320.nrlssc.navy.mil/GLBhycom1-12/skill.html.
Figure 5 shows an example of such image. This is snapshot of sea surface temperature in the Arctic region. We can see the effect of high resolution in the Gulf Stream and Kuroshio regions with a lot of eddies associated to these western boundary currents. We can also see the sea ice extent (gay color).

Figure 5 : snapshot of Sea Surface Temperature field for November 3rd, 2008 in the Arctic domain obtained from http://www7320.nrlssc.navy.mil/GLBhycom1-12/skill.html . This snapshot was issued from a HYCOM/NCODA system run performed on November 5th, 2008.
f) MERCATOR
Mercator Océan (http://www.mercator-ocean.fr) started in 1995 to develop operational ocean forecast systems in France. The first real-time system started to produce routinely ocean products (including 2-week forecasts updated weekly) in 2001 in the tropical and north Atlantic at 1/3°.
Today, The Mercator Ocean system has global coverage with eddy admitting (1/4°) resolution (Hurlburt et al., 2008, this issue). It has eddy resolving (1/12°) resolution in the tropical and North Atlantic (north of 20°S) and the Mediterranean sea (Kamashi et al. 1008, this issue). The modelling component is based on NEMO (Madec et al, 1998) or ORCA tripolar grid (Madec and Imbard, 1996) as show on Figure 6a. It includes LIM prognostic sea-ice (Fichefet and Morales Maqueda 1997). Its assimilation system is based on the SEEK filter (Pham et al, 1998, Testut et al. 2003), with fixed base (computed once from en ensemble) and an adaptive scheme for the variance (Tranchant et al. 2008, Cummings et al. 2008, this issue). The data assimilated are along track altimeter data from Jason, ENVISAT and GFO satellites,
acquired from SSALTO/DUACS in Toulouse (CNES/CLS), in situ profiles of T and S (including XBTs, CTDs, ARGO, TAO/TRITON/PIRATA, …) acquired from CORIOLIS in Brest (IFREMER), and RTG SST products (Gemmill et al, 2007). The atmospheric forcing is applied computing interactive fluxes (bulk formulae) of heat, momentum and fresh water from operational ECMWF atmospheric products (applying precipitation correction using GPCP data with a method derived from Troccoli and Kallberg, 2004). River runoff (see Bourdale-Badie and Treguier, 2006) are computed from Dai and Trenberth (2003) climatology. The products are weekly updates of 2-week forecast for the global ocean physics (including sea ice), and daily updates of 1-week forecast in the tropical and north Atlantic, and in the Mediterranean Sea.
Two major improvements have been developed: a global eddy resolving (1/12°) system based on NEMO/LIM with assimilation (SEEK) of altimeter SST and T/S profiles, and a global primary ecosystem (1°) based on the PISCES N5P2Z2D-type model (Aumont et al., 2003) coupled to the physics (with physical data assimilation). They have been demonstrated in real-time in April 2008 (Dombrowsky, 2008) within the MERSEA project. These new capacities are not yet turned on for operations, but this is planned for 2010 within the MyOcean project (for more details, see Bahurel 2008, this issue).
In addition, a system covering the IBI domain (Iberian, Biscayan and Irish seas, see Figure 6a) at high resolution (1/32°) is under development. This system, to be nested in the global one, will include tides and high frequencies, and will deliver improved boundary data for coastal systems. The development of this system will be done within the MyOcean project in particular in collaboration with Puertos Del Estado in Spain who is already operating a forecasting system in this region (ESEOAT, see http://www.eseoo.org/servicios/oceano/eng/descripciontecnicaESEOAT_eng.html).
Reanalysis activities are also conducted at Mercator Océan. A 1/3° tropical and North Atlantic multivariate 11-year reanalysis of altimeter and T/S data has been produced (MERA-11, see Greiner et al. 2006), as well as low resolution (2°) global reanalysis (1979-present with SEEK, and 1960-2005 with 3D-FGAT OPAVAR, see Weaver, 2005). Today, a global eddy admitting (1/4°) reanalysis project has started within Mercator Océan and the research community (GLORYS project, see Barnier and Ferry, 2007) which aims at producing a 50-year ocean reanalysis (coincident with the ECMWF ERA-40 atmospheric reanalysis period). This project has started this year and the production of a first stream covering the most recent years (ARGO period: 2001-present) is ongoing, and planned for release in 2009. It will be followed by a second stream covering the altimeter period (1993-present). This second stream is planned as an international collaboration (Canada, Italy, UK and France) within the MyOcean project (Bahurel, 2008 this issue)) to be produced in 2010-2011. Then the third and final stream will cover the last 50-years.
Routine CAL/VAL activities are also conducted within Mercator Océan, to systematically document and monitor the quality of the products delivered (see Figure 6(b,c and d) for innovation statistics). This has been one of the major activities conducted by Mercator Océan within GODAE, defining a validation methodology agreed among the different GODAE centres, with the definition and implementation of common validation metrics (e.g. Le Provost et al 2001, Le Provost 2002, Crosnier et al. 2006, Hernandez et al. 2008, this issue).

(a)
Global ¼° SLA innovation RMS. Black Jason, Blue Envisat, Orange GFOGlobal ¼° SLA innovation RMS. Black Jason, Blue Envisat, Orange GFO
(b)
600m
0.5 °C
Global ¼°Temp. innov. RMS
600m
0.5 °C
Global ¼°Temp. innov. RMS
(c) 0.1 Psu0.1 Psu
(d)
Figure 6 : (a) MERCATOR systems grid and geographic coverage. Background (dark blue and red) the global ORCA tripolar grid used for the global systems, currently 1/4° for real-time services. In light blue, the domain on which horizontal resolution is enhanced to 1/12°. In orange, the domain for the future 1/32° configuration including tides and high frequencies dedicated to the delivery of boundary data to coastal systems in the IBI region. (b) global SLA innovation (observation minus background before assimilation) RMS, (c) global temperature innovation RMS with depth, (d) global salinity innovation RMS with depth
g) MFS
The Italian Group of Operational Oceanography (GNOO) has developed and maintains a system of ocean forecast for the Mediterranean sea (MFS) at INGV. The MFS system is operationally working since year 2000 and it has been continuously improving. The system is part of the Mediterranean Operational Oceanography Network-MOON. MFS has been developed since year 1999 in the frame of the Eu-project MFSPP (Mediterranean ocean Forecasting System Pilot Project) and MFSTEP (Mediterran ocean Forecasting System Toward Environmental Predictions) and has been further developed in the frame of MERSEA (Marine EnviRonment and Security for the European Area) and BOSS4GMES (Building Operational Sustainable services for GMES).
The system produces short term ocean forecast for the next ten days and since September 2005 the production is on a daily basis, while before it was weekly (Pinardi et al., 2003). The analysis is done weekly using a daily assimilation cycle. This means that in order to produce an analysis the model is run for 24 hours and the analysis is produced at the end of the day assimilating all and only the data available in that time window. The daily analysis cycle is done once a week, each Tuesday, producing 14 past analyses and the present day analysis. Each day a 10 days forecast is produced starting on Tuesday from an analysis and each of the successive six days from a model simulation. A biogeochemical forecast is produced once week (on Tuesday) by an off line coupling with an ecosystem model operated by OGS Osservatorio Geofisico Sperimentale, Trieste, Italy).
MFS is running at present two systems in parallel, V1 and V2. V1 used the numerical code of OPA implemented in the Mediterranean at 1/16°x1/16° horizontal resolution and 72 unevenly spaced vertical levels (Tonani et al., 2008), Figure 7a shows the model domain. The data assimilation system is derived from the SOFA code (De Mey and Benkiran, 2002) and further developed by Dobricic at al., (2007). V2 has the same grid of V1 but the model code is NEMO (Madec, 2008) implemented for the Mediterranean

sea and it has 3DVAR (Dobricic and Pinardi, 2008) for the assimilation. The major differences between the two systems are: the boundary in the Atlantic ocean which are closed in V1 while are nested into GLOBAL_MERCATOR in V2 and the parameterisation of the water flux. The water and corresponding salt fluxes are given by a relaxation toward a monthly mean climatology of salinity at the surface in V1 while in V2 are related to the rate of evaporation, precipitation and river run off.
The daily forecast and weekly analysis are available in real time to the users through a dedicated ftp service. Every day a web bulletin is published on the web site (http://gnoo.bo.ingv.it/mfs). A continuous evaluation in near real time of the forecasts and analyses produced by MFS has been developed in order to continuously verify the system and to provide useful information to the users. As example, Figure 7(b) shows the Root Mean Square Error for SLA (cm) from August 2004 to October 2008.
MFS has developed different kind of downstream products based on the core services. Indicators have been defined in the frame of ETC-Water and B4GMES and are operationally produced. A seven years time series web bulletin is published every day together with daily maps of SST, heat content and transports. Forecast currents fields have been used in support to search & rescue operations in collaboration with the Italian Coast Guard through a trajectory model. An MFS-MEDSLICK coupled system is operationally used for oil spill forecasting in support to REMPEC activities.
(a)
(b)
Figure 7: MFS model domain and bathymetry (a), Root Mean Square Error of SLA (cm) from August 2004 to October 2008 (b)
h) MOVE/MRI.COM
The Meteorological Research Institute (MRI) multivariate ocean variational estimation (MOVE/MRI.COM) systems have been developed for research system to study mesoscale phenomena and climate variability, and for the operational ocean data assimilation system in Japan Meteorological Agency (JMA). The systems have three varieties, the global (MOVE/MRI.COM-G), and North Pacific (-
NP), and western North Pacific (-WNP) systems (Usui et al., 2006a). MOVE/MRI.COM-G is for initialization of seasonal-interannual forecasting and analysis/reanalysis. MOVE/MRI.COM-NP and -WNP are for initialization of ocean forecasting in the North pacific and analysis/reanalysis.
MOVE/MRI.COM systems are composed of OGCMs and a variational analysis scheme. The numerical code for the OGCMs is the MRI community ocean model (MRI.COM), which has been developed in JMA/MRI and is independent of any other popular OGCM code. Detailed model structure and numerical schemes are reported by Ishikawa et al. (2005) and Tsujino et al. (2006). The OGCM used in MOVE/MRI.COM-G (model G) has a global domain for climate variability. The domain extends from 75°S to 75°N globally. The grid spacing in the zonal (meridional) direction is 1° (0.3° within 5°S–5°N, and 1° poleward of 15°S and 15°N). There are 50 levels in vertical. On the other hand, the system for ocean weather employs two models: the North Pacific and western North Pacific models (models NP and WNP). Model WNP is nested into model NP (one-way nesting). The domain of the model WNP extends from 15°N to 65°N, and 117 °E to 160°W, with a grid spacing of 1/10° × 1/10° around Japan. Region of the model NP is from 15°S to 65°N, and 100°E to 75°W with a grid spacing of 1/2°x1/2°. Both models have the same vertical grid spacing (54 levels).
The analysis fields for models G, NP, and WNP are calculated separately. The analysis scheme adopted in the MOVE/MRI.COM system is a multivariate 3DVAR with vertical coupled T–S EOF modal decomposition of a background error covariance matrix (Fujii and Kamachi, 2003a, c). The amplitudes of the coupled EOF modes are employed as control variables and the analyzed temperature and salinity fields are represented by the linear combination of the modes. A preconditioned optimizing utility for large-dimension analysis (POpULar; Fujii and Kamachi, 2003b and Fujii, 2005) was developed and applied for minimizing a nonlinear cost function as the descent method. This scheme can minimize the cost function including a constraint of the background without inversion of the background error covariance matrix, even if the function is nonlinear. The regions of the models G, NP, and WNP are divided into 40, 12 and 13 subregions, respectively. EOF modes are calculated in each subregion from world ocean database 2001 (WOD2001), according to Fujii and Kamachi (2003b). We retained 12 dominant modes in each subregion. More than 85% of the total variance can be explained by the dominant 12 modes although this estimate depends on each subregion. The Gaussian function is adopted as the horizontal correlation model. The e-folding scales along latitude and longitude lines are also different in each subregion by Kuragano and Kamachi (2000). The model temperature and salinity fields are corrected by the analysis result through IAU technique.
Temperature, salinity and along-track SSH observations are employed in the analysis. The observations were collected from WOD2001 and the global temperature–salinity profile program (GTSPP) database that contains ship hydrography, XBT, drifting buoy, Argo float and tropical array systems such as TAO/Triton. We also adopted the along track SSH anomaly data of TOPEX/Poseidon (T/P), Jason-1, ERS-1/2, ENVISAT. Real time global merged SST analysis MGDSST (i.e., Japan GHRSST) combined ship and satellite data by JMA is also adopted.
The assimilation experiments (analysis/reanalysis) have been conducted from 1948 to 2007 for the -G and -NP systems, and from 1985 to 2007 for the -WNP system. Prediction experiments for the WNP were also conducted from 1993 to 2004 with 90 days lead time (Usui et al., 2006b). Here we introduce examples of the assimilation. Figure 8a shows a snapshot of temperature field at 100m depth for August 15, 2004. It shows the realistic field with Kuroshio 2004 large meander. Figure 8b shows the comparison of power spectrum of the variability along the track of the satellite altimetry. Figure 8c shows a comparison of the Kuroshio transport south of Japan (ASUKA line). The mean transport is 42 (40) SV of the observation (assimilation) (Imawaki et al., 2001, and Usui et al., 2006a). The volume transport and its variability are represented well. Some peak values are due to strong meso-scale eddies. The system has been operated in the Japan Meteorological Agency for nowcasting and forecasting of ocean state from March, 2008, after two years Cal/VAL project.

(a)
(b) (c)
Figure 8: (a): Snapshot of subsurface temperature field for August 15, 2004. (b): Comparison of power spectrum along the track of TOPEX/Poseidon. (c): Comparison of the Kuroshio transport south of Japan. Red: assimilation. Square: observation.
i) NLOM/NCOM
NAVOCEANO is operating a system based on two global OGCM configurations. The first one is a layered model (Navy Layered Ocean Model, NLOM) with simplified physics on the vertical, but featuring very high resolution on the horizontal. This system is designed to provide one-month forecast of the surface currents, including the eddies and high resolution processes on one hand, and estimates of the SSH and SST through the assimilation of altimeter SSH on the other hand. Its output, in addition to other observations, are used to constrain a full OGCM with high vertical resolution (Navy Coastal Ocean Model, NCOM), including more complexity in the representation of the physics, but featuring lower horizontal resolution. NCOM is designed to provide boundary data for coastal systems worldwide.
NLOM is a layered model system (Hurlburt and Thompson, 1980, Wallcraft, 1991, Wallcraft and Moore, 1997, Moore and Wallcraft, 1998, Wallcraft et al., 2003) featuring 6 Lagrangian layers and a mixed layer (7th layer) is added on top of it. It is implemented on a global 1/32° grid, and is forced by daily outputs of the Navy Operational Global Atmospheric Prediction System (NOGAPS) and was the first global ocean forecasting system to assimilate real-time altimeter data. It started to run operationally at NAVOCEANO from September 2001, first with 1/16° horizontal resolution (Smedstad et al. 2003), and then at 1/32° since March 2006 (Shriver et al. 2007).

Global NCOM (Barron et al., 2006) is a baroclinic, hydrostatic, Boussinesq, free-surface ocean model that allows its 40 vertical levels to consist of sigma coordinates for the upper layers and z-levels below. A stretched spherical grid at south of 32°N with 14 km spacing transitions to an Arctic basin on a 5 km rotated bipolar grid with singularities over land in Siberia and Canada. Global NCOM has been providing daily forecasts in real time since November 2001 and was declared operational by the Navy Administrative Oversight Panel (AMOP) on 19 February 2006 based on extensive hindcast validation studies (Barron et al. 2004, Kara et al 2006) and operational tests. The second generation global NCOM (Barron et al., 2007), declared operational on 6 March 2006, modified the assimilation to use SSH from 1/32° NLOM. The third-generation NCOM system, declared operational by AMOP on 21 November 2008, extends forecasts to five days, uses NCODA (Cummings, 2005) to assimilate in situ observations into a background of synthetic profiles and adds a coupled ice model (Polar Ice Prediction System 3.0; Van Woert et al., 2004) in the Arctic.
The NLOM assimilation of altimeter data is performed using an OI deviation SSH analysis with the model SSH field as the first guess. A statistical inference technique updates all layers of the model based on the analyzed SSH deviations (Hurlburt et al., 1990) and a geostrophic update for the velocity field is calculated outside the equatorial region. An incremental updating scheme is used to assimilate the data. Currently, GEOSAT Follow-On (GFO), JASON1 and ENVISAT data are being assimilated. The MODAS SST analyses of satellite IR data are also assimilated via nudging in NLOM.
The assimilation on NCOM is based on a 3-dimensional interpolation system including sophisticated vertical inference of surface parameters, called MODAS (Modular Ocean Data Assimilation System, see Fox et al, 2002), which combines SSH coming from NLOM system, SST from MODAS-2D (Barron and Kara, 2007), and historical correlations of SSH/SST/T/S to produce 3-D estimates of T and S. These 3D T&S estimates are assimilated into NCOM using a nudging technique. In the latest version, an NCODA analysis of in situ observations, using the synthetic profiles as a background, is assimilated into NCOM. Surface heat and salinity fluxes are adjusted by the data-model differences times a flux rate. A more detailed description of the MODAS/NCOM assimilation system can be found in Rhodes et al. (2002) and Barron et al. (2007).
Figure 9 shows example of product that can be accessed on the WEB for NLOM (top) and NCOM (bottom). These figures show the SSH analysis. We see the capacity of these systems to reproduce the eddy activity at the global scale.

(a)
(b) (c)
Figure 9: examples of ocean products that can be downloaded on the WEB for NLOM (a) and NCOM (b) and (c). Shown here is an analysis of the sea surface height.
j) NMEFC
The National Marine Environment Forecast Centre of China (NMEFC) of the State Oceanographic Administration has implemented an operational ocean analysis system to estimate temperature and salinity fields in the Tropical Pacific Ocean. This system has been launched in 2008 to provide real-time monitoring of ENSO events that have a large impact on China climate variability. and analysis is performed on a monthly base (issued ever month on the 25th) and can be accessed from NMEFC website
It is based on an OGCM developed by the Institute of Atmospheric Physics (IAP), Chinese Academy of Science (Zhang and Endow 1992) implementing primitive equations under hydrostatic and Boussinesq approximation. It is implemented in the Tropical Pacific (30°S-30°N, 69°W-121°E) on a staggered grid whose horizontal resolution is 2°x1° with solid eastern and western boundaries following realistic coastlines. There is a no-slip and no-flux condition applied on lateral walls with in addition relaxation of T and S (60 days time scale) to Levitus (1982) climatology at the open boundaries (North and South).

There are 14 levels on the vertical, with 10 levels in the upper 240 meters, with no bottom topography. The model includes a convective adjustment procedure when hydrostatic instability occurs.
In situ temperature and salinity observations from ARGO, TAO, XBT retrieved from the CORIOLIS and the China real-time Argo Data Centre, and Altimeter sea surface height anomalies provided by PODAAC (SSHA products) are assimilated using a 3D-VAR based optimal interpolation (OI) scheme called OVALS (Ocean Variational AnaLysis System). Taking into account the large scales of the Pacific Ocean, the assimilation window has been adjusted to 30 days. A variational OI scheme is used to minimize the cost function. Control variables are temperature and salinity. They are both adjusted using non-linear T/S relations as balance constrains for the assimilation of altimeter data as described by Zhu and Yan (2004). In order to reduce the memory size of the assimilation, vertical and horizontal background error correlations are solved separately (Yan, Zhu, Li and Zhou, 2004).
The model is forced during integration using wind stress computed from NCEP wind speed retrieved from the NCEP website, blended with Hellerman and Rosenstrein (1983) climatological wind. Heat fluxes are computed relaxing sea surface temperature towards Reynolds and Smith (1994) OISST products. Fresh water fluxes are neglected.
Figure 10 shows monthly estimates of temperature and salinity at 30m for January 2008, which illustrate the capacity of the system to reproduce the tropical pacific patterns thanks to the assimilation of the observations through variational OI. Such results can be accessed on http://dell1500sc.nmefc.gov.cn/argo-sz/argo7n.asp web page, on which horizontal and vertical sections are available for the past year, with a delay of a few month from real-time. (today, i.e. November 2008, last available is July 2008).
Figure 10: monthly estimates of temperature (top) and salinity (bottom) at 30 meters for January 2008, obtained with the NMEFC 3D-VAR assimilation system.

k) RTOFS
NCEP implemented a prediction system in the North Atlantic called RTOFS for Real-Time Ocean Forecast System. This system is operated on a daily bases to provides 5-days forecast of the ocean state on a routine bases. It has been designed to provide seamless boundary and initial conditions to more regional systems and to bio-geochemical systems. One of its applications is the coupling with an atmospheric model (HWRF) for the monitoring and prediction of hurricanes. It started to run in rear-real-time in 2005.
This system is based on HYCOM OGCM, implemented in the North Atlantic on a curvilinear coordinate grid whose horizontal resolution ranges from 18 km in the eastern north Atlantic to 4 km in the westernmost region (Gulf of Mexico). Its domain extends from ~20°S to ~70°N. It has 26 hybrid coordinates on the vertical (21 isopycnal and 5 z-levels near the surface). It includes body tides (8 constituents). Part of its development was done under a multi-institutional HYCOM Consortium funded by NOPP.
The system assimilates along track altimeter data from Jason-1 and GFO, T/S profiles from ARGO, (A)XBTs and CTDs, moorings, and SST from GOES, AVHRR and in situ observations. The assimilation system is an in-house 3D-VAR scheme implemented in the RTOFS system since 2007. More specifically, this assimilation scheme is based on a 2D-VAR scheme with 1D vertical modes. The horizontal 2D-VAR assumes Gaussian isotropic, inhomogeneous covariance matrix using recursive filtering (Purser et al., 2003a, b) while the vertical covariance matrix is constructed from coarser resolution simulations, and implements the lifting/lowering of the main pycnocline for the assimilation of altimeter SSH.
The model is forced using 3-hour NCEP (GDAS/GFS) model outputs. The open boundaries are relaxed to climatology. Rivers fresh water fluxes are prescribed from a blend of observations (USGS data) and climatology (RIVDIS).
The RTOFS products are distributed (http://polar.ncep.noaa.gov/ofs) via ftp server, and for selected products they reside in the data server NOMADS.
Figure 11 shows a snapshot of the products of the RTOFS system that can be accessed on the web. It shows the sea surface temperature and surface current velocities in the Gulf of Mexico where the RTOFS has the higher horizontal resolution (~4 km).
Figure 11 : snapshot of sea surface temperature (left) and surface current velocities (right) in the Gulf of Mexico obtained from the RTOFS website. These snapshots are for November 11th, 2008, and are 5-day forecast issued on November 6th, 2008.
l) TOPAZ
The TOPAZ system was started at the Nansen Environmental and Remote Sensing Center (NERSC) within the DIADEM, TOPAZ and MERSEA European Projects (Bertino and Lisæter 2008). Operations
have been continuous from January 2003 till now. Since March 2008, met.no exploits the TOPAZ system in its operational suite, while the developments take place at NERSC.
TOPAZ uses the HYCOM model and the Ensemble Kalman Filter (EnKF, Evensen 2006). It is the first GODAE system using dynamical error statistics for assimilation (Cummings et al. 2008, this issue). TOPAZ is designed to serve ocean and sea-ice forecasts to the public at large, to environmental agencies and to private users such as the shipping offshore oil and gas industry. The latter activities are motivated by the expected retreat of the summer sea-ice from the Arctic and the enhanced offshore activity and transport hazards may become a threat to the Arctic fragile ecosystem, thus the need for efficient monitoring and forecasting.
TOPAZ uses a North Atlantic and Arctic configuration of the HYCOM model of horizontal resolution 11 km to 16 km (about 1/8th of a degree) and 22 hybrid vertical layers, coupled to an Elastic Viscous Plastic dynamic and thermodynamic sea-ice model and to the Norwegian Ecosystem Model (NORWECOM) from the IMR. The ecosystem module of TOPAZ is used in hindcast mode so far (Hansen and Samuelsen, 2008). The system is forced by operational forecasts and analyses from the ECMWF.
The EnKF runs 100 members with model errors in the wind and heat forcing terms, the same ensemble statistics are used for assimilating different satellite and in-situ data: sea level anomalies, sea surface temperatures, sea-ice concentrations, sea ice drift and Argo T/S profiles. The assimilation is local with a data selection radius between 200 km and 1000 km depending on observation density. In the latest TOPAZ3 prototype, the resolution of the physical model has been doubled and additional data have been assimilated: Lagrangian sea-ice drift and Argo temperature and salinity profiles, both datasets being obtained from Ifremer.
(a) (b)
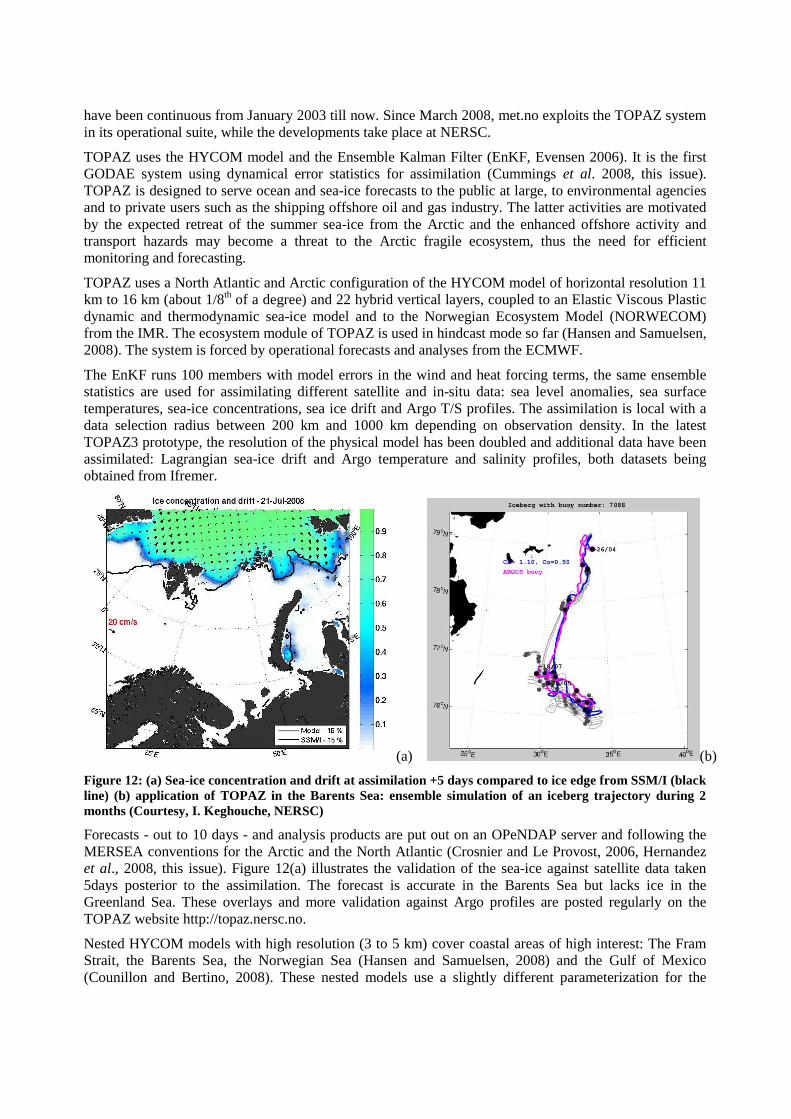
Figure 12: (a) Sea-ice concentration and drift at assimilation +5 days compared to ice edge from SSM/I (black line) (b) application of TOPAZ in the Barents Sea: ensemble simulation of an iceberg trajectory during 2 months (Courtesy, I. Keghouche, NERSC)
Forecasts - out to 10 days - and analysis products are put out on an OPeNDAP server and following the MERSEA conventions for the Arctic and the North Atlantic (Crosnier and Le Provost, 2006, Hernandez et al., 2008, this issue). Figure 12(a) illustrates the validation of the sea-ice against satellite data taken 5days posterior to the assimilation. The forecast is accurate in the Barents Sea but lacks ice in the Greenland Sea. These overlays and more validation against Argo profiles are posted regularly on the TOPAZ website http://topaz.nersc.no.
Nested HYCOM models with high resolution (3 to 5 km) cover coastal areas of high interest: The Fram Strait, the Barents Sea, the Norwegian Sea (Hansen and Samuelsen, 2008) and the Gulf of Mexico (Counillon and Bertino, 2008). These nested models use a slightly different parameterization for the
specific needs of each area. Figure 12(b) illustrates the potential use of the nested HYCOM ice-ocean model in the Barents Sea as forcing fields for iceberg modelling (Keghouche et al., 2008).
The TOPAZ system uses 2000 CPU hours per week on a 990-processors IBM p575 facility from the Norwegian Supercomputing Project (NOTUR2). In July 2008, TOPAZ has been ported to a 5500-processors Cray XT4 in view of a 20-years reanalysis to be carried out within the MyOcean European project (Bahurel et al. 2008, this issue).
Conclusions
The initial GODAE goal was to have global high resolution (a few km) advanced ocean modelling and assimilation systems, fully assessed, operated in real-time, providing forecast services to users. Large progresses towards this goal have been made during the last 10 years GODAE period: today, several monitoring and forecasting systems have been developed and are operated in the countries that have participated in the GODAE. Some of these systems are global, some regional, some are eddy resolving or low resolution, most assimilate the real-time observations both remotely sensed and in situ and provide real-time estimates and forecast of the ocean state. Though the existing capacity is close to the target in terms of scientific capacity, there is still some work to do to reach the target, including R&D and engineering efforts but also international coordination to transition from the demonstration of useful services based on modelling and assimilation systems to fully operational services for the ocean. Finally, such capacity development has been possible because of the parallel development of the observing systems, such as the radar satellite altimeters, and the ARGO array, and observation centres providing the observations in real-time on a routine bases. The transition to operational services will require the consolidation of these observing systems.
Acknowledgement
Development of HYCOM and the HYCOM/NCODA ocean prediction system was funded under the U.S. National Ocean Partnership Program (NOPP). The U.S. Office of Naval Research (ONR) provided additional funds for the development of HYCOM and NCODA and provided the funding for development of NLOM, NCOM and the NLOM/NCOM ocean prediction system. Large grants of computer time were provided by the U.S. Defense Department High Performance Computing Modernization Program (HPCMP).
Part of this work (i.e. development of FOAM, MERCATOR, MFS and TOPAZ systems) has been done within the MERSEA project, partly funded by the 6th Framework Program of European Commission.
References
Aumont O., E. Maier-Reimer, S. Blain, P. Monfray, 2003, An ecosystem model of the global ocean including Fe, Si, P co-limitations, Global Biogeochemical Cycles, vol. 17, N°. 2, 1060, doi:10.1029/2001GB001745
Bahurel et al, 2008 MyOcean, an European example of post-GODAE initiatives, GODAE final conference proceedings, this issue.
Barnier, B., and N. Ferry, 2007, Eddy Permitting Global Ocean/sea-Ice Reanalysis, GLORYS project, 31 pp, Mercator-Océan, Toulouse, France
Barron, C.N., A.B. Kara, H.E. Hurlburt, C. Rowley, and L.F. Smedstad, 2004, Sea surface height predictions from the global Navy Coastal Ocean Model (NCOM) during 1998-2001, J. Atmos. Oceanic Tech., 21, 1876-1894.
Barron, C.N., A.B. Kara, P.J. Martin, R.C. Rhodes, and L.F. Smedstad, 2006, Formulation, implementation and examination of vertical coordinate choices in the global Navy Coastal Ocean Model (NCOM), Ocean Modelling, 11, 347-375, doi:10.1016/j.ocemod.2005.01.004.
Barron, C.N., and A.B. Kara, 2006, Satellite-based daily SSTs over the global ocean, Geophys. Res. Lett., 33, L15603, doi:10.1029/2006GL026356.

Barron, C.N., L.F. Smedstad, J.M. Dastugue, and O.M. Smedstad, 2007, Evaluation of ocean models using observed and simulated drifter trajectories: Impact of sea surface height on synthetic profiles for data assimilation, J. Geophys. Res., 112, C07019, doi:10.1029/2006JC003982.
Bell, M. J., Forbes, R. M., Hines, A. 2000 Assessment of the FOAM global data assimilation system for real-time operational ocean forecasting. J. Mar. Sys., 25, 1-22.
Bertino, L., and K. A. Lisæter, The TOPAZ monitoring and prediction system for the Atlantic and Arctic oceans, Journal of Operational Oceanography, 1, 15–19, 2008.
Bleck, R., 2002: An oceanic general circulation model framed in hybrid isopycnic-cartesian coordinates. Ocean Modelling, 4, 55-88.
Bourdalle-Badie, R., and A.-M. Treguier, 2006, A climatology of runoff for the global ocean-ice model ORCA025, Mercator-Ocean, Toulouse, France.
Brassington, G. B., T. Pugh, C. Spillman, E. Schulz, H. Beggs, A. Schiller and P. R. Oke, 2007: BLUElink> Development of operational oceanography and servicing in Australia, Journal of Research and Practice in Information Technology, 39, 151-164
Cazes-Boezio, G., D. Menemenlis D, C.R. Mechoso, 2008: Impact of ECCO ocean-state estimates on the initialization of seasonal climate forecasts. J. Clim., 1929-1947.
Chassignet E. et al., 2008, Advances in Global and Basin scale modelling during GODAE, GODAE final conference proceedings, this issue.
Chassignet, E.P., L.T. Smith, G.R. Halliwell, and R. Bleck, 2003: North Atlantic simulations with the HYbrid Coordinate Ocean Model (HYCOM): Impact of the vertical coordinate choice, reference density, and thermobaricity. J. Phys. Oceanogr., 33, 2504-2526.
Cooper, M. and K. Haines,1996: Altimetric assimilation with water property conservation. J. Geophys. Res., 101: C1, 1059-1077..
Counillon, F., and L. Bertino, Ensemble Optimal Interpolation: multivariate properties in the Gulf of Mexico, Tellus, 2008, in press.
Crosnier, L., C. Le Provost, and MERSEA Strand1 team, 2006, Internal metrics definition for operational forecast systems inter-comparison: Examples in the North Atlantic and Mediterranean Sea, in GODAE Summer school in “Ocean Weather Forecasting: An integrated view of oceanography", edited by E.P. Chassignet, and J. Verron, pp. 455-465, Springer, Lallonde les Maures, France.
Cummings, J., L. Bertino, P. Brasseur, I. Fukumori, M. Kamachi, M. Martin, K. Mogensen, P. Oke, C. E. Testut, J. Verron, A. Weaver, 2008, Ocean Data Assimilation Systems for GODAE, GODAE final conference proceedings, this issue.
Cummings, J.A., 2005. Operational multivariate ocean data assimilation. Quart. J. Royal Met. Soc., 131:3583-3604.
Dai, A., and K. E. Trenberth, 2003, New estimates of continental discharge and oceanic freshwater transport, Symposium on Observing and understanding the variability of water in weather and climate, 9-13 Feb. 2003, Long Beach, CA.
De Mey and M. Benkiran, (2002). A multivariate reduced-order optimal interpolation method and ots application to the Mediterranean basin-scale circoluation, In: Ocean Forecasting, (Eds) Pinardi, N. and Woods J., Springer and Verlag, 281-306.
De Mey P., P. Craig, C.A. Edwards, Y. Ishikawa, J.C. Kindle, R. Proctor, K.R. Thompson, J. Zhu, F. Auclair, J.-M. Beckers, E. Blayo, J. Huthnance, F. Lyard and the GODAE CSSWG community, 2008, Coastal modelling and applications, GODAE final conference proceedings, this issue.
Dobricic S. and N. Pinardi, 2008. An oceanogra three-dimensional variational data assimilation scheme. Ocean Modelling, 22 (3), 89-105.
Dombrowsky E.and B.Le Squère, 1994, « Operational assimilation of Topex/Poseidon and ERS-1 data into the French Navy’s SOAP-93 forecasting system » - Aviso Newsletter 3
Dombrowsky, E., 2008, Multi month period integration of the Global 1/12° system (Mersea V3), Mersea project report, Ref: MERSEA-WP9-MERCA-D9.2.1.2, V1.0, 15 pp., Mercator-Ocean, Toulouse, France
Evensen, G., Data assimilation: the Ensemble Kalman Filter, Springer, 2006.
Fichefet, T., and M.A. Morales Maqueda, 1997: Sensitivity of a global sea ice model to the treatment of ice thermodynamics and dynamics. J. Geophys. Res., 102, 12,609-12,646.
Fox, D.N., W.J. Teague, C.N. Baron, M.R. Carnes and C.M. Lee, 2002, the Modular Ocean Data Assimilation System (MODAS), J. Atmos. Oceanic Tech., 19, 240-252.
Fujii Y, Kamachi M. 2003a: Three-dimensional analysis of temperature and salinity in the equatorial Pacific using a variational method with vertical coupled temperature-salinity EOF modes. J. Geophys Res., 108(C9), 3297, doi:10.1029/2002JC001745.
Fujii Y, Kamachi M. 2003b: A reconstruction of observed profiles in the sea east of Japan using vertical coupled temperature-salinity EOF modes. J. Oceanogr., 59, 173-186.
Fujii Y, Kamachi M. 2003c: A nonlinear preconditioned quasi-Newton method without inversion of a first-guess covariance matrix in variational analysis. Tellus, 55A, 450-454.
Fujii Y. 2005:Preconditioned optimizing utility for large-dimensional analyses (POpULar). J. Oceanogr. 61, 167-181.
Fukumori, I., 2002: A partitioned Kalman filter and smoother. Mon. Wea. Rev., 130, 1370-1383.
Gebbie, G., P. Heimbach and C. Wunsch, 2006: Strategies for nested and eddy-resolving state estimation. J. Geophys. Res., 111, C10073, doi:10.1029/2005JC003094.
Gemmill, W., B. Katz and Xu Li, 2007: Daily Real-Time Global Sea Surface Temperature - High Resolution Analysis at NOAA/NCEP. NOAA / NWS / NCEP / MMAB Office Note Nr. 260, 39 pp
Giraud S., S. Baudel, E. Dombrowsky and P. Bahurel, 1997 : « The SOPRANE project :Real-time monitoring of the North-East Atlantic - Ocean circulation Nowcast/Forecast for Oceanographic Scientific Campaigns », Biarritz International Symposium, Proceedings, Oct.97.
Greiner, E., M. Benkiran, E. Blayo, G. Dibarboure, 2006 : MERA-11 general scientific paper, 1992-2002 PSY1V2 reanalysis, reference MOO-MR-431-37-MER, 68 pp. Mercator-Ocean, Toulouse, France
Griffies, S. M., M. J. Harrison, R. C. Pacanowski, and A. Rosati, 2004: A technical guide to MOM4 GFDL Ocean Group Technical Report NO. 5, NOAA/Geophysical Fluid Dynamics Laboratory, 339pp
Gross, R.S., I. Fukumori, and D. Menemenlis., 2005: Atmospheric and Oceanic Excitation of Decadal-Scale Earth Orientation Variations. J. Geophys. Res., 110, B09405, doi:10.1029/2004JB003565.
Halkides, D., and T., Lee, 2008: Mechanisms controlling seasonal-to-interannual mixed-layer temperature variability in the southeastern tropical Indian Ocean. J. Geophys. Res., in press.
Halliwell, Jr., G.R., 2004: Evaluation of vertical coordinate and vertical mixing algorithms in the HYbrid-Coordinate Ocean Model (HYCOM). Ocean Modelling, 7, 285-322.
Hansen, C., and A. Samuelsen, Influence of horizontal model grid resolution on the simulated primary production in an embedded primary production model in the Norwegian Sea, J. Marine Syst., submitted, 2008.
Hellerman, S., and M. Rosenstein, 1983: Normal monthly wind stress over the world ocean with error estimates. J. Phys. Oceanogr., 13, 1093-1104.
Hernandez et al., 2008, Validation and intercomparison of analysis and forecast. GODAE final conference proceedings, this issue.
Hurlburt et al. 2008, Global high resolution analyses and forecasts at the mesoscale, GODAE final conference proceedings, this issue.
Hurlburt, H.E., D.N. Fox, and E.J. Metzger, 1990, Statistical inference of weakly correlated subthermocline fields from satellite altimeter data, J. Geophys. Res., 95(C7), 11375-11409.
Hurlburt, H.E., E.P. Chassignet, J.A. Cummings, A.B. Kara, E.J. Metzger, J.F. Shriver, O.M. Smedstad, A.J. Wallcraft, C.N. Barron, 2008, Eddy-resolving global ocean prediction. In: Hecht, M. and H. Hasumi (Eds.), Ocean Modeling in an Eddying Regime, Geophysical Monograph 177. American Geophysical Union, Washington, D.C., pp. 353-381.

Imawaki, S., Uchida H., Ichikawa, H., Fukasawa, M., Umatani S. and the ASUKA group, 2001: Satellite altimeter monitoring the Kuroshio transport south of Japan. Geophys. Res. Letters. Vol. 28, 17-20.
Ishikawa I, Tsujino H, Hirabara M, Nakano H, Yasuda T, Ishizaki H. 2005: Meteorological Research Institute Community Ocean Model (MRI.COM) Manual. Technical Reports of the Meteorological Research Institute, No.47 (in Japanese).
Kamashi et al. 2008, Regional high resolution analyses and forecasts at the mesoscale, GODAE final conference proceedings, this issue.
Kara, A.B., C.N. Barron, P.J. Martin, L.F. Smedstad, and R.C. Rhodes, 2006, Validation of interannual simulations from the 1/8° Global Navy Coastal Ocean Model (NCOM), Ocean Modelling, 11, 376-398, doi:10.1016/j.ocemod.2005.01.003.
Keghouche I., L. Bertino and K.A. Lisæter, Parameterization of an iceberg drift model in the Barents Sea, J. Atm. Oc. Tech., submitted, 2008.
Kuragano T, Kamachi M. 2000: Global statistical space-time scales of oceanic variability estimated from the TOPEX/POSEIDON altimetry data. J. Geophys. Res., 105, 955-974.
Le Provost, C., 2002, GODAE Internal Metrics for model performance evaluation and intercomparison, edited by CNRS/LEGOS, pp. 12
Le Provost, C., M.J. Bell, E. Greiner, P. McCulloch, and P. De Mey, 2001: GODAE Internal Metrics for model performance evaluation and intercomparison.
Lee, T. and I. Fukumori, 2003: Interannual to decadal variation of tropical-subtropical exchange in the Pacific Ocean: boundary versus interior pycnocline transports. J. Clim. 16, 4022-4042
Madec G., 2008: “NEMO ocean engine”. Note du Pole de medelisation, Institut Pierre-Simon-Laplace (IPSL), France, No. 27 ISSN No 1288-1619
Madec, G., and M. Imbard, 1996, A global ocean mesh to overcome the North Pole singularity, Clim. Dyn., 12, 381-388.
Madec, G., et al., 1998, OPA 8.1 general circulation model reference manual, Notes de l'Institut Pierre-Simon Laplace (IPSL) - Université P. et M. Curie, B102 T15-E5, 4 place Jussieu, Paris cedex 5, 91p.
Martin, M.J., A. Hines and M.J. Bell, 2007. Data assimilation in the FOAM operational short-range ocean forecasting system: a description of the scheme and its impact. Q. J. R. Meteorol. Soc., 133: 981-995.
McKinley, G., M.J. Follows and J. Marshall, 2004: Mechanisms of air-sea CO2 flux variability in the Equatorial Pacific and north Atlantic: Global Biogeochemical Cycles, vol 18,doi:10.1029/2003GB002179.
Metzger, E.J., O.M. Smedstad, P. Thoppil, H.E. Hurlburt, A.J. Wallcraft, D.S. Franklin, J.F. Shriver and L.F. Smedstad, 2008: Validation Test Report for the Global Ocean Predictions System V3.0 - 1/12° HYCOM/NCODA: Phase I. NRL Memorandum Report, NRL/MR/7320--08-9148.
Metzger, E.J., R.C. Rhodes, D.S. Ko, and H.E. Hurlburt, 1998, Validation test report for Oceans 1.0, Naval Research Laboratory tech. report NRL/FR/7323-97-9673, 31 pp., Naval Research Laboratory, Stennis Space Center, MS.
Moore, D. R., and A. J. Wallcraft, 1998, Formulation of the NRL Layered Ocean Model in spherical coordinates, Naval Research Laboratory tech. report NRL/CR/7323--96-0005, 24 pp., Naval Research Laboratory, Stennis Space Center, MS.
Oke, P. R., G. B. Brassington, D. A. Griffin and A. Schiller, 2008: The Bluelink ocean data assimilation system (BODAS), Ocean Modelling, 21, 46-70
Pham, D. T., Verron, J. and Roubaud, M. C., 1998: A Singular Evolutive Extended Kalman Filter for Data Assimilation in Oceanography. J. Marine Systems, 16, 3, 4, 323–340.
Pinardi N., I. Allen, E. Demirov, P. De Mey , G. Korres, A. Lascaratos, P.-Y. Le Traon, C. Maillard, G. Manzella, and C. Tziavos, (2003). The Mediterranean ocean forecasting system: first phase of implementation (1998–2001). Annales Geophysicae, 21: 3–20 c

Purser R. J., W.-S. Wu, D. F. Parrish, and N. M. Roberts, 2003a: Numerical aspects of the application of recursive filters to variational statistical analysis. Part I: Spatially homogeneous and isotropic Gaussian covariances. Mon. Wea. Rev., 131, 1524–1535
Purser R. J., W.-S. Wu, D. F. Parrish, and N. M. Roberts, 2003b: Numerical Aspects of the Application of Recursive Filters to Variational Statistical Analysis. Part II: Spatially Inhomogeneous and Anisotropic General Covariances, Mon. Wea. Rev., 131, 1536–1548
Reynolds, R.W., and T.M.Smith, 1994: Improved global sea surface temperature analysis. J.Climate, 6, 929-948.
Rhodes, R. C., H. E. Hurlburt, A. J. Wallcraft, C. N. Barron, P. J. Martin, O. M. Smedstad, S. L. Cross, E. J. Metzger, J. F. Shriver, A. B. Kara, and D. S. Ko, 2002, Navy real-time global modeling systems, Oceanography, 15(1), 29–43.
Schiller, A., P. R. Oke, G. B. Brassington, M. Entel, R. Fiedler, D. A. Griffin, J. Mansbridge, 2008: Eddy-resolving ocean circulation in the Asian-Australian region inferred from an ocean reanalysis effort, Progress in Oceanography, 76, 334-365
Seaman, R., Bourke, W., Steinle, P., Hart, T., Embery, G., Naughton, M and Rikus, L. 1995. Evolution of the Bureau of Meteorology's Global Assimilation and Prediction System, Part 1: Analyses and Initialization, Aust. Met. Mag., 44, 1-18
Shriver, J. F., H. E. Hurlburt, O. M. Smedstad, A. J. Wallcraft, and R. C. Rhodes, 2007, 1/32°real-time global ocean prediction and value-added over 1/16°resolution, J. Mar. Sys., 65, 3–26.
Smedstad, O. M., H. E. Hurlburt, E. J. Metzger, R. C. Rhodes, J. F. Shriver, A. J. Wallcraft, and A. B. Kara, 2003, An operational eddy-resolving 1/16° global ocean nowcast/forecast system, J. Mar. Sys., 40–41, 341–361.
Smith, N. and M. Lefebre, The Global Ocean Data Assimilation Experiment (GODAE), Monitoring the Ocean in the 2000s, 1997: An integrated approach, International Symposium, Biarritz, October 15-17.
Stammer D, Wunsch C, Giering R, et al. 2003: Volume, heat, and freshwater transports of the global ocean circulation 1993-2000, estimated from a general circulation model constrained by World Ocean Circulation Experiment (WOCE) data. J. Geophys. Res., 108 (C1), Art. No. 3007.
Testut, C.-E., et al., 2003, Assimilation of sea-surface temperature and altimetric observations during 1992-1993 into an eddy-permitting primitive equation model of the North Atlantic Ocean, Journal of Marine Systems, 40-41, 291-316.
Tonani M., N.Pinardi, S. Dobricic, I. Pujol and C. Fratianni, (2008). A High Resolution Free Surface Model on the Mediterranean Sea. Ocean Science, 4, 1-14.
Tranchant B., Testut C.E., Renault L. and Ferry N., Obligis E., Boone C. and Larnicol G., 2008, Data assimilation of simulated SSS SMOS products in an ocean forecasting system, Journal of operational Oceanography, Vol. 2008, No 2, August 2008., pp 19-27(9).
Troccoli, A., and P. Kallberg, 2004, Precipitation correction in the ERA-40 reanalysis, ERA-40 Project Report Series.
Tsujino H, Usui N, Nakano H, 2006: Dynamics of Kuroshio path variations in a high-resolution GCM. J. Geophys Res., 111 , C11001, doi:10.1029/ 2005JC003118
Usui N., S. Ishizaki, Y. Fujii, H. Tsujino, T. Yasuda and M. Kamachi, 2006a: Meteorological Research Institute Multivariate Ocean Variational Estimation (MOVE) System: Some Early Results. Adv. Space Res., vol. 37, 806-822.
Usui, N., H. Tsujino, Y. Fujii, M. Kamachi, 2006b: Short-range prediction experiments of the Kuroshio path variabilities south of Japan. Ocean Dynamics, vol.56, 607-623, DOI 10.1007/s10236-006-0084-z
Van Woert, M.L., C.-Z. Zou, W.N. Meier, P.D. Hovey, R.H. Preller, and P.G. Posey, 2004, Forecast verification of the Polar Ice Prediction System (PIPS) sea ice concentration fields, J. Atmos. Oceanic Tech., 21, 944-957.
Wallcraft, A. J., 1991, The Navy Layered Ocean Model users guide, NOARL Report 35, 21 pp., Naval Research Laboratory, Stennis Space Center, MS.
Wallcraft, A. J., and D. R. Moore, 1997, The NRL Layered Ocean Model, Parallel Computing, 23, 2227–2242.
Wallcraft, A.J., A.B. Kara, H.E. Hurlburt, and P.A. Rochford, 2003, The NRL Layered Ocean Model (NLOM) with an embedded mixed layer sub-model: Formulation and tuning. J. Atmos. Ocean. Technol., 20, 1601-1615.
Weaver, A. T., 2005: A global ocean variational data assimilation system: formulation and general characteristics of OPAVAR. Final report for the Groupe Mission MERCATOR/CORIOLIS (Contract No. 1000038), 28 pp, Mercator-Ocean, Toulouse, France.
Wunsch, C. and P. Heimbach, 2007: Practical global oceanic state estimation. Physica D-Nonlinear Phenomena. 230, 197-208.
Yan C. X., J.Zhu, R.F.Li, and G.Q.Zhou, 2004: Roles of vertical correlation of background error and T-S relations in estimation temperature and salinity profiles from sea surface dynamic height. J.Geophys.Res. 109, C08010, doi:10.1029/2003JC002224,2004.
Zhang, R-H, and M.Endoh, 1992: A free surface general circulation model for the tropical Pacific Ocean. J. Geophys. Res., 97(C7), 11237-11255.
Zhu J. and C.X.Yan, 2004: Nonlinear balance constraints in 3DVAR data assimilation. Science in China.
Related Documents