GoBack

Welcome message from author
This document is posted to help you gain knowledge. Please leave a comment to let me know what you think about it! Share it to your friends and learn new things together.
Transcript

GoBack

c© Iain Pardoe, 2006 1 / 22
Applied Regression Modeling:
A Business Approach
Chapter 1: Foundations
Sections 1.1–1.4
by Iain Pardoe
Identifying and summarizing data
1.1 Identifying andsummarizing data
Identifying andsummarizing data
Stem-and-leaf plot
Histogram for homeprices example
Sample statistics
Sample standardizedZ-values
1.2 Populationdistributions
1.3 Selectingindividuals atrandom—probability
1.4 Randomsampling
c© Iain Pardoe, 2006 2 / 22
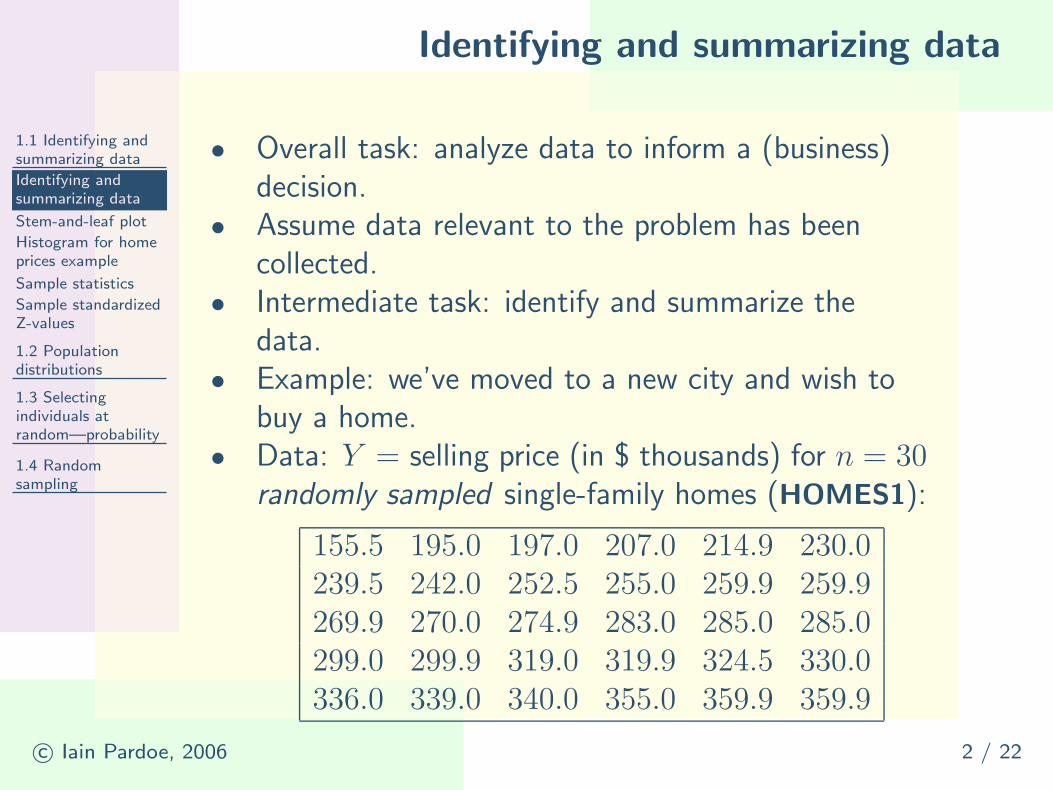
• Overall task: analyze data to inform a (business)decision.
• Assume data relevant to the problem has beencollected.
• Intermediate task: identify and summarize thedata.
• Example: we’ve moved to a new city and wish tobuy a home.
• Data: Y = selling price (in $ thousands) for n = 30randomly sampled single-family homes (HOMES1):
155.5 195.0 197.0 207.0 214.9 230.0239.5 242.0 252.5 255.0 259.9 259.9269.9 270.0 274.9 283.0 285.0 285.0299.0 299.9 319.0 319.9 324.5 330.0336.0 339.0 340.0 355.0 359.9 359.9

Stem-and-leaf plot
1.1 Identifying andsummarizing data
Identifying andsummarizing data
Stem-and-leaf plot
Histogram for homeprices example
Sample statistics
Sample standardizedZ-values
1.2 Populationdistributions
1.3 Selectingindividuals atrandom—probability
1.4 Randomsampling
c© Iain Pardoe, 2006 3 / 22
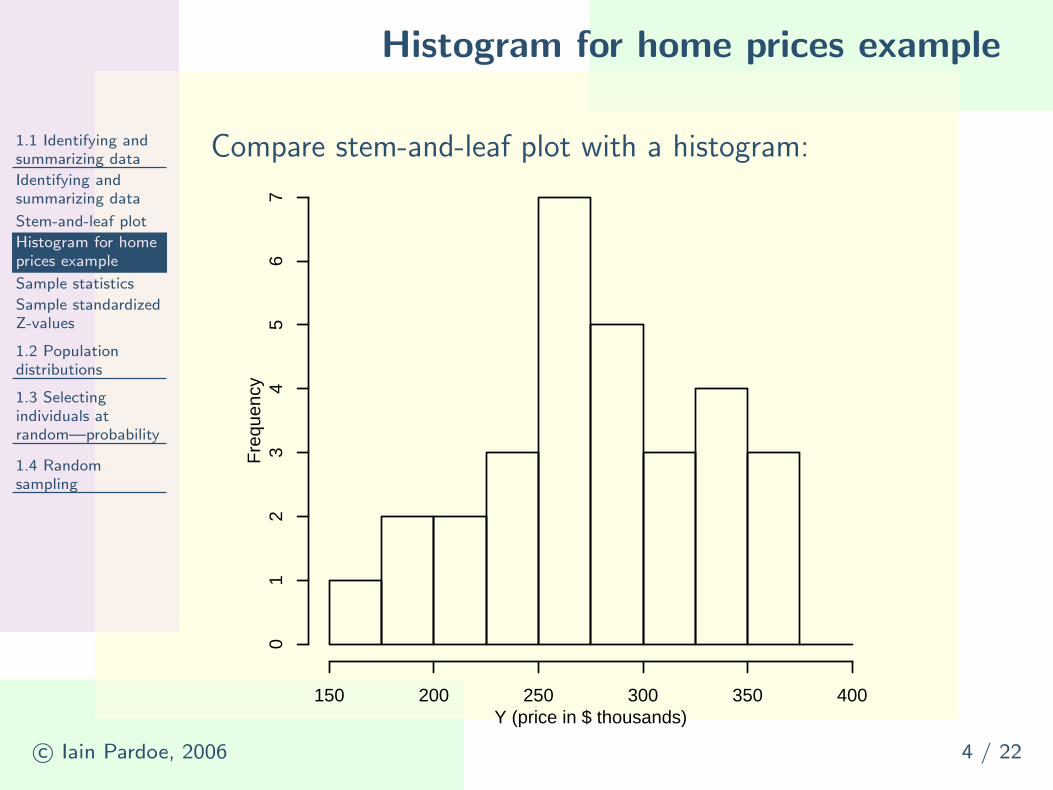
• Home prices example:
1 | 6
2 | 0011344
2 | 5666777899
3 | 002223444
3 | 666
• Consider lowest home price represented by “1” inthe stem and “6” in the leaf.
• This represents a number between 155 and 164.9(thousand dollars).
• In particular, it is the lowest price of $155,500.• What does this graph tell you about home prices in
this market?
Histogram for home prices example
1.1 Identifying andsummarizing data
Identifying andsummarizing data
Stem-and-leaf plot
Histogram for homeprices example
Sample statistics
Sample standardizedZ-values
1.2 Populationdistributions
1.3 Selectingindividuals atrandom—probability
1.4 Randomsampling
c© Iain Pardoe, 2006 4 / 22
Compare stem-and-leaf plot with a histogram:
Y (price in $ thousands)
Fre
quen
cy
150 200 250 300 350 400
01
23
45
67

Sample statistics
1.1 Identifying andsummarizing data
Identifying andsummarizing data
Stem-and-leaf plot
Histogram for homeprices example
Sample statistics
Sample standardizedZ-values
1.2 Populationdistributions
1.3 Selectingindividuals atrandom—probability
1.4 Randomsampling
c© Iain Pardoe, 2006 5 / 22
• Sample mean, mY , measures “central tendency” ofY-values.
• Median also measures central tendency, but lesssensitive to very small/large values.
• Sample standard deviation, sY , measuresspread/variation.
• Minimum and maximum.• Percentiles, e.g., 25th percentile: 25% of Y-values
are smaller and 75% of Y-values are larger.• Question: what’s another name for the
50th percentile?

Sample standardized Z-values
1.1 Identifying andsummarizing data
Identifying andsummarizing data
Stem-and-leaf plot
Histogram for homeprices example
Sample statistics
Sample standardizedZ-values
1.2 Populationdistributions
1.3 Selectingindividuals atrandom—probability
1.4 Randomsampling
c© Iain Pardoe, 2006 6 / 22
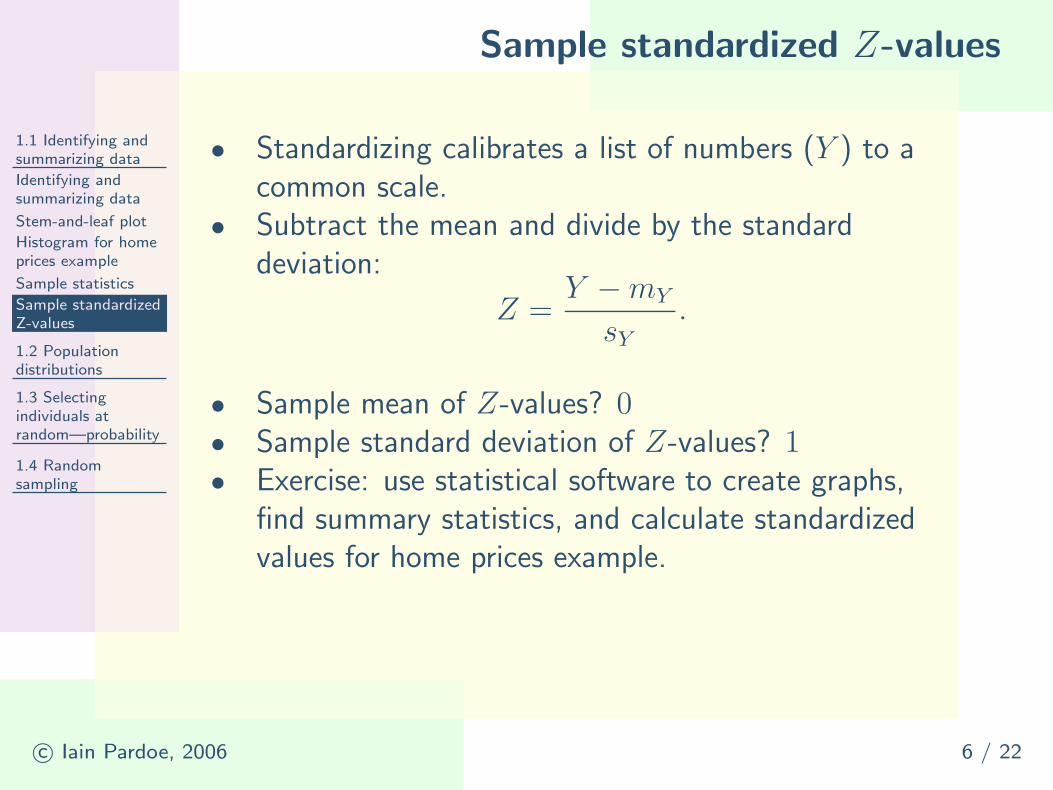
• Standardizing calibrates a list of numbers (Y ) to acommon scale.
• Subtract the mean and divide by the standarddeviation:
Z =Y − mY
sY
.
Sample standardized Z-values
1.1 Identifying andsummarizing data
Identifying andsummarizing data
Stem-and-leaf plot
Histogram for homeprices example
Sample statistics
Sample standardizedZ-values
1.2 Populationdistributions
1.3 Selectingindividuals atrandom—probability
1.4 Randomsampling
c© Iain Pardoe, 2006 6 / 22
• Standardizing calibrates a list of numbers (Y ) to acommon scale.
• Subtract the mean and divide by the standarddeviation:
Z =Y − mY
sY
.
• Sample mean of Z-values?

Sample standardized Z-values
1.1 Identifying andsummarizing data
Identifying andsummarizing data
Stem-and-leaf plot
Histogram for homeprices example
Sample statistics
Sample standardizedZ-values
1.2 Populationdistributions
1.3 Selectingindividuals atrandom—probability
1.4 Randomsampling
c© Iain Pardoe, 2006 6 / 22
• Standardizing calibrates a list of numbers (Y ) to acommon scale.
• Subtract the mean and divide by the standarddeviation:
Z =Y − mY
sY
.
• Sample mean of Z-values? 0
Sample standardized Z-values
1.1 Identifying andsummarizing data
Identifying andsummarizing data
Stem-and-leaf plot
Histogram for homeprices example
Sample statistics
Sample standardizedZ-values
1.2 Populationdistributions
1.3 Selectingindividuals atrandom—probability
1.4 Randomsampling
c© Iain Pardoe, 2006 6 / 22
• Standardizing calibrates a list of numbers (Y ) to acommon scale.
• Subtract the mean and divide by the standarddeviation:
Z =Y − mY
sY
.
• Sample mean of Z-values? 0• Sample standard deviation of Z-values?

Sample standardized Z-values
1.1 Identifying andsummarizing data
Identifying andsummarizing data
Stem-and-leaf plot
Histogram for homeprices example
Sample statistics
Sample standardizedZ-values
1.2 Populationdistributions
1.3 Selectingindividuals atrandom—probability
1.4 Randomsampling
c© Iain Pardoe, 2006 6 / 22
• Standardizing calibrates a list of numbers (Y ) to acommon scale.
• Subtract the mean and divide by the standarddeviation:
Z =Y − mY
sY
.
• Sample mean of Z-values? 0• Sample standard deviation of Z-values? 1
Sample standardized Z-values
1.1 Identifying andsummarizing data
Identifying andsummarizing data
Stem-and-leaf plot
Histogram for homeprices example
Sample statistics
Sample standardizedZ-values
1.2 Populationdistributions
1.3 Selectingindividuals atrandom—probability
1.4 Randomsampling
c© Iain Pardoe, 2006 6 / 22
• Standardizing calibrates a list of numbers (Y ) to acommon scale.
• Subtract the mean and divide by the standarddeviation:
Z =Y − mY
sY
.
• Sample mean of Z-values? 0• Sample standard deviation of Z-values? 1• Exercise: use statistical software to create graphs,
find summary statistics, and calculate standardizedvalues for home prices example.
Population distributions
1.1 Identifying andsummarizing data
1.2 PopulationdistributionsPopulationdistributionsNormal histogramfor 1000 simulatedhome prices
Standard normaldensity curve
Critical values forstandard normaldistribution
Assessing normality
QQ-plot for homeprices example
1.3 Selectingindividuals atrandom—probability
1.4 Randomsampling
c© Iain Pardoe, 2006 7 / 22
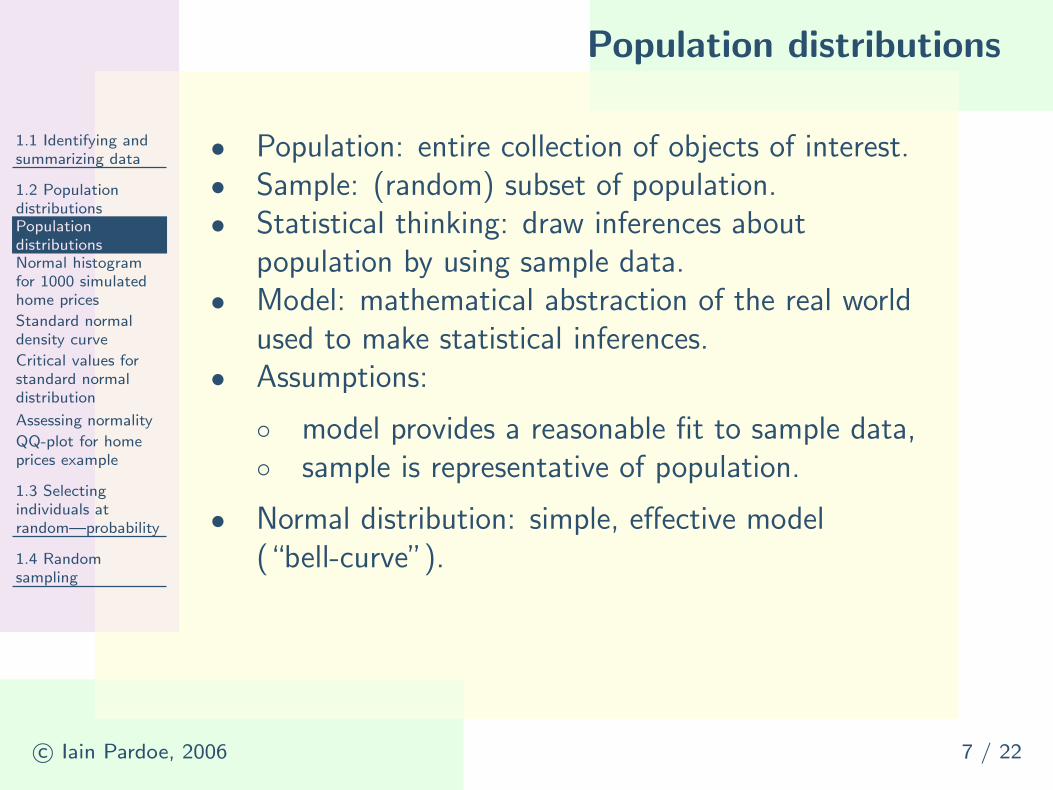
• Population: entire collection of objects of interest.• Sample: (random) subset of population.• Statistical thinking: draw inferences about
population by using sample data.• Model: mathematical abstraction of the real world
used to make statistical inferences.• Assumptions:
◦ model provides a reasonable fit to sample data,◦ sample is representative of population.
• Normal distribution: simple, effective model(“bell-curve”).

Normal histogram for 1000 simulated home
prices
1.1 Identifying andsummarizing data
1.2 PopulationdistributionsPopulationdistributionsNormal histogramfor 1000 simulatedhome prices
Standard normaldensity curve
Critical values forstandard normaldistribution
Assessing normality
QQ-plot for homeprices example
1.3 Selectingindividuals atrandom—probability
1.4 Randomsampling
c© Iain Pardoe, 2006 8 / 22
What happens to histogram as sample size increases?
Y (price in $ thousands)
Den
sity
150 200 250 300 350 400 450
0.00
00.
002
0.00
40.
006
0.00
8

Standard normal density curve
1.1 Identifying andsummarizing data
1.2 PopulationdistributionsPopulationdistributionsNormal histogramfor 1000 simulatedhome prices
Standard normaldensity curve
Critical values forstandard normaldistribution
Assessing normality
QQ-plot for homeprices example
1.3 Selectingindividuals atrandom—probability
1.4 Randomsampling
c© Iain Pardoe, 2006 9 / 22
Shaded area=Pr(standard normal is between a and b):
−3 −2 −1 0 1 2 3a=0 b=1.96
area=0.475
Critical values for standard normal
distribution
1.1 Identifying andsummarizing data
1.2 PopulationdistributionsPopulationdistributionsNormal histogramfor 1000 simulatedhome prices
Standard normaldensity curve
Critical values forstandard normaldistribution
Assessing normality
QQ-plot for homeprices example
1.3 Selectingindividuals atrandom—probability
1.4 Randomsampling
c© Iain Pardoe, 2006 10 / 22
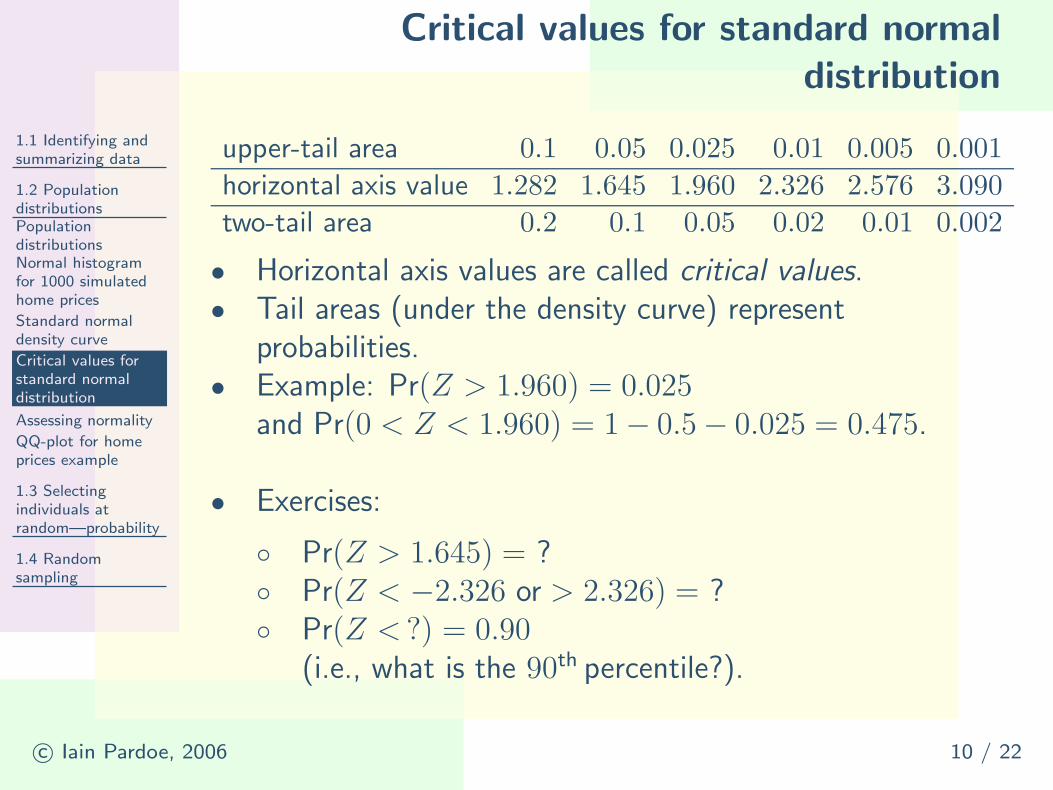
upper-tail area 0.1 0.05 0.025 0.01 0.005 0.001
horizontal axis value 1.282 1.645 1.960 2.326 2.576 3.090
two-tail area 0.2 0.1 0.05 0.02 0.01 0.002
• Horizontal axis values are called critical values.• Tail areas (under the density curve) represent
probabilities.• Example: Pr(Z > 1.960) = 0.025
and Pr(0 < Z < 1.960) = 1− 0.5 − 0.025 = 0.475.
• Exercises:
◦ Pr(Z > 1.645) = ?◦ Pr(Z < −2.326 or > 2.326) = ?◦ Pr(Z < ?) = 0.90
(i.e., what is the 90th percentile?).
Assessing normality
1.1 Identifying andsummarizing data
1.2 PopulationdistributionsPopulationdistributionsNormal histogramfor 1000 simulatedhome prices
Standard normaldensity curve
Critical values forstandard normaldistribution
Assessing normality
QQ-plot for homeprices example
1.3 Selectingindividuals atrandom—probability
1.4 Randomsampling
c© Iain Pardoe, 2006 11 / 22
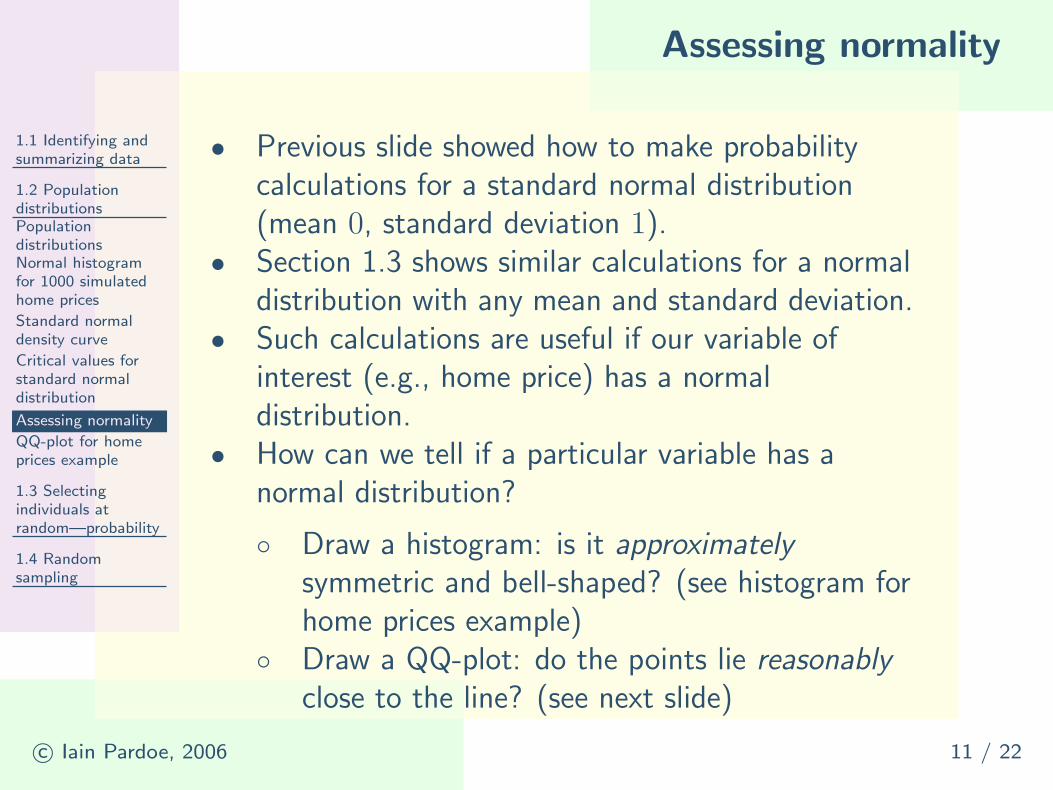
• Previous slide showed how to make probabilitycalculations for a standard normal distribution(mean 0, standard deviation 1).
• Section 1.3 shows similar calculations for a normaldistribution with any mean and standard deviation.
• Such calculations are useful if our variable ofinterest (e.g., home price) has a normaldistribution.
• How can we tell if a particular variable has anormal distribution?
◦ Draw a histogram: is it approximately
symmetric and bell-shaped? (see histogram forhome prices example)
◦ Draw a QQ-plot: do the points lie reasonably
close to the line? (see next slide)

QQ-plot for home prices example
1.1 Identifying andsummarizing data
1.2 PopulationdistributionsPopulationdistributionsNormal histogramfor 1000 simulatedhome prices
Standard normaldensity curve
Critical values forstandard normaldistribution
Assessing normality
QQ-plot for homeprices example
1.3 Selectingindividuals atrandom—probability
1.4 Randomsampling
c© Iain Pardoe, 2006 12 / 22
Do the points lie reasonably close to the line?
−2 −1 0 1 2
150
200
250
300
350
Theoretical Quantiles
Sam
ple
Qua
ntile
s

Normal probability and percentile
calculations
1.1 Identifying andsummarizing data
1.2 Populationdistributions
1.3 Selectingindividuals atrandom—probability
Normal probabilityand percentilecalculations
Finding probabilities
Finding percentiles
1.4 Randomsampling
c© Iain Pardoe, 2006 13 / 22
• Connection between normal distribution with anymean, E(Y ), and standard deviation, SD(Y ), andstandard normal distribution:
◦ Suppose Y ∼ Normal(E(Y ), SD(Y )2).
◦ Then Z =Y −E(Y )SD(Y ) ∼ Normal(0, 12).
• Idea for finding probabilities: standardize Y intoZ-units, then do probability calculation on Z(example next slide).
• Can also go other way to find percentiles: doprobability calculation on Z, then unstandardize Zinto Y-units (example subsequent slide).

Finding probabilities
1.1 Identifying andsummarizing data
1.2 Populationdistributions
1.3 Selectingindividuals atrandom—probability
Normal probabilityand percentilecalculations
Finding probabilities
Finding percentiles
1.4 Randomsampling
c© Iain Pardoe, 2006 14 / 22
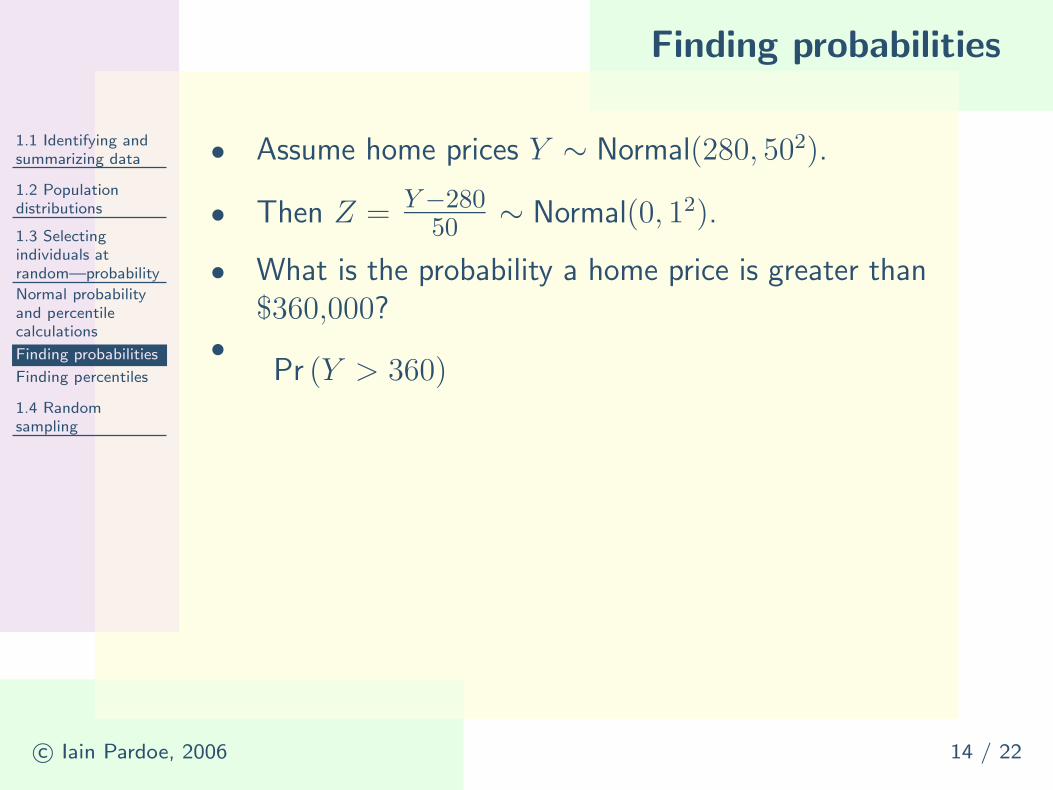
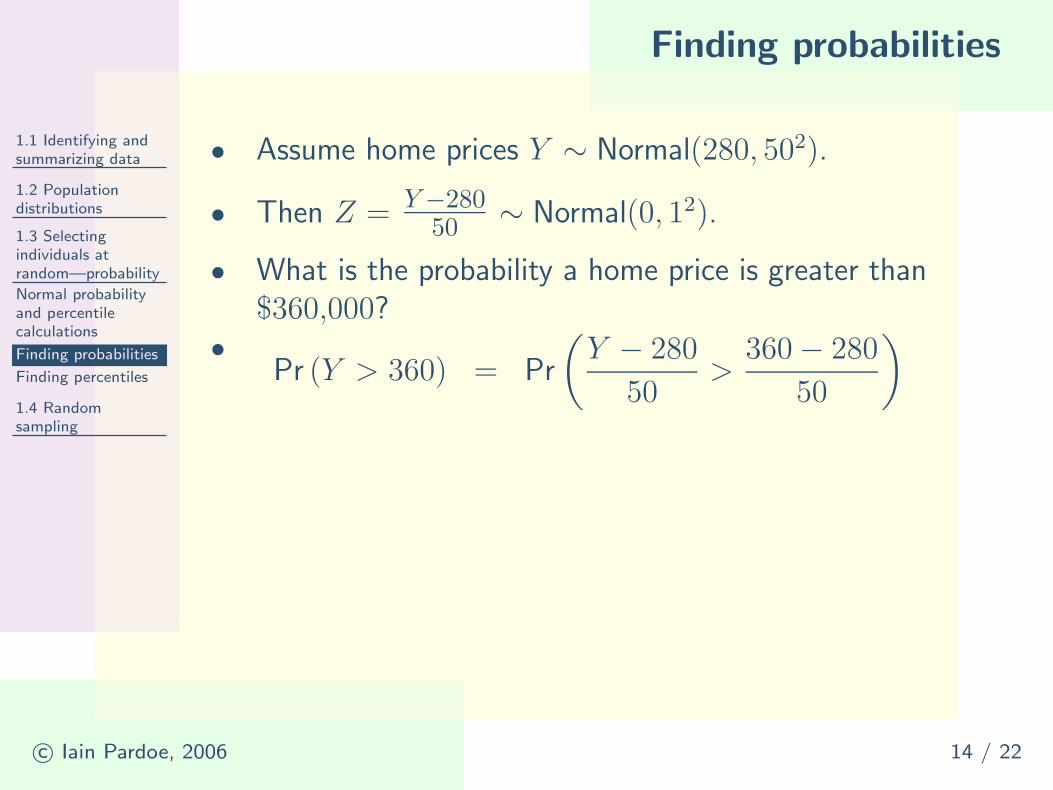
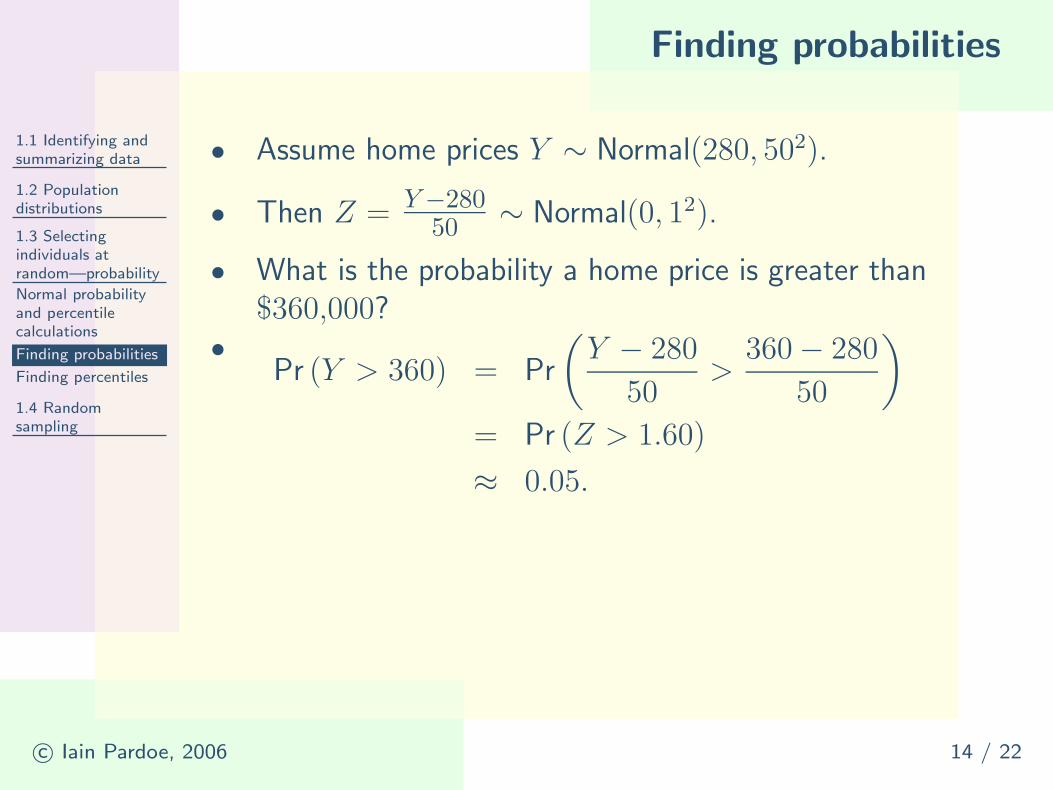
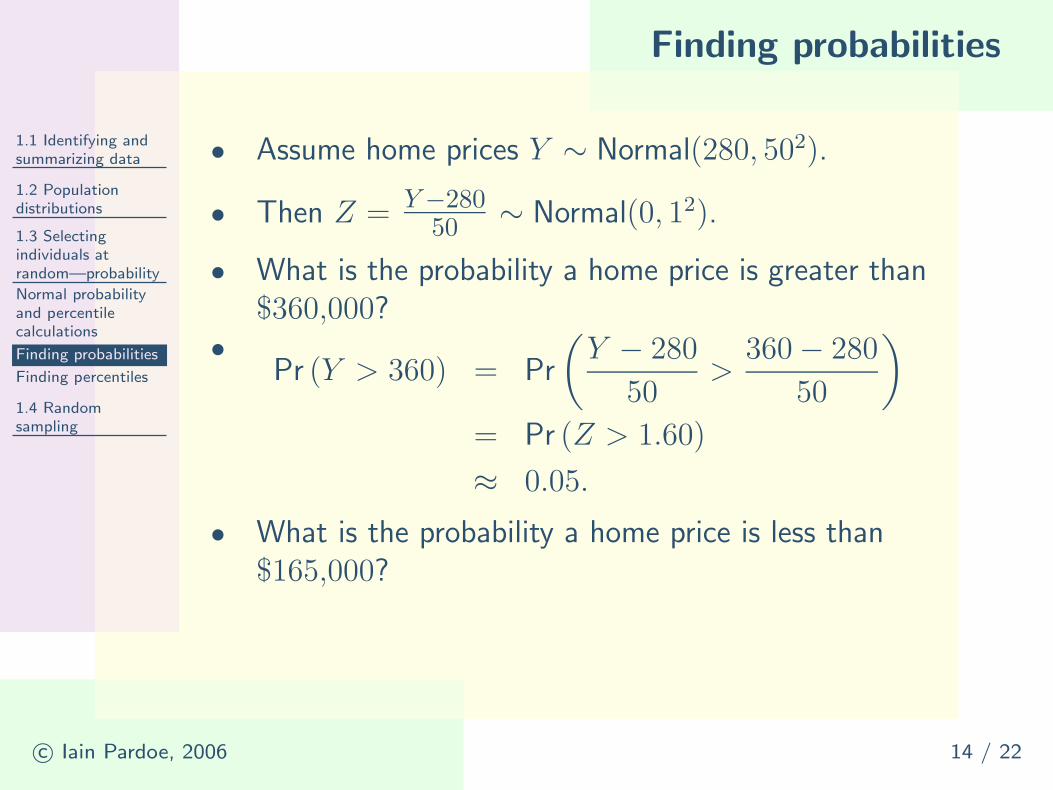
• Assume home prices Y ∼ Normal(280, 502).
• Then Z = Y −28050 ∼ Normal(0, 12).
• What is the probability a home price is greater than$360,000?
Finding probabilities
1.1 Identifying andsummarizing data
1.2 Populationdistributions
1.3 Selectingindividuals atrandom—probability
Normal probabilityand percentilecalculations
Finding probabilities
Finding percentiles
1.4 Randomsampling
c© Iain Pardoe, 2006 14 / 22
• Assume home prices Y ∼ Normal(280, 502).
• Then Z = Y −28050 ∼ Normal(0, 12).
• What is the probability a home price is greater than$360,000?
•Pr (Y > 360)
Finding probabilities
1.1 Identifying andsummarizing data
1.2 Populationdistributions
1.3 Selectingindividuals atrandom—probability
Normal probabilityand percentilecalculations
Finding probabilities
Finding percentiles
1.4 Randomsampling
c© Iain Pardoe, 2006 14 / 22
• Assume home prices Y ∼ Normal(280, 502).
• Then Z = Y −28050 ∼ Normal(0, 12).
• What is the probability a home price is greater than$360,000?
•Pr (Y > 360) = Pr
(
Y − 280
50>
360 − 280
50
)

Finding probabilities
1.1 Identifying andsummarizing data
1.2 Populationdistributions
1.3 Selectingindividuals atrandom—probability
Normal probabilityand percentilecalculations
Finding probabilities
Finding percentiles
1.4 Randomsampling
c© Iain Pardoe, 2006 14 / 22
• Assume home prices Y ∼ Normal(280, 502).
• Then Z = Y −28050 ∼ Normal(0, 12).
• What is the probability a home price is greater than$360,000?
•Pr (Y > 360) = Pr
(
Y − 280
50>
360 − 280
50
)
= Pr (Z > 1.60)
Finding probabilities
1.1 Identifying andsummarizing data
1.2 Populationdistributions
1.3 Selectingindividuals atrandom—probability
Normal probabilityand percentilecalculations
Finding probabilities
Finding percentiles
1.4 Randomsampling
c© Iain Pardoe, 2006 14 / 22
• Assume home prices Y ∼ Normal(280, 502).
• Then Z = Y −28050 ∼ Normal(0, 12).
• What is the probability a home price is greater than$360,000?
•Pr (Y > 360) = Pr
(
Y − 280
50>
360 − 280
50
)
= Pr (Z > 1.60)
≈ 0.05.
Finding probabilities
1.1 Identifying andsummarizing data
1.2 Populationdistributions
1.3 Selectingindividuals atrandom—probability
Normal probabilityand percentilecalculations
Finding probabilities
Finding percentiles
1.4 Randomsampling
c© Iain Pardoe, 2006 14 / 22
• Assume home prices Y ∼ Normal(280, 502).
• Then Z = Y −28050 ∼ Normal(0, 12).
• What is the probability a home price is greater than$360,000?
•Pr (Y > 360) = Pr
(
Y − 280
50>
360 − 280
50
)
= Pr (Z > 1.60)
≈ 0.05.
• What is the probability a home price is less than$165,000?
Finding percentiles
1.1 Identifying andsummarizing data
1.2 Populationdistributions
1.3 Selectingindividuals atrandom—probability
Normal probabilityand percentilecalculations
Finding probabilities
Finding percentiles
1.4 Randomsampling
c© Iain Pardoe, 2006 15 / 22
• Assume home prices Y ∼ Normal(280, 502).
• Then Z = Y −28050 ∼ Normal(0, 12).
• What is the 95th percentile of Y ?

Finding percentiles
1.1 Identifying andsummarizing data
1.2 Populationdistributions
1.3 Selectingindividuals atrandom—probability
Normal probabilityand percentilecalculations
Finding probabilities
Finding percentiles
1.4 Randomsampling
c© Iain Pardoe, 2006 15 / 22
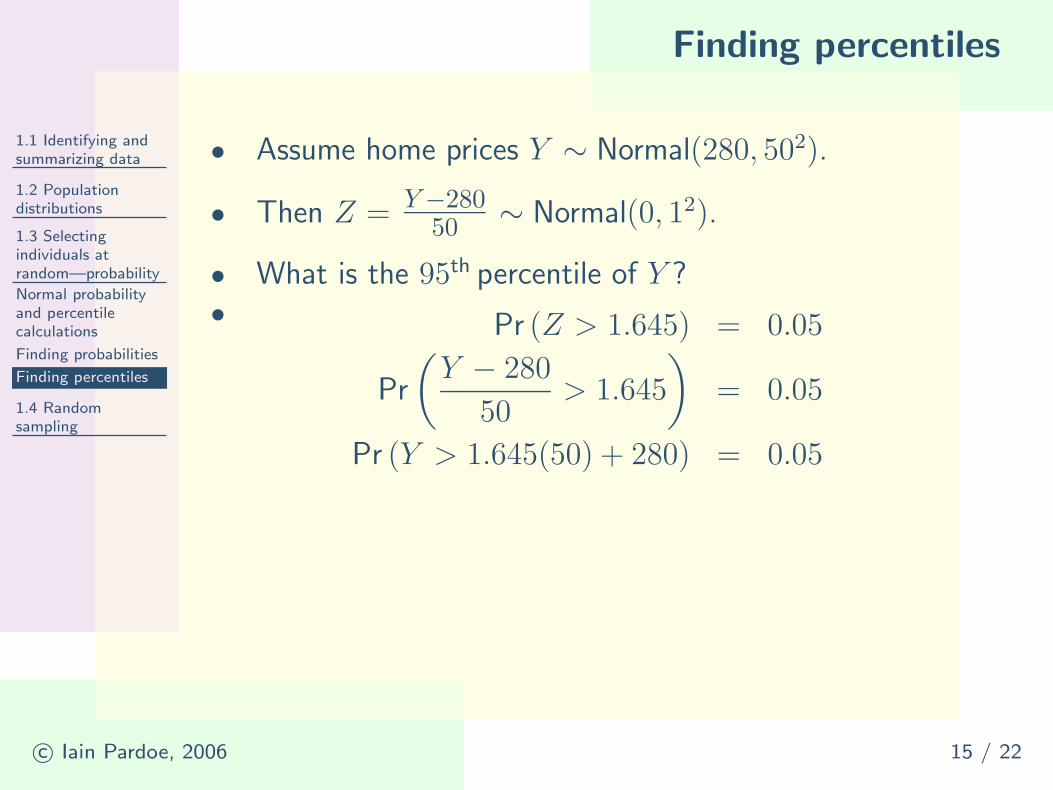
• Assume home prices Y ∼ Normal(280, 502).
• Then Z = Y −28050 ∼ Normal(0, 12).
• What is the 95th percentile of Y ?• Pr (Z > 1.645) = 0.05

Finding percentiles
1.1 Identifying andsummarizing data
1.2 Populationdistributions
1.3 Selectingindividuals atrandom—probability
Normal probabilityand percentilecalculations
Finding probabilities
Finding percentiles
1.4 Randomsampling
c© Iain Pardoe, 2006 15 / 22
• Assume home prices Y ∼ Normal(280, 502).
• Then Z = Y −28050 ∼ Normal(0, 12).
• What is the 95th percentile of Y ?• Pr (Z > 1.645) = 0.05
Pr
(
Y − 280
50> 1.645
)
= 0.05
Finding percentiles
1.1 Identifying andsummarizing data
1.2 Populationdistributions
1.3 Selectingindividuals atrandom—probability
Normal probabilityand percentilecalculations
Finding probabilities
Finding percentiles
1.4 Randomsampling
c© Iain Pardoe, 2006 15 / 22
• Assume home prices Y ∼ Normal(280, 502).
• Then Z = Y −28050 ∼ Normal(0, 12).
• What is the 95th percentile of Y ?• Pr (Z > 1.645) = 0.05
Pr
(
Y − 280
50> 1.645
)
= 0.05
Pr (Y > 1.645(50) + 280) = 0.05

Finding percentiles
1.1 Identifying andsummarizing data
1.2 Populationdistributions
1.3 Selectingindividuals atrandom—probability
Normal probabilityand percentilecalculations
Finding probabilities
Finding percentiles
1.4 Randomsampling
c© Iain Pardoe, 2006 15 / 22
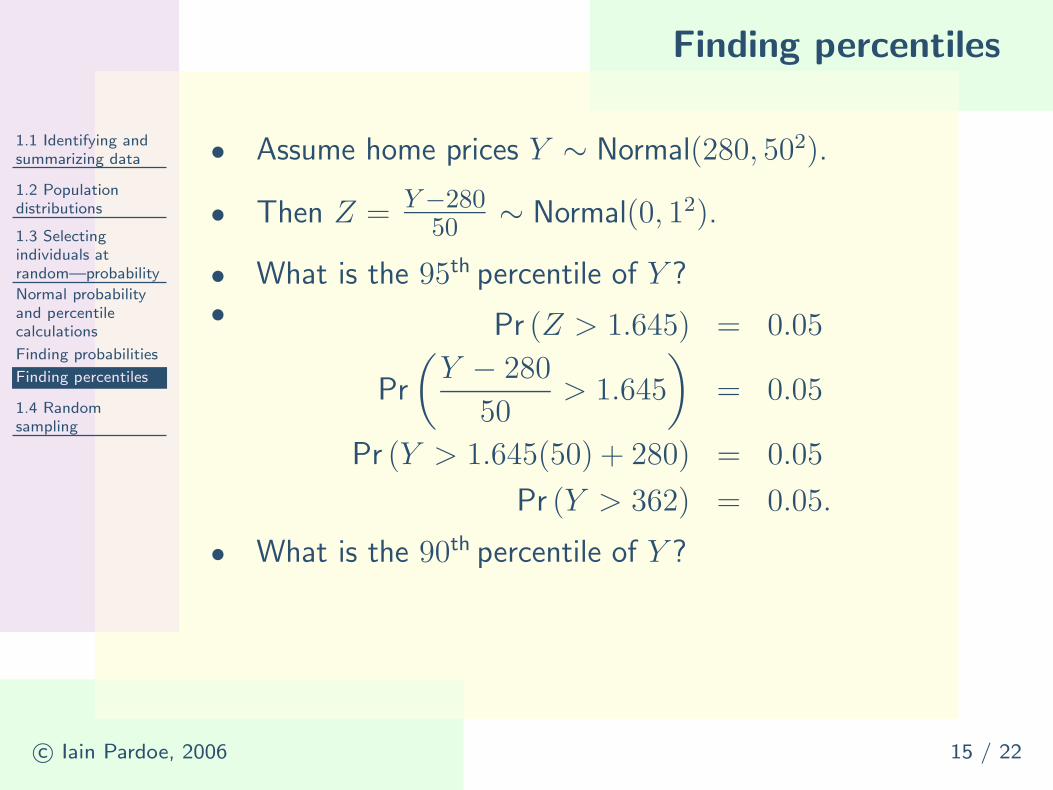
• Assume home prices Y ∼ Normal(280, 502).
• Then Z = Y −28050 ∼ Normal(0, 12).
• What is the 95th percentile of Y ?• Pr (Z > 1.645) = 0.05
Pr
(
Y − 280
50> 1.645
)
= 0.05
Pr (Y > 1.645(50) + 280) = 0.05
Pr (Y > 362) = 0.05.
Finding percentiles
1.1 Identifying andsummarizing data
1.2 Populationdistributions
1.3 Selectingindividuals atrandom—probability
Normal probabilityand percentilecalculations
Finding probabilities
Finding percentiles
1.4 Randomsampling
c© Iain Pardoe, 2006 15 / 22
• Assume home prices Y ∼ Normal(280, 502).
• Then Z = Y −28050 ∼ Normal(0, 12).
• What is the 95th percentile of Y ?• Pr (Z > 1.645) = 0.05
Pr
(
Y − 280
50> 1.645
)
= 0.05
Pr (Y > 1.645(50) + 280) = 0.05
Pr (Y > 362) = 0.05.
• What is the 90th percentile of Y ?

Random sampling
1.1 Identifying andsummarizing data
1.2 Populationdistributions
1.3 Selectingindividuals atrandom—probability
1.4 Randomsampling
Random sampling
Central limittheorem—normalversionFinding samplingdistributionprobabilities
The central limittheorem in actionStudent’st-distributionCritical values fort-distributionsCentral limittheorem—t version
c© Iain Pardoe, 2006 16 / 22
• Population parameters: numerical summarymeasures of the population, e.g.:
◦ mean, E(Y ), and standard deviation, SD(Y ).
• Sample statistics: analagous sample measures, e.g.:
◦ mean, mY , and standard deviation, sY .
• Statistical inference: use sample statistics to inferabout (likely values of) population parameters.
• Example: the sample mean is an estimate of thepopulation mean.
• Question: how far off might the estimate be?

Random sampling
1.1 Identifying andsummarizing data
1.2 Populationdistributions
1.3 Selectingindividuals atrandom—probability
1.4 Randomsampling
Random sampling
Central limittheorem—normalversionFinding samplingdistributionprobabilities
The central limittheorem in actionStudent’st-distributionCritical values fort-distributionsCentral limittheorem—t version
c© Iain Pardoe, 2006 16 / 22
• Population parameters: numerical summarymeasures of the population, e.g.:
◦ mean, E(Y ), and standard deviation, SD(Y ).
• Sample statistics: analagous sample measures, e.g.:
◦ mean, mY , and standard deviation, sY .
• Statistical inference: use sample statistics to inferabout (likely values of) population parameters.
• Example: the sample mean is an estimate of thepopulation mean.
• Question: how far off might the estimate be?
◦ Could be a long way off if Y is very variableand/or sample size is small.

Random sampling
1.1 Identifying andsummarizing data
1.2 Populationdistributions
1.3 Selectingindividuals atrandom—probability
1.4 Randomsampling
Random sampling
Central limittheorem—normalversionFinding samplingdistributionprobabilities
The central limittheorem in actionStudent’st-distributionCritical values fort-distributionsCentral limittheorem—t version
c© Iain Pardoe, 2006 16 / 22
• Population parameters: numerical summarymeasures of the population, e.g.:
◦ mean, E(Y ), and standard deviation, SD(Y ).
• Sample statistics: analagous sample measures, e.g.:
◦ mean, mY , and standard deviation, sY .
• Statistical inference: use sample statistics to inferabout (likely values of) population parameters.
• Example: the sample mean is an estimate of thepopulation mean.
• Question: how far off might the estimate be?
◦ Could be a long way off if Y is very variableand/or sample size is small.
• Quantify uncertainty using sampling distributions.
Central limit theorem—normal version
1.1 Identifying andsummarizing data
1.2 Populationdistributions
1.3 Selectingindividuals atrandom—probability
1.4 Randomsampling
Random sampling
Central limittheorem—normalversionFinding samplingdistributionprobabilities
The central limittheorem in actionStudent’st-distributionCritical values fort-distributionsCentral limittheorem—t version
c© Iain Pardoe, 2006 17 / 22
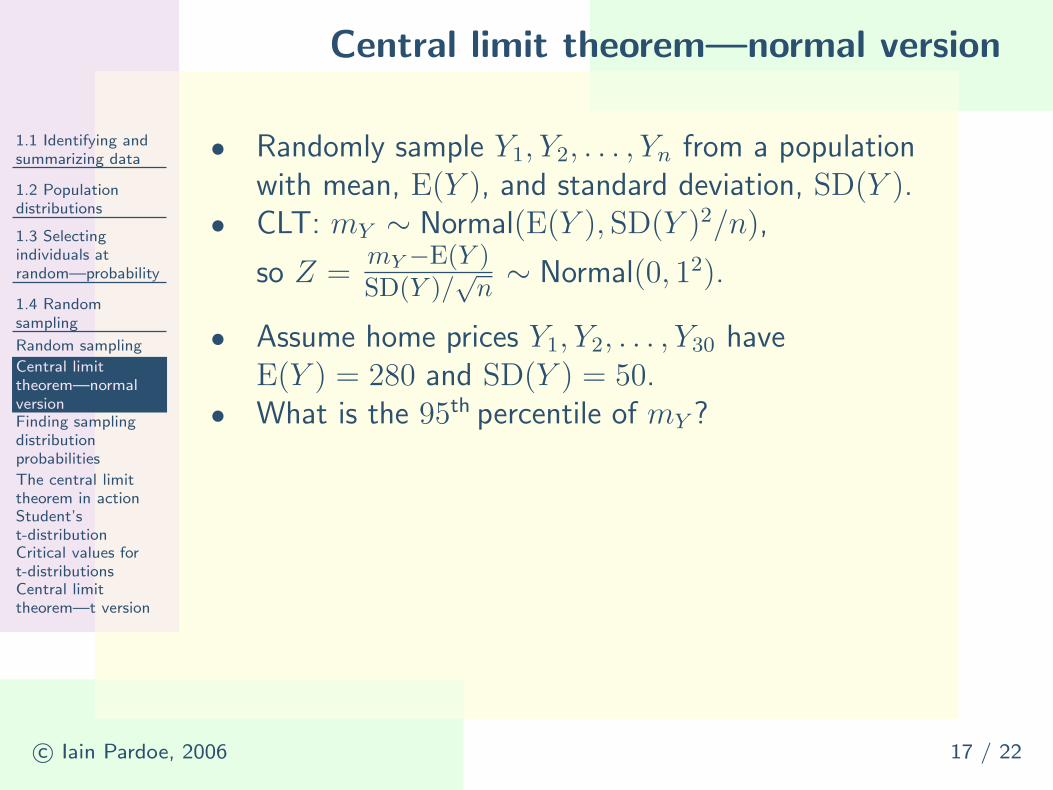
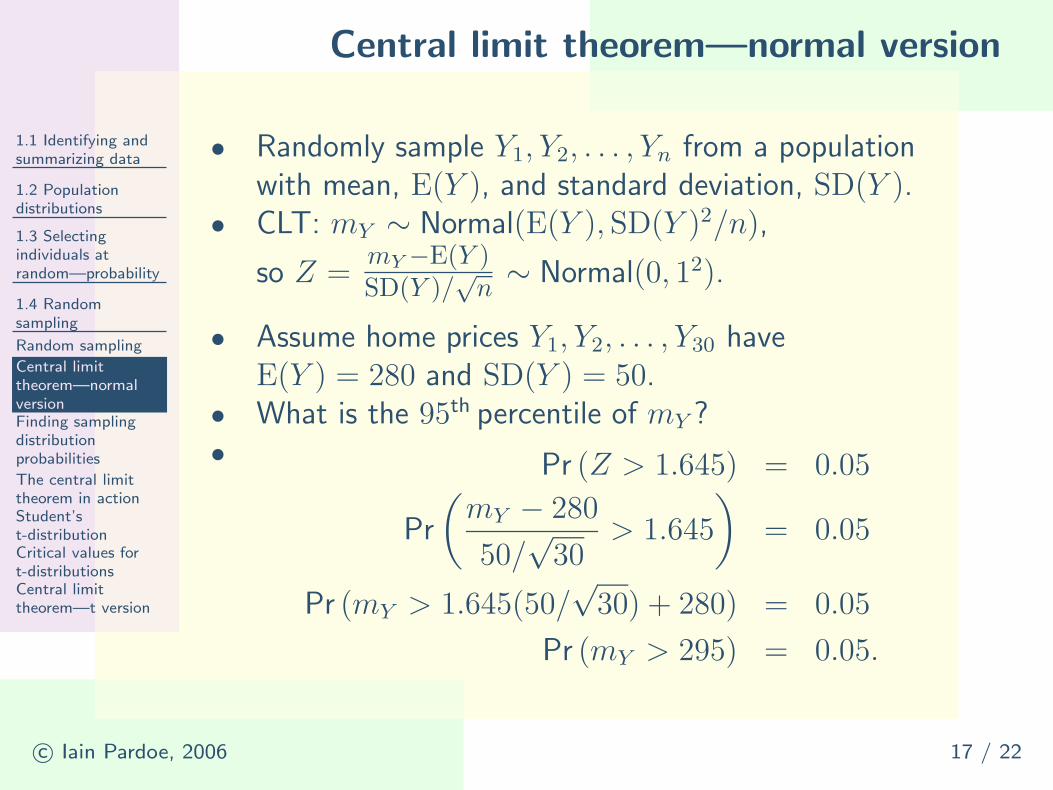
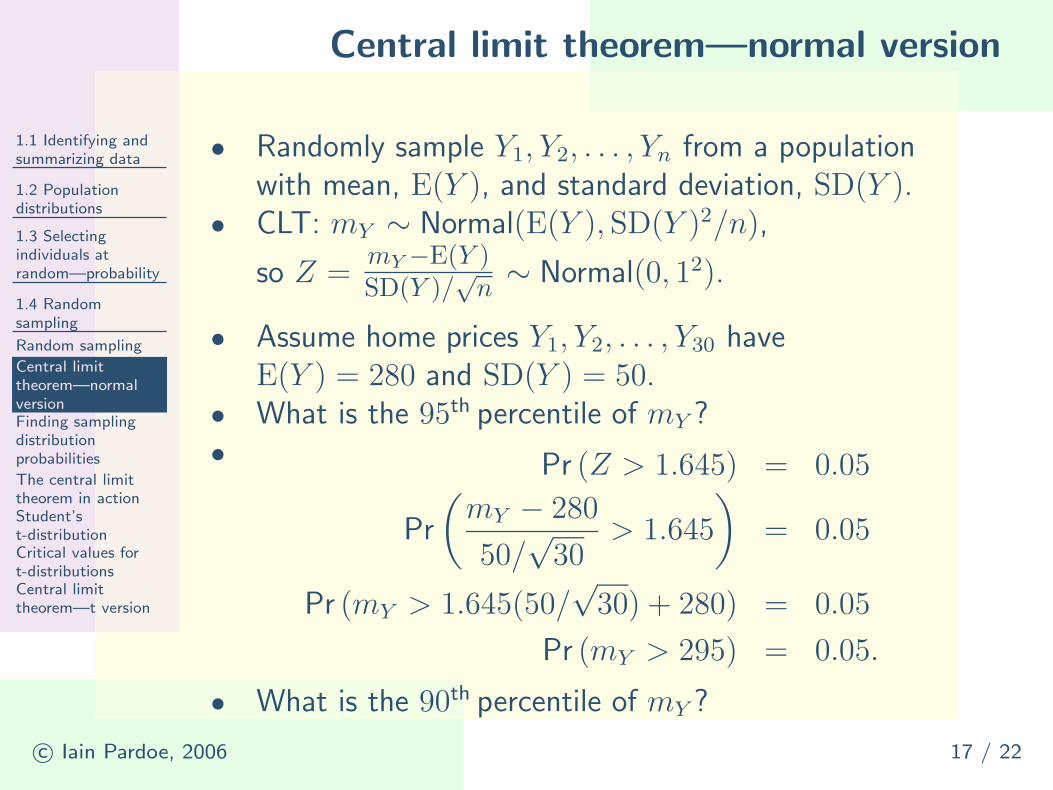
• Randomly sample Y1, Y2, . . . , Yn from a populationwith mean, E(Y ), and standard deviation, SD(Y ).
• CLT: mY ∼ Normal(E(Y ), SD(Y )2/n),
so Z =mY −E(Y )SD(Y )/
√n∼ Normal(0, 12).
• Assume home prices Y1, Y2, . . . , Y30 haveE(Y ) = 280 and SD(Y ) = 50.
• What is the 95th percentile of mY ?

Central limit theorem—normal version
1.1 Identifying andsummarizing data
1.2 Populationdistributions
1.3 Selectingindividuals atrandom—probability
1.4 Randomsampling
Random sampling
Central limittheorem—normalversionFinding samplingdistributionprobabilities
The central limittheorem in actionStudent’st-distributionCritical values fort-distributionsCentral limittheorem—t version
c© Iain Pardoe, 2006 17 / 22
• Randomly sample Y1, Y2, . . . , Yn from a populationwith mean, E(Y ), and standard deviation, SD(Y ).
• CLT: mY ∼ Normal(E(Y ), SD(Y )2/n),
so Z =mY −E(Y )SD(Y )/
√n∼ Normal(0, 12).
• Assume home prices Y1, Y2, . . . , Y30 haveE(Y ) = 280 and SD(Y ) = 50.
• What is the 95th percentile of mY ?• Pr (Z > 1.645) = 0.05
Pr
(
mY − 280
50/√
30> 1.645
)
= 0.05
Pr (mY > 1.645(50/√
30) + 280) = 0.05
Pr (mY > 295) = 0.05.
• What is the 90th percentile of mY ?

Finding sampling distribution probabilities
1.1 Identifying andsummarizing data
1.2 Populationdistributions
1.3 Selectingindividuals atrandom—probability
1.4 Randomsampling
Random sampling
Central limittheorem—normalversionFinding samplingdistributionprobabilities
The central limittheorem in actionStudent’st-distributionCritical values fort-distributionsCentral limittheorem—t version
c© Iain Pardoe, 2006 18 / 22
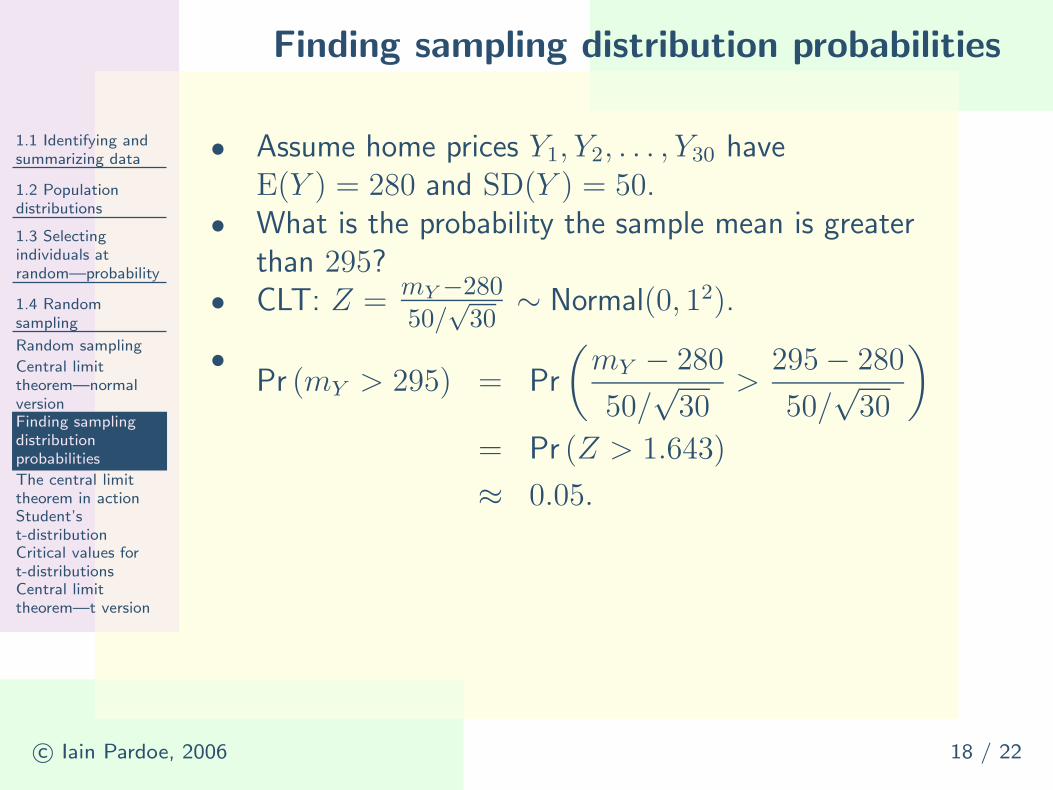
• Assume home prices Y1, Y2, . . . , Y30 haveE(Y ) = 280 and SD(Y ) = 50.
• What is the probability the sample mean is greaterthan 295?
Finding sampling distribution probabilities
1.1 Identifying andsummarizing data
1.2 Populationdistributions
1.3 Selectingindividuals atrandom—probability
1.4 Randomsampling
Random sampling
Central limittheorem—normalversionFinding samplingdistributionprobabilities
The central limittheorem in actionStudent’st-distributionCritical values fort-distributionsCentral limittheorem—t version
c© Iain Pardoe, 2006 18 / 22
• Assume home prices Y1, Y2, . . . , Y30 haveE(Y ) = 280 and SD(Y ) = 50.
• What is the probability the sample mean is greaterthan 295?
• CLT: Z = mY −28050/
√30
∼ Normal(0, 12).
•Pr (mY > 295)
Finding sampling distribution probabilities
1.1 Identifying andsummarizing data
1.2 Populationdistributions
1.3 Selectingindividuals atrandom—probability
1.4 Randomsampling
Random sampling
Central limittheorem—normalversionFinding samplingdistributionprobabilities
The central limittheorem in actionStudent’st-distributionCritical values fort-distributionsCentral limittheorem—t version
c© Iain Pardoe, 2006 18 / 22
• Assume home prices Y1, Y2, . . . , Y30 haveE(Y ) = 280 and SD(Y ) = 50.
• What is the probability the sample mean is greaterthan 295?
• CLT: Z = mY −28050/
√30
∼ Normal(0, 12).
•Pr (mY > 295) = Pr
(
mY − 280
50/√
30>
295 − 280
50/√
30
)
= Pr (Z > 1.643)
≈ 0.05.
• What is the probability the sample mean is greaterthan 292?
The central limit theorem in action
1.1 Identifying andsummarizing data
1.2 Populationdistributions
1.3 Selectingindividuals atrandom—probability
1.4 Randomsampling
Random sampling
Central limittheorem—normalversionFinding samplingdistributionprobabilities
The central limittheorem in actionStudent’st-distributionCritical values fort-distributionsCentral limittheorem—t version
c© Iain Pardoe, 2006 19 / 22
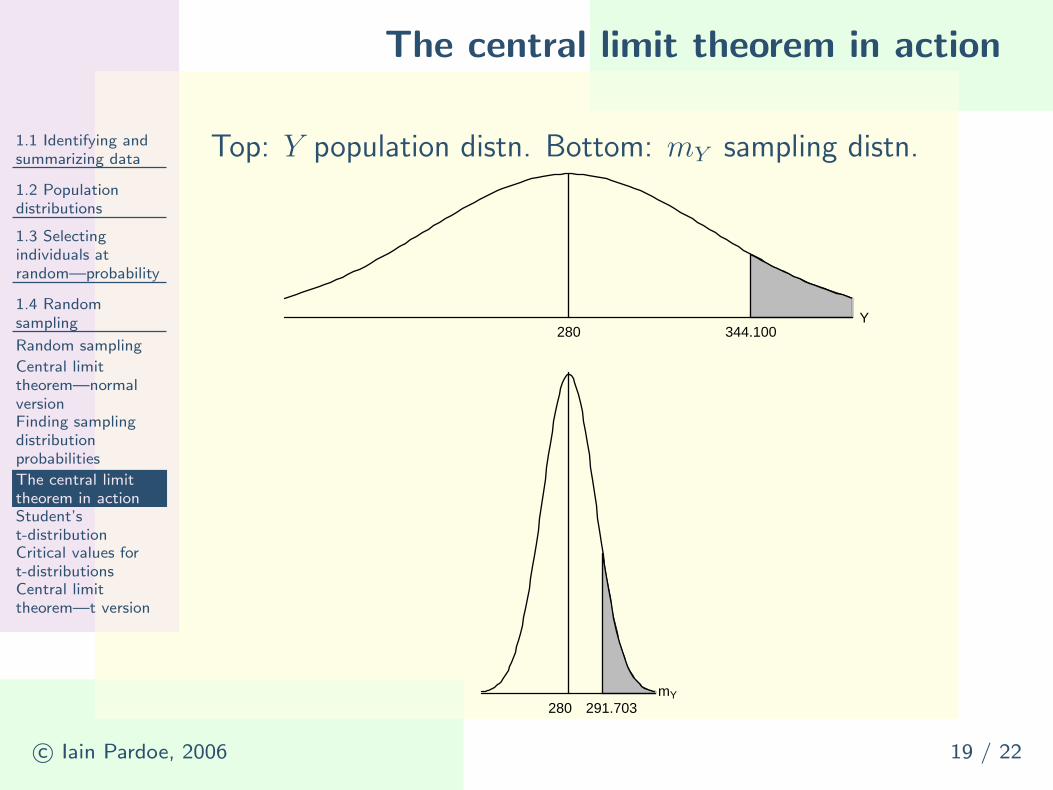
Top: Y population distn. Bottom: mY sampling distn.
Y280 344.100
mY280 291.703
Student’s t-distribution
1.1 Identifying andsummarizing data
1.2 Populationdistributions
1.3 Selectingindividuals atrandom—probability
1.4 Randomsampling
Random sampling
Central limittheorem—normalversionFinding samplingdistributionprobabilities
The central limittheorem in actionStudent’st-distributionCritical values fort-distributionsCentral limittheorem—t version
c© Iain Pardoe, 2006 20 / 22
• Drawback to CLT: need to know populationstandard deviation, SD(Y ), to use it.
• Since we rarely know SD(Y ), what would be agood estimate to use instead?

Student’s t-distribution
1.1 Identifying andsummarizing data
1.2 Populationdistributions
1.3 Selectingindividuals atrandom—probability
1.4 Randomsampling
Random sampling
Central limittheorem—normalversionFinding samplingdistributionprobabilities
The central limittheorem in actionStudent’st-distributionCritical values fort-distributionsCentral limittheorem—t version
c© Iain Pardoe, 2006 20 / 22
• Drawback to CLT: need to know populationstandard deviation, SD(Y ), to use it.
• Since we rarely know SD(Y ), what would be agood estimate to use instead? The sample s.d., sY .
• Replacing SD(Y ) with sY requires use of at-distribution rather than the normal:
◦ t-distribution is like normal but more spread out(fatter tails) to reflect additional uncertainty;
◦ additional uncertainty is due to using sY insteadof assuming we know SD(Y );
◦ sY is a better estimate of SD(Y ) for large n;◦ t-distribution accounts for this using degrees of
freedom (df= n−1 in this case);◦ as df becomes large, t-distribution looks more
and more like normal.

Critical values for t-distributions
1.1 Identifying andsummarizing data
1.2 Populationdistributions
1.3 Selectingindividuals atrandom—probability
1.4 Randomsampling
Random sampling
Central limittheorem—normalversionFinding samplingdistributionprobabilities
The central limittheorem in actionStudent’st-distributionCritical values fort-distributionsCentral limittheorem—t version
c© Iain Pardoe, 2006 21 / 22
upper-tail area 0.1 0.05 0.025 0.01 0.005 0.001
df = 3 1.638 2.353 3.182 4.541 5.841 10.215df = 15 1.341 1.753 2.131 2.602 2.947 3.733df = 29 1.311 1.699 2.045 2.462 2.756 3.396df = 60 1.296 1.671 2.000 2.390 2.660 3.232df = ∞ (normal) 1.282 1.645 1.960 2.326 2.576 3.090
two-tail area 0.2 0.1 0.05 0.02 0.01 0.002
• Horizontal axis values are called critical values.• Tail areas (under the density curve) represent
probabilities.• Example: Pr(t29 > 1.699) = 0.05.• Note that critical values get closer to those for the
normal as df gets larger.
Central limit theorem—t version
1.1 Identifying andsummarizing data
1.2 Populationdistributions
1.3 Selectingindividuals atrandom—probability
1.4 Randomsampling
Random sampling
Central limittheorem—normalversionFinding samplingdistributionprobabilities
The central limittheorem in actionStudent’st-distributionCritical values fort-distributionsCentral limittheorem—t version
c© Iain Pardoe, 2006 22 / 22
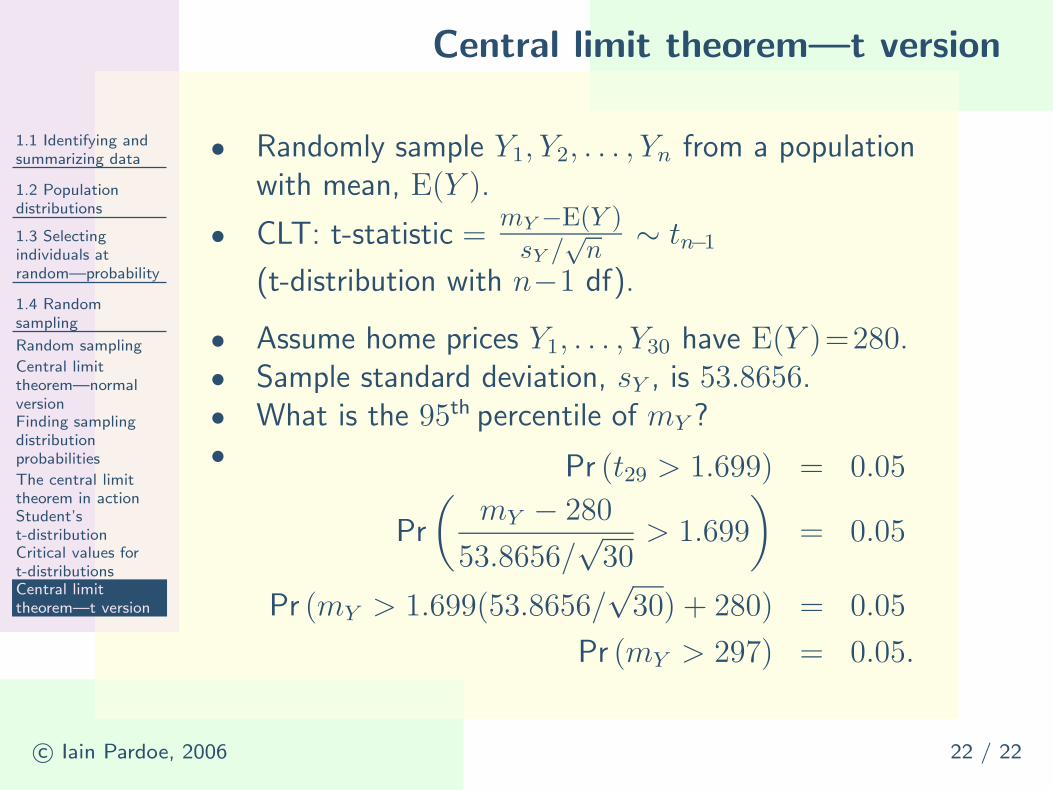
• Randomly sample Y1, Y2, . . . , Yn from a populationwith mean, E(Y ).
• CLT: t-statistic =mY −E(Y )
sY /√
n∼ tn−1
(t-distribution with n−1 df).
• Assume home prices Y1, . . . , Y30 have E(Y )=280.• Sample standard deviation, sY , is 53.8656.• What is the 95th percentile of mY ?

Central limit theorem—t version
1.1 Identifying andsummarizing data
1.2 Populationdistributions
1.3 Selectingindividuals atrandom—probability
1.4 Randomsampling
Random sampling
Central limittheorem—normalversionFinding samplingdistributionprobabilities
The central limittheorem in actionStudent’st-distributionCritical values fort-distributionsCentral limittheorem—t version
c© Iain Pardoe, 2006 22 / 22
• Randomly sample Y1, Y2, . . . , Yn from a populationwith mean, E(Y ).
• CLT: t-statistic =mY −E(Y )
sY /√
n∼ tn−1
(t-distribution with n−1 df).
• Assume home prices Y1, . . . , Y30 have E(Y )=280.• Sample standard deviation, sY , is 53.8656.• What is the 95th percentile of mY ?• Pr (t29 > 1.699) = 0.05
Pr
(
mY − 280
53.8656/√
30> 1.699
)
= 0.05
Pr (mY > 1.699(53.8656/√
30) + 280) = 0.05
Pr (mY > 297) = 0.05.
• What is the 90th percentile of mY ?
Related Documents