Abstract— Microarray technology has been used extensively for high throughput gene expression studies. Many bioinformatics tools are available for analysis of microarray data. In the data mining process, it is important to be goal oriented so that a set of proper tools can be assembled for the targeted knowledge discovery process. In this paper, we tackle this issue by using a microarray dataset from Brassica endosperm together with EST data to validate our process. We were most interested in which genes are highly expressed in Brassica endosperm and their variations and functions over various stages in embryo development. We also performed gene characterization based on gene ontology analysis. Our results indicate that designing a specific data mining workflow that considers both the log ratio and signal intensity enhances knowledge discovery process. Through this approach, we were able to find the regulatory relationship between two most important transcription factors, LEC1 and WRI1 in the endosperm of Brassica napus. Keywords: Microarray data analysis, gene expression, differentially expressed genes, transcriptional regulation I. INTRODUCTION ICROARRAY technology has been prevalent in modern biology over the past decade. Through a simple PubMed search using the keyword “microarray”, we today could find about 27,000 papers. This does not include many papers published in the conference proceedings and journals that are not being indexed in PubMed. In September of 2006, the Gene Expression Omnibus (GEO) database held 120,000 samples [1]. This number reached over 260,000 samples in September of 2008 (http://www.ncbi.nlm.nih.gov /geo/). Differentially expressed gene analysis has been a norm in routine microarray data analysis. Often, the differences in gene expressions are simply assumed by ratios or log ratios of fluorescence signals that theoretically indicate differences in mRNA concentrations between two biological classes (e.g. treated vs. untreated, mutant vs. wild type, tissue 1 vs. tissue 2, condition 1 vs. condition 2, or time i+1 vs. time i). In some of these analyses, consistency among the replicate samples has not been seriously considered. One would simply take the log ratios and check through SAM This work was supported in part by the Genomics and Health Initiative of National Research Council Canada. This is publication NRC-50745 of National Research Council. Y. Pan, Z. Liu, S. Phan and F. A. Famili are with Knowledge Discovery Group, Institute for Information Technology, NRC, 1200 Montreal Road, Ottawa, ON, Canada K1A 0R6 (e-mails: [email protected]). Jitao Zou and Yi Huang are with Plant Biotechnology Institute, NRC, 110 Gymnasium Place, Saskatoon, SK, Canada S7N 0W9 (e-mails: [email protected]). * For correspondence: [email protected]. (Significance Analysis of Microarrays) [2] to generate a group of significant genes and then do a clustering analysis to identify groups of co-expressed genes. Functional characterization is subsequently performed through GO analysis and/or pathway search. The analysis of differentially expressed genes as stated above overlooked one important fact. Ratios or log ratios are informative only in the linear region as indicated in Fig. 1. Another important fact in the microarray data is that the low expression signals are usually buried in the noisy zone. For example, by simply taking ratio of the two classes of the six genes in Table I, one would conclude the magnitude of difference in gene expression between classes C2 and C1 is g1>g2>g3>g4>g5>g6. In this synthetic dataset, the ratio values are probably true for g4 and g5. However, for the other four genes (g1, g2, g3 and g6) it is difficult to compare the magnitude of difference among these genes though they appear to be differentially expressed because their expression signal intensities are in the non-linear region. Therefore it is important to consider the fluorescence signal zonal localization before considering the ratios. Goal Driven Analysis of cDNA Microarray Data Youlian Pan * , Jitao Zou, Yi Huang, Ziying Liu, Sieu Phan, Fazel A. Famili M Median of empty spots 50,000 40 Signal mRNA concentration Saturation (68,102) Baseline 25.15 Median of empty spots Median of empty spots 50,000 40 Signal mRNA concentration Saturation (68,102) Baseline 25.15 50,000 40 Signal mRNA concentration Saturation (68,102) ~ ~ ~ ~ ~ ~ ~ ~ ~ ~ Baseline 25.15 Fig. 1. Schematics identification of the linear region of gene expression signal vs. mRNA concentration in microarray experiments. This was simulated base on the application case in this paper. TABLE I SYNTHETIC DATA TO DEMONSTRATE FAULTY IN TAKING RATIO DATA WITHOUT CONSIDERING SIGNAL INTENSITY DATA C1 C2 Ratio C2/C1 Fold changes g1 15 240 16 4.00 g2 30 240 8 3.00 g3 50 200 4 2.00 g4 500 1750 3.5 1.81 g5 3000 9000 3 1.58 g6 50000 60000 1.2 0.26 978-1-4244-2756-7/09/$25.00 ©2009 IEEE Authorized licensed use limited to: CISTI. Downloaded on June 16, 2009 at 11:26 from IEEE Xplore. Restrictions apply.

Welcome message from author
This document is posted to help you gain knowledge. Please leave a comment to let me know what you think about it! Share it to your friends and learn new things together.
Transcript
Abstract— Microarray technology has been used extensively for high throughput gene expression studies. Many bioinformatics tools are available for analysis of microarray data. In the data mining process, it is important to be goal oriented so that a set of proper tools can be assembled for the targeted knowledge discovery process. In this paper, we tackle this issue by using a microarray dataset from Brassica endosperm together with EST data to validate our process. We were most interested in which genes are highly expressed in Brassica endosperm and their variations and functions over various stages in embryo development. We also performed gene characterization based on gene ontology analysis. Our results indicate that designing a specific data mining workflow that considers both the log ratio and signal intensity enhances knowledge discovery process. Through this approach, we were able to find the regulatory relationship between two most important transcription factors, LEC1 and WRI1 in the endosperm of Brassica napus. Keywords: Microarray data analysis, gene expression,
differentially expressed genes, transcriptional regulation
I. INTRODUCTION ICROARRAY technology has been prevalent in modern biology over the past decade. Through a
simple PubMed search using the keyword “microarray”, we today could find about 27,000 papers. This does not include many papers published in the conference proceedings and journals that are not being indexed in PubMed. In September of 2006, the Gene Expression Omnibus (GEO) database held 120,000 samples [1]. This number reached over 260,000 samples in September of 2008 (http://www.ncbi.nlm.nih.gov /geo/).
Differentially expressed gene analysis has been a norm in routine microarray data analysis. Often, the differences in gene expressions are simply assumed by ratios or log ratios of fluorescence signals that theoretically indicate differences in mRNA concentrations between two biological classes (e.g. treated vs. untreated, mutant vs. wild type, tissue 1 vs. tissue 2, condition 1 vs. condition 2, or time i+1 vs. time i). In some of these analyses, consistency among the replicate samples has not been seriously considered. One would simply take the log ratios and check through SAM
This work was supported in part by the Genomics and Health Initiative of National Research Council Canada. This is publication NRC-50745 of National Research Council.
Y. Pan, Z. Liu, S. Phan and F. A. Famili are with Knowledge Discovery Group, Institute for Information Technology, NRC, 1200 Montreal Road, Ottawa, ON, Canada K1A 0R6 (e-mails: [email protected]).
Jitao Zou and Yi Huang are with Plant Biotechnology Institute, NRC, 110 Gymnasium Place, Saskatoon, SK, Canada S7N 0W9 (e-mails: [email protected]).
* For correspondence: [email protected].
(Significance Analysis of Microarrays) [2] to generate a group of significant genes and then do a clustering analysis to identify groups of co-expressed genes. Functional characterization is subsequently performed through GO analysis and/or pathway search.
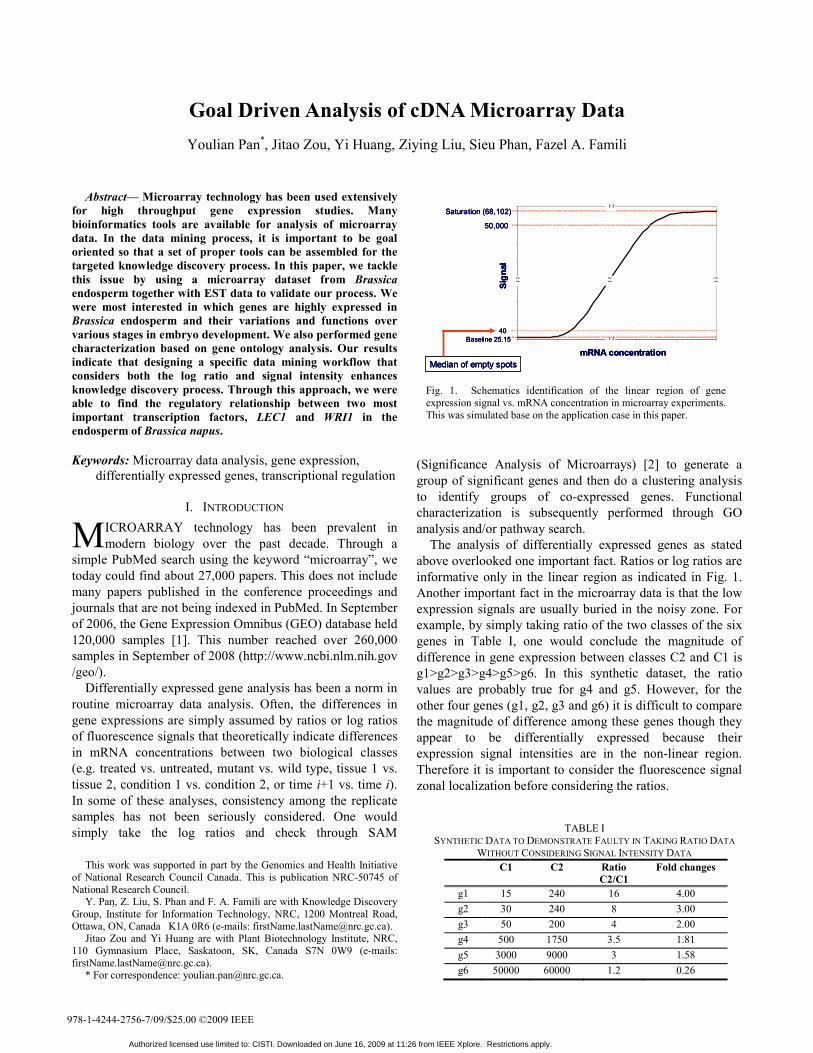
The analysis of differentially expressed genes as stated above overlooked one important fact. Ratios or log ratios are informative only in the linear region as indicated in Fig. 1. Another important fact in the microarray data is that the low expression signals are usually buried in the noisy zone. For example, by simply taking ratio of the two classes of the six genes in Table I, one would conclude the magnitude of difference in gene expression between classes C2 and C1 is g1>g2>g3>g4>g5>g6. In this synthetic dataset, the ratio values are probably true for g4 and g5. However, for the other four genes (g1, g2, g3 and g6) it is difficult to compare the magnitude of difference among these genes though they appear to be differentially expressed because their expression signal intensities are in the non-linear region. Therefore it is important to consider the fluorescence signal zonal localization before considering the ratios.
Goal Driven Analysis of cDNA Microarray Data Youlian Pan*, Jitao Zou, Yi Huang, Ziying Liu, Sieu Phan, Fazel A. Famili
M
Median of empty spots
50,000
40
Sign
al
mRNA concentration
Saturation (68,102)
~~ ~~ ~~
~~~~
Baseline 25.15
Median of empty spotsMedian of empty spots
50,000
40
Sign
al
mRNA concentration
Saturation (68,102)
~~ ~~ ~~
~~~~
Baseline 25.15
50,000
40
Sign
al
mRNA concentration
Saturation (68,102)
~~ ~~ ~~
~~~~
Baseline 25.15
Fig. 1. Schematics identification of the linear region of gene expression signal vs. mRNA concentration in microarray experiments. This was simulated base on the application case in this paper.
TABLE I
SYNTHETIC DATA TO DEMONSTRATE FAULTY IN TAKING RATIO DATA WITHOUT CONSIDERING SIGNAL INTENSITY DATA
C1 C2 Ratio C2/C1
Fold changes
g1 15 240 16 4.00 g2 30 240 8 3.00 g3 50 200 4 2.00 g4 500 1750 3.5 1.81 g5 3000 9000 3 1.58 g6 50000 60000 1.2 0.26
978-1-4244-2756-7/09/$25.00 ©2009 IEEE
Authorized licensed use limited to: CISTI. Downloaded on June 16, 2009 at 11:26 from IEEE Xplore. Restrictions apply.
Microarray data are usually very noisy and subjected to multiple sources of variation. These include biological variations that are influenced by environmental, developmental, or genetic factors; technical variations influenced by sample preparation, hybridization, array platform, or probe design; and measurement variations influenced by the array scanner or label fluorescence [3]. Therefore, the consistency of the data among the replicates is another very important factor one should consider in data analysis.
Finally, the most important factor one needs to take into account is the domain question(s) to be addressed from the dataset. One dataset can be used for multiple purposes. For example, the yeast datasets have been extensively used for many different purposes [4],[5]. Sometimes, one might want to find the difference in gene expression among the genes in addition to various classes; or to find difference in gene expression patterns among the genes over time period while expression signal levels could be the same between a group of genes at a given time point. To address various questions collectively, one needs to properly design a data analysis workflow.
In this paper, we tackle this issue and propose an appropriate approach in analysis of differentially expressed genes. We used a set of Brassica napus endosperm microarray data collected over various stages of embryogenesis. Brassica napus, also known as rapeseed, is the most widely cultivated oilseed in many parts of the world. The endosperm is a specialized tissue in the seed that supplies nutrients to the developing embryo. Understanding endosperm development is essential for biotechnology efforts aimed at improving seed size and quality.
In the following sections, we first describe the dataset and domain questions that we are seeking for answers through data mining. We then propose a knowledge discovery workflow specific to our goals. Subsequently, we present our results and discussion, and finally the conclusion.
II. THE DATASET
A. Microarray Data The microarray data used in this study contained a set of
10,642 cDNA amplicons from Brassica spp [6]. The biological problem was to identify highly expressed genes and understand the mechanism behind the changes of gene expression in the endosperm during embryogenesis of the Brassica seeds. The stages of embryogenesis considered in this study were defined according to the shapes of the imbedded embryos: globular, heart, and cotyledon. The microarray experiment was done in two channels representing two different developmental stages, i.e. heart vs. globular, cotyledon vs. globular, or cotyledon vs. heart. The experiment was performed in two biological replicates, each has four technical repeats with dye swaps. Hybridized arrays were scanned using a Genepix 4000B microarray scanner (Axon Instruments, CA, USA) at 5 µm resolution,
100% laser power, and different PMT values to obtain a similar green and red overall intensity. Raw spot fluorescence intensities were collected using GenePix Pro version 6.0 (Axon Instruments, CA, USA). A quality control filter was used to flag questionable spots on the array so they could be removed from the analysis.
Before normalization, the outlier spots with median intensities that were larger than ‘median ± 10×stdev’ were removed. Foreground intensities of gene expression signal were background corrected using the ‘normexp’, and the signal intensities were normalized by ‘global loess’ within array and by Quantile among arrays using R-package Limma [7].
B. EST Data Two cDNA libraries were constructed using a Creator
SMART cDNA Library Construction Kit from Clontech (BD Biosciences Clontech, USA) according to the manufacturer’s recommendations. One library originated from RNA isolated from endosperms at heart-shape-embryo stage (Library II), and another one derived from RNA isolated from mixed endosperms at various developmental stages (Library I). We totally sequenced 30,239 ESTs and a total of 24,881 high quality sequences were recovered. Because the number of ESTs was not sufficient to justify separation into different pools, we combined the data into one endosperm EST dataset. Alleles and homologues were combined into the same contig using TIGCL (http://ww.tigr.org/tdb/tgi/ software) for clustering analysis. In total, we found 2,894 tentative contigs and 7,069 singletons which represent 9,963 unisequences. All unisequences were subjected to search by BLASTX against Arabidopsis protein database on The Arabidopsis Information Resource (TAIR) for transcript homologs at an E-value ≤ 1e-6 [8]. This EST dataset is used to illustrate goodness of our approach below.
III. THE APPROACH We first identify a group of significantly and differentially
expressed genes. In this step, it is critical to refer to the domain questions so that not to exclude genes which are necessary in answering the questions and also not to introduce much noise in subsequent data analysis steps. There are two aspects in the domain question: 1) to find significantly expressed genes a) in some stages but not necessarily in other stages, and b) across all stages; 2) to group differentially expressed genes based on their patterns of variations. By simply taking the log2 ratio data with a certain level of significance (e.g. log2R = 1, where R=ratio) between the two channels on the microarray, genes with similar expression signals, but highly expressed across all stages would have been excluded. We tried to avoid this in the design of workflow below.
Authorized licensed use limited to: CISTI. Downloaded on June 16, 2009 at 11:26 from IEEE Xplore. Restrictions apply.
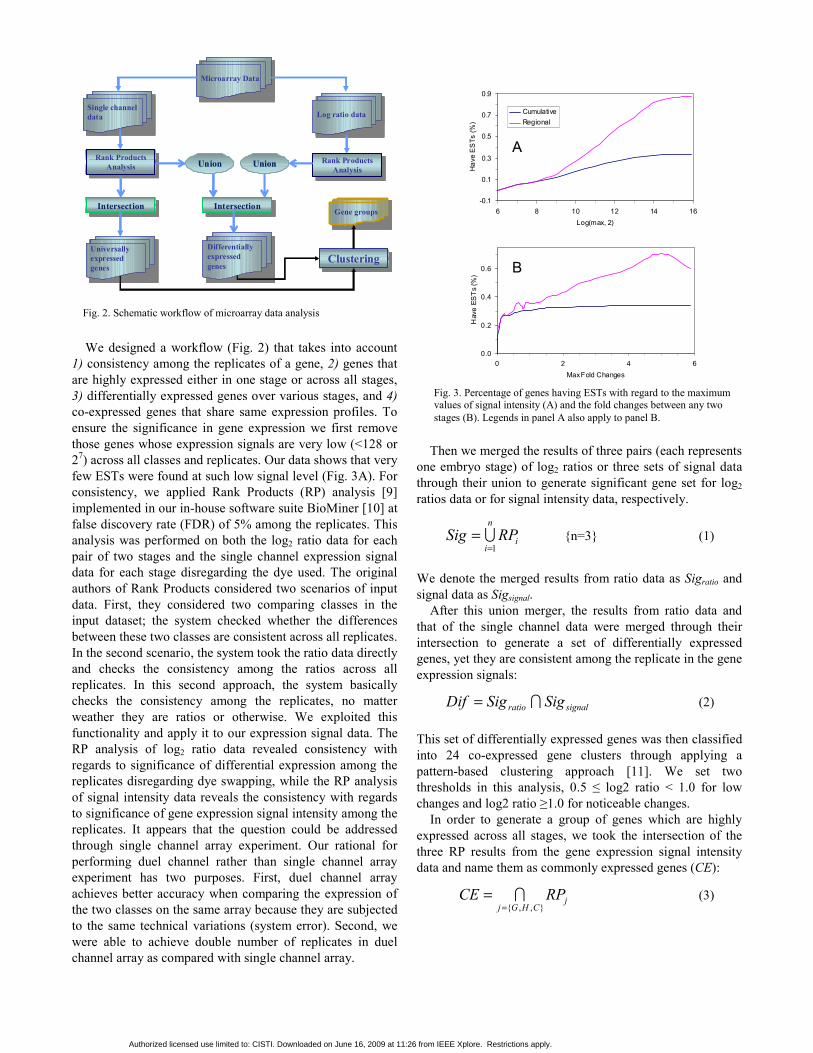
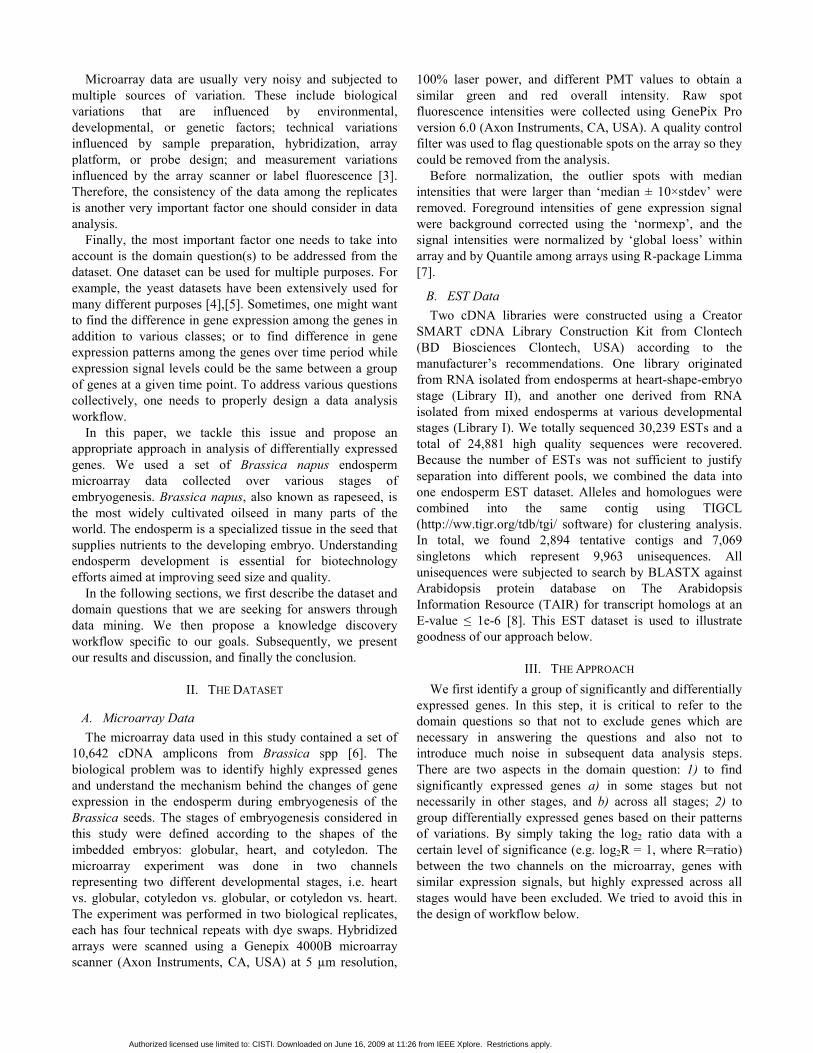
We designed a workflow (Fig. 2) that takes into account 1) consistency among the replicates of a gene, 2) genes that are highly expressed either in one stage or across all stages, 3) differentially expressed genes over various stages, and 4) co-expressed genes that share same expression profiles. To ensure the significance in gene expression we first remove those genes whose expression signals are very low (<128 or 27) across all classes and replicates. Our data shows that very few ESTs were found at such low signal level (Fig. 3A). For consistency, we applied Rank Products (RP) analysis [9] implemented in our in-house software suite BioMiner [10] at false discovery rate (FDR) of 5% among the replicates. This analysis was performed on both the log2 ratio data for each pair of two stages and the single channel expression signal data for each stage disregarding the dye used. The original authors of Rank Products considered two scenarios of input data. First, they considered two comparing classes in the input dataset; the system checked whether the differences between these two classes are consistent across all replicates. In the second scenario, the system took the ratio data directly and checks the consistency among the ratios across all replicates. In this second approach, the system basically checks the consistency among the replicates, no matter weather they are ratios or otherwise. We exploited this functionality and apply it to our expression signal data. The RP analysis of log2 ratio data revealed consistency with regards to significance of differential expression among the replicates disregarding dye swapping, while the RP analysis of signal intensity data reveals the consistency with regards to significance of gene expression signal intensity among the replicates. It appears that the question could be addressed through single channel array experiment. Our rational for performing duel channel rather than single channel array experiment has two purposes. First, duel channel array achieves better accuracy when comparing the expression of the two classes on the same array because they are subjected to the same technical variations (system error). Second, we were able to achieve double number of replicates in duel channel array as compared with single channel array.
Then we merged the results of three pairs (each represents one embryo stage) of log2 ratios or three sets of signal data through their union to generate significant gene set for log2 ratios data or for signal intensity data, respectively.
i
n
iRPSig
1== ∪ {n=3} (1)
We denote the merged results from ratio data as Sigratio and signal data as Sigsignal.
After this union merger, the results from ratio data and that of the single channel data were merged through their intersection to generate a set of differentially expressed genes, yet they are consistent among the replicate in the gene expression signals:
signalratio SigSigDif ∩= (2)
This set of differentially expressed genes was then classified into 24 co-expressed gene clusters through applying a pattern-based clustering approach [11]. We set two thresholds in this analysis, 0.5 ≤ log2 ratio < 1.0 for low changes and log2 ratio ≥1.0 for noticeable changes.
In order to generate a group of genes which are highly expressed across all stages, we took the intersection of the three RP results from the gene expression signal intensity data and name them as commonly expressed genes (CE):
jCHGj
RPCE},,{=
= ∩ (3)
0.0
0.2
0.4
0.6
0 2 4 6Max Fold Changes
Hav
e ES
Ts
(%)
B
-0.1
0.1
0.3
0.5
0.7
0.9
6 8 10 12 14 16Log(max, 2)
Hav
e E
STs
(%)
CumulativeRegional
A
0.0
0.2
0.4
0.6
0 2 4 6Max Fold Changes
Hav
e ES
Ts
(%)
B
-0.1
0.1
0.3
0.5
0.7
0.9
6 8 10 12 14 16Log(max, 2)
Hav
e E
STs
(%)
CumulativeRegional
A
Fig. 3. Percentage of genes having ESTs with regard to the maximum values of signal intensity (A) and the fold changes between any two stages (B). Legends in panel A also apply to panel B.
Microarray DataMicroarray Data
Log ratio dataLog ratio dataSingle channel data
Single channel data
Rank Products Analysis
Rank Products Analysis Rank Products
AnalysisRank Products
Analysis
IntersectionIntersection
Universally expressed genes
Universally expressed genes
Differentiallyexpressed genes
Differentiallyexpressed genes
IntersectionIntersection
ClusteringClustering
Gene groupsGene groups
Union Union
Fig. 2. Schematic workflow of microarray data analysis
Authorized licensed use limited to: CISTI. Downloaded on June 16, 2009 at 11:26 from IEEE Xplore. Restrictions apply.
IV. RESULT AND DISCUSSION
A. Differentially Expressed Genes Through Rank Products analysis, we found 3048 and 2501
genes based on the gene expression signals and log2 ratio data, respectively (Sig in (1), Table II). By merging through intersection of these results, we identified 1229 genes that were differentially expressed in the endosperm across the three embryogenesis stages (Dif in (2)). We also found 1600 genes that were commonly expressed across all three stages (CE in (3)). By taking genes from CE which have minimum signal intensity of 5,000 across all three stages, we found 430 genes that were highly expressed across the three stages (HCE in Table II).
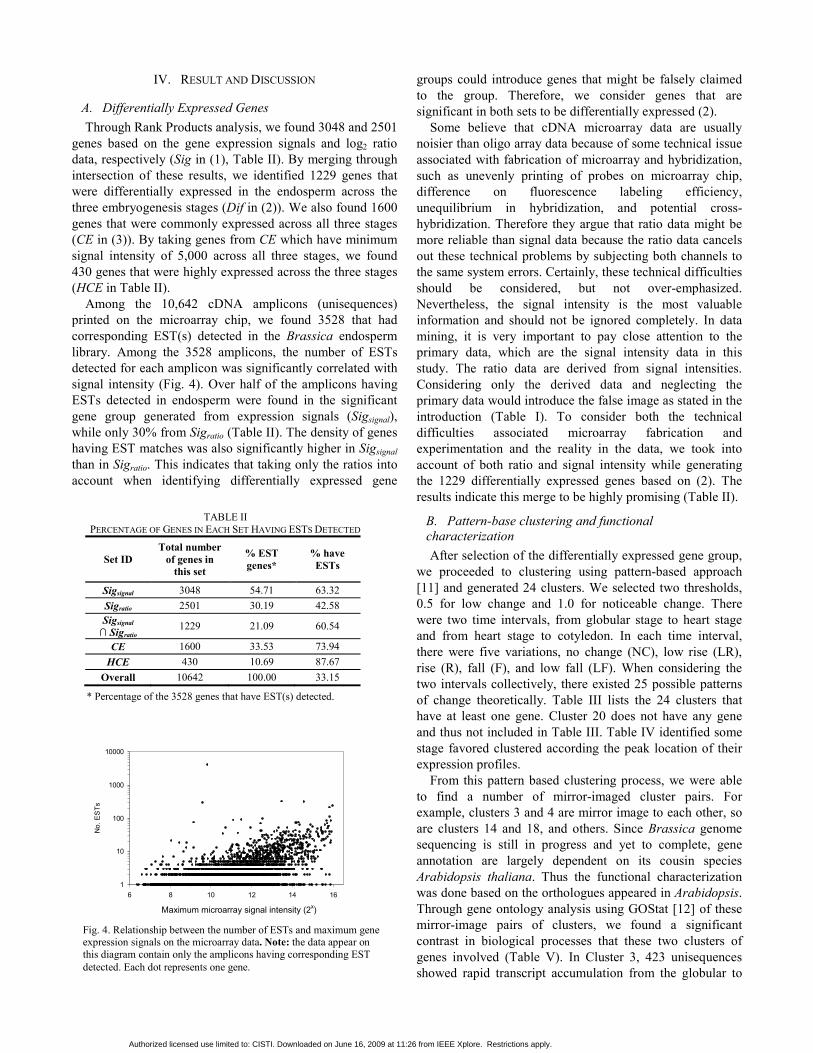
Among the 10,642 cDNA amplicons (unisequences) printed on the microarray chip, we found 3528 that had corresponding EST(s) detected in the Brassica endosperm library. Among the 3528 amplicons, the number of ESTs detected for each amplicon was significantly correlated with signal intensity (Fig. 4). Over half of the amplicons having ESTs detected in endosperm were found in the significant gene group generated from expression signals (Sigsignal), while only 30% from Sigratio (Table II). The density of genes having EST matches was also significantly higher in Sigsignal than in Sigratio. This indicates that taking only the ratios into account when identifying differentially expressed gene
groups could introduce genes that might be falsely claimed to the group. Therefore, we consider genes that are significant in both sets to be differentially expressed (2).
Some believe that cDNA microarray data are usually noisier than oligo array data because of some technical issue associated with fabrication of microarray and hybridization, such as unevenly printing of probes on microarray chip, difference on fluorescence labeling efficiency, unequilibrium in hybridization, and potential cross-hybridization. Therefore they argue that ratio data might be more reliable than signal data because the ratio data cancels out these technical problems by subjecting both channels to the same system errors. Certainly, these technical difficulties should be considered, but not over-emphasized. Nevertheless, the signal intensity is the most valuable information and should not be ignored completely. In data mining, it is very important to pay close attention to the primary data, which are the signal intensity data in this study. The ratio data are derived from signal intensities. Considering only the derived data and neglecting the primary data would introduce the false image as stated in the introduction (Table I). To consider both the technical difficulties associated microarray fabrication and experimentation and the reality in the data, we took into account of both ratio and signal intensity while generating the 1229 differentially expressed genes based on (2). The results indicate this merge to be highly promising (Table II).
B. Pattern-base clustering and functional characterization After selection of the differentially expressed gene group,
we proceeded to clustering using pattern-based approach [11] and generated 24 clusters. We selected two thresholds, 0.5 for low change and 1.0 for noticeable change. There were two time intervals, from globular stage to heart stage and from heart stage to cotyledon. In each time interval, there were five variations, no change (NC), low rise (LR), rise (R), fall (F), and low fall (LF). When considering the two intervals collectively, there existed 25 possible patterns of change theoretically. Table III lists the 24 clusters that have at least one gene. Cluster 20 does not have any gene and thus not included in Table III. Table IV identified some stage favored clustered according the peak location of their expression profiles.
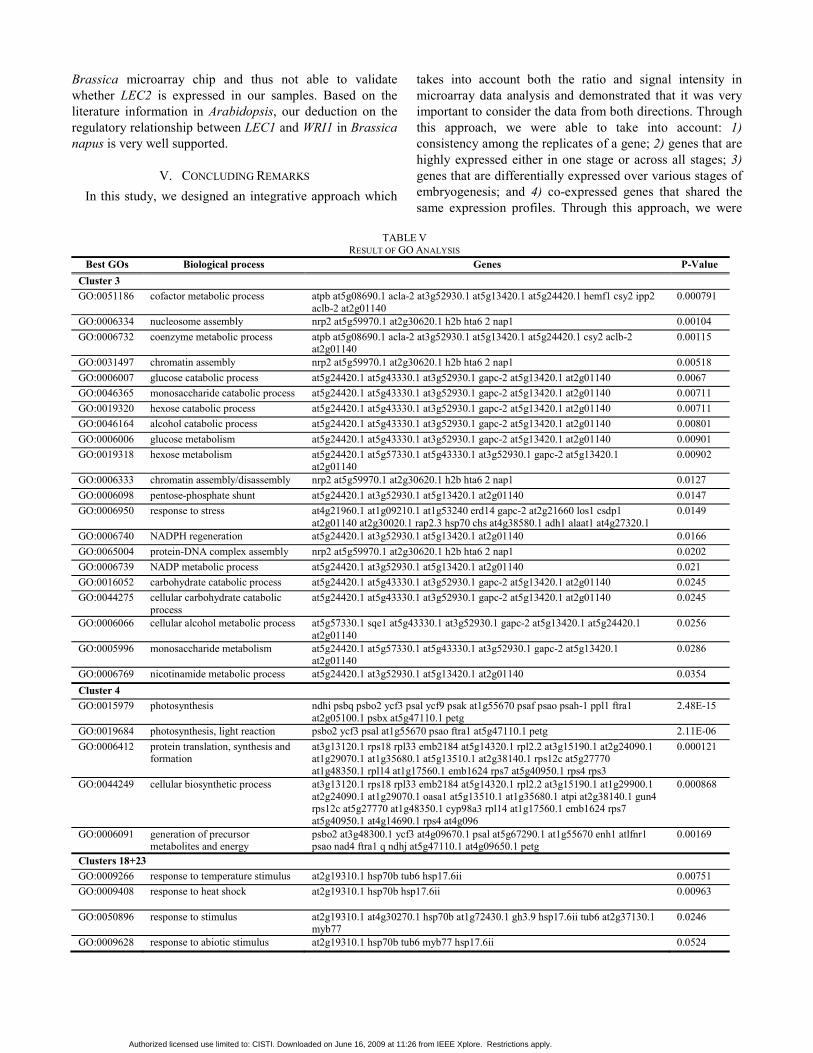
From this pattern based clustering process, we were able to find a number of mirror-imaged cluster pairs. For example, clusters 3 and 4 are mirror image to each other, so are clusters 14 and 18, and others. Since Brassica genome sequencing is still in progress and yet to complete, gene annotation are largely dependent on its cousin species Arabidopsis thaliana. Thus the functional characterization was done based on the orthologues appeared in Arabidopsis. Through gene ontology analysis using GOStat [12] of these mirror-image pairs of clusters, we found a significant contrast in biological processes that these two clusters of genes involved (Table V). In Cluster 3, 423 unisequences showed rapid transcript accumulation from the globular to
TABLE II
PERCENTAGE OF GENES IN EACH SET HAVING ESTS DETECTED
Set ID Total number
of genes in this set
% EST genes*
% have ESTs
Sigsignal 3048 54.71 63.32 Sigratio 2501 30.19 42.58 Sigsignal ∩ Sigratio
1229 21.09 60.54
CE 1600 33.53 73.94 HCE 430 10.69 87.67
Overall 10642 100.00 33.15
* Percentage of the 3528 genes that have EST(s) detected.
1
10
100
1000
10000
6 8 10 12 14 16
Log(max, 2)
No.
ES
Ts
Maximum microarray signal intensity (2x)
1
10
100
1000
10000
6 8 10 12 14 16
Log(max, 2)
No.
ES
Ts
Maximum microarray signal intensity (2x)
Fig. 4. Relationship between the number of ESTs and maximum gene expression signals on the microarray data. Note: the data appear on this diagram contain only the amplicons having corresponding EST detected. Each dot represents one gene.
Authorized licensed use limited to: CISTI. Downloaded on June 16, 2009 at 11:26 from IEEE Xplore. Restrictions apply.
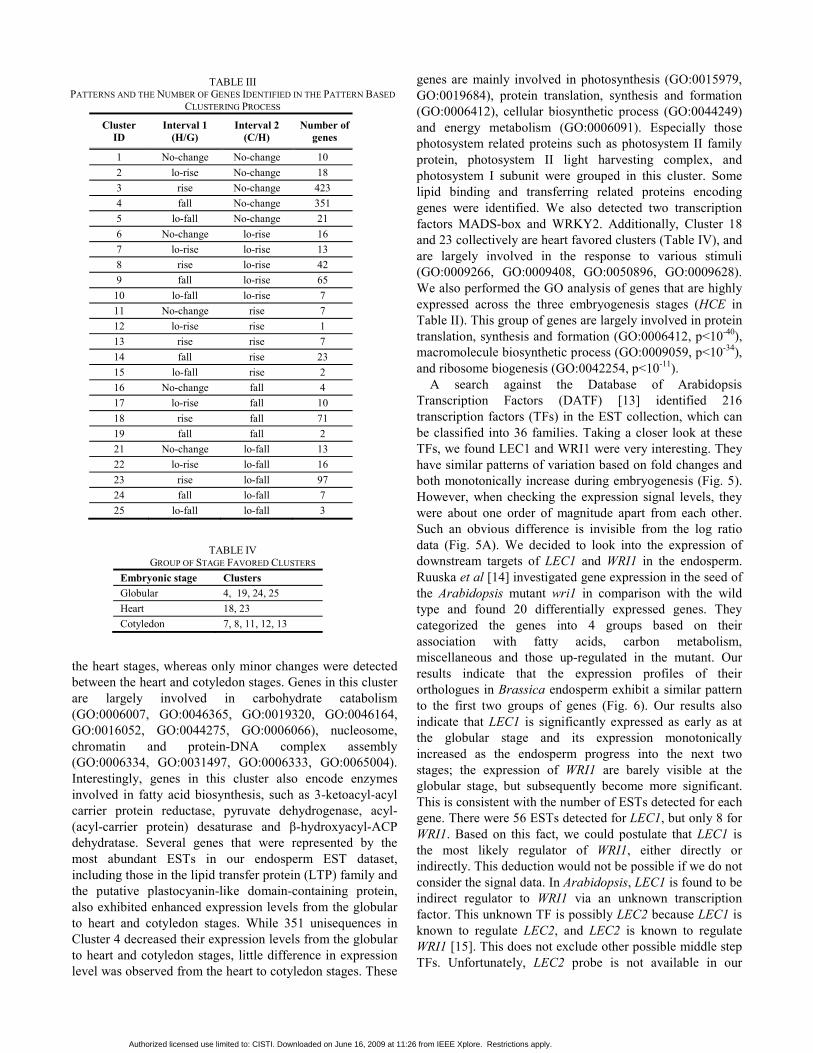
TABLE III PATTERNS AND THE NUMBER OF GENES IDENTIFIED IN THE PATTERN BASED
CLUSTERING PROCESS
Cluster ID
Interval 1 (H/G)
Interval 2 (C/H)
Number of genes
1 No-change No-change 10 2 lo-rise No-change 18 3 rise No-change 423 4 fall No-change 351 5 lo-fall No-change 21 6 No-change lo-rise 16 7 lo-rise lo-rise 13 8 rise lo-rise 42 9 fall lo-rise 65
10 lo-fall lo-rise 7 11 No-change rise 7 12 lo-rise rise 1 13 rise rise 7 14 fall rise 23 15 lo-fall rise 2 16 No-change fall 4 17 lo-rise fall 10 18 rise fall 71 19 fall fall 2 21 No-change lo-fall 13 22 lo-rise lo-fall 16 23 rise lo-fall 97 24 fall lo-fall 7 25 lo-fall lo-fall 3
TABLE IV GROUP OF STAGE FAVORED CLUSTERS
Embryonic stage Clusters Globular 4, 19, 24, 25 Heart 18, 23 Cotyledon 7, 8, 11, 12, 13
the heart stages, whereas only minor changes were detected between the heart and cotyledon stages. Genes in this cluster are largely involved in carbohydrate catabolism (GO:0006007, GO:0046365, GO:0019320, GO:0046164, GO:0016052, GO:0044275, GO:0006066), nucleosome, chromatin and protein-DNA complex assembly (GO:0006334, GO:0031497, GO:0006333, GO:0065004). Interestingly, genes in this cluster also encode enzymes involved in fatty acid biosynthesis, such as 3-ketoacyl-acyl carrier protein reductase, pyruvate dehydrogenase, acyl-(acyl-carrier protein) desaturase and β-hydroxyacyl-ACP dehydratase. Several genes that were represented by the most abundant ESTs in our endosperm EST dataset, including those in the lipid transfer protein (LTP) family and the putative plastocyanin-like domain-containing protein, also exhibited enhanced expression levels from the globular to heart and cotyledon stages. While 351 unisequences in Cluster 4 decreased their expression levels from the globular to heart and cotyledon stages, little difference in expression level was observed from the heart to cotyledon stages. These
genes are mainly involved in photosynthesis (GO:0015979, GO:0019684), protein translation, synthesis and formation (GO:0006412), cellular biosynthetic process (GO:0044249) and energy metabolism (GO:0006091). Especially those photosystem related proteins such as photosystem II family protein, photosystem II light harvesting complex, and photosystem I subunit were grouped in this cluster. Some lipid binding and transferring related proteins encoding genes were identified. We also detected two transcription factors MADS-box and WRKY2. Additionally, Cluster 18 and 23 collectively are heart favored clusters (Table IV), and are largely involved in the response to various stimuli (GO:0009266, GO:0009408, GO:0050896, GO:0009628). We also performed the GO analysis of genes that are highly expressed across the three embryogenesis stages (HCE in Table II). This group of genes are largely involved in protein translation, synthesis and formation (GO:0006412, p<10-40), macromolecule biosynthetic process (GO:0009059, p<10-34), and ribosome biogenesis (GO:0042254, p<10-11).
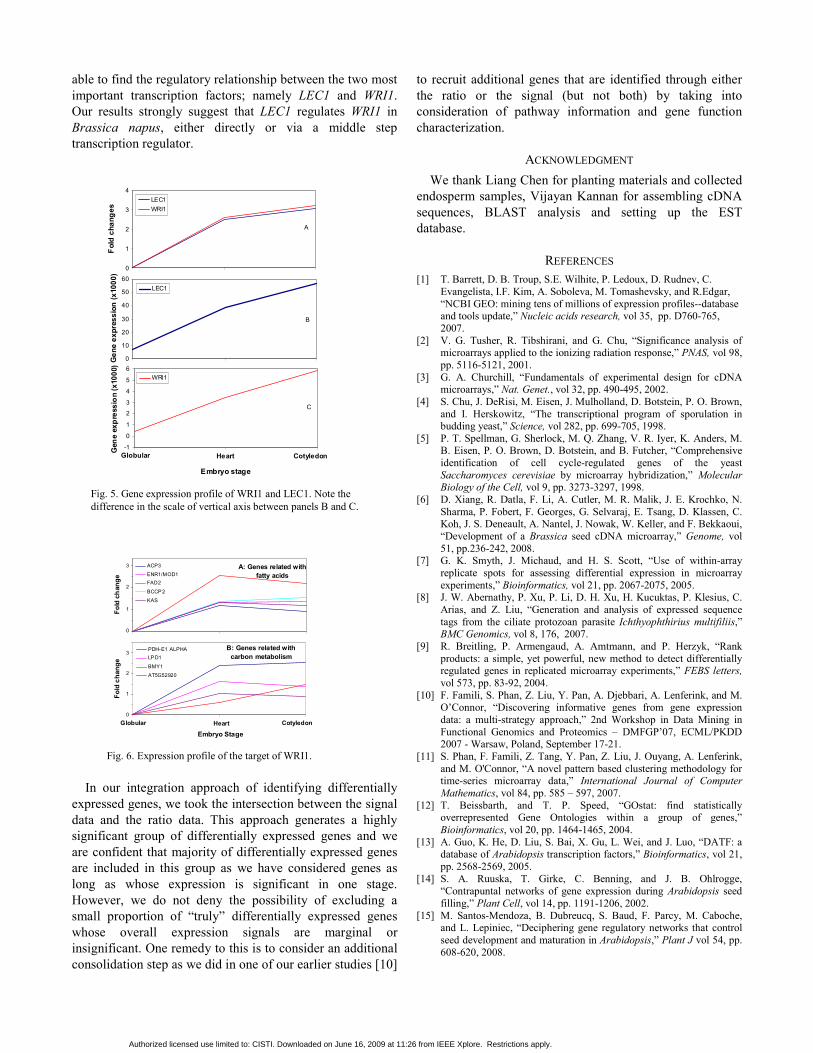
A search against the Database of Arabidopsis Transcription Factors (DATF) [13] identified 216 transcription factors (TFs) in the EST collection, which can be classified into 36 families. Taking a closer look at these TFs, we found LEC1 and WRI1 were very interesting. They have similar patterns of variation based on fold changes and both monotonically increase during embryogenesis (Fig. 5). However, when checking the expression signal levels, they were about one order of magnitude apart from each other. Such an obvious difference is invisible from the log ratio data (Fig. 5A). We decided to look into the expression of downstream targets of LEC1 and WRI1 in the endosperm. Ruuska et al [14] investigated gene expression in the seed of the Arabidopsis mutant wri1 in comparison with the wild type and found 20 differentially expressed genes. They categorized the genes into 4 groups based on their association with fatty acids, carbon metabolism, miscellaneous and those up-regulated in the mutant. Our results indicate that the expression profiles of their orthologues in Brassica endosperm exhibit a similar pattern to the first two groups of genes (Fig. 6). Our results also indicate that LEC1 is significantly expressed as early as at the globular stage and its expression monotonically increased as the endosperm progress into the next two stages; the expression of WRI1 are barely visible at the globular stage, but subsequently become more significant. This is consistent with the number of ESTs detected for each gene. There were 56 ESTs detected for LEC1, but only 8 for WRI1. Based on this fact, we could postulate that LEC1 is the most likely regulator of WRI1, either directly or indirectly. This deduction would not be possible if we do not consider the signal data. In Arabidopsis, LEC1 is found to be indirect regulator to WRI1 via an unknown transcription factor. This unknown TF is possibly LEC2 because LEC1 is known to regulate LEC2, and LEC2 is known to regulate WRI1 [15]. This does not exclude other possible middle step TFs. Unfortunately, LEC2 probe is not available in our
Authorized licensed use limited to: CISTI. Downloaded on June 16, 2009 at 11:26 from IEEE Xplore. Restrictions apply.
Brassica microarray chip and thus not able to validate whether LEC2 is expressed in our samples. Based on the literature information in Arabidopsis, our deduction on the regulatory relationship between LEC1 and WRI1 in Brassica napus is very well supported.
V. CONCLUDING REMARKS In this study, we designed an integrative approach which
takes into account both the ratio and signal intensity in microarray data analysis and demonstrated that it was very important to consider the data from both directions. Through this approach, we were able to take into account: 1) consistency among the replicates of a gene; 2) genes that are highly expressed either in one stage or across all stages; 3) genes that are differentially expressed over various stages of embryogenesis; and 4) co-expressed genes that shared the same expression profiles. Through this approach, we were
TABLE V
RESULT OF GO ANALYSIS Best GOs Biological process Genes P-Value
Cluster 3 GO:0051186 cofactor metabolic process atpb at5g08690.1 acla-2 at3g52930.1 at5g13420.1 at5g24420.1 hemf1 csy2 ipp2
aclb-2 at2g01140 0.000791
GO:0006334 nucleosome assembly nrp2 at5g59970.1 at2g30620.1 h2b hta6 2 nap1 0.00104 GO:0006732 coenzyme metabolic process atpb at5g08690.1 acla-2 at3g52930.1 at5g13420.1 at5g24420.1 csy2 aclb-2
at2g01140 0.00115
GO:0031497 chromatin assembly nrp2 at5g59970.1 at2g30620.1 h2b hta6 2 nap1 0.00518 GO:0006007 glucose catabolic process at5g24420.1 at5g43330.1 at3g52930.1 gapc-2 at5g13420.1 at2g01140 0.0067 GO:0046365 monosaccharide catabolic process at5g24420.1 at5g43330.1 at3g52930.1 gapc-2 at5g13420.1 at2g01140 0.00711 GO:0019320 hexose catabolic process at5g24420.1 at5g43330.1 at3g52930.1 gapc-2 at5g13420.1 at2g01140 0.00711 GO:0046164 alcohol catabolic process at5g24420.1 at5g43330.1 at3g52930.1 gapc-2 at5g13420.1 at2g01140 0.00801 GO:0006006 glucose metabolism at5g24420.1 at5g43330.1 at3g52930.1 gapc-2 at5g13420.1 at2g01140 0.00901 GO:0019318 hexose metabolism at5g24420.1 at5g57330.1 at5g43330.1 at3g52930.1 gapc-2 at5g13420.1
at2g01140 0.00902
GO:0006333 chromatin assembly/disassembly nrp2 at5g59970.1 at2g30620.1 h2b hta6 2 nap1 0.0127 GO:0006098 pentose-phosphate shunt at5g24420.1 at3g52930.1 at5g13420.1 at2g01140 0.0147 GO:0006950 response to stress at4g21960.1 at1g09210.1 at1g53240 erd14 gapc-2 at2g21660 los1 csdp1
at2g01140 at2g30020.1 rap2.3 hsp70 chs at4g38580.1 adh1 alaat1 at4g27320.1 0.0149
GO:0006740 NADPH regeneration at5g24420.1 at3g52930.1 at5g13420.1 at2g01140 0.0166 GO:0065004 protein-DNA complex assembly nrp2 at5g59970.1 at2g30620.1 h2b hta6 2 nap1 0.0202 GO:0006739 NADP metabolic process at5g24420.1 at3g52930.1 at5g13420.1 at2g01140 0.021 GO:0016052 carbohydrate catabolic process at5g24420.1 at5g43330.1 at3g52930.1 gapc-2 at5g13420.1 at2g01140 0.0245 GO:0044275 cellular carbohydrate catabolic
process at5g24420.1 at5g43330.1 at3g52930.1 gapc-2 at5g13420.1 at2g01140 0.0245
GO:0006066 cellular alcohol metabolic process at5g57330.1 sqe1 at5g43330.1 at3g52930.1 gapc-2 at5g13420.1 at5g24420.1 at2g01140
0.0256
GO:0005996 monosaccharide metabolism at5g24420.1 at5g57330.1 at5g43330.1 at3g52930.1 gapc-2 at5g13420.1 at2g01140
0.0286
GO:0006769 nicotinamide metabolic process at5g24420.1 at3g52930.1 at5g13420.1 at2g01140 0.0354 Cluster 4 GO:0015979 photosynthesis ndhi psbq psbo2 ycf3 psal ycf9 psak at1g55670 psaf psao psah-1 ppl1 ftra1
at2g05100.1 psbx at5g47110.1 petg 2.48E-15
GO:0019684 photosynthesis, light reaction psbo2 ycf3 psal at1g55670 psao ftra1 at5g47110.1 petg 2.11E-06 GO:0006412 protein translation, synthesis and
formation at3g13120.1 rps18 rpl33 emb2184 at5g14320.1 rpl2.2 at3g15190.1 at2g24090.1 at1g29070.1 at1g35680.1 at5g13510.1 at2g38140.1 rps12c at5g27770 at1g48350.1 rpl14 at1g17560.1 emb1624 rps7 at5g40950.1 rps4 rps3
0.000121
GO:0044249 cellular biosynthetic process at3g13120.1 rps18 rpl33 emb2184 at5g14320.1 rpl2.2 at3g15190.1 at1g29900.1 at2g24090.1 at1g29070.1 oasa1 at5g13510.1 at1g35680.1 atpi at2g38140.1 gun4 rps12c at5g27770 at1g48350.1 cyp98a3 rpl14 at1g17560.1 emb1624 rps7 at5g40950.1 at4g14690.1 rps4 at4g096
0.000868
GO:0006091 generation of precursor metabolites and energy
psbo2 at3g48300.1 ycf3 at4g09670.1 psal at5g67290.1 at1g55670 enh1 atlfnr1 psao nad4 ftra1 q ndhj at5g47110.1 at4g09650.1 petg
0.00169
Clusters 18+23 GO:0009266 response to temperature stimulus at2g19310.1 hsp70b tub6 hsp17.6ii 0.00751 GO:0009408 response to heat shock
at2g19310.1 hsp70b hsp17.6ii 0.00963
GO:0050896 response to stimulus at2g19310.1 at4g30270.1 hsp70b at1g72430.1 gh3.9 hsp17.6ii tub6 at2g37130.1 myb77
0.0246
GO:0009628 response to abiotic stimulus at2g19310.1 hsp70b tub6 myb77 hsp17.6ii 0.0524
Authorized licensed use limited to: CISTI. Downloaded on June 16, 2009 at 11:26 from IEEE Xplore. Restrictions apply.
able to find the regulatory relationship between the two most important transcription factors; namely LEC1 and WRI1. Our results strongly suggest that LEC1 regulates WRI1 in Brassica napus, either directly or via a middle step transcription regulator.
In our integration approach of identifying differentially expressed genes, we took the intersection between the signal data and the ratio data. This approach generates a highly significant group of differentially expressed genes and we are confident that majority of differentially expressed genes are included in this group as we have considered genes as long as whose expression is significant in one stage. However, we do not deny the possibility of excluding a small proportion of “truly” differentially expressed genes whose overall expression signals are marginal or insignificant. One remedy to this is to consider an additional consolidation step as we did in one of our earlier studies [10]
to recruit additional genes that are identified through either the ratio or the signal (but not both) by taking into consideration of pathway information and gene function characterization.
ACKNOWLEDGMENT We thank Liang Chen for planting materials and collected
endosperm samples, Vijayan Kannan for assembling cDNA sequences, BLAST analysis and setting up the EST database.
REFERENCES [1] T. Barrett, D. B. Troup, S.E. Wilhite, P. Ledoux, D. Rudnev, C.
Evangelista, I.F. Kim, A. Soboleva, M. Tomashevsky, and R.Edgar, “NCBI GEO: mining tens of millions of expression profiles--database and tools update,” Nucleic acids research, vol 35, pp. D760-765, 2007.
[2] V. G. Tusher, R. Tibshirani, and G. Chu, “Significance analysis of microarrays applied to the ionizing radiation response,” PNAS, vol 98, pp. 5116-5121, 2001.
[3] G. A. Churchill, “Fundamentals of experimental design for cDNA microarrays,” Nat. Genet., vol 32, pp. 490-495, 2002.
[4] S. Chu, J. DeRisi, M. Eisen, J. Mulholland, D. Botstein, P. O. Brown, and I. Herskowitz, “The transcriptional program of sporulation in budding yeast,” Science, vol 282, pp. 699-705, 1998.
[5] P. T. Spellman, G. Sherlock, M. Q. Zhang, V. R. Iyer, K. Anders, M. B. Eisen, P. O. Brown, D. Botstein, and B. Futcher, “Comprehensive identification of cell cycle-regulated genes of the yeast Saccharomyces cerevisiae by microarray hybridization,” Molecular Biology of the Cell, vol 9, pp. 3273-3297, 1998.
[6] D. Xiang, R. Datla, F. Li, A. Cutler, M. R. Malik, J. E. Krochko, N. Sharma, P. Fobert, F. Georges, G. Selvaraj, E. Tsang, D. Klassen, C. Koh, J. S. Deneault, A. Nantel, J. Nowak, W. Keller, and F. Bekkaoui, “Development of a Brassica seed cDNA microarray,” Genome, vol 51, pp.236-242, 2008.
[7] G. K. Smyth, J. Michaud, and H. S. Scott, “Use of within-array replicate spots for assessing differential expression in microarray experiments,” Bioinformatics, vol 21, pp. 2067-2075, 2005.
[8] J. W. Abernathy, P. Xu, P. Li, D. H. Xu, H. Kucuktas, P. Klesius, C. Arias, and Z. Liu, “Generation and analysis of expressed sequence tags from the ciliate protozoan parasite Ichthyophthirius multifiliis,” BMC Genomics, vol 8, 176, 2007.
[9] R. Breitling, P. Armengaud, A. Amtmann, and P. Herzyk, “Rank products: a simple, yet powerful, new method to detect differentially regulated genes in replicated microarray experiments,” FEBS letters, vol 573, pp. 83-92, 2004.
[10] F. Famili, S. Phan, Z. Liu, Y. Pan, A. Djebbari, A. Lenferink, and M. O’Connor, “Discovering informative genes from gene expression data: a multi-strategy approach,” 2nd Workshop in Data Mining in Functional Genomics and Proteomics – DMFGP’07, ECML/PKDD 2007 - Warsaw, Poland, September 17-21.
[11] S. Phan, F. Famili, Z. Tang, Y. Pan, Z. Liu, J. Ouyang, A. Lenferink, and M. O'Connor, “A novel pattern based clustering methodology for time-series microarray data,” International Journal of Computer Mathematics, vol 84, pp. 585 – 597, 2007.
[12] T. Beissbarth, and T. P. Speed, “GOstat: find statistically overrepresented Gene Ontologies within a group of genes,” Bioinformatics, vol 20, pp. 1464-1465, 2004.
[13] A. Guo, K. He, D. Liu, S. Bai, X. Gu, L. Wei, and J. Luo, “DATF: a database of Arabidopsis transcription factors,” Bioinformatics, vol 21, pp. 2568-2569, 2005.
[14] S. A. Ruuska, T. Girke, C. Benning, and J. B. Ohlrogge, “Contrapuntal networks of gene expression during Arabidopsis seed filling,” Plant Cell, vol 14, pp. 1191-1206, 2002.
[15] M. Santos-Mendoza, B. Dubreucq, S. Baud, F. Parcy, M. Caboche, and L. Lepiniec, “Deciphering gene regulatory networks that control seed development and maturation in Arabidopsis,” Plant J vol 54, pp. 608-620, 2008.
A: Genes related with
fatty acids
0
1
2
3
Stage
Fold
cha
nge
ACP3
ENR1/MOD1FAD2
BCCP2
KAS
Globul CotyleHearB: Genes related with
carbon metabolism
0
1
2
3
Embryo Stage
Fold
cha
nge
PDH-E1 ALPHALPD1
BMY1
AT5G52920
Globular CotyledonHeart
A: Genes related with fatty acids
0
1
2
3
Stage
Fold
cha
nge
ACP3
ENR1/MOD1FAD2
BCCP2
KAS
Globul CotyleHearB: Genes related with
carbon metabolism
0
1
2
3
Embryo Stage
Fold
cha
nge
PDH-E1 ALPHALPD1
BMY1
AT5G52920
Globular CotyledonHeart
Fig. 6. Expression profile of the target of WRI1.
0
1
2
3
4
Stage
Fold
cha
nges
LEC1WRI1
Globular Heart Cotyledo
A
0
10
20
30
40
50
60
Stage
Gen
e ex
pres
sion
(x10
00)
LEC1
CotyledoHeartGlobular
B
-1
0
1
2
3
4
5
6
Embryo stage
Gen
e ex
pres
sion
(x10
00)
WRI1
CotyledonHeartGlobular
C
0
1
2
3
4
Stage
Fold
cha
nges
LEC1WRI1
Globular Heart Cotyledo
A
0
10
20
30
40
50
60
Stage
Gen
e ex
pres
sion
(x10
00)
LEC1
CotyledoHeartGlobular
B
-1
0
1
2
3
4
5
6
Embryo stage
Gen
e ex
pres
sion
(x10
00)
WRI1
CotyledonHeartGlobular
C
Fig. 5. Gene expression profile of WRI1 and LEC1. Note the difference in the scale of vertical axis between panels B and C.
Authorized licensed use limited to: CISTI. Downloaded on June 16, 2009 at 11:26 from IEEE Xplore. Restrictions apply.
Related Documents